Embed Size (px)
Citation preview
International Journal of
Environmental Research
and Public Health
Article
Impact of Safety Culture on Safety Performance;Mediating Role of Psychosocial Hazard: An IntegratedModelling Approach
Gehad Mohammed Ahmed Naji 1,*, Ahmad Shahrul Nizam Isha 1, Mysara Eissa Mohyaldinn 2, Stavroula Leka 3 ,Muhammad Shoaib Saleem 1, Syed Mohamed Nasir Bin Syed Abd Rahman 4 and Mohammed Alzoraiki 5
�����������������
Citation: Naji, G.M.A.; Isha, A.S.N.;
Mohyaldinn, M.E.; Leka, S.; Saleem,
M.S.; Rahman, S.M.N.B.S.A.;
Alzoraiki, M. Impact of Safety
Culture on Safety Performance;
Mediating Role of Psychosocial
Hazard: An Integrated Modelling
Approach. Int. J. Environ. Res. Public
Health 2021, 18, 8568. https://
doi.org/10.3390/ijerph18168568
Academic Editor: Silvia Pignata
Received: 8 July 2021
Accepted: 11 August 2021
Published: 13 August 2021
Publisher’s Note: MDPI stays neutral
with regard to jurisdictional claims in
published maps and institutional affil-
iations.
Copyright: © 2021 by the authors.
Licensee MDPI, Basel, Switzerland.
This article is an open access article
distributed under the terms and
conditions of the Creative Commons
Attribution (CC BY) license (https://
creativecommons.org/licenses/by/
4.0/).
1 Department of Management & Humanities, Universiti Teknologi PETRONAS,Seri Iskandar 32610, Perak, Malaysia; [email protected] (A.S.N.I.); [email protected] (M.S.S.)
2 Department of Petroleum Engineering, Universiti Teknologi PETRONAS,Seri Iskandar 32610, Perak, Malaysia; [email protected]
3 Cork University Business School, University College Cork, T12 K8AF Cork, Ireland; [email protected] Petronas Group Technology Solutions, Bandar Baru Bangi 43000, Selangor, Malaysia;
[email protected] Department of Technology Management and Business, Universiti Tun Hussein Onn Malaysia,
Parit Raja 86400, Johor, Malaysia; [email protected]* Correspondence: [email protected]
Abstract: We conceptualize that safety culture (SC) has a positive impact on employee’s safetyperformance by reducing their psychosocial hazards. A higher level of safety culture environmentreduces psychosocial hazards by improving employee’s performance toward safety concerns. Thepurpose of this study was to evaluate how psychosocial hazard mediates the relationship betweensafety culture and safety performance. Data were collected from 380 production employees inthree states of Malaysia from the upstream oil and gas sector. Structural equation modeling wasimplemented to test the suggested hypotheses. The proposed model was evaluated using structuralequation modeling. A stratified sampling with a Likert 5-point scale was used to distribute thequestionnaires. Furthermore, the proposed model was tested using the simulation of the structuralequation and partial. According to our findings, all hypotheses were significant. A review of priorstudies was used to select the items of the dimension for the data collection. Safety culture wasassessed with psychosocial hazard to determine its direct and indirect impact on safety performance.Results suggest that to enhance safety performance (leading and lagging), psychosocial concernsin the workplace environments should be taken into consideration by employees. In addition, thefindings showed that the psychosocial hazard fully mediates the relationship between safety cultureand safety performance.
Keywords: safety culture; psychosocial hazards; safety performance; oil and gas; Malaysia
1. Introduction
Over the last 100 years, the emphasis on occupational safety at work has considerablyhelped to save thousands of lives. Fatalities and accidents at work were quite prevalent inthe early 1900s [1]. For example, one early occupational accident study revealed that morethan 500 workers per year died with a further 1500 severe and non-fatal incidents havingoccurred in Allegheny County Pennsylvania. According to Hoffmann, et al. [2], Malaysia’soil and gas industry is a major contributor to the national economy. Malaysia’s national oilcompany is no exception. However, even with these improvements, occupational safety atwork remains a major problem. According to the Social Security Organization of Malaysia(SOCSO), it announced that the latest number of reported industrial accidents was 35,304in 2016, which increased by 1357 cases or 3.84% to a total of 36,661 in 2017 [3,4].
Int. J. Environ. Res. Public Health 2021, 18, 8568. https://doi.org/10.3390/ijerph18168568 https://www.mdpi.com/journal/ijerph
Int. J. Environ. Res. Public Health 2021, 18, 8568 2 of 20
Yang et al. [5] specifically discussed safety performance as a comprehensive safetymanagement system with output controlled and measured by safety management, safetyorganizations, safety training activities, safety equipment, incident investigations, safetytraining evaluations, and accident statistics measures. A safety performance assessmentenables organizations to assess leadership efficiency, but many safety performance defini-tions challenge safety performance evaluations. Safety efficiency includes testing policyunderstanding, onshore visits, and tours, attending monthly security meetings, occupa-tional health plans and programs, and closing off a large proportion of correctives [6].Traditionally, oil and gas companies use lagging indices to thoroughly evaluate the safetyperformance of employees [7], such as Total Recordable Incident Rate (TRIR) and theseverity rate (SR) of work security and health administration (OSHA). In the workplace,the TRIR is a calculation of the reported injuries per 100 employees per year. As a result, theTRIR multiplies the highest figures of injuries throughout the year by 200,000; the averageworking hours are simply split by that amount per year. The security Rate (SR), in contrast,is a ratio that defines the number of days lost compared to the number of events [8,9].
Management is not short of safety procedures and processes; however, complianceremains the issue that needs to be addressed immediately. Three central characteristicscommon to all organizations are people’s behaviors, organizational structure, and orga-nizational processes. Research has shown that focusing on a well-established structure,organizational processes, and strict rules and regulations alone does not guarantee a suc-cessful health safety and environment (HSE) performance [10]. Avoiding this tunnel-visionis vital in a workplace that involves an enormous number of people, a high-hazard workenvironment, and the potential for loss of life [11]. Effective employees enable the orga-nization to function properly and influence others who work in the same organization tofulfill the required goals. However, the ‘softer’ human resource concerns have too oftenbeen accorded little attention [12], and there is a need to understand better the factors thatinfluence employees’ safety performances.
2. Literature Review2.1. Safety Culture
According to Yorio et al. [13] the idea of safety culture was raised after the 1986Chernobyl incident. As stated by [14,15], there is no universally accepted definition forsafety culture as several interpretations have been assigned to safety culture by manyresearchers since its inception. Regardless of this, certain elements make it possible toconstitute a definition for safety culture as a set of shared values, and members’ safetyperception, attitude and their behavior concerning safety in an organization as well asorganizational policies, procedures, and practices pertinent to the enhancement of measuresagainst possible risks and hazards being the priority [15]. Cox and Cox [16] also highlightedthe concept of safety culture by including collective beliefs, perceptions, and attitudes of theworkforce in the pursuit of safety. Therefore, different studies have defined safety cultureas shown in Table 1. The dimensions of safety culture will be applied to assist employees’stress and safety performance, such as management commitment, work environment, andinvolvement. Management commitment increases employees’ skills, which helps to savelives, reduce stress, and prevent injuries in any organization [17]. Involvement or workdemands on workers associated with limited management and work-life balance activitieshave been found to have been found to increase the rate of stress [18]. Consequently,this research work clarifies the understanding and development of safety attitudes thatwould reduce accidents at the workplace [19], as stress causes depression, anxiety, andanger, which can result in huge costs that would be a burden to the organization [20,21].According to the literature, psychosocial risks and hazards have been aggravated andhave become more intense, and it is organizational legislation and structure that protectsworkers from such hazards or at least helps minimize their effect [22]. Therefore, the cultureof the organization, i.e., safety culture, is expected to play a vital role in the mitigation of
Int. J. Environ. Res. Public Health 2021, 18, 8568 3 of 20
psychosocial hazards. We thus formed Hypothesis 1 to test the association between safetyculture and psychosocial hazards.
Hypothesis 1. There is a significant relationship between safety culture and psychosocial hazard.
Table 1. Safety culture definitions.
References Safety Culture Definitions
[23] Safety culture is considered the values, perceptions, attitudes, behaviors of individuals andgroups that evaluate the commitment to health and safety management.
[24]Culture interacts between people’s psychological and work behavior in the organization.Safety culture observes the efforts of organizational members and draws their attentiontowards daily safety improvement.
[15] Safety culture is characterized as all elements of organizational culture that affect the behaviorsand attitudes associated with increased or decreased risk.
[25] To direct people’s activities toward risk, accidents, and prevention, it is required to share andunderstand all related definitions, experiences, and safety perceptions.
[26] Employees’ decisions also depend on the organizational culture, which influences the overallcompany’s achievement.
[27]Organizational culture in the workplace can be complex and comprehensive, yet ambiguousenough to be observed by the employees. In other words, if employees could not adapt to theirorganization’s culture, they will be thought of as outsiders.
[28]A group’s safety culture evolves and changes through time as a result of changes in a variety ofinfluencing elements such as leadership, management techniques, business environment, andformal and informal socialization processes.
2.2. The Dimension of Safety Culture2.2.1. Management Commitment
Commitment to management means being engaged in a mannered behavior thatsupports other staff to accomplish the determined goals [29]. In general, measurementscan be assessed in two different ways: direct questions are asked by managers [30] ortheir commitment behaviors are monitored. According to Joung et al. [30], some managersacknowledge that they are not committed to safety rules when asked, while such behaviorrequires obvious proof for safety commitment.
2.2.2. Work Environment
The work environment requires procedures and policies be put in place to ensurethe health and safety of staff in the workplace. The key policy is the identification ofhazards and controls based on standards set by the government, and performing safetytraining and education for employees [31]. Moreover, a healthy and safe work environmenthas professional and legal responsibilities to afford staff with a workplace that is free ofhazards which may cause serious physical injury or death, and to preserve safe and healthyworking conditions for their staff.
2.2.3. Involvement
Work involvement refers to supporting and promoting employees to participate andbe consulted on health and safety matters in their workplaces. Setting such a goal isnecessary, as involving employees can have an encouraging effect on health and safetyperformance [32]. In addition, work involvement combines management, and health andsafety representatives in inspections, investigations, and risk assessments.
2.3. Psychosocial Hazards
Chirico et al. [33] defined psychosocial hazards as all occupational hazards that havea direct or indirect effect on the employees’ psychological being and their capability tocontribute in a work environment amongst other individuals [34]. Psychosocial hazardsare connected to the organization, project, and management of the work, as well as the
Int. J. Environ. Res. Public Health 2021, 18, 8568 4 of 20
social context and economics of the work, and are tied to psychological, psychiatric, andphysical injuries or illnesses. Similarly, the International Labour Organization [35] alludedto psychosocial hazards as being two sides of a coin: the relations amongst job content, theorganization, and management of the work, as well as environmental and organizationalconditions, are on one side, and on the other side, are the individuals’ proficiencies anddesires [36]. Thus, these interactions engender a strong influence over the health ofemployees through their perceptions and experiences [37]. In effect, these psychosocialhazards are now unique challenges to organizations/managers, and thus these hazardsought to be effectively managed. In recent times, workplace psychosocial hazards havebeen recognized as a major contemporary challenge to occupational health and safety, andthey include but are not limited to workplace problems such as work stress, workplaceviolence, and workplace bullying [38,39].
Psychosocial hazards and risks were developed according to the International LaborOrganization (ILO) definition from 1986. The interaction among work environment, workorganization, job content, workers’ capacities, needs, cultures, and personnel considerationare all considered psychosocial factors that have a great influence on work performanceand job satisfaction. These variable interactions are acknowledged as having a poten-tially hazardous effect on workers’ health [40]. There are nine categories identified bystress researchers who grouped psychosocial risks to job content, workload and workpace, working hours, participation and control, career development, status, payments,role in the organization, interpersonal relations, organizational culture, and home-workinterface [41,42]. Work-related stress is the harmful physical and emotional responsecaused by an imbalance between the perceived demands and the perceived resourcesand abilities of a person to cope with those demands. Based on previous studies, [43,44]reported that there is a relationship between psychosocial hazards and safety performance.Thus, we formed hypothesis 02 to test the relationship between psychosocial hazards andsafety performance.
Hypothesis 2. There is a significant relationship between psychosocial hazards and safetyperformance.
2.4. Safety Performance
One of the most important elements to enhance the efficiency of oil and gas projects isincreasing the performance of the safety activities. While significant consideration is onthe use and creation of inventive indicators for safety performance, contractor’s safety hashistorically been assessed and controlled by using lagging indicators [6]. Organizationalsafety performance assessment helps organizations assess management effectiveness, butthe safety performance assessment is challenged by various classifications.
Safety performance as the global output of the security management of an enter-prise can be conceptualized by six factors: safety equipment, safety measures, safetymanagement, accident investigation statistics, safety training, and safety organization [5].Bunner et al. [45] presented safety performance models comprising performance elements,performance determinants, and performance backgrounds. The performance history wasdetermined at the individual and organizational levels. The individual-level includesperformance roles, skill, experience, and personality. The organizational level includes anorganization’s atmosphere, which assigns meaning to individuals and values the charac-teristics of the work environment. There are three success elements: awareness, capacity,and motivation. The performance components define the actual behaviors of the people atwork, such as compliance with health and safety performance [46].
2.4.1. Lagging and Leading Metrics
The lagging indicator measures the influence of safety on workplace accidents afterthey happen. Specific staff behaviors and daily activities are analyzed using leadingindicators [47]. This approach allows managers and employees to alter habits before
Int. J. Environ. Res. Public Health 2021, 18, 8568 5 of 20
accidents or incidents happen. Thus, leading indicators accurately work as a warning toolfor both managers and employees to act before the occurrence of any property damage,personnel injuries, or even any harm. The available lagging indicators could not providesatisfactory information about real reasons for workplace incidents [6]. This failure requirescompanies to perform further research and studies to figure out the actual reasons forhealth and safety incidents. The leading indicators allow employees and managers tohave an effective system and process to track employee’s safety performance. Such atracking system rapidly identifies workplace safety failure and examines the root causes byemphasizing staff activities and attitudes [48].
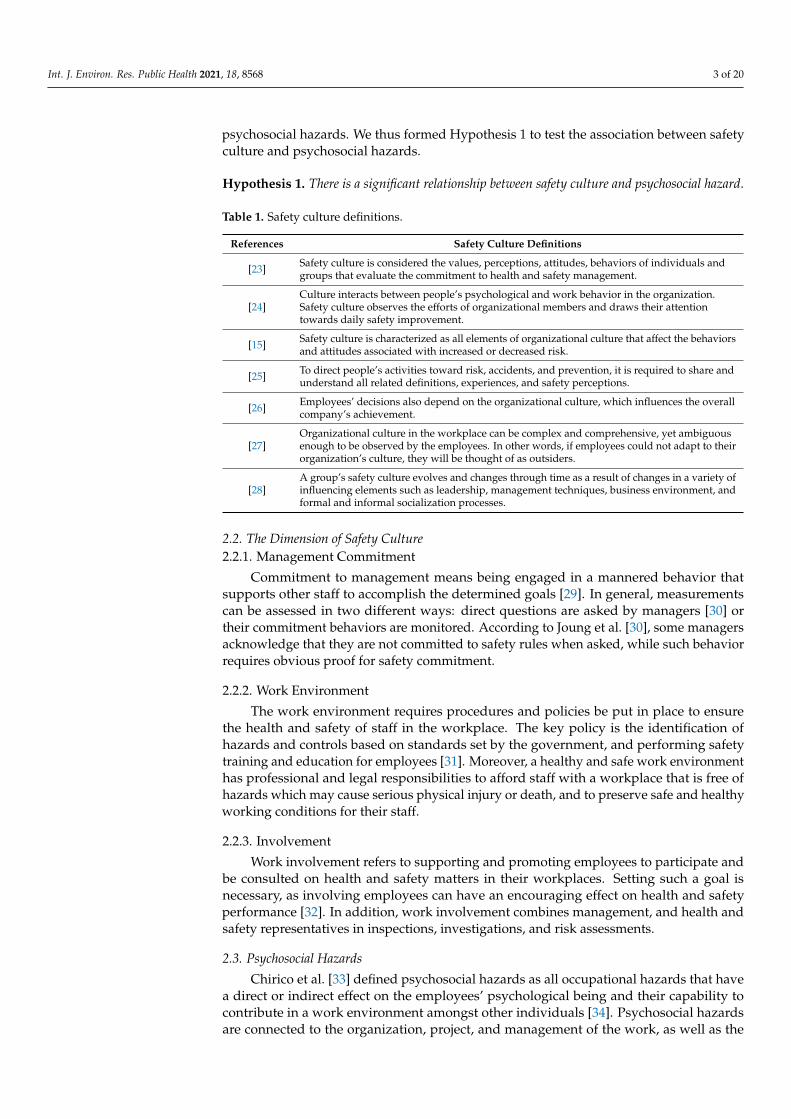
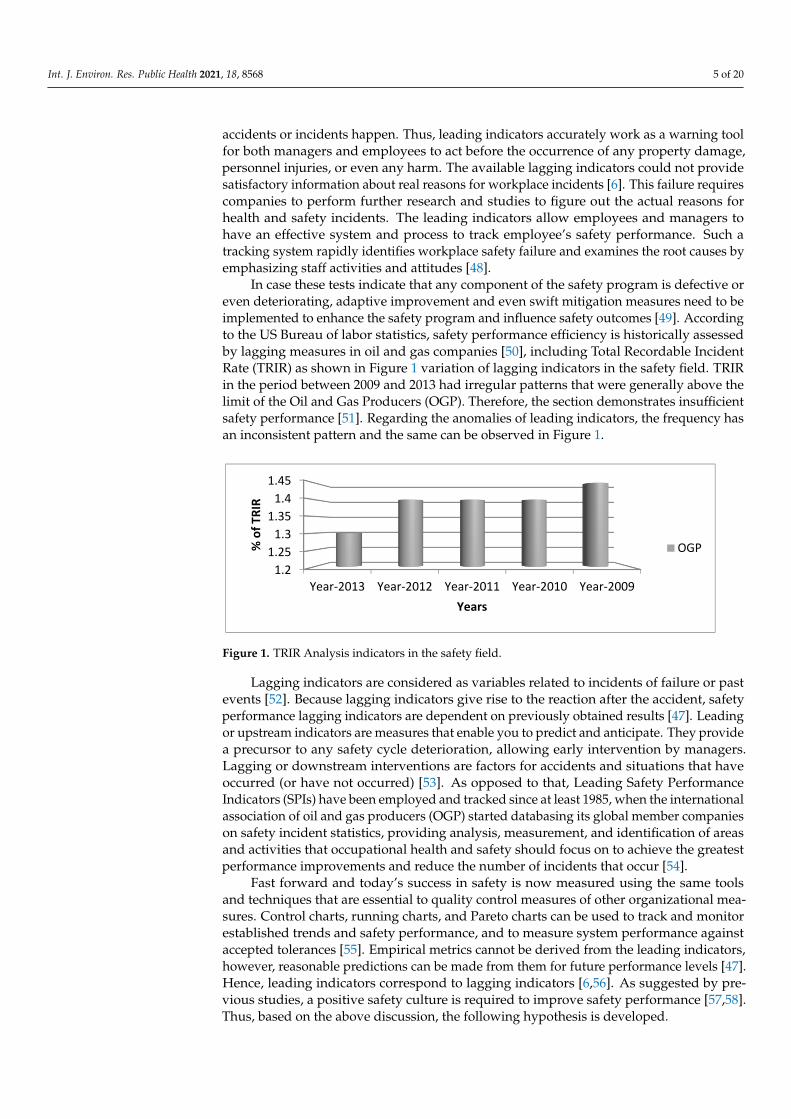
In case these tests indicate that any component of the safety program is defective oreven deteriorating, adaptive improvement and even swift mitigation measures need to beimplemented to enhance the safety program and influence safety outcomes [49]. Accordingto the US Bureau of labor statistics, safety performance efficiency is historically assessedby lagging measures in oil and gas companies [50], including Total Recordable IncidentRate (TRIR) as shown in Figure 1 variation of lagging indicators in the safety field. TRIRin the period between 2009 and 2013 had irregular patterns that were generally above thelimit of the Oil and Gas Producers (OGP). Therefore, the section demonstrates insufficientsafety performance [51]. Regarding the anomalies of leading indicators, the frequency hasan inconsistent pattern and the same can be observed in Figure 1.
Int. J. Environ. Res. Public Health 2021, 18, x FOR PEER REVIEW 5 of 21
safety performance assessment helps organizations assess management effectiveness, but the safety performance assessment is challenged by various classifications.
Safety performance as the global output of the security management of an enterprise can be conceptualized by six factors: safety equipment, safety measures, safety manage-ment, accident investigation statistics, safety training, and safety organization [5]. Bunner et al. [45] presented safety performance models comprising performance elements, per-formance determinants, and performance backgrounds. The performance history was de-termined at the individual and organizational levels. The individual-level includes per-formance roles, skill, experience, and personality. The organizational level includes an organization’s atmosphere, which assigns meaning to individuals and values the charac-teristics of the work environment. There are three success elements: awareness, capacity, and motivation. The performance components define the actual behaviors of the people at work, such as compliance with health and safety performance [46].
2.4.1. Lagging and Leading Metrics The lagging indicator measures the influence of safety on workplace accidents after
they happen. Specific staff behaviors and daily activities are analyzed using leading indi-cators [47]. This approach allows managers and employees to alter habits before accidents or incidents happen. Thus, leading indicators accurately work as a warning tool for both managers and employees to act before the occurrence of any property damage, personnel injuries, or even any harm. The available lagging indicators could not provide satisfactory information about real reasons for workplace incidents [6]. This failure requires compa-nies to perform further research and studies to figure out the actual reasons for health and safety incidents. The leading indicators allow employees and managers to have an effec-tive system and process to track employee’s safety performance. Such a tracking system rapidly identifies workplace safety failure and examines the root causes by emphasizing staff activities and attitudes [48].
In case these tests indicate that any component of the safety program is defective or even deteriorating, adaptive improvement and even swift mitigation measures need to be implemented to enhance the safety program and influence safety outcomes [49]. Accord-ing to the US Bureau of labor statistics, safety performance efficiency is historically as-sessed by lagging measures in oil and gas companies [50], including Total Recordable In-cident Rate (TRIR) as shown in Figure 1 variation of lagging indicators in the safety field. TRIR in the period between 2009 and 2013 had irregular patterns that were generally above the limit of the Oil and Gas Producers (OGP). Therefore, the section demonstrates insufficient safety performance [51]. Regarding the anomalies of leading indicators, the frequency has an inconsistent pattern and the same can be observed in Figure 1.
Figure 1. TRIR Analysis indicators in safety field
Lagging indicators are considered as variables related to incidents of failure or past events [52]. Because lagging indicators give rise to the reaction after the accident, safety performance lagging indicators are dependent on previously obtained results [47].
1.21.25
1.31.35
1.41.45
Year-2013 Year-2012 Year-2011 Year-2010 Year-2009
% o
f TRI
R
Years
OGP
Figure 1. TRIR Analysis indicators in the safety field.
Lagging indicators are considered as variables related to incidents of failure or pastevents [52]. Because lagging indicators give rise to the reaction after the accident, safetyperformance lagging indicators are dependent on previously obtained results [47]. Leadingor upstream indicators are measures that enable you to predict and anticipate. They providea precursor to any safety cycle deterioration, allowing early intervention by managers.Lagging or downstream interventions are factors for accidents and situations that haveoccurred (or have not occurred) [53]. As opposed to that, Leading Safety PerformanceIndicators (SPIs) have been employed and tracked since at least 1985, when the internationalassociation of oil and gas producers (OGP) started databasing its global member companieson safety incident statistics, providing analysis, measurement, and identification of areasand activities that occupational health and safety should focus on to achieve the greatestperformance improvements and reduce the number of incidents that occur [54].
Fast forward and today’s success in safety is now measured using the same toolsand techniques that are essential to quality control measures of other organizational mea-sures. Control charts, running charts, and Pareto charts can be used to track and monitorestablished trends and safety performance, and to measure system performance againstaccepted tolerances [55]. Empirical metrics cannot be derived from the leading indicators,however, reasonable predictions can be made from them for future performance levels [47].Hence, leading indicators correspond to lagging indicators [6,56]. As suggested by pre-vious studies, a positive safety culture is required to improve safety performance [57,58].Thus, based on the above discussion, the following hypothesis is developed.
Int. J. Environ. Res. Public Health 2021, 18, 8568 6 of 20
Hypothesis 3. There is a significant relationship between safety culture and safety performance.
2.4.2. Psychosocial Hazard Mediates the Relationship between Safety Culture and ItsImpact on Employees Performance
The previous studies have recognized that psychosocial hazards could be influencedby the efficiency of the safety culture amongst the workers [59]. As aforementioned,researchers have found that an effective safety culture is essential to engage employersin safety matters, which then affects the level of safety performance [60]. Accordingto Kortum [61], research has acknowledged the positive impacts of the safety cultureestablishing workplace psychosocial hazards. Although one of the best ways to improvethe safety of psychosocial risk is to optimize safety culture, employees usually tend to bereticent about encountering risky situations [62] which might decrease the level of safetypsychosocial hazards in the organization.
Thus, when the workers in the organization are having safety information beingdisseminated well, this will be reflected in the level of safety psychosocial hazards. Ac-cording to Lunt [63], safety psychosocial risk is related to employee’s perceptions of thesafety conditions at the workplace. A more positive safety psychosocial risk has beenfound to maintain the participation of the workers in safety-related issues, for whichthe influence of a worker’s perception of the psychosocial safety risk will determine thesafety-related behavior of the worker [64]. As noted in previous studies, a positive levelof safety psychosocial risk will encourage and enhance the worker’s safety performanceat work [65]. Hence, the researcher of the current study believes that an effective safetyculture will enhance the level of safety psychosocial risk, which will lead to an increaseof the safety performance of the workers. Although evidence has attested to a significantdirect relationship between safety culture and safety performance, this research believesthat such a relationship could be refined with the inclusion of psychosocial hazard in amediator role between safety culture and safety performance. According to the outcomesof previous studies [66,67], when construction employees in the upstream oil and gas sectorin Malaysia perceive a positive safety climate or safety culture at work, they will focus theirefforts on completing the work rather than on safety practices, as they face the prospectof being laid off. As a result, they may break more safety standards, resulting in a higheraccident and injury rate in the workplace environment. Therefore, it is hypothesized that:
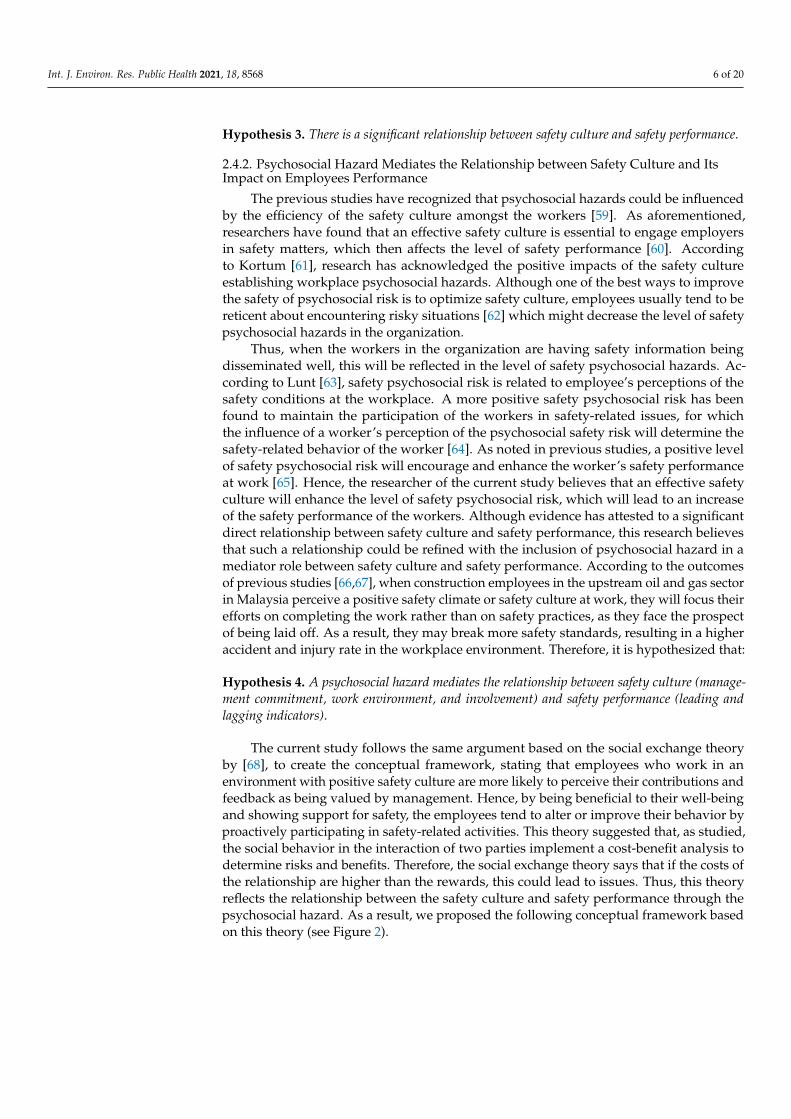
Hypothesis 4. A psychosocial hazard mediates the relationship between safety culture (manage-ment commitment, work environment, and involvement) and safety performance (leading andlagging indicators).
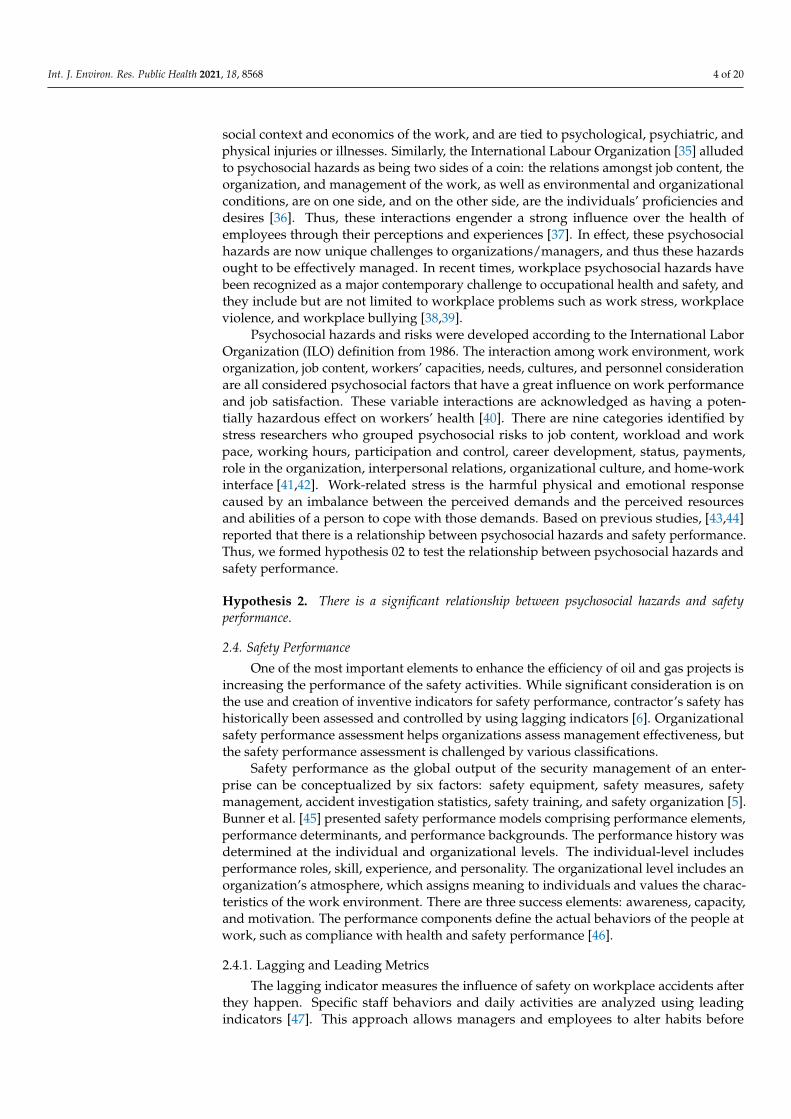
The current study follows the same argument based on the social exchange theoryby [68], to create the conceptual framework, stating that employees who work in anenvironment with positive safety culture are more likely to perceive their contributions andfeedback as being valued by management. Hence, by being beneficial to their well-beingand showing support for safety, the employees tend to alter or improve their behavior byproactively participating in safety-related activities. This theory suggested that, as studied,the social behavior in the interaction of two parties implement a cost-benefit analysis todetermine risks and benefits. Therefore, the social exchange theory says that if the costs ofthe relationship are higher than the rewards, this could lead to issues. Thus, this theoryreflects the relationship between the safety culture and safety performance through thepsychosocial hazard. As a result, we proposed the following conceptual framework basedon this theory (see Figure 2).
Int. J. Environ. Res. Public Health 2021, 18, 8568 7 of 20
Int. J. Environ. Res. Public Health 2021, 18, x FOR PEER REVIEW 7 of 21
Hypothesis 4. A psychosocial hazard mediates the relationship between safety culture (manage-ment commitment, work environment, and involvement) and safety performance (leading and lag-ging indicators).
The current study follows the same argument based on the social exchange theory by [68], to create the conceptual framework, stating that employees who work in an environ-ment with positive safety culture are more likely to perceive their contributions and feed-back as being valued by management. Hence, by being beneficial to their well-being and showing support for safety, the employees tend to alter or improve their behavior by pro-actively participating in safety-related activities. This theory suggested that, as studied, the social behavior in the interaction of two parties implement a cost-benefit analysis to determine risks and benefits. Therefore, the social exchange theory says that if the costs of the relationship are higher than the rewards, this could lead to issues. Thus, this theory reflects the relationship between the safety culture and safety performance through the psychosocial hazard. As a result, we proposed the following conceptual framework based on this theory (see Figure 2)
Figure 2. Conceptual framework.
3. Methods and Materials 3.1. Participants and Procedures
The survey included productions and operational employees of nine different oil and gas companies operating in three Malaysian states (Sabah, Sarawak, Trengganu). Because the nature of their employment exposes them to significant safety problems and dangers, production and operational employees (mostly involved in oil extraction and processing) were included [44]. Pipe-liners, electricians, and chemical foremen, as well as material specialists, are among the production and operational employees [69]. An analysis of var-iance was used to see if there was a difference between the two groups before testing the hypothesis. In terms of the study’s primary variables, the results indicated that there is no difference between these groups. Operation and production professionals in the oil and gas business have a unique job description that required them to be particularly cautious in their work because a single mistake might result in a psychosocial hazard. According to the literature, such employees are particularly vulnerable to accidents [70,71]. Because of their continual exposure to toxic and hazardous materials, oil and gas personnel are classified as a “safety-sensitive” industry in the safety literature [72].
The questionnaires have been distributed among the employees in the upstream oil and gas sector of Malaysia. During the completion of the questionnaire, the principal
Figure 2. Conceptual framework.
3. Methods and Materials3.1. Participants and Procedures
The survey included productions and operational employees of nine different oil andgas companies operating in three Malaysian states (Sabah, Sarawak, Trengganu). Becausethe nature of their employment exposes them to significant safety problems and dangers,production and operational employees (mostly involved in oil extraction and processing)were included [44]. Pipe-liners, electricians, and chemical foremen, as well as materialspecialists, are among the production and operational employees [69]. An analysis ofvariance was used to see if there was a difference between the two groups before testingthe hypothesis. In terms of the study’s primary variables, the results indicated that there isno difference between these groups. Operation and production professionals in the oil andgas business have a unique job description that required them to be particularly cautiousin their work because a single mistake might result in a psychosocial hazard. Accordingto the literature, such employees are particularly vulnerable to accidents [70,71]. Becauseof their continual exposure to toxic and hazardous materials, oil and gas personnel areclassified as a “safety-sensitive” industry in the safety literature [72].
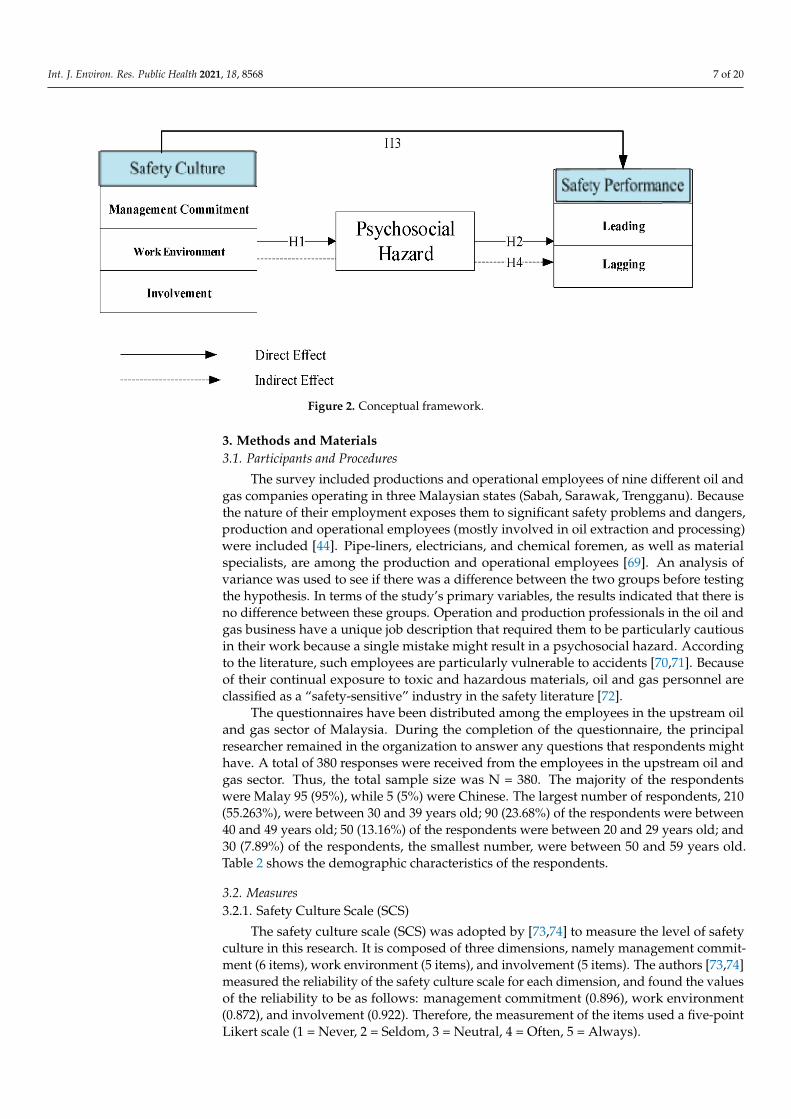
The questionnaires have been distributed among the employees in the upstream oiland gas sector of Malaysia. During the completion of the questionnaire, the principalresearcher remained in the organization to answer any questions that respondents mighthave. A total of 380 responses were received from the employees in the upstream oil andgas sector. Thus, the total sample size was N = 380. The majority of the respondentswere Malay 95 (95%), while 5 (5%) were Chinese. The largest number of respondents, 210(55.263%), were between 30 and 39 years old; 90 (23.68%) of the respondents were between40 and 49 years old; 50 (13.16%) of the respondents were between 20 and 29 years old; and30 (7.89%) of the respondents, the smallest number, were between 50 and 59 years old.Table 2 shows the demographic characteristics of the respondents.
3.2. Measures3.2.1. Safety Culture Scale (SCS)
The safety culture scale (SCS) was adopted by [73,74] to measure the level of safetyculture in this research. It is composed of three dimensions, namely management commit-ment (6 items), work environment (5 items), and involvement (5 items). The authors [73,74]measured the reliability of the safety culture scale for each dimension, and found the valuesof the reliability to be as follows: management commitment (0.896), work environment(0.872), and involvement (0.922). Therefore, the measurement of the items used a five-pointLikert scale (1 = Never, 2 = Seldom, 3 = Neutral, 4 = Often, 5 = Always).
Int. J. Environ. Res. Public Health 2021, 18, 8568 8 of 20
Table 2. Demographic of the Respondents (N = 380).
Construct Categories Frequency Responses %
GenderMale 371 97.63
Female 9 2.37
Age
20–29 Years 50 13.1630–39 Years 210 55.2640–49 Years 90 23.6850–59 Years 30 7.90
Work Experience
1–5 Years 102 26.846–10 Years 127 33.42
11–15 Years 45 11.8416–20 64 16.84
21 Years and above 42 11.06
Marital StatusSingle 62 16.32
Married 295 77.63Divorced 23 6.05
Education
Graduate/Postgraduate 7 1.84College 53 13.94
Secondary 312 82.11Primary 8 2.11
3.2.2. Management Commitment (MC)
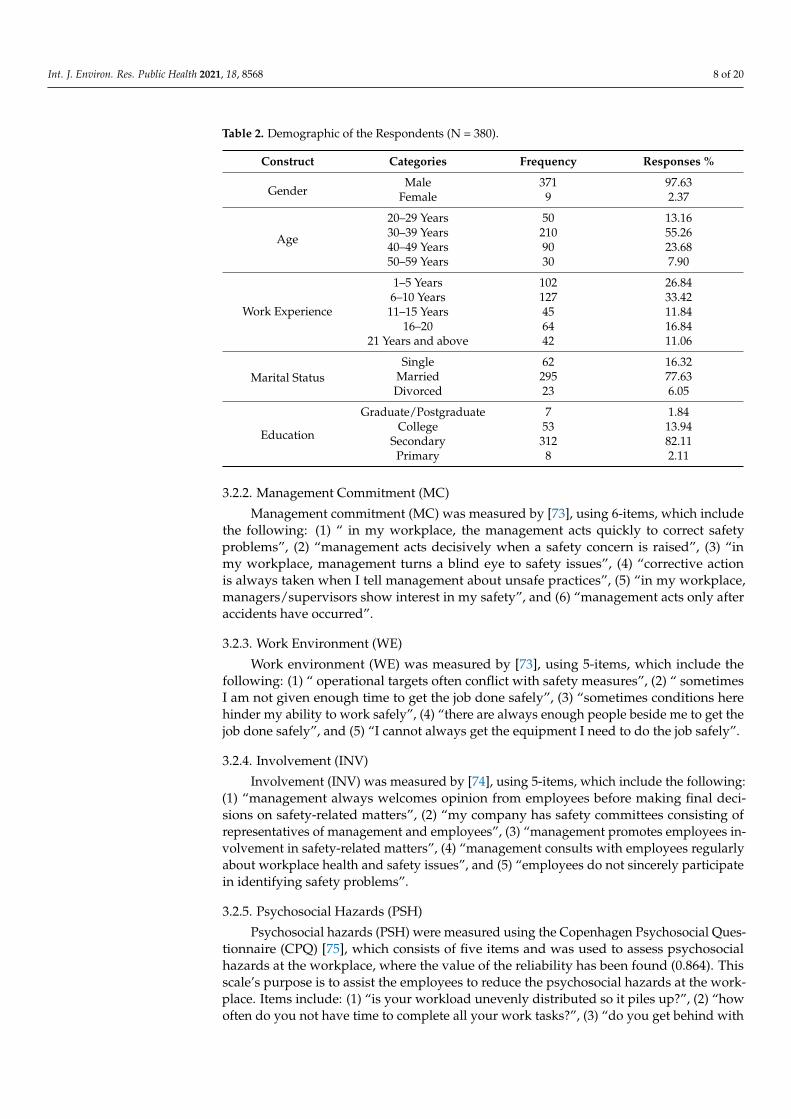
Management commitment (MC) was measured by [73], using 6-items, which includethe following: (1) “ in my workplace, the management acts quickly to correct safetyproblems”, (2) “management acts decisively when a safety concern is raised”, (3) “inmy workplace, management turns a blind eye to safety issues”, (4) “corrective actionis always taken when I tell management about unsafe practices”, (5) “in my workplace,managers/supervisors show interest in my safety”, and (6) “management acts only afteraccidents have occurred”.
3.2.3. Work Environment (WE)
Work environment (WE) was measured by [73], using 5-items, which include thefollowing: (1) “ operational targets often conflict with safety measures”, (2) “ sometimesI am not given enough time to get the job done safely”, (3) “sometimes conditions herehinder my ability to work safely”, (4) “there are always enough people beside me to get thejob done safely”, and (5) “I cannot always get the equipment I need to do the job safely”.
3.2.4. Involvement (INV)
Involvement (INV) was measured by [74], using 5-items, which include the following:(1) “management always welcomes opinion from employees before making final deci-sions on safety-related matters”, (2) “my company has safety committees consisting ofrepresentatives of management and employees”, (3) “management promotes employees in-volvement in safety-related matters”, (4) “management consults with employees regularlyabout workplace health and safety issues”, and (5) “employees do not sincerely participatein identifying safety problems”.
3.2.5. Psychosocial Hazards (PSH)
Psychosocial hazards (PSH) were measured using the Copenhagen Psychosocial Ques-tionnaire (CPQ) [75], which consists of five items and was used to assess psychosocialhazards at the workplace, where the value of the reliability has been found (0.864). Thisscale’s purpose is to assist the employees to reduce the psychosocial hazards at the work-place. Items include: (1) “is your workload unevenly distributed so it piles up?”, (2) “howoften do you not have time to complete all your work tasks?”, (3) “do you get behind with
Int. J. Environ. Res. Public Health 2021, 18, 8568 9 of 20
your work?”, (4) “do you have enough time for your work tasks?”, and (5) “do you have towork very fast?”.
3.2.6. Safety Performance Scale (SPS)
Safety performance scale (SPS) was developed by [76,77] to measure the level ofsafety performance. The reliability value was found to be (0.907). It is composed oftwo dimension measurement indicators, namely, leading indicator (4 items) and laggingindicators (5 items). SPS was developed by [76,77], who measured the reliability for thesafety performance scale for each dimension. The values of the reliability we found are asfollows: leading (0.864) and lagging (0.849).
3.2.7. Leading Indicators (SPLD)
The scale of leading indicators was established by [76], and consist of four itemswhich were used to assess the leading indicators at the workplace of safety performance.This scale’s purpose is to drive and measure activities carried out to prevent and controlinjury, such as safety audits, behavior, and attitude at the workplace. The items includethe following: (1) “formal occupational health and safety audits at regular intervals area normal part of our workplace”, (2) “everyone at this workplace appreciates ongoingoccupational health and safety improvement in this workplace”, (3) “health and safetyare important as product quality in the way the work is done”, and (4) “workers andsupervisors have the information they need to work safely”.
3.2.8. Lagging Indicators (SPLG)
In this study, the lagging indicator was measured by five items from the laggingindicator questionnaire by [77]. This scale aims to measure the effectiveness of a safetyprogram after accidents have happened at the workplace, such as incidents and injuries.The items include the following: (1) “operating procedures are followed during start-upoperations of the unit”, (2) “procedures are followed during emergency shutdown ofthe unit”, (3) “deviations are recorded from the written procedures during normal plantoperations”, (4) “procedures are concise and clear”, and (5) “procedures dealing in differentactivities are incomplete”.
3.3. Sampling and Study Design
This study has developed a framework to demonstrate that good safety culture andsafety are all related to safety performance, as shown in Figure 2. This framework hasillustrated three important variables under investigation by the researcher (safety culture,psychosocial hazard, and safety performance). Psychosocial hazard was adapted as themediator of the relationship between safety culture and safety performance. This studyanalyzed the mediating effect of psychosocial hazards between safety culture and safetyperformance in upstream oil and gas operations in Malaysia. This study also examinedthe different strategies for safety risk reduction and incident prevention by validatingthe framework constructs in the context of Malaysia. However, the proposed frameworkwas assessed with the “Partial Least Square” approach using the software of Smart-PLS3.2.7 [78]. The current study used a five-point Likert scale, which has also been usedin other studies [79,80]. The survey questionnaire contained 30 items. The constructsvariable’s structure is shown in Table 3.
To evaluate the structural models and measurement, we used the recommendedtwo-staged analytical approaches [81]. G* Power version 3.1.9.2 was developed by [82], tocalculate the suitable sample size. The required sample size of the study was 68, based onthe 0.80 value recommended for “social and behavioral sciences”. The total sample sizefor the current research of 380 employees comfortably exceed the minimum sample sizerequirement. The current study had more participants than the optimum sample size forSmart-PLS-SEM analysis, which is 100 [83].
Int. J. Environ. Res. Public Health 2021, 18, 8568 10 of 20
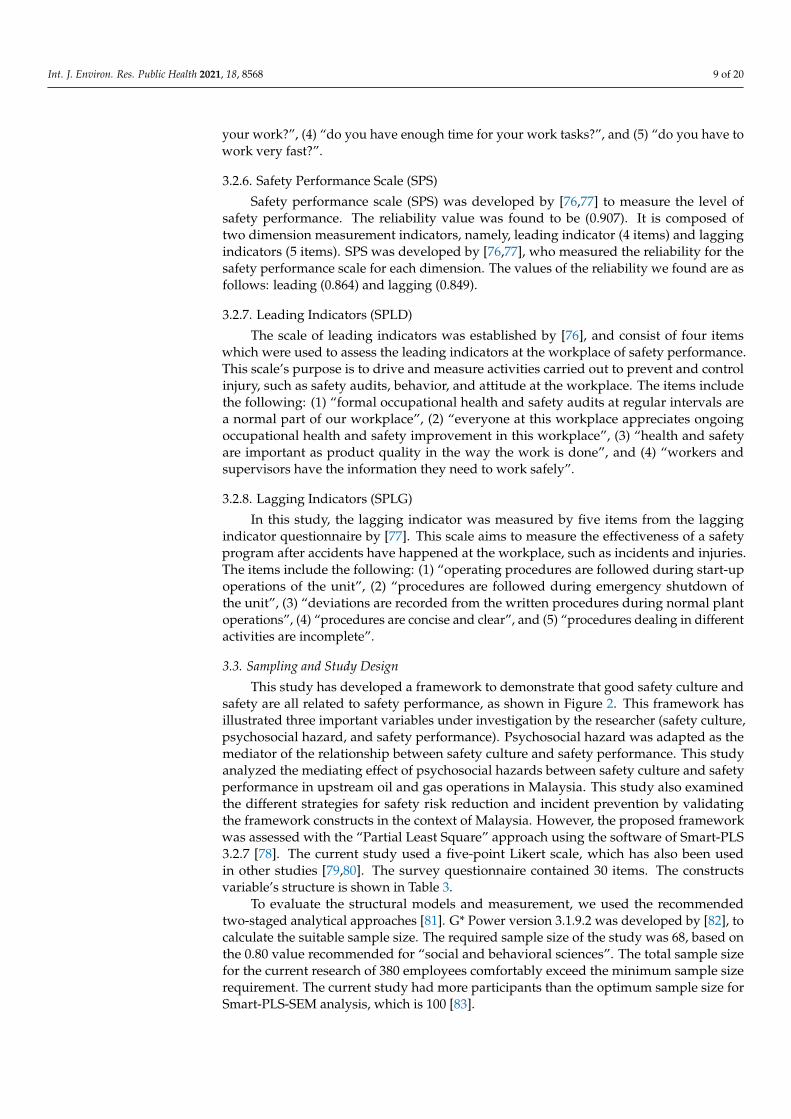
Table 3. Study instrument structured.
Constructs Dimensions No. of Items References
Safety Culture
16
[73,74]Management Commitment (MC) 6
Work Environment (WE) 5Involvement (INV) 5
Safety Performance9
[76,77]Leading(SPLD) 4
Lagging(SPLG) 5
Psychosocial Hazard (PSH) 5 [75]
3.4. Structural Equation Modeling (SEM)
SEM is a multivariate method for determining the validity of competing hypothesesand gathered samples concerning a concept or theory [84,85]. The two main approachesfor SEM are partial least squares structural equation modeling (PLS-SEM), and covariance-based structural equation modeling (CB-SEM) [86–88]. Mackinnon [89] mentioned thatPLS-SEM is more flexible than CB-SEM when it comes to describing the link betweenitems and constructs for researchers. PLS-SEM functions admirably in any sample size,but it must meet the sample size’s minimal criteria, which allows for the development ofvariables with complex effects on certain components of the model. PLS-SEM is concernedwith constructs or latent variables that can be used with both reflective and non-reflective(formative) measurement models. As a result, researchers commonly incorporate the SEMtechnique. The following are some of the benefits of using SEM: to begin, SEM may beused to approximate complex hypothesis models based on multiple observations [90,91].
SEM is effective, particularly for very complicated models with large numbers ofhidden variables and indicators. As a result, it seeks to obtain models that are as sparse aspossible [91,92]. Many domains of social science studies, such as construction, industry,hotel management, competitive performance [93,94], the environment, and organizationhave successfully used SEM [95].
Finally, the PLS-SEM method was used to assess the four hypotheses that wereproposed in this study. Bauer and Baumeister [96] indicated that variance inflation factor(VIF) was used to examine multicollinearity difficulties to evaluate multicollinearity. Thiswas accomplished by using the Smart-PLS v3.2.1 tool to evaluate the measurement model’sfitting and path analysis [97]. Harman’s single factor was tested using SPSS version 25.0software to test common technique bias.
4. Results
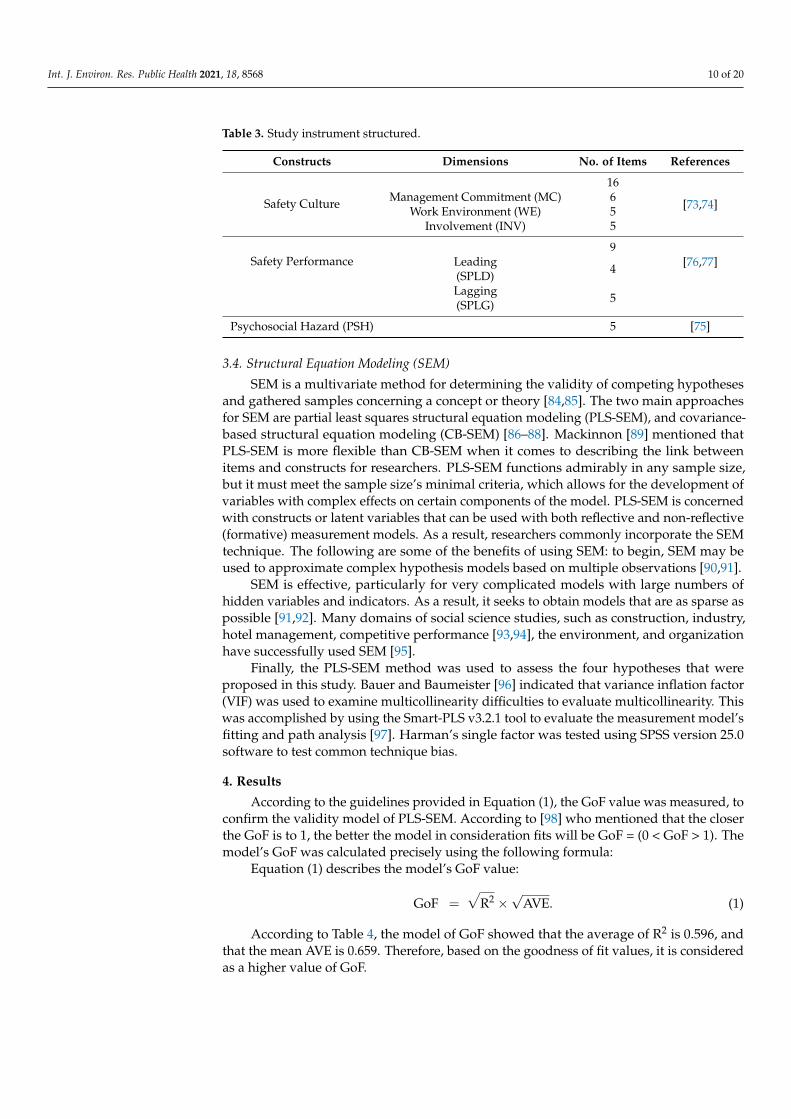
According to the guidelines provided in Equation (1), the GoF value was measured, toconfirm the validity model of PLS-SEM. According to [98] who mentioned that the closerthe GoF is to 1, the better the model in consideration fits will be GoF = (0 < GoF > 1). Themodel’s GoF was calculated precisely using the following formula:
Equation (1) describes the model’s GoF value:
GoF =√
R2 ×√
AVE. (1)
According to Table 4, the model of GoF showed that the average of R2 is 0.596, andthat the mean AVE is 0.659. Therefore, based on the goodness of fit values, it is consideredas a higher value of GoF.
Int. J. Environ. Res. Public Health 2021, 18, 8568 11 of 20
Table 4. Model of GoF.
Laten Variable (AVE) R Square
INV 0.761 0.29Lagging 0.624 0.885Leading 0.711 0.853
MC 0.66 0.801Safety Culture 0.648
Safety Performance 0.635 0.209WE 0.575 0.779
Psychosocial Hazard 0.662 0.358Average
The goodness of Fit GoF0.6585 0.5964
0.61
R2 endogenous constructs, AVE (Average variance extracted), GoF (Goodness of Fit) beseline value (small = 0.1,medium = 0.25, high = 0.36).
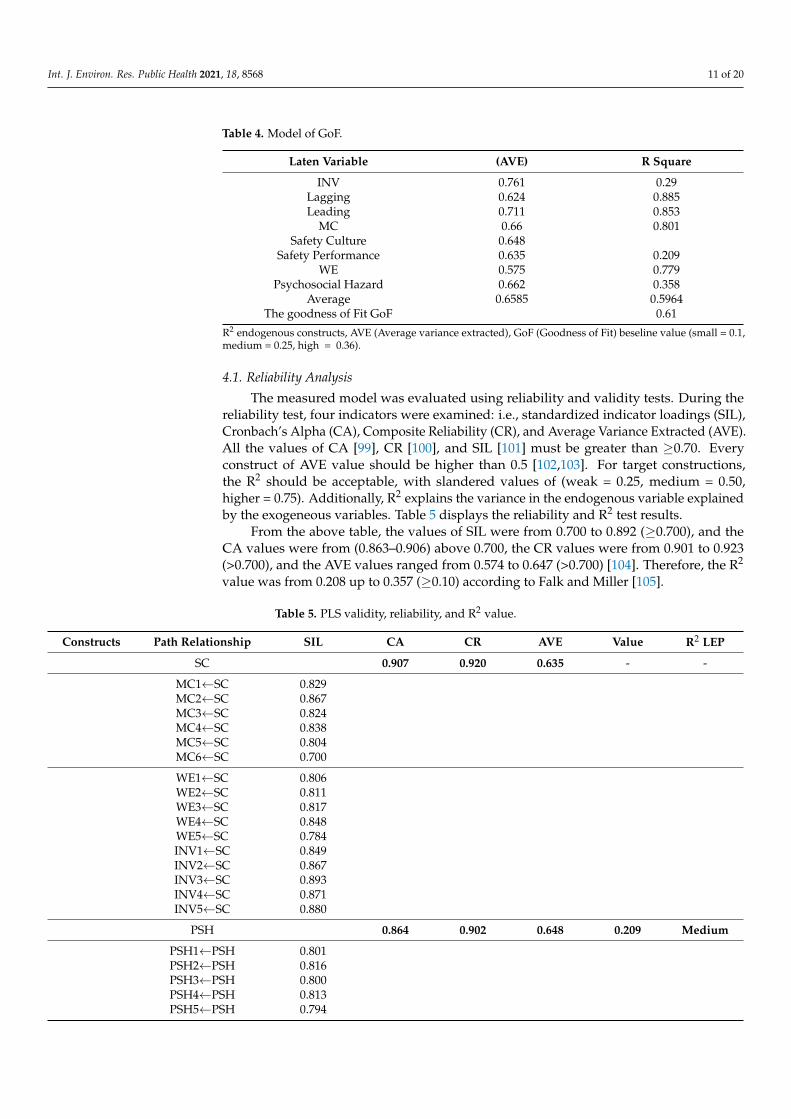
4.1. Reliability Analysis
The measured model was evaluated using reliability and validity tests. During thereliability test, four indicators were examined: i.e., standardized indicator loadings (SIL),Cronbach’s Alpha (CA), Composite Reliability (CR), and Average Variance Extracted (AVE).All the values of CA [99], CR [100], and SIL [101] must be greater than ≥0.70. Everyconstruct of AVE value should be higher than 0.5 [102,103]. For target constructions,the R2 should be acceptable, with slandered values of (weak = 0.25, medium = 0.50,higher = 0.75). Additionally, R2 explains the variance in the endogenous variable explainedby the exogeneous variables. Table 5 displays the reliability and R2 test results.
From the above table, the values of SIL were from 0.700 to 0.892 (≥0.700), and theCA values were from (0.863–0.906) above 0.700, the CR values were from 0.901 to 0.923(>0.700), and the AVE values ranged from 0.574 to 0.647 (>0.700) [104]. Therefore, the R2
value was from 0.208 up to 0.357 (≥0.10) according to Falk and Miller [105].
Table 5. PLS validity, reliability, and R2 value.
Constructs Path Relationship SIL CA CR AVE Value R2 LEP
SC 0.907 0.920 0.635 - -
MC1←SC 0.829MC2←SC 0.867MC3←SC 0.824MC4←SC 0.838MC5←SC 0.804MC6←SC 0.700
WE1←SC 0.806WE2←SC 0.811WE3←SC 0.817WE4←SC 0.848WE5←SC 0.784INV1←SC 0.849INV2←SC 0.867INV3←SC 0.893INV4←SC 0.871INV5←SC 0.880
PSH 0.864 0.902 0.648 0.209 Medium
PSH1←PSH 0.801PSH2←PSH 0.816PSH3←PSH 0.800PSH4←PSH 0.813PSH5←PSH 0.794
Int. J. Environ. Res. Public Health 2021, 18, 8568 12 of 20
Table 5. Cont.
Constructs Path Relationship SIL CA CR AVE Value R2 LEP
SP 0.907 0.924 0.575 0.358 Substantial
LD1←SP 0.823LD2←SP 0.891LD3←SP 0.849LD4←SP 0.807LG1←SP 0.834LG2←SP 0.838LG3←SP 0.781LG4←SP 0.737LG5←SP 0.755
SIL: Standardized indicator loadings, CA: Cronbach’s Alpha, CR: Composite Reliability, AVE: average variance extracted, LEP: LevelExplanatory power, SC: Safety Culture, MC: Management commitment, WE: Work Environment, INV: Involvement, PSH: PsychosocialHazard, SP: Safety Performance, LD: Leading, LG: Lagging.
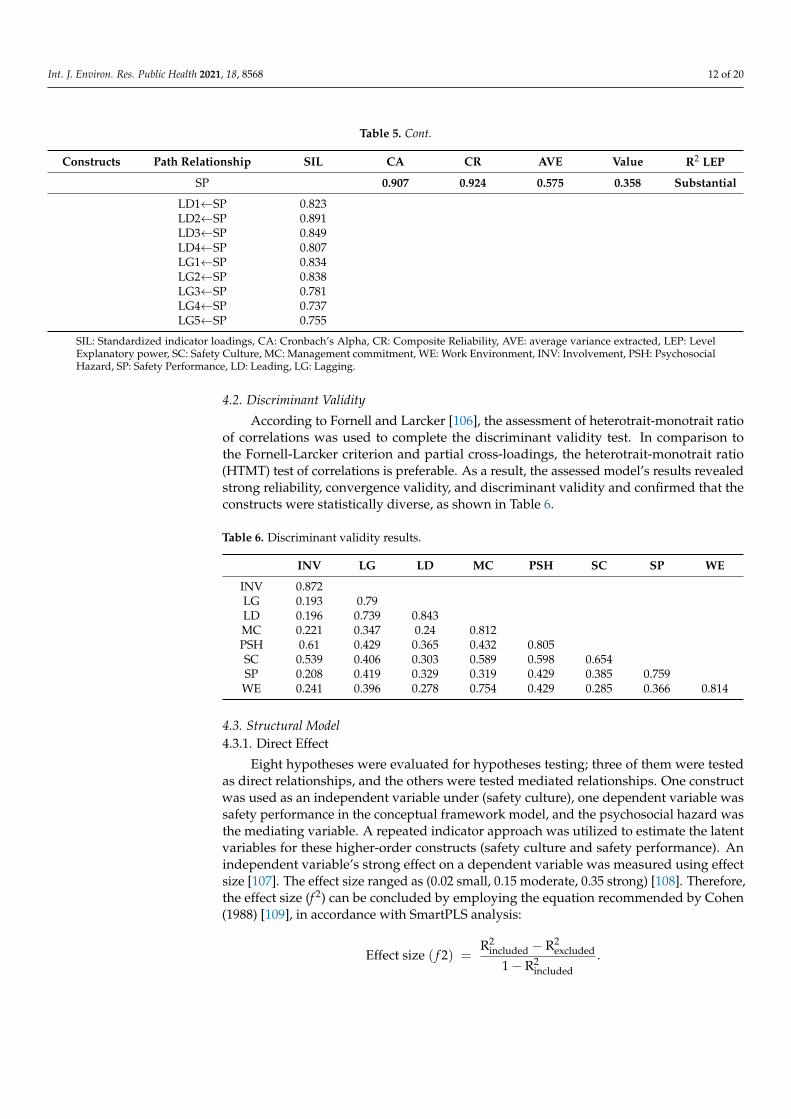
4.2. Discriminant Validity
According to Fornell and Larcker [106], the assessment of heterotrait-monotrait ratioof correlations was used to complete the discriminant validity test. In comparison tothe Fornell-Larcker criterion and partial cross-loadings, the heterotrait-monotrait ratio(HTMT) test of correlations is preferable. As a result, the assessed model’s results revealedstrong reliability, convergence validity, and discriminant validity and confirmed that theconstructs were statistically diverse, as shown in Table 6.
Table 6. Discriminant validity results.
INV LG LD MC PSH SC SP WE
INV 0.872LG 0.193 0.79LD 0.196 0.739 0.843MC 0.221 0.347 0.24 0.812PSH 0.61 0.429 0.365 0.432 0.805SC 0.539 0.406 0.303 0.589 0.598 0.654SP 0.208 0.419 0.329 0.319 0.429 0.385 0.759WE 0.241 0.396 0.278 0.754 0.429 0.285 0.366 0.814
4.3. Structural Model4.3.1. Direct Effect
Eight hypotheses were evaluated for hypotheses testing; three of them were testedas direct relationships, and the others were tested mediated relationships. One constructwas used as an independent variable under (safety culture), one dependent variable wassafety performance in the conceptual framework model, and the psychosocial hazard wasthe mediating variable. A repeated indicator approach was utilized to estimate the latentvariables for these higher-order constructs (safety culture and safety performance). Anindependent variable’s strong effect on a dependent variable was measured using effectsize [107]. The effect size ranged as (0.02 small, 0.15 moderate, 0.35 strong) [108]. Therefore,the effect size (f 2) can be concluded by employing the equation recommended by Cohen(1988) [109], in accordance with SmartPLS analysis:
Effect size ( f 2) =R2
included − R2excluded
1− R2included
.
Int. J. Environ. Res. Public Health 2021, 18, 8568 13 of 20
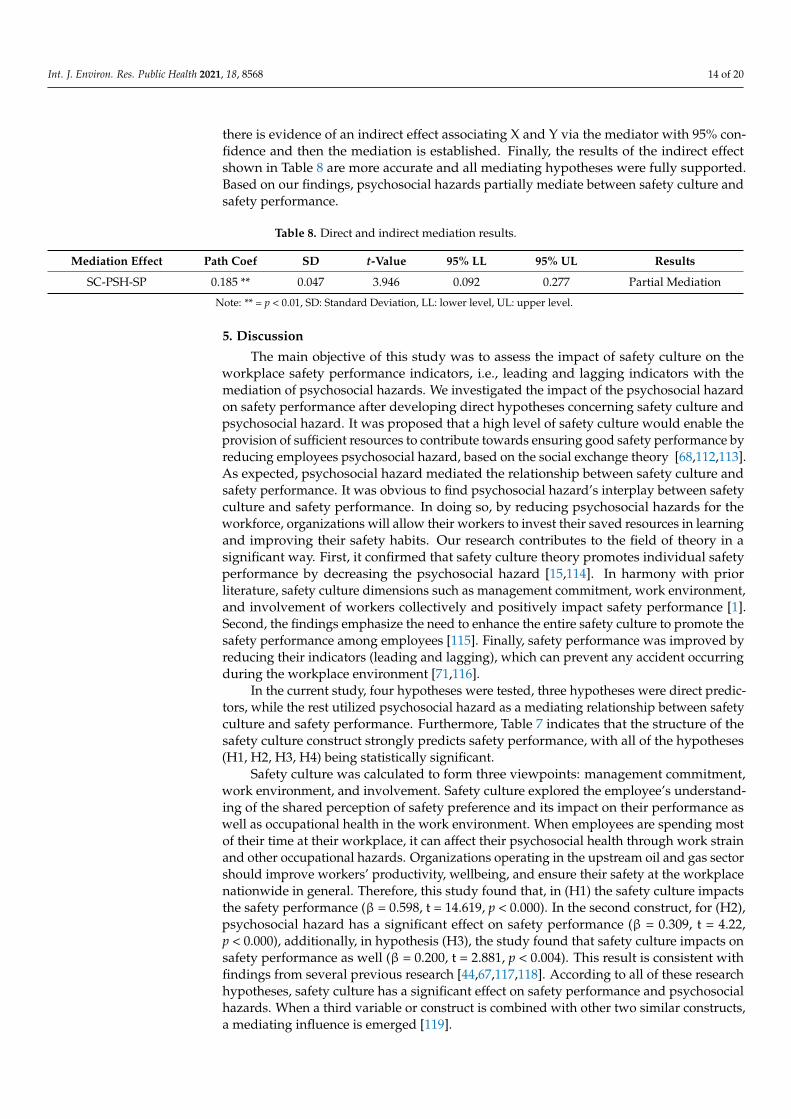
Construct R2 Included R2 Excluded R2 Included-R2 Excluded 1-R2 Included F2 Result
SC 0.209 0.184 0.025 0.791 0.032 SmallPSH 0.209 0.147 0.062 0.791 0.078 Small
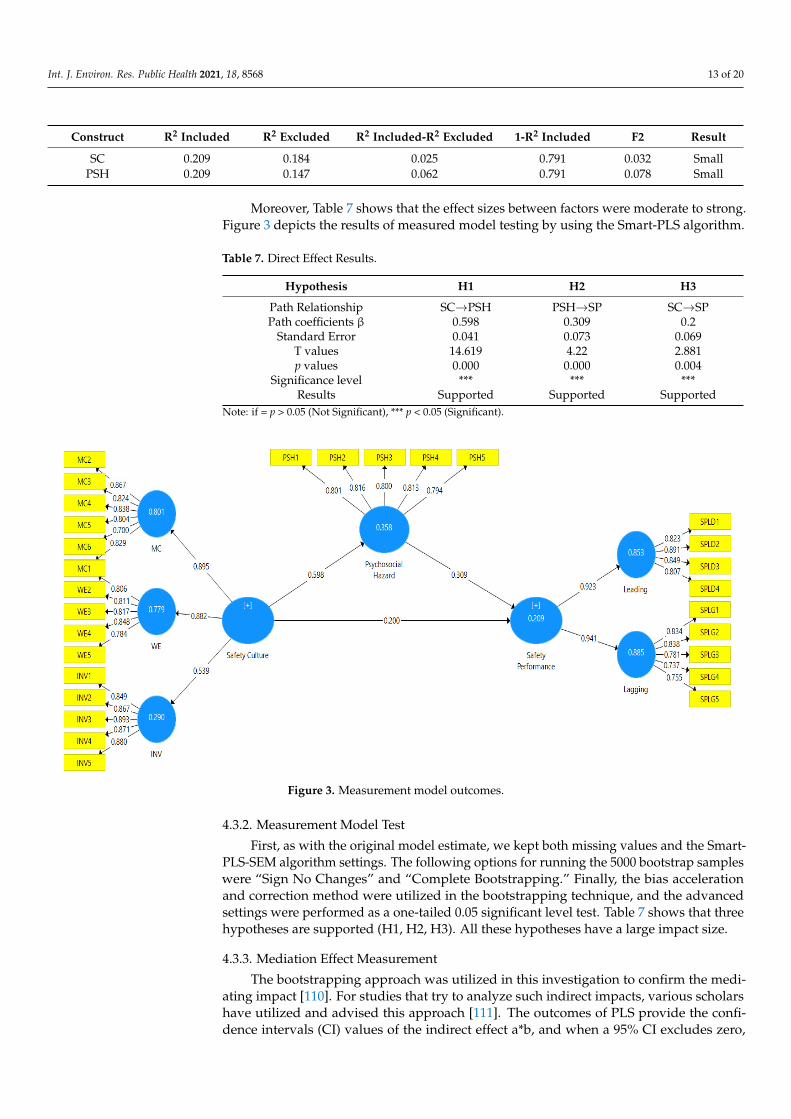
Moreover, Table 7 shows that the effect sizes between factors were moderate to strong.Figure 3 depicts the results of measured model testing by using the Smart-PLS algorithm.
Table 7. Direct Effect Results.
Hypothesis H1 H2 H3
Path Relationship SC→PSH PSH→SP SC→SPPath coefficients β 0.598 0.309 0.2
Standard Error 0.041 0.073 0.069T values 14.619 4.22 2.881p values 0.000 0.000 0.004
Significance level *** *** ***Results Supported Supported Supported
Note: if = p > 0.05 (Not Significant), *** p < 0.05 (Significant).
Int. J. Environ. Res. Public Health 2021, 18, x FOR PEER REVIEW 14 of 21
First, as with the original model estimate, we kept both missing values and the Smart-PLS-SEM algorithm settings. The following options for running the 5000 bootstrap sam-ples were “Sign No Changes” and “Complete Bootstrapping.” Finally, the bias accelera-tion and correction method were utilized in the bootstrapping technique, and the ad-vanced settings were performed as a one-tailed 0.05 significant level test. Table 7 shows that three hypotheses are supported (H1, H2, H3). All these hypotheses have a large im-pact size.
Figure 3. Measurement model outcomes.
4.3.3. Mediation Effect Measurement The bootstrapping approach was utilized in this investigation to confirm the mediat-
ing impact [110]. For studies that try to analyze such indirect impacts, various scholars have utilized and advised this approach [111]. The outcomes of PLS provide the confi-dence intervals (CI) values of the indirect effect a*b, and when a 95% CI excludes zero, there is evidence of an indirect effect associating X and Y via the mediator with 95% con-fidence and then the mediation is established. Finally, the results of the indirect effect shown in Table 8 are more accurate and all mediating hypotheses were fully supported. Based on our findings, psychosocial hazards partially mediate between safety culture and safety performance.
Table 8. Direct and indirect mediation results.
Mediation Effect Path Coef SD t-Value 95% LL 95% UL Results
SC-PSH-SP 0.185 ** 0.047 3.946 0.092 0.277 Partial Mediation
Note: ** = p < 0.01, SD: Standard Deviation, LL: lower level, UL: upper level.
5. Discussion The main objective of this study was to assess the impact of safety culture on the
workplace safety performance indicators, i.e., leading and lagging indicators with the me-diation of psychosocial hazards. We investigated the impact of the psychosocial hazard on safety performance after developing direct hypotheses concerning safety culture and
Figure 3. Measurement model outcomes.
4.3.2. Measurement Model Test
First, as with the original model estimate, we kept both missing values and the Smart-PLS-SEM algorithm settings. The following options for running the 5000 bootstrap sampleswere “Sign No Changes” and “Complete Bootstrapping.” Finally, the bias accelerationand correction method were utilized in the bootstrapping technique, and the advancedsettings were performed as a one-tailed 0.05 significant level test. Table 7 shows that threehypotheses are supported (H1, H2, H3). All these hypotheses have a large impact size.
4.3.3. Mediation Effect Measurement
The bootstrapping approach was utilized in this investigation to confirm the medi-ating impact [110]. For studies that try to analyze such indirect impacts, various scholarshave utilized and advised this approach [111]. The outcomes of PLS provide the confi-dence intervals (CI) values of the indirect effect a*b, and when a 95% CI excludes zero,
Int. J. Environ. Res. Public Health 2021, 18, 8568 14 of 20
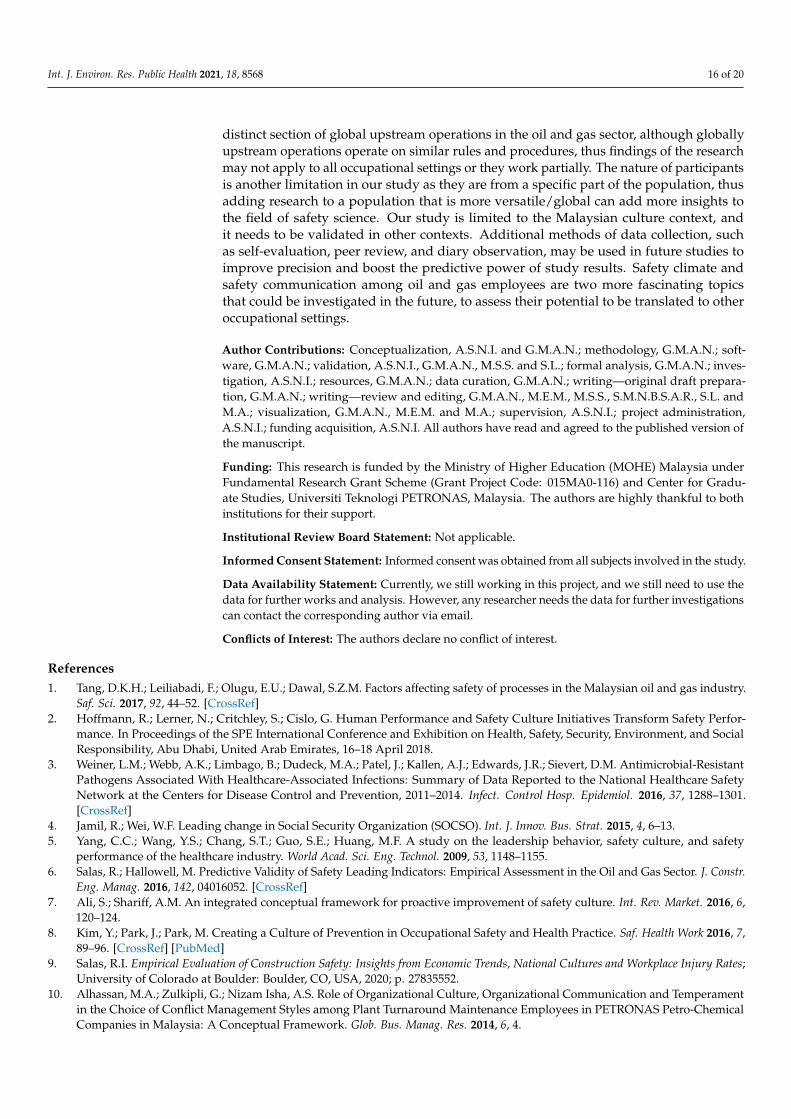
there is evidence of an indirect effect associating X and Y via the mediator with 95% con-fidence and then the mediation is established. Finally, the results of the indirect effectshown in Table 8 are more accurate and all mediating hypotheses were fully supported.Based on our findings, psychosocial hazards partially mediate between safety culture andsafety performance.
Table 8. Direct and indirect mediation results.
Mediation Effect Path Coef SD t-Value 95% LL 95% UL Results
SC-PSH-SP 0.185 ** 0.047 3.946 0.092 0.277 Partial Mediation
Note: ** = p < 0.01, SD: Standard Deviation, LL: lower level, UL: upper level.
5. Discussion
The main objective of this study was to assess the impact of safety culture on theworkplace safety performance indicators, i.e., leading and lagging indicators with themediation of psychosocial hazards. We investigated the impact of the psychosocial hazardon safety performance after developing direct hypotheses concerning safety culture andpsychosocial hazard. It was proposed that a high level of safety culture would enable theprovision of sufficient resources to contribute towards ensuring good safety performance byreducing employees psychosocial hazard, based on the social exchange theory [68,112,113].As expected, psychosocial hazard mediated the relationship between safety culture andsafety performance. It was obvious to find psychosocial hazard’s interplay between safetyculture and safety performance. In doing so, by reducing psychosocial hazards for theworkforce, organizations will allow their workers to invest their saved resources in learningand improving their safety habits. Our research contributes to the field of theory in asignificant way. First, it confirmed that safety culture theory promotes individual safetyperformance by decreasing the psychosocial hazard [15,114]. In harmony with priorliterature, safety culture dimensions such as management commitment, work environment,and involvement of workers collectively and positively impact safety performance [1].Second, the findings emphasize the need to enhance the entire safety culture to promote thesafety performance among employees [115]. Finally, safety performance was improved byreducing their indicators (leading and lagging), which can prevent any accident occurringduring the workplace environment [71,116].
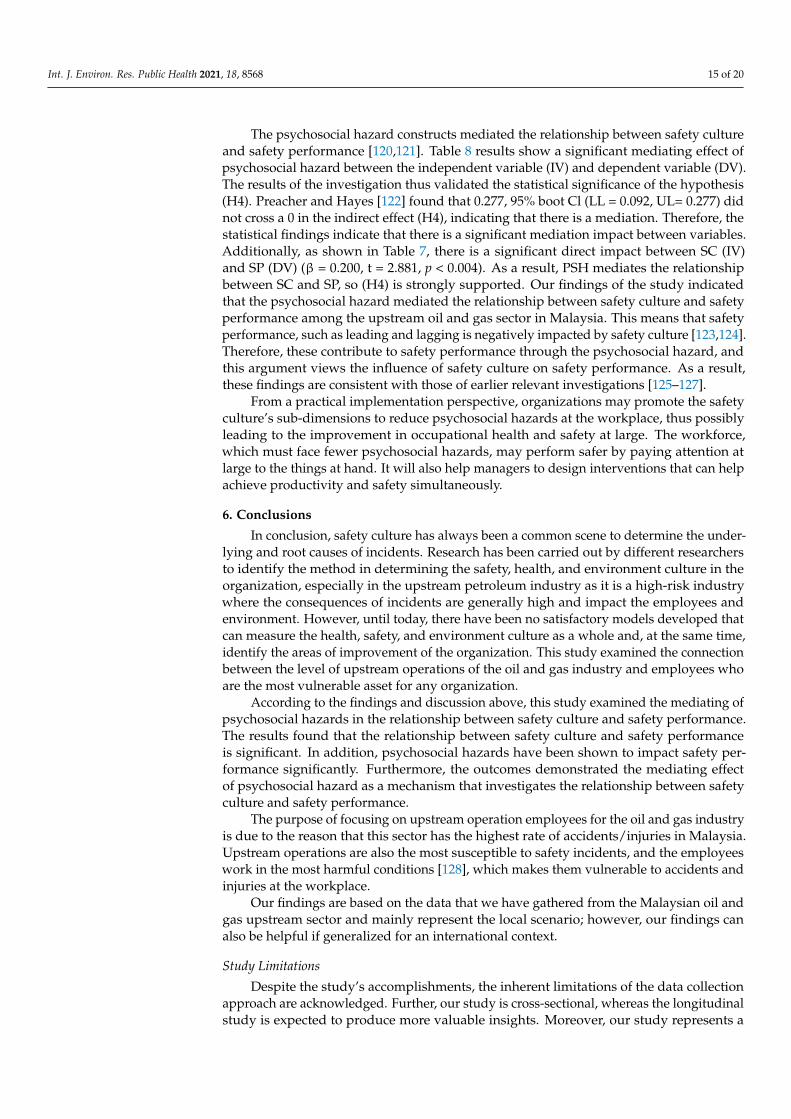
In the current study, four hypotheses were tested, three hypotheses were direct predic-tors, while the rest utilized psychosocial hazard as a mediating relationship between safetyculture and safety performance. Furthermore, Table 7 indicates that the structure of thesafety culture construct strongly predicts safety performance, with all of the hypotheses(H1, H2, H3, H4) being statistically significant.
Safety culture was calculated to form three viewpoints: management commitment,work environment, and involvement. Safety culture explored the employee’s understand-ing of the shared perception of safety preference and its impact on their performance aswell as occupational health in the work environment. When employees are spending mostof their time at their workplace, it can affect their psychosocial health through work strainand other occupational hazards. Organizations operating in the upstream oil and gas sectorshould improve workers’ productivity, wellbeing, and ensure their safety at the workplacenationwide in general. Therefore, this study found that, in (H1) the safety culture impactsthe safety performance (β = 0.598, t = 14.619, p < 0.000). In the second construct, for (H2),psychosocial hazard has a significant effect on safety performance (β = 0.309, t = 4.22,p < 0.000), additionally, in hypothesis (H3), the study found that safety culture impacts onsafety performance as well (β = 0.200, t = 2.881, p < 0.004). This result is consistent withfindings from several previous research [44,67,117,118]. According to all of these researchhypotheses, safety culture has a significant effect on safety performance and psychosocialhazards. When a third variable or construct is combined with other two similar constructs,a mediating influence is emerged [119].
Int. J. Environ. Res. Public Health 2021, 18, 8568 15 of 20
The psychosocial hazard constructs mediated the relationship between safety cultureand safety performance [120,121]. Table 8 results show a significant mediating effect ofpsychosocial hazard between the independent variable (IV) and dependent variable (DV).The results of the investigation thus validated the statistical significance of the hypothesis(H4). Preacher and Hayes [122] found that 0.277, 95% boot Cl (LL = 0.092, UL= 0.277) didnot cross a 0 in the indirect effect (H4), indicating that there is a mediation. Therefore, thestatistical findings indicate that there is a significant mediation impact between variables.Additionally, as shown in Table 7, there is a significant direct impact between SC (IV)and SP (DV) (β = 0.200, t = 2.881, p < 0.004). As a result, PSH mediates the relationshipbetween SC and SP, so (H4) is strongly supported. Our findings of the study indicatedthat the psychosocial hazard mediated the relationship between safety culture and safetyperformance among the upstream oil and gas sector in Malaysia. This means that safetyperformance, such as leading and lagging is negatively impacted by safety culture [123,124].Therefore, these contribute to safety performance through the psychosocial hazard, andthis argument views the influence of safety culture on safety performance. As a result,these findings are consistent with those of earlier relevant investigations [125–127].
From a practical implementation perspective, organizations may promote the safetyculture’s sub-dimensions to reduce psychosocial hazards at the workplace, thus possiblyleading to the improvement in occupational health and safety at large. The workforce,which must face fewer psychosocial hazards, may perform safer by paying attention atlarge to the things at hand. It will also help managers to design interventions that can helpachieve productivity and safety simultaneously.
6. Conclusions
In conclusion, safety culture has always been a common scene to determine the under-lying and root causes of incidents. Research has been carried out by different researchersto identify the method in determining the safety, health, and environment culture in theorganization, especially in the upstream petroleum industry as it is a high-risk industrywhere the consequences of incidents are generally high and impact the employees andenvironment. However, until today, there have been no satisfactory models developed thatcan measure the health, safety, and environment culture as a whole and, at the same time,identify the areas of improvement of the organization. This study examined the connectionbetween the level of upstream operations of the oil and gas industry and employees whoare the most vulnerable asset for any organization.
According to the findings and discussion above, this study examined the mediating ofpsychosocial hazards in the relationship between safety culture and safety performance.The results found that the relationship between safety culture and safety performanceis significant. In addition, psychosocial hazards have been shown to impact safety per-formance significantly. Furthermore, the outcomes demonstrated the mediating effectof psychosocial hazard as a mechanism that investigates the relationship between safetyculture and safety performance.
The purpose of focusing on upstream operation employees for the oil and gas industryis due to the reason that this sector has the highest rate of accidents/injuries in Malaysia.Upstream operations are also the most susceptible to safety incidents, and the employeeswork in the most harmful conditions [128], which makes them vulnerable to accidents andinjuries at the workplace.
Our findings are based on the data that we have gathered from the Malaysian oil andgas upstream sector and mainly represent the local scenario; however, our findings canalso be helpful if generalized for an international context.
Study Limitations
Despite the study’s accomplishments, the inherent limitations of the data collectionapproach are acknowledged. Further, our study is cross-sectional, whereas the longitudinalstudy is expected to produce more valuable insights. Moreover, our study represents a
Int. J. Environ. Res. Public Health 2021, 18, 8568 16 of 20
distinct section of global upstream operations in the oil and gas sector, although globallyupstream operations operate on similar rules and procedures, thus findings of the researchmay not apply to all occupational settings or they work partially. The nature of participantsis another limitation in our study as they are from a specific part of the population, thusadding research to a population that is more versatile/global can add more insights tothe field of safety science. Our study is limited to the Malaysian culture context, andit needs to be validated in other contexts. Additional methods of data collection, suchas self-evaluation, peer review, and diary observation, may be used in future studies toimprove precision and boost the predictive power of study results. Safety climate andsafety communication among oil and gas employees are two more fascinating topicsthat could be investigated in the future, to assess their potential to be translated to otheroccupational settings.
Author Contributions: Conceptualization, A.S.N.I. and G.M.A.N.; methodology, G.M.A.N.; soft-ware, G.M.A.N.; validation, A.S.N.I., G.M.A.N., M.S.S. and S.L.; formal analysis, G.M.A.N.; inves-tigation, A.S.N.I.; resources, G.M.A.N.; data curation, G.M.A.N.; writing—original draft prepara-tion, G.M.A.N.; writing—review and editing, G.M.A.N., M.E.M., M.S.S., S.M.N.B.S.A.R., S.L. andM.A.; visualization, G.M.A.N., M.E.M. and M.A.; supervision, A.S.N.I.; project administration,A.S.N.I.; funding acquisition, A.S.N.I. All authors have read and agreed to the published version ofthe manuscript.
Funding: This research is funded by the Ministry of Higher Education (MOHE) Malaysia underFundamental Research Grant Scheme (Grant Project Code: 015MA0-116) and Center for Gradu-ate Studies, Universiti Teknologi PETRONAS, Malaysia. The authors are highly thankful to bothinstitutions for their support.
Institutional Review Board Statement: Not applicable.
Informed Consent Statement: Informed consent was obtained from all subjects involved in the study.
Data Availability Statement: Currently, we still working in this project, and we still need to use thedata for further works and analysis. However, any researcher needs the data for further investigationscan contact the corresponding author via email.
Conflicts of Interest: The authors declare no conflict of interest.
References1. Tang, D.K.H.; Leiliabadi, F.; Olugu, E.U.; Dawal, S.Z.M. Factors affecting safety of processes in the Malaysian oil and gas industry.
Saf. Sci. 2017, 92, 44–52. [CrossRef]2. Hoffmann, R.; Lerner, N.; Critchley, S.; Cislo, G. Human Performance and Safety Culture Initiatives Transform Safety Perfor-
mance. In Proceedings of the SPE International Conference and Exhibition on Health, Safety, Security, Environment, and SocialResponsibility, Abu Dhabi, United Arab Emirates, 16–18 April 2018.
3. Weiner, L.M.; Webb, A.K.; Limbago, B.; Dudeck, M.A.; Patel, J.; Kallen, A.J.; Edwards, J.R.; Sievert, D.M. Antimicrobial-ResistantPathogens Associated With Healthcare-Associated Infections: Summary of Data Reported to the National Healthcare SafetyNetwork at the Centers for Disease Control and Prevention, 2011–2014. Infect. Control Hosp. Epidemiol. 2016, 37, 1288–1301.[CrossRef]
4. Jamil, R.; Wei, W.F. Leading change in Social Security Organization (SOCSO). Int. J. Innov. Bus. Strat. 2015, 4, 6–13.5. Yang, C.C.; Wang, Y.S.; Chang, S.T.; Guo, S.E.; Huang, M.F. A study on the leadership behavior, safety culture, and safety
performance of the healthcare industry. World Acad. Sci. Eng. Technol. 2009, 53, 1148–1155.6. Salas, R.; Hallowell, M. Predictive Validity of Safety Leading Indicators: Empirical Assessment in the Oil and Gas Sector. J. Constr.
Eng. Manag. 2016, 142, 04016052. [CrossRef]7. Ali, S.; Shariff, A.M. An integrated conceptual framework for proactive improvement of safety culture. Int. Rev. Market. 2016, 6,
120–124.8. Kim, Y.; Park, J.; Park, M. Creating a Culture of Prevention in Occupational Safety and Health Practice. Saf. Health Work 2016, 7,
89–96. [CrossRef] [PubMed]9. Salas, R.I. Empirical Evaluation of Construction Safety: Insights from Economic Trends, National Cultures and Workplace Injury Rates;
University of Colorado at Boulder: Boulder, CO, USA, 2020; p. 27835552.10. Alhassan, M.A.; Zulkipli, G.; Nizam Isha, A.S. Role of Organizational Culture, Organizational Communication and Temperament
in the Choice of Conflict Management Styles among Plant Turnaround Maintenance Employees in PETRONAS Petro-ChemicalCompanies in Malaysia: A Conceptual Framework. Glob. Bus. Manag. Res. 2014, 6, 4.
Int. J. Environ. Res. Public Health 2021, 18, 8568 17 of 20
11. Lilley, R.; McNoe, B.; Davie, G.; De Graaf, B.; Driscoll, T. Work-Related Fatalities Involving Children in New Zealand, 1999–2014.Children 2020, 8, 4. [CrossRef]
12. Shamsuddin, K.A.; Ani, M.N.C.; Ismail, A.K.; Ibrahim, M.R. Investigation the Safety, Health and Environment (SHE) protectionin construction area. Int. Res. J. Eng. Technol. 2015, 2, 624–636.
13. Yorio, P.L.; Edwards, J.; Hoeneveld, D. Safety culture across cultures. Saf. Sci. 2019, 120, 402–410. [CrossRef] [PubMed]14. Fernández-Muñiz, B.; Montes-Peón, J.M.; Vázquez-Ordás, C.J. Safety culture: Analysis of the causal relationships between its key
dimensions. J. Saf. Res. 2007, 38, 627–641. [CrossRef]15. Guldenmund, F. The nature of safety culture: A review of theory and research. Saf. Sci. 2000, 34, 215–257. [CrossRef]16. Cox, S.; Cox, T. The structure of employee attitudes to safety: A European example. Work Stress 1991, 5, 93–106. [CrossRef]17. Wilkinson, F.C.; Lewis, L.K. Developing a Safety Training Program. Libr. Arch. Secur. 2008, 21, 77–85. [CrossRef]18. Chiang, F.F.; Birtch, T.A.; Kwan, H.K. The moderating roles of job control and work-life balance practices on employee stress in
the hotel and catering industry. Int. J. Hosp. Manag. 2010, 29, 25–32. [CrossRef]19. Henning, J.B.; Stufft, C.J.; Payne, S.C.; Bergman, M.E.; Mannan, M.S.; Keren, N. The influence of individual differences on
organizational safety attitudes. Saf. Sci. 2009, 47, 337–345. [CrossRef]20. Liu, S.; Nkrumah, E.N.K.; Akoto, L.S.; Gyabeng, E.; Nkrumah, E. The State of Occupational Health and Safety Management
Frameworks (OHSMF) and Occupational Injuries and Accidents in the Ghanaian Oil and Gas Industry: Assessing the MediatingRole of Safety Knowledge. BioMed Res. Int. 2020, 2020, 6354895. [CrossRef]
21. Ajmal, M.; Nizam Isha, A.S.; Md Nordin, S.; Kanwal, N.; Al-Mekhlafi, A.A.; Naji, G.M.A. A conceptual framework for thedeterminants of organizational agility: Does safety commitment matters? Solid State Technol. 2020, 63, 4112–4119.
22. Akalp, G.; Aytac, S.; Yamankaradeniz, N.; Cankaya, O.; Gokce, A.; Tufekci, U. Perceived Safety Culture and Occupational RiskFactors among women in Metal Industries: A Study in Turkey. Procedia Manuf. 2015, 3, 4956–4963. [CrossRef]
23. Cox, S.; Flin, R. Safety culture: Philosopher’s stone or man of straw? Work Stress 1998, 12, 189–201. [CrossRef]24. Cooper, M.D. Towards a model of safety culture. Saf. Sci. 2000, 36, 111–136. [CrossRef]25. Choudhry, R.; Fang, D.; Mohamed, S. The nature of safety culture: A survey of the state-of-the-art. Saf. Sci. 2007, 45, 993–1012.
[CrossRef]26. Zohar, D.M.; Hofmann, D.A. Organizational Culture and Climate; American Psychological Association: Washington, DC, USA,
2012; Volume 1, pp. 643–666.27. Kozlowski, S.W. The Oxford Handbook of Organizational Psychology; Oxford University Press: Oxford, UK, 2012; Volume 1.28. Schein, E. (Ed.) Organizational Culture and Leadership, 2nd ed.; Jossey Bass: San Francisco, CA, USA, 1992.29. Hansez, I.; Chmiel, N. Safety behavior: Job demands, job resources, and perceived management commitment to safety. J. Occup.
Health Psychol. 2010, 15, 267–278. [CrossRef]30. Joung, H.-W.; Goh, B.K.; Huffman, L.; Yuan, J.; Surles, J. Investigating relationships between internal marketing practices and
employee organizational commitment in the foodservice industry. Int. J. Contemp. Hosp. Manag. 2015, 27, 1618–1640. [CrossRef]31. Kirwan, M.; Matthews, A.; Scott, P.A. The impact of the work environment of nurses on patient safety outcomes: A multi-level
modelling approach. Int. J. Nurs. Stud. 2013, 50, 253–263. [CrossRef]32. Ocloo, J.; Garfield, S.; Dawson, S.; Franklin, B.D. Exploring the theory, barriers and enablers for patient and public involvement
across health, social care and patient safety: A protocol for a systematic review of reviews. BMJ Open 2017, 7, e018426. [CrossRef][PubMed]
33. Chirico, F.; Heponiemi, T.; Pavlova, M.; Zaffina, S.; Magnavita, N. Psychosocial Risk Prevention in a Global Occupational HealthPerspective. A Descriptive Analysis. Int. J. Environ. Res. Public Health 2019, 16, 2470. [CrossRef]
34. Milczarek, M.; Brun, E.; Houtman, I.; Goudswaard, A.; Evers, M.; Bovenkamp, M.; Roskams, N.; Op de Beeck, R.; Pahkin, K.;Berthet, M.; et al. Expert Forecast on Emerging Psychosocial Risks Related to Occupational Safety and Health; Volume 5 of EuropeanRisk Observatory Report; European Agency for Safety and Health at Work: Bilbao, Spain, 2007.
35. Ganzeboom, H.; Treiman, D.J. Internationally Comparable Measures of Occupational Status for the 1988 International StandardClassification of Occupations. Soc. Sci. Res. 1996, 25, 201–239. [CrossRef]
36. Leka, S.; Jain, A.; World Health Organization. Health Impact of Psychosocial Hazards at Work: An Overview; WHO: Geneva,Switzerland, 2010; p. 126.
37. Leka, S.; Jain, A.; Lerouge, L. Work-Related Psychosocial Risks: Key Definitions and an Overview of the Policy Context in Europe.In Psychosocial Risks in Labour and Social Security Law; Springer: Berlin/Heidelberg, Germany, 2017; pp. 1–12.
38. Bergh, L.I.V.; Hinna, S.; Leka, S.; Jain, A. Developing a performance indicator for psychosocial risk in the oil and gas industry. Saf.Sci. 2014, 62, 98–106. [CrossRef]
39. Ruiz, L.; Brown, M.; Li, Y.; Boots, E.; Barnes, L.; Jason, L.; Zenk, S.; Clarke, P.; Lamar, M. Neighborhood Socioeconomic Resourcesand Crime-Related Psychosocial Hazards, Stroke Risk, and Cognition in Older Adults. Int. J. Environ. Res. Public Health 2021,18, 5122. [CrossRef] [PubMed]
40. Cooper, C.L. (Ed.) Theories of Organizational Stress; Oup: Oxford, UK, 1998.41. Ilo, S.; Just, C.; Xhiku, F. Optimisation of multiple quality characteristics of hardfacing using grey-based Taguchi method. Mater.
Des. 2012, 33, 459–468. [CrossRef]42. Kortum, E.; Leka, S.; Cox, T. Perceptions of Psychosocial Hazards, Work-related Stress and Workplace Priority Risks in Developing
Countries. J. Occup. Health 2011, 53, 144–155. [CrossRef] [PubMed]
Int. J. Environ. Res. Public Health 2021, 18, 8568 18 of 20
43. Neal, A.; Griffin, M.; Hart, P. The impact of organizational climate on safety climate and individual behavior. Saf. Sci. 2000, 34,99–109. [CrossRef]
44. Naji, G.M.A.; Isha, A.S.N.; Alzoraiki, M.; Al-Mekhlafi, A.B.A.; Sharafaddin, O.; Saleem, M.S. Impact of Safety Culture AndPsychosocial Hazard On Safety Performance Among Upstream Employees In Malaysia At Oil And Gas Industry. Solid StateTechnol. 2020, 63, 4120–4126.
45. Bunner, J.; Prem, R.; Korunka, C. How Work Intensification Relates to Organization-Level Safety Performance: The MediatingRoles of Safety Climate, Safety Motivation, and Safety Knowledge. Front. Psychol. 2018, 9, 2575. [CrossRef] [PubMed]
46. Chen, Y.; McCabe, B.; Hyatt, D. Impact of individual resilience and safety climate on safety performance and psychological stressof construction workers: A case study of the Ontario construction industry. J. Saf. Res. 2017, 61, 167–176. [CrossRef]
47. Hinze, J.; Thurman, S.; Wehle, A. Leading indicators of construction safety performance. Saf. Sci. 2013, 51, 23–28. [CrossRef]48. Versteeg, K.; Bigelow, P.; Dale, A.M.; Chaurasia, A. Utilizing construction safety leading and lagging indicators to measure project
safety performance: A case study. Saf. Sci. 2019, 120, 411–421. [CrossRef]49. Reiman, T.; Pietikäinen, E. Leading indicators of system safety—Monitoring and driving the organizational safety potential. Saf.
Sci. 2012, 50, 1993–2000. [CrossRef]50. Tamim, N.; Laboureur, D.M.; Mentzer, R.A.; Hasan, A.R.; Mannan, M.S. A framework for developing leading indicators for
offshore drillwell blowout incidents. Process. Saf. Environ. Prot. 2017, 106, 256–262. [CrossRef]51. Sarkheil, H.; Rahbari, S. HSE Key Performance indicators in HSE-MS establishment and sustainability: A case of south pars gas
complex, Iran. Int. J. Occup. Hyg. 2016, 8, 45–53.52. Frankish, K.; Ramsey, W.M. (Eds.) The Cambridge Handbook of Artificial Intelligence; Cambridge University Press (CUP): Cambridge,
UK, 2014.53. Ask, K.; Jasencakova, Z.; Ménard, P.; Feng, Y.; Almouzni, G.; Groth, A. Codanin-1, mutated in the anaemic disease CDAI, regulates
Asf1 function in S-phase histone supply. EMBO J. 2012, 31, 2013–2023. [CrossRef] [PubMed]54. Martin, A.; Walker, K. Oil and Gas Industry Leading Health Performance Indicators. In Proceedings of the SPE International
Conference on Health, Safety, and Environment, Long Beach, CA, USA, 17–19 March 2014.55. Sinelnikov, S.; Inouye, J.; Kerper, S. Using leading indicators to measure occupational health and safety performance. Saf. Sci.
2015, 72, 240–248. [CrossRef]56. Neal, A.; Griffin, M.A. Perceptions of safety at work: Developing a model to link organizational safety climate and individual
behavior. In Proceedings of the 12th Annual Conference of the Society for Industrial and Organizational Psychology, St. Louis,MO, USA, 11–13 April 1997.
57. Mearns, K.; Whitaker, S.M.; Flin, R. Safety climate, safety management practice and safety performance in offshore environments.Saf. Sci. 2003, 41, 641–680. [CrossRef]
58. Wadsworth, E.; Smith, A. Safety Culture, Advice and Performance. Policy Pract. Health Saf. 2009, 7, 5–31. [CrossRef]59. Jasiulewicz-Kaczmarek, M.; Szwedzka, K.; Szczuka, M. Behaviour Based Intervention for Occupational Safety—Case Study.
Procedia Manuf. 2015, 3, 4876–4883. [CrossRef]60. Molenaar, K.R.; Park, J.-I.; Washington, S. Framework for Measuring Corporate Safety Culture and Its Impact on Construction
Safety Performance. J. Constr. Eng. Manag. 2009, 135, 488–496. [CrossRef]61. Kortum, E. Psychosocial Risks and Work-Related Stress in Developing Countries: A Call for Research and Action in Policy Development;
University of Nottingham: Nottingham, UK, 2011.62. Kortum, E.; Leka, S.; Cox, T. Psychosocial risks and work-related stress in developing countries: Health impact, priorities, barriers
and solutions. Int. J. Occup. Med. Environ. Health 2010, 23, 225–238. [CrossRef]63. Lunt, J. Health Psychology: The Missing Ingredient from Health and Safety? In Health Psychology in Action; Wiley: Hoboken, NJ,
USA, 2012; p. 80.64. Rick, J.; Briner, R.B.; Daniels, K.; Perryman, S.; Guppy, A. A Critical Review of Psychosocial Hazard Measures; University of Sussex:
Brighton, UK, 2001.65. Wang, H. Safety Factors and Leading Indicators in Shipping Organizations: Tanker and Container Operations; Rensselaer Polytechnic
Institute: St. Troy, NY, USA, 2008.66. Siu, O.L.; Phillips, D.R.; Leung, T.W. Safety climate and safety performance among construction workers in Hong Kong: The role
of psychological strains as mediators. Accid. Anal. Prev. 2004, 36, 359–366. [CrossRef]67. Manapragada, A.; Bruk-Lee, V.; Thompson, A.H.; Heron, L.M. When safety climate is not enough: Examining the moderating
effects of psychosocial hazards on nurse safety performance. J. Adv. Nurs. 2019, 75, 1207–1218. [CrossRef] [PubMed]68. Emerson, R.M. Social Exchange Theory. Annu. Rev. Sociol. 1976, 2, 335–362. [CrossRef]69. Mohyaldinn, M.E.; Husin, H.; Hasan, N.; Elmubarak, M.M.; Genefid, A.M.; Dheeb, M.E. Challenges during Operation and
Shutdown of Waxy Crude Pipelines. In Processing of Heavy Crude Oils—Challenges and Opportunities; IntechOpen: Rijeka, Croatia,2019; p. 153. [CrossRef]
70. Penkey, S.P.; Siddiqui, N.A. A review on accident pyramid and its empirical interpretation in oil & gas industry (upstream). Int. J.Sci. Res. Publ. 2015, 5, 1–3.
71. Naji, G.M.A.; Isha, A.S.N.; Al-Mekhlafi, A.-B.A.; Sharafaddin, O.; Ajmal, M. Implementation of Leading and Lagging Indicatorsto Improve Safety Performance in the Upstream Oil and Gas Industry. J. Crit. Rev. 2020, 7, 265–269.
Int. J. Environ. Res. Public Health 2021, 18, 8568 19 of 20
72. Mirza, M.Z.; Isha, A.S.N. Context matters: A research agenda to move beyond conventional leadership-safety relationship. Saf.Sci. 2017, 98, 167–173. [CrossRef]
73. Cox, S.; Cheyne, A. Assessing safety culture in offshore environments. Saf. Sci. 2000, 34, 111–129. [CrossRef]74. Vinodkumar, M.; Bhasi, M. Safety management practices and safety behaviour: Assessing the mediating role of safety knowledge
and motivation. Accid. Anal. Prev. 2010, 42, 2082–2093. [CrossRef] [PubMed]75. Bjorner, J.B.; Pejtersen, J.H. Evaluating construct validity of the second version of the Copenhagen Psychosocial Questionnaire
through analysis of differential item functioning and differential item effect. Scand. J. Public Health 2009, 38, 90–105. [CrossRef]76. Sheehan, C.; Donohue, R.; Shea, T.; Cooper, B.; De Cieri, H. Leading and lagging indicators of occupational health and safety: The
moderating role of safety leadership. Accid. Anal. Prev. 2016, 92, 130–138. [CrossRef]77. Shamim, M.Y. Development and Quantitative Evaluation of Leading and Lagging Metrics for PHA, OP, and EPR for Process Safety
Performance; Universiti Teknologi PETRONAS: Seri Iskandar, Malaysia, 2019.78. Ringle, C.M.; Wende, S.; Becker, J.-M. SmartPLS 3; SmartPLS GmbH: Boenningstedt, Germany, 2015.79. Williams, L.J.; Vandenberg, R.J.; Edwards, J.R. 12 structural equation modeling in management research: A guide for improved
analysis. Acad. Manag. Ann. 2009, 3, 543–604. [CrossRef]80. Lei, P.-W.; Wu, Q. Introduction to Structural Equation Modeling: Issues and Practical Considerations. Educ. Meas. Issues Pract.
2007, 26, 33–43. [CrossRef]81. Anderson, J.C.; Gerbing, D.W. Structural equation modeling in practice: A review and recommended two-step approach. Psychol.
Bull. 1988, 103, 411. [CrossRef]82. Faul, F.; Erdfelder, E.; Lang, A.; Buchner, A. G* Power (Version 3.1. 9.2); Software; Universitat Kiel: Kiel, Germany, 2014.83. Reinartz, W.; Haenlein, M.; Henseler, J. An empirical comparison of the efficacy of covariance-based and variance-based SEM. Int.
J. Res. Mark. 2009, 26, 332–344. [CrossRef]84. Reimer, B.; D’Ambrosio, L.A.; Coughlin, J.F.; Fried, R.; Biederman, J. Task-Induced Fatigue and Collisions in Adult Drivers with
Attention Deficit Hyperactivity Disorder. Traffic Inj. Prev. 2007, 8, 290–299. [CrossRef]85. Kecklund, L.; Ingre, M.; Kecklund, G.; Söderström, M.; Åkerstedt, T.; Lindberg, E.; Jansson, A.; Olsson, E.; Sandblad, B.; Almqvist,
P. The TRAIN-project: Railway safety and the train driver information environment and work situation-A summary of the mainresults. In Proceedings of the Signalling Safety 2001, London, UK, 26–27 February 2001; pp. 26–27.
86. Jap, B.T.; Lal, S.; Fischer, P. Inter-hemispheric electroencephalography coherence analysis: Assessing brain activity duringmonotonous driving. Int. J. Psychophysiol. 2010, 76, 169–173. [CrossRef]
87. Mohd Azlis Sani, M.J. Development of an Integrated Train Driver Performance Model/Mohd Azlis Sani Md Jalil; University of Malaya:Kuala Lumpur, Malaysia, 2015.
88. Ghaleb, E.; Dominic, P.; Fati, S.; Muneer, A.; Ali, R. The Assessment of Big Data Adoption Readiness with a Technology–Organization–Environment Framework: A Perspective towards Healthcare Employees. Sustainability 2021, 13, 8379. [CrossRef]
89. MacKinnon, D.P. Integrating Mediators and Moderators in Research Design. Res. Soc. Work. Pract. 2011, 21, 675–681. [CrossRef]90. Hamidun, R.; Hoong, A.P.W.; Roslan, A.; Shabadin, A.; Jamil, H. Characteristics of heavy goods vehicles (HGV) accidents in
Malaysia. IOP Conf. Series Mater. Sci. Eng. 2019, 512, 012021. [CrossRef]91. Bergh, L.I.V.; Leka, S.; Zwetsloot, G.I. Tailoring Psychosocial Risk Assessment in the Oil and Gas Industry by Exploring Specific
and Common Psychosocial Risks. Saf. Health Work. 2018, 9, 63–70. [CrossRef]92. Al-Mekhlafi, A.-B.A.; Isha, A.S.N.; Naji, G.M.A. The relationship between fatigue and driving performance: A review and
directions for future research. J. Crit. Rev. 2020, 7, 134–141.93. Nkrumah, E.; Liu, S.; Fiergbor, D.D.; Akoto, L. Improving the Safety–Performance Nexus: A Study on the Moderating and
Mediating Influence of Work Motivation in the Causal Link between Occupational Health and Safety Management (OHSM)Practices and Work Performance in the Oil and Gas Sector. Int. J. Environ. Res. Public Health 2021, 18, 5064. [CrossRef]
94. Shaikh, S.A. Impact of Internal Marketing and Human Resource Management to Foster Customer Oriented Behavior amongEmployees: A Study on Mega Retail Stores in Karachi. NICE Res. J. 2018, 183–199. [CrossRef]
95. Al-Mekhlafi, A.-B.; Isha, A.; Chileshe, N.; Abdulrab, M.; Saeed, A.; Kineber, A. Modelling the Relationship between the Nature ofWork Factors and Driving Performance Mediating by Role of Fatigue. Int. J. Environ. Res. Public Health 2021, 18, 6752. [CrossRef]
96. Bauer, I.M.; Baumeister, R.F. Self-regulatory strength. In Handbook of Self-Regulation: Research, Theory, and Applications; GuilfordPublications: New York, NY, USA, 2011; Volume 2, pp. 64–82.
97. Javaid, M.U.; Isha, A.S.N.; Ghazali, Z.; Langove, N. Psychosocial stressors in relation to unsafe acts. Int. Rev. Manag. Mark. 2016,6, 4S.
98. Wetzels, M.; Odekerken-Schröder, G.; Van Oppen, C. Using PLS Path Modeling for Assessing Hierarchical Construct Models:Guidelines and Empirical Illustration. MIS Q. 2009, 33, 177. [CrossRef]
99. Mikalef, P.; Pateli, A. Information technology-enabled dynamic capabilities and their indirect effect on competitive performance:Findings from PLS-SEM and fsQCA. J. Bus. Res. 2017, 70, 1–16. [CrossRef]
100. Aboelmaged, M. The drivers of sustainable manufacturing practices in Egyptian SMEs and their impact on competitive capabili-ties: A PLS-SEM model. J. Clean. Prod. 2018, 175, 207–221. [CrossRef]
101. Zeng, F.; Huang, W.-C.; Hueng, C.J. On Chinese Government’s Stock Market Rescue Efforts in 2015. Mod. Econ. 2016, 7, 411–418.[CrossRef]
Int. J. Environ. Res. Public Health 2021, 18, 8568 20 of 20
102. Henseler, J.; Ringle, C.M.; Sarstedt, M. A new criterion for assessing discriminant validity in variance-based structural equationmodeling. J. Acad. Mark. Sci. 2015, 43, 115–135. [CrossRef]
103. Kineber, A.F.; Othman, I.; Oke, A.E.; Chileshe, N.; Alsolami, B. Critical Value Management Activities in Building Projects: A Caseof Egypt. Buildings 2020, 10, 239. [CrossRef]
104. Love, P.E.D.; Davis, P.R.; Chevis, R.; Edwards, D.J. Risk/Reward Compensation Model for Civil Engineering InfrastructureAlliance Projects. J. Constr. Eng. Manag. 2011, 137, 127–136. [CrossRef]
105. Falk, R.F.; Miller, N.B. A Primer for Soft Modeling; University of Akron Press: Akron, OH, USA, 1992.106. Ab Hamid, M.R.; Sami, W.; Sidek, M.H.M. Discriminant Validity Assessment: Use of Fornell & Larcker criterion versus HTMT
Criterion. J. Phys. Conf. Ser. 2017, 890, 012163. [CrossRef]107. Ryan, B.; Wilson, J.R.; Sharples, S.; Clarke, T. Attitudes and opinions of railway signallers and related staff, using the Rail
Ergonomics Questionnaire (REQUEST). Appl. Ergon. 2008, 40, 230–238. [CrossRef] [PubMed]108. Austin, A.; Drummond, P. Work problems associated with suburban train driving. Appl. Ergon. 1986, 17, 111–116. [CrossRef]109. Cohen, J. In Statistical Power Analysis for the Behaviour Sciences (Revised Edition). Biometrics 1988, 73, 19–74.110. Cheung, G.W.; Lau, R.S. Testing mediation and suppression effects of latent variables: Bootstrapping with structural equation
models. Org. Res. Methods 2008, 11, 296–325. [CrossRef]111. Hayes, A.F.; Scharkow, M. The relative trustworthiness of inferential tests of the indirect effect in statistical mediation analysis:
Does method really matter? Psychol. Sci. 2013, 24, 1918–1927. [CrossRef] [PubMed]112. Hobfoll, S.E. Conservation of resources: A new attempt at conceptualizing stress. Am. Psychol. 1989, 44, 513. [CrossRef]113. Zhang, J.; Bal, P.M.; Akhtar, M.N.; Long, L.; Zhang, Y.; Ma, Z. High-performance work system and employee performance: The
mediating roles of social exchange and thriving and the moderating effect of employee proactive personality. Asia Pac. J. Hum.Resour. 2019, 57, 369–395. [CrossRef]
114. Zadow, A.J.; Dollard, M.F.; McLinton, S.; Lawrence, P.; Tuckey, M.R. Psychosocial safety climate, emotional exhaustion, and workinjuries in healthcare workplaces. Stress Health 2017, 33, 558–569. [CrossRef]
115. Zohar, D. Thirty years of safety climate research: Reflections and future directions. Accid. Anal. Prev. 2010, 42, 1517–1522.[CrossRef]
116. Yang, R. Safety in Construction: Connecting Safety Climate, Safety Performance, and Leading Indicators; University of Toronto: Toronto,ON, Canada, 2021.
117. Sommer, M.; Ness, O.; Borg, M. Helpful support to promote participation in school and work: Subjective experiences of peoplewith mental health problems—A literature review. Soc. Work. Ment. Health 2017, 16, 346–366. [CrossRef]
118. Morrow, S.L.; Koves, G.K.; Barnes, V.E. Exploring the relationship between safety culture and safety performance in U.S. nuclearpower operations. Saf. Sci. 2014, 69, 37–47. [CrossRef]
119. Bagozzi, R.P.; Yi, Y. On the evaluation of structural equation models. J. Acad. Mark. Sci. 1988, 16, 74–94. [CrossRef]120. Naji, G.M.A.; Isha, A.N.; Abd, S.M.N.B.S. The Role of HR Strategy on Safety Culture and Psychological Stress among Employees
in the Upstream Oil and Gas Companies: A Conceptual Review. Solid State Technol. 2020, 63, 9118–9128.121. Lei, Z.; Tang, W.; Duffield, C.F.; Zhang, L.; Hui, F.K.P.; You, R. Qualitative Analysis of the Occupational Health and Safety
Performance of Chinese International Construction Projects. Sustainability 2018, 10, 4344. [CrossRef]122. Preacher, K.J.; Hayes, A.F. Asymptotic and resampling strategies for assessing and comparing indirect effects in multiple mediator
models. Behav. Res. Methods 2008, 40, 879–891. [CrossRef] [PubMed]123. Gao, R.; Chan, A.P.; Utama, W.P.; Zahoor, H. Multilevel Safety Climate and Safety Performance in the Construction Industry:
Development and Validation of a Top-Down Mechanism. Int. J. Environ. Res. Public Health 2016, 13, 1100. [CrossRef]124. Kalteh, H.O.; Mortazavi, S.B.; Mohammadi, E.; Salesi, M. The relationship between safety culture and safety climate and safety
performance: A systematic review. Int. J. Occup. Saf. Ergon. 2021, 27, 206–216. [CrossRef] [PubMed]125. Yiu, N.S.; Chan, D.W.; Sze, N.; Shan, M. Implementation of Safety Management System for Improving Construction Safety
Performance: A Structural Equation Modelling Approach. Buildings 2019, 9, 89. [CrossRef]126. Zahoor, H.; Chan, A.P.C.; Utama, W.P.; Gao, R.; Zafar, I. Modeling the Relationship between Safety Climate and Safety Performance
in a Developing Construction Industry: A Cross-Cultural Validation Study. Int. J. Environ. Res. Public Health 2017, 14, 351.[CrossRef] [PubMed]
127. Grecco, C.H.D.S.; Vidal, M.C.R.; Cosenza, C.A.N.; Dos Santos, I.J.A.L.; De Carvalho, P.V.R. Safety culture assessment: A fuzzymodel for improving safety performance in a radioactive installation. Prog. Nucl. Energy 2014, 70, 71–83. [CrossRef]
128. Mannan, M.S.; Reyes-Valdes, O.; Jain, P.; Tamim, N.; Ahammad, M. The Evolution of Process Safety: Current Status and FutureDirection. Annu. Rev. Chem. Biomol. Eng. 2016, 7, 135–162. [CrossRef] [PubMed]


