Embed Size (px)
Citation preview

2001-2006 Mission Kearney Foundation of Soil Science: Soil Carbon and California's Terrestrial Ecosystems
Final Report: 2003313, 1/1/2004-12/31/2006
* Principal Investigator 1Department of Land, Air and Water Resources, University of California, Davis 2Department of Soil Biology and Plant Nutrition, University of Kassel, Germany
Impacts of Plant Community Composition on Soil Carbon Processes in Grasslands
Louise E. Jackson*1, Martin Potthoff
2, Shannon Sokolow
1, and Dennis E. Rolston*
1
Summary Soil C sequestration increases after the abandonment of marginal agricultural lands in California, due to the rapid invasion of non-native annual grasses. In a few rare cases, land managers have restored old fields with native perennial bunchgrasses. This was hypothesized to further increase C storage, especially deeply deposited soil C, since these species can construct root systems that use deep moisture, extending C gain over a longer growing season. Restored perennial grasslands were created by tilling an old-field annual grassland prior to seeding perennials in 1997. One project compared CO2 dynamics in restored perennial grassland, annual grassland, and tilled, bare soil. CO2 emission and soil gas CO2 concentrations were similar in the annual and restored perennial grasslands, supporting unexpected findings that root distribution and soil microbial biomass were generally similar. This may have been due to the young age of the plants or to a lack of a deep layer of stored moisture in this sandy loam soil. A second project tracked the fates and effects of added high C:N C4 (Bouteloua gracilis) vs. site C3 plant litter in a restored perennial grassland using field cylinders that each contained a perennial bunchgrass (Nassella pulchra). Some cylinders were also seeded with a native annual legume (Lupinus bicolor). Two years later, soil microbial biomass C, especially fungi, was higher in the legume treatment, but was lower with the high C:N litter, which apparently released C slowly but gradually, based on the isotopic enrichment in the soil C pools. Biomass of the bunchgrass tended to increase with the high C:N litter, possibly because the dense litter layer reduced competition with annual plants. Neither treatment was effective in both increasing native bunchgrass biomass and soil C pools. To further investigate C storage by native perennials used in restoration projects, such as hedgerows, a set of relationships was developed for estimating shoot and root C from shrub volume and height. Overall, this research shows the complexity of restoring native plant communities while simultaneously increasing soil C sequestration.
Objectives Two restored perennial grasslands at the UC Hastings Natural History Reservation in Carmel Valley were created from annual grassland on sandy loam soil after a two-year period of tillage to remove annuals, followed by direct-seeding of native perennial bunchgrasses, and then no further management since 1998. This method successfully established perennial grasses, but plant cover has not increased in the past few years, suggesting that either water or nutrients are limiting plant growth, and thus potential C inputs to soil (Stromberg, unpubl. data). Litter management, planting a legume, and nutrient additions are possible options to increase plant biomass, C deposition and storage. The specific objectives were to:

Impacts of Plant Community Composition on Soil Carbon Processes in Grasslands—Jackson
2
1. Monitor and survey roots, soil gas CO2 concentrations and efflux, and soil C pools in several native perennial grasslands, and relate to environmental and edaphic differences, so that factors important for deep root C deposition and storage can be determined.
2. Track the fates and effects of added C4 vs. typical C3 plant litter in field microcosms with or without a native annual legume and/or added phosphorus (P) after three years, and assess above- and belowground outcomes for plants and soil C pools.
3. Compare fates of applied labile 13C to soil under different assemblages of plants in restored native perennial grassland, and relate to plant architectural traits and life form.
The objectives changed during the three-year period, mainly because we found little difference between annual and restored perennial grasslands in roots, CO2 production, or microbial communities with depth (Potthoff et al. 2005; Potthoff et al. 2006). This made us skeptical about the value of disturbing relict native perennial grasslands which are rare (Objective 1). For the same reason, we doubted whether the labeling with labile 13C would show differences between annuals and perennials (Objective 3). Instead, much greater emphasis was placed on the project that addressed Objective 1, but only at one site by monitoring CO2 emissions and soil gas CO2 concentrations between tilled, annual grassland, and restored perennial grasslands, to show if differences could be attributed to management type, seasonal differences, or soil moisture (see below, Soil CO2 and CO2 emission in grasslands with different management histories). Objective 2 was addressed in another project, which tracked fates and effects of added high C:N C4 vs. typical lower C:N C3 plant litter in field microcosms with or without lupines (see below, Field microcosms with perennial bunchgrasses and additions of litter and lupines). To address the issue of root C storage, we assessed woody native perennial species that are being used as hedgerows on farms, to determine ways to make estimates for restoration projects (see below, Determining shrub above- and belowground biomass and carbon content for hedgerows). We also wrote a review on soil biology and C sequestration for a book on California grasslands, as a way to reconcile some of these issues about productivity and C storage (Jackson et al. 2007).
Approach and Procedures
Study Sites The UC Hastings Natural History Reservation is in the foothills of the Santa Lucia Mountains in Upper Carmel Valley, Monterey County. The reserve is protected from cattle grazing, which partially accounts for the prevalence of relict perennial grasslands. The main two study sites (Well site and Corral site) are located on level areas (20 m x 50 m) on Gorgonio sandy loam that were farmed between 1865 and 1937. From 1937 to 1995, the sites were annual grassland. Different management treatments were established beginning in November 1995. There are three field management types: 1) tilled, bare soil that has been plant-free since 1995 using tillage and Round-up™ herbicide; 2) annual grassland since 1937; and 3) restored perennial grassland that was seeded in December 1997, with the native bunchgrasses, Nassella pulchra and Elymus glaucus, after tillage and Round-up for two years.
The UC Quail Ridge Reserve, near Lake Berryessa in Napa County, was the location at which native perennial chapparal shrubs were sampled for above- and belowground biomass and shrub
Impacts of Plant Community Composition on Soil Carbon Processes in Grasslands—Jackson
3
volume for determining allometric relationships. Species used in farm-site hedgerows are present there in sufficient quantity to allow destructive sampling.
Soil CO2 and CO2 emission in grasslands with different management histories
At the Corral site, stations on the west and east sides of the field were set up for CO2 monitoring. Hollow in situ soil gas samplers were inserted at 7.5, 22.5, 45, and 70 cm depth (Rolston 1986) in representative areas of tilled soil, annual grassland, and at the perimeter of perennial grass bunches in the restored perennial grassland. The upper soil layer was sampled using canulated needles. Surface CO2 emission was measured for 30 min with capped chambers. Gas samples were stored in exitainers, and analyzed by infrared detection. Gravimetric moisture samples were taken at 0-15, 15-30, 30-60 and 60-80 cm depth. A nearby weather station monitored temperatures. There were 12 sampling dates throughout the study period (2003-05).
CO2 dynamics at peak productivity in early spring (March). Since early spring is the peak growing season when soil moisture is more uniform and plants are highly productive, two early springtime data sets were analyzed: 1) early March data (March 5, 2003, March 5, 2004, and March 2, 2005); and 2) late March data (March 31, 2003, March 27, 2004, and April 6, 2005). Analysis of variance (ANOVAs) compared treatments within each data set. Analyses of co-variance (ANCOVAs) were run with gravimetric soil moisture as the covariate, to adjust the soil gas CO2 concentration and emission data as if they were all at the same moisture level. Additional runs also using soil water potential (Ψs) as a covariate, based on moisture retention curves from very similar soil in the vicinity (Steenwerth et al. 2003).
CO2 dynamics in late spring (April, Ma,y and June). Mid-April until early June sampling dates (May 7 and 24, 2003, June 5, 2003, April 14, 2004, and May 27, 2005) were analyzed as a data set to observe CO2 dynamics as the growing season tapers off, i.e. soil moisture lessens and biotic activity slows down. Statistical analysis was as above.
Field microcosms with perennial bunchgrasses and additions of litter and lupines
At the Well site, to investigate the effects of surface inputs of perennial grass litter, in December 2002, PVC cylinders (30-cm deep x 30-cm dia.) were pushed 25-cm deep into the soil in the restored perennial grasslands. Every cylinder encircled a 6-year-old Nassella pulchra plant with mean diameter of 6 cm. In half of the cylinders, existing C3 litter (≅30 g per cylinder) was removed, and 50 g litter of Bouteloua gracilis, corresponding to 700 g m-2 was replaced. Bouteloua gracilis does not grow locally, and is a C4 plant with higher natural abundance of 13C in its tissue (δ13C = -13.96) compared to Nassella pulchra, a C3 plant (δ13C = -27.85). They have similar C:N ratio (~100). No other C4 species occur at the site. Germinated seeds (≅100 per cylinder) of the native annual legume, Lupinus bicolor (‘Miniature lupine’), were scattered on the soil surface of half of the cylinders in December 2002. Four treatments are reported here (a treatment with added P is not shown), each replicated five times in a random design:
C4 (B. gracilis) litter, -Lupinus C3 (Annual plants) litter, -Lupinus C4 (B. gracilis) litter, +LupinusP C3 (Annual plants) litter, +Lupinus

Impacts of Plant Community Composition on Soil Carbon Processes in Grasslands—Jackson
4
Plant sampling was done in April/May 2003, 2004, and 2005. In 2004 and 2005, cover was recorded for all species in each cylinder. In 2005, aboveground biomass of annuals and Nassella was clipped, litter was removed, and plants and litter were weighed after drying. Isotope signatures and total concentrations of C and N were determined on: 1) tissue from the Nassella plant in each cylinder; 2) the standing annual plant biomass in each cylinder; and 3) litter residues left on the soil surface in each cylinder. For the latter, δ13C values were used to calculate the proportion of Bouteloua C4 litter vs. litter of annual plants grown in 2003 and 2004 by the following equation:
y = (δ13Csa - δ13CC3) / (δ13CC4 - δ13CC3);
where y is the portion of C4 litter-C contributing to the mixed sample, sa indicates the mixed sample, C4 the C4 litter, and C3 the C3 litter.
Soil samples at two depths (0 – 7.5 cm and 7.5 – 15 cm), were taken from each cylinder and the core was filled with a PVC tube to prevent the soil from collapsing and to avoid preferential flow of rainwater into the holes. In 2005, the cylinders were removed from the site and sliced into three layers (0 – 7.5, 7.5 – 15, and 15 – 30 cm). Isotope signatures and total soil C and N were determined on a Europa Hydra 20/20 IRMS at the UC Davis Stable Isotope Facility.
Soil microbial biomass C (SMB-C) was measured by fumigation extraction (Wu et al. 1990; Joergensen 1996). Organic C in the K2SO4 extracts was measured using diluted extracts (1:10) and a Phoenix 8000 automatic analyzer (Tekmar-Dohrmann). After the extracts were digested with persulfate, the CO2 passed from a C analyzer in line with a PDZ Europa 20-20 isotope ratio mass spectrometer at the UC Davis Stable Isotope Facility. Litter-derived C in total soil C and in the SMB was calculated following Potthoff et al. (2003).
The fungal marker, ergosterol, was measured according to Djajakirana et al. (1996). The protocol for phospholipid lipid fatty acid (PLFA) analysis for microbial community fingerprinting followed Bossio and Scow (1998). PLFA were grouped into bacterial (actinomycetes, Gram positive (Gram+), Gram negative (Gram-)), fungal and unspecific origins.
Statistical analysis included ANOVAs for comparisons between C4 vs. C3 litter treatments, and with vs. without Lupinus treatments. PLFA profiles were analyzed by Correspondence Analysis (Canoco 4.0). PLFAs that were detected in less than 10% of the samples were excluded from further analysis.
Determining shrub above- and belowground biomass and carbon content for hedgerows
At the Quail Ridge Reserve, accessible areas were searched for shrub species that are commonly planted in hedgerows, and seven Baccharis pilularis (coyote brush), eight Heteromeles arbutifolia (toyon) and six Ceanothus cuneatus (ceanothus) were selected and sampled for above- and belowground biomass during February and March 2007. Canopy dimensions of each shrub were measured as a possible non-destructive predictor of biomass for future shrub estimates. These included the longest horizontal diameter, the diameter perpendicular to the longest diameter, and the shrub height from ground level. Each shrub was divided into four quarters and one quarter was then randomly chosen for destructive sampling. From the remaining three-quarters of the shrub, representative branches were separated into leaf and woody material
Impacts of Plant Community Composition on Soil Carbon Processes in Grasslands—Jackson
5
for C content. Then the remainder of the plant was harvested, weighed wet, and a sub-sample was dried and weighed to calculate total aboveground biomass. After harvesting the aboveground biomass, the main shrub root system was excavated with the assistance of a backhoe attached to a small tractor. This was the top ~30 cm for coyote brush and ceanothus, and ~60 cm for toyon.
Results
Soil CO2 and CO2 emission in grasslands with different management histories
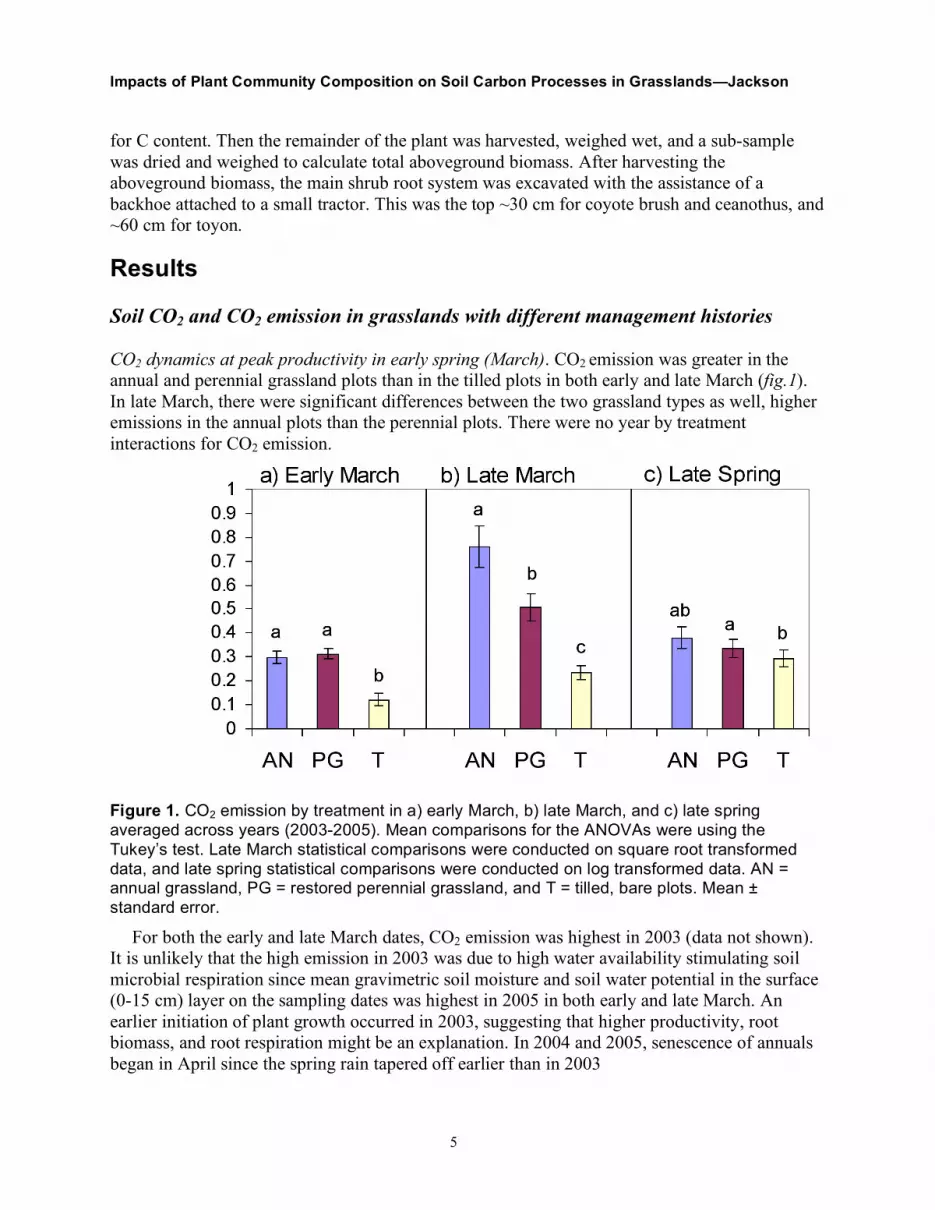
CO2 dynamics at peak productivity in early spring (March). CO2 emission was greater in the annual and perennial grassland plots than in the tilled plots in both early and late March (fig.1). In late March, there were significant differences between the two grassland types as well, higher emissions in the annual plots than the perennial plots. There were no year by treatment interactions for CO2 emission.
Figure 1. CO2 emission by treatment in a) early March, b) late March, and c) late spring averaged across years (2003-2005). Mean comparisons for the ANOVAs were using the Tukey’s test. Late March statistical comparisons were conducted on square root transformed data, and late spring statistical comparisons were conducted on log transformed data. AN = annual grassland, PG = restored perennial grassland, and T = tilled, bare plots. Mean ± standard error.
For both the early and late March dates, CO2 emission was highest in 2003 (data not shown). It is unlikely that the high emission in 2003 was due to high water availability stimulating soil microbial respiration since mean gravimetric soil moisture and soil water potential in the surface (0-15 cm) layer on the sampling dates was highest in 2005 in both early and late March. An earlier initiation of plant growth occurred in 2003, suggesting that higher productivity, root biomass, and root respiration might be an explanation. In 2004 and 2005, senescence of annuals began in April since the spring rain tapered off earlier than in 2003

Impacts of Plant Community Composition on Soil Carbon Processes in Grasslands—Jackson
6
(http://www.hastingsreserve.org), and there was approximately two times less aboveground biomass produced than in 2003, based on sampling at a nearby site.
Soil gas CO2 concentrations were greater in the perennial grassland plots than in the tilled plots in both early and late March, averaged across depths (fig. 2). No significant differences in soil gas CO2 concentration were observed between the two grassland types or between the annual and tilled plots, regardless of depth (data not shown). Soil gas CO2 concentration increased with depth in both early and late March (data not shown).
Figure 2. CO2 concentration in the soil atmosphere using a weighted averaged across depths in a) early March, b) late March, and c) late spring (averaged across depth and year). Mean comparisons for the ANOVAs used the Tukey’s test. AN = annual grassland, PG = restored perennial grassland, and T = tilled, bare plots. Mean ± standard error.
There was a significant (P<0.0001) year effect for soil gas CO2 concentration in early March, where CO2 concentration, averaged across depth and treatment, was significantly (P≤0.0003) higher in 2005 than in 2003 and 2004, but no year effect occurred in late March.
CO2 dynamics in late spring (April, May, and June). The perennial grassland had significantly higher CO2 emissions than tilled plots in the late spring data set (fig. 1). No differences occurred between the annual and tilled plots or between the two grassland types.
The three treatments had similar soil gas CO2 concentrations in late spring (fig. 2), and there were no depth by treatment interactions. But, there was a significant depth effect, where CO2 concentration significantly increased with depth (data not shown).
In 2003, the CO2 emission was highest in late spring compared to the other two years, just as for the March data sets. However, in late spring, 2003 had the highest soil CO2 concentration rather than year 2005, as was seen in early and late March.
Effects of soil moisture on CO2 dynamics. Gravimetric moisture was 2.5% to 21.8%, which corresponds to Ψs of -2.9 MPa to -0.01 MPa during the early spring period (early and late March). During the late spring period, this ranged at 7.5cm from 0.26% to 13.9%, which corresponds to Ψs of -4.3 MPa to -0.02 MPa. The effects of soil moisture on CO2 emission depended largely on

Impacts of Plant Community Composition on Soil Carbon Processes in Grasslands—Jackson
7
timing within the growing season, with differing significant relationships in early March, late March, and late spring (table 1). These relationships ranged from positive, negative, or none at all.
Table 1. The relationship between soil moisture at 0-15 cm depth and CO2 emission stratified by growing season for all treatments (annual grassland, restored perennial grassland, and tilled bare soil) for three seasons (March through June) at the Corral site
Season Relationship between soil moisture (%) and CO2 emission (kg C ha-1 hr-1)
r2 P
Early March + 0.07 0.07 Late March - 0.1008 0.025 Late Spring (April, May, June) + 0.2571 <0.001 The entire study period (March through June) No relationship 0.000751 0.7204
For the early spring data, results of the ANOVA and ANCOVA (with surface moisture as a
covariate) for CO2 emission were matched, i.e., grasslands were similar, but greater than tilled plots. In late March, the difference between the two grassland types for surface CO2 emission became non-significant when we added Ψs to the model as a covariate, suggesting differences in Ψs between the two communities explained the difference in CO2 emission (see Figure 2b).
For soil CO2 concentrations, with gravimetric soil moisture (by depth) added to the model for CO2 concentration as a covariate in the ANCOVA in late spring, the main treatment effect became significant (P=0.003); both the annual and perennial plots had significantly higher CO2 concentration than the tilled plots, regardless of depth or year. But, there were no significant differences between the two grassland types.
Field microcosms with perennial bunchgrasses and additions of litter and lupines
Plants and plant biomass. In the first year (2003), the total cover of Lupinus spp. ranged from ~25% to ~65%. In successive years, Lupinus spp. cover did not reach the performance of 2003; cover was 6% or lower. There were no effects of Lupinus addition on the aboveground biomass of Nassella bunchgrasses at the end of the experiment in 2005 (table 2).
Biomass of Nassella plants tended to increase (P=0.06) with the high C:N exchanged C4 litter compared to the lower amounts of lower C:N site litter (table 2). Cover of Nassella in 2004 and 2005 were highest in the treatment with C4 litter (21.4 to 27.6%,) compared to 11.4 to 14% cover in the C3 litter treatments.
In 2003, annual plants in cylinders with original C3 litter left in place had about twice as much biomass as the cylinders with the Bouteloua litter exchange (P<0.001). This was mainly due to the higher Lupinus cover. There were no treatment effects on the standing biomass of annual plants in the subsequent years. No marked differences ever occurred in species composition among treatments, nor were there clearly dominant annual species in any year
Nutrients in plants and litter. At the end of the experiment in 2005, the total C and N content of all plant tissues and recovered litter were generally unaffected by the treatments (table 2).

Impacts of Plant Community Composition on Soil Carbon Processes in Grasslands—Jackson
8
Higher P concentrations in Nassella tissue occurred in treatments without litter exchange compared to Bouteloua C4 litter treatments (1881 vs. 1629 µg P g-1 tissue).
Nassella plants grown with added Lupinus had more negative δ13C values than without added Lupinus (-28.0 vs. -27.4) (table 2). As expected, δ13C values were less negative in recovered litter from the Bouteloua C4 litter treatments than from the treatments without litter exchange. The addition of Lupinus resulted in more negative δ13C values in the recovered litter from both litter treatments. Adding Lupinus also decreased δ15N values in recovered litter. On average, adding Lupinus lowered litter δ15N from 0.78 to -0.31. In contrast, adding Bouteluoa litter increased the δ15N in the recovered litter, but with much greater effects between the litter treatments with added Lupinus.
Nutrient contents of soil. The total soil C content at both depths (0 – 7.5 and 7.5 – 15 cm) in the unamended treatment (C3 litter and no added Lupinus) did not change throughout the 28-month period. It ranged between 0.76 and 0.94% C in the upper layer, and 0.76 and 0.83% in the lower layer. Neither the increase of Lupinus density nor the litter exchange affected the total C content of soil (data not shown), and the similarity between the C and N content of the two layers reflects the recent tillage to establish the restored perennial grassland. Adding Lupinus in 2002 resulted in slightly lower soil C at 7.5 – 15 cm depth in 2005, but had no effect on total soil N.
Bray-P contents showed both litter exchange and Lupinus addition effects in 2005 (data not shown). The lowest Bray-P concentrations were with existing C3 litter and no added Lupinus. Addition of the Bouteloua C4 litter increased Bray-P slightly in the surface layer. In the lower layer, Lupinus increased the soil available P with the existing C3 litter, but not with the high C:N C4 litter. The recovered litter had higher P content in the C4 litter treatment.
Soil microbial biomass and communities. The SMB-C was ~130 µg g-1 dry soil in December 2002, right before installation of cylinders and treatments. In the following spring (April 2003), a slight overall increase occurred in SMB-C; it was 150 to 200 µg g-1 dry soil, with no differences among treatments. This range was generally seen again in April 2005. In spring 2005, the Bouteloua C4 litter-exchange treatments showed lower values in the surface layer than existing C3 litter, while Lupinus addition increased SMB-C. For the 7. 5 – 15 cm layer, there were no differences among treatments on either date, and means ranged from 70 to 100 µg g-1 dry soil (data not shown).).
Using analysis of 13C natural abundance, the contribution of the added Bouteluoa litter to total soil C and the SMB-C was determined. After five months of decomposition during the wet season, Bouteloua-derived C contributed 2 to 4% to total soil C (fig. 3a). By April 2005, this increased to 6 to 9%. There were no significant differences between the Lupinus and non-Lupinus addition treatments, but higher values tended to be seen with Lupinus addition. In the 7.5 to 15 cm layer, litter derived C accounted for about 2% of the total soil C, and no significant treatment differences occurred.
Litter-derived C was much higher in the microbial biomass, reaching 20 to 30% of the SMB-C in April 2003 (fig. 3b). However, these high contributions declined to 10 to 15% in April 2005. The lower layer showed comparable enrichments at that time.
Soil microbial community composition was strongly affected by Lupinus addition, based on an ordination of the PLFA profiles from the upper layer (0 to 7.5 cm) of the cylinders (table 3).

Impacts of Plant Community Composition on Soil Carbon Processes in Grasslands—Jackson
9
Based on the relative proportions of individual PLFA as a percentage of total PLFA, the relative abundance of bacteria was reduced with Lupinus addition. This holds for Gram+ and Gram- bacteria. Actinomycetes, when analyzed separately from other Gram+ bacteria, showed no differences among treatments. In contrast to bacterial PLFA, fungal PLFA increased in relative abundance in the Lupinus treatments. Soil ergosterol content, which serves as a fungal biomarker, confirmed the pattern observed from the PLFA profiles. Ergosterol content of the soil samples from the upper 0 – 7.5 cm ranged between 0.7 and 1.3 µg g-1 dry soil. Lupinus addition resulted in higher amounts of soil ergosterol regardless of litter type. For the 7.5 to 15 cm layer, ergosterol was found to be ~0.3 µg g-1 dry soil.
Figure 3. Litter derived C in the total soil organic carbon (a) and in the soil microbial biomass (b) as determined by analysis of natural abundance of 13C for the treatments with exchanged litter. For treatment abbreviations please refer to table 2. Statistical grouping by one way ANOVA for treatment using Tukey HSD for mean separation. Different letters indicate different statistical groupings (n=5). Mean ± standard deviation.
Determining shrub above- and belowground biomass and carbon content for hedgerows
Preliminary results showed that the canopy dimensions were highly correlated with above- and belowground biomass for coyote brush and ceanothus, but less so for belowground biomass for toyon. The selected mean quarter section was indeed 22-24% of the shrub, and showed a good correlation with total aboveground biomass for all species. Quarter-sections of shrubs thus may be considered representative of total shrub biomass, and thus would avoid killing the shrub for sampling purposes.

Impacts of Plant Community Composition on Soil Carbon Processes in Grasslands—Jackson
10
Table 2. Plant tissue harvested in 2005 (mean ± SE). C3Lit = N. pulchra plant encircled by cylinder with original site C3 plant litter left in place, C4Lit = original litter in encircled areas exchanged with B. gracilis litter (50 g), LupAdd = Addition of Lupinus plants by seeding 1400 L. bicolor seed m-2, NoLupAdd = No addition of Lupinus seed. * P≤ 0.05, * * P≤ 0.01, *** P≤ 0.001, ns P> 0.05 (ANOVA).
Plant Tissue Response Variable Lit Lup Lit*Lup C3Lit & NoLupAdd
C4Lit & NoLupAdd
C3Lit & LupAdd
C4Lit & LupAdd
biomass (g m-2) *** ns ns 79.5 ± 20.8 303.3 ± 22.4 156.4 ± 31.0 291.1 ± 23.1 µg P g-1 dry wt. * ns ns 813.4 ± 50.2 785.1 ± 26.4 836.1 ± 56.9 978.6 ± 32.3 µg C g-1 dry wt. * ns ns 400.9 ± 21.7 359.0 ± 19.2 427.9 ± 4.2 377.0 ± 27.5 µg N g-1 dry wt. ns ns ns 7.8 ± 0.6 8.5 ± 0.9 8.1 ± 0.8 9.7 ± 0.6 δ13C § n/a * n/a -28.8 ± 0.2 -22.1 ± 0.8 -29.4 ± 0.1 -24.9 ± 0.4
Recovered litter
δ15N ** ** ns 0.17 ± 0.26 1.4 ± 0.4 -0.85 ± 0.2 0.23 ± 0.25 biomass (g m-2) ns ns ns 105.4 ± 30.6 216.2 ± 42.0 165.8 ± 85.2 234.7 ± 59.0 µg P g-1 dry wt. * ns ns 1984.3 ± 96.2 1605.2 ± 62.5 1778.8 ± 95.3 1653.3 ± 156.5 µg C g-1 dry wt. ns ns * 416.8 ± 3.7 400.4 ± 11.6 396.0 ± 16.5 458.5 ± 27.1 µg N g-1 dry wt. ns ns ns 11.5 ± 1.6 10.0 ± 0.8 10.2 ± 1.1 11.7 ± 2.2 δ13C ns * ns -27.3 ± 0.4 -27.5 ± 0.2 -27.9 ± 0.2 -28.1 ± 0.2
Nassella
δ15N ns ns ns 1.16 ± 0.2 0.36 ± 0.53 0.56 ± 0.42 1.1 ± 0.6 biomass (g m-2) ns ns ns 155.8 ± 38.5 114.3 ± 10.5 155.6 ± 16.5 139.1 ± 24.8 µg P g-1 dry wt. ns ns ns 3539.6 ± 179.7 3989.2 ± 190.3 3627.2 ± 205.5 3630.2 ± 260.0 µg C g-1 dry wt. ns ns ns 416.0 ± 6.3 398.3 ± 3.0 408.6 ± 3.6 402.3 ± 14.2 µg N g-1 dry wt. ns ns ns 9.57 ± 1.2 10.6 ± 0.4 9.47 ± 0.6 11.0 ± 0.7 δ13C § ns ns ns -29.62 ± 0.26 -29.6 ± 0.1 -30.0 ± 0.1 -29.5 ± 0.2
Standing biomass of annual plants
δ15N ns ns ns 1.1 ± 0.5 2.0 ± 0.2 1.5 ± 0.2 1.6 ± 0.3

Impacts of Plant Community Composition on Soil Carbon Processes in Grasslands—Jackson
11
Table 3. Total PLFA and PLFA purportedly associated with bacteria, fungi, or from unspecific origin (refer to Table 2 for abbreviations). Bacterial PLFA are separated as actinomycetes, Gram+, and Gram-. Actinomycetes are listed apart from other Gram+ bacteria. PLFA with frequencies less than 10% in all samples are not listed. Shown are the relative proportions of PLFA from specific groups (rel.) is given in % of total PLFA. * P≤ 0.05, * * P≤ 0.01, *** P≤ 0.001, ns P> 0.05 for the ANOVA. Treatment Means
Depth (cm)
Treatment Total PLFA abs
all bacteria1
rel. % actinomycetes2
rel.% Gram+3
rel. % Gram-4
rel. % fungi5
rel. % unspecific6
rel. %
0 – 7.5 C3Lit & NoLupAdd 30.98 44.35 5.15 21.65 15.79 20.03 35.63 C4Lit & NoLupAdd 28.23 43.72 5.34 21.79 15.16 19.77 36.50 C3Lit & LupAdd 44.44 39.58 5.26 18.71 13.96 23.58 36.84 C4Lit & LupAdd 41.44 38.09 5.09 17.49 14.15 22.95 38.97
7.5 - 15 C3Lit & NoLupAdd 13.78 43.23 6.35 23.29 13.09 18.89 37.88 C4Lit & NoLupAdd 13.04 43.12 6.49 22.67 13.08 17.57 39.31 C3Lit & LupAdd 13.83 42.23 7.17 21.21 13.02 17.21 40.56 C4Lit & LupAdd 9.20 44.46 7.34 23.64 12.65 17.13 38.41
ANOVA significance levels Depth (cm)
Factor Total PLFA abs
all bacteria1
rel. % actinomycetes2
rel.% Gram+3
rel. % Gram-4
rel. % fungi5
rel. % unspecific6
rel.% 0 – 7.5 Lit ns ns ns ns ns ns *** Lup ns *** ns *** *** ** *** Lit*Lup ns ns ns ns ns ns * 7.5-15 Lit ns ns ns ns ns ns ns Lup ns ns ** ns ns ns ns Lit*Lup ns ns ns ns ns ns * 1: sum of PLFA listed as actinomycetes, Gram+ and Gram- + i15:1 (Federle, 1986; Zelles, 1997; Bossio and Scow, 1998) 2: sum of i17:1, 10Me16:0, 10Me17:0, and 10Me18:0 (Kroppenstedt, 1985; O'Leary and Wilkinson, 1988; Vestal and White, 1989) 3: Gram+ bacteria excluding acinomycetes; sum of 12:1, i14:0, a16:0, i15:0, a15:0, i16:0, i17:0, a17:0 (Federle, 1986; Zelles, 1997) 4: sum of 16:1ω7t, 16:1ω7c, 17:1ω9c, cy17:0, and cy19:0 (Federle, 1986; O'Leary and Wilkinson, 1988; Zelles, 1997) 5: sum of 16:1ω5c, 18:3ω6, 9,12c, 18:2ω6,9c, 18:1ω9c (Federle, 1986; O'Leary and Wilkinson, 1988; Vestal and White, 1989; Olsson et al., 1995; Zelles, 1997) 6: sum of unspecific PLFAs 12:0, 13:0 3OH, 14:0, 14:0 3OH, 15:0, 15:0 3OH, 16:0, 17:0, i17:1ω5c, 16: 2OH, 16:1ω11c, 18:0, cy19:0ω10c, 20:2ω6,9c, 20:0.

Impacts of Plant Community Composition on Soil Carbon Processes in Grasslands—Jackson
12
Discussion
Soil CO2 and CO2 emission in grasslands with different management histories
Restoration of perennial grass communities in coarse-textured soil in coastal California areas may have very small effects on CO2 emissions, compared to old-field annual grasslands. Tilled bare soil, however, had significantly lower emissions than the grasslands. We did not observe consistent differences in CO2 emission between the annual and perennial grassland types. This supports previous evidence from this site that perennial and annual grasslands have generally similar root depth and activity, with slightly greater root biomass and root length in the 0-15 cm layer for annual grasslands than perennial grasslands, but at all other depths the root biomass and length of the two grassland types were similar (Potthoff et al. 2005). Roots of perennials may not have grown deeper than annuals at this site due to the young age of the plants or to a lack of a deep layer of stored moisture in this sandy loam soil.
Soil moisture is often positively related to CO2 production. In contrast, this study found no discernible relationship between soil moisture and CO2 emission, unless the results were stratified over fairly short periods within the growing season (which was done in this study by separating the data out into the three data sets: early March, late March, and late spring (April through June). These results suggest that the relationship between soil moisture and CO2 emission appears to be strongly dependent on the timing within the growing season. The seasonality of response suggests that plant growth and activity plays a major role in CO2 emission, either directly via root respiration, or by stimulating soil microbial activity.
Field microcosms with perennial bunchgrasses and additions of litter and lupines
By adding high C:N litter, the perennial bunchgrass, Nassella pulchra, tended to have increased biomass, but instead of increasing soil C pools, this treatment decreased the SMB-C. The most likely explanation is that the dense layer of Bouteloua litter suppressed the growth of non-native annuals and thus competition with the bunchgrass, but the Bouteloua litter did not support an increase in soil activity or C sequestration. A gradual release of C from the high C:N Bouteloua litter did occur, accounting for 10-15% of the SMB-C two years after it was added. Even so, only a small amount of the total soil C was derived from the C4 litter after two years.
Lupinus addition did not affect the biomass of Nassella pulchra in 2005, but it did have major effects on SMB-C and especially fungi, since these effects were detectable two years after the large population of Lupinus occurred in 2003. Other legumes are known to increase the soil fungi (Appuhn and Joergensen 2006).
Based on these results, neither sowing native lupines nor adding high C:N litter resulted in both higher native bunchgrass biomass and soil C pools during this time frame. While the potential may exist for Lupinus additions over the long-term to contribute to higher soil C sequestration, the native perennial bunchgrass may not show much increase. Non-native grasses may also benefit from the increased N availability, thus increasing their competition with the perennial native species. Thus, there are tradeoffs associated with managing for plant biodiversity and C sequestration simultaneously in this situation.

Impacts of Plant Community Composition on Soil Carbon Processes in Grasslands—Jackson
13
Determining shrub above- and belowground biomass and carbon content for hedgerows
With the increasing focus on global warming and C sequestration, methods to estimate plant C content will be necessary to quantify the above- and belowground contribution of perennial plants. Many of the hedgerow shrubs used in restoration of field margins and riparian corridors on California farms are native to chapparal communities of upland areas. This work in progress will provide a set of easy-to-measure attributes that can be used for this purpose without destructive sampling that would destroy the shrub.
References Appuhn, A., and R.G. Joergensen. 2006. Microbial colonisation of roots as a function of plant
species. Soil Biology and Biochemistry 38 :1040-1051.
Bossio, D.A., and K.M. Scow. 1998. Impacts of carbon and flooding on soil microbial communities: Phospholipid fatty acid profiles and substrate utilization patterns. Microbial Ecology 35 :265-278.
Djajakirana, G., R.G. Joergensen, B. Meyer. 1996. Ergosterol and microbial biomass relationships in soil. Biology and Fertility of Soils 22 :299-304.
Federle, T.W. 1986. Microbial distribution in soil. In: Perspectives in Microbial Ecology, eds. F. Megusar and M. Gantar, 493-498. Slovene Society for Microbiology.
Jackson, L.E., M. Potthoff, K.L. Steenwerth, A.T. O’Geen, M.R. Stromberg, and K.M. Scow. 2007. Soil biology and carbon sequestration. Chapter 9. In: Ecology and Management of California Grasslands, eds. Corbin, J., C. D’Antonio, and M.R. Stromberg, 107-118. University of California Press.
Joergensen, R.G. 1996. The fumigation extraction method to estimate soil microbial biomass: calibration of the kEC-factor. Soil Biology and Biochemistry 28: 25-31.
Kroppenstedt, R.M. 1985. Fatty acid and menaquinone analysis of actinomycetes and related organisms. In: Chemical Methods in Bacterial Systematics, eds. M. Goodfellow and D.E. Minnikin, 173-199. Academic Press.
O’Leary, W.M., and S.G. Wilkinson. 1988. Gram-positive bacteria. In: Microbial Lipids, eds. C. Ratledge and S.G. Wilkinson, 117-201. London: Academic Press.
Olsson, P.A., E. Bååth, I. Jacobsen, B. Söderström. 1995. The use of phospholipid and neutral lipid fatty acids to estimate biomass of arbuscular mycorrhizal fungi in soil. Mycological Research 99 :623-629.
Potthoff, M., N. Loftfield, F. Buegger, B. Wick, B. John, R.G. Joergensen, and H. Flessa. 2003. The determination of d13C in soil microbial biomass using fumigation-extraction. Soil Biology and Biochemistry 35 :947-954.
Potthoff, M., L.E. Jackson, K.L. Steenwerth, I. Ramirez, M.R. Stromberg, and D.E. Rolston. 2005. Soil biological and chemical properties in restored perennial grassland in California. Restoration Ecology 13 :61-73.

Impacts of Plant Community Composition on Soil Carbon Processes in Grasslands—Jackson
14
Potthoff, M., L.E. Jackson, K. Steenwerth, R. Drenovsky, K.M. Scow and R.G. Joergensen. 2006. Soil microbial community composition as affected by restoration practices in California grassland. Soil Biology and Biochemistry 38 :1851-1860.
Rolston, D.E. 1986. Gas flux. In: Methods of Soil Analysis. Part 1. Physical and Mineralogical Methods. 2nd edition. Agronomy Monographs 9, ed. A. Klute, 1103-1119. ASA and SSSA.
Steenwerth, K.L., L.E. Jackson, F.J. Calderón, M.R. Stromberg, and K.M. Scow. 2003. Soil microbial community composition and land use history in cultivated and grassland ecosystems of Coastal California. Soil Biology and Biochemistry 35 :489-500.
Vance, E.D., P.C. Brookes, and D.S. Jenkinson. 1987. An extraction method for measuring soil microbial biomass C. Soil Biology and Biochemistry 19 :703-707.
Vestal, R.D., and D.C. White. 1989. Lipid analysis in microbial ecology: quantitative approaches to the study of microbial communities. Bioscience 39 :535-541.
Wu, J., R.G. Joergensen, B. Pommerening, R. Chaussod, and P.C. Brookes. 1990. Measurement of soil microbial biomass C by fumigation-extraction - an automated procedure. Soil Biology and Biochemistry 22 :1167-1169.
Zelles, L. 1997. Phospholipid fatty acid profiles in selected members of soil microbial communities. Chemosphere 35 :275-294.
This research was funded by the Kearney Foundation of Soil Science: Soil Carbon and California's Terrestrial Ecosystems, 2001-2006 Mission (http://kearney.ucdavis.edu). The Kearney Foundation is an endowed research program created to encourage and support research in the fields of soil, plant nutrition, and water science within the Division of Agriculture and Natural Resources of the University of California.


