Embed Size (px)
Citation preview

Atmos. Meas. Tech., 8, 965–985, 2015
www.atmos-meas-tech.net/8/965/2015/
doi:10.5194/amt-8-965-2015
© Author(s) 2015. CC Attribution 3.0 License.
Impacts of updated spectroscopy on thermal infrared retrievals of
methane evaluated with HIPPO data
M. J. Alvarado1, V. H. Payne2, K. E. Cady-Pereira1, J. D. Hegarty1, S. S. Kulawik3, K. J. Wecht4, J. R. Worden2,
J. V. Pittman5, and S. C. Wofsy5
1Atmospheric and Environmental Research, Lexington, MA, USA2Jet Propulsion Laboratory, California Institute of Technology, Pasadena, CA, USA3Bay Area Environmental Research Institute, Mountain View, CA, USA4School of Engineering and Applied Science, Harvard University, Cambridge, MA, USA5Department of Earth and Planetary Sciences, Harvard University, Cambridge, MA, USA
Correspondence to: M. J. Alvarado ([email protected])
Received: 12 August 2014 – Published in Atmos. Meas. Tech. Discuss.: 29 September 2014
Revised: 29 January 2015 – Accepted: 3 February 2015 – Published: 27 February 2015
Abstract. Errors in the spectroscopic parameters used in the
forward radiative transfer model can introduce spatially, tem-
porally, and altitude-dependent biases in trace gas retrievals.
For well-mixed trace gases such as methane, where the vari-
ability of tropospheric mixing ratios is relatively small, re-
ducing such biases is particularly important. We use aircraft
observations from all five missions of the HIAPER Pole-to-
Pole Observations (HIPPO) of the Carbon Cycle and Green-
house Gases Study to evaluate the impact of updates to spec-
troscopic parameters for methane (CH4), water vapor (H2O),
and nitrous oxide (N2O) on thermal infrared retrievals of
methane from the NASA Aura Tropospheric Emission Spec-
trometer (TES). We find that updates to the spectroscopic
parameters for CH4 result in a substantially smaller mean
bias in the retrieved CH4 when compared with HIPPO ob-
servations. After an N2O-based correction, the bias in TES
methane upper tropospheric representative values for mea-
surements between 50◦ S and 50◦ N decreases from 56.9 to
25.7 ppbv, while the bias in the lower tropospheric represen-
tative value increases only slightly (from 27.3 to 28.4 ppbv).
For retrievals with less than 1.6 degrees of freedom for signal
(DOFS), the bias is reduced from 26.8 to 4.8 ppbv. We also
find that updates to the spectroscopic parameters for N2O re-
duce the errors in the retrieved N2O profile.
1 Introduction
Methane (CH4) is an important greenhouse gas (GHG), a
critical component of the Earth’s carbon cycle, and a source
of background tropospheric O3 (Ciais et al., 2013; Myhre et
al., 2013). Globally averaged surface concentrations of CH4
have risen from 722± 25 ppb in 1750 to 1803± 2 ppb by
2011 (Myhre et al., 2013), primarily due to increased an-
thropogenic emissions of CH4. While CH4 concentrations
appeared to stabilize in 1999 (Rigby et al., 2008), they be-
gan increasing again in 2007 (Dlugokencky et al., 2011) and
the sources of this renewed increase are not yet clear. Cut-
ting anthropogenic CH4 emissions has been identified as one
of the most efficient methods to mitigate the radiative forc-
ing of GHGs on decadal time scales due to the strong warm-
ing potential of CH4 (86 times higher than CO2 on a 20-year
time horizon, Myhre et al., 2013) and the relatively short life-
time of CH4 in the atmosphere (9.14 years±10 %, Ciais et
al., 2013). Quantifying the anthropogenic and natural emis-
sions of CH4 is thus essential to determining CH4 emission
reduction targets and verifying that these targets have been
met. Atmospheric observations can provide “top-down” con-
straints to improve the bottom-up CH4 emission inventories
(Weiss and Prinn, 2011). Satellite observations can provide
global, spatially and temporally dense data covering many
years, and are therefore extremely valuable to these top-
down studies. Methane retrievals from measurements of so-
lar backscatter in the shortwave infrared (SWIR) have been
used to provide data on the spatial distribution of CH4 (e.g.,
Published by Copernicus Publications on behalf of the European Geosciences Union.

966 M. J. Alvarado et al.: Impacts of updated spectroscopy on thermal infrared retrievals of methane
Bergamaschi et al., 2007, 2009; Frankenberg et al., 2011;
Meirink et al., 2008). The SWIR retrievals are sensitive to
the entire tropospheric column but their dependence on re-
flected sunlight precludes observations at night, over most
ocean surfaces, and over most cloudy targets. Measurements
of terrestrial radiation in the thermal infrared (TIR) have also
been utilized to study the emissions and transport of CH4
(e.g., Worden et al., 2013a, b; Crevoisier et al., 2009, 2013;
Massart et al., 2014; Razavi et al., 2009; Xiong et al., 2008,
2009, 2010). TIR retrievals have limited sensitivity to the
lower troposphere but can be performed day and night, over
land and ocean, and for partly cloudy scenes. In recent years,
there has been interest in utilization of TIR measurements to-
gether with SWIR measurements in order to separate bound-
ary layer and free tropospheric contributions to the methane
columns (Herbin et al., 2013). Minimizing retrieval biases in
both the TIR and SWIR retrievals are a critical factor in the
success of these efforts.
The Tropospheric Emission Spectrometer (TES), flying
on the Aura satellite, measures TIR radiances, including
the 8 µm CH4 region. The high spectral resolution of the
TES instrument (0.06 cm−1) allows it to separate the sig-
nals from interfering species more easily than other satellite-
based nadir TIR sounders, and TES can therefore provide ad-
ditional insight into retrieval biases from these instruments.
In this paper, we evaluate the impact of recent updates to
the spectroscopic parameters in Version 6 (V006) of the TES
retrieval products on the retrieved profile of CH4. In ad-
dition, we evaluate the impact of proposed updates to the
N2O spectroscopic parameters in the forward model of the
TES retrieval algorithm on the retrieved CH4. We perform
these validations using the extensive set of vertical profiles
of CH4 measured from aircraft by the five campaigns of the
HIAPER Pole-to-Pole Observations (HIPPO) of Carbon Cy-
cle and Greenhouse Gases Study over the Pacific (Wofsy et
al., 2011). This evaluation follows the methods of Wecht et
al. (2012), but differs from that previous study in the follow-
ing ways: (a) we are evaluating the performance of the up-
coming TES Version 6 products, whereas Wecht et al. (2012)
evaluated the TES Version 4 and 5 products; (b) we use all
five HIPPO campaigns, whereas Wecht et al. (2012) only had
access to data from the first two HIPPO campaigns; (c) we
examine the spectral residuals as part of the evaluation. We
characterize the errors in individual profiles and the mean
biases, and the variability of these mean biases with lati-
tude and height. We also illustrate the impact of two post-
retrieval bias-correction algorithms on the TES CH4 prod-
ucts: the N2O-based correction of Worden et al. (2012) and a
global bias correction based on the results of this validation
study.
Section 2 describes the TES and HIPPO measurements.
Section 3 describes the TES CH4 retrieval algorithm, includ-
ing the changes to spectroscopic parameters. This section
also describes updates to the a priori profiles for the version
being evaluated in this study, although these are shown to
have a minor impact on the retrieval results. Section 4 de-
scribes the methodology of our validation study. Sections 5
and 6 present the results for TES Version 6 and the proposed
updates to the N2O spectroscopic parameters, respectively.
2 Data
2.1 TES
TES is a nadir-viewing Fourier-transform infrared (FTIR)
spectrometer aboard the NASA Aura spacecraft (Beer et al.,
2001). Aura is in a sun-synchronous orbit that repeats every
16 days with daytime and nighttime overpasses at 13:30 and
01:30 (mean local solar time). TES Global Survey observa-
tions are about 180 km apart along the orbit track, while spe-
cial observation modes, such as Step & Stare and Transect,
can be used for increased spatial sampling (generally 45 and
12 km, respectively) over specific regions. TES’s high spec-
tral resolution (0.06 cm−1), spatial resolution (5×8 km2), and
radiometric stability (Connor et al., 2011) provide the ca-
pacity to measure atmospheric concentrations of many gas
species, including O3 (Worden et al., 2007; Nassar et al.,
2008), CO (Rinsland et al., 2006; Luo et al., 2007), CH4
(Worden et al., 2012, 2013a, b; Wecht et al., 2012), CO2
(Kulawik et al., 2010, 2013), HDO (Worden et al., 2012),
NH3 (Shephard et al., 2011; Zhu et al., 2013; Pinder et al.,
2011), CH3OH (Cady-Pereira et al., 2012; Wells et al., 2012),
HCOOH (Cady-Pereira et al., 2014), OCS (Kuai et al., 2014),
and PAN (Alvarado et al., 2011; Payne et al., 2014).
2.2 HIPPO
Measurements from the HIPPO aircraft campaigns provide
an excellent data set for satellite validation, due to the large
number of measurements, the extensive latitudinal coverage,
and the vertical extent of the profiles (up to 14 km for some
cases). Figure 1 shows the flight paths of the NSF’s Gulf-
stream V (GV) during the five HIPPO missions (HIPPO I
in January 2009; HIPPO II in October–November 2009;
HIPPO III in March–April 2010; HIPPO IV in June–
July 2011; and HIPPO V in August–September 2011). The
GV transected the Pacific Ocean from 87◦ N to 67◦ S, per-
forming vertical profiles every ∼ 220 km or 20 min (Wofsy
et al., 2011, 2012). CH4 was measured with a quantum cas-
cade laser spectrometer (QCLS) at 1 Hz frequency with ac-
curacy of 1.0 ppb and precision of 0.5 ppb (Kort et al., 2011).
HIPPO CH4 data are reported on the NOAA calibration scale
and have been used in several other studies to evaluate satel-
lite retrievals of CH4 (e.g., Wecht et al., 2012; Crevoisier
et al., 2013; Massart et al., 2014). Comparisons with flask
data from the NOAA Whole Air Sampler (NWAS) showed a
mean positive bias of 0.85 ppb for the QCLS measurements
against the NOAA flask data during the HIPPO campaigns,
which is consistent with the estimated QCLS accuracy of
1.0 ppb (Santoni et al., 2014).
Atmos. Meas. Tech., 8, 965–985, 2015 www.atmos-meas-tech.net/8/965/2015/

M. J. Alvarado et al.: Impacts of updated spectroscopy on thermal infrared retrievals of methane 967
Figure 1. Flight tracks for HIPPO campaigns I through V.
3 TES CH4 retrieval algorithm
TES retrievals of trace gas profiles are based on an op-
timal estimation approach (with a priori constraints, e.g.,
Rodgers, 2000; Bowman et al., 2006) that minimizes the
differences between the TES Level 1B spectral radiances L
and a radiative transfer calculation that uses absorption co-
efficients calculated with the line-by-line radiative transfer
model LBLRTM (Clough et al., 2005, 2006). That is, the al-
gorithm solves for the state vector x that minimizes the cost
function:
J = [L−F(x)]−T S−1m [L−F(x)]+ [x−xa]T S−1
a [x−xa],
(1)
where F(x) is the non-linear radiative transfer calculation
(also called the “forward model”) that relates the state vector
to the calculated radiances, Sm is the covariance of the mea-
surement noise, xa is the a priori value of the state vector,
and S−1a is the “constraint matrix”, generally the inverse of
the covariance of a prior climatology of x.
The CH4 retrieval algorithm for TES Version 5 is de-
scribed in detail in Worden et al. (2012), and the same basic
approach is used in TES Version 6. In this approach, joint es-
timates of H2O, HDO, CH4, and N2O are retrieved simulta-
neously from TES radiances covering the spectral region be-
tween 1100 and 1330 cm−1 with the exception of a 10 cm−1
wide region centered at 1280 and a 2 cm−1 wide region cen-
tered at 1308 cm−1, which contain a strong CFC absorption
feature and the CH4 Q branch, respectively. The state vector
for the joint estimate is
x =
xH2O
xHDO
xCH4
xN2O
Tsurf
Pcloud
τcloud
=M
zH2O
zHDO
zCH4
zN2O
Tsurf
Pcloud
τcloud
, (2)
where the column vectors xi are the natural logarithms of
the volume mixing ratios (VMRs) of the various retrieved
species on the 67 level pressure grid from 1000 to 0.1 hPa
used in the TES forward model. Updated estimates of surface
temperature (Tsurf), cloud pressure (Pcloud), and cloud effec-
tive optical depth (τcloud) are also retrieved. The atmospheric
species are actually retrieved on subsets of this grid (the lev-
els of the vectors z in Eq. 2), related to the forward model
grid by the mapping matrix M, but for the sake of brevity we
exclude this mapping in subsequent equations.
The retrieved CH4 profile xCH4is related to the true profile
xCH4by the equation (Worden et al., 2012):
xCH4= xaCH4
+Acc
(xCH4
− xaCH4
)+Acn
(xN2O− xaN2O
)+Acj
(xj − xaj
)+GcKb
(b− ba
)+Gcn,
(3)
www.atmos-meas-tech.net/8/965/2015/ Atmos. Meas. Tech., 8, 965–985, 2015
968 M. J. Alvarado et al.: Impacts of updated spectroscopy on thermal infrared retrievals of methane
where Acc is the averaging kernel matrix describing the sen-
sitivity of the retrieved CH4 profile to the true state: Acc =∂xCH4
∂xCH4. Acn and Acj are the sensitivity of xCH4
to the jointly
retrieved N2O profile and all other jointly retrieved parame-
ters, respectively. Kb =∂L∂b
is the partial-derivative (i.e., Ja-
cobian) matrix of the sensitivity of the radiances to unre-
trieved model parameters b. The vector n is the noise in the
radiance measurement as a function of wavelength, while Gc
is the gain matrix, or the sensitivity of xCH4to the radiance:
Gc =∂xCH4
∂L=
(KTc S−1
m Kc+S−1a
)−1
KTc S−1
m , (4)
where Kc =∂L
∂xCH4is the sensitivity of the radiances to
changes in the true state of CH4, and S−1a is the CH4 con-
straint matrix, which is derived as the inverse of the covari-
ance of a set of CH4 profiles from version 4 of the Whole
Atmosphere Community Climate Model (WACCM, Marsh
et al., 2013), modified based on knowledge gained from in
situ and satellite observations (Kulawik et al., 2006; Worden
et al., 2011, 2012).
The raw retrieved CH4 profile from TES (xCH4) can have
a significant positive bias due to errors in unretrieved model
parameters (b) such as the temperature profile, surface emis-
sivity, and spectroscopic parameters. Worden et al. (2012)
assumed that (1) errors that affect the retrieved profile of
N2O will have a similar effect on CH4 and that (2) all devia-
tions of the retrieved N2O from the a priori profile are due to
systematic errors (e.g., errors in the temperature profile, sur-
face temperature, clouds, and surface emissivity). Thus the
retrieved N2O profile is used to adjust the CH4 profile via the
equation:
xadj
CH4= xCH4
− xN2O+ xaN2O. (5)
The idea of this N2O correction is similar to the use of
CO2 in “proxy” retrievals of CH4 from SWIR measurements
(Frankenberg et al., 2005). The N2O-corrected CH4 profile
xadj
CH4is then related to the true profile by the following equa-
tion (Worden et al., 2012):
xadj
CH4= xaCH4
+ (Acc−Anc)(xCH4
− xaCH4
)−(Ann−Acn)
(xN2O− xaN2O
)+(Acj−Anj
)(xj − xaj
)+GRKb
(b− ba
)+GRn,
(6)
where GR is the gain matrix for xCH4minus the gain ma-
trix for xN2O(GR =Gc−Gn), Ann is the averaging kernel
for N2O, Anj is the sensitivity of the retrieved N2O to all
other jointly retrieved parameters, and Anc is the sensitivity
of the retrieved N2O to the retrieved CH4. Note that the cross-
averaging kernels are small relative to the averaging kernels
for N2O and CH4 (Anc� Acc and Acn� Ann), and so these
cross-averaging kernels can be neglected.
Comparisons of Version 5 of the TES CH4 product with
HIPPO showed a remaining positive bias that was generally
constant with latitude (Wecht et al., 2012), and we find that
the same is true in TES Version 6 (see Sect. 5.3). Thus a sec-
ond, global correction is applied to the TES retrieved CH4:
xcorCH4= x
adj
CH4−Accq, (7)
where each element of q is set to 0.015, which generally min-
imizes the bias in the lower-tropospheric representative value
for CH4 (see Sect. 5.4).
3.1 Spectroscopic updates
The accuracy of the radiative transfer model F(x) in Eq. (1)
depends on the accuracy of the spectroscopic line parameters
and continua for the various gas-phase species used to cal-
culate the molecular absorption coefficients. Thus improve-
ments in these spectroscopic parameters should lead to im-
provements in the retrieved profiles of various species, all
other things being equal. Table 1 summarizes the spectro-
scopic parameters evaluated in this study. In going from TES
Version 5 to TES Version 6, the spectroscopic parameters
for H2O, CO2, and CH4 were substantially updated based
on recent evaluations of the spectroscopic parameters used
in LBLRTM with ground-based and satellite radiance data
(e.g., Shephard et al., 2009; Mlawer et al., 2012; Alvarado et
al., 2013).
In TES Version 5, the CH4 spectroscopic parameters were
taken from HITRAN 2004 (Rothman et al., 2005). For Ver-
sion 6, the CH4 parameters were taken from HITRAN 2008
(Rothman et al., 2009) with first-order line coupling pa-
rameters calculated for the ν4 (∼ 1311 cm−1) and ν3 (∼
3019 cm−1) bands of CH4 with the method and relaxation
matrices of Tran et al. (2006), as in LBLRTM v12.1. Al-
varado et al. (2013) found that these updated CH4 line cou-
pling parameters reduced the positive bias in CH4 retrievals
from IASI (Infrared Atmospheric Sounding Interferometer),
but that significant spectral residuals remained, most likely
due to remaining errors in the CH4 spectroscopy. Further-
more, they found that including the line coupling parame-
ters for CH4 had little impact on the retrieved CH4 profile or
the mean spectroscopic residuals in the spectral range used
by the retrieval (1292–1305 cm−1), although there was some
improvement in the residuals in the ν4 Q-branch between
1305 and 1310 cm−1.
In TES Version 5, the spectroscopic parameters for H2O
came from HITRAN 2004 (Rothman et al., 2005), including
the 2006 updates. For Version 6, the H2O parameters were
updated to HITRAN 2008, with the exception that the line
positions and intensities in the range 10–2500 cm−1 were
taken from Coudert et al. (2008), as in LBLRTM v12.1.
Shephard et al. (2009) and Alvarado et al. (2013) showed that
this combination of parameters is more consistent across the
H2O ν2 band than the HITRAN 2008 parameters alone, and
that the Coudert et al. (2008) parameters lead to a ∼ 10 %
Atmos. Meas. Tech., 8, 965–985, 2015 www.atmos-meas-tech.net/8/965/2015/

M. J. Alvarado et al.: Impacts of updated spectroscopy on thermal infrared retrievals of methane 969
Table 1. Sources of spectroscopic line parameters used in this study.
Species TES Version 5 TES Version 6 Experimental version
CH4 HITRAN 2004a HITRAN 2008b HITRAN 2008b
with line mixingc with line mixingc
H2O HITRAN 2004a HITRAN 2008b HITRAN 2008b
with 2006 updates + Coudert et al. (2008) + Coudert et al. (2008)
CO2 Niro et al. (2005)d Lamouroux et al. (2010)d Lamouroux et al. (2010)d
N2O HITRAN 2000e HITRAN 2000e HITRAN 2008b
a Rothman et al. (2005); b Rothman et al. (2009); c Tran et al. (2006); d Includes P-, Q-, and R-branch line mixing
parameters; e Rothman et al. (2003)
reduction in the upper tropospheric H2O mixing ratio re-
trieved from IASI. Both versions used v2.4 of the MT_CKD
self and foreign water vapor continua (Mlawer et al., 2012),
as this version performs better than MT_CKD v2.5 in the CO
fundamental band (Alvarado et al., 2013).
For CO2, the differences between the two sets of line pa-
rameters used in TES Version 5 and Version 6 are negligible
in the regions used for CH4 retrieval. However, since the CO2
line parameters can affect the temperature retrieval, and the
CH4 retrieval step uses the retrieved temperature, we include
this information for completeness. For CO2, TES Version 5
used the line parameters of Niro et al. (2005), including first-
order line coupling parameters for the P, Q, and R branches
of the CO2 bands. In TES Version 6, these are updated to the
parameters of Lamouroux et al. (2010), which are based on
the HITRAN 2008 line parameters and also include P-,Q-,
and R-branch line coupling parameters. Both versions used
the CO2 foreign continuum from MT_CKD v2.5 (Mlawer et
al., 2012). Validations tests against radiosonde data showed
little difference in the mean temperature profiles retrieved us-
ing the two sets of CO2 and H2O spectroscopy (B. Herman,
personal communication, 16 October 2013).
In addition to the updates to CH4, H2O, and CO2 made
in TES Version 6, we also evaluate the impact of updates to
the spectroscopic parameters of N2O that may be included
in future TES versions. In both TES Version 5 and 6, the
N2O line parameters are based on HITRAN 2000 (Rothman
et al., 2003). Here we test the impact of updating these to
the HITRAN 2008 parameters (Rothman et al., 2009), which
include the almost complete revision of the N2O line list per-
formed for HITRAN 2004 (Rothman et al., 2005).
3.2 A priori profile updates
In the optimal estimation approach, the retrieved profile of
CH4 depends on the a priori estimate of the profiles of CH4,
of the co-retrieved trace gases (through xaN2O and xaj in Eq. 6)
and of the a priori estimates of the profiles of temperature and
other trace gases (through ba in Eq. 6). The a priori estimates
of temperature, H2O, N2O, CH4, and O3 were changed be-
tween Version 5 and Version 6 of the TES products. These
updates are described below.
The TES a priori profiles of temperature and H2O, as
well as the estimates of surface temperature and pressure,
come from the NASA Global Modeling and Assimilation Of-
fice (GMAO) Goddard Earth Observing System Model, Ver-
sion 5 (GEOS-5, Rienecker et al., 2008). TES Version 5 prod-
ucts used data from version v5.2 of the GEOS-5 model as a
priori values, while TES Version 6 uses v5.9.1.
The TES Version 5 N2O a priori profiles used a monthly
mean climatology every 30◦ latitude and 60◦ longitude based
on the Model for OZone and Related chemical Tracers
(MOZART)-2 chemistry-transport model (CTM) (Brasseur
et al., 1998; Park et al., 2004). A yearly increase of 0.22 %
was applied based on the trends in surface flask measure-
ments from the NOAA Earth System Research Laboratory
(ESRL) Global Monitoring Division (GMD). TES Version 6
uses an updated monthly mean N2O climatology from the
Specified Dynamics version of WACCM-4 (Marsh et al.,
2013), in which the horizontal winds and temperatures are re-
laxed to the GEOS-5 meteorological fields in the troposphere
and stratosphere. The horizontal resolution with latitude was
increased from 30 to 1◦. The simulation was done for 2004
through 2010 by Doug Kinneson (UCAR); the a priori pro-
files for years after 2010 were based on the 2010 data.
The CH4 climatology used for the TES Version 5 a pri-
ori consisted of monthly average fields in 10◦ latitude bins
from the same MOZART run as was used for N2O above.
This previous climatology accounted for seasonal cycles, but
the CH4 values for a given month were static from one year
to the next. Measurements from the NOAA Global Cooper-
ative Air Sampling Network have shown that from 1999 to
2006, globally averaged CH4 was relatively constant. How-
ever, 2007 marked a return to a positive CH4 growth rate
(Dlugokencky et al., 2011). The TES Version 6 CH4 clima-
tology was updated in order to account for the post-2007
CH4 growth rate using surface flask measurements from the
NOAA ESRL GMD. At the time when the work on the TES
CH4 climatology update was underway, monthly mean data
were available up to the end of 2010. The flask data was
www.atmos-meas-tech.net/8/965/2015/ Atmos. Meas. Tech., 8, 965–985, 2015

970 M. J. Alvarado et al.: Impacts of updated spectroscopy on thermal infrared retrievals of methane
binned into 10◦ latitude bands and an average, globally uni-
form increase for each year since 2004, relative to 2004, was
calculated. For the years 2011 to 2014, the growth rate was
extrapolated from the approximately linear growth rate ob-
served from 2008 to 2010 inclusive.
There were also updates to the O3 climatology for TES
Version 6. The impact of the O3 climatology update on the
CH4 retrievals is not expected to be significant, but could
have some impact via the temperature retrievals, since there
are O3 lines in the CO2 region used for the temperature
retrievals. For TES Version 5, the O3 a priori climatol-
ogy was based on MOZART-3, which extended the earlier
MOZART-2 tropospheric chemistry model into the strato-
sphere and mesosphere (surface – 0.001 hPa). The climatol-
ogy had unrealistically strong vertical gradients in ozone, and
thus higher-than-observed ozone abundances, in the extrat-
ropical upper troposphere lower stratosphere (UTLS) region.
The ozone climatology for the TES Version 6 O3 a priori
was generated by merging the climatological monthly mean
tropospheric/lower stratospheric ozone field from a 1997–
2004 simulation from the MOZART-4 CTM (Emmons et al.,
2010), which extends from the surface to 0.2 hPa, with the
climatological monthly mean stratospheric and mesospheric
ozone field from a 2005–2010 simulation from the Specified
Dynamics version of WACCM. This revised O3 climatology
agrees better with Microwave Limb Sounder (MLS) obser-
vations of the O3 climatology in the UTLS.
4 TES CH4 validation methodology
Our validation approach is based on that used by Wecht et
al. (2012) to evaluate CH4 retrievals from TES V004 and
V005 with data from the HIPPO I and II campaigns, and is
described in detail below.
4.1 Coincidence criteria
One of the key issues in comparing satellite retrievals of trace
gases with aircraft profiles is sampling: the aircraft gener-
ally does not sample the atmosphere in the exact time and
place as the satellite observations. Thus to compare the TES
and HIPPO CH4 profiles we must choose appropriate co-
incidence criteria in space and time. Wecht et al. (2012)
found that collocation error between TES Version 4 and 5
and HIPPO CH4 profiles was not significant on scales up to
750 km and 24 h, most likely due to the fact that the HIPPO
profiles are remote from major sources of CH4, and thus
show little fine-scale variability. We thus adopt the same co-
incidence criteria (TES overpass within 750 km and 24 h of
the HIPPO profile) here. We also require that the HIPPO pro-
file have a sufficient number of valid CH4 data points to de-
fine the tropospheric profile using the following quality crite-
ria: (a) there are at least 10 data points in the profile; (b) the
minimum pressure in the profile was less than or equal to
Table 2. Number of TES (bold) and HIPPO (italic) scans matched
for each combination of spectroscopy, a priori, and corrections. Val-
ues are given for scans with DOFS≥ 1.6 and DOFS< 1.6.
Spectroscopy TES Version 5 a priori TES Version 6 a priori
TES Version 5DOFS≥ 1.6: 404 (197) DOFS≥ 1.6: 402 (195)
DOFS< 1.6: 114 (56) DOFS< 1.6: 107 (50)
TES Version 6DOFS≥ 1.6: 406 (197) DOFS≥ 1.6: 389 (191)
DOFS< 1.6: 111 (55) DOFS< 1.6: 108 (51)
Experimental DOFS≥ 1.6: 408 (198) DOFS≥ 1.6: 402 (195)
version DOFS< 1.6: 109 (54) DOFS< 1.6: 107 (50)
250 hPa; and (c) the difference between the minimum and
maximum pressure in the profile was at least 400 hPa. With
these criteria, a worst-case HIPPO CH4 profile would have
at least 10 valid data points between 250 and 650 hPa, which
is generally adequate to define the tropospheric profile. The
number of TES and HIPPO profiles matched using these cri-
teria for each combination of spectroscopic parameters and a
priori profiles is given in Table 2.
4.2 TES observation operator for HIPPO profiles
A second issue with comparing satellite and aircraft profiles
is that (a) the vertical resolution of the satellite profile is sub-
stantially coarser than that of the aircraft data and (b) the
retrieved satellite profile reflects the influence of the choice
of a priori profile (Rodgers and Connor, 2003). To address
this, we first interpolate each HIPPO profile (expressed as
the natural logarithm of the mixing ratio) to the 67 levels of
the TES pressure grid, extrapolating above the GV ceiling
using the shape of the TES a priori profile (i.e., scaling the
TES a priori to match the top of the HIPPO profile) and ex-
trapolating below the lowest altitude measured by assuming
that the profile is constant below this height. We then apply
the TES observation operator to the resulting HIPPO profile,
hCH4
hCH4= xaCH4
+Acc
(hCH4
− xaCH4
). (8)
Here hCH4is the HIPPO profile corrected for the smooth-
ing error of the TES retrieval and including the influence of
the a priori CH4 profile. It represents the profile that would
have been retrieved if (a) TES had sampled the same air as
HIPPO and (b) the retrieval errors due to jointly retrieved pa-
rameters, other model parameters, and instrument noise were
negligible.
The trace of the averaging kernel Acc gives the degrees
of freedom for signal (DOFS) for the retrieval (Rodgers,
2000). The TES Version 5 and 6 CH4 retrievals generally
have between 0.6 and 2.3 degrees of freedom for signal (Wor-
den et al., 2012), and thus provide at most one or two in-
dependent pieces of information on the vertical profile of
Atmos. Meas. Tech., 8, 965–985, 2015 www.atmos-meas-tech.net/8/965/2015/

M. J. Alvarado et al.: Impacts of updated spectroscopy on thermal infrared retrievals of methane 971
Figure 2. Mean spectral residuals after retrieval in the areas used to simultaneously retrieve CH4, N2O, HDO, and H2O from TES radiances.
(a) Example TES spectrum. (b) Mean TES residuals after TES Version 5 retrievals for the 518 TES scans analyzed in this study (see Table 2).
(c) Mean TES residuals after TES Version 6 retrievals. (d) Mean TES residuals after retrievals as in TES Version 6, but with the proposed
updated N2O spectroscopy from HITRAN 2008.
CH4. We thus reduce the retrieved TES CH4 profiles xcorCH4
and the smoothed HIPPO profiles hCH4to one or two rep-
resentative tropospheric volume mixing ratios (RTVMRs),
following the approach of Payne et al. (2009) and Wecht et
al. (2012). For TES profiles with DOFS of 1.6 or less, a sin-
gle RTVMR value (yR) was calculated by remapping the 67-
level retrieved CH4 profile to a four-level grid with points
at (1) the Earth’s surface, (2) the altitude of maximum TES
sensitivity to CH4 (i.e., the level where the sum of the rows
of Acc is largest), (3) the tropopause, and (4) the top of the
atmosphere, as in Payne et al. (2009). The value of the CH4
mixing ratio at the second level of this four-level grid is the
RTVMR. For retrievals with DOFS of 1.6 or more, two rep-
resentative values are produced by remapping the retrieved
CH4 profile to a five-level grid with points at (1) the Earth’s
surface, (2) the altitude of the lower maximum of TES sen-
sitivity to CH4 (defined as the level where the sum of the
diagonal of Acc from the surface to this level is 20 % of the
DOFS), (3) the altitude of the upper maximum of TES sen-
sitivity to CH4 (i.e., the level where the sum of the diago-
nal of Acc from the surface is 60 % of the DOFS), (4) the
tropopause, and (5) the top of the atmosphere. The remapped
CH4 values at points (2) and (3) are then defined as the lower
tropospheric (yL) and upper tropospheric (yU) representative
values. The same remapping is applied to the corresponding
HIPPO profiles.
5 Changes between TES Version 5 and Version 6
5.1 Changes in spectral residuals
One method for evaluating changes in the spectroscopic pa-
rameters of a radiative transfer model is to examine the re-
maining spectral residuals (i.e., observed minus modeled ra-
diances or brightness temperatures) after retrieval. When av-
eraged over a large number of spectra, remaining systematic
residuals indicate likely spectroscopic errors in the radiative
transfer model (e.g., Shephard et al., 2009; Alvarado et al.,
2013).
Figure 2 shows the average of 518 TES brightness temper-
ature spectra in the spectral ranges TES uses to retrieve CH4
along with the mean spectral brightness temperature residu-
als for TES Version 5 and Version 6. The root-mean-square
(RMS) errors for each set of mean residuals are printed in
red on the figure. The change to V006 has mixed results:
while the spectroscopic parameters used in TES Version 6 do
www.atmos-meas-tech.net/8/965/2015/ Atmos. Meas. Tech., 8, 965–985, 2015

972 M. J. Alvarado et al.: Impacts of updated spectroscopy on thermal infrared retrievals of methane
Figure 3. Plots of the TES Version 5 mean residuals for each re-
trieval channel versus the change in brightness temperature due to
replacing the TES Version 5 spectroscopic parameters with (a) the
TES Version 6 CH4 parameters, (b) the TES Version 6 H2O param-
eters, and (c) the experimental N2O parameters for the AFGL (Air
Force Geophysics Laboratory) standard tropical atmosphere and a
surface temperature of 300.8 K. The points are colored according to
wave number in cm−1. Points lying near the dashed blue x = y line
indicate an improvement in the spectroscopic parameters.
remove several of the strong residual features between 1190
and 1280 cm−1 (especially the strong residuals near 1245–
1247 cm−1), the spectral regions above 1290 cm−1 show
stronger residual spikes that are generally associated with
strong CH4 and H2O lines. The overall RMS decreases very
slightly (by 0.0004 K) in Version 6, suggesting that it is not
clear if this spectroscopy is an overall improvement over
that in Version 5, at least for the spectral regions used in
the TES retrievals. This is also consistent with the results
for the updated CH4 spectroscopic parameters in Alvarado
et al. (2013), where although the introduction of line mix-
ing improved the residuals in the Q-branch (not used in TES
retrievals), the updated CH4 spectroscopy was not a clear im-
provement between 1292 and 1305 cm−1.
In order to separate the impact of the different spectro-
scopic parameter changes on the spectral residuals, Fig. 3
shows the TES Version 5 mean residuals for each retrieval
channel versus the change in brightness temperature due to
replacing the TES Version 5 spectroscopic parameters with
(a) the TES Version 6 CH4 parameters, (b) the TES Version 6
H2O parameters, and (c) the experimental N2O parameters
(discussed in Sect. 6). The brightness temperature changes
due to the spectroscopic parameter changes were calculated
for the Air Force Geophysics Laboratory (AFGL) standard
tropical profile (Anderson et al., 1986) and a surface temper-
ature of 300.8 K using LBLRTM v12.1 (Clough et al., 2005;
Alvarado et al., 2013). The points are also colored according
to wave number.
In these plots, an improvement in the spectroscopy would
be noted by points lying near the line x = y (plotted as a
dashed blue line in Fig. 3), as that would suggest that the
new spectroscopy would generally move the residuals closer
to 0. This is the case for the CH4 spectroscopic updates in
Fig. 3a, which show that many of the improvements in the
residuals in the spectral range 1230–1270 cm−1 in Fig. 2 are
primarily due to the improvements in the CH4 spectroscopic
parameters in this region. In contrast, Fig. 3b implies that
the H2O spectroscopic updates increase the absolute value of
the residuals about as often as they reduce it. These results
suggest that most of the improvement in the spectroscopic
residuals between TES Version 5 and TES Version 6 is due
to the updated CH4 spectroscopic parameters.
5.2 Changes in uncorrected TES CH4 retrievals
We wish to know how the updated spectroscopic parameters,
along with the updated a priori profiles, impact the retrieval
of CH4. We start by evaluating the errors in the “uncorrected”
CH4 retrieved from TES spectra with the HIPPO data de-
scribed in Sect. 2.2. In TES Version 5 these uncorrected CH4
profiles were biased high in the upper troposphere and lower
stratosphere. The TES Version 5 biases for all five HIPPO
campaign periods can be seen in Fig. 4, which shows the
latitudinal profiles of the bias in yL, yU, and yR for TES Ver-
sions 5 and 6. The blue triangles are the TES-HIPPO differ-
ences for the individual TES scans, with blue lines showing
the estimated retrieval error reported with the TES retrievals.
The black circles are the mean bias for the scans binned by
10◦ latitude, while the black error bars represent the stan-
dard deviation in each bin. The dashed black line is the mean
bias for each parameter. The uncorrected CH4 retrievals
from TES Version 5 show a strong positive mean bias of
123± 58 ppbv in the upper tropospheric representative value
yU, over twice as large as the bias in the lower tropospheric
representative value yL (46.8± 42.6 ppbv) and the RTVMR
Atmos. Meas. Tech., 8, 965–985, 2015 www.atmos-meas-tech.net/8/965/2015/

M. J. Alvarado et al.: Impacts of updated spectroscopy on thermal infrared retrievals of methane 973
Figure 4. Latitudinal profiles of the differences between the uncorrected TES CH4 retrievals and HIPPO CH4 measurements for all five
HIPPO campaigns. The left column has the results for TES Version 5, and the right column has the results for TES Version 6. The top two
panels of each column show the results for the upper and lower tropospheric representative volume mixing ratios (1yL and1yU, respectively)
for TES retrievals where the degrees of freedom for signal (DOFS) is ≥ 1.6. The bottom panel shows the results for the RTVMR (1yR) in
scenes where the DOFS is< 1.6. The blue triangles are the differences for the individual TES retrievals, with blue lines showing the estimated
retrieval error. The black circles show the mean bias for the scans binned by 10◦ latitude, while the black error bars are the standard deviation
in each bin. Circles are only plotted when at least 10 scans are in a bin.
yR (57.4± 60.6 ppbv). However, these biases in the uncor-
rected TES CH4 are all substantially reduced in TES Ver-
sion 6: the mean bias in yU is decreased to 94.8± 59.1 ppbv,
the mean bias in yL is reduced to 28.3± 45.9 ppbv, and the
mean bias in yR is reduced to 29.8± 58.8 ppbv. This is con-
sistent with the findings of Alvarado et al. (2013), who found
that these updated H2O and CH4 spectroscopic parameters
reduced the positive mean bias in the average CH4 retrieved
from 120 IASI spectra below the 100 hPa surface by 44 ppbv.
Therefore we conclude that the updated CH4 spectroscopic
parameters in TES Version 6 substantially reduce the posi-
tive bias in the retrieved CH4 profiles prior to the application
of any corrections. However, the remaining bias in the uncor-
rected CH4 profiles from TES Version 6 suggest that further
improvement of the CH4 spectroscopic parameters is needed
to remove the necessity of the N2O-based correction.
5.3 Changes in the N2O-corrected TES CH4 retrievals
As discussed by Worden et al. (2012) and noted in Sect. 3,
much of the bias in the retrieved TES CH4 can be removed
through the use of a correction that assumes (a) that any de-
viations of the retrieved N2O profile from its a priori value
are the result of systematic error and (b) that systematic er-
rors that affect the retrieved TES N2O profiles also impact
the co-retrieved CH4. This “N2O-corrected” CH4 retrieval is
what is used in atmospheric studies that use TES CH4 (e.g.,
Worden et al., 2013a, b) and is provided in the TES “lite”
product files. In this section we examine the remaining bias
in the TES CH4 retrievals from Version 5 and 6 after this cor-
rection has been applied, but before the application of global
bias correction given by Eq. (7). The impact of the global
bias correction is discussed in Sect. 5.4 below.
www.atmos-meas-tech.net/8/965/2015/ Atmos. Meas. Tech., 8, 965–985, 2015

974 M. J. Alvarado et al.: Impacts of updated spectroscopy on thermal infrared retrievals of methane
Figure 5. As in Fig. 4, but for the N2O-corrected TES CH4 retrievals (see Eq. (5) and Worden et al., 2012).
Table 3. Mean bias (±1σ , in ppb) of the lower (yL) and upper (yU) troposphere RTVMR for TES CH4 retrievals with DOFS≥ 1.6 and
overall RTVMR (yR) for retrievals with DOFS< 1.6.
Spectroscopy TES Version 5 a priori TES Version 6 a priori
With N2O correction With N2O and bias With N2O correction With N2O and bias
applied correction applied applied correction applied
TES Version 5
yU: 56.9± 32.8 yU: 28.7± 32.5 yU: 56.2± 32.4 yU: 28.1± 32.2
yL: 27.3± 33.0 yL: 2.0± 31.7 yL: 26.9± 32.0 yL: 1.6± 31.7
yR: 26.8± 33.0 yR: 2.7± 32.7 yR: 24.6± 34.7 yR: 0.2± 34.4
TES Version 6
yU: 25.6± 31.0 yU: −2.1± 30.6 yU: 25.7± 30.4 yU: −2.0± 30.0
yL: 29.1± 30.0 yL: 3.8± 29.6 yL: 28.4± 30.5 yL: 3.0± 30.0
yR: 6.1± 36.8 yR: −17.8± 36.5 yR: 4.8± 35.0 yR: −19.4± 34.7
Experimental version
yU: 60.8± 31.7 yU: 32.6± 31.3 yU: 59.8± 31.3 yU: 31.6± 30.8
yL: 38.1± 30.2 yL: 12.6± 29.8 yL: 38.3± 30.9 yL: 12.7± 30.5
yR: 30.4± 34.6 yR: 6.3± 34.1 yR: 28.5± 36.3 yR: 3.9± 35.7
Table 3 gives the mean bias and standard deviation of
the errors between the TES and HIPPO profiles, as de-
termined by the representative values yL, yU, and yR, for
each combination of spectroscopic parameters, a priori pro-
files, and corrections. For N2O-corrected TES CH4 retrievals
with DOFS≥ 1.6, the positive mean bias of the lower tropo-
spheric RTVMR (yL) only increases slightly between Ver-
sions 5 and 6 (27.3± 33.0 ppbv and 28.4± 30.5 ppbv, re-
spectively). However, the positive mean bias of the upper tro-
pospheric RTVMR (yU) decreases by more than half (from
Atmos. Meas. Tech., 8, 965–985, 2015 www.atmos-meas-tech.net/8/965/2015/

M. J. Alvarado et al.: Impacts of updated spectroscopy on thermal infrared retrievals of methane 975
Figure 6. The differences between the N2O-corrected TES CH4 retrievals (see Eq. (5) and Worden et al., 2012) and the HIPPO CH4 profiles
versus pressure (altitude). Red lines are the differences for individual TES retrievals. The solid black line is the mean difference and the
dashed black lines show the standard deviation. Panels (a) and (c) are the TES Version 5 CH4 retrievals with DOFS≥ 1.6 and DOFS< 1.6,
respectively. Panels (b) and (d) are the TES Version 6 CH4 retrievals with DOFS≥ 1.6 and DOFS< 1.6, respectively.
56.9± 32.8 ppbv for Version 5 to 25.7± 30.4 ppbv for Ver-
sion 6). For N2O-corrected TES retrievals with DOFS< 1.6,
the positive mean bias of the single RTVMR value (yR)
also decreases dramatically between Versions 5 and 6 (from
26.8± 33.0 to 4.8± 35.0 ppbv). The results in Table 3 show
that this decrease in the bias of yU and yR is primarily due
to the spectroscopic changes between TES Versions 5 and
6, with the a priori changes having a minor impact (see also
Sect. 5.5). The spectroscopic changes made in TES Version 6
thus significantly reduce, but do not eliminate, the positive
bias in the TES CH4 profiles that remains after the N2O cor-
rection is applied.
In order to evaluate the TES CH4 retrievals, we must also
look at the dependence of the retrieval bias against (a) lati-
tude and (b) altitude. Figure 5 shows the latitudinal profiles
of the bias in yL, yU, and yR for TES Versions 5 and 6 (again
with only the N2O correction applied). For TES retrievals
with DOFS≥ 1.6, the average bias within a latitude bin for
both yL and yU is fairly constant with latitude between 50◦ S
and 40◦ N in TES Version 6, with the changes in the bias
with latitude in this range less pronounced than in Version 5:
The difference between the minimum and maximum bias of
the bins is 20.7 ppbv (yL) and 31.9 ppbv (yU) in Version 5,
but only 17.6 ppbv (yL) and 17.9 ppbv (yU) in Version 6.
North of 40◦ N, nearly all the TES retrievals have less than
1.6 DOFS, and so have a single RTVMR (yR). The changes
in the bias of yR with latitude north of 40◦ N are similar be-
tween TES Version 5 and 6 (21.6 and 23.9 ppbv between the
minimum and maximum bins, respectively), and are slightly
larger than those seen for the high DOFS retrievals south of
40◦ N in Version 6.
The greater similarity between the remaining positive bias
in yL and yU in TES Version 6 already suggests that the bias
is more constant with altitude in Version 6 than in Version 5.
This is confirmed by Fig. 6, which shows the differences be-
tween the TES and HIPPO profiles versus pressure for each
retrieval in red, with the mean and standard deviation of these
differences plotted in black. The left column has results for
TES Version 5, with Version 6 results on the right, while
the top row is for retrievals with DOFS≥ 1.6 and the bot-
tom row is for DOFS< 1.6. We can see that while there were
large swings in the mean bias versus altitude in Version 5,
the mean biases in Version 6 are fairly constant with height.
However, the error for any individual scan seems to create
an “S” shape or an “inverted S” shape, with a cross point at
∼ 300 hPa. While these vertically varying errors cancel out
in the average for TES Version 6, further work is still needed
to explain the origin of these “S” and “inverted S” error pat-
terns with height, and to find a method to remove them from
the retrieval results or mitigate their impacts.
Figure 7 shows the vertical structure of the theoretical
observation errors for each TES CH4 retrieval for both
www.atmos-meas-tech.net/8/965/2015/ Atmos. Meas. Tech., 8, 965–985, 2015

976 M. J. Alvarado et al.: Impacts of updated spectroscopy on thermal infrared retrievals of methane
Figure 7. Theoretical observations errors for each TES CH4 retrieval (dotted red lines) and the mean theoretical error (solid red line and
triangles) versus pressure, along with the mean a priori error estimate (green line) and the standard deviation of the TES-HIPPO differences.
(a) and (c) are the TES Version 5 CH4 retrievals with DOFS≥ 1.6 and DOFS< 1.6, respectively. (b) and (d) are the TES Version 6 CH4
retrievals with DOFS≥ 1.6 and DOFS< 1.6, respectively.
Versions 5 and 6 and for the mean of the retrievals, along
with the actual errors, where the latter is defined as the stan-
dard deviation of the TES-HIPPO CH4 differences after the
N2O-based correction(x
adj
CH4− hCH4
). For CH4 retrievals
with DOFS≥ 1.6, the mean actual errors in TES Version 6
are smaller and closer to the mean theoretical errors than in
TES Version 5 above 300 hPa and are also slightly improved
in the lower error peak near 560 hPa (0.0255 in Version 6 ver-
sus 0.0272 in Version 5). The errors for retrievals with less
than 1.6 DOFS are fairly similar between the two versions.
5.4 Impact of the global bias correction
As discussed above, a global bias correction following
Eq. (7), with every element of the vector q set to 0.015 was
found to generally remove the remaining bias in the lower
tropospheric representative value (yL) from TES Version 5.
This can be seen in Table 3, which shows that for Version 5
TES CH4 retrievals with DOFS≥ 1.6 the positive mean bias
yL is reduced from 27.3± 33.0 to 2.0± 31.7 ppbv by the
global bias correction. In addition, the bias in yU in Ver-
sion 5 is reduced from 56.9± 32.8 to 28.7± 32.5 ppbv by
the global bias correction, and the positive mean bias yR is
reduced from 26.8± 33.0 to 2.7± 32.7 ppbv.
Table 3 also shows that this same global bias correction
nearly eliminates the bias in yL and yU in Version 6, decreas-
ing from 28.4± 30.5 to 3.0± 30.0 and from 25.7± 30.4 to
−2.0± 30.0, respectively. Figures 8 and 9 show that the rel-
ative latitudinal and vertical dependence of the errors in yL
and yU are mostly unchanged by this bias correction as well.
However, the global bias correction results in a negative bias
of −19.4± 34.7 ppbv for the TES Version 6 retrievals with
DOFS< 1.6 (primarily north of 40◦ N).
In addition to the RTVMR approach of Payne et al. (2009),
another common way of using TES CH4 data is to calcu-
late a tropospheric average VMR by averaging the TES re-
trieved VMR between 900 hPa and the tropopause, as was
done in Worden et al. (2013a, b). Figure 10 shows the differ-
ence of the TES and HIPPO average tropospheric VMR ver-
sus latitude after the N2O and global bias corrections have
been applied. These results are very similar to the corre-
sponding RTVMR results in Fig. 8, with the TES Version 6
spectroscopy reducing the positive bias in the average tro-
pospheric VMR from 15.7± 17.1 to 2.1± 17.1 ppbv for re-
trievals with DOFS≥ 1.6, while changing a positive bias of
6.6± 32.0 ppbv to a negative bias of −18.2± 33.9 ppbv in
retrievals with DOFS< 1.6.
Atmos. Meas. Tech., 8, 965–985, 2015 www.atmos-meas-tech.net/8/965/2015/
M. J. Alvarado et al.: Impacts of updated spectroscopy on thermal infrared retrievals of methane 977
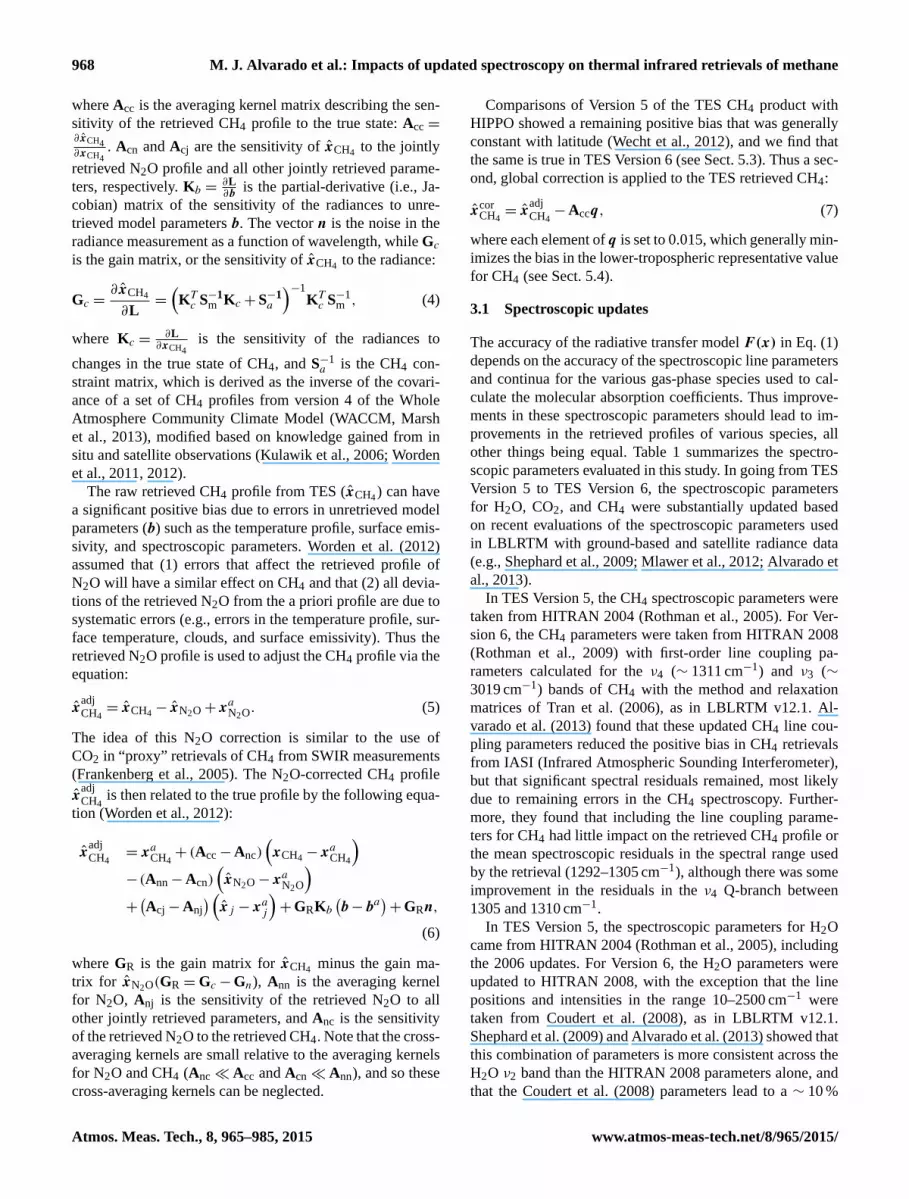
Figure 8. As in Fig. 5, but with the global bias correction (Eq. (7) and Sect. 5.4) applied.
5.5 Impact of the a priori changes
The changes to the a priori estimates of temperature, H2O,
N2O, CH4, O3, and CO2 between TES Version 5 and Ver-
sion 6 have a minor impact on the CH4 retrievals, as can be
seen in Table 3. Using the TES Version 6 spectroscopic pa-
rameters, the mean bias in the lower tropospheric RTVMR
(yL, after both the N2O correction and the global bias correc-
tion) improves slightly from 3.8±29.6 to 3.0±30.0 ppbv, as
does the upper tropospheric value yU (from −2.1± 30.6 to
−2.0± 30.0 ppbv), while the mean bias in yR for scans with
less than 1.6 DOFS becomes slightly worse (from −17.8±
36.5 to −19.4± 35.7 ppbv). The a priori profiles also have
a negligible impact on the dependence of the CH4 bias with
latitude and the vertical profile of the bias (not shown). Thus
the reduction in positive bias seen between Version 5 and
Version 6 is primarily due to the improvements in the spec-
troscopic parameters for CH4 and other species discussed in
Sect. 3.1.
6 Impact of proposed updates to N2O spectroscopic
parameters
6.1 Impact on the spectral residuals
Figure 2d shows the mean spectral residuals after the CH4
retrieval when the TES Version 6 spectroscopy is modified
to include the updated N2O spectroscopic parameters from
HITRAN 2008 (the “experimental version” in Table 1). The
main difference from the mean residuals from TES Version 6
is an increase in the number of residual spikes between 1260–
1275 cm−1, resulting in a “fuzzier” appearance of the resid-
uals in this region. The overall RMS error is also slightly in-
creased from Version 6 (by 0.002 K). In addition, Fig. 3c sug-
gests that the updated N2O spectroscopic parameters worsen
the spectral residuals about as often as they improve them,
consistent with the increase in the overall RMS. Thus the
analysis of the residuals after retrieval does not suggest that
the updated N2O spectroscopic parameters are a significant
improvement over the parameters used in TES Version 6, but
neither do they introduce significantly larger errors.
www.atmos-meas-tech.net/8/965/2015/ Atmos. Meas. Tech., 8, 965–985, 2015
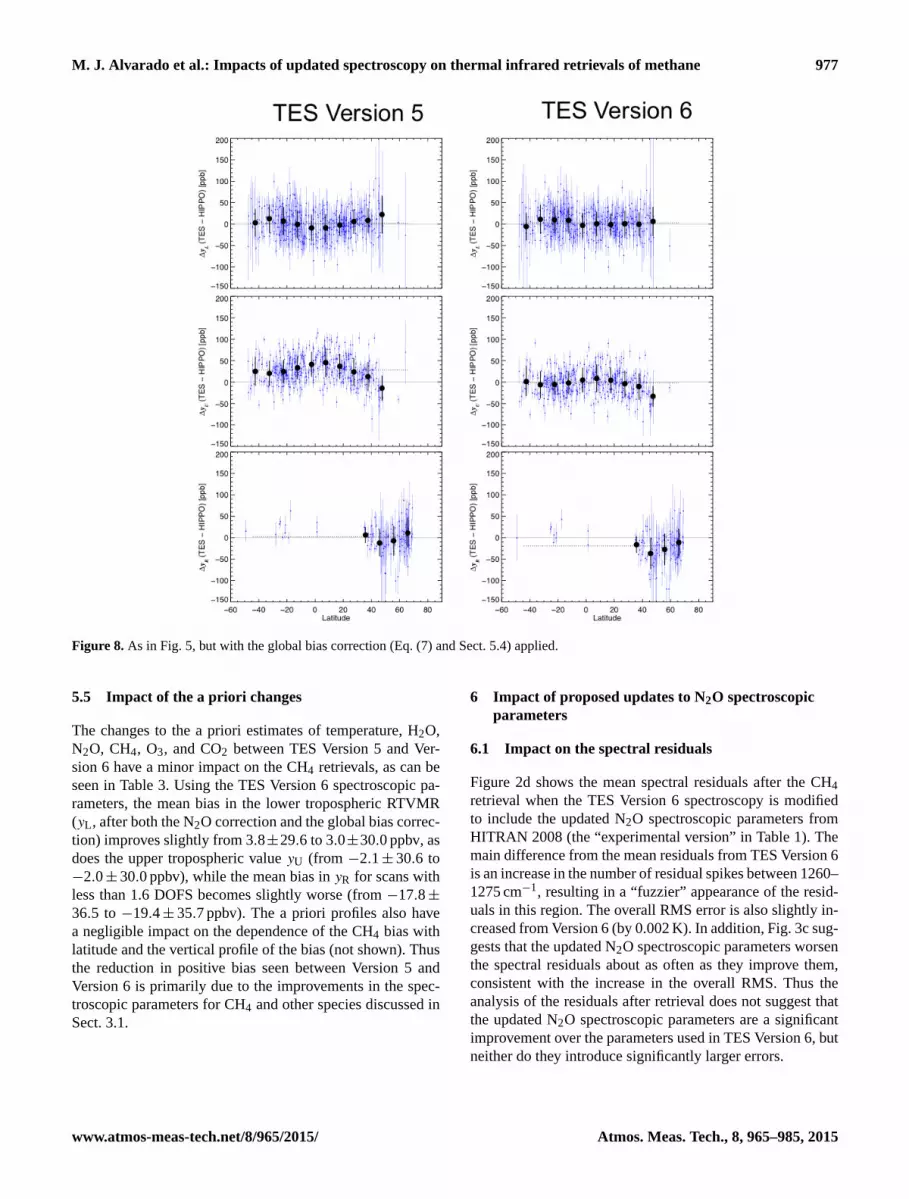
978 M. J. Alvarado et al.: Impacts of updated spectroscopy on thermal infrared retrievals of methane
Figure 9. As in Fig. 6, but with the global bias correction (Eq. (7) and Sect. 5.4) applied.
6.2 Impact on TES CH4 retrievals
The results in Table 3 show that the use of the updated
N2O spectroscopy generally increases the bias in the CH4 re-
trievals over Version 6. When the Version 6 a priori profiles
are used and only the N2O correction is applied, the bias in
yU and yL increases from 25.7± 30.4 and 28.4± 30.5 ppbv,
respectively, in Version 6 to 59.8±31.3 and 38.3±30.9 ppbv,
respectively. In addition, the bias in yR also increases from
4.8± 35.0 to 28.5± 36.3 ppbv.
The impact of the N2O spectroscopic parameters on the
N2O-corrected TES CH4 retrievals does not arise through
changes in the uncorrected CH4 profile retrieved, but rather
is due to a reduction in strength in the N2O correction. Fig-
ure 11 compares the uncorrected CH4 profiles retrieved in
TES Version 6 with those retrieved by the experimental ver-
sion. We can see that the mean bias in the uncorrected CH4
profiles is nearly identical in these cases. However, Fig. 12
shows the N2O profiles retrieved by both versions of the
TES algorithm with the N2O observations from HIPPO. We
can see that the updated N2O spectroscopic parameters in
the experimental version have reduced the bias in the TES
retrieved N2O, which would suggest that the updated N2O
spectroscopy is an improvement. Reducing the bias of the
retrieved N2O reduces the strength of the N2O correction
via Eq. (5), and thus less of the bias in the CH4 profiles is
removed than is the case in TES Version 6. Thus the N2O
correction method of Worden et al. (2012), which works rea-
sonably well to remove the bias in the retrieved CH4 for TES
Versions 5 and 6 (using HITRAN 2000 N2O parameters), is
less effective with the updated N2O spectroscopic parame-
ters from HITRAN 2008. However, we note that even with
the updated N2O spectroscopic parameters it is better to use
the N2O-corrected TES CH4 data for scientific studies than
the raw CH4 retrievals.
In order to determine why the N2O-based correction
method is less effective with the experimental version of the
TES CH4, we examined the assumptions behind the correc-
tion method. As stated in Sect. 5.3 above, the N2O-based
correction method assumes that any deviations from the TES
N2O a priori are due to systematic errors. We can examine
the validity of this assumption by comparing the TES N2O a
priori profiles from TES Version 5 and 6 with the measured
N2O profiles from HIPPO, as shown in Fig. 13. We can see
that for cases where the TES CH4 retrievals have at least 1.6
DOFS, which are generally in latitudes between 50◦ S and
50◦ N, the assumption that on average the TES N2O a priori
is generally the same as the true N2O profile appears to be
valid – while individual N2O a priori profiles can show dif-
ferences of up to 5 ppbv from the HIPPO measurements, the
mean of the differences is very small (< 0.5 ppbv). The dif-
ference between the TES N2O a priori and HIPPO is larger
for cases where the TES CH4 retrievals have less than 1.6
DOFS, which are generally in latitudes north of 40◦ N. Here
the mean difference between the N2O a priori and the HIPPO
observations is ∼ 1.5 ppbv, with the TES a priori generally
underestimating the HIPPO N2O profile. However, in both
cases the differences are fairly minor, especially compared
Atmos. Meas. Tech., 8, 965–985, 2015 www.atmos-meas-tech.net/8/965/2015/

M. J. Alvarado et al.: Impacts of updated spectroscopy on thermal infrared retrievals of methane 979
Figure 10. Latitudinal profiles of the differences between average tropospheric volume mixing ratios (VMRs) of the N2O- and global bias-
corrected TES CH4 retrievals and HIPPO CH4 measurements for all five HIPPO campaigns. The average tropospheric VMR is calculated
as the mean of the VMRs on the TES retrieval grid between 900 hPa and the tropopause. The left column has the results for TES Version 5,
and the right column has the results for TES Version 6. The top panel of each column shows the results for TES retrievals where the degrees
of freedom for signal (DOFS) is ≥ 1.6. The bottom panel shows the results in scenes where the DOFS is < 1.6. The blue triangles are the
differences for the individual TES retrievals, with blue lines showing the estimated retrieval error. The black circles show the mean bias for
the scans binned by 10◦ latitude, while the black error bars are the standard deviation in each bin. Circles are only plotted when at least 10
scans are in a bin.
with the 10–20 ppbv positive mean bias seen in the N2O pro-
files retrieved by TES.
Thus it is more likely that remaining bias is symptomatic
of inadequacies in the assumption that the errors that im-
pact the N2O retrieval impact the CH4 retrieval in a similar
manner. The improvement in the retrieved N2O when the up-
dated N2O parameters are used suggests that rather than the
same systematic errors causing the positive bias in the TES
retrievals of CH4 and N2O, these remaining biases are pri-
marily due to spectroscopic errors, a significant fraction of
which are independent.
We note that we have demonstrated in Sect. 5 above that
the N2O-corrected, bias-corrected TES CH4 retrievals from
Version 6 match the measured HIPPO profiles well for cases
in which the TES retrievals have more than 1.6 DOFS, and
we still recommend the use of both corrections with TES Ver-
sion 6 data.
Our results suggest that further work is needed on either
the CH4/H2O spectroscopy, or on empirical, post hoc correc-
tion approaches, before the updated N2O spectroscopy can
bring improvements to the TES CH4 product.
7 Conclusions
We have evaluated the impact of spectroscopic updates on
TES CH4 retrievals, using measured CH4 profiles from all
five HIPPO campaigns, following the methods previously
used in Wecht et al. (2012) to evaluate TES Version 5 (V005)
products with HIPPO I and II data. We find that the up-
dated spectroscopic parameters for CH4 and H2O in TES
Version 6 result in a significant decrease of the positive
bias in both the uncorrected TES CH4 retrievals and in the
TES CH4 retrievals after the N2O-based correction of Wor-
den et al. (2012) is applied (while the updated a priori pro-
files in Version 6 have little impact). Examinations of the
spectral residuals after retrievals suggest that most of the
improvement in the retrieved CH4 is due to the updates
in the CH4 spectroscopic parameters, rather than those of
H2O. For the N2O-corrected TES CH4 profiles with at least
1.6 DOFS (generally between 50◦ S and 50◦ N), the bias in
the upper tropospheric representative value decreases from
56.9 to 25.7 ppbv, while the bias in the lower tropospheric
representative value only increases slightly (from 27.3 to
28.4 ppbv). For retrievals with less than 1.6 DOFS, and thus
a single-parameter RTVMR, the bias is reduced from 26.8 to
www.atmos-meas-tech.net/8/965/2015/ Atmos. Meas. Tech., 8, 965–985, 2015

980 M. J. Alvarado et al.: Impacts of updated spectroscopy on thermal infrared retrievals of methane
Figure 11. As in Fig. 6, but for the uncorrected CH4 retrievals from TES Version 6 and the experimental version (see Table 1).
Figure 12. Differences between the retrieved TES N2O profiles and the measured HIPPO N2O profiles. The red lines are for each TES
spectra analyzed, while the black solid line shows the mean differences and the black dashed lines show the standard deviation. (a) TES
Version 5 N2O for TES CH4 retrievals with DOFS≥ 1.6. (b) TES Version 6 N2O retrievals with DOFS≥ 1.6. (c) TES Version 5 N2O for
TES CH4 retrievals with DOFS< 1.6. (d) TES Version 6 N2O for TES CH4 retrievals with DOFS< 1.6.
Atmos. Meas. Tech., 8, 965–985, 2015 www.atmos-meas-tech.net/8/965/2015/

M. J. Alvarado et al.: Impacts of updated spectroscopy on thermal infrared retrievals of methane 981
Figure 13. Differences between the TES N2O a priori profiles and the measured HIPPO N2O profiles. The red lines are for each TES spectra
analyzed, while the black solid line shows the mean differences and the black dashed lines show the standard deviation. (a) TES Version 5
N2O a priori for TES CH4 retrievals with DOFS≥ 1.6 (generally between 50◦ S and 50◦ N). (b) TES Version 6 N2O a priori for TES CH4
retrievals with DOFS≥ 1.6. (c) TES Version 5 N2O a priori for TES CH4 retrievals with DOFS< 1.6 (generally between 30◦ N and 70◦ N).
(d) TES Version 6 N2O a priori for TES CH4 retrievals with DOFS< 1.6.
4.8 ppbv. There is little evidence of a latitudinal dependence
of the biases for either TES Version 5 or Version 6. In addi-
tion, the mean bias in the N2O-corrected CH4 is reasonably
constant with height for Version 6, although errors in individ-
ual scans show a characteristic “S” or “inverted S” shape with
height. An additional global bias correction can be applied to
remove the remaining bias in TES CH4 retrievals with at least
1.6 DOFS. We thus conclude that the TES Version 6 CH4 is
a significant improvement on TES Version 5.
We also examined the impact of adding the updated N2O
spectroscopic parameters from HITRAN 2008 to the TES
Version 6 retrievals. These updated N2O parameters have lit-
tle impact on the uncorrected CH4 retrieved by TES and do
reduce the positive bias in the TES retrievals of N2O. For
TES this reduces the strength of the N2O-based correction
for the CH4 retrieval bias, and would result in a more biased
CH4 product if corrected in a similar fashion as in TES Ver-
sions 5 and 6. Further work is needed, either on the CH4/H2O
spectroscopy or on a new post hoc correction methodology,
in order to allow the inclusion of the updated N2O spec-
troscopic parameters to bring improvements to the TES re-
trieval CH4 product. Nonetheless, we conclude that in terms
of N2O retrievals, the HITRAN 2008 N2O parameters are an
improvement over the HITRAN 2000 list.
Acknowledgements. This research was supported by the US
National Science Foundation under the HIPPO Program, and under
NASA contracts to Atmospheric and Environmental Research
(AER) and the Jet Propulsion Laboratory, California Institute of
Technology (JPL). We thank Eric A. Kort of the University of
Michigan and all the other members of the HIPPO Science Team
for their assistance with the data.
Edited by: G. Stiller
References
Alvarado, M. J., Cady-Pereira, K. E., Xiao, Y., Millet, D.
B., and Payne, V. H.: Emission Ratios for Ammonia and
Formic Acid and Observations of Peroxy Acetyl Nitrate
(PAN) in Biomass Burning Smoke As Seen By the Tropo-
spheric Emission Spectrometer (TES), Atmosphere, 2, 633–654,
doi:10.3390/atmos2040633, 2011.
Alvarado, M. J., Payne, V. H., Mlawer, E. J., Uymin, G., Shephard,
M. W., Cady-Pereira, K. E., Delamere, J. S., and Moncet, J.-
L.: Performance of the Line-By-Line Radiative Transfer Model
(LBLRTM) for temperature, water vapor, and trace gas retrievals:
recent updates evaluated with IASI case studies, Atmos. Chem.
Phys., 13, 6687–6711, doi:10.5194/acp-13-6687-2013, 2013.
Anderson, G. P., Clough, S. A., Kneizys, F. X., Chetwynd, J. H.,
and Shettle, E. P.: AFGL Atmospheric Constituent Profiles (0–
www.atmos-meas-tech.net/8/965/2015/ Atmos. Meas. Tech., 8, 965–985, 2015

982 M. J. Alvarado et al.: Impacts of updated spectroscopy on thermal infrared retrievals of methane
120 km), Technical Report AFGL-TR-86-0110, Air Force Geo-
physics Laboratory, Hanscom AFB, MA, USA, 43 pp., 1986.
Beer, R., Glavich, T. A., and Rider, D. M.: Tropospheric emission
spectrometer for the Earth Observing System’s Aura satellite,
Appl. Optics, 40, 2356–2367, 2001.
Bergamaschi, P., Frankenberg, C., Meirink, J. F., Krol, M., Den-
tener, F., Wagner, T., Platt, U., Kaplan, J. O., Korner, S.,
Heimann, M., Dlugokencky, E. J., and Goede A.: Satellite char-
tography of atmospheric methane from SCIAMACHY on board
ENVISAT: 2. Evaluation based on inverse model simulations, J.
Geophys. Res., 112, D02304, doi:10.1029/2006JD007268, 2007.
Bergamaschi, P., Frankenberg, C., Meirink, J. F., Krol, M., Vil-
lani, M. G., Houweling, S., Dentener, F., Dlugokencky, E. J.,
Miller, J. B., Gatti, L. V., Engel, A., and Levin I.: Inverse
modeling of global and regional CH4 emissions using SCIA-
MACHY satellite retrievals, J. Geophys. Res., 114, D22301,
doi:10.1029/2009JD012287, 2009.
Bowman, K. W., Rodgers, C. D., Sund-Kulawik, S., Worden,
J., Sarkissian, E., Osterman, G., Steck, T., Luo, M., Elder-
ing, A., Shephard, M. W., Worden, H., Clough, S. A., Brown,
P. D., Rinsland, C. P., Lampel, M., Gunson, M., and Beer,
R.: Tropospheric emission spectrometer: Retrieval method and
error analysis, IEEE Geosci. Remote Sens., 44, 1297–1307,
doi:10.1109/TGRS.2006.871234, 2006.
Brasseur, G. P., Hauglustaine, D. A., Walters, S., Rasch, P. J.,
Müller, J.-F., Granier, C., and Tie, X. X.: MOZART, a global
chemical transport model for ozone and related chemical trac-
ers: 1. Model description, J. Geophys. Res., 103, 28265–28289,
doi:10.1029/98JD02397, 1998.
Cady-Pereira, K. E., Shephard, M. W., Millet, D. B., Luo, M.,
Wells, K. C., Xiao, Y., Payne, V. H., and Worden, J.: Methanol
from TES global observations: retrieval algorithm and seasonal
and spatial variability, Atmos. Chem. Phys., 12, 8189–8203,
doi:10.5194/acp-12-8189-2012, 2012.
Cady-Pereira, K. E., Chaliyakunnel, S., Shephard, M. W., Mil-
let, D. B., Luo, M., and Wells, K. C.: HCOOH measurements
from space: TES retrieval algorithm and observed global distri-
bution, Atmos. Meas. Tech., 7, 2297–2311, doi:10.5194/amt-7-
2297-2014, 2014.
Ciais, P., Sabine, C., Bala, G., Bopp, L., Brovkin, L. V., Canadell, J.,
Chhabra, A., DeFries, R., Galloway, J., Heimann, M., Jones, C.,
Le Quéré, C., Myneni, R. B., Pia, S., and Thornton, P.: Carbon
and Other Biogeochemical Cycles, in: Climate Change 2013:
The Physical Science Basis, Contribution of Working Group I to
the Fifth Assessment Report of the Intergovernmental Panel on
Climate Change, edited by: Stocker, T. F., Qin, D., Plattner, G.-
K., Tignor, M., Allen, S. K., Boschung, J., Nauels, A., Xia, Y.,
Bex, V., and Midgley, P. M., Cambridge University Press, Cam-
bridge, United Kingdom and New York, NY, USA, 2013.
Clough, S. A., Shephard, M. W., Mlawer, E. J., Delamere, J. S.,
Iacono, M. J., Cady-Pereira, K., Boukabara, S., and Brown, R.
D.: Atmospheric radiative transfer modeling: a summary of the
AER codes, J. Quant. Spectrosc. Radiat. T., 91, 233–244, 2005.
Clough, S. A., Shephard, M. W., Worden, J., Brown, P. D., Wor-
den, H. M., Luo, M., Rodgers, C. D., Rinsland, C. P., Goldman,
A., Brown, L., Sund-Kulawik, S., Eldering, A., Lampel, M. C.,
Osterman, G., Beer, R., Bowman, K., Cady-Pereira, K. E., and
Mlawer, E. J.: Forward Model and Jacobians for Tropospheric
Emission Spectrometer Retrievals, IEEE Trans. Geosci. Remote
Sens., 44, 1308–1323, 2006.
Connor, T. C., Shephard, M. W., Payne, V. H., Cady-Pereira, K.
E., Kulawik, S. S., Luo, M., Osterman, G., and Lampel, M.:
Long-term stability of TES satellite radiance measurements, At-
mos. Meas. Tech., 4, 1481–1490, doi:10.5194/amt-4-1481-2011,
2011.
Coudert, L. H., Wagner, G., Birk, M., Baranov, Yu I., Lafferty, W.
J., and Flaud, J.-M.: The H162
O molecule: Line position and line
intensity analyses up to the second triad, J. Mol. Spectrosc., 251,
339, doi:10.1016/j.jms.2008.03.021, 2008.
Crevoisier, C., Nobileau, D., Fiore, A. M., Armante, R., Chédin, A.,
and Scott, N. A.: Tropospheric methane in the tropics – first year
from IASI hyperspectral infrared observations, Atmos. Chem.
Phys., 9, 6337–6350, doi:10.5194/acp-9-6337-2009, 2009.
Crevoisier, C., Nobileau, D., Armante, R., Crépeau, L., Machida, T.,
Sawa, Y., Matsueda, H., Schuck, T., Thonat, T., Pernin, J., Scott,
N. A., and Chédin, A.: The 2007–2011 evolution of tropical
methane in the mid-troposphere as seen from space by MetOp-
A/IASI, Atmos. Chem. Phys., 13, 4279–4289, doi:10.5194/acp-
13-4279-2013, 2013.
Dlugokencky, E. J., Nisbet, E. G., Fisher, R., and Lowry, D.: Global
atmospheric methane: budget, changes and dangers, Philos. T.
Roy. Soc. A, 369, 2058–2072, doi:10.1098/rsta.2010.0341, 2011.
Emmons, L. K., Walters, S., Hess, P. G., Lamarque, J.-F., Pfister,
G. G., Fillmore, D., Granier, C., Guenther, A., Kinnison, D.,
Laepple, T., Orlando, J., Tie, X., Tyndall, G., Wiedinmyer, C.,
Baughcum, S. L., and Kloster, S.: Description and evaluation of
the Model for Ozone and Related chemical Tracers, version 4
(MOZART-4), Geosci. Model Dev., 3, 43–67, doi:10.5194/gmd-
3-43-2010, 2010.
Frankenberg, C., Meirink, J. F., van Weele, M., Platt, U., and
Wagner, T.: Assessing Methane Emissions from Global
Space-Borne Observations, Science, 308, 1010–1014,
doi:10.1126/science.1106644, 2005.
Frankenberg, C., Aben, I., Bergamaschi, P., Dlugokencky, E. J., van
Hees, R., Houweling, S., van der Meer, P., Snel, R., and Tol,
P.: Global column-averaged methane mixing ratios from 2003
to 2009 as derived from SCIAMACHY: Trends and variability, J.
Geophys. Res., 116, D04302, doi:10.1029/2010JD014849, 2011.
Herbin, H., Labonnote, L. C., and Dubuisson, P.: Multispectral in-
formation from TANSO-FTS instrument – Part 1: Application to
greenhouse gases (CO2 and CH4) in clear sky conditions, At-
mos. Meas. Tech., 6, 3301–3311, doi:10.5194/amt-6-3301-2013,
2013.
Kort, E. A., Patra, P. K., Ishijima, K., Daube, B. C., Jimenez, R.,
Elkins, J., Hurst, D., Moore, F. L., Sweeney, C., and Wofsy, S.
C.: Tropospheric distribution and variability of N2O: Evidence
for strong tropical emissions, Geophys. Res. Lett., 38, L15806,
doi:10.1029/2011GL047612, 2011.
Kuai, L., Worden, J., Kulawik, S. S., Montzka, S. A., and Liu, J.:
Characterization of Aura TES carbonyl sulfide retrievals over
ocean, Atmos. Meas. Tech., 7, 163–172, doi:10.5194/amt-7-163-
2014, 2014.
Kulawik, S. S., Osterman, G., Jones, D. B. A., and Bowman, K. W.:
Calculation of altitude-dependent Tikhonov constraints for TES
nadir retrievals, IEEE T. Geosci. Remote, 44, 1334–1342, 2006.
Kulawik, S. S., Jones, D. B. A., Nassar, R., Irion, F. W., Wor-
den, J. R., Bowman, K. W., Machida, T., Matsueda, H., Sawa,
Atmos. Meas. Tech., 8, 965–985, 2015 www.atmos-meas-tech.net/8/965/2015/

M. J. Alvarado et al.: Impacts of updated spectroscopy on thermal infrared retrievals of methane 983
Y., Biraud, S. C., Fischer, M. L., and Jacobson, A. R.: Char-
acterization of Tropospheric Emission Spectrometer (TES) CO2
for carbon cycle science, Atmos. Chem. Phys., 10, 5601–5623,
doi:10.5194/acp-10-5601-2010, 2010.
Kulawik, S. S., Worden, J. R., Wofsy, S. C., Biraud, S. C., Nassar,
R., Jones, D. B. A., Olsen, E. T., Jimenez, R., Park, S., Santoni,
G. W., Daube, B. C., Pittman, J. V., Stephens, B. B., Kort, E. A.,
Osterman, G. B., and TES team: Comparison of improved Aura
Tropospheric Emission Spectrometer CO2 with HIPPO and SGP
aircraft profile measurements, Atmos. Chem. Phys., 13, 3205–
3225, doi:10.5194/acp-13-3205-2013, 2013.
Lamouroux, J., Tran, H, Laraia, A. L., Gamache, R. R., Rothman,
L. S., Gordon, I. E., and Hartmann, J.-M.: Updated database plus
software for line-mixing in CO2 infrared spectra and their test
using laboratory spectra in the 1.5–2.3 µm region, J. Quant. Spec-
trosc. Radiat. T., 111, 2321, doi:10.1016/j.jqsrt.2010.03.006,
2010.
Luo, M., Rinsland, C. P., Rodgers, C. D., Logan, J. A., Worden, H.,
Kulawik, S., Eldering, A., Goldman, A., Shephard, M. W., Gun-
son, M., and Lampel, M.: Comparison of carbon monoxide mea-
surements by TES and MOPITT: Influence of a priori data and in-
strument characteristics on nadir atmospheric species retrievals,
J. Geophys. Res., 112, D09303, doi:10.1029/2006JD007663,
2007.
Marsh, D. R., Mills, M. J., Kinnison, D. E., Lamarque, J. F., Calvo,
N., and Polvani, L. M.: Climate Change from 1850 to 2005 Sim-
ulated in CESM1 (WACCM, J. Climate, 26, 7372–7391, 2013.
Massart, S., Agusti-Panareda, A., Aben, I., Butz, A., Chevallier, F.,
Crevoisier, C., Engelen, R., Frankenberg, C., and Hasekamp, O.:
Assimilation of atmospheric methane products into the MACC-II
system: from SCIAMACHY to TANSO and IASI, Atmos. Chem.
Phys., 14, 6139–6158, doi:10.5194/acp-14-6139-2014, 2014.
Meirink, J. F., Bergamaschi, P., Frankenberg, C., D’Amelio, M. T.
S., Dlugokencky, E. J., Gatti, L. V., Houweling, S., Miller, J. B.,
Rockmann, T., Villani, M. G., and Krol, M. C.: Four-dimensional
variational data assimilation for inverse modeling of atmospheric
methane emissions: Analysis of SCIAMACHY observations, J.
Geophys. Res., 113, D17301, doi:10.1029/2007JD009740, 2008.
Mlawer, E. J., Payne, V. H., Moncet, J.-L., Delamere, J. S., Al-
varado, M. J., and Tobin, D. D.: Development and recent eval-
uation of the MT_CKD model of continuum absorption, Phil.
Trans. Roy. Soc. A, 370, 1–37, doi:10.1098/rsta.2011.0295,
2012.
Myhre, G., Shindell, D., Bréon, F.-M., Collins, W., Fuglestvedt,
J., Huang, J., Koch, D., Lamarque, J.-F., Lee, D., Mendoza,
B., Nakajima, T., Robock, A., Stephens, G., Takemura, T., and
Zhang, H.: Anthropogenic and Natural Radiative Forcing, in:
Climate Change 2013: The Physical Science Basis, Contribution
of Working Group I to the Fifth Assessment Report of the Inter-
governmental Panel on Climate Change, edited by: Stocker, T.
F., Qin, D., Plattner, G.-K., Tignor, M., Allen, S. K., Boschung,
J., Nauels, A., Xia, Y., Bex, V., and Midgley, P. M., Cambridge
University Press, Cambridge, United Kingdom and New York,
NY, USA, 2013.
Nassar, R., Logan, J. A., Worden, H. M., Megretskaia, I. A.,
Bowman, K. W., Osterman, G. B., Thompson, A. M., Tara-
sick, D. W., Austin, S., Claude, H., Dubey, M. K., Hocking,
W. K., Johnson, B. J., Joseph, E., Merrill, J., Morris, G. A.,
Newchurch, M., Oltmans, S. J., Posny, F., Schmidlin, F. J.,
Vömel, H., Whiteman, D. N., and Witte, J. C.: Validation of Tro-
pospheric Emission Spectrometer (TES) nadir ozone profiles us-
ing ozonesonde measurements, J. Geophys. Res., 113, D15S17,
doi:10.1029/2007JD008819, 2008.
Niro, F., Jucks, K., and Hartmann, J.-M.: Spectral calculations in
central and wing regions of CO2 IR bands. IV: Software and
database for the computation of atmospheric spectra, J. Quant.
Spectrosc. Radiat. T., 95, 469–481, 2005.
Park, M., Randel, W. J., Kinnison, D. E., Garcia, R. R.,
and Choi, W.: Seasonal variation of methane, water vapor,
and nitrogen oxides near the tropopause: Satellite observa-
tions and model simulations, J. Geophys. Res., 109, D03302,
doi:10.1029/2003JD003706, 2004.
Payne, V. H., Clough, S. A., Shephard, M. W., Nassar, R., and Lo-
gan, J. A.: Information-centered representation of retrievals with
limited degrees of freedom for signal: application to methane
from the Tropospheric Emission Spectrometer, J. Geophys. Res.,
17, D10307, doi:10.1029/2008JD010155, 2009.
Payne, V. H., Alvarado, M. J., Cady-Pereira, K. E., Worden, J. R.,
Kulawik, S. S., and Fischer, E. V.: Satellite observations of perox-
yacetyl nitrate from the Aura Tropospheric Emission Spectrome-
ter, Atmos. Meas. Tech., 7, 3737–3749, doi:10.5194/amt-7-3737-
2014, 2014.
Pinder, R. W., Walker, J. T., Bash, J. O., Cady-Pereira, K. E.,
Henze, D. K., Luo, M., and Shephard, M. W.: Quantifying spa-
tial and temporal variability in atmospheric ammonia with in situ
and space-based observations, Geophys. Res. Lett., 38, L04802,
doi:10.1029/2010GL046146, 2011.
Razavi, A., Clerbaux, C., Wespes, C., Clarisse, L., Hurtmans, D.,
Payan, S., Camy-Peyret, C., and Coheur, P. F.: Characterization
of methane retrievals from the IASI space-borne sounder, At-
mos. Chem. Phys., 9, 7889–7899, doi:10.5194/acp-9-7889-2009,
2009.
Rienecker, M. M., Suarez, M. J., Todling, R., Bacmeister, J., Takacs,
L., Liu, H.-C., Gu, W., Sienkiewicz, M., Koster, R. D., Gelaro,
R., Stajner, I., and Nielsen, J. E.: The GEOS-5 Data Assim-
ilation System – Documentation of Versions 5.0.1, 5.1.0, and
5.2.0, NASA Technical Report Series on Global Modeling and
Data Assimilation, vol. 27, edited by: Suarez, M. J., NASA/TM–
2008–104606, 2008.
Rigby, M., Prinn, R. G., Fraser, P. J., Simmonds, P. G., Lan-
genfelds, R. L., Huang, J., Cunnold, D. M., Steele, L. P.,
Krummel, P. B., Weiss, R. F., O’Doherty, S., Salameh, P. K.,
Wang, H. J., Harth, C. M., Mühle, J., and Porter, L. W.: Re-
newed growth of atmospheric methane, Geophys. Res. Lett., 35,
L22805, doi:10.1029/2008GL036037, 2008.
Rinsland, C. P., Luo, M., Logan, J. A., Beer, R., Worden, H., Ku-
lawik, S. S., Rider, D., Osterman, G., Gunson, M., Eldering, A.,
Goldman, A., Shephard, M., Clough, S. A., Rodgers, C., Lam-
pel, M., and Chiou, L.: Nadir measurements of carbon monox-
ide distributions by the Tropospheric Emission Spectrometer in-
strument onboard the Aura Spacecraft: Overview of analysis ap-
proach and examples of initial results, Geophys. Res. Lett., 33,
L22806, doi:10.1029/2006GL027000, 2006.
Rodgers, C. D.: Inverse Methods for Atmospheric Sounding: The-
ory and Practice, World Sci., Hackensack, N. J., 2000.
Rodgers, C. D. and Connor, B. J.: Intercomparison of re-
mote sounding instruments, J. Geophys. Res., 108, 4116,
doi:10.1029/2002JD002299, 2003.
www.atmos-meas-tech.net/8/965/2015/ Atmos. Meas. Tech., 8, 965–985, 2015
984 M. J. Alvarado et al.: Impacts of updated spectroscopy on thermal infrared retrievals of methane
Rothman, L. S., Barbe, A., Benner, D. C., Brown, L. R., Camy-
Peyret, C., Carleer, M. R., Chance, K. V., Clerbaux, C., Dana, V.,
Devi, V. M., Fayt, A., Flaud, J-M., Gamache, R. R., Goldman,
A., Jacquemart, D., Jucks, K. W., Lafferty, W. J., Mandin, J-Y.,
Massie, S. T., Nemtchinov, V., Newnham, D. A., Perrin, A., Rins-
land, C. P., Schroeder, J., Smith, K. M., Smith, M. A. H., Tang,
K., Toth, R. A., Vander Auwera, J., Varanasi, P., and Yoshino,
K.: The HITRAN Molecular Spectroscopic Database: Edition of
2000 Including Updates through 2001, J. Quant. Spectrosc. Ra-
diat. T., 82, 5–44, 2003.
Rothman, L. S., Jacquemart, D., Barbe, A., Benner, D. C., Birk, M.,
Brown, L. R., Carleer, M. R., Chackerian, C., Jr., Chance, K.,
Coudert, L. H., Dana, V., Devi, V. M., Flaud, J.-M., Gamache,
R. R., Goldman, A., Hartmann, J.-M., Jucks, K. W., Maki, A. G.,
Mandin, J.-Y., Massie, S. T., Orphal, J., Perrin, A., Rinsland, C.
P., Smith, M. A. H., Tennyson, J., Tolchenov, R. N., Toth, R. A.,
Vander Auwera, J., Varanasi, P., and Wagner, G.: The HITRAN
2004 molecular spectroscopic database, J. Quant. Spectrosc. Ra-
diat. T., 96, 139–204, 2005.
Rothman, L. S., Gordon, I. E., Barbe, A., Benner, D. C., Bernath, P.
F., Birk, M., Boudon, V., Brown, L. R., Campargue, A., Cham-
pion, J.-P., Chance, K., Coudert, L. H., Dana, V., Devi, V. M.,
Fally, S., Flaud, J.-M., Gamache, R. R., Goldman, A., Jacque-
mart, D., Kleiner, I., Lacome, N., Lafferty, W. J., Mandin, J.-
Y., Massie, S. T., Mikhailenko, S. N., Miller, C. E., Moazzen-
Ahmadi, N., Naumenko, O. V., Nikitin, A. V., Orphal, J.,
Perevalov, V. I., Perrin, A., Predoi-Cross, A., Rinsland, C. P., Rot-
ger, M., Šimecková, M., Smith, M. A. H., Sung, K., Tashkun, S.
A., Tennyson, J., Toth, R. A., Vandaele, A. C., and Vander Auw-
era, J: The HITRAN 2008 molecular spectroscopic database, J.
Quant. Spectrosc. Radiat. T., 110, 533–572, 2009.
Santoni, G. W., Daube, B. C., Kort, E. A., Jiménez, R., Park, S.,
Pittman, J. V., Gottlieb, E., Xiang, B., Zahniser, M. S., Nelson,
D. D., McManus, J. B., Peischl, J., Ryerson, T. B., Holloway, J.
S., Andrews, A. E., Sweeney, C., Hall, B., Hintsa, E. J., Moore,
F. L., Elkins, J. W., Hurst, D. F., Stephens, B. B., Bent, J., and
Wofsy, S. C.: Evaluation of the airborne quantum cascade laser
spectrometer (QCLS) measurements of the carbon and green-
house gas suite – CO2, CH4, N2O, and CO – during the Cal-
Nex and HIPPO campaigns, Atmos. Meas. Tech., 7, 1509–1526,
doi:10.5194/amt-7-1509-2014, 2014.
Shephard, M. W., Clough, S. A., Payne, V. H., Smith, W. L., Kireev,
S., and Cady-Pereira, K. E.: Performance of the line-by-line ra-
diative transfer model (LBLRTM) for temperature and species
retrievals: IASI case studies from JAIVEx, Atmos. Chem. Phys.,
9, 7397–7417, doi:10.5194/acp-9-7397-2009, 2009.
Shephard, M. W., Cady-Pereira, K. E., Luo, M., Henze, D. K., Pin-
der, R. W., Walker, J. T., Rinsland, C. P., Bash, J. O., Zhu, L.,
Payne, V. H., and Clarisse, L.: TES ammonia retrieval strat-
egy and global observations of the spatial and seasonal vari-
ability of ammonia, Atmos. Chem. Phys., 11, 10743–10763,
doi:10.5194/acp-11-10743-2011, 2011.
Tran, H., Flaud, J.-M., Gabard, T., Hase, F., Von Clarmann, T.,
Camy-Peyret, C., Payan, S., and Hartmann, J.-M.: Model, Soft-
ware and database for line-mixing effects in the v3 and v4 bands
of CH4 and tests using laboratory and planetary measurements.
I. N2 (and air) broadening and the Earth atmosphere, J. Quant.
Spectrosc. Radiat. T., 101, 284–305, 2006.
Wecht, K. J., Jacob, D. J., Wofsy, S. C., Kort, E. A., Worden, J. R.,
Kulawik, S. S., Henze, D. K., Kopacz, M., and Payne, V. H.: Val-
idation of TES methane with HIPPO aircraft observations: impli-
cations for inverse modeling of methane sources, Atmos. Chem.
Phys., 12, 1823–1832, doi:10.5194/acp-12-1823-2012, 2012.
Weiss, R. F. and Prinn, R. G.: Quantifying greenhouse gas emis-
sions from anthropogenic measurements: a critical reality check
for climate legislation, Phil. Trans. R. Soc. A, 369, 1925–1942,
doi:10.1098/rsta.2011.0006, 2011.
Wells, K. C., Millet, D. B., Hu, L., Cady-Pereira, K. E., Xiao,
Y., Shephard, M. W., Clerbaux, C. L., Clarisse, L., Coheur, P.-
F., Apel, E. C., de Gouw, J., Warneke, C., Singh, H. B., Gold-
stein, A. H., and Sive, B. C.: Tropospheric methanol observations
from space: retrieval evaluation and constraints on the seasonal-
ity of biogenic emissions, Atmos. Chem. Phys., 12, 5897–5912,
doi:10.5194/acp-12-5897-2012, 2012.
Wofsy, S. C. and the HIPPO Science Team and Cooperating
Modellers and Satellite Teams: HIAPER Pole-to-Pole Observa-
tions (HIPPO): fine-grained, global-scale measurements of cli-
matically important atmospheric gases and aerosols, Philosoph.
Trans. Roy. Soc. A: Mathematical, Physical and Engineering Sci-
ences, 369, 2073–2086, doi:10.1098/rsta.2010.0313, 2011.
Wofsy, S. C., Daube, B. C., Jimenez, R., Kort, E., Pittman, J.
V., Park, S., Commane, R., Xiang, B., Santoni, G., Jacob, D.,
Fisher, J., Pickett-Heaps, C., Wang, H., Wecht, K., Wang, Q.-Q.,
Stephens, B. B., Shertz, S., Watt, A. S., Romashkin, P., Cam-
pos, T., Haggerty, J., Cooper, W. A., Rogers, D., Beaton, S., Hen-
dershot, R., Elkins, J. W., Fahey, D. W., Gao, R. S., Moore, F.,
Montzka, S. A., Schwarz, J. P., Perring, A. E., Hurst, D., Miller,
B. R., Sweeney, C., Oltmans, S., Nance, D., Hintsa, E., Dut-
ton, G., Watts, L. A., Spackman, J. R., Rosenlof, K. H., Ray,
E. A., Hall, B., Zondlo, M. A., Diao, M., Keeling, R., Bent,
J., Atlas, E. L., Lueb, R., and Mahoney, M. J.: HIPPO Merged
10-second Meteorology, Atmospheric Chemistry, Aerosol Data
(R_20121129),Carbon Dioxide Information Analysis Center,
Oak Ridge National Laboratory, Oak Ridge, Tennessee, USA,
doi:10.3334/CDIAC/hippo_010 (Release 20121129), 2012.
Worden, H. M., Logan, J. A., Worden, J. R., Beer, R., Bowman,
K., Clough, S. A., Eldering, A., Fisher, B. M., Gunson, M. R.,
Herman, R. L., Kulawik, S. S., Lampel, M. C., Luo, M., Megret-
skaia, I. A., Osterman, G. B., and Shephard, M. W.: Comparisons
of Tropospheric Emission Spectrometer (TES) ozone profiles to
ozonesondes: methods and initial results, J. Geophys. Res., 112,
D03309, doi:10.1029/2006JD007258, 2007.
Worden, J., Noone, D., Galewsky, J., Bailey, A., Bowman, K.,
Brown, D., Hurley, J., Kulawik, S., Lee, J., and Strong, M.:
Estimate of bias in Aura TES HDO/H2O profiles from com-
parison of TES and in situ HDO/H2O measurements at the
Mauna Loa observatory, Atmos. Chem. Phys., 11, 4491–4503,
doi:10.5194/acp-11-4491-2011, 2011.
Worden, J., Kulawik, S., Frankenberg, C., Payne, V., Bowman, K.,
Cady-Peirara, K., Wecht, K., Lee, J.-E., and Noone, D.: Pro-
files of CH4, HDO, H2O, and N2O with improved lower tro-
pospheric vertical resolution from Aura TES radiances, Atmos.
Meas. Tech., 5, 397–411, doi:10.5194/amt-5-397-2012, 2012.
Worden, J., Jiang, Z., Jones, D. B. A., Alvarado, M., Bowman, K.,
Frankenberg, C., Kort, E. A., Kulawik, S. S., Lee, M., Liu, J.,
Payne, V., Wecht, K., and Worden, H.: El Niño, the 2006 Indone-
Atmos. Meas. Tech., 8, 965–985, 2015 www.atmos-meas-tech.net/8/965/2015/

M. J. Alvarado et al.: Impacts of updated spectroscopy on thermal infrared retrievals of methane 985
sian peat fires, and the distribution of atmospheric methane, Geo-
phys. Res. Lett., 40, 4938–4943, doi:10.1002/grl.50937, 2013a.
Worden, J., Wecht, K., Frankenberg, C., Alvarado, M., Bowman,
K., Kort, E., Kulawik, S., Lee, M., Payne, V., and Worden,
H.: CH4 and CO distributions over tropical fires during Octo-
ber 2006 as observed by the Aura TES satellite instrument and
modeled by GEOS-Chem, Atmos. Chem. Phys., 13, 3679–3692,
doi:10.5194/acp-13-3679-2013, 2013b.
Xiong, X., Barnet, C., Maddy, E., Sweeney, C., Liu, X., Zhou, L.,
and Goldberg, M.: Characterization and validation of methane
products from the Atmospheric Infrared Sounder (AIRS), J. Geo-
phys. Res., 113, G00A01, doi:10.1029/2007JG000500, 2008.
Xiong, X., Houweling, S., Wei, J., Maddy, E., Sun, F., and Barnet,
C.: Methane plume over south Asia during the monsoon season:
satellite observation and model simulation, Atmos. Chem. Phys.,
9, 783–794, doi:10.5194/acp-9-783-2009, 2009.
Xiong, X., Barnet, C. D., Zhuang, Q., Machida, T., Sweeney, C.,
and Patra, P. K.: Mid-upper tropospheric methane in the high
Northern Hemisphere: Spaceborne observations by AIRS, air-
craft measurements, and model simulations, J. Geophys. Res.,
115, D19309, doi:10.1029/2009JD013796, 2010.
Zhu, L., Henze, D. K., Cady-Pereira, K. E., Shephard, M. W., Luo,
M., Pinder, R. W., Bash, J. O., and Jeong, G.-R.: Constraining
U.S. ammonia emissions using TES remote sensing observations
and the GEOS-Chem adjoint model, J. Geophys. Res. Atmos.,
118, 3355–3368, doi:10.1002/jgrd.50166, 2013.
www.atmos-meas-tech.net/8/965/2015/ Atmos. Meas. Tech., 8, 965–985, 2015


