Embed Size (px)
Citation preview

Impaired Drivers and their Risk of Reoffending
Amy Pilon, Lisa M. Jewell, and
J. Stephen Wormith
Centre for Forensic Behavioural Science and Justice Studies
University of Saskatchewan
November, 2015

Abstract
Impaired driving is one of the most costly social, legal, and safety problems in society, both in
financial and in human terms (Smith, 1993; Traffic Injury Research Foundation, 2014). In order
to effectively manage impaired drivers, it is necessary to accurately assess their risk, and, if
possible, provide rehabilitation options targeted toward their criminogenic needs. The current
study examined the Level of Service Inventory-Ontario Revision (LSI-OR) and its ability to
predict both general recidivism and DWI recidivism with a sample of impaired drivers who are
under the responsibility of the province of Ontario. As well, analyses were conducted with both
DWI offenders and non-DWI offenders in order to compare the performance of the LSI-OR with
DWI offenders to the larger mainstream segment of the offender population for whom the
instrument was originally intended. The results from the ROC analyses that examined the LSI-
OR total and section scores with general recidivism for the various groups of offenders suggested
that the LSI-OR and its subscales were better able to predict general recidivism in the non-DWI
sample compared to the DWI sample. In contrast, the LSI-OR and its subscales were better able
to predict DWI recidivism in the DWI sample compared to the non-DWI sample, for the
community offenders but not for the custody offenders. The LSI-OR has good predictive
accuracy for both DWI and non-DWI custody and community offenders thus it is appropriate to
continue to use this tool with this population. Future directions in this area of research may
include the development of a risk assessment tool designed and validated on this population.
Keywords: impaired driving, DWI offenders, LSI-OR

Table of Contents
Abstract……………………………………………………………………………………………2
Table of Contents………………………………………………………………………………….3
List of Tables……………………………………………………………………………………...4
List of Figures……………………………………………………………………………………..8
Introduction………………………………………………………………………………………11
Method…………………………………………………………………………………………...29
Results……………………………………………………………………………………………40
Discussion………………………………………………………………………………………118
References………………………………………………………………………………………127
Appendix A: University of Saskatchewan Research Ethics Board Approval…...……………..135

List of Tables
Table 1 Total number of DWI and non-DWI offenders by disposition type………………………..40
Table 2 Total number of DWI charges by the type of DWI Charge………………………………....41
Table 3 Comparisons of DWI Offenders and non-DWI offenders on demographic
characteristics………………………………..…………………………………………………………….43
Table 4 Comparisons of DWI Offenders and non-DWI offenders on substance abuse variables.44
Table 5 Comparisons of DWI Offenders and non-DWI offenders on LSI-OR variables…...........45
Table 6 Comparisons of DWI Offenders and non-DWI offenders on Recidivism variables..……47
Table 7 Comparisons of DWI and non-DWI custody offenders on demographic characteristics.48
Table 8 Comparisons of DWI and non-DWI custody offenders on substance abuse variables....49
Table 9 Comparisons of DWI and non-DWI custody offenders on LSI-OR variables…………….50
Table 10 Comparisons of DWI and non-DWI custody offenders on recidivism variables……….51
Table 11 Comparisons of DWI and non-DWI community offenders on demographic
characteristics…………………………………………………………………………..………………….53
Table 12 Comparisons of DWI and non-DWI community offenders on substance abuse
variables………………………………………………………………………………………….…………54
Table 13 Comparisons of DWI and non-DWI community offenders on LSI-OR variables………54
Table 14 Comparisons of DWI and non-DWI community offenders on recidivism variables...…56
Table 15 The number of DWI and non-DWI offenders by type and number of DWI recidivism
offences ………………………………………………………………………………….………………….57
Table 16 The number of DWI and non-DWI custody offenders by type and number of DWI
recidivism charges…………………………………………………………...…………………………….57

Table 17 The number of DWI and non-DWI community offenders by type and number of DWI
recidivism charges……………………………………………………………..…………………………..58
Table 18 Comparisons of DWI Offenders and non-DWI offenders on General Recidivism….….59
Table 19 Comparisons of DWI Offenders and non-DWI offenders on DWI Recidivism……...….59
Table 20 Comparisons of DWI and non-DWI Custody offenders on Recidivism.…………………59
Table 21 Comparisons of DWI and non-DWI custody offenders on DWI Recidivism…………….60
Table 22 Comparisons of DWI and non-DWI community offenders on Recidivism...…………….60
Table 23 Comparisons of DWI and non-DWI community offenders on DWI Recidivism………..60
Table 24 Initial risk level by final risk level for DWI offenders….…………………………………..61
Table 25 Initial risk level by final risk level for Non-DWI offenders…….………………………….62
Table 26 Initial risk level by final risk level for DWI custody offenders…..………………………..62
Table 27 Initial risk level by final risk level for non-DWI custody offenders……………………...63
Table 28 Initial risk level by final risk level for DWI community offenders…………..……………64
Table 29 Initial risk level by final risk level for non-DWI community offenders…………………..64
Table 30 Correlations between LSI-OR Variables with General Recidivism for DWI Offenders
and non-DWI Offenders…………………………………………………………………………………...66
Table 31 Correlations between LSI-OR Variables with General Recidivism for DWI and non-
DWI Custody Offenders…………………………………………………………………………….……..66
Table 32 Correlations between LSI-OR Variables with General Recidivism for DWI and non-
DWI Community Offenders……………………………………………………………………………….67
Table 33 Correlations between LSI-OR Variables with DWI Recidivism for DWI Offenders and
non-DWI offenders…………………………………………………………………………………………68

Table 34 Correlations between LSI-OR Variables with DWI Recidivism for DWI and non-DWI
Custody Offenders…………………………………………………………………………………………68
Table 35 Correlations between LSI-OR Variables with DWI Recidivism for DWI and non-DWI
Community Offenders……………………………………………………………………………69
Table 36 AUC Values for the DWI and non-DWI offender groups on Recidivism………………70
Table 37 AUC Values for the DWI and non-DWI custody offenders on Recidivism………………72
Table 38 AUC Values for the DWI and non-DWI community offenders on Recidivism………….74
Table 39 AUC Values for the DWI and non-DWI offenders on DWI Recidivism………………..76
Table 40 AUC Values for the DWI and non-DWI custody offenders on DWI Recidivism………..78
Table 41 AUC Values for the DWI and non-DWI community offenders on DWI Recidivism…...80
Table 42 AUC Values for all DWI and non-DWI offender groups on Recidivism………………...82
Table 43 LSI-OR Item Correlations and Demographics for the DWI Construction Sample on
DWI Recidivism…………………………………………………………………………………………….83
Table 44 Stepwise Logistic Regression for LSI-OR Items for the DWI Construction
Sample……………………………………………………………………………………………………….84
Table 45 Stepwise Logistic Regression for LSI-OR Items for the DWI Construction
Sample……………………………………………………………………………………………………….91
Table 46 Stepwise Logistic Regression for LSI-OR/Demographic Variables for the DWI
Construction Sample………………………………………………………………………………………98
Table 47 Stepwise Multiple Regression for LSI-OR/Demographic Items for the DWI
Construction Sample……………………………………………………………………………………106
Table 48 Summary Tables of the Correlations and ROC Analyses Among the DWI Construction
and Validation Samples for LSI-OR and LSI-OR/Demographic Predictor Variables………….113

Table 49 Summary Tables of the Correlations and ROC Analyses Among the Non-DWI Sample
for LSI-OR and LSI-OR/Demographic Predictor Variables………………………………………..114
Table 50 Summary Tables of the Correlations and ROC Analyses Among the Validation Samples
for LSI-OR and LSI-OR/Demographic Predictor Variables………………………………………..115
Table 51 Summary Tables of the ROC Analyses Among the DWI Construction and Validation
Samples for LSI-OR Predictor Variable on DWI Recidivism……………………………......……..116
Table 52 Summary Tables of the ROC Analyses Among the Total Construction and Validation
Samples for LSI-OR and Initial DWI Charges Predictor Variable on DWI Recidivism..………117

List of Figures
Figure 1 Comparisons of the Means on LSI-OR Variables for DWI Offenders and non-DWI
Offenders…………………………………………………………………………………………………….46
Figure 2 ROC Curve on General Recidivism for the DWI Offenders…..…………………………...71
Figure 3 ROC Curve on General Recidivism for the Non-DWI Offenders………………………....71
Figure 4 ROC Curve on General Recidivism for the DWI Custody Offenders.……………………73
Figure 5 ROC Curve on General Recidivism for the Non-DWI Custody Offenders..……………..73
Figure 6 ROC Curve on General Recidivism for the DWI Community Offenders…..…………….75
Figure 7 ROC Curve on General Recidivism for the Non-DWI Community Offenders..………....75
Figure 8 ROC Curve on DWI Recidivism for the DWI Offenders.………………………………......77
Figure 9 ROC Curve on DWI Recidivism for the Non-DWI Offenders……………………………..77
Figure 10 ROC Curve on DWI Recidivism for the DWI Custody Offenders….……………………79
Figure 11 ROC Curve on DWI Recidivism for the Non-DWI Custody Offenders……….……..….79
Figure 12 ROC Curve on DWI Recidivism for the DWI Community Offenders….………………..81
Figure 13 ROC Curve on DWI Recidivism for the Non-DWI Community Offenders……………..81
Figure 14 ROC Curve on DWI Recidivism for the Logistic Binary LSI-OR Variable and Initial
Risk Levels – DWI Construction Sample..………………………………………………………………85
Figure 15 ROC Curve on DWI Recidivism for the Logistic Binary LSI-OR Variable and Initial
Risk Levels – DWI Validation Sample…….…………………………………………………………….86
Figure 16 ROC Curve on DWI Recidivism for the Logistic Binary LSI-OR Variable and Initial
Risk Levels – Non-DWI Sample…...……………………………………………………………………..87
Figure 17 ROC Curve on DWI Recidivism for the Logistic Weighted LSI-OR Variable and Initial
Risk Levels – DWI Construction Sample…..……………………………………………………………88

Figure 18 ROC Curve on DWI Recidivism for the Logistic Weighted LSI-OR Variable and Initial
Risk Levels – DWI Validation Sample……………………….………………………………………….89
Figure 19 ROC Curve on DWI Recidivism for the Logistic Weighted LSI-OR Variable and Initial
Risk Levels – Non-DWI Sample…………………………………...……………………………………..90
Figure 20 ROC Curve on DWI Recidivism for the MR Binary LSI-OR Variable and Initial Risk
Levels – DWI Construction Sample…………………………………………………………………...…92
Figure 21 ROC Curve on DWI Recidivism for the MR Binary LSI-OR Variable and Initial Risk
Levels – DWI Validation Sample………………………..……………………………………………….93
Figure 22 ROC Curve on DWI Recidivism for the MR Binary LSI-OR Variable and Initial Risk
Levels – Non-DWI Sample………………………………………………………………………………..94
Figure 23 ROC Curve on DWI Recidivism for the MR Weighted LSI-OR Variable and Initial Risk
Levels – DWI Construction Sample…..………………………………………………………………….95
Figure 24 ROC Curve on DWI Recidivism for the MR Weighted LSI-OR Variable and Initial Risk
Levels – DWI Validation Sample…………………………………………………………………96
Figure 25 ROC Curve on DWI Recidivism for the MR Weighted LSI-OR Variable and Initial Risk
Levels – Non-DWI Sample………………………………………………………………………………..97
Figure 26 ROC Curve on DWI Recidivism for the Logistic Binary LSI-OR/Demographic Variable
and Initial Risk Levels – DWI Construction Sample…………………………………………………..99
Figure 27 ROC Curve on DWI Recidivism for the Logistic Binary LSI-OR/Demographic Variable
and Initial Risk Levels – DWI Validation Sample………………………………………………...….100
Figure 28 ROC Curve on DWI Recidivism for the Logistic Binary LSI-OR/Demographic Variable
and Initial Risk Levels – Non-DWI Sample…………………………………………………………...101

Figure 29 ROC Curve on DWI Recidivism for the Logistic Weighted LSI-OR/Demographic
Variable and Initial Risk Levels – DWI Construction Sample……………………………………...103
Figure 30 ROC Curve on DWI Recidivism for the Logistic Weighted LSI-OR/Demographic
Variable and Initial Risk Levels – DWI Validation Sample………………………………………...104
Figure 31 ROC Curve on DWI Recidivism for the Logistic Weighted LSI-OR/Demographic
Variable and Initial Risk Levels – Non-DWI Sample………………………………………………..105
Figure 32 ROC Curve on DWI Recidivism for the MR Binary LSI-OR/Demographic Variable and
Initial Risk Levels – DWI Construction Sample……………………………………………………...107
Figure 33 ROC Curve on DWI Recidivism for the MR Binary LSI-OR/Demographic Variable and
Initial Risk Levels – DWI Validation Sample…………………………………………………………108
Figure 34 ROC Curve on DWI Recidivism for the MR Binary LSI-OR/Demographic Variable and
Initial Risk Levels – Non-DWI Sample………………………………………………………………...109
Figure 35 ROC Curve on DWI Recidivism for the MR Weighted LSI-OR/Demographic Variable
and Initial Risk Levels – DWI Construction Sample…………………………………………………110
Figure 36 ROC Curve on DWI Recidivism for the MR Weighted LSI-OR/Demographic Variable
and Initial Risk Levels – DWI Validation Sample……………………………………………………111
Figure 37 ROC Curve on DWI Recidivism for the MR Weighted LSI-OR/Demographic Variable
and Initial Risk Levels – Non-DWI Sample…………………………………………………………...112
Impaired Drivers and their Risk of Reoffending
Impaired driving is a widespread social problem in society that has serious ramifications,
in terms of human injury/loss and financial costs. In Canada, the Canadian Criminal Code
prohibits driving while one’s ability to operate a vehicle is impaired by drugs or alcohol
(Perreault, 2013). Impaired driving has been a recognized criminal act in Canada since 1921,
and there are nine offences related to this violation in the Code. The offences include: driving
with a blood alcohol concentration (BAC) in excess of 80 mg of alcohol per 100 ml of blood; a
failure to comply with a demand for a sample; driving while impaired causing bodily harm;
operating a motor vehicle with a BAC that exceeds 80 mg per 100 ml of blood causing bodily
harm; failure to comply with a demand for a sample causing bodily harm; driving while impaired
causing death; operating a motor vehicle with a BAC that exceeds 80 mg per 100 ml of blood
causing death; and failure to comply with a demand for a sample causing death (Hanson, 2009;
Perreault, 2013). A violation of any of the above would result in a charge of impaired driving.
Drivers can also be charged with impaired driving if they are driving recklessly with
alcohol in their system (even if their BAC is not over the 0.08 limit) or if a car is under their care
and control, such as sitting behind the wheel of an unstarted vehicle while impaired (DUI.CA,
2014). In Canada, all provinces have adopted zero BAC levels for young or novice drivers
(Hanson, 2009). Levels of impairment are determined by the percentage of a person’s
bloodstream that is alcohol and can be measured using a breathalyzer or a blood sample
(DUI.CA, 2014).
Impaired driving charges, in various jurisdictions, are often referred to using the terms
driving while intoxicated (DWI), driving while ability impaired (DWAI), driving under the
influence (DUI), impaired care and control, and operating while impaired (OWI; DUI.CA, 2014;

Hanson, 2009). These terms are commonly used interchangeably, including non-legal terms
such as drunk driving and drinking and driving. The terms DWI and DUI are commonly used in
the United States; however, they are not used in Canada’s Criminal Code (Hanson, 2009).
Impaired driving is one of the most costly social, legal, and safety problems in society,
both in financial and in human terms (Smith, 1993; Traffic Injury Research Foundation, 2014).
For example, Pitel and Solomon (2013) reported that in 2010, impaired driving in Canada
resulted in an estimated 1,082 fatalities, 63,821 injuries and damage to 210,932 vehicles in
property damage-only crashes, costing an estimated $20.62 billion. Impaired driving causes
approximately 4 deaths, 175 injuries, and 578 property damage-only crashes on a daily basis
(Mothers Against Drunk Driving [MADD], 2014). As well, impaired driving is the most
common criminal offence among adults and is the leading cause of criminal death (Perreault,
2013). In 2010/2011, approximately 3,800 admissions to sentenced provincial custody and 70
admissions to sentenced federal custody were for impaired driving (Perreault, 2013).
There is a considerable portion of Canadians that report driving while impaired, and
impaired driving rates have increased over the past decade. For example, the Traffic Injury
Research Foundation (2014) found that 17.4% of Canadians self-reported driving after
consuming any amount of alcohol in the past month and 6.6% self-reported driving while
impaired in the past year. Despite a sizeable decrease in impaired driving rates from the mid-
1980s to the mid-2000s, since 2006, the rate of impaired driving in Canada has continually
increased (Perreault, 2013). In fact, in 2011, impaired driving rates were higher than they have
been in a decade (Perreault, 2013). Thus, impaired driving continues to be an important issue for
governments throughout Canada, police services, the justice system, community organizations,
and the general public.

For individuals charged with impaired driving, there are various sanctions and penalties
used to deter future impaired driving and to protect the public. For example, for indictable
offences and summary convictions, the minimum penalty for the first offence is a $1000 fine,
while second and subsequent offences include terms of imprisonment (Hanson, 2009). Provinces
and territories also have the authority to impose provincial license suspensions (which vary by
province, for offence types, and length of time) for first and subsequent offences (Hanson, 2009).
In addition, some provinces impound vehicles of repeat impaired drivers and have mandatory
educational or rehabilitation programs or courses that must be completed (Hanson, 2009).
Courts can also mandate the installation of ignition interlock devices to individuals charged with
impaired driving, which prevent intoxicated persons from starting their vehicle (Beck, Rauch,
Baker, & Williams, 1999; Hanson, 2009; Weinrath, 1997). In some jurisdictions, specialized
DUI/DWI courts are used with repeat offenders to target their alcohol addiction (Hanson, 2009;
Lapham, Kapitula, C'de Baca, & McMillan, 2006; MacDonald, Morral, Raymond, & Eibner,
2007).
In recent decades, the federal government has implemented numerous measures, such as
increasing the minimum and maximum penalties (which escalate for repeat offenders), to combat
impaired driving (Hanson, 2009; Perreault, 2013). As well, there are community organizations,
such as MADD (n.d.), and media commercial campaigns that increase awareness of, and
advocate against, impaired driving. There are also provincial/territorial (e.g., arrive alive drive
sober, reduce impaired driving everywhere [RIDE]) and national initiatives (e.g., SMARTRISK
Heroes) that work to address and decrease impaired driving (Change the Conversation, n.d.).
Although there are numerous sanctions (e.g., fines, imprisonment, substance abuse
treatment programs) available for impaired drivers, previous research (Hanson, 2009; Ross &

Klette, 1995; Taxman & Piquero, 1998; Yu, 2000) has found that imprisonment and large fines
have little to no deterrent effect on repeat impaired drivers. As well, ignition interlock devices
and educational or rehabilitation programs only modestly affect recidivism (Beck et al., 1999;
MacDonald et al., 2007). However, some studies (e.g., Fulkerson, 2003; Morse & Elliott, 1992;
Weinrath, 1997) have found that ignition interlock devices do result in lower recidivism rates
among impaired driving offenders. A systematic review on the effectiveness of ignition
interlocks found lower recidivism rates when the device is installed in the vehicle, but to
eliminate potential selection bias, the authors concluded that more randomized controlled trials
are needed so that the effectiveness and efficacy can be ascertained (Willis, Lybrand, & Bellamy,
2004).
Past research about the effectiveness of DUI/DWI courts has also resulted in mixed
findings. Some studies (Hanson, 2009; Lapham et al., 2006) have found that DUI/DWI courts
have very low failure and recidivism rates. In contrast, other studies (e.g., Bouffard &
Richardson, 2007; MacDonald et al., 2007) have found either no difference or higher recidivism
rates for offenders who proceeded through DUI/DWI courts. A meta-analysis on the
effectiveness of DWI courts found the evidence to be promising, but ambiguous, given the mixed
and sometimes null findings from the most rigorous randomized experimental evaluations, and
concluded that additional experimental evaluations of DWI courts are needed (Ojmarrh, Wilson,
Eggers, & MacKenzie, 2012).
With all of the conflicting evidence that exists on which sanctions are effective, there is
no firm evidence on what works in reducing recidivism with these offenders (Weinrath, 1997).
In addition, although, there are numerous sanctions available and numerous tactics have been
implemented, the injuries, fatalities, property damage, and charges that result from impaired

driving continue to occur (Perreault, 2013). Thus, in order to provide sanctions that are
rehabilitative and effective for impaired drivers, it is necessary to accurately assess their risk to
provide options that are targeted toward their criminogenic needs (dynamic risk factors).
However, little is known about the risk assessment of impaired driving offenders and the risk
they present on an individual basis.
Risk Assessment
Risk assessment is focused on predicting whether an offender will reoffend in the future
(Andrews & Bonta, 2010). Otherwise, it refers to the probability that an individual will engage
in harmful/antisocial behaviour (e.g., drinking and driving) based on known risk factors relating
to the individual (Bartol & Bartol, 2011). Risk factors can be classified into static risk factors
and criminogenic need/dynamic risk factors. Static risk factors are fixed characteristics of an
individual that cannot be changed, such as an offender’s criminal history or age (Andrews &
Bonta, 2010). In contrast, criminogenic need/dynamic risk factors (e.g., substance abuse) are
characteristics of an individual that can be changed over time and, therefore, are targeted through
treatment to reduce recidivism. The most important dynamic/criminogenic risk factors to reduce
recidivism are known as the “central eight” which include a history of antisocial behaviour,
antisocial personality pattern, antisocial cognitions, antisocial associates, family and/or marital,
school and/or work, leisure and/or recreation, and substance abuse (Andrews & Bonta, 2010;
Andrews, Bonta, & Wormith, 2006). Within the central eight risk factors, a history of antisocial
behaviour, antisocial personality pattern, antisocial cognitions, and antisocial associates are
considered the “big four”. These four risk factors are the strongest predictors of criminal
recidivism among the central eight.

Risk assessments provide correctional agencies with the level of risk that an offender
poses to the community, as well as appropriate targets for change (Latessa & Lovins, 2010).
Indeed, risk assessments are important for numerous reasons: they help identify offenders most
at risk for recidivating; identify risk and criminogenic need factors; guide decision making by
providing more information in a systematic manner; reduce bias by following objective criteria;
improve the placement of offenders and the utilization of resources; and enhance public safety
(Latessa & Lovins, 2010).
Risk assessments are used across a wide range of correctional settings including: courts
for pretrial decisions, sentencing decisions, and during revocation hearings; probation and parole
agencies for determining levels of supervision, placement in programming, and release
decisions; and provincial and federal corrections for classifying offenders’ risk, placement in
programming, and determining which offenders should be granted early release (Latessa &
Lovins, 2010). Examples of some commonly used risk assessment tools are the Historical,
Clinical, Risk Management Scale (HCR-20; Webster, Douglas, Eaves, & Hart, 1997), the
Statistical Information on Recidivism Scale (SIR; Nuffield, 1982), the Correctional Offender
Management Profiling for Alternative Sanctions (COMPAS; Brennan & Oliver, 2000), the Level
of Service Inventory-Revised (LSI-R; Andrews & Bonta, 1995), and the Level of Service/Case
Management Inventory (LS/CMI; Andrews, Bonta, & Wormith, 2004).
Assessment tools in corrections can be categorized into three domains: screening
instruments, comprehensive risk/need assessment tools, and specialized tools (Latessa & Lovins,
2010). Screening instruments assess primarily static factors (e.g., criminal history), are quick
and easy to use, and are useful for in or out decisions (e.g., detain, release on recognizance) and
sorting offenders into risk categories (Latessa & Lovins, 2010). Comprehensive risk/need
assessment tools assess all of the major risk and need factors (e.g., the central eight), take longer
to administer, and require more extensive training for those administering such tools (Latessa &
Lovins, 2010). These tools produce levels of risk/needs that are correlated with outcome
measures (e.g., recidivism) and are useful in case management of offenders, recommending
treatments/programming, and reassessing changes in risk overtime (Latessa & Lovins, 2010).
Finally, specialized tools are defined as instruments that assess specific domains (e.g., substance
abuse) or specialized populations (e.g., sex offenders) and should be used in conjunction with
comprehensive risk/need assessment tools (Latessa & Lovins, 2010). We will now discuss the
risk factors that have been identified for impaired drivers and the assessment tools that have been
used to assess the risk of impaired driving offenders.
Risk Factors for Impaired Drivers
Risk factors increase the chance that an impaired driving offender will reoffend with
subsequent impaired driving charges. It is widely accepted (e.g., Cavaiola, Strohmetz, & Abreo,
2007; Cavaiola, Strohmetz, Wolf, & Lavender, 2003; Chang, Lapham, C'de Baca, & Davis,
2001a; Jewell, Hupp, & Segrist, 2008) that the majority of impaired driving offences are
committed by a small group of chronic repeat offenders. Further, prior impaired driving
behaviour is a useful predictor of future impaired driving behaviour; therefore, all impaired
driving offenders are at a relatively high risk of recidivating, regardless of the types of penalties
they initially received (Ahlin, Zador, Rauch, Howard & Duncan, 2011; Taxman & Piquero,
1998).
Impaired drivers tend to be aged 25 to 35 years, male, single, and have a history of
impaired driving convictions and polydrug abuse (Chang et al., 2001a; Hanson, 2009; Perreault,
2013). Specifically, Perreault (2013) found that the highest impaired driving rates occur among

individuals who are 20 to 24 years of age, with the rate slowly declining with age. Further,
approximately 82% of those charged with impaired driving are male; however, since 2005, the
impaired driving rates for females have increased and females now account for 1 in every 6
impaired drivers (Perreault, 2013). In addition, race/ethnicity (Nochajski & Stasiewicz, 2006),
low educational attainment (i.e., less than Grade 12; Chang et al., 2001a) and having a diagnosed
mental disorder (Holt, O’Malley, Rounsaville, & Ball, 2009) have been identified as risk factors
for impaired driving recidivism.
Individuals who have prior DWI arrest and criminal histories are also more likely to
recidivate with an impaired driving offence (Nochajski & Stasiewicz, 2006). Moreover, specific
types of previous criminal offences are more closely linked with recidivism than others. For
example, La Brie, Kidman, Albanese, Peller, and Shaffer (2007) found that DWI offenders with
a history of both crimes against persons and property crimes were twice as likely to reoffend,
generally, and offenders with a history of property crimes were about one and a half times more
likely to recidivate, generally, compared to offenders with only impaired driving offences.
Further, Nochajski and Stasiewicz (2006) found that repeat impaired driving offenders were
more likely to have been involved in other motor vehicle accidents and had more traffic
violations compared to first time impaired driving offenders.
Impaired drivers are also characterized by aggression, hostility, or other undesirable
attitudes and personality traits (Hanson, 2009). Some researchers (Keane, Maxim, & Teevan,
1993) have suggested that impaired driving recidivism is caused by individuals who lack
appropriate levels of self-control to resist drinking and driving.

Screening Instruments and Risk Assessment Tools for Impaired Drivers
Screening Instruments
There are several screening instruments that exist to measure the likelihood of substance
abuse disorders and some (e.g., Alcohol Use Inventory) have attempted to predict DWI
recidivism (DeMichele & Lowe, 2011). Some of the best-rated screening instruments that have
demonstrated predictive validity with DWI recidivism include the Alcohol Use Inventory (AUI;
Horn, Wanberg, & Foster, 2015); MacAndrew Alcoholism Scale; Mortimer-Filkins
Questionnaire; Michigan Alcoholism Screening Test; Life Activities Inventory; and the RIA
Self-Inventory Screening Instrument (Chang, Gregory, & Lapham, 2002). However, past
research (e.g., Anderson, Snow, & Wells-Parker, 2000; Chang et al., 2002; Lowe, 2014) has
found that the majority of previously existing substance abuse screening methods have not been
able to accurately predict general or DWI recidivism. Some of the most common screening
instruments used with DWI offenders will be discussed in the following sections.
Alcohol Use Inventory.
The Alcohol Use Inventory (AUI) is a 228-item screening instrument that consists of 24
scales that investigate behaviour, attitudes, and symptoms related to alcohol use of individuals
who are 16 years of age or older (Horn et al., 2015). The AUI consists of multiple choice
questions and includes 17 primary scales, six second order scales, and a third order broad scale
(Chang, Lapham, & Wanberg, 2001b). The 17 primary scales measure: perceived benefits from
drinking, styles of drinking, consequences of drinking, and concerns about drinking. Similarly,
the six second order scales measure: benefits associated with the use of alcohol, such as drinking
to enhance functioning; styles of drinking, such as obsessive, compulsive, and sustained
drinking; consequences of drinking, such as uncontrolled life disruption; and concerns and

acknowledgement of drinking problems, such as anxiety. The third order scale measures an
individual’s broad involvement with alcohol (Chang et al., 2001b).
Chang et al. (2001a) evaluated the predictive validity of the AUI to determine whether
DWI offenders, grouped according to their reported alcohol involvement on the AUI, would
have differing DWI recidivism rates over a five year follow-up. Based on the six second order
scales, a cluster analysis revealed six groups of offenders (in order of least clinical severity to
highest): low profile, alcohol preoccupation, enhanced, enhanced-disrupt, anxious-disrupt, and
high profile types. Unexpectedly, rates of recidivism did not necessarily increase as the clusters
became more severe. The enhanced-disrupt group had the highest recidivism rate and the
anxious-disrupt and the high profile groups had the second and third highest rates (Chang et al.,
2001a). In particular, offenders in the enhanced-disrupt group had the highest DWI recidivism
rate when it was defined as committing one or more further DWIs, while the anxious-disrupt and
high profile groups had the highest rates of recidivism among offenders who had two or more
DWI offences. On the basis of this study and others (e.g., Chang et al., 2002), it has been
accepted that the AUI has positive predictive validity for the enhanced, enhanced-disrupt, and
anxious-disrupt offenders; however, it is not able to accurately predict recidivism for high profile
offenders. Consequently, much remains to be clarified about the instrument as the low scale
score distributions common in the DWI offender population suggest that the instrument may
require lower cut off points.
MacAndrew Alcoholism Scale.
The MacAndrew Alcoholism Scale (MAS) is a subscale of the Minnesota Multiphasic
Personality Inventory (MMPI) that screens personality characteristics related to alcoholism and
has been used for predicting DWI recidivism (Chang et al., 2002). However, the MAS does not

explicitly mention alcohol and, as a result, respondents can be scored as high risk even if they do
not have any history of drinking. The MAS can detect about 67% of DWI recidivists and
identify an additional 48% as problem drinkers.
The MAS and AUI have both been found to have the best predictive ability to identify
DWI recidivism (Chang et al., 2002). However, the MAS’s psychometric applicability to DWI
screening is not clear as it only assesses alcohol use (Chang et al., 2002). Furthermore, C’de
Baca, Miller, and Lapham (2001) found that the AUI and MAS were not accurate in predicting
which individuals will and will not be rearrested.
Additional DWI screening instruments.
Additional screening instruments that have been used to predict DWI recidivism include
the: Mortimer-Filkins (MF), Michigan Alcoholism Screening Test (MAST), Life Activities
Inventory (LAI), and RIA Self-Inventory Screening Instrument (RIASI; Chang et al., 2002). The
MF was designed for assessing DWI offenders and is used to collect information on: marital and
family problems, recent stress, employment and finances, depression, nervousness, drinking,
feelings, and ability to cope (Chang et al., 2002). The MF has three risk categories: social
drinker, presumptive problem drinker, and problem drinker. In contrast, the MAST is a 24-item
questionnaire that simply detects alcoholism (Chang et al., 2002). The LAI is a more
comprehensive instrument that consists of nine life situation scales (i.e., alcohol quantity
frequency; alcohol problems; physical health; financial/employment; social
interaction/involvement; family status/living situation; marriage; treatment receptivity; and
residential stability) and six personality scales (i.e., extroversion/introversion; sanguine; self-
confident vs. anxious and depressed; moralistic and conservative vs. non-traditional and
unconstrained; improbability; paranoid and suspicious vs. naïve and trustworthy; and conforming

and compliant vs. acting-out and aggressive). It is designed to obtain information on DWI
offenders’ life activities and personality characteristics prior to and during treatment (Chang et
al., 2002). The RIASI was empirically derived from large samples of DWI offenders and
provides a problem-drinking score and a recidivism score (Chang et al., 2002).
Chang et al. (2002) found that the predictive validity for the screening instruments in
their study varied and the receiver operator characteristic curves demonstrated that none of the
instruments met the stringent criteria for predictive validity that would meet the accepted
standard in medical practice. In other words, the screening methods discussed cannot accurately
predict who will and will not recidivate (Chang et al., 2002). The MF and the MAST are the
most widely used tests in the US court system despite the lack of evidence supporting their use
with DWI offender populations (Chang et al., 2002).
Risk Assessment Tools
There are three risk assessment tools that have been used to assess the risk to reoffend for
impaired drivers: the Driver Risk Inventory (DRI; Behaviour Data Systems, Ltd., 1985); the
Impaired Driving Assessment (IDA; DeMichele & Lowe, 2011; Lowe, 2014); and the LSI-OR
(Andrews, Bonta, & Wormith, 1995). Previous research (e.g., Anderson et al., 2000; Lowe,
2014) has indicated that there are no widely used risk assessment tools that exist in the field for
DWI offenders. Thus, the following sections will review the suitability of all three instruments
for predicting DWI recidivism.
Driver Risk Inventory.
The Driver Risk Inventory (DRI; Behaviour Data Systems, Ltd., 1985) is an offender
risk/needs assessment tool that was designed for use with DUI/DWI offenders (Behaviour Data
Systems, Ltd., 1992). The DRI was released in 1985 and is a 140 item, multidimensional,

empirically-based tool that includes five behavioural risk scales (i.e., the truthfulness scale,
alcohol scale, drug scale, driver risk scale, and stress coping abilities scale; Behaviour Data
Systems, Ltd., 2005; Bishop, 2011), as well as items that measure demographic and criminal
history characteristics. The DRI is easily administered, available in English and Spanish, and
consists of true/false and multiple-choice items (Behaviour Data Systems, Ltd., 2005). Risk
level classifications can be calculated for each of the five scales and risk level categories include
designations of low risk, medium risk, problem risk, and severe problem risk (Behaviour Data
Systems, Ltd., 1992). The DRI is useful in identifying problem drinkers, substance abusers, and
high risk drivers, and is able to distinguish between first and repeat DWI offenders (Behaviour
Data Systems, Ltd., 1992; Behaviour Data Systems, Ltd., 2005; Bishop, 2011). The DRI was
updated in 1998 with the addition of a sixth scale (a DSM-IV criteria-based substance
abuse/dependency scale) to create the improved DRI-II (Behaviour Data Systems, Ltd., 2005).
Substance abuse is a maladaptive pattern of substance use that causes significant impairments in
one’s life, whereas dependency is a more severe form of abuse, resulting in tolerance and
withdrawal of the substance that is being abused (American Psychiatric Association, 2000).
Bishop (2011) conducted a study that used the DRI to identify DWI offenders who
recidivated (i.e., DWI re-arrests), within a two year interval, in a sample of Florida DWI
offenders who were charged between January 1, 2008 and December 31, 2009. The DRI
provided accurate identification of DWI recidivists; in particular, the DRI driver risk scale was
the strongest and most consistent predictor of DWI recidivism within 2 years (Bishop, 2011).
The DSM-IV substance abuse and dependency scale also was a significant predictor of DWI
recidivism, with substance dependency providing a greater risk than substance abuse. Finally,

the DRI alcohol scale proved to be a significant identifier of DWI recidivism and had a
predictive capacity similar to other DWI offender screening instruments (Bishop, 2011).
Impaired Driving Assessment.
The Impaired Driving Assessment (IDA) risk assessment tool was developed using
statistical techniques to identify the most parsimonious sets of items from the LSI-R (54 items),
the Alcohol Severity Use Survey (ASUS; 94 items), and the Adult Substance Use and Driving
Survey (ASUDS) on a sample of convicted DWI offenders in the United States (DeMichele &
Lowe, 2011; DeMichele & Payne, 2012; Lowe, 2014). The LSI-R measures offender
characteristics that inform decisions, with respect to the level of service necessary for each
offender, by focusing on their criminogenic needs (Hogg, 2011), while the ASUS is a measure of
substance use patterns and consequences (DeMichele & Lowe, 2011) and assesses the DWI
offender in the areas of substance use/abuse, alcohol involvement, and other areas of life-
adjustment problems (Lowe, 2014).
The IDA consists of two components, a self-report and an evaluator report. The self-
report (SR) component is comprised of 33 questions which measure both retrospective and
current perceptions of conditions related to mental health and mood adjustment, alcohol and
other drug involvement and disruption, social and legal non-conformity, and acknowledgment of
problem behaviours and motivation to seek help for these problems (Lowe, 2014). The evaluator
(ER) component consists of ten questions that provide information around the client’s past DWI
and non-DWI involvement in the judicial system, prior education and treatment, past responses
to DWI education and/or treatment, and the current status of community supervision and
mandated education and/or treatment programs. A total of eight subscales are derived from the

IDA: psychosocial, alcohol and drug involvement, legal non-conformity, acceptance-motivation,
defensiveness, DWI risk-supervision estimate (DRSE), SR general, and ER general.
Lowe (2014) examined the predictive validity of the IDA for DWI offenders’ future
reoffending with a sample of DWI probationers who were tracked for a follow-up period of 12
months from the time they were placed on supervision and administered the IDA. He found that
the eight scales of the IDA have statistically significant relationships with probation failure. For
example, DWI probationers were more likely to fail probation if they had extensive criminal
histories, more mental health and mood adjustment problems, higher levels of alcohol and drug
involvement, more acceptance of their problems caused by impaired driving, and less
defensiveness. As well, probationers who had higher scores on the DRSE scale were much more
likely to fail probation (Lowe, 2014).
Level of Service Inventory-Ontario Revision (LSI-OR).
The Level of Service Inventory-Ontario Revision (LSI-OR) has also been used to assess
the risk of DWI offenders and is the risk assessment tool of interest for this study. The Level of
Service Inventory (LSI) is a popular actuarial criminogenic risk/need assessment tool that has
been adopted by numerous local, state, and provincial jurisdictions in Canada, the United States,
the United Kingdom, and elsewhere (Flores, Lowenkamp, Holsinger, & Latessa, 2006;
Gendreau, Little, & Goggin, 1996; Girard & Wormith, 2004). The original LSI has generated at
least four subsequent versions (e.g., LSI-R, LSI-OR; Girard & Wormith, 2004).
The specific version of the LSI that will be examined in the present study is the Level of
Service-Ontario Revision (LSI-OR; Andrews et al., 1995). The LSI-OR is currently used in
Ontario’s provincial corrections and probation services, and is a theoretically and empirically
developed risk/need assessment tool that is used to predict an offender’s risk of recidivating
(Girard & Wormith, 2004). The tool consists of: a general risk/need section assessing the central
eight dynamic risk factors (43 items); a specific risk/need section used to identify additional risk
factors and criminogenic needs (23 items); and three additional sections (i.e., institutional factors
[10 items], other client issues [18 items], and special responsivity considerations [8 items])
which facilitate case management (Wormith & Hogg, 2012). The resulting scores determine an
offender’s initial risk level (Wormith & Hogg, 2012; please refer to the methods section for a
detailed description of the LSI-OR).
Wormith, Hogg, and Guzzo (2012) examined the predictive validity of the LSI-OR in
assessing impaired driving offenders’ recidivism on a sample of DWI offenders under the
responsibility of the province of Ontario. Wormith et al. (2012) defined recidivism as any
criminal offence that occurred in Ontario for which an offender was returned back into custody.
Importantly, the study examined all types of recidivism, not only DWI recidivism. As well,
analyses were conducted on both DWI offenders and non-DWI offenders in order to compare the
performance of the LSI-OR with DWI offenders to the larger mainstream segment of the
offender population for whom the instrument was originally intended. Interestingly, Wormith et
al. found that DWI offenders were significantly older than other offenders, did not differ on
gender, had a lower offence severity on their index offence, and scored significantly lower on all
LSI-OR summary measures (except strengths). Conversely, the non-DWI offenders had a
significantly higher rate of general reoffending, violent reoffending, and impaired driving
reoffending and reoffended more quickly than DWI offenders. Specifically, the general
recidivism rate for the non-DWI offenders compared to the DWI offenders was 35.1% versus
19.1%, the violent recidivism rate was 13% versus 1.7%, and the impaired driving recidivism
rate was 5.7% versus 2.2%.

Further, Wormith et al. (2012) found that the mean general risk/needs score was lower for
the DWI offenders. The general risk/needs score was highly correlated with general recidivism
on the full sample and the non-DWI sample; however, a significant decrease was illustrated for
DWI offenders (Wormith et al., 2012). This same pattern of results was also found with respect
to violent and DWI recidivism. In addition, correlations for general recidivism with the general
risk/need scores were higher for non-DWI offenders and, of the eight subscales, only criminal
history, education/employment, companions, procriminal attitudes, and antisocial patterns were
significant for DWI offenders.
Similarly, the mean specific risk/needs score was lower for the DWI offenders, while the
specific risk/need section and both of its subscales were moderately correlated with general
recidivism for the full sample and the non-DWI sample but more weakly correlated for the DWI
sample (Wormith et al., 2012). The correlations of the specific risk/need subscales with violent
recidivism were also significant, but were substantially lower, particularly for the DWI
offenders.
Scope of the Present Study
The present study will examine the predictive accuracy of the Level of Service Inventory-
Ontario Revision (LSI-OR) with a sample of impaired drivers who are under the responsibility of
the province of Ontario. In order to effectively manage impaired drivers, it is necessary to
accurately assess their risk, and, if possible, provide rehabilitation options targeted toward their
criminogenic needs. Although impaired drivers are ever present in the criminal justice system,
the research on this population of offenders is less advanced than in many other areas of
corrections. As such, the current study examined the LSI-OR’s ability to predict both general
recidivism and DWI recidivism, wherein it was anticipated that DWI recidivism will be

considerably higher for DWI offenders. As well, analyses were conducted with both DWI
offenders and non-DWI offenders in order to compare the performance of the LSI-OR with DWI
offenders to the larger mainstream segment of the offender population for whom the instrument
was originally intended. In addition, differences in the LSI-OR’s ability to predict recidivism
among DWI offenders who had custody versus community sentences were examined. Thus, the
present study provides new empirical information on the predictive accuracy of the LSI-OR and
its subscales in relation to predicting general reoffending and DWI recidivism among impaired
drivers. Given the lack of consensus in the field about the most appropriate instrument to be
used when conducting risk assessments of impaired driving, such evidence is particularly
important in establishing whether the LSI-OR should be used with DWI offenders.

Method
Participants
Participants included provincial offenders who were under the responsibility of Ontario’s
Ministry of Community Safety and Correctional Services (MCSCS). The sample included all
male and female offenders who were released from custody, were sentenced to a conditional
sentence, or began a probation or intermittent sentence, over two calendar years, 2010 and 2011.
All offenders had been administered an LSI-OR in conjunction with their sentence. The original
dataset consisted of 90,781 (77,790 community and 12,991 custody) cases. However, many
offenders appeared more than once for various reasons (e.g., having more than one LSI-OR
assessment, appearing in both custody and community datasets). To reconcile this, an offender’s
first release from custody or first admission to conditional or probation or intermittent sentence,
whichever was earlier, was used to screen out duplicates. In addition, for offenders who had
more than one LSI-OR assessment on file, the first assessment was chosen to screen out
duplicates, resulting in each offender being represented only once in the final dataset. The total
sample included 72,726 offenders, consisting of 64,089 community offenders and 8,637 custody
offenders. The community offenders were comprised of 55,976 on probation and 8,113 on
conditional sentences. The total sample included both DWI offenders and non-DWI offenders
based on their index offence.
The DWI offenders were a cohort of the total sample and were identified by those
offenders who were convicted of any DWI index offence(s). These offences included: impaired
driving; refuse a breath sample; impaired driving over 80 mg; impaired driving causing bodily
harm; and impaired driving causing death. A total of 4,009 (5.5%) of the total sample were DWI
offenders, consisting of 3,367 (84%) males and 641 (16%) females. Among the DWI offenders,
3,674 (91.6%) were charged with only one DWI offence; although, 317 (7.9%) offenders were
charged with two, 16 (.4%) were charged with three, and 2 (.05%) were charged with four DWI
offences. The type of disposition that DWI offenders were serving included: 691 (17.2%)
custody sentences; 3,092 (77.1%) probation sentences; and 226 (5.6%) conditional sentences.
The non-DWI offenders were the remaining offenders in the sample who had not been
convicted of an index impaired driving offence. There were a total of 68,717 (94.5%) non-DWI
offenders in the sample, consisting of 56,720 (82.6%) males and 11,975 (17.4%) females. Data
on gender was missing for 22 offenders. The type of disposition the non-DWI offenders were
serving included: 7,946 (11.6%) custody sentences; 52,884 (77%) probation sentences; and
7,887 (11.5%) conditional sentences.
Furthermore, in order to determine if select LSI-OR items or demographic variables can
be used to enhance the prediction of DWI recidivism, construction and validation samples of the
total sample, and DWI and non-DWI offenders were created and prediction models were used to
establish and validate computed logistic binary and weighted LSI-OR and computed multiple
regression (MR) binary and weighted LSI-OR/demographic DWI recidivism prediction
variables. To create the construction and validation samples, the cohort was randomly split into
two approximately equal sections, 51% and 49%, respectively. Specifically, the construction
sample consisted of 2,045 DWI and 34,224 non-DWI offenders while the validation sample was
comprised of 1,964 DWI and 34,493 non-DWI offenders. The computed DWI recidivism
prediction variables were developed with the DWI construction sample, and applied to, and
validated on, the DWI construction, DWI validation, and non-DWI construction and validation
samples, providing information about the predictive validity of the scales for the various groups.

Materials/Measures
Offender Information and Tracking System (OTIS)/LSI-OR.
All data was extracted from Ontario’s MCSCS Offender Information and Tracking
System (OTIS) through their statistical reporting system. The MCSCS uses the computerized
file system of OTIS to maintain all offender records and includes information that is used to
manage an offender from the beginning until the end of their sentence. Examples of the type of
data collected included: demographic variables (e.g., gender, date of birth, race, Aboriginal
status); variables related to the index sentence and admission (e.g., most serious offence,
sentence start date); substance abuse variables (e.g., evidence of impairment at admit, history of
substance abuse); impaired driving variables (e.g., impaired driving charges, refusing a breath
sample, and impaired driving over 80 mg); LSI-OR variables (e.g., total score, risk level,
override risk levels); and recidivism variables (please see below).
LSI-OR.
An automated version of the LSI-OR was introduced into the MCSCS in 1997 which
allowed staff to enter all details of their assessment into an electronic record for scoring and
record keeping (Wormith et al., 2012). The LSI-OR is administered to all adult offenders who
are sentenced to custody and to all adult probationers and parolees in Ontario (Andrews et al.,
1995). A considerable body of literature (e.g., Andrews & Bonta, 1995; Flores et al., 2006;
Gendreau et al., 1996; Girard & Wormith, 2004; Hogg, 2011; Olver, Stockdale, & Wormith,
2014; Wormith, Hogg, & Guzzo, 2015) has demonstrated that the LSI and its subsequent
versions are reliable and valid risk assessment tools that demonstrate predictive validity with
various offender subgroups (e.g., women, Aboriginal offenders, sex offenders).

The tool includes a general risk/need section which consists of 43 items that are
organized into the central eight subscales: criminal history (8 items), procriminal
attitude/orientation (4 items), antisocial patterns/cognitions (4 items), companions/associates (4
items), family/marital (4 items), education/employment (9 items), leisure/recreation (2 items),
and substance abuse (8 items; Wormith & Hogg, 2012). These items are scored dichotomously
(0 = not present; 1 = present) and the information is gathered from file reviews and client
interviews, which are totalled to create eight domain scores and a total general risk/need score
(Wormith & Hogg, 2012; Girard & Wormith, 2004). Scores are used to determine an offender’s
initial risk level on a five-point ordinal scale ranging from very low risk to very high risk
(Wormith & Hogg, 2012). Specifically, total scores of zero to four correspond with very low
risk, five to ten with low risk, 11 to 19 with medium risk, 20 to 29 with high risk, and 30 to 43
with very high risk (Orton, 2014). As well, a strength score (i.e., a strength or protective factor
for the offender) can be derived from the simple summation of strengths across the central eight
domains (Andrews et al., 2004). Any of the eight subscales where offenders do not have risk
factors are considered strength factors and a total strength score can be created for each offender
ranging from zero to eight (Orton, 2014). In addition, there are provisions within the instrument
that allow for a clinical override of the initial risk level, in either direction, to create a final risk
level (Girard & Wormith, 2004; Wormith & Hogg, 2012).
The LSI-OR also has a specific risk/need section that contains two subscales, personal
problems with criminogenic potential (14 items) and history of perpetration (9 items), which is
scored dichotomously, as described above (Girard & Wormith, 2004). These scales are used to
identify additional risk factors and criminogenic needs and guide assessors as to whether they
should override the initial risk level (Wormith & Hogg, 2012). There are three additional

sections which facilitate case management: institutional factors (10 items; records problems and
management issues during previous incarceration), other client issues (18 items; includes social,
health, and mental health issues), and special responsivity considerations (8 items; includes
characteristics such as ethnicity, cognitive disabilities, and personality features; Wormith &
Hogg, 2012). All electronic LSI-OR variables (e.g., total score, initial risk, override risk) were
collected.
Recidivism.
Recidivism was the outcome variable of interest in the current study. An offender
qualified for recidivism if he/she was returned to custody or community supervision: 1) for an
offence committed following release from custody; and/or 2) for an offence committed during or
following a community sentence. Only an offender’s first recidivistic event was captured in the
study. Recidivism information was collected from OTIS, which documents all criminal offences
that occur in Ontario. Thus, any offences committed in other provinces and convictions that
resulted in sentences other than incarceration (e.g., alternative measures) were not included. A
total of five measures of recidivism were used. A dichotomous variable (0 = no, 1 = yes) which
identified those who did or did not recidivate during the follow-up period (on average,
approximately 2-3 years) for both general and DWI recidivism (i.e., offenders who received the
following charges: impaired driving; refuse a breath sample; impaired driving over 80 mg;
impaired driving causing bodily harm; and impaired driving causing death) constituted the first
and second recidivism variables employed in the study.
The third recidivism variable was the time to recidivate or lapse time, which was
represented by the number of days from an offender’s release date until the date of reoffence or
re-entry into custody or community supervision (for the custody sample) and the number of days

from an offender’s sentence start date until the date of reoffence or re-entry into custody or
community supervision (for the community sample) up until the data extraction date. The
follow-up period for the custodial offenders could be as early as January 2010 or as late as July
2014, with the follow-up period varying for each offender based on their release date. The
follow-up period for the community offenders ranged from January 2010 until December 2013,
with the follow-up period varying for each offender based on their community sentence start
date.
The fourth recidivism variable was reoffence severity level, which includes 26 categories
of offences that are rank ordered according to the mean sentence length for each offence
category (Ontario, 1983). These offences were reverse coded so that higher scores represent
higher offence severity levels. Finally, the fifth recidivism variable examined the type of
disposition sentence (e.g., probation, custody) that the offenders received for recidivating.
University of Saskatchewan Research Ethics Board application and approval.
An application to gain ethical approval for the study was submitted to the University of
Saskatchewan’s Behavioural Research Ethics Board was granted on February 6, 2015 (see
Appendix A).
Procedure
All offenders who had served and were released from a custodial sentence in 2010 and
2011 or who were admitted to a conditional sentence or probation in 2010 and 2011 and had
been administered an LSI-OR were identified from MCSCS’s OTIS. All personal identifiers
were removed before the data was transferred from the Ministry to the principal investigator and
all offenders were designated a unique case number. The data was collected for all offenders
through OTIS including descriptive information, admission and sentence information, LSI-OR

information, and recidivism information. The data from the custody and the community files
were merged by offender case number.
In addition, data that identified offenders who had received impaired driving charges was
extracted from OTIS. This data file was merged with the first two data files by case number and
sentence start date, creating a single data file for data analysis. Once all three files were merged,
the data was screened for outliers, data entry errors, and missing data. Next, offenders that
appeared more than once in the database were removed so that an offender only appeared once in
analyses. Further, the offence severity category levels were reverse coded so that higher scores
corresponded with higher severity levels. As well, the impaired driving variables were used to
create DWI and non-DWI offender groups and a dichotomous variable of DWI recidivism was
created from a variable that specified recontact impaired driving convictions. The final data file
included descriptive information, admission and sentence information, LSI-OR total and item
scores, and the five measures of recidivism.
The dataset was randomly divided into two samples (construction and validation) for the
development and validation of the computed logistic binary and weighted and the computed MR
binary and weighted LSI-OR and LSI-OR/demographic predictor variables. There were a total
of eight variables created. To create the first two variables, first, each LSI-OR item was
correlated with DWI recidivism and the items that exhibited a significant correlation were
entered into a stepwise logistic regression. From here, the variables that emerged as significant
predictors were added together to compute the logistic binary and weighted LSI-OR predictor
variables. The logistic binary variable was created by summing together the original unweighted
data (where possible data points were 0 and 1), while the weighted variable was calculated by
applying the unstandardized beta weights to each item and summing together the weighted

figures. To create the next two variables, each LSI-OR item was correlated with DWI recidivism
and the items that exhibited a significant correlation were entered into a stepwise MR. From
here, the variables that were found to be significant predictors were added together to compute
the MR binary and weighted LSI-OR predictor variables in the same fashion as above. The
correlations were also assessed between DWI recidivism and the MCSCS substance abuse
variables. There were no significant correlations; therefore, these variables were dropped from
further analyses.
A similar procedure was carried out to create the next four variables. Specifically, three
demographic variables (i.e., age, gender, race), along with the significant items of the LSI-OR
that were previously found were entered into a stepwise logistic regression. From here, the
variables that emerged as significant predictors were added together to compute the logistic
binary and weighted LSI-OR/demographic predictor variables. To create the remaining two
variables, the three demographic variables, along with the significant items of the LSI-OR that
were previously found were entered into a stepwise MR. Again, the variables that were found to
be significant predictors were added together to compute the MR binary and weighted LSI-
OR/demographic predictor variables.
Each of the new variables were applied on various occasions (e.g., the DWI construction
sample, the DWI validation sample, the non-DWI offender sample). This permitted a
comparison of predictive accuracy of offenders by sample type. The construction and validation
samples allowed for the predictor variables to be generated and then validated on a second
independent sample, where predictive validity coefficients are less likely to capitalize upon
chance associations.

Analytic Approach
The statistical analyses for this study were conducted using the IBM Statistical Package
for the Social Sciences (SPSS). Descriptive statistics (e.g., frequencies, means, and standard
deviations) were obtained to describe characteristics (e.g., gender, marital status, type of
sentence) of the DWI and non-DWI offenders (for both the custody and community offenders),
as well as the characteristics within the DWI offenders by offence type (i.e., impaired driving;
refuse a breath sample; impaired driving over 80 mg; impaired driving causing bodily harm; and
impaired driving causing death). Thus, although the focus of the current study was on DWI
offenders, many analyses were conducted on both DWI and non-DWI offenders for both the
community and custody samples.
T-tests & Chi-Squares.
T-tests and chi-squares were used to measure significant differences between the
combinations of the demographic variables (e.g., age, offence severity level, total days served,
race), recidivism variables (e.g., DWI and general yes/no recidivism, offence severity level, DWI
recidivism charges), LSI-OR variables (e.g., general risk/need factors total score, total strength
score, initial risk level, final risk level after override, central eight total scores), and type of
offender (e.g., DWI and non-DWI custody and community offenders).
Correlations.
Correlations were utilized to assess relationships between the LSI-OR variables (e.g.,
general risk/need factors total score, total strength score, initial risk level, final risk level after the
override, central eight total scores) and both general and DWI recidivism. This was examined
for both custody and community DWI and non-DWI offender groups. In addition, to create the
DWI recidivism prediction variables, correlations were conducted between DWI recidivism and:

1) the individual items of the LSI-OR; 2) demographic variables; 3) the MCSCS substance abuse
variables; and 4) the number of impaired driving recidivistic events in their follow-up period for
the DWI construction sample. Further, correlations between the newly computed logistic binary
and weighted and MR binary and weighted LSI-OR and LSI-OR/demographic predictor
variables and DWI recidivism were analysed for the construction, validation, and DWI and non-
DWI offender samples. These correlations allowed for a determination of how well the new
predictor variables predicted DWI recidivism in the samples by identifying the magnitude of the
relationship between the new variables and DWI recidivism.
Validity.
Predictive validity was assessed with receiver operator curves (ROC; Hanley & McNeil,
1983) analyses to generate area under the curve (AUC) values to examine how well the LSI-OR
variables predict general and DWI recidivism for both the custody and community DWI and
non-DWI offender groups. In addition, ROC analyses were used to measure predictive accuracy
for the eight predictor variables on DWI recidivism. As previously mentioned, due to the low
base rates for DWI recidivism, AUC values are most appropriate for this dependent variable
because they are unlikely to be influenced by base rates (but a lack of power may limit their
ability to detect an effect).
Item Stepwise Logistic Regression.
In order to determine which items added significantly to the prediction of DWI
recidivism, stepwise logistic regression was employed with each of the individual items of the
LSI-OR that had a significant correlation with DWI recidivism. Items that emerged as
significant predictors were used to create the logistic binary and weighted LSI-OR predictor
variables. Stepwise logistic regression was also used with the significant predictors that emerged

from the individual items of the LSI-OR and the three demographic variables (i.e., gender, age,
and race) that were significantly correlated with DWI recidivism. Items that emerged as
significant predictors were used to create the logistic binary and weighted LSI-OR/demographic
predictor variables.
Item Stepwise Multiple Regression (MR).
In order to determine which items added significantly to the prediction of DWI
recidivism, an alternative stepwise MR was employed with each of the individual items of the
LSI-OR that had a significant correlations with DWI recidivism. Items that emerged as
significant predictors were used to create the MR binary and weighted LSI-OR predictor
variables. Stepwise MR was also used with the significant predictors that emerged from the
individual items of the LSI-OR and the three demographic variables (i.e., gender, age, and race)
that were significantly correlated with DWI recidivism. Items that emerged as significant
predictors were used to create the MR binary and weighted LSI-OR/demographic predictor
variables. While binary stepwise logistic regression is the most appropriate analysis to conduct
to establish the predictor variables given the binary DWI recidivism (yes/no) employed as the
dependent variable, conducting a stepwise MR allowed for an examination of the strength of
each statistical method vis-à-vis the other.

Results
The total sample included 72,726 (4,009 DWI, 68,717 non-DWI) offenders. A majority
of the offenders in the sample were serving community sentences, and a large proportion of these
offenders had been sentenced to probation. A small minority of offenders were serving
intermittent sentences: 68 (1.7%) of the DWI offenders and 405 (0.6%) of the non-DWI
offenders. For the purposes of the current study, offenders serving intermittent sentences were
included under the umbrella of “community” as they served the majority of their time in that
context. Table 1 illustrates the number of offenders in the total sample, as well as in the DWI
and non-DWI offender groups, by the type of disposition.
Table 1. Total number of DWI and non-DWI offenders by disposition type Disposition Type Total Sample
(N=72726) DWI Offenders
(n=4009) Non-DWI Offenders
(n=68717) Custody 8637 691 7946 Community: 64089 3318 60771
Probation 55976 3092 52884 Conditional Sentence 8113 226 7887
DWI Offenders
The DWI offender sample consisted of 4,009 offenders. DWI offenders in our sample
were convicted of the following index charges: 2,640 for impaired driving; 372 for refusing a
breath sample; 1,263 for impaired driving over 80 mg; 33 for impaired driving causing bodily
harm; and 10 for impaired driving causing death. There was total of 691 DWI custody
offenders; 457 were charged with impaired driving, while 98 refused a breath sample, 210 were
charged for impaired driving over 80 mg, 13 were charged with impaired driving causing bodily
harm, and six were charged with impaired driving causing death. When examining the 3,318
DWI community offenders, 2,183 were charged with impaired driving, 274 refused a breath

sample, 1,053 were charged for impaired driving over 80 mg, 20 were charged with impaired
driving causing bodily harm, and four were charged for impaired driving causing death. Table 2
displays the breakdown of each offence by the number of charges an offender had on file.
Table 2. Total number of DWI charges by the type of DWI Charge
DWI Charges All DWI Offenders (n=4009)
DWI Custody Offenders (n=691)
DWI Community Offenders (n=3318)
Type and Number of Charges:
Impaired driving: 1 2608 425 2183 2 30 30 -- 3 2 2 -- Refuse breath sample:
1 368 94 274 2 4 4 -- Impaired driving over 80 mg:
1 1256 203 1053 2 6 6 -- 3 1 1 -- Impaired causing bodily harm:
1 33 13 20 Impaired causing death:
1 10 6 4
In terms of the number of index impaired driving charges for which offenders were
convicted, 3,674 (91.6%) offenders had one charge; 317 (7.9%) had two charges; 16 (0.4%) had
three charges; and two (.05%) had four charges. The number of impaired driving charges for
which the DWI custody offenders were convicted was as follows: 568 (82.2%) offenders had one
charge; 109 (15.8%) had two charges; 12 (1.7%) had three charges; and two (.3%) had four

charges. With respect to the DWI community offenders, 3,106 (93.6%) of the offenders had one
charge; 208 (6.3%) had two charges; and 4 (.1%) had three charges.
DWI and Non-DWI Offenders on Demographic Characteristics, Substance Abuse
Variables, LSI-OR, and Recidivism
Descriptive and demographic characteristics were calculated for both DWI and non-DWI
offenders (see Table 3). On average, DWI offenders were older than non-DWI offenders, with a
mean age of 41 years compared to 34 years, respectively. There were more males in both
groups; females represented 16% of the DWI sample and 17.4% of the non-DWI sample. A
large majority of offenders in both groups were Caucasian (i.e., 75.2% of the DWI sample and
68.8% of the non-DWI sample). There was also a large representation of Aboriginal offenders in
both samples. Specifically, 5% of the DWI sample was Aboriginal and 9.3% of the non-DWI
sample was Aboriginal. In the DWI group, there was a large representation of South Asian
offenders compared to the non-DWI group (5.5% versus 2.7%) and, in the non-DWI group, there
was a large representation of Black offenders compared to the DWI sample (9.1% versus 3.6%).
The other ethnicities represented in both samples included: East Asian, Hispanic, Southeast
Asian, and West Asian/Arabic. Other minority, unknown, and declined to specify categories
were also included for offenders in both groups. In addition, the non-DWI offenders had higher
index offence severity levels compared to the DWI offenders. The average sentence length was
398.16 days for the DWI offenders and 444.94 days for the non-DWI offenders.

Table 3. Comparisons of DWI Offenders and non-DWI offenders on demographic characteristics
Demographic Characteristics
DWI (n=4009)
Non-DWI (n=68717)
t-tests and Chi Squares
Mean (SD) or n (%)
Mean (SD) or n (%)
Age: 40.78 (12.38) 33.59 (11.91) t (4450.73) = -35.8, p < .001
Gender: Male 3367 (84%) 56720 (82.6%) Female 641 (16%) 11975 (17.4%) 2(1) = 5.47, = p = .019 Race: Aboriginal 178 (5%) 5810 (9.3%) 2(10) = 330.65, = p < .001 Black 128 (3.6%) 5713 (9.1%) Caucasian 2686 (75.2%) 43130 (68.8%) Declined to Specify
6 (0.2%) 246 (0.4%)
East Asian 71 (2%) 1141 (1.8%) Hispanic 57 (1.6%) 840 (1.3%) Other Minority 103 (2.9%) 1595 (2.5%) South Asian 198 (5.5%) 1665 (2.7%) Southeast Asian 49 (1.4%) 815 (1.3%) Unknown 61 (1.7%) 740 (1.2%) West Asian/Arabic
33 (0.9%) 965 (1.5%)
Most Serious Offence (MSO) Severity Level
10 (3) 16 (4) t (5037.15) = 131.41, p < .001
Sentence Length 398.16 (219.52)
444.94 (215.50) t (4470.54) = 13.13, p < .001
The MCSCS records information (e.g., alerts, treatment history) on OTIS that is collected
at admission to custody for custodial offenders and by probation officers for community
offenders. For the purposes of this study, we analyzed five variables of interest: substance abuse
alerts; offender history of substance abuse; evidence of impairment at admit; evidence at
withdrawal at admit; and history of substance abuse treatment (see Table 4). As expected, the
DWI offenders were more likely to present with substance-related problems, a history of

substance abuse and substance abuse treatment, and being impaired at admit. However, the DWI
offenders were less likely to show evidence of withdrawal at admit compared to the non-DWI
offender group.
Table 4. Comparisons of DWI Offenders and non-DWI offenders on substance abuse variables
Substance Abuse Variables
DWI (n=4009)
n (%)
Non-DWI (n=68717)
n (%)
Chi Squares
Substance Abuse Alert 1728 (53.4%) 21829 (34.6%) 2(1) = 474.85, = p < .001 History of Substance Abuse 1252 (38.7%) 17839 (28.3%) 2(1) = 162.78, = p < .001 Impairment at Admit 288 (8.9%) 1859 (2.9%) 2(1) = 348.24, = p < .001 Withdrawal at Admit 69 (2.1%) 2433 (3.9%) 2(1) = 25.21, = p < .001 Substance Abuse Treatment 378 (11.7%) 4058 (6.4%) 2(1) = 135.86, = p < .001
LSI-OR variables, including the general risk/need total and strength score, their
corresponding risk levels (both before and after the use of the override function), and the eight
subscales of the general risk/need section and their corresponding strength scores, were
calculated for DWI and non-DWI offenders (Table 5). DWI offenders scored significantly lower
on all LSI-OR summary measures, with the exception of most strength scores and substance
abuse scores (see Figure 1). As well, DWI offenders scored significantly lower on the measure
of risk level change, indicating that the use of the override feature to increase their risk level
occurred significantly less often than it did for non-DWI offenders.

Table 5. Comparisons of DWI Offenders and non-DWI offenders on LSI-OR variables
LSI-OR Variables DWI (n=4009)
Mean (SD)
Non-DWI (n=68717)
Mean (SD)
t-tests
General Risk/Needs 12.0 (7.2) 14.44 (8.98) t (4767.66) = 20.56, p < .001 Strength .93 (1.54) .85 (1.47) t (4443.4) = -3.38, p = .001 Initial Risk Level 2.56 (0.95) 2.82 (1.12) t (4686.04) = 16.73, p < .001 Risk Override .25 (.88) .46 (1.17) t (4879.63) = 14.47, p < .001 Final Risk Level (after override)
2.63 (0.95) 2.98 (1.07) t (4623.42) = 22.23, p < .001
A1: Criminal History 2.38 (2.27) 2.7 (2.51) t (4599.25) = 8.47, p < .001 A1: Strength .13 (.33) .14 (.35) t (4530.17) = 2.37, p = .018 A2: Education/ Employment
2.14 (2.31) 3.4 (2.79) t (4714.89) = 33.13, p < .001
A2: Strength .25 (.44) .19 (.39) t (4397.22) = -9.04, p < .001 A3: Family/Marital 1.04 (1.02) 1.49 (1.14) t (4608.08) = 26.73, p < .001 A3: Strength .18 (.39) .15 (.36) t (4428.99) = -4.32, p < .001 A4: Leisure/ Recreation
.99 (.74) 1.16 (.75) t (4496.81) = 13.84, p < .001
A4: Strength .07 (.25) .06 (.24) t (4426.19) = -2.28, p = .023 A5: Companions .72 (.93) 1.23 (1.08) t (4652.17) = 33.6, p < .001 A5: Strength .1 (.29) .07 (.26) t (4380.47) = -4.81, p < .001 A6: Procriminal Attitude/Orientation
.62 (.95) 1.0 (1.16) t (4726.48) = 24.13, p < .001
A6: Strength .11 (.32) .09 (.29) t (4417.41) = -3.53, p < .001 A7: Substance Abuse 3.71 (1.87) 2.72 (2.45) t (4843.64) = -31.77, p < .001 A7: Strength .05 (.22) .1 (.3) t (4915.83) = 13.21, p < .001 A8: Antisocial Pattern .4 (.67) .74 (.92) t (4931.43) = 30.85, p < .001 A8: Strength .04 (.2) .04 (.19) t (4433.5) = -1.52, p = .129

Figure 1. Comparisons of the Means on LSI-OR Variables for DWI Offenders and non-DWI Offenders.
The five recidivism variables were also calculated for DWI and non-DWI offenders (see
Table 6). In total, 22,198 offender’s recidivated; specifically, 788 DWI offenders and 21,410
non-DWI offenders. Non-DWI offenders had a significantly higher rate of general recidivism
compared to the DWI offenders; the general recidivism rate for the DWI offenders was 19.7%
and 31.2% for the non-DWI offenders. However, the DWI offenders had significantly higher
rates of DWI recidivism compared to the non-DWI sample. That is, the DWI recidivism rate for
the DWI offenders was 3.6% compared to 0.7% for the non-DWI offenders. Interestingly, the
DWI offenders recidivated generally at less than two thirds the rate of the non-DWI offenders
while their DWI recidivism rate is five times more than the non-DWI offenders. The average
lapse time for the non-DWI offenders was 285 days and 322 days for the DWI offenders,
indicating that the non-DWI offender’s recidivated significantly quicker. As well, the non-DWI
offenders had higher index offence severity levels compared to the DWI offenders. The majority
of offenders in both groups received custodial sentences for their recontact offence; although,
0
0.5
1
1.5
2
2.5
3
3.5
4
A1 A2 A3 A4 A5 A6 A7 A8
DWI Offenders Non‐DWI Offenders

121 DWI recidivists and 1, 138 non-DWI recidivists received an intermittent sentence for their
new offence.
Table 6. Comparisons of DWI Offenders and non-DWI offenders on Recidivism variables
Recidivism Variables DWI (n=4009)
Non-DWI (n=68717)
t-tests and Chi Squares
Mean (SD) or n (%)
Mean (SD) or n (%)
Recidivism 788 (19.7%) 21410 (31.2%) 2(1) = 236.27, = p < .001 DWI Recidivism 146 (3.6%) 464 (.7%) 2(1) = 400.81, = p < .001 Lapse Time 322.43 (211.39) 284.55 (202.07) t (857.49) = -4.99, p < .001 New Sentence Type:
Custody 454 (56.5%) 11786 (54.7%) 2(2) = 2.56, = p = .278 Probation 304 (37.9%) 8273 (38.4%) Conditional Sentence 45 (5.6%) 1497 (6.9%)
New Most Serious Offence (MSO) Severity Level
3 (6) 5 (7) t (4884.76) = 22.57, p < .001
Sentence Length 205.4 (246.66) 208.53 (261.83) t (869.51) = .35, p = .725
DWI and Non-DWI Custody Offenders on Demographic Characteristics, Substance Abuse
Variables, LSI-OR, and Recidivism
Descriptive and demographic characteristics were calculated for DWI and non-DWI
custody offenders (see Table 7). DWI custody offenders are significantly older compared to the
non-DWI custody offenders. The majority in both groups were males, with females representing
only 2.9% of the DWI custody sample and 6.6% of the non-DWI custody sample. A large
majority of offenders in both groups were Caucasian and there was a large representation of
Aboriginal offenders in both samples. Specifically, 9.6% of the DWI custody sample was
Aboriginal and 12% of the non-DWI custody sample was Aboriginal. In the non-DWI custody
group, there was also a large portion of Black offenders (10.1%). The release dates for the
offenders ranged from January 2, 2010 to December 30, 2011 for the DWI custody sample and

from January 1, 2010 to December 31, 2011 for the non-DWI custody sample. Non-DWI
custody offenders had significantly higher index offence severity levels compared to the DWI
offenders. Correspondingly, the non-DWI custody offenders served significantly more days
incarcerated compared to the other group, 166 compared to 126 days, respectively. The total
days served for the DWI custody group ranged from 13 days to 1,589 days and from zero to
3,377 days for the non-DWI custody group. The average sentence length was 171.09 days for
the DWI custody offenders and 225.34 days for the non-DWI custody offenders.
Table 7. Comparisons of DWI and non-DWI custody offenders on demographic characteristics Demographic Variables DWI
Custody (n=691)
Non-DWI Custody (n=7946)
t-tests and Chi Squares
Mean (SD) or n (%)
Mean (SD) or n (%)
Age: 42.99 (11.39) 34.28 (11.37) t (814.35) = -19.28, p < .001
Gender: Male 671 (97.1%) 7424 (93.4%) 2(1) = 14.53, = p < .001 Female 20 (2.9%) 521 (6.6%) Race: Aboriginal 66 (9.6%) 957 (12%) 2(10) = 62.21, = p < .001 Black 15 (2.2%) 806 (10.1%) Caucasian 513 (74.2%) 5175 (65.1%) Declined to Specify
-- 20 (0.3%)
East Asian 9 (1.3%) 83 (1%) Hispanic 7 (1.0%) 76 (1%) Other Minority 12 (1.7%) 175 (2.2%) South Asian 16 (2.3%) 102 (1.3%) Southeast Asian 9 (1.3%) 99 (1.2%) Unknown 37 (5.4%) 373 (4.7%) West Asian/Arabic
7 (1.0%) 80 (1%)
Most Serious Offence (MSO) Severity Level
12 (4) 19 (5) t (863.36) = 39.18, p < .001

Total days served 125.62
(111.39) 165.8 (153.71) t (935.22) = 8.78, p < .001
Sentence Length 171.09
(128.76) 225.34 (164.98) t (899.48) = 10.36, p < .001
Compared to the non-DWI custody offenders, the DWI custody offenders were more
likely to present with substance abuse problems, have a history of both substance abuse and
substance abuse treatment, and be assessed as impaired at admit (see Table 8). However, the
DWI custody offenders were less likely to be undergoing withdrawal at admit, compared to the
non-DWI custody offenders.
Table 8. Comparisons of DWI and non-DWI custody offenders on substance abuse variables
Substance Abuse Variables
DWI Custody (n=691)
Non-DWI Custody (n=7946)
Chi Squares
n (%) n (%) Substance Abuse Alert 363 (60.7%) 3752 (49.1%) 2(1) = 30.05, = p < .001 History of Substance Abuse 298 (49.8%) 3164 (41.4%) 2(1) = 16.29, = p < .001 Impairment at Admit 48 (8%) 370 (4.8%) 2(1) = 11.71, = p = .001 Withdrawal at Admit 30 (5%) 635 (8.3%) 2(1) = 8.08, = p = .004 Substance Abuse Treatment 72 (12%) 724 (9.5%) 2(1) = 4.21, = p = .040
DWI custody offenders scored significantly lower on the LSI-OR summary measures,
with the exception of most strength scores, criminal history, and substance abuse. Although
DWI custody offenders had lower scores on criminal history compared to the non-DWI custody
offenders, this difference did not approach significance. Similar to the previous finding, DWI
custody offenders scored significantly lower on the measure of risk level change, indicating that
the use of the override feature to increase their risk level occurred significantly less often than it
did for non-DWI custody offenders (see Table 9).

Table 9. Comparisons of DWI and non-DWI custody offenders on LSI-OR variables
LSI-OR Variables DWI Custody (n=691)
Non-DWI Custody (n=7946)
t-tests
Mean (SD) Mean (SD) General Risk/Needs 18.93 (7.3) 22.26 (8.97) t (881.93) = 11.26, p < .001 Strength .4 (.94) .36 (.93) t (811.45) = -1.11, p = .269 Initial Risk Level 3.39 (0.84) 3.73 (1.0) t (867.68) = 9.95, p < .001 Risk Override .21 (.9) .33 (1.09) t (875.26) = 3.06, p = .002 Final Risk Level 3.43 (0.85) 3.8 (.96) t (849.34) = 10.99, p < .001 A1: Criminal History 4.89 (1.7) 4.97 (2.27) t (920.72) = 1.15, p = .25 A1: Strength .02 (.15) .03 (.18) t (883.34) = 1.99, p = .047 A2: Education/ Employment
3.12 (2.58) 4.88 (2.7) t (827.43) = 17.16, p < .001
A2: Strength .14 (.35) .09 (.29) t (773.21) = -3.78, p < .001 A3: Family/Marital 1.43 (1.11) 1.86 (1.2) t (836.76) = 9.65, p < .001 A3: Strength .08 (.27) .08 (.27) t (820.82) = .387, p = .699 A4: Leisure/ Recreation
1.42 (.69) 1.61 (.63) t (793.39) = 6.75, p < .001
A4: Strength .04 (.19) .03 (.17) t (784.19) = -1.23, p = .22 A5: Companions 1.32 (1.02) 1.9 (1.0) t (813.58) = 13.52, p < .001 A5: Strength .04 (.19) .03 (.17) t (785.95) = -1.18, p = .238 A6: Procriminal Attitude/Orientation
1.22 (1.21) 1.71 (1.29) t (831.96) = 10.11, p < .001
A6: Strength .04 (.2) .04 (.18) t (791.25) = -1.02, p = .309 A7: Substance Abuse 4.67 (1.69) 3.93 (2.6) t (1002.51) = -10.45, p < .001 A7: Strength .03 (.16) .05 (.21) t (922.37) = 3.42, p = .001 A8: Antisocial Pattern .85 (.88) 1.43 (1.09) t (885.02) = 16.24, p < .001 A8: Strength .01 (.11) .01 (.10) t (800.69) = -.298, p = .766
In total, 5,615 custody offenders recidivated; specifically, 210 DWI custody offenders
and 3,505 non-DWI offenders (see Table 10). Non-DWI custody offenders had significantly
higher rates of recidivism compared to the DWI custody offenders, 44.1% compared to 30.4%.
However, the DWI custody offenders had significantly higher rates of DWI recidivism compared
to the non-DWI custody sample (4.3% versus .7%). The recontact sentence start date for the
DWI custody offenders ranged from March 11, 2010 to July 7, 2014 and from January 25, 2010
to July 10, 2014 for the non-DWI custody offenders. DWI custody offenders were at risk in the

community for a range of 3 to 1,137 days, while the non-DWI custody offenders’ lapse time
ranged from 1 to 1,177 days. The average lapse time for the non-DWI custody offenders was
316 days, and 374 days for the DWI custody offenders, indicating that the non-DWI custody
offenders recidivated in significantly less time. As well, the non-DWI custody offenders had
higher index offence severity levels compared to the DWI custody offenders. A majority of
offenders in both groups (74.2% DWI and 79.5% non-DWI custody) received subsequent
custodial sentences for their recontact offence; a total of 37 DWI custody and 314 non-DWI
custody offenders received an intermittent sentence for their recontact offence.
Table 10. Comparisons of DWI and non-DWI custody offenders on recidivism variables
Recidivism Variables DWI Custody (n=691)
Non-DWI Custody (n=7946)
t-tests and Chi Squares
Mean (SD) or n (%)
Mean (SD) or n (%)
Recidivism 210 (30.4%) 3505 (44.1%) 2(1) = 48.82, = p < .001 DWI Recidivism 30 (4.3%) 58 (.7%) 2(1) = 82.22, = p < .001 Lapse Time 373.61 (233.78) 316.2 (223.61) t (249.92) = -3.58, p < .001 New Sentence Type:
Custody 167 (74.2%) 2903 (79.5%) 2(2) = 5.33, = p = 0.070 Probation 49 (21.8%) 582 (15.9%) Conditional Sentence 9 (4%) 166 (4.5%)
New Most Serious Offence (MSO) Severity Level
5 (7) 7 (8) t (881.38) = 9.61, p < .001
Sentence Length 206.63 (215.16) 205.27 (291.57) t (275.86) = -.09, p = .928

DWI and Non-DWI Community Offenders on Demographic Characteristics, Substance
Abuse Variables, LSI-OR, and Recidivism
Descriptive and demographic characteristics were also calculated for DWI and non-DWI
community offenders (see Table 11). There were a total of 3,318 DWI community offenders and
60,771 non-DWI community offenders. The DWI community offenders were significantly older
compared to the non-DWI community offenders, and there were more males than females
present in both offender groups. A large majority of offenders in both groups were Caucasian.
There was also a large representation of Aboriginal and Black offenders in the non-DWI
community sample (8.9% and 9%, respectively), but only 3.9% of the DWI community
offenders were Aboriginal, while another 3.9% were Black. However, the DWI community
sample had a large representation of South Asian offenders (6.3%). The sentence start dates for
the DWI community offenders ranged from January 4, 2010 to December 30, 2011, and from
January 4, 2010 to December 31, 2011 for the non-DWI community sample. The average
sentence length was 445.45 days for the DWI community offenders and 473.65 days for the non-
DWI community offenders. Similar to the previous findings, the non-DWI community offenders
had significantly higher index offence severity levels than the DWI offenders.

Table 11. Comparisons of DWI and non-DWI community offenders on demographic characteristics Demographic Variables DWI
Community (n=3318)
Non-DWI Community (n=60771)
t-tests and Chi Squares
Mean (SD) or n (%)
Mean (SD) or n (%)
Age: 40.39 (12.55) 33.56 (11.98) t (3653.91) = -30.6, p < .001
Gender: Male 2696 (81.3%) 49296 (81.1%) 2(1) = .036, = p = .849 Female 621 (18.7%) 11454 (18.9%) Race: Aboriginal 112 (3.9%) 4853 (8.9%) 2(10) = 300.64, = p < .001 Black 113 (3.9%) 4907 (9%) Caucasian 2173 (75.5%) 37955 (69.4%) Declined to Specify
6 (.2%) 226 (.4%)
East Asian 62 (2.2%) 1058 (1.9%) Hispanic 50 (1.7%) 764 (1.4%) Other Minority 91 (3.2%) 1420 (2.6%) South Asian 182 (6.3%) 1563 (2.9%) Southeast Asian 40 (1.4%) 716 (1.3%) Unknown 24 (.8%) 367 (.7%) West Asian/Arabic
26 (.9%) 885 (1.6%)
Most Serious Offence (MSO) Severity Level
10 (2) 16 (4) t (4457.24) = 149.44, p < .001
Sentence Length 445.45
(204.45) 473.65 (204.51) t (3688.71) = 7.74, p < .001
The DWI community offenders were more likely to present with substance abuse
problems, have a history of substance abuse and substance abuse treatment, or be assessed as
impaired at admit (see Table 12). However, the DWI community offenders were less likely than
non-DWI community offenders to show evidence of withdrawal at admit. Further, DWI
community offenders scored significantly lower on the LSI-OR variables, with the exception of
most strength scores and the substance abuse scale. Similar to the previous sections, the use of

the override feature to increase the risk level occurred significantly less often for the DWI
community offenders than it did for the non-DWI community offenders (see Table 13).
Table 12. Comparisons of DWI and non-DWI community offenders on substance abuse variables
Substance Abuse Variables
DWI Community
(n=3318)
Non-DWI Community (n=60771)
Chi Squares
n (%) n (%) Substance Abuse Alert 1365 (51.7%) 18077 (32.6%) 2(1) = 414.07, = p < .001 History of Substance Abuse
954 (36.2%) 14675 (26.5%) 2(1) = 120.28, = p < .001
Impairment at Admit 240 (9.1%) 1489 (2.7%) 2(1) = 358.42, = p < .001 Withdrawal at Admit 39 (1.5%) 1798 (3.2%) 2(1) = 25.61, = p < .001 Substance Abuse Treatment
306 (11.6%) 3334 (6%) 2(1) = 133.74, = p < .001
Table 13. Comparisons of DWI and non-DWI community offenders on LSI-OR variables LSI-OR Variables DWI
Community (n=3318)
Non-DWI Community (n=60771)
t-tests
Mean (SD) Mean (SD) General Risk/Needs 10.55 (6.28) 13.41 (8.47) t (4006.92) = 25.06, p < .001 Strength 1.05 (1.62) .91 (1.52) t (3641.69) = -4.58, p < .001 Initial Risk Level 2.39 (0.88) 2.7 (1.08) t (3891.45) = 19.92, p < .001 Risk Override .26 (.87) .48 (1.18) t (4009.83) = 13.91, p < .001 Final Risk Level 2.47 (.89) 2.87 (1.04) t (3833.9) = 25.32, p < .001 A1: Criminal History 1.86 (2.01) 2.4 (2.39) t (3844.42) = 14.87, p < .001 A1: Strength .15(.36) .15 (.36) t (3698.46) = .76, p = .447 A2: Education/ Employment
1.93 (2.2) 3.2 (2.74) t (3902.02) = 31.97, p < .001
A2: Strength .28 (.45) .2 (.4) t (3616.27) = -9.29, p < .001 A3: Family/Marital .96 (.98) 1.44 (1.12) t (3803.53) = 27.14, p < .001 A3: Strength .2 (.4) .16 (.37) t (3630.35) = -5.47, p < .001 A4: Leisure/ Recreation
.9 (.72) 1.1 (.74) t (3712.37) = 15.4, p < .001
A4: Strength .08 (.27) .06 (.25) t (3633.27) = -2.53, p = .012 A5: Companions .59 (.86) 1.15 (1.06) t (3880.28) = 35.77, p < .001 A5: Strength .11 (.31) .08 (.27) t (3594.98) = -5.29, p < .001 A6: Procriminal Attitude/Orientation
.49 (.84) .9 (1.1) t (3978.81) = 27.02, p < .001
A6: Strength .13 (.33) .1 (.3) t (3622.93) = -4.17, p < .001 A7: Substance Abuse 3.51 (1.85) 2.57 (2.38) t (3943.86) = -28.16, p < .001

A7: Strength .06 (.23) .11 (.31) t (3933.76) = 11.88, p < .001 A8: Antisocial Pattern .31 (.58) .66 (.86) t (4157.8) = 32.86, p < .001 A8: Strength .05 (.22) .04 (.2) t (3630.47) = -2.05, p = .04
In total, 18,483 community offenders recidivated; specifically, 578 DWI community
offenders and 17,905 non-DWI community offenders were charged with another offence (see
Table 14). Non-DWI community offenders had a general recidivism rate of 29.5%, which is
significantly higher than the 17.4% recidivism rate of the DWI community offenders. However,
the DWI community offenders had significantly higher rates of DWI recidivism compared to the
non-DWI community sample (3.5% versus .7%). The recontact sentence start date for the DWI
community offenders ranged from January 12, 2010 to November 7, 2013, and it ranged from
January 5, 2010 to December 17, 2014 for the non-DWI community offenders. The average
lapse time for the non-DWI community offenders was 278 days compared to 303 days for the
DWI community offenders, indicating that the non-DWI community offenders recidivated in
significantly less time. As well, the non-DWI community offenders had significantly higher
index offence severity levels for their recontact offense. In terms of sentence type, the majority
of offenders in both groups received subsequent custodial sentences (followed closely by
probation) for their recontact offence.

Table 14. Comparisons of DWI and non-DWI community offenders on recidivism variables Recidivism Variables DWI
Community (n=3318)
Non-DWI Community (n=60771)
t-tests and Chi Squares
Mean (SD) or n (%)
Mean (SD) or n (%)
Recidivism 578 (17.4%) 17905 (29.5%) 2(1) = 222.35, = p < .001 DWI Recidivism 116 (3.5%) 406 (.7%) 2(1) = 311.47, = p < .001 Lapse Time 302.51 (198.68) 278.09 (196.77) t (614.1) = -2.91, p = .004 New Sentence Type:
Custody 287 (49.7%) 8883 (49.6%) 2(2) = 1.28, = p = .528 Probation 255 (44.1%) 7691 (43%) Conditional Sentence 36 (6.2%) 1331 (7.4%)
New Most Serious Offence (MSO) Severity Level
2 (5) 4 (7) t (4062.22) = 22.77, p < .001
Sentence Length 204.92 (258.00) 209.19 (255.35) t (614.05) = 0.392, p = .695
DWI Recidivism
Of the total sample, 610 (.8%) received a new DWI index offence. Of these, 545 were
charged with one new DWI charge, 62 were charged with two, and three were charged with three
new DWI charges. Focusing specifically on DWI offenders, 146 of these offenders recidivated
with new DWI charges: 126 received one new charge and 20 received two charges. In turn, a
total of 464 non-DWI offenders’ recidivated with DWI charges: 419 received one new DWI
charge, 42 received two new DWI charges, and three received three new DWI charges.
Compared to DWI offenders, the non-DWI offenders incurred significantly more DWI recontact
charges (see Table 15); however, both groups had an equivalent number of individuals who were
charged with impaired driving causing bodily harm.

Table 15. The number of DWI and non-DWI offenders by type and number of DWI recidivism offences Type of DWI Recontact Offences
Number of Offenders Charged with Recontact Offences
t-tests Between DWI Recontact Offences by
Offender Group DWI (n)
Non-DWI (n)
Impaired driving: 94 293 t (4095.14) = -7.98, p < .001 Refuse breath sample: 25 61 t (4075.18) = -4.28, p < .001 Impaired driving over 80 mg:
45 156 t (4103.95) = -5.35, p < .001
Impaired driving causing bodily harm:
2 2 t (4035.33) = -1.33, p = .184
Recontact Total Impaired Driving Offences
146 464 t (4092) = -9.6, p < .001
Examining the DWI custody sample, a total of 30 DWI offenders recidivated wherein 24
received one new DWI charge and six received two new DWI charges. In contrast, 58 non-DWI
custody offenders’ recidivated: 53 received one new DWI charge, four received two new DWI
charges, and one received three DWI charges. Compared to DWI custody offenders, non-DWI
custody offenders received significantly more DWI recontact charges (see Table 16).
Table 16. The number of DWI and non-DWI custody offenders by type and number of DWI recidivism charges Type of DWI Recontact Offences
Number of Offenders Charged with Recontact Offences
t-tests Between DWI Recontact Offences by Offender Group DWI
(n) Non-DWI
(n) Impaired driving: 23 33 t (705.48) = -4.24, p < .001 Refuse breath sample: 8 8 t (700.57) = -2.59, p = .01 Impaired driving over 80 mg:
4 23 t (751.29) = -9.81, p = .327
Impaired driving causing bodily harm:
1 -- t (690) = -1.0, p = .318
Recontact Total Impaired Driving Offences
30 58 t (707.61) = -4.45, p < .001

Finally, 116 of the DWI community offenders recidivated: 102 received one new DWI
charge and 14 received two new DWI charges. Conversely, 406 non-DWI community offenders
recidivated wherein 366 received one new DWI charge, 38 acquired two new DWI charges, and
two incurred three new DWI charges. In fact, the non-DWI community offender group had
significantly more DWI recontact charges than the DWI community offenders (see Table 17).
Table 17. The number of DWI and non-DWI community offenders by type and number of DWI recidivism charges Type of DWI Recontact Offences
Number of Offenders Charged with Recontact Offences
t-tests Between DWI Recontact Offences by Offender Group DWI
(n) Non-DWI
(n) Impaired driving: 71 260 t (3391.05) = -6.78, p < .001 Refuse breath sample: 17 53 t (3379.17) = -3.41, p = .001 Impaired driving over 80 mg:
41 133 t (3382.09) = -5.28, p < .001
Impaired driving causing bodily harm:
1 2 t (3356.66) = -.89, p = .375
Recontact Total Impaired Driving Charges
116 406 t (3386.21) = -8.49, p < .001
General and DWI Recidivism
The two recidivism variables, general and DWI recidivism were analyzed by the type of
offender group (i.e., DWI and non-DWI offenders; DWI and non-DWI custody offenders; and
DWI and non-DWI community offenders; see Tables 18 to 23). Among all offenders captured in
the total sample, the general recidivism rate was 30.5%, while the DWI recidivism rate was
0.8%. When examining both the custody and community offenders separately, the general
recidivism rate for the total custody sample was 43% and the DWI recidivism rate was 1%. For
the community offender sample, the overall general recidivism rate and DWI recidivism rate
were 28.8% and 0.8%, respectively.

Table 18. Comparisons of DWI Offenders and non-DWI offenders on General Recidivism Recidivism DWI Offender Non-DWI Offender Total No Recontact: Count 3221 47307 50528 % of Total 4.4% 65% 69.5% Recontact: Count 788 21410 22198 % of Total 1.1% 29.4% 30.5% Total: Count 4009 68717 72726 % of Total 5.5% 94.5% 100% Table 19. Comparisons of DWI Offenders and non-DWI offenders on DWI Recidivism DWI Recidivism DWI Offender Non-DWI Offender Total No Recontact: Count 3863 68253 72116 % of Total 5.3% 93.8% 99.2% Recontact: Count 146 464 610 % of Total 0.2% .6% 0.8% Total: Count 4009 68717 72726 % of Total 5.5% 94.5% 100% Table 20. Comparisons of DWI and non-DWI Custody offenders on Recidivism Recidivism DWI Custody
Offenders Non-DWI Custody
Offenders Total
No Recontact Count 481 4441 4922 % of Total 5.6% 51.4% 57% Recontact Count 210 3505 3715 % of Total 2.4% 40.6% 43% Total Count 691 7946 8637 % of Total 8% 92% 100%

Table 21. Comparisons of DWI and non-DWI custody offenders on DWI Recidivism DWI Recidivism DWI Custody
Offenders Non-DWI Custody
Offenders Total
No Recontact Count 661 7888 8549 % of Total 7.7% 91.3% 99% Recontact Count 30 58 88 % of Total 0.3% 0.7% 1% Total Count 691 7946 8637 % of Total 8% 92% 100% Table 22. Comparisons of DWI and non-DWI community offenders on Recidivism Recidivism DWI
Community Offenders
Non-DWI Community Offenders
Total
No Recontact Count 2740 42866 45606 % of Total 4.3% 66.9% 71.2% Recontact Count 17905 578 18483 % of Total 27.9% 0.9% 28.8% Total Count 3318 60771 64089 % of Total 5.2% 94.8% 100% Table 23. Comparisons of DWI and non-DWI community offenders on DWI Recidivism DWI Recidivism DWI
Community Offenders
Non-DWI Community Offenders
Total
No Recontact Count 3202 60365 63567 % of Total 5% 94.2% 99.2% Recontact Count 116 406 522 % of Total 0.2% 0.6% 0.8% Total Count 3318 60771 64089 % of Total 5.2% 94.8% 100%

Use of the Override
An analysis of the initial risk level and the resulting final risk level, after accounting for
the use of the override, was conducted for the DWI and non-DWI offender groups, as well as for
both custody and community groups within each offender group, using chi square tests. It was
found that the override feature was used with 314 (7.8%) DWI offenders and 9,607 (14%) non-
DWI offenders. The use of the override feature to increase or decrease an offender’s risk level
was examined between DWI and non-DWI offenders, and it was found that overrides were used
significantly less often with DWI offenders, t (4879.63) = 14.47, p < .001.
These results for the difference between the initial and final risk level were significant for
the DWI offenders (2(16) = 13463.7, p < .001). A common pattern of significant results were
found between the initial and final risk level for the non-DWI offenders (2(16) = 201695.38, p <
.001), the DWI custody offenders (2(16) = 2476.56, p < .001), the DWI community offenders
(2(16) = 11025.08, p < .001), the non-DWI custody offenders (2(16) = 24332.89, p < .001),
and the non-DWI community offenders (2(16) = 176434.82, p < .001). The contingency tables
which display the frequency distribution of these variables for this analysis are displayed in
Tables 24 to 29.
Table 24. Initial risk level by final risk level for DWI offenders
Final Risk After Override Initial Risk Level Very
Low Low Medium High Very
High Total
Very Low Count 471 13 21 0 0 505 % of Total 11.7% 0.3% 0.5% 0.0% 0.0% 12.6% Low Count 1 1271 184 5 1 1462 % of Total 0.0% 31.7% 4.6% 0.1% 0.0% 36.5% Medium Count 1 6 1378 51 0 1436 % of Total 0.0% 0.1% 34.4% 1.3% 0.0% 35.8%

High Count 0 0 10 483 13 506 % of Total 0.0% 0.0% 0.2% 12% 0.3% 12.6% Very High Count 0 0 0 1 99 100 % of Total 0.0% 0.0% 0.0% 0.0% 2.5% 2.5% Total Count 473 1290 1593 540 113 4009 % of Total 11.8% 32.2% 39.7% 13.5% 2.8% 100% Table 25. Initial risk level by final risk level for Non-DWI offenders
Final Risk After Override Initial Risk Level Very
Low Low Medium High Very
High Total
Very Low Count 7238 408 1621 162 10 9439 % of Total 10.5% 0.6% 2.4% 0.2% 0.0% 13.7% Low Count 6 12804 4047 488 31 17376 % of Total 0.0% 18.6% 5.9% 0.7% 0.0% 25.3% Medium Count 6 117 20869 1700 128 22820 % of Total 0.0% 0.2% 30.4% 2.5% 0.2% 33.2% High Count 0 8 348 13562 344 14262 % of Total 0.0% 0.0% 0.5% 19.7% 0.5% 20.8% Very High Count 0 0 42 39 4739 4820 % of Total 0.0% 0.0% 0.1% 0.1% 6.9% 7.0% Total Count 7250 13337 26927 15951 5252 68717 % of Total 10.6% 19.4% 39.2% 23.2% 7.6% 100% Table 26. Initial risk level by final risk level for DWI custody offenders
Final Risk After Override Initial Risk Level Very
Low Low Medium High Very
High Total
Very Low Count 8 0 0 0 0 8 % of Total 1.2% 0.0% 0.0% 0.0% 0.0% 1.2% Low Count 0 76 6 0 0 82 % of Total 0.0% 11% 0.9% 0.0% 0.0% 11.9%

Medium Count 0 0 273 17 0 290 % of Total 0.0% 0.0% 39.5% 2.5% 0.0% 42% High Count 0 0 5 241 8 254 % of Total 0.0% 0.0% 0.7% 34.9% 1.2% 36.8% Very High Count 0 0 0 1 56 57 % of Total 0.0% 0.0% 0.0% 0.1% 8.1% 8.2% Total Count 8 76 284 259 64 691 % of Total 1.2% 11% 41.1% 37.5% 9.3% 100% Table 27. Initial risk level by final risk level for non-DWI custody offenders
Final Risk After Override Initial Risk Level Very
Low Low Medium High Very
High Total
Very Low Count 126 2 22 17 4 171 % of Total 1.6% 0.0% 0.3% 0.2% 0.1% 2.2% Low Count 0 579 91 74 15 759 % of Total 0.0% 7.3% 1.1% 0.9% 0.2% 9.6% Medium Count 0 7 1809 179 37 2032 % of Total 0.0% 0.1% 22.8% 2.3% 0.5% 25.6% High Count 0 0 103 2885 88 3076 % of Total 0.0% 0.0% 1.3% 36.3% 1.1% 38.7% Very High Count 0 0 25 5 1878 1908 % of Total 0.0% 0.0% 0.3% 0.1% 23.6% 24% Total Count 126 588 2050 3160 2022 7946 % of Total 1.6% 7.4% 25.8% 39.8% 25.4% 100%
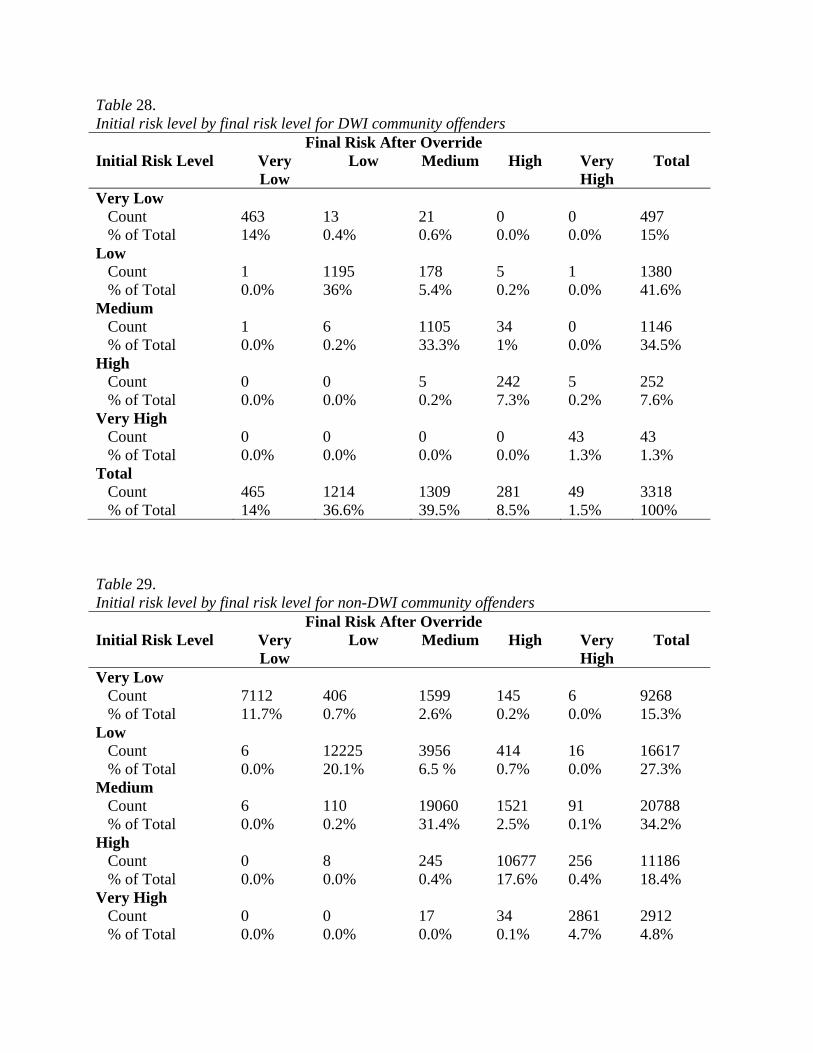
Table 28. Initial risk level by final risk level for DWI community offenders
Final Risk After Override Initial Risk Level Very
Low Low Medium High Very
High Total
Very Low Count 463 13 21 0 0 497 % of Total 14% 0.4% 0.6% 0.0% 0.0% 15% Low Count 1 1195 178 5 1 1380 % of Total 0.0% 36% 5.4% 0.2% 0.0% 41.6% Medium Count 1 6 1105 34 0 1146 % of Total 0.0% 0.2% 33.3% 1% 0.0% 34.5% High Count 0 0 5 242 5 252 % of Total 0.0% 0.0% 0.2% 7.3% 0.2% 7.6% Very High Count 0 0 0 0 43 43 % of Total 0.0% 0.0% 0.0% 0.0% 1.3% 1.3% Total Count 465 1214 1309 281 49 3318 % of Total 14% 36.6% 39.5% 8.5% 1.5% 100% Table 29. Initial risk level by final risk level for non-DWI community offenders
Final Risk After Override Initial Risk Level Very
Low Low Medium High Very
High Total
Very Low Count 7112 406 1599 145 6 9268 % of Total 11.7% 0.7% 2.6% 0.2% 0.0% 15.3% Low Count 6 12225 3956 414 16 16617 % of Total 0.0% 20.1% 6.5 % 0.7% 0.0% 27.3% Medium Count 6 110 19060 1521 91 20788 % of Total 0.0% 0.2% 31.4% 2.5% 0.1% 34.2% High Count 0 8 245 10677 256 11186 % of Total 0.0% 0.0% 0.4% 17.6% 0.4% 18.4% Very High Count 0 0 17 34 2861 2912 % of Total 0.0% 0.0% 0.0% 0.1% 4.7% 4.8%

Total Count 7124 12749 24877 12791 3230 60771 % of Total 11.7% 21% 40.9% 21% 5.3% 100%
Correlations between LSI-OR Variables with General and DWI Recidivism
The correlations between various aspects of the LSI-OR and both general and DWI
recidivism were examined for DWI offenders and non-DWI offenders, as well for each offender
group within the custody and community subsamples, to assess the applicability of the LSI-OR
to a DWI population. These correlations were calculated for the: general risk/need total score,
total strength score, initial risk level, final risk level after the override use, and the eight domain
scores.
All of the correlations for general recidivism among the DWI and non-DWI offenders
were significant (Table 30). Interestingly, the non-DWI offenders had a higher correlation
between general recidivism and the substance abuse subscale of the LSI-OR. Given that the
DWI offenders had a higher mean score than the non-DWI offenders on this subscale (M = 3.71
[SD = 1.87] compared to M = 2.72 [SD = 2.45]), a lack of variance for the DWI offenders may
be contributing to the lower correlation between the substance abuse variable and general
recidivism. In addition, all of the correlations for general recidivism for the DWI community
and non-DWI custody and community offenders were significant (Tables 31 and 32). For DWI
custody offenders, with the exception of the total strength score (r = -.016, ns; Table 31), all of
the correlations among the LSI-OR variables and general recidivism were significant. Overall,
the general risk/needs score was correlated with general recidivism among DWI and non-DWI
offenders, both in the total sample and within the custody and community subsamples; however,
it was not correlated as strongly for the DWI offenders as it was for the non-DWI offenders
(Tables 30 to 32).

Table 30. Correlations between LSI-OR Variables with General Recidivism for DWI Offenders and non-DWI Offenders
Recidivism
DWI Offender (n = 4009)
Non-DWI Offender (n = 68717)
General Risk/Needs .325** .424** Strength -.054** -.112** Initial Risk Level .286** .402** Final Risk Level .281** .376** A1: Criminal History .305** .371** A2: Education/ Employment .204** .303** A3: Family/Marital .162** .191** A4: Leisure/ Recreation .146** .237** A5: Companions .229** .296** A6: Procriminal Attitude/Orientation .206** .253** A7: Substance Abuse .164** .294** A8: Antisocial Pattern .269** .328** **Correlation is significant at the .01 level (2-tailed) * Correlation is significant at the .05 level (2-tailed) Table 31. Correlations between LSI-OR Variables with General Recidivism for DWI and non-DWI Custody Offenders
Recidivism
DWI Custody Offenders (n = 691)
Non-DWI Custody Offenders (n = 7946)
General Risk/Needs .249** .411** Strength -.016 -.051** Initial Risk Level .205** .394** Final Risk Level .183** .355** A1: Criminal History .234** .383** A2: Education/ Employment .202** .271** A3: Family/Marital .161** .193** A4: Leisure/ Recreation .124** .218** A5: Companions .211** .292** A6: Procriminal Attitude/Orientation .083* .214** A7: Substance Abuse .075* .311** A8: Antisocial Pattern .220** .302** **Correlation is significant at the .01 level (2-tailed) * Correlation is significant at the .05 level (2-tailed)

Table 32. Correlations between LSI-OR Variables with General Recidivism for DWI and non-DWI Community Offenders
Recidivism
DWI Community Offenders (n = 3318)
Non-DWI Community Offenders
(n = 60771) General Risk/Needs .320** .415** Strength -.039* -.107** Initial Risk Level .275** .392** Final Risk Level .274** .366** A1: Criminal History .298** .356** A2: Education/ Employment .181** .294** A3: Family/Marital .139** .179** A4: Leisure/ Recreation .117** .222** A5: Companions .2** .282** A6: Procriminal Attitude/Orientation .216** .242** A7: Substance Abuse .156** .277** A8: Antisocial Pattern .255** .317** **Correlation is significant at the .01 level (2-tailed) * Correlation is significant at the .05 level (2-tailed)
Turning to DWI recidivism, AUC analyses would have been the most appropriate
statistical test to use between the LSI-OR variables and DWI recidivism due to the low base rate
(i.e., below 10%); however, correlations were used. Many of the same correlations were
significant for both the DWI and non-DWI offenders: general risk/needs score, initial risk level,
final risk level, criminal history, and substance abuse (see Table 33). Two additional
correlations were significant for the DWI offenders (i.e., companions and anti-social patterns),
while one additional correlation was significant for the non-DWI offenders (i.e.,
education/employment). There were no significant correlations among the LSI-OR variables and
DWI recidivism for the DWI custody offenders. However, there were a handful of significant
correlations for the non-DWI custody offenders: general risk/needs score, criminal history, and
substance abuse (see Table 34).

Table 33. Correlations between LSI-OR Variables with DWI Recidivism for DWI Offenders and non-DWI offenders
DWI Recidivism
DWI Offender (n=4009)
Non-DWI Offender (n=68717)
General Risk/Needs .056** .015** Strength -.019 -.003 Initial Risk Level .057** .015** Final Risk Level .054** .013** A1: Criminal History .071** .024** A2: Education/ Employment .014 -.012** A3: Family/Marital .028 -.003 A4: Leisure/ Recreation .031 -.002 A5: Companions .035* -.006 A6: Procriminal Attitude/Orientation .022 .002 A7: Substance Abuse .041** .045** A8: Antisocial Pattern .037** .002 **Correlation is significant at the .01 level (2-tailed) * Correlation is significant at the .05 level (2-tailed) Table 34. Correlations between LSI-OR Variables with DWI Recidivism for DWI and non-DWI Custody Offenders
DWI Recidivism
DWI Custody Offenders (n=691)
Non-DWI Custody Offenders (n=7946)
General Risk/Needs .007 .029* Strength -.007 .007 Initial Risk Level .011 .022 Final Risk Level .018 .016 A1: Criminal History .01 .041** A2: Education/ Employment .-.007 -.003 A3: Family/Marital .058 .015 A4: Leisure/ Recreation .055 .014 A5: Companions -.019 -.002 A6: Procriminal Attitude/Orientation -.027 .008 A7: Substance Abuse -.013 .044** A8: Antisocial Pattern .028 .019 **Correlation is significant at the .01 level (2-tailed) * Correlation is significant at the .05 level (2-tailed)

In the community sample, for both DWI and non-DWI offenders, the correlations among
the LSI-OR and DWI recidivism variables that were significant included: general risk/needs
score, initial risk level, final risk level, criminal history, and substance abuse (see Table 35). For
DWI community offenders, significant correlations also emerged for companions and antisocial
patterns and, for non-DWI community offenders, there was a significant correlation between
education/employment and DWI recidivism.
Table 35. Correlations between LSI-OR Variables with DWI Recidivism for DWI and non-DWI Community Offenders
DWI Recidivism
DWI Community Offenders (n = 3318)
Non-DWI Community Offenders
(n = 60771) General Risk/Needs .066** .012** Strength -.018 -.003 Initial Risk Level .064** .014** Final Risk Level .059** .012** A1: Criminal History .085** .022** A2: Education/ Employment .016 -.014** A3: Family/Marital .017 -.006 A4: Leisure/ Recreation .021 -.004 A5: Companions .045** -.008 A6: Procriminal Attitude/Orientation .033 .001 A7: Substance Abuse .05** .045** A8: Antisocial Pattern .036* -.001 **Correlation is significant at the .01 level (2-tailed) * Correlation is significant at the .05 level (2-tailed)

ROC Coefficients for LSI-OR Total and Section Scores with Recidivism
A series of ROC analyses were conducted to examine the LSI-OR total and section scores
with general and DWI recidivism for all DWI and non-DWI offender groups.
General Recidivism.
The AUC values for the overall DWI and non-DWI offender groups are presented in
Table 36. An analysis of the general risk/need total score on general recidivism produced a ROC
of AUC = .707 for DWI offenders and an AUC = .757 for non-DWI offenders. The lower AUC
value for DWI offenders indicates that there is a decrease in predictive accuracy for the DWI
offenders compared to the non-DWI offenders. The majority of the remaining AUC coefficients
for the domain scores and other section scores ranged from .726 to .741 for the non-DWI
offenders and from .684 to .685 for the DWI offenders. This again indicated that the LSI-OR
and its subscales were better able to predict recidivism in the non-DWI sample than the DWI
sample. Figures 2 and 3 illustrate the ROC curves for the DWI and non-DWI offender groups.
Table 36. AUC Values for the DWI and non-DWI offender groups on Recidivism LSI-OR Variables DWI Offender
AUC (95% CI) Non-DWI Offender AUC (95% CI)
General Risk/Needs .707 (.686, .727) .757 (.754, .761) Initial Risk Level .684 (.663, .705) .741 (.737, .745) Final Risk Level After Override .685 (.664, .706) .726 (.722, .73)

Figure 2. ROC Curve on General Recidivism for the DWI Offenders.
Figure 3. ROC Curve on General Recidivism for the Non-DWI Offenders.

The AUC values for the DWI and non-DWI custody offender groups are presented in
Table 37. An analysis of the general risk/need total score in relation to general recidivism
produced a ROC of AUC = .642 for the DWI custody offenders and an AUC = .738 for non-
DWI custody offenders. This demonstrated that there was a decrease in predictive accuracy for
the DWI custody offenders. The majority of the remaining AUC coefficients for the domain
scores and other section scores ranged from .695 to .719 for the non-DWI custody offenders and
from .600 to .612 for the DWI custody offenders. Thus, the LSI-OR and its subscales were
better able to predict recidivism in the non-DWI custody sample than the DWI custody sample.
Figures 3 and 4 portray the ROC curves for the DWI and non-DWI custody offender groups.
Table 37. AUC Values for the DWI and non-DWI custody offenders on Recidivism LSI-OR Variables DWI Custody Offender
AUC (95% CI) Non-DWI Custody Offender AUC (95% CI)
General Risk/Needs .642 (.597, .687) .738 (.727, .748) Initial Risk Level .612 (.566, .658) .719 (.708, .730) Final Risk Level After Override .600 (.554, .646) .695 (.684, .707)

Figure 4. ROC Curve on General Recidivism for the DWI Custody Offenders.
Figure 5. ROC Curve on General Recidivism for the Non-DWI Custody Offenders.

The AUC values for the DWI and non-DWI community offender groups are presented in
Table 38. The analysis of general risk/need total score on general recidivism resulted in a ROC
of AUC =.699 for DWI community offenders and an AUC = .754 for non-DWI community
offenders. The majority of the remaining AUC coefficients for the domain scores and other
section scores ranged from .721 to .737 for the non-DWI community offenders and from .677 to
.68 for the DWI community offenders, indicating that the LSI-OR and its subscales were better
able to predict recidivism in the non-DWI community sample than the DWI community sample.
Figures 5 and 6 portray the ROC curves for the DWI and non-DWI community offender groups.
Table 38. AUC Values for the DWI and non-DWI community offenders on Recidivism LSI-OR Variables DWI Community
Offender AUC (95% CI)
Non-DWI Community Offender AUC (95% CI)
General Risk/Needs .699 (.674, .723) .754 (.749, .758) Initial Risk Level .677 (.652, .702) .737 (.732, .741) Final Risk Level After Override .68 (.655, .705) .721 (.716, .725)
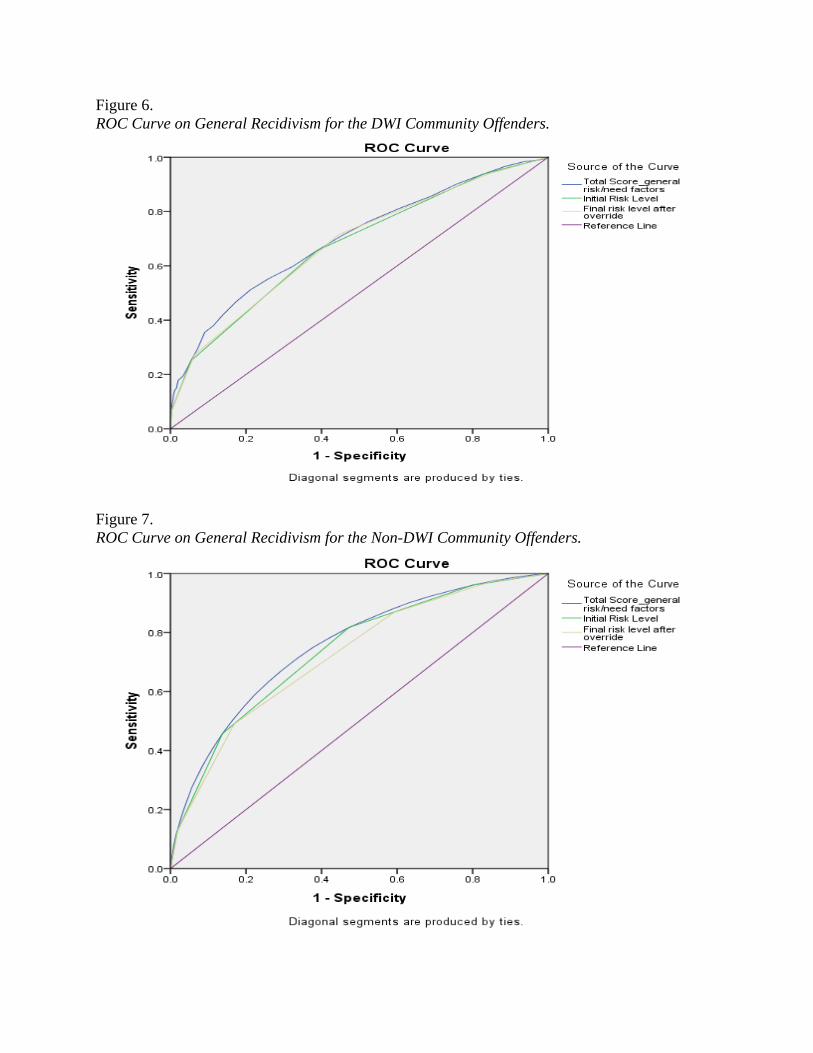
Figure 6. ROC Curve on General Recidivism for the DWI Community Offenders.
Figure 7. ROC Curve on General Recidivism for the Non-DWI Community Offenders.
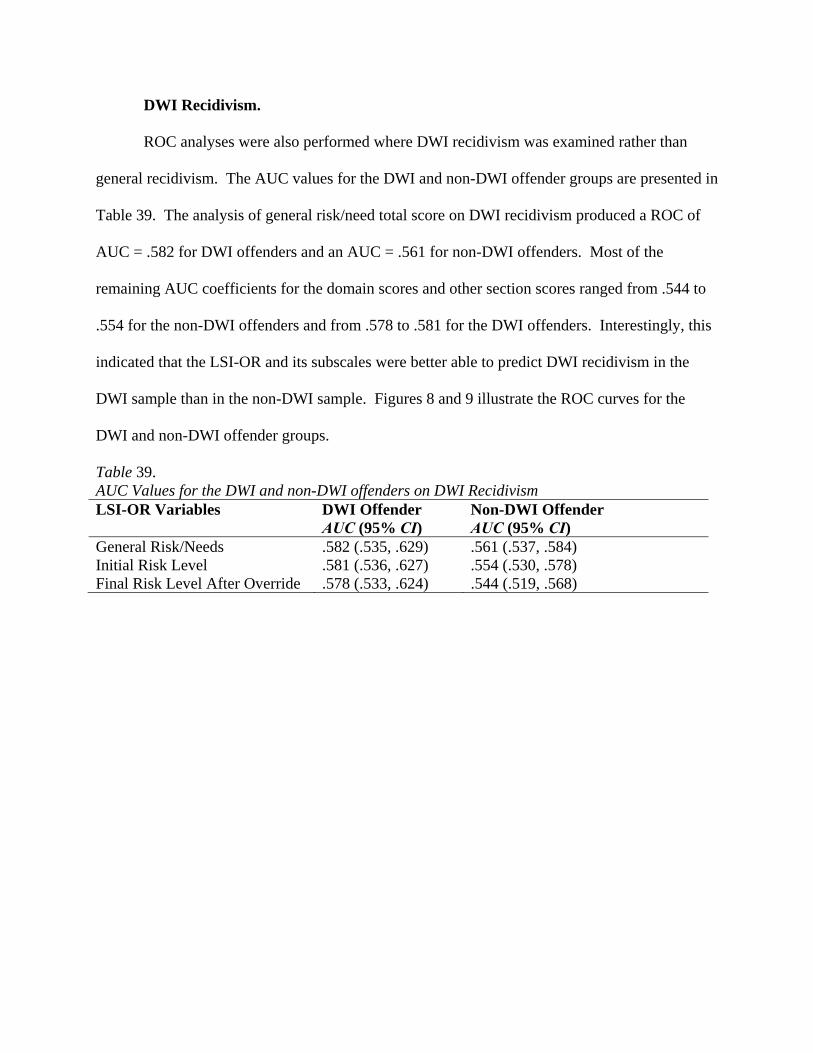
DWI Recidivism.
ROC analyses were also performed where DWI recidivism was examined rather than
general recidivism. The AUC values for the DWI and non-DWI offender groups are presented in
Table 39. The analysis of general risk/need total score on DWI recidivism produced a ROC of
AUC = .582 for DWI offenders and an AUC = .561 for non-DWI offenders. Most of the
remaining AUC coefficients for the domain scores and other section scores ranged from .544 to
.554 for the non-DWI offenders and from .578 to .581 for the DWI offenders. Interestingly, this
indicated that the LSI-OR and its subscales were better able to predict DWI recidivism in the
DWI sample than in the non-DWI sample. Figures 8 and 9 illustrate the ROC curves for the
DWI and non-DWI offender groups.
Table 39. AUC Values for the DWI and non-DWI offenders on DWI Recidivism LSI-OR Variables DWI Offender
AUC (95% CI) Non-DWI Offender AUC (95% CI)
General Risk/Needs .582 (.535, .629) .561 (.537, .584) Initial Risk Level .581 (.536, .627) .554 (.530, .578) Final Risk Level After Override .578 (.533, .624) .544 (.519, .568)

Figure 8. ROC Curve on DWI Recidivism for the DWI Offenders.
Figure 9. ROC Curve on DWI Recidivism for the Non-DWI Offenders.

The AUC values for the DWI and non-DWI custody offender groups are presented in
Table 40. Here, the general risk/need total score on DWI recidivism resulted in a ROC of AUC
= .508 for DWI custody offenders and an AUC = .593 for non-DWI custody offenders. The
majority of the remaining AUC coefficients for the domain scores and other section scores
ranged from .549 to .567 for the non-DWI custody offenders and from .502 to .513 for the DWI
custody offenders. As with the overall sample, the LSI-OR and its subscales were better able to
predict DWI recidivism in the non-DWI custody sample than in the DWI custody sample.
Figures 10 and 11 illustrate the ROC curves for the DWI and non-DWI custody offender groups.
Table 40. AUC Values for the DWI and non-DWI custody offenders on DWI Recidivism LSI-OR Variables DWI Custody Offender
AUC (95% CI) Non-DWI Custody Offender AUC (95% CI)
General Risk/Needs .508 (.410, .606) .593 (.530, .657) Initial Risk Level .502 (.402, .603) .567 (.503, .631) Final Risk Level After Override .513 (.415, .610) .549 (.484, .615)

Figure 10. ROC Curve on DWI Recidivism for the DWI Custody Offenders.
Figure 11. ROC Curve on DWI Recidivism for the Non-DWI Custody Offenders.

The AUC values for the DWI and non-DWI community offender groups are presented in
Table 41. The analysis of general risk/need total score on DWI recidivism produced a ROC of
AUC = .585 for DWI community offenders and an AUC = .558 for non-DWI community
offenders. The remaining AUC coefficients for the domain scores and other section scores
ranged from .542 to .552 for the non-DWI community offenders and from .582 to .588 for the
DWI community offenders. Again, the LSI-OR and its subscales were better able to predict
DWI recidivism in the DWI community sample than in the non-DWI community sample.
Figures 12 and 13 illustrate the ROC curves for the DWI and non-DWI community offender
groups.
Table 41. AUC Values for the DWI and non-DWI community offenders on DWI Recidivism LSI-OR Variables DWI Community
Offender AUC (95% CI)
Non-DWI Community Offender AUC (95% CI)
General Risk/Needs .585 (.531, .638) .558 (.533, .583) Initial Risk Level .588 (.536, .641) .552 (.527, .578) Final Risk Level After Override .582 (.529, .635) .542 (.516, .568)

Figure 12. ROC Curve on DWI Recidivism for the DWI Community Offenders.
Figure 13. ROC Curve on DWI Recidivism for the Non-DWI Community Offenders.

Additional ROC Analyses.
Finally, a series of ROC analyses were conducted to examine the number of impaired
driving charges received by offenders in their initial sentence on both general and DWI
recidivism for all of the DWI and non-DWI offender groups. The AUC values for the offender
groups are presented in Table 42. The AUC values were higher or equivalent for general
recidivism compared to DWI recidivism for all offender groups, with the exception of the DWI
community offenders, indicating that initial impaired driving charges tends to be better able to
predict general recidivism. Further, higher AUC values were produced for DWI offenders
compared to non-DWI offenders (both overall and in relation to custody- and community-only
samples), which suggests that the initial number of impaired driving charges is more effective at
predicting recidivism among DWI offenders than non-DWI offenders.
Table 42. AUC Values for all DWI and non-DWI offender groups on Recidivism Initial Total Impaired Driving Charges Recidivism
AUC (95% CI) DWI Recidivism AUC (95% CI)
DWI Offenders .525 (.502, .548) .520 (.471, .569) Non-DWI Offenders .500 (.495, .505) .500 (.474, .526) DWI Custody Offenders .522 (.475, .569) .509 (.403, .615) Non-DWI Custody Offenders .500 (.487, .513) .500 (.425, .575) DWI Community Offenders .517 (.49, .543) .520 (.465, .576) Non-DWI Community Offenders .500 (.495, .505) .500 (.472, .528)
Prediction Models Based on LSI-OR Item Correlations
The DWI offender sample was split using an SPSS function that generates random
samples from within the dataset. A random selection of approximately 50% of the sample
yielded a construction sample, on which predictor variables were generated and a validation
sample, on which the predictor variables were assessed for their predictive validity. A total of
eight new variables were created: logistic binary and weighted LSI-OR, MR binary and weighted
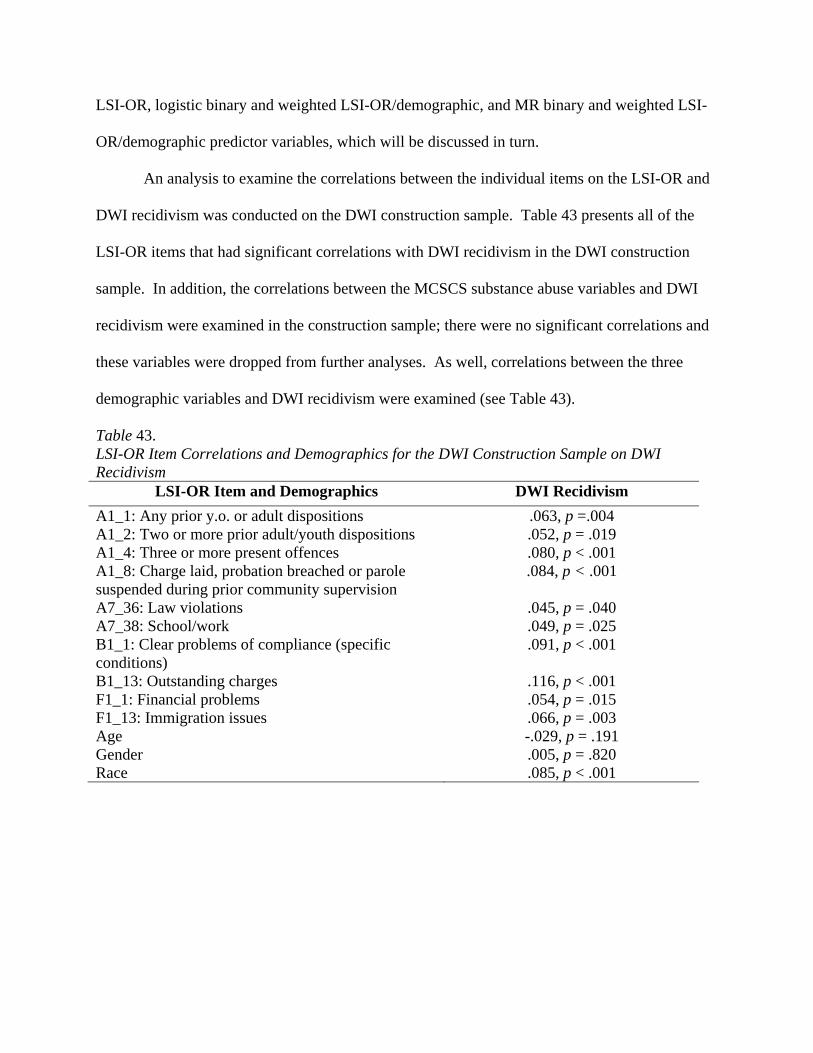
LSI-OR, logistic binary and weighted LSI-OR/demographic, and MR binary and weighted LSI-
OR/demographic predictor variables, which will be discussed in turn.
An analysis to examine the correlations between the individual items on the LSI-OR and
DWI recidivism was conducted on the DWI construction sample. Table 43 presents all of the
LSI-OR items that had significant correlations with DWI recidivism in the DWI construction
sample. In addition, the correlations between the MCSCS substance abuse variables and DWI
recidivism were examined in the construction sample; there were no significant correlations and
these variables were dropped from further analyses. As well, correlations between the three
demographic variables and DWI recidivism were examined (see Table 43).
Table 43. LSI-OR Item Correlations and Demographics for the DWI Construction Sample on DWI Recidivism
LSI-OR Item and Demographics DWI Recidivism
A1_1: Any prior y.o. or adult dispositions .063, p =.004 A1_2: Two or more prior adult/youth dispositions .052, p = .019 A1_4: Three or more present offences .080, p < .001 A1_8: Charge laid, probation breached or parole suspended during prior community supervision
.084, p < .001
A7_36: Law violations .045, p = .040 A7_38: School/work .049, p = .025 B1_1: Clear problems of compliance (specific conditions)
.091, p < .001
B1_13: Outstanding charges .116, p < .001 F1_1: Financial problems .054, p = .015 F1_13: Immigration issues .066, p = .003 Age -.029, p = .191 Gender .005, p = .820 Race .085, p < .001

LSI-OR Predictor Variables: Stepwise Logistic Regression.
The next analysis to create the logistic binary and weighted LSI-OR predictor variables
utilized stepwise logistic regression to identify items that are predictive of DWI recidivism. The
four steps and items that were identified as significantly contributing to explaining the variance
of DWI recidivism are illustrated in Table 44. These four significant variables were used to
compute the two logistic LSI-OR variables.
Table 44. Stepwise Logistic Regression for LSI-OR Items for the DWI Construction Sample
Step Number
LSI-OR Item b Standard Error (SE)
Wald ² p-value Exp (β)
1 A7_36: Law violations
1.131 .101 125.297 .000 3.099
Constant -5.626 .084 4478.388 .000 .004 2 B1_13:
Outstanding charges
.826 .118 49.011 .000 2.284
Constant -5.707 .086 4441.058 .000 .003 3 A1_1: Any prior
y.o. or adult dispositions
.547 .119 21.118 .000 1.729
Constant -6.021 .115 2753.287 .000 .002 4 A1_1 .591 .12 24.401 .000 1.805 A7_36 .978 .105 87.358 .000 2.659 B1_13 .815 .118 47.441 .000 2.259 F1_1: Financial
Problems -.344 .102 11.403 .001 .709
Constant -5.96 .116 2640.457 .000 .003
Correlations and ROC Analyses with the Logistic Binary LSI-OR Predictor
Variable.
A correlational analysis between the computed logistic binary LSI-OR variable and DWI
recidivism among the DWI construction sample was significant, r = .109, p < .001. Further,
ROC analyses were conducted for the logistic binary LSI-OR variable, LSI-OR initial risk levels,

and DWI recidivism. The analysis of the logistic binary LSI-OR variable on DWI recidivism
produced a ROC of AUC = .660 (95% CI = .596, .724) and a ROC of AUC = .581 (95% CI =
.517, .645) for the initial risk levels on DWI recidivism for the DWI construction sample. This
indicates that the logistic binary LSI-OR variable was better able to predict DWI recidivism in
the DWI construction sample than the initial risk levels generated from the LSI-OR. Figure 14
illustrates the ROC curve for the logistic binary LSI-OR variable and the initial risk levels on
DWI recidivism.
Figure 14. ROC Curve on DWI Recidivism for the Logistic Binary LSI-OR Variable and Initial Risk Levels – DWI Construction Sample.

A correlational analysis between the logistic binary LSI-OR variable and DWI recidivism
among the DWI validation sample was also conducted and was significant, r = .074, p = .001.
ROC analyses were also conducted for the logistic binary LSI-OR variable, initial risk levels,
and DWI recidivism. The analysis of the logistic binary variable on DWI recidivism produced a
ROC of AUC = .598 (95% CI = .537, .659) and a ROC of AUC = .582 (95% CI = .517, .647) for
the initial risk levels on DWI recidivism for the DWI validation sample. The logistic binary LSI-
OR variable was slightly better able to predict DWI recidivism in the validation sample than the
initial risk levels generated from the LSI-OR. However, the AUC for the logistic binary variable
was not as high for the validation sample as it was for the construction sample. Figure 15
presents the ROC curve for the logistic binary variable and the initial risk levels on DWI
recidivism.
Figure 15. ROC Curve on DWI Recidivism for the Logistic Binary LSI-OR Variable and Initial Risk Levels – DWI Validation Sample.
Finally, a correlation was generated between the logistic binary LSI-OR variable and
DWI recidivism among the non-DWI sample and was significant, r = .042, p < .001. As well,

ROC analyses were conducted for the logistic binary variable, initial risk levels, and DWI
recidivism. The analysis of the logistic binary variable on DWI recidivism produced a ROC of
AUC = .643 (95% CI = .619, .667) and a ROC of AUC = .554 (95% CI = .53, .578) for the initial
risk levels on DWI recidivism for the non-DWI sample. The logistic binary LSI-OR variable
was better able to predict DWI recidivism in the non-DWI sample than the initial risk levels
generated from the LSI-OR. Figure 16 presents the ROC curve for the logistic binary variable
and the initial risk levels on DWI recidivism.
Figure 16. ROC Curve on DWI Recidivism for the Logistic Binary LSI-OR Variable and Initial Risk Levels – Non-DWI Sample.
Correlations and ROC Analyses with the Logistic Weighted LSI-OR Predictor
Variable.
The weighted version of the logistic LSI-OR predictor variable was also computed. It
was weighted using the unstandardized beta coefficients. A correlation between the logistic
weighted LSI-OR variable and DWI recidivism among the DWI construction sample was

significant, r = .088, p < .001. Further, ROC analyses were conducted for the logistic weighted
LSI-OR variable, LSI-OR initial risk levels, and DWI recidivism. The analysis of the logistic
weighted LSI-OR variable on DWI recidivism produced a ROC of AUC = .636 (95% CI = .57,
.702) and a ROC of AUC = .581 (95% CI = .517, .645) for the initial risk levels on DWI
recidivism for the DWI construction sample. The logistic weighted LSI-OR variable was better
able to predict DWI recidivism in the construction sample than the initial risk levels generated
from the LSI-OR. However, it was slightly less able to predict DWI recidivism than the logistic
binary LSI-OR variable. Figure 17 illustrates the ROC curve for the logistic weighted variable
and the initial risk levels on DWI recidivism.
Figure 17. ROC Curve on DWI Recidivism for the Logistic Weighted LSI-OR Variable and Initial Risk Levels – DWI Construction Sample.
A correlational analysis between the logistic weighted LSI-OR variable and DWI
recidivism among the DWI validation sample was also found to be significant, r = .055, p = .014.

ROC analyses were conducted for the logistic weighted variable, initial risk levels, and DWI
recidivism. The analysis of the logistic weighted LSI-OR variable on DWI recidivism produced
a ROC of AUC = .584 (95% CI = .516, .652) and a ROC of AUC = .582 (95% CI = .517, .647)
for the initial risk levels on DWI recidivism for the DWI validation sample. The logistic
weighted LSI-OR variable was nearly equivalent in predicting DWI recidivism in the DWI
validation sample as the initial risk levels generated from the LSI-OR. Further, the logistic
weighted LSI-OR variable in the validation sample was a poorer predictor of DWI recidivism
compared to the DWI construction sample (AUC = .636). It was also a poorer predictor than the
logistic binary LSI-OR variable when it was applied to the DWI validation sample (AUC =
.598). Figure 18 presents the ROC curve for the logistic weighted LSI-OR variable and the initial
risk levels on DWI recidivism.
Figure 18. ROC Curve on DWI Recidivism for the Logistic Weighted LSI-OR Variable and Initial Risk Levels – DWI Validation Sample.

Finally, a correlation was generated between the logistic weighted LSI-OR variable and
DWI recidivism among the non-DWI sample and was significant, r = .056, p < .001. As well,
ROC analyses were conducted for the logistic weighted LSI-OR variable, initial risk levels, and
DWI recidivism. The analysis of the logistic weighted LSI-OR variable on DWI recidivism
produced a ROC of AUC = .687 (95% CI = .664, .710) and a ROC of AUC = .554 (95% CI =
.53, .578) for the initial risk levels on DWI recidivism for the non-DWI sample. Again, the
logistic weighted LSI-OR variable was better able to predict DWI recidivism in the non-DWI
sample than the initial risk levels generated from the LSI-OR. In addition, the logistic weighted
variable was better able to predict DWI recidivism than the logistic binary LSI-OR variable and
exhibited the strongest predictive power with the non-DWI sample. Figure 19 presents the ROC
curve for the logistic weighted LSI-OR variable and the initial risk levels on DWI recidivism.
Figure 19. ROC Curve on DWI Recidivism for the Logistic Weighted LSI-OR Variable and Initial Risk Levels – Non-DWI Sample.

LSI-OR Predictor Variables: Stepwise Multiple Regression (MR).
An analysis to create the MR binary and weighted LSI-OR predictor variables utilized
stepwise MR to identify items that are predictive of DWI recidivism. The four steps and items
that were identified as significantly contributing to explaining the variance of DWI recidivism
are illustrated in Table 45. These four significant variables were used to compute the two MR
LSI-OR variables.
Table 45. Stepwise Multiple Regression for LSI-OR Items for the DWI Construction Sample
Step Number
LSI-OR Item b R Cumulative R Square
R Square Change
Significant F Change
1 B1_13: Outstanding charges
.089 .116 .013 .013 .000
2 B1_1: Clear problems of compliance
.040 .140 .020 .006 .000
3 F1_13: Immigration issues
.088 .153 .023 .004 .006
4 A1_4: Three or more present offences
.024 .159 .025 .002 .041
Constant .019
Correlations and ROC Analyses with the Multiple Regression (MR) Binary LSI-OR
Predictor Variable.
A correlational analysis between the computed MR binary LSI-OR variable and DWI
recidivism among the DWI construction sample was significant, r = .143, p < .001. Further,
ROC analyses were conducted for the MR binary LSI-OR variable, initial risk levels, and DWI
recidivism. The analysis of the MR binary LSI-OR variable on DWI recidivism produced a
ROC of AUC = .667 (95% CI = .597, .737) and a ROC of AUC = .581 (95% CI = .517, .645) for
the initial risk levels on DWI recidivism for the DWI construction sample. The MR binary LSI-

OR variable predicted DWI recidivism better than the initial risk levels and slightly better than
the alternative logistic binary LSI-OR variable (AUC = .660). Figure 20 illustrates the ROC
curve for the MR binary LSI-OR variable and initial risk levels on DWI recidivism.
Figure 20. ROC Curve on DWI Recidivism for the MR Binary LSI-OR Variable and Initial Risk Levels – DWI Construction Sample.
A correlational analysis between the MR binary LSI-OR variable and DWI recidivism
among the DWI validation sample was also conducted and was significant, r = .094, p < .001.
ROC analyses were also conducted for the MR binary LSI-OR variable, initial risk levels, and
DWI recidivism. The analysis of the MR binary variable on DWI recidivism produced a ROC of
AUC = .605 (95% CI = .537, .674) and a ROC of AUC = .582 (95% CI = .517, .647) for the
initial risk levels on DWI recidivism for the DWI validation sample. The MR binary LSI-OR
variable was better able to predict DWI recidivism compared to the initial risk levels. As well, it

was better able to predict DWI recidivism in the DWI construction sample compared to the DWI
validation sample and was a better predictor compared to the logistic binary LSI-OR variable.
Figure 21 presents the ROC curve for the MR binary variable and initial risk levels on DWI
recidivism.
Figure 21. ROC Curve on DWI Recidivism for the MR Binary LSI-OR Variable and Initial Risk Levels – DWI Validation Sample.
Finally, a correlation was generated between the MR binary LSI-OR variable and DWI
recidivism among the non-DWI sample and was significant, r = .026, p < .001. As well, ROC
analyses were conducted for the MR binary LSI-OR variable, initial risk levels, and DWI
recidivism. The analysis of the MR binary LSI-OR variable on DWI recidivism produced a
ROC of AUC = .580 (95% CI = .553, .608) and a ROC of AUC = .554 (95% CI = .530, .578) for
the initial risk levels on DWI recidivism for the non-DWI sample. The MR binary LSI-OR
variable was better able to predict DWI recidivism compared to the initial risk levels. However,
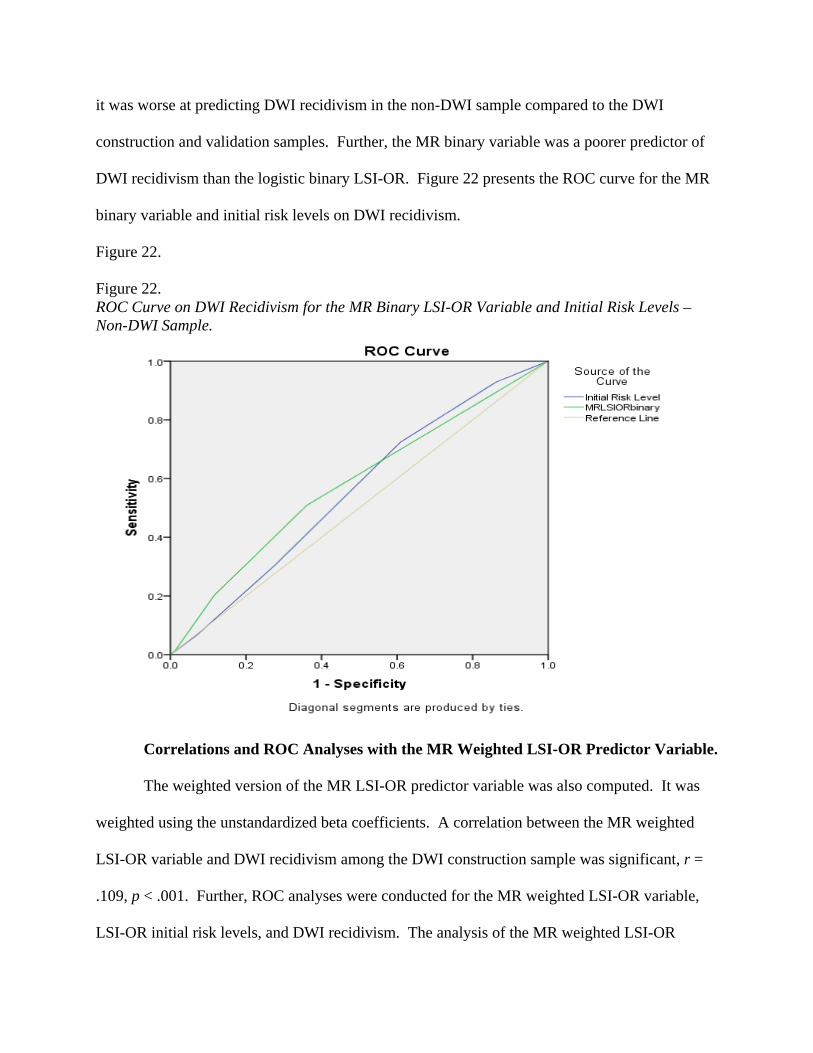
it was worse at predicting DWI recidivism in the non-DWI sample compared to the DWI
construction and validation samples. Further, the MR binary variable was a poorer predictor of
DWI recidivism than the logistic binary LSI-OR. Figure 22 presents the ROC curve for the MR
binary variable and initial risk levels on DWI recidivism.
Figure 22. Figure 22. ROC Curve on DWI Recidivism for the MR Binary LSI-OR Variable and Initial Risk Levels – Non-DWI Sample.
Correlations and ROC Analyses with the MR Weighted LSI-OR Predictor Variable.
The weighted version of the MR LSI-OR predictor variable was also computed. It was
weighted using the unstandardized beta coefficients. A correlation between the MR weighted
LSI-OR variable and DWI recidivism among the DWI construction sample was significant, r =
.109, p < .001. Further, ROC analyses were conducted for the MR weighted LSI-OR variable,
LSI-OR initial risk levels, and DWI recidivism. The analysis of the MR weighted LSI-OR

variable on DWI recidivism produced a ROC of AUC = .609 (95% CI = .540, .678) and a ROC
of AUC = .582 (95% CI = .517, .647) for the initial risk levels on DWI recidivism for the DWI
construction sample. Thus, the MR weighted LSI-OR variable was better able to predict DWI
recidivism in the DWI construction sample than the initial risk levels generated from the LSI-
OR. However, it was worse at predicting DWI recidivism than the MR binary LSI-OR variable.
Figure 23 illustrates the ROC curve for the MR weighted LSI-OR variable and the initial risk
levels on DWI recidivism.
Figure 23. ROC Curve on DWI Recidivism for the MR Weighted LSI-OR Variable and Initial Risk Levels – DWI Construction Sample.
A correlational analysis between the MR weighted LSI-OR variable and DWI recidivism
among the DWI validation sample was also found to be significant, r = .159, p < .001. ROC
analyses were conducted for the MR weighted variable, initial risk levels, and DWI recidivism.

The analysis of the MR weighted LSI-OR variable on DWI recidivism produced a ROC of AUC
= .676 (95% CI = .605, .748) and a ROC of AUC = .581 (95% CI = .517, .645) for the initial risk
levels on DWI recidivism for the DWI validation sample. The MR weighted LSI-OR variable
was much better at predicting DWI recidivism in the validation sample compared to the initial
risk levels generated from the LSI-OR. As well, it was better able to predict DWI recidivism
than the MR weighted variable for the DWI construction sample (AUC = .609) and the MR
binary LSI-OR variable in the DWI validation sample (AUC = .605). Figure 24 presents the
ROC curve for the MR weighted LSI-OR variable and the initial risk levels on DWI recidivism.
Figure 24. ROC Curve on DWI Recidivism for the MR Weighted LSI-OR Variable and Initial Risk Levels – DWI Validation Sample.
Finally, a correlation was generated between the MR weighted LSI-OR variable and DWI
recidivism among the non-DWI sample and was significant, r = .032, p < .001. As well, ROC
analyses were conducted for the MR weighted LSI-OR variable, initial risk levels, and DWI

recidivism. The analysis of the MR weighted LSI-OR variable on DWI recidivism produced a
ROC of AUC = .591 (95% CI = .563, .619) and a ROC of AUC = .554 (95% CI = .53, .578) for
the initial risk levels on DWI recidivism for the non-DWI sample. The MR weighted LSI-OR
variable was slightly better able to predict DWI recidivism in the non-DWI sample than the
initial risk levels generated from the LSI-OR. In addition, the MR weighted variable was better
able to predict DWI recidivism than the MR binary LSI-OR variable. Figure 25 presents the
ROC curve for the MR weighted LSI-OR variable and the initial risk levels on DWI recidivism.
Figure 25. ROC Curve on DWI Recidivism for the MR Weighted LSI-OR Variable and Initial Risk Levels – Non-DWI Sample.
LSI-OR/Demographic Predictor Variables: Stepwise Logistic Regression.
Analyses to create logistic binary and weighted LSI-OR/demographic variables utilizing
stepwise logistic regression to identify LSI-OR items and demographic variables that are
predictive of DWI recidivism were also performed. The previously mentioned significant LSI-
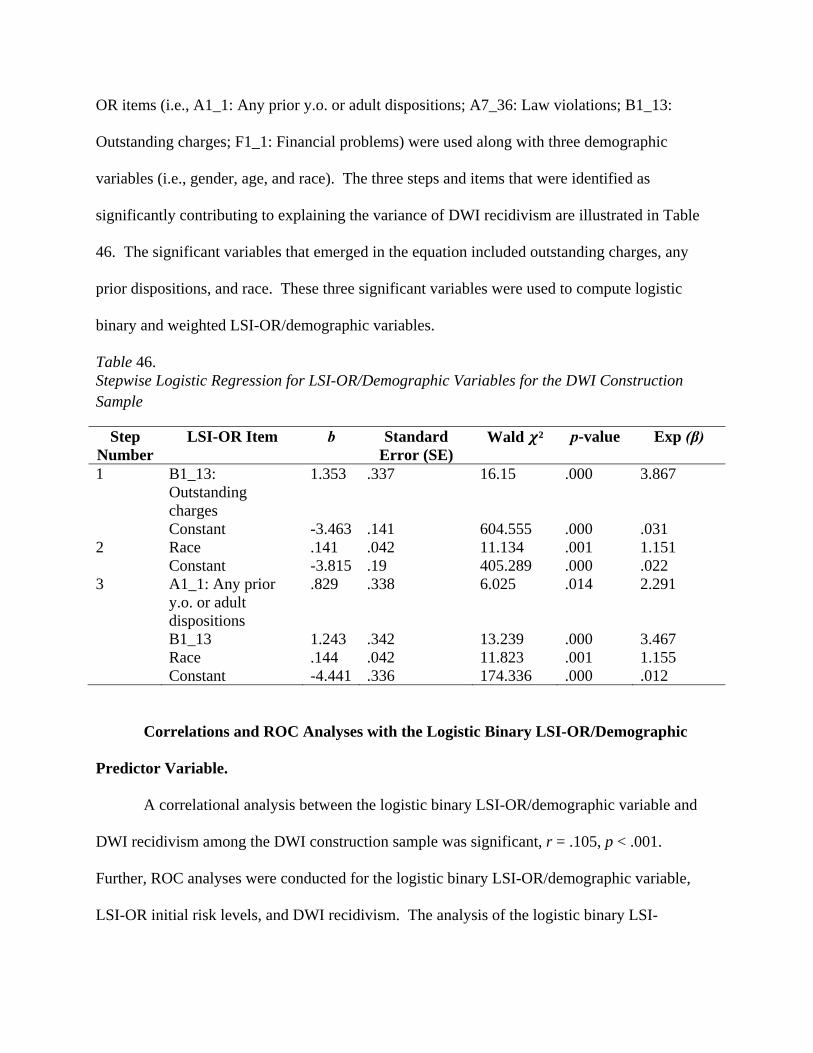
OR items (i.e., A1_1: Any prior y.o. or adult dispositions; A7_36: Law violations; B1_13:
Outstanding charges; F1_1: Financial problems) were used along with three demographic
variables (i.e., gender, age, and race). The three steps and items that were identified as
significantly contributing to explaining the variance of DWI recidivism are illustrated in Table
46. The significant variables that emerged in the equation included outstanding charges, any
prior dispositions, and race. These three significant variables were used to compute logistic
binary and weighted LSI-OR/demographic variables.
Table 46. Stepwise Logistic Regression for LSI-OR/Demographic Variables for the DWI Construction Sample
Step Number
LSI-OR Item b Standard Error (SE)
Wald ² p-value Exp (β)
1 B1_13: Outstanding charges
1.353 .337 16.15 .000 3.867
Constant -3.463 .141 604.555 .000 .031 2 Race .141 .042 11.134 .001 1.151 Constant -3.815 .19 405.289 .000 .022 3 A1_1: Any prior
y.o. or adult dispositions
.829 .338 6.025 .014 2.291
B1_13 1.243 .342 13.239 .000 3.467 Race .144 .042 11.823 .001 1.155 Constant -4.441 .336 174.336 .000 .012
Correlations and ROC Analyses with the Logistic Binary LSI-OR/Demographic
Predictor Variable.
A correlational analysis between the logistic binary LSI-OR/demographic variable and
DWI recidivism among the DWI construction sample was significant, r = .105, p < .001.
Further, ROC analyses were conducted for the logistic binary LSI-OR/demographic variable,
LSI-OR initial risk levels, and DWI recidivism. The analysis of the logistic binary LSI-
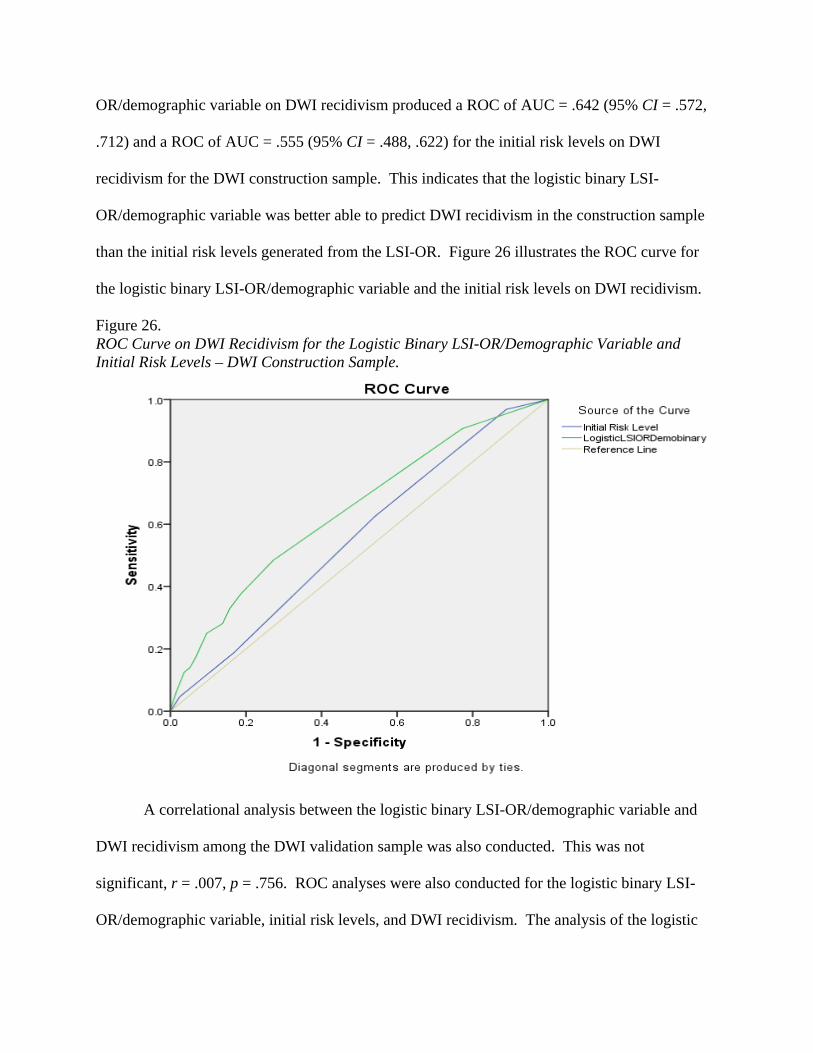
OR/demographic variable on DWI recidivism produced a ROC of AUC = .642 (95% CI = .572,
.712) and a ROC of AUC = .555 (95% CI = .488, .622) for the initial risk levels on DWI
recidivism for the DWI construction sample. This indicates that the logistic binary LSI-
OR/demographic variable was better able to predict DWI recidivism in the construction sample
than the initial risk levels generated from the LSI-OR. Figure 26 illustrates the ROC curve for
the logistic binary LSI-OR/demographic variable and the initial risk levels on DWI recidivism.
Figure 26. ROC Curve on DWI Recidivism for the Logistic Binary LSI-OR/Demographic Variable and Initial Risk Levels – DWI Construction Sample.
A correlational analysis between the logistic binary LSI-OR/demographic variable and
DWI recidivism among the DWI validation sample was also conducted. This was not
significant, r = .007, p = .756. ROC analyses were also conducted for the logistic binary LSI-
OR/demographic variable, initial risk levels, and DWI recidivism. The analysis of the logistic

binary LSI-OR/demographic variable on DWI recidivism produced a ROC of AUC = .545 (95%
CI = .479, .612) and a ROC of AUC = .579 (95% CI = .510, .647) for the initial risk levels on
DWI recidivism for the DWI validation sample. The initial risk levels generated from the LSI-
OR were slightly better able to predict DWI recidivism in the DWI validation sample than the
logistic binary LSI-OR/demographic variable. In fact, the logistic binary LSI-OR/demographic
variable had a confidence level that was below .5 and, therefore, it is not a significant predictor
of DWI recidivism. Figure 27 presents the ROC curve for the logistic binary LSI-
OR/demographic variable and the initial risk levels on DWI recidivism.
Figure 27. ROC Curve on DWI Recidivism for the Logistic Binary LSI-OR/Demographic Variable and Initial Risk Levels – DWI Validation Sample.
Finally, a correlation was generated between the logistic binary LSI-OR/demographic
variable and DWI recidivism among the non-DWI sample and was found to be non-significant, r
= .006, p = .135. As well, ROC analyses were conducted for the logistic binary LSI-
OR/demographic variable, initial risk levels, and DWI recidivism. The analysis of the logistic
binary LSI-OR/demographic variable on DWI recidivism produced a ROC of AUC = .548 (95%
CI = .524, .573) and a ROC of AUC = .543 (95% CI = .518, .568) for the initial risk levels on
DWI recidivism for the non-DWI sample. The logistic binary LSI-OR/demographic variable
was only slightly better able to predict DWI recidivism in the non-DWI sample than the initial
risk levels generated from the LSI-OR. However, both were weak predictors. Figure 28 presents
the ROC curve for the logistic binary LSI-OR/demographic variable and the initial risk levels on
DWI recidivism.
Figure 28. ROC Curve on DWI Recidivism for the Logistic Binary LSI-OR/Demographic Variable and Initial Risk Levels – Non-DWI Sample.

Correlations and ROC Analyses with the Logistic Weighted LSI-OR/ Demographic
Predictor Variable.
The weighted version of the LSI-OR/demographic predictor variable was also computed.
It was weighted using the unstandardized beta coefficients. A correlation between the logistic
weighted LSI-OR/demographic variable and DWI recidivism among the DWI construction
sample was significant, r = .137, p < .001. Further, ROC analyses were conducted for the
logistic weighted LSI-OR/demographic variable, LSI-OR initial risk levels, and DWI recidivism.
The analysis of the logistic weighted LSI-OR/demographic variable on DWI recidivism
produced a ROC of AUC = .685 (95% CI = .616, .755) and a ROC of AUC = .555 (95% CI =
.488, .622) for the initial risk levels on DWI recidivism for the DWI construction sample. This
indicates that the logistic weighted LSI-OR/demographic variable was much better at predicting
DWI recidivism in the DWI construction sample than the initial risk levels generated from the
LSI-OR. Further, the logistic weighted LSI-OR/demographic variable was better able to predict
DWI recidivism compared to the logistic binary LSI-OR/demographic variable. Figure 29
illustrates the ROC curve for the logistic weighted LSI-OR/demographic variable and the initial
risk levels on DWI recidivism.

Figure 29. ROC Curve on DWI Recidivism for the Logistic Weighted LSI-OR/Demographic Variable and Initial Risk Levels – DWI Construction Sample.
A correlational analysis between the logistic weighted LSI-OR/demographic variable and
DWI recidivism among the DWI validation sample was also conducted and found to be
significant, r = .074, p = .002. In addition, ROC analyses were conducted for the logistic
weighted LSI-OR/demographic variable, initial risk levels, and DWI recidivism. The analysis of
the logistic weighted LSI-OR/demographic variable on DWI recidivism produced a ROC of
AUC = .603 (95% CI = .532, .673) and a ROC of AUC = .579 (95% CI = .51, .647) for the initial
risk levels on DWI recidivism for the DWI validation sample. The logistic weighted LSI-
OR/demographic variable was better at predicting DWI recidivism in the DWI validation sample
compared to the initial risk levels generated from the LSI-OR. It also outperformed the logistic
binary LSI-OR/demographic variable; however, it did not predict as well for the DWI validation

sample as it did for the DWI construction sample. Figure 30 presents the ROC curve for the
logistic weighted LSI-OR/demographic variable and the initial risk levels on DWI recidivism.
Figure 30. ROC Curve on DWI Recidivism for the Logistic Weighted LSI-OR/Demographic Variable and Initial Risk Levels – DWI Validation Sample.
Finally, a correlation was generated between the logistic weighted LSI-OR/demographic
variable and DWI recidivism among the non-DWI sample and was significant, r = .034, p < .001.
ROC analyses were also conducted for the logistic weighted LSI-OR/demographic variable,
initial risk levels, and DWI recidivism. The analysis of the logistic weighted LSI-
OR/demographic variable on DWI recidivism produced a ROC of AUC = .598 (95% CI = .572,
.624) and a ROC of AUC = .543 (95% CI = .518, .568) for the initial risk levels on DWI
recidivism for the non-DWI sample. Again, the logistic weighted LSI-OR/demographic variable
was only slightly better able to predict DWI recidivism in the non-DWI sample than the initial

risk levels generated from the LSI-OR. Figures 31 presents the ROC curve for the logistic
weighted LSI-OR/demographic variable and the initial risk levels on DWI recidivism.
Figure 31. ROC Curve on DWI Recidivism for the Logistic Weighted LSI-OR/Demographic Variable and Initial Risk Levels – Non-DWI Sample.
LSI-OR/Demographic Predictor Variables: Stepwise Multiple Regression.
An analysis to create the MR binary and weighted LSI-OR/demographic predictor
variables utilized stepwise MR to identify items that are predictive of DWI recidivism. The four
steps and items that were identified as significantly contributing to explaining the variance of
DWI recidivism are illustrated in Table 47. These four significant variables were used to
compute the two MR LSI-OR/demographic variables.
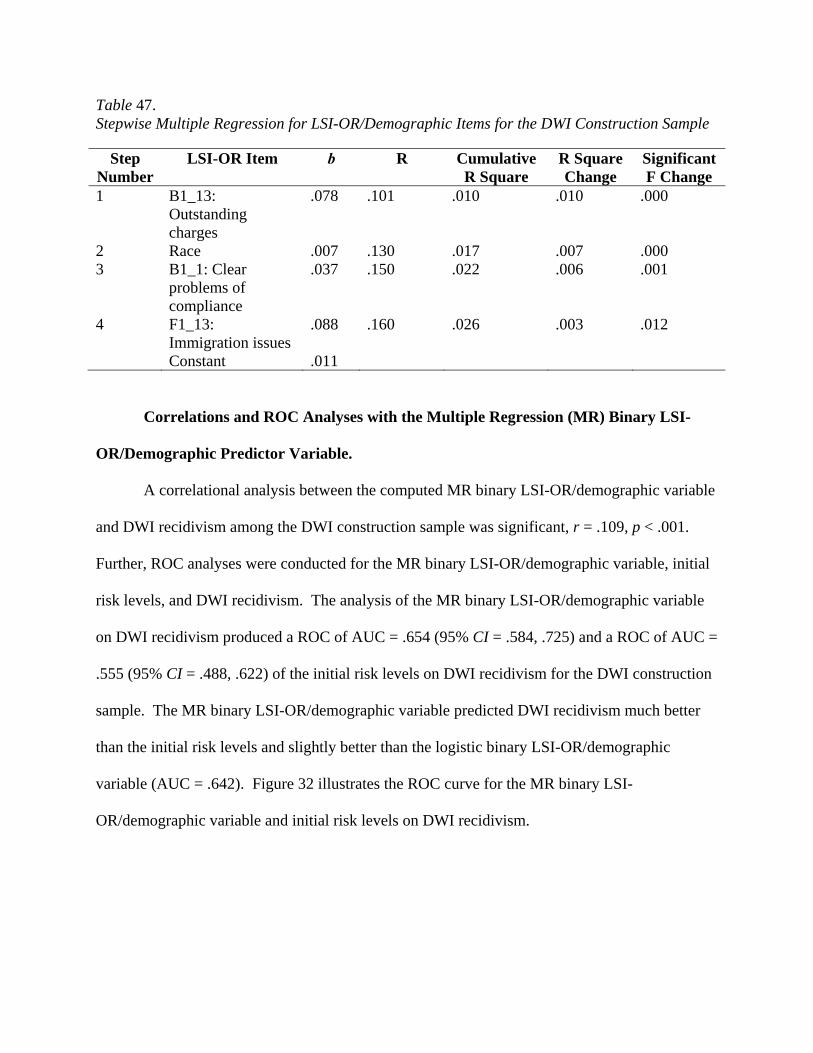
Table 47. Stepwise Multiple Regression for LSI-OR/Demographic Items for the DWI Construction Sample
Step Number
LSI-OR Item b R Cumulative R Square
R Square Change
Significant F Change
1 B1_13: Outstanding charges
.078 .101 .010 .010 .000
2 Race .007 .130 .017 .007 .000 3 B1_1: Clear
problems of compliance
.037 .150 .022 .006 .001
4 F1_13: Immigration issues
.088 .160 .026 .003 .012
Constant .011
Correlations and ROC Analyses with the Multiple Regression (MR) Binary LSI-
OR/Demographic Predictor Variable.
A correlational analysis between the computed MR binary LSI-OR/demographic variable
and DWI recidivism among the DWI construction sample was significant, r = .109, p < .001.
Further, ROC analyses were conducted for the MR binary LSI-OR/demographic variable, initial
risk levels, and DWI recidivism. The analysis of the MR binary LSI-OR/demographic variable
on DWI recidivism produced a ROC of AUC = .654 (95% CI = .584, .725) and a ROC of AUC =
.555 (95% CI = .488, .622) of the initial risk levels on DWI recidivism for the DWI construction
sample. The MR binary LSI-OR/demographic variable predicted DWI recidivism much better
than the initial risk levels and slightly better than the logistic binary LSI-OR/demographic
variable (AUC = .642). Figure 32 illustrates the ROC curve for the MR binary LSI-
OR/demographic variable and initial risk levels on DWI recidivism.

Figure 32. ROC Curve on DWI Recidivism for the MR Binary LSI-OR/Demographic Variable and Initial Risk Levels – DWI Construction Sample.
A correlational analysis between the MR binary LSI-OR/demographic variable and DWI
recidivism among the DWI validation sample was also conducted and was not significant, r =
.009, p = .699. ROC analyses were also conducted for the MR binary LSI-OR/demographic
variable, initial risk levels, and DWI recidivism. The analysis of the MR binary LSI-
OR/demographic variable on DWI recidivism produced a ROC of AUC = .549 (95% CI = .482,
.616) and a ROC of AUC = .579 (95% CI = .510, .647) for the initial risk levels on DWI
recidivism for the DWI validation sample. The MR binary LSI-OR/demographic variable was
worse at predicting DWI recidivism compared to the initial risk levels and the MR binary LSI-
OR/demographic variable in the DWI construction sample. Figure 33 presents the ROC curve
for the MR binary LSI-OR/demographic variable and initial risk levels on DWI recidivism.

Figure 33. ROC Curve on DWI Recidivism for the MR Binary LSI-OR/Demographic Variable and Initial Risk Levels – DWI Validation Sample.
Finally, a correlation was generated between the MR binary LSI-OR/demographic
variable and DWI recidivism among the non-DWI sample and was not significant, r = .003, p =
.447. As well, ROC analyses were conducted for the MR binary LSI-OR/demographic variable,
initial risk levels, and DWI recidivism. The analysis of the MR binary LSI-OR/demographic
variable on DWI recidivism produced a ROC of AUC = .533 (95% CI = .507, .559) and a ROC
of AUC = .543 (95% CI = .518, .568) for the initials risk levels on DWI recidivism for the non-
DWI sample. The initial risk levels were slightly better at predicting DWI recidivism in the non-
DWI sample compared to the MR binary LSI-OR/demographic variable. Also, the logistic
binary LSI-OR/demographic variable was slightly better able to predict DWI recidivism
compared to the MR binary LSI-OR/demographic variable. Figure 34 portrays the ROC curve
for the MR binary LSI-OR/demographic variable and initial risk levels on DWI recidivism.

Figure 34. ROC Curve on DWI Recidivism for the MR Binary LSI-OR/Demographic Variable and Initial Risk Levels – Non-DWI Sample.
Correlations and ROC Analyses with the MR Weighted LSI-OR/Demographic
Predictor Variable.
The weighted version of the MR LSI-OR/demographic predictor variable was also
computed. It was weighted using the unstandardized beta coefficients. A correlation between
the MR weighted LSI-OR/demographic variable and DWI recidivism among the DWI
construction sample was significant, r = .086, p < .001. Further, ROC analyses were conducted
for the MR weighted LSI-OR/demographic variable, LSI-OR initial risk levels, and DWI
recidivism. The analysis of the MR weighted LSI-OR/demographic variable on DWI recidivism
produced a ROC of AUC = .648 (95% CI = .578, .718) and a ROC of AUC = .555 (95% CI =
.488, .622) for the initial risk levels on DWI recidivism for the DWI construction sample. This
portrays that the MR weighted LSI-OR/demographic variable was much better able to predict

DWI recidivism in the DWI construction sample than the initial risk levels generated from the
LSI-OR. However, it was a slightly poorer predictor of DWI recidivism than the MR binary
LSI-OR/demographic variable. Figure 35 illustrates the ROC curve for the MR weighted LSI-
OR/demographic variable and the initial risk levels on DWI recidivism.
Figure 35. ROC Curve on DWI Recidivism for the MR Weighted LSI-OR/Demographic Variable and Initial Risk Levels – DWI Construction Sample.
A correlational analysis between the MR weighted LSI-OR/demographic variable and
DWI recidivism among the DWI validation sample was not significant, r = -.010, p = .677. ROC
analyses were conducted for the MR weighted LSI-OR/demographic variable, initial risk levels,
and DWI recidivism. The analysis of the MR weighted LSI-OR/demographic variable on DWI
recidivism produced a ROC of AUC = .549 (95% CI = .483, .616) and a ROC of AUC = .579
(95% CI = .510, .647) for the initial risk levels on DWI recidivism for the DWI validation
sample. The initial risk levels generated from the LSI-OR were slightly better in predicting DWI
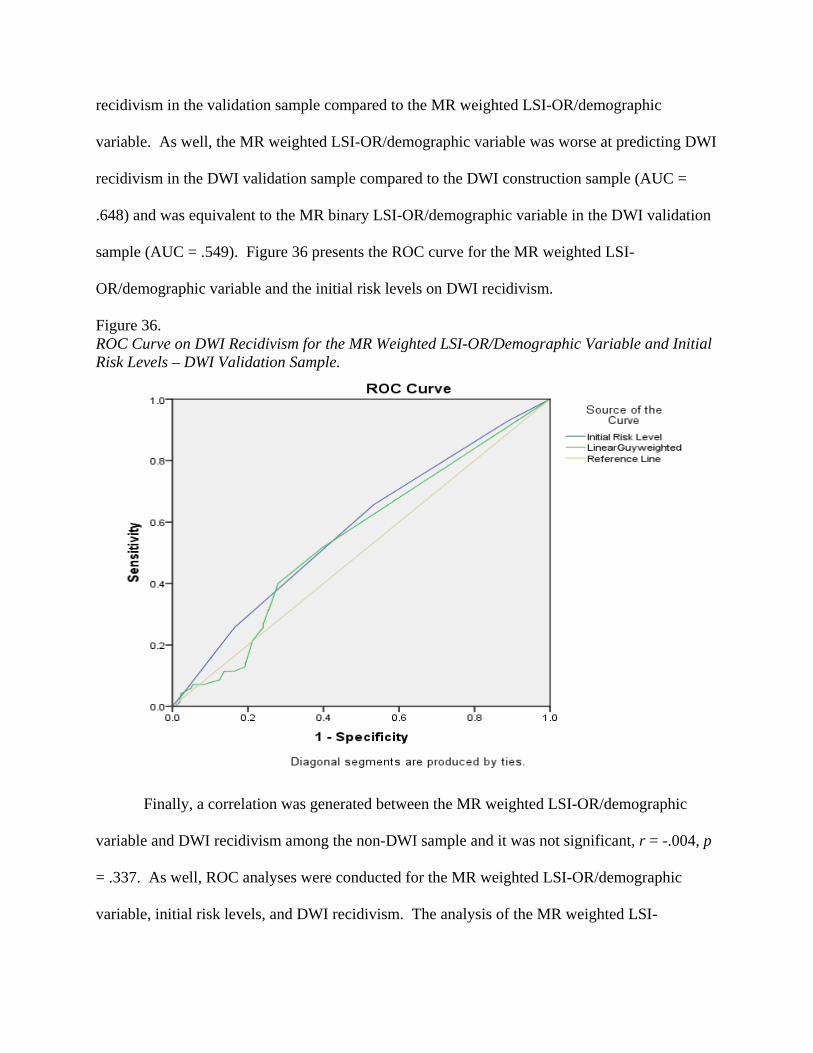
recidivism in the validation sample compared to the MR weighted LSI-OR/demographic
variable. As well, the MR weighted LSI-OR/demographic variable was worse at predicting DWI
recidivism in the DWI validation sample compared to the DWI construction sample (AUC =
.648) and was equivalent to the MR binary LSI-OR/demographic variable in the DWI validation
sample (AUC = .549). Figure 36 presents the ROC curve for the MR weighted LSI-
OR/demographic variable and the initial risk levels on DWI recidivism.
Figure 36. ROC Curve on DWI Recidivism for the MR Weighted LSI-OR/Demographic Variable and Initial Risk Levels – DWI Validation Sample.
Finally, a correlation was generated between the MR weighted LSI-OR/demographic
variable and DWI recidivism among the non-DWI sample and it was not significant, r = -.004, p
= .337. As well, ROC analyses were conducted for the MR weighted LSI-OR/demographic
variable, initial risk levels, and DWI recidivism. The analysis of the MR weighted LSI-

OR/demographic variable on DWI recidivism produced a ROC of AUC = .527 (95% CI = .501,
.552) and a ROC of AUC = .543 (95% CI = .518, .568) for the initial risk levels on DWI
recidivism for the non-DWI sample. The initial risk levels generated from the LSI-OR were
slightly better able to predict DWI recidivism in the non-DWI sample than the MR weighted
LSI-OR/demographic variable. In addition, the MR binary LSI-OR/demographic variable was
slightly better able to predict DWI recidivism than the MR weighted LSI-OR/demographic
variable. Figure 37 portrays the ROC curve for the MR weighted LSI-OR/demographic variable
and the initial risk levels on DWI recidivism.
Figure 37. ROC Curve on DWI Recidivism for the MR Weighted LSI-OR/Demographic Variable and Initial Risk Levels – Non-DWI Sample.

Summary of the Correlations and ROC Analyses Among the Samples and LSI-OR
and LSI-OR/Demographic Predictor Variables.
A summary table of the correlations and ROC analyses that were previously discussed
above are presented in Table 48. Both the MR binary and weighted and logistic binary and
weighted LSI-OR variables were better able to predict DWI recidivism with the DWI
construction sample compared to the DWI validation sample, with the exception of the MR
weighted LSI-OR variable. A similar pattern of results emerged for the LSI-OR/demographic
predictor variables. As well, the eight variables that were created also predicted DWI recidivism
better than the LSI-OR total score and initial risk levels for the DWI construction sample.
However, this held true for only some of the variables in the DWI validation sample (e.g., MR
binary LSI-OR, logistic weighted LSI-OR/demographic).
Table 48. Summary Tables of the Correlations and ROC Analyses Among the DWI Construction and Validation Samples for LSI-OR and LSI-OR/Demographic Predictor Variables
Predictor Variable DWI Construction Sample
(r, AUC)
DWI Validation Sample (r, AUC)
LSI-OR: MR Binary .143***, .667 .094***, .605 MR Weighted .109***, .609 .159***, .676 Logistic Binary .109***, .660 .074***, .598 Logistic Weighted .088***, .636 .055*, .584 LSI-OR/Demographic: MR Binary .109***, .654 .009, .549 MR Weighted .086***, .648 -.010, .549 Logistic Binary .105***, .642 .007, .545 Logistic Weighted .137***, .685 .074**, .603 LSI-OR Total Score .054*, .580 .058*, .584 LSI-OR Initial Risk Levels .056*, .581 .057*, .582 *** Correlation is significant at or below the .001 level (2-tailed) **Correlation is significant at the .01 level (2-tailed) * Correlation is significant at the .05 level (2-tailed)

A summary table of the correlations and ROC analyses for both the LSI-OR variables and
LSI-OR/demographic variables for the non-DWI samples are illustrated in Table 49. Both MR
and logistic versions of our LSI-OR variable were better able to predict DWI recidivism among
all non-DWI samples compared to the LSI-OR/demographic variables. As well, both MR and
logistic versions of our LSI-OR variable were able to better predict DWI recidivism compared to
the LSI-OR total score and initial risk levels. Even though both the MR and logistic versions of
our LSI-OR variable outperformed the previously mentioned variables, the logistic binary and
weighted versions were better able to predict DWI recidivism compared to both versions of the
MR LSI-OR variables. It is important to note, however, that most predictors were found to be
weak (AUC = .5 - .6 range) with the exception of the logistic weighted LSI-OR variable which
had AUC values that were approaching the .7 range.
Table 49. Summary Tables of the Correlations and ROC Analyses Among the Non-DWI Samples for LSI-OR and LSI-OR/Demographic Predictor Variables
Predictor Variable Non-DWI Total Sample
(r, AUC)
Non-DWI Construction
Sample (r, AUC)
Non-DWI Validation
Sample (r, AUC)
LSI-OR: MR Binary .026***, .580 .024***, .569 .029***, .587 MR Weighted .032***, .591 .028***, .577 .036***, .600 Logistic Binary .042***, .643 .040***, .620 .044***, .641 Logistic Weighted .056***, .687 .055***, .669 .058***, .680 LSI-OR/Demographic: MR Binary .003, .533 .007, .536 -.001, .530 MR Weighted -.004, .527 .001, .531 -.009, .523 Logistic Binary .006, .548 .010, .557 .002, .539 Logistic Weighted .034***, .598 .033***, .600 .034***, .596 LSI-OR Total Score .015***, .561 .013*, .557 .016**, .564 LSI-OR Initial Risk Levels .015***, .554 .014**, .552 .016**, .556 *** Correlation is significant at or below the .001 level (2-tailed) **Correlation is significant at the .01 level (2-tailed) * Correlation is significant at the .05 level (2-tailed)

A summary table of the correlations and ROC analyses for both the LSI-OR variables and
LSI-OR demographic variables for all the validation samples is presented in Table 50. The MR
binary and weighted variables predicted best in the DWI validation sample while the logistic
binary and weighted variables predicted DWI recidivism best with the total validation samples.
As well, both of the MR LSI-OR variables and both of the logistic LSI-OR variables predicted
DWI recidivism better than the LSI-OR total score and initial risk levels. The LSI-
OR/demographic variable did not predict DWI recidivism well with either the construction and
validation samples, with the exception of the DWI construction sample (see Tables 48 - 49).
Table 50. Summary Tables of the Correlations and ROC Analyses Among the Validation Samples for LSI-OR and LSI-OR/Demographic Predictor Variables
Predictor Variable Total Validation Sample
(r, AUC)
DWI Validation Sample
(r, AUC)
Non-DWI Validation
Sample (r, AUC)
LSI-OR: MR Binary .031***, .584 .094***, .605 .029***, .587 MR Weighted .038***, .595 .159***, .676 .036***, .600 Logistic Binary .050***, .645 .074***, .598 .044***, .641 Logistic Weighted .064***, .684 .055*, .584 .058***, .680 LSI-OR/Demographic: MR Binary .000, .526 .009, .549 -.001, .530 MR Weighted -.009, .520 -.010, .549 -.009, .523 Logistic Binary .002, .536 .007, .545 .002, .539 Logistic Weighted .037***, .593 .074**, .603 .034***, .596 LSI-OR Total Score .008, .552 .058*, .584 .016**, .564 LSI-OR Initial Risk Levels .015**, .546 .057*, .582 .016**, .556 *** Correlation is significant at or below the .001 level (2-tailed) **Correlation is significant at the .01 level (2-tailed) * Correlation is significant at the .05 level (2-tailed)

LSI-OR Total Score and Initial Index DWI Charges
A logistic stepwise regression was conducted using the LSI-OR total score and the total
number of DWI convictions among the index (current) offences as predictor variables and DWI
recidivism as the outcome variable. The analysis was conducted on the DWI offenders in the
construction sample. However, only the LSI-OR total score was significant. Therefore, the
ROC analysis was conducted with only the LSI-OR total score for both the DWI construction
and validation samples and the corresponding AUCs and confidence intervals are provided in
Table 51. A logistic regression using the enter method was also conducted on the DWI offenders
in the construction sample to ensure that both variables were included in the model and, again,
the only significant predictor that emerged was the LSI-OR total score. However, a composite
measure using these two variables was created. Further, the ROC analysis was conducted with
this composite measure (i.e., LSI-OR total score/number of current DWI offences) for both the
DWI construction and validation samples (see Table 51).
Table 51. Summary Tables of the ROC Analyses Among the DWI Construction and Validation Samples for LSI-OR Predictor Variable on DWI Recidivism
Predictor Variable DWI Construction Sample (AUC, 95% CI)
DWI Validation Sample (AUC, 95% CI)
LSI-OR Total Score: Logistic Stepwise Binary LSI-OR Total Score Plus Number of Current DWI Offences Logistic Enter Binary
.580 (.512, .647)
.580 (.513, .648)
.584 (.519, .649)
.585 (.520, .650)

The preceding logistic stepwise regression was repeated on the full construction sample
(DWI and non-DWI offenders). Both predictor variables were significant predictors, with the
number of DWI current offences entering on step 1 and the LSI-OR total score entering on step
2. A composite (weighted) predictor variable was computed using the unstandardized beta
coefficients as follows: LSI-OR total score/initial DWI charges = 1.229 initial DWI charges +
.018 LSI-OR total score. The standardized beta coefficients for current DWI charges and LSI-
OR total score were 3.419 (p < .001) and 1.018 (p = .005), respectively. The ROC analysis was
conducted with the composite variable for both the total construction and validation samples.
The corresponding AUCs and confidence intervals are provided in Table 52.
Table 52. Summary Tables of the ROC Analyses Among the Total Construction and Validation Samples for LSI-OR and Initial DWI Charges Predictor Variable on DWI Recidivism
Predictor Variable Total Construction Sample (AUC, 95% CI)
Total Validation Sample (AUC, 95% CI)
LSI-OR Total Score Plus Number of Current DWI Offenses:
Logistic Weighted .628 (.595, .660) .647 (.615, .680)
Discussion
The current study examined the predictive accuracy of the LSI-OR with DWI provincial
offenders in Ontario. DWI and non-DWI custody and community offenders were compared to
assess the unique differences that exist within these offender populations, as well as to compare
the performance of the LSI-OR. DWI offenders were most likely to be older, male, and
Caucasian. This held true for both DWI custody and community offenders. Similarly, past
research (Oklahoma Department of Corrections, 2011; Perreault, 2013) has also found that DWI
offenders tend to be male. With respect to age, the average age at release for our DWI offenders
was 41 years, which is consistent with another study (Oklahoma Department of Corrections,
2011) which reported the average age of DWI offenders to be approximately 41.8 years.
However, other research (Chang et al., 2001a; Hanson, 2009; Perreault, 2013) has found that
DWI offenders tend to be young (i.e., 20-35 years of age) with the rate slowly declining with
age. A possible explanation is that this may not have been these offenders’ first index offence of
DWI charges, as they may have encountered DWI charges earlier in their lives.
There was also a large representation of Aboriginal offenders in all of our groups of
offenders. This was not surprising, as Aboriginal peoples continue to be overrepresented in
Ontario’s correctional system, as is the case nationally (MCSCS, 2011). This finding is also
consistent with the Oklahoma Department of Corrections’ (2011) finding that a large portion of
DWI offenders were highly represented among Caucasians and Native Americans. Another
interesting finding in our study regarding ethnicity was the large representation of South Asian
offenders in the DWI group of offenders compared to the non-DWI offender sample, 5.5%
versus 2.7%. DWI offenders in our study also had significantly lower offence severity levels
and, thus, served significantly less time in custody compared to non-DWI offenders. Similar

findings have been reported elsewhere (e.g., Oklahoma Department of Corrections, 2011). DWI
offenders scored significantly lower on all LSI-OR summary measures, with the exception of
strength scores and substance abuse. This finding replicates Wormith et al.’s (2012) results. In
addition, the override feature was used least frequently with DWI offenders, which was also the
case in Wormith et al.’s (2012) examination of the LSI-OR with impaired driving offenders.
Furthermore, both our study and Wormith et al. found that non-DWI offenders had significantly
higher rates of general recidivism and recidivated significantly quicker compared to DWI
offenders. Specifically, the recidivism rate was 30.5% for the total sample, 43% for the custody
sample and 28.8% for the community sample.
Overall, the DWI recidivism rate was low for the total sample (0.8%) but was slightly
higher for the custody sample compared to the community sample, 1% and 0.8%, respectively.
Importantly, our results revealed that the DWI offenders had significantly higher rates of DWI
recidivism compared to the non-DWI sample. Specifically, the DWI recidivism rate for the DWI
offenders was five times more than the recidivism rate for the non-DWI offenders (i.e., 3.6%
versus 0.7%). This is in line with the widely reported (e.g., Ahlin et al., 2011; Cavaiola,
Strohmetz, & Abreo, 2007; Cavaiola et al., 2003; Chang et al., 2001a; Jewell et al., 2008;
Taxman & Piquero, 1998) finding that the majority of impaired driving offences are committed
by a small group of chronic repeat offenders and that prior impaired driving behaviour is a useful
predictor of future impaired driving behaviour. However, some studies have reported contrary
results. Wormith et al. (2012) found that non-DWI offenders had a significantly higher rate of
impaired driving reoffending and reoffended more quickly than DWI offenders.
When examining the custody and community samples of DWI and non-DWI offenders, a
few differences are worth noting. Among the custody offenders, non-DWI offenders served

significantly more days incarcerated. In addition, DWI custody offenders had lower scores on
criminal history compared to the non-DWI custody offenders, but this difference did not
approach significance. Similar to results for the combined custody and community samples,
non-DWI custody offenders had significantly higher rates of general recidivism compared to the
DWI custody offenders (44.1% compared to 30.4%) and non-DWI community offenders had
significantly higher rates of general recidivism compared to the DWI community offenders
(29.5% compared to 17.4%). Wormith et al. (2012) also found that the non-DWI offenders had a
significantly higher rate of general reoffending. Alternatively, the DWI custody offenders had
significantly higher rates of DWI recidivism compared to the non-DWI custody sample (4.3%
versus .7%) and the DWI community offenders had significantly higher rates of DWI recidivism
compared to the non-DWI community sample (3.5% versus .7%). As to be expected, the DWI
custody sample had a higher rate of DWI recidivism compared to the DWI community offenders
(4.3% versus 3.5%). Higher DWI recidivism rates among the DWI offender population is in line
with previous research (e.g., Nochajski & Stasiewicz, 2006) that also found that individuals who
have prior DWI arrest and criminal histories are more likely to recidivate with an impaired
driving offence. A majority of offenders in both custody groups (74.2% DWI and 79.5% non-
DWI custody) received subsequent custodial sentences for their recontact offence. A higher
proportion of both DWI and non-DWI community offenders also received more custodial
sentences for their recontact offence; however, this finding was not significant for either of the
community offender groups.
Interestingly, the non-DWI offenders incurred significantly more DWI recontact charges
compared to the DWI offenders. This held true for both the custody and community non-DWI
offenders. A possible explanation for this finding is that offenders in the non-DWI sample may

have previously incurred DWI charges prior to the index offence for which that they were most
recently captured. Our data did not allow for an accumulation of a life history of DWI index
offences. Thus, non-DWI offenders could have prior impaired driving index offences that were
not captured by our dataset.
Overall, our results indicated that the LSI-OR was applicable to the DWI offenders as
nearly all of the correlations between the LSI-OR and general recidivism were significant, with
the exception of the strength score for the DWI custody offenders. Interestingly, it would be
expected that the total strength score would be negatively correlated with recidivism. However,
our findings did not indicate that strength was negatively correlated with general recidivism for
the DWI custody offenders nor was it significant. All of the correlations between general
recidivism and the LSI-OR were significant for the non-DWI offenders. Further, many
correlations were significant for both the DWI and non-DWI offenders between DWI recidivism
and the LSI-OR (i.e., general risk/needs score, initial risk level, final risk level, criminal history,
and substance abuse). In addition, the companions and anti-social patterns sections were also
significant for the DWI offenders, while the education/employment subscale was significant for
the non-DWI offenders. There were no significant correlations among the LSI-OR variables and
DWI recidivism for the DWI custody offenders. However, due to the low base rate of DWI
recidivism, the correlations that were obtained need to be cautiously interpreted; the AUCs,
which are discussed below, are more appropriate in this case.
The results from the ROC analyses that examined the LSI-OR total and section scores
with general recidivism for the various groups of offenders suggested that the LSI-OR and its
subscales were better able to predict general recidivism in the non-DWI sample compared to the
DWI sample. This held true for both custody and community non-DWI offender samples. In

contrast, the LSI-OR and its subscales were better able to predict DWI recidivism in the DWI
sample compared to the non-DWI sample, except in the case of custody offenders. Correlations
and ROC analyses were also employed to examine if the total number of impaired driving
offences was associated and predictive of general and DWI recidivism. This correlation was not
significant for DWI recidivism (r = .022, p = .158) among the DWI offenders and we found that
impaired driving charges were relatively equivalent in being able to predict general and DWI
recidivism among all offender groups (all AUC values were within the .500 range); however, the
predictive accuracy was slightly better for DWI offenders than non-DWI offenders. Overall, the
ability of impaired driving charges to predict general and DWI recidivism was weak with no
AUC values approaching the .7 range.
The ROC analyses on our logistic LSI-OR variable and DWI recidivism indicated that
our logistic LSI-OR variables, binary and weighted, outperformed the initial risk levels generated
by the LSI-OR among the DWI construction, DWI validation, and non-DWI construction and
validation samples. In fact, the logistic LSI-OR binary variable was found to predict DWI
recidivism for the construction (AUC = .660) and validation samples (AUC = .598) better than
the general risk/need total score (AUC = .582) of the LSI-OR for DWI offenders. This also held
true for the logistic weighted LSI-OR variable for both the DWI construction (AUC = .636) and
validation samples (AUC = .584; just slightly better). As well, the logistic LSI-OR binary
variable (AUC = .643) and logistic LSI-OR weighted variable (AUC = .687) was found to
predict DWI recidivism for the non-DWI sample better than the general risk/need total score
(AUC = .561) of the LSI-OR for non-DWI offenders. Otherwise, our logistic binary LSI-OR
variable was best for predicting DWI recidivism among the DWI construction and validation

samples, while the logistic weighted LSI-OR variables was best for predicting DWI recidivism
for the non-DWI sample.
Further, our logistic LSI-OR/demographic variable (binary and weighted) which included
LSI-OR items and demographic variables also outperformed the initial risk levels generated by
the LSI-OR among the construction, validation and non-DWI samples, with the exception of the
binary in the DWI validation sample. It was found that our logistic LSI-OR/demographic
variable predicted DWI recidivism better when the variable was weighted compared to when the
variable was binary.
The ROC analyses on our MR LSI-OR variable and DWI recidivism indicated that our
MR LSI-OR variables, binary and weighted, outperformed the initial risk levels generated by the
LSI-OR among the DWI construction, DWI validation, and non-DWI construction and
validation samples. In fact, the MR LSI-OR binary variable was found to predict DWI
recidivism for the construction (AUC = .667) and validation samples (AUC = .605) better than
the general risk/need total score (AUC = .582) of the LSI-OR for DWI offenders. This also held
true for the MR weighted LSI-OR variable for both the DWI construction (AUC = .609) and
validation samples (AUC = .676). As well, the MR LSI-OR binary variable (AUC = .580) and
MR LSI-OR weighted variable (AUC = .591) was found to predict DWI recidivism for the non-
DWI sample better than the general risk/need total score (AUC = .561) of the LSI-OR for non-
DWI offenders. Otherwise, our MR binary LSI-OR variable was best for predicting DWI
recidivism among the DWI construction samples and the MR weighted LSI-OR variables were
best for predicting DWI recidivism for the DWI validation and non-DWI sample.
As well, our MR LSI-OR/demographic variable (binary and weighted) which included
LSI-OR items and demographic variables also outperformed the initial risk levels generated by

the LSI-OR among the DWI construction sample. However, this did not hold true for the DWI
validation and non-DWI samples. The initial risk levels of the LSI-OR predicted DWI
recidivism better than the MR LSI-OR/demographic variable (binary and weighted) for the DWI
validation and non-DWI samples. It was found that our MR LSI-OR/demographic variable
predicted DWI recidivism better when the variable was binary compared to when the variable
was weighted.
In summary, the eight variables that were created (i.e., MR binary and weighted and
logistic binary and weighted LSI-OR and LSI-OR/demographic) were better able to predict DWI
recidivism with the DWI construction sample compared to the DWI validation sample, with the
exception of the MR weighted LSI-OR variable. As well, the eight variables also predicted DWI
recidivism better than the LSI-OR total score and initial risk levels for the DWI construction
sample. However, the LSI-OR total score and initial risk levels predicted DWI recidivism better
than the logistic weighted LSI-OR variable in the DWI validation sample, and the MR binary
LSI-OR/demographic variable, the MR weighted LSI-OR/demographic variable, and the logistic
binary LSI-OR/demographic in the total, DWI and non-DWI validation samples. The MR binary
and weighted variables predicted best in the DWI validation sample while the logistic binary and
weighted variables predicted DWI recidivism best with the total validation samples.
Overall, the logistic weighted LSI-OR/demographic variable predicted DWI recidivism
best (AUC = .685) with the construction sample, the MR weighted LSI-OR predicted DWI
recidivism best (AUC = .676) with the validation sample, and the logistic weighted LSI-OR
variable predicted DWI recidivism best with the non-DWI sample (AUC = .687) and the total
validation sample (AUC = .684). It is not surprising that the computed logistic variables tended
to be better predictors of DWI recidivism than the computed MR variables given that reicidivism

was measured in a binary fashion, making logistic regression the more appropriate statistical
procedure to apply. Both MR and logistic versions of our LSI-OR variable were better able to
predict DWI recidivism among all non-DWI samples compared to the LSI-OR/demographic
variables. The LSI-OR/demographic variable did not predict DWI recidivism well with many of
the samples, with the exception of being a great predictor in the DWI construction sample.
Importantly, most predictors were found to be weak (AUC = .5 to .6 range) with the exception of
the logistic weighted LSI-OR variable which had AUC values that were approaching the .7
range.
Limitations
An identified limitation in our study included the use of only general and DWI recidivism
rather than examining other types of recidivism such as violent recidivism. Furthermore, our
dataset captured only index offences and not offenders’ past index offences. Thus, some of the
non-DWI offenders could have possibly had DWI index offences in their past criminal history.
Such information would be helpful in interpreting the results that were obtained in the study
(such as non-DWI offenders having a higher number of DWI recontact offences). Another
identified limitation pertained to the recidivism outcome. That is, only an offender’s first
recidivistic event was captured in the dataset. It would have been informative to examine all
DWI recidivistic events for all of the offenders which may have led to a higher base rate of DWI
recidivism, but was beyond the scope of this project. Finally, the use of correlations in the
analysis of DWI recidivism and LSI-OR scores should be interpreted with caution as correlations
are not reliable below 20%.

Future Directions
A possible direction for future research may include the development of a risk assessment
tool designed and validated on DWI offenders. As well, a replication of this study factoring in
an examination of all offenders’ past DWI offences and DWI recidivistic events which could
significantly increase the DWI offender sample size and possibly result in a higher base rate of
DWI recidivism may clarify some of the results in the present study.
Conclusion
The findings of our study added to the literature on DWI offenders (e.g., lower recidivism
rates compared to the general offender population) and confirmed specific risk factors (e.g.,
male, ethnicity). As DWI risk assessment is greatly needed for this offender population, our
findings demonstrated that the LSI-OR has moderate predictive accuracy for both DWI and non-
DWI custody and community offenders. However, our results proved that the LSI-OR was more
effective in predicting general recidivism with non-DWI offenders (which is to be expected as it
was originally designed for use with the general offender population) and more effective in
predicting DWI recidivism with DWI community offenders. Further, our computed versions of
the LSI-OR variable outperformed the original LSI-OR total scores and initial risk levels in
predicting DWI recidivism. However, all of the AUCs were still weak and did not achieve the
desired .7 range. Therefore, more research is needed in order to find a risk assessment tool that
strongly predicts DWI recidivism.

References
Ahlin, E. M., Zador, P. L., Rauch, W. J., Howard, J. M., & Duncan, G. D. (2011). First-time
DWI offenders are at risk of recidivating regardless of sanctions imposed. Journal of
Criminal Justice, 39, 137-142.
American Psychiatric Association. (2000). Diagnostic and statistical manual of mental
disorders: DSM-IV-TR (4th ed., text rev.). Washington, DC: Author.
Anderson, B. J., Snow, R.W., & Wells-Parker, E. (2000). Comparing the predictive validity of
DUI risk screening instruments: Development of validation standards. Addiction, 95,
915–929.
Andrews, D. A., & Bonta, J. (2010). The psychology of criminal conduct (5th ed.). Cincinnati,
OH: Anderson.
Andrews, D. A., & Bonta, J. (1995). The Level of Service Inventory-Revised. Toronto, Canada:
Multi-Health Systems.
Andrews, D. A., Bonta, J., & Wormith, J. S. (2006). The recent past and near future of risk
and/or need assessment. Crime & Delinquency, 52, 7-27.
Andrews, D. A., Bonta, J., & Wormith, J. S. (2004). The Level of Service/Case Management
Inventory (LS/CMI). Toronto, Canada: Multi-Health Systems.
Andrews, D. A., Bonta, J., & Wormith, J. S. (1995). The LSI-OR: Interview and scoring guide.
Toronto, ON: Ontario Ministry of Solicitor General and Correctional Services.
Bartol, C. R., & Bartol, A. M. (2011). Criminal behavior: A psychological approach (9th ed.).
Upper Saddle River, New Jersey: Prentice Hall.
Beck, K. H., Rauch, W. J., Baker, E. A., & Williams, A. F. (1999). Effects of Ignition Interlock
license restrictions on drivers with multiple alcohol offenses: A randomized trial in

Maryland. American Journal of Public Health, 89(11), 1696-1700.
Behaviour Data Systems, Ltd. (2005). Driver Risk Inventory-II (DRI-II): An inventory of
scientific findings (Volume 1). Phoenix, AZ. Retrieved from http://www.online-
testing.com/documents/DRI-II/DRISci.pdf
Behaviour Data Systems, Ltd. (1992). Driver Risk Inventory (DRI): An inventory of scientific
findings. Phoenix, AZ. Retrieved from
https://www.ncjrs.gov/pdffiles1/Photocopy/142543NCJRS.pdf
Behaviour Data Systems, Ltd. (1985). Driver Risk Inventory (DRI). Phoenix, AZ.
Bishop, N. J. (2011). Predicting rapid DUI recidivism using the Driver Risk Inventory on a state-
wide sample of Floridian DUI offenders. Drug and Alcohol Dependence, 118, 423-429.
Bouffard, J. A. & Richardson, K. A. (2007). The effectiveness of Drug Court programming for
specific kinds of offenders: Methamphetamine and DWI offenders versus other drug-
involved offenders. Criminal Justice Policy Review, 18(3), 274-293.
Brennan, T., & Oliver, W. L. (2000). Evaluation of reliability and validity of COMPAS scales:
National aggregate sample. Traverse City, MI: Northpointe Institute for Public
Management.
Cavaiola, A., Strohmetz, D., & Abreo, S. (2007). Characteristics of DUI recidivists: A 12-year
follow-up study of first time DUI offenders. Addictive Behaviors, 32, 855-861.
Cavaiola, A., Strohmetz, D., Wolf, J., & Lavender, N. (2003). Comparison of DWI offenders
with non-DWI individuals on the MMPI-2 and the Michigan Alcoholism Screening
Test. Addictive Behaviors, 28, 971-977.
C’ de Baca, J., Miller, W. R., & Lapham, S. (2001). A multiple risk factor approach for
predicting DWI recidivism, Journal of Substance Abuse Treatment, 21, 207-212.

Chang, I., Gregory, C., & Lapham, S.C. (2002). Review of screening instruments and procedures
for evaluating DWI offenders. Washington DC: AAA Foundation for Traffic Safety.
Chang, I., Lapham, S. C., C'de Baca, J., & Davis, J. W. (2001a). Alcohol Use Inventory:
Screening and assessment of first-time driving-while-impaired offenders. II. Typology
and predictive validity. Alcohol & Alcoholism, 36, 122-130.
Chang, I., Lapham, S. C., & Wanberg, K. W. (2001b). Alcohol Use Inventory: Screening and
assessment of first-time driving-while-impaired offenders. I. Reliability and profiles.
Alcohol & Alcoholism, 36, 112-121.
Change the Conversation. (n.d.). Drinking and driving facts: Effective strategies to reduce
impaired driving. Retrieved from
http://changetheconversation.ca/drinking_and_driving_facts/other_strategies.php
DeMichele, M., & Lowe, N.C. (2011). DWI recidivism: Risk implications for community
supervision. Federal Probation, 75, 19–24.
DeMichele, M., & Payne, B. (2012). Predicting repeat DWI: Chronic offending, risk assessment,
and community supervision. National Criminal Justice Reference Service. Retrieved
from: https://www.appa-net.org/eweb/docs/APPA/PRDWI-DRAFT.pdf
DUI.CA. (2014). Impaired driving in Canada. Retrieved from www.dui.ca
Flores, A. W., Lowenkamp, C. T., Holsinger, A. M., & Latessa, E. J. (2006). Predicting outcome
with the Level of Service Inventory-Revised: The importance of implementation
integrity. Journal of Criminal Justice, 34, 523-529.
Fulkerson, A. (2003). Blow and go: The breath-analyzed Ignition Interlock device as a
technological response to DWI. The American Journal of Drug and Alcohol Abuse,
29(1), 219-235.

Gendreau, P., Little, T., & Goggin, C. (1996). A meta-analysis of the predictors of adult offender
recidivism: What works! Criminology, 34, 575-607.
Girard, L., & Wormith, J. S. (2004). The predictive validity of the Level of Service Inventory-
Ontario Revision on general and violent recidivism among various offender groups.
Criminal Justice and Behavior, 31, 150-181.
Hanley, J. A., & McNeil, B. J. (1983). A method of comparing the areas under receiver operating
characteristic curves derived from the same cases. Radiology, 148, 839-843.
Hanson, D. J. (2009). Alcohol problems and solutions: Canada’s drunk and impaired driving
laws. Adapted from Fast, Ed. Ending Alcohol-Impaired Driving: A Common Approach.
Report of the Standing Committee on Justice and Human Rights. 40th Parliament, 2nd
Session. Ottawa: House of Commons. Retrieved from
http://www2.potsdam.edu/alcohol/DrivingIssues/20091103093929.html#.VE_-wGfgV1k
Hogg, S. M. (2011). The Level of Service Inventory (Ontario Revision) scale validation for
gender and ethnicity: Addressing reliability and predictive validity (Unpublished
master’s thesis). University of Saskatchewan, Saskatoon, SK.
Holt, L. J., O’Malley, S. S., Rounsaville, B. J., & Ball, S. A. (2009). Depressive symptoms,
drinking consequences, and motivation to change in first time offenders. The American
Journal of Drug and Alcohol Abuse, 35, 117-122.
Horn, J. L., Wanberg, K. W., & Foster, F. M. (2015). Alcohol Use Inventory (AUI). Retrieved
from http://www.statisticssolutions.com/alcohol-use-inventory-aui/
Jewell, J. D., Hupp, S. D. A., & Segrist, D. J. (2008). Assessing DUI risk: Examination of the
behaviours and attitudes drinking and driving scale (BADDS). Addictive Behaviors, 33,
853-865.

Keane, C., Maxim, P., & Teevan, J. (1993). Drinking and driving, self-control and gender:
Testing a general theory of crime. Journal of Research in Crime and Delinquency, 30
374-346.
LaBrie, R.A., Kidman, R.C., Albanese, M., Pellar, A.J., & Shaffer, H.J. (2007). Criminality and
continued DUI offense: Criminal typologies and recidivism among repeat offenders.
Behavioral Sciences and the Law, 25, 603–614.
Lapham, S. C., Kapitula, L. R., C'de Baca, J., & McMillan, G. P. (2006). Impaired-driving
recidivism among repeat offenders following an intensive court-based intervention.
Accident Analysis and Prevention, 38, 162-169.
Latessa, E. J., & Lovins, B. (2010). The role of offender risk assessment: A policy maker guide.
Victims and Offenders, 5, 203-219.
Lowe, N. (2014). Screening for risk and needs using the impaired driving assessment: Final
report. Retrieved from https://www.appa-net.org/eweb/docs/APPA/pubs/SRNUIDA.pdf
MacDonald, J. M., Morral, A. R., Raymond, B., & Eibner, C. (2007). The efficacy of the Rio
Hondo DUI Court: A two year field experiment. Evaluation Review, 4(23), 4-23.
Ministry of Community Safety and Correctional Services. (2011). Crime Prevention in Ontario:
A Framework for Action. Ontario: Author.
Morse, B. J. & Elliott, D. S. (1992). Effects of Ignition Interlock devices on DUI recidivism:
Findings from a longitudinal study in Hamilton County, Ohio. Crime and Delinquency,
38(2), 131-157.
Mothers Against Drunk Driving. (n.d.). Retrieved from http://www.madd.ca/madd2/

Mothers Against Drunk Driving. (2014). Inspire, inform, influence, change: Annual report
2013/2014. MADD Canada. Retrieved from
http://madd.ca/madd2/en/media/pubs_annual_reports.html
Nochajski, T.H., & Stasiewicz, P.R. (2006). Relapse to driving under the influence (DUI): A
review. Clinical Psychology Review, 26, 179–195.
Nuffield, J. (1982). Parole decision making in Canada: Research towards decision guidelines.
Ottawa, ON: Solicitor General of Canada.
Ojmarrh, M., Wilson, D. B., Eggers, A., & MacKenzie, D. L. (2012). Drug courts’ effects on
criminal offending for juveniles and adults. The Campbell Collaboration, 4, 1-86.
Oklahoma Department of Corrections. (2011). DUI offender profile: Analyzing differences
between DUI-specific and general population prison receptions, incarcerates and prison
releases. Oklahoma, OK: Author. Retrieved from
ok.gov/ohso/documents/DUI_PresentationB.pptx
Olver, M. E., Stockdale, K. C., & Wormith, J. S. (2014). Thirty years of research on the Level of
Service scales: A meta-analytic examination of predictive accuracy and sources of
variability. Psychological Assessment, 26, 156-176.
Ontario Ministry of Correctional Services, Research Services Division. (1983). Offences leading
to incarceration. Correctional facts (No. 83-1).
Orton, L. C. (2014). An Examination of the Professional Override in the Level of Service
Inventory - Ontario Revision (LSI-OR) (Unpublished master’s thesis). University of
Saskatchewan, Saskatoon, SK.
Perreault, S. (2013). Impaired driving in Canada, 2011. Juristat Article. Statistics Canada
Catalogue no. 85-002-X. Retrieved from http://www.statcan.gc.ca/pub/85-002-
x/2013001/article/11739-eng.pdf
Pitel, S. & Solomon, R. (2013). Estimating the cost and impairment-related traffic crashes in
Canada: 1999 to 2010. MADD Canada. Retrieved from
http://www.madd.ca/madd2/en/impaired_driving/impaired_driving_statistics.html
Ross, H. L., & Klette, H. (1995). Abandonment of mandatory jail for impaired drivers in Norway
and Sweden. Accident Analysis and Prevention, 27(2), 151-157.
Smith, B. W. (1993). Impaired driving programs–A review of the Canadian experience: What
makes for an effective intervention? (Unpublished master’s thesis). Memorial University
of Newfoundland, St. John’s, Newfoundland, Canada.
Taxman, F. S., & Piquero, A. R. (1998). On preventing drunk driving recidivism: An
examination of rehabilitation and punishment approaches. Journal of Criminal Justice,
26, 129-143.
Traffic Injury Research Foundation. (2014). The road safety monitor 2014: Drinking and
Driving in Canada. Retrieved from
http://www.tirf.ca/publications/PDF_publications/RSM_2014_Drinking_Driving_Eng_2.
Webster, C. D., Douglas, K. S., Eaves, D., & Hart, S. D. (1997). HCR-20: Assessing risk for
violence (Version2). Burnaby, British Columbia: Simon Fraser University.
Weinrath, M. (1997). The Ignition Interlock program for drunk drivers: A multivariate test.
Crime and Delinquency, 43(1), 42-59.
Willis, C., Lybrand, S., & Bellamy, N. (2004). Alcohol ignition interlock programmes for

reducing drink driving recidivism. The Cochrane Database of Systematic Reviews, 18,
CD004168.
Wormith, J. S., Hogg, S. M., & Guzzo, L. (2015). The predictive validity of the LS/CMI with
Aboriginal offenders in Canada. Criminal Justice and Behavior, 42, 481-508.
Wormith, J. S., & Hogg, S. M. (2012). The predictive validity of Aboriginal offender recidivism
with a general risk/needs assessment inventory. Program Effectiveness, Statistics, and
Applied Research, Ministry of Community Safety and Correctional Services. Ottawa,
ON.
Wormith, J. S., Hogg, S. M., & Guzzo, L. (2012). The predictive validity of driving while
intoxicated offenders recidivism with a general risk/needs assessment inventory.
Program Effectiveness, Statistics, and Applied Research, Ministry of Community Safety
and Correctional Services. Ottawa, ON.
Yu, J. (2000). Punishment and alcohol problems: Recidivism among drinking-driving offenders.
Journal of Criminal Justice, 28, 261-270.

Appendix A: University of Saskatchewan Research Ethics Board Approval


