Embed Size (px)
Citation preview
Impedance Spectroscopy of Reactive Polymers. 2. Multifunctional Epoxy/Amine Formulations
FRANCESCO BELLUCCI,' MA10 VALENTINO,' TULLIO MONETTA,' LUlGl NICODEMO,' JOSE KENNY,' LUlGl NICOLAIS,' and JOVAN MlJbVIC**
'Dipartimento di lngegneria dei Materiali e Della Produzione, Universita di Napoli, Piazzale Tecchio 80, Naples, 801 25 Italy; 'Chemical Engineering Department, Polytechnic University, Six Metrotech Center, Brooklyn, New York, 1 1201
SYNOPSIS
Dielectric measurements were utilized to follow the advancement of cure in a bifunctional and a tetrafunctional epoxy/amine formulation. In deferance to earlier dielectric studies of cure, complex impedance was measured and used to calculate ionic resistivity. By using complex impedance we were able to separate, according to their frequency dependence, the contributions to overall polarization from electrode blocking layers, mobile charge carriers, and dipole relaxations. At any stage of cure, there is a unique frequency a t which ionic resistivity can be singularly measured. Our approach does not involve trial-and-error fre- quency search, it measures dielectric response in real time, and is conducive to the devel- opment of phenomenological models based on equivalent circuits. Values of ionic resistivity measured at different cure time and temperature were used to quantify the progress of cure. Excellent agreement was reported between the calculated values of normalized degree of cure obtained by dielectric and calorimetric measurements. It was suggested that apart from the extrinsic conductivity by ionic impurities, an intrinsic mechanism which involves the reactive molecules contributes to the overall ionic conductivity. 0 1995 John Wiley & Sons, Inc. Keywords: impedance dielectric cure monitoring
INTRODUCTION
In situ measurements of dielectric properties of re- active polymer-forming systems have been the focus of considerable interest among polymer scientists and process engineers in the last ten years. The sub- ject has been recently reviewed' and only the prin- cipal features of currently used methods will be highlighted here.
From a process engineer's point of view, the cru- cial stage in the processing of thermoset polymers and their composites occurs prior to gelation. During that stage, an optimal combination of pressure and temperature must be utilized to control the flow of resin and the extent of advancement of the network formation. One way of monitoring the progress of
* To whom correspondence should be addressed. Journal of Polymer Science: Part B: Polymer Physics, Vol. 33,433-443 (1995) 0 1995 John Wiley & Sons, Inc. CCC 0887-6266/95/030433-11
reactions is by dielectric measurements of ionic conductivity (or its reciprocal-ionic resistivity), which has been identified as the dielectric parameter of interest due to its qualitative analogy to the main processing parameters, viscosity, and degree of cure.
During the 1980s, efforts by the teams of Senturia, Day, and c o - ~ o r k e r s , ~ - ~ and later by Kranbuehl and his ~ollaborators,5-~ have led to the development of dielectric sensors. Their methods are based on the assumption that there exists a frequency at which the contribution of ionic conductivity to the overall polarization is much greater than that of dipolar relaxations, while, a t the same time, the effect of electrode polarization is negligible. Seferis and co- workers were first to incorporate resin chemorheol- ogy into a model for the dielectric resp0nse.8.~ Their results covered two decades of frequency and were analyzed in terms of ionic conductivity and complex dielectric constant. Another approach was reported
433
434 BELLUCCI ET AL.
by Johari and his group, who utilized the inverse complex dielectric constant, termed dielectric mod- ulus, to monitor the change in ionic conductivity during cure."
We believe that the herein outlined method for calculation of ionic conductivity, based upon the measurements of complex impedance over a wide frequency range, is a superior analytical tool for the description of dielectric response of reactive poly- mers. The approach we propose offers the following advantages (1) it provides an easier interpretation of results by clearly separating the contributions of electrode blocking layers, migrating charges, and di- poles; (2) it eschews the trial-and-error procedure by yielding a single experimental frequency from which ionic conductivity and resistivity are calcu- lated; (3) it is conducive to the development of phe- nomenological models based on equivalent circuits; and (4) it covers a wide frequency range within which the measurement times are negligible in comparison with the time scale of the changes in polymer net- work. A more detailed description of our method has been reported elsewhere'' and only its salient features are presented below.
The objective of this study was to investigate the applicability of our approach to the monitoring of cure of two multifunctional epoxy/amine formula- tions.
The results presented in this communication are a part of the continuing collaborative program on dielectric behavior of reactive polymeric systems, which is currently underway at the University of Naples and the Polytechnic University.
EXPERIMENTAL
Materials
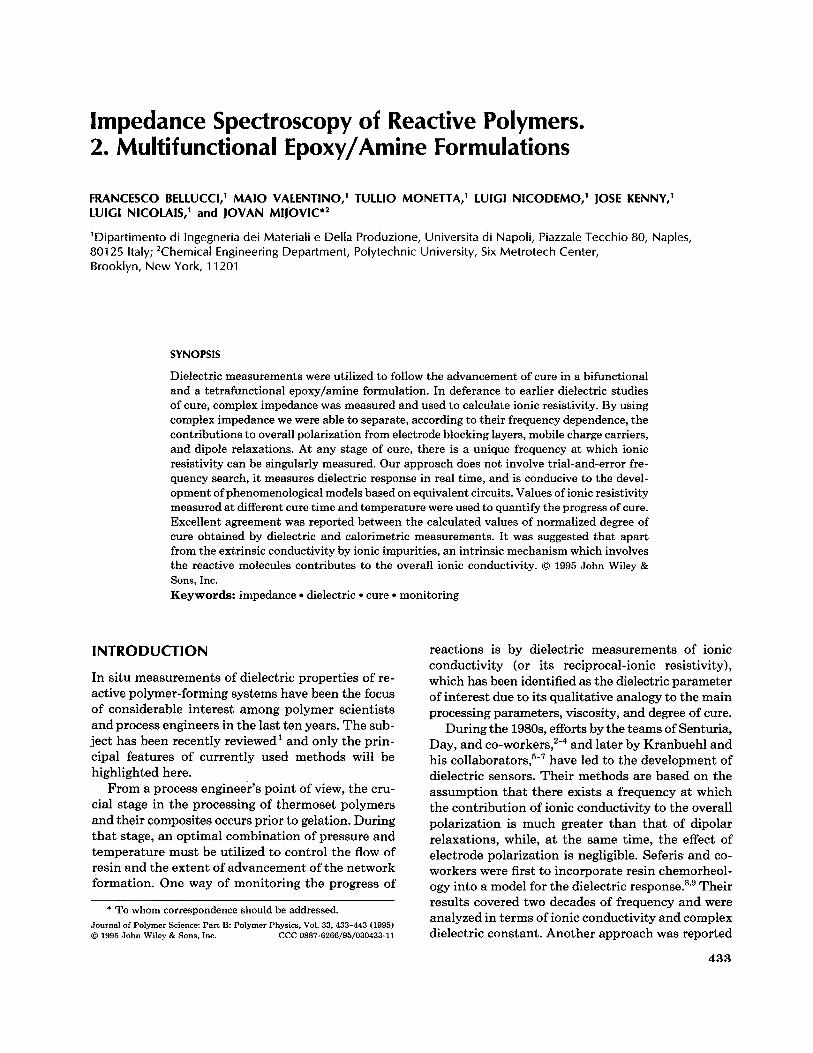
Two epoxy-amine formulations, bifunctional (DGEBA/MDA), and tetrafunctional (TGDDM/ DDS), were investigated. Their chemical composi- tions are shown in Figure 1. The bifunctional for- mulation consisted of the stoichiometric amounts of diglycidyl ether of bisphenol A (DGEBA) epoxy resin (research grade Epon 825; courtesy of Shell Chemical Company) and 4,4'methylenedianiline (MDA) curing agent (Aldrich). The tetrafunctional epoxy resin was based on Ciba-Geigy's MY 720, which contains primarily tetraglycidyl 4,4' diami- nodiphenyl methane (TGDDM) molecules. The curing agent used was 4,4'diaminodiphenyl sulfone (DDS), available from Ciba-Geigy as H T 976 hardener.
DGEBA/MD A
Diglycidyl Ether of Bisphenol A (DGEBA)
Methylene Dianiline (MDA)
TGD DM-DDS
0 0 / t / \
C H ~ - C H - C H ~
H2C-CH-CH2 \ / 0
Tetraglycidyl4,4' Diaminodiphenyl Methane (TGDDM)
0
4,4' Diaminodiphenyl Sulfone (DDS)
Figure 1. Chemical composition of bifunctional (DGEBA/MDA) and tetrafunctional (TGDDM/DDS) epoxy formulations.
Sample Preparation
The bifunctional epoxy resin and amine curing agent were mixed while stirring for about 7 min at 57"C, until a clear mixture was obtained. The mixture was then either tested immediately or poured into glass vials and stored in dry ice for a maximum of 72 h." The tetrafunctional formulation was processed by heating the resin to 130°C and adding the curing agent while stirring, until a homogeneous mixture was ~btained. '~
Technique
Dielectric measurements were performed on a Schlumberger Model 1260 Frequency Response An- alyzer operable in the range from to Hz, equipped with an environmental chamber, and in- terfaced with a computer. At each frequency, a 5 mV AC excitation wave was applied to the metallic elec- trodes and the overall impedance measured. The ex-
IMPEDANCE SPECTROSCOPY OF POLYMERS 435
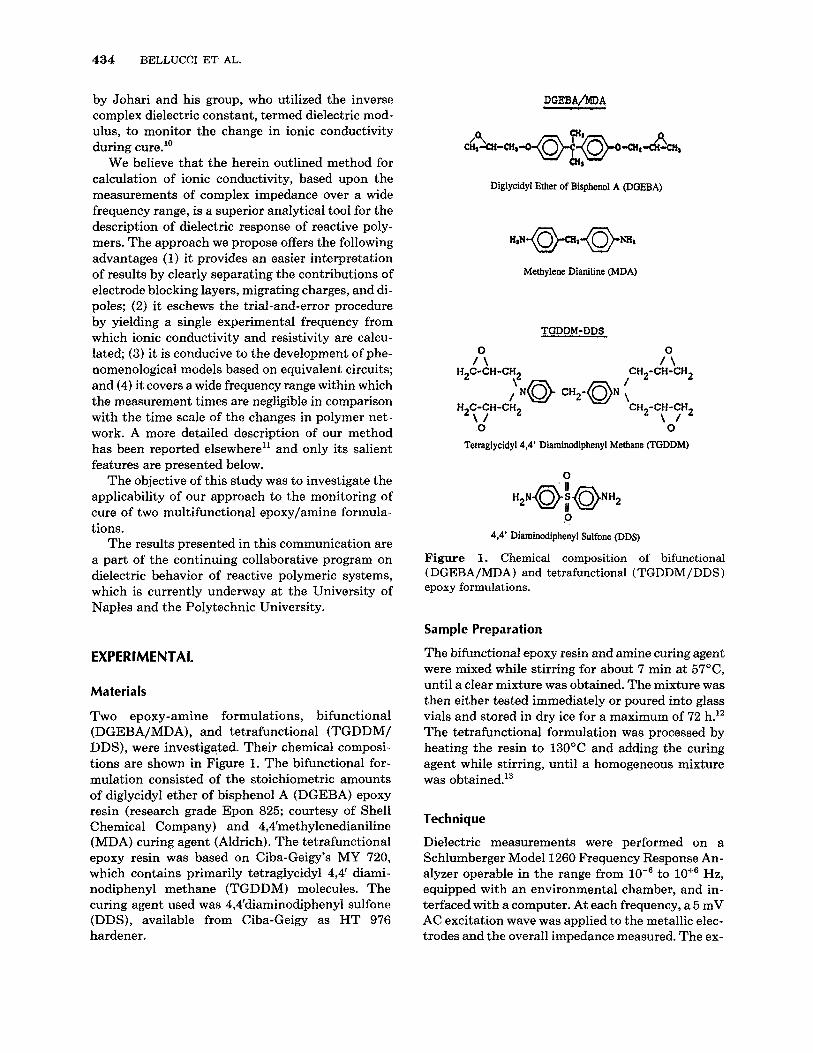
citation frequency was varied from the maximum of lof5 Hz to a minimum value that depended on the time and temperature of the measurement. For each cure time, five steps per frequency decade were taken with the Frequency Response Analyzer in the auto integration mode. The maximum number of inte- gration cycles at each frequency was set a t 20, giving an excellent balance between integration speed and accuracy. The time required to complete a frequency sweep depended on the lowest value of frequency (fmin) employed during the run and was approxi- mately given by 20/fmin. The time scale of the ex- periment was negligible in comparison with the time scale of the changes in the polymer network, and hence each measurement can be taken to represent an isostructural state. Following each frequency sweep, data were stored, corrected for the cell con- stant of the sample and used in the calculations de- scribed below. A schematic diagram of the experi- mental setup is shown in Figure 2A. In the later stages of cure, an adapter was utilized in order to measure impedance values in excess of lo1’ Ohm. The measuring cell, depicted in Figure 2B, consisted of two glass slides separated by a 1 mm thick Teflon spacer. Thin aluminum electrodes, with surface area of 4 cm2, were placed on each glass plate. The cell constant, K = S/L, was equal to 40 cm. Small cell dimensions enabled us to maintain isothermal con- ditions and avoid large temperature gradients. Dur- ing tests the cell was positioned vertically to allow for resin shrinkage (of the order of < 2%) without altering the distance between electrodes.
THE MODELING CONCEPT
Our modeling approach is based on the use of real and imaginary components of complex impedance to calculate ionic conductivity and/or resistivity in the course of formation of a three-dimensional poly- mer network. We shall now briefly describe the principal features of our analysis. More in-depth ac- counts of this subject are available elsewhere (e.g.,
In the simplest case of an R - C parallel circuit 14-16).
shown below:
c
I-l i7-I INTERFACE HP-18 and
a
6
C
U
b
Figure 2. ( A ) Schematic of the experimental setup for dielectric measurements. (B) Schematic of the measuring cell: ( a ) electrode, ( b ) glass, (c ) Teflon spacer.
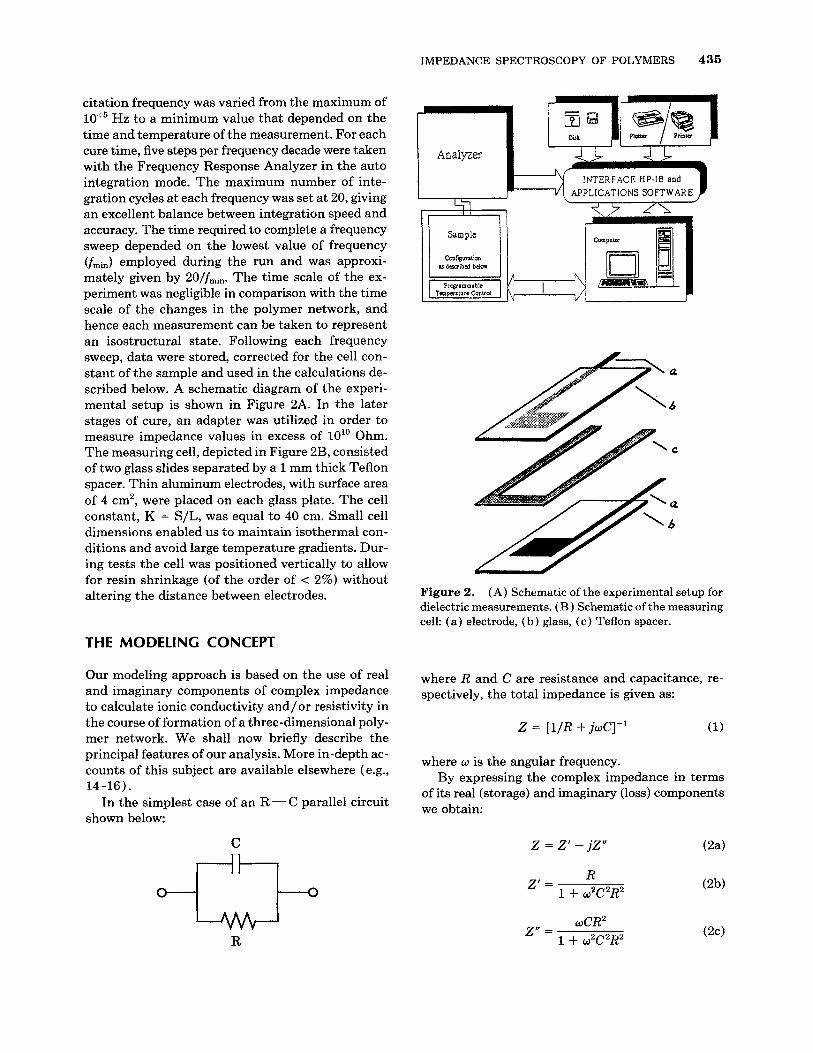
where R and C are resistance and capacitance, re- spectively, the total impedance is given as:
2 = [1/R + jwC1-l (1)
where w is the angular frequency. By expressing the complex impedance in terms
of its real (storage) and imaginary (loss) components we obtain:
D 1 L 2’ = 1 + w2C2R2
R wCR2
1 + 02C2R2 2‘’ =
436 BELLUCCI ET AL.
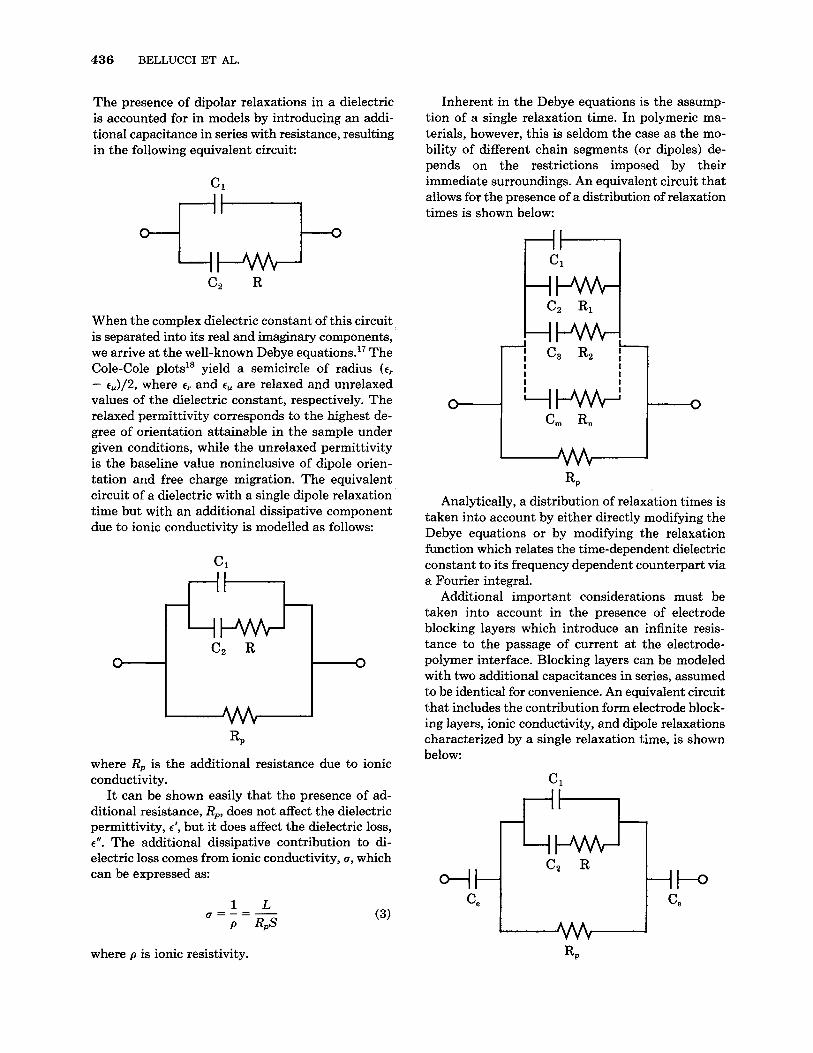
The presence of dipolar relaxations in a dielectric is accounted for in models by introducing an addi- tional capacitance in series with resistance, resulting in the following equivalent circuit:
4w
When the complex dielectric constant of this circuit, is separated into its real and imaginary components, we arrive at the well-known Debye equation^.'^ The Cole-Cole plots18 yield a semicircle of radius ( t ,
- ~,)/2, where t, and E , are relaxed and unrelaxed values of the dielectric constant, respectively. The reIaxed permittivity corresponds to the highest de- gree of orientation attainable in the sample under given conditions, while the unrelaxed permittivity is the baseline value noninclusive of dipole orien- tation and free charge migration. The equivalent circuit of a dielectric with a single dipole relaxation time but with an additional dissipative component due to ionic conductivity is modelled as follows:
RP where Rp is the additional resistance due to ionic conductivity.
It can be shown easily that the presence of ad- ditional resistance, Rp, does not affect the dielectric permittivity, t‘, but it does affect the dielectric loss, t ’I. The additional dissipative contribution to di- electric loss comes from ionic conductivity, g, which can be expressed as:
(3)
Inherent in the Debye equations is the assump- tion of a single relaxation time. In polymeric ma- terials, however, this is seldom the case as the mo- bility of different chain segments (or dipoles) de- pends on the restrictions imposed by their immediate surroundings. An equivalent circuit that allows for the presence of a distribution of relaxation times is shown below:
Analytically, a distribution of relaxation times is taken into account by either directly modifying the Debye equations or by modifying the relaxation function which relates the time-dependent dielectric constant to its frequency dependent counterpart via a Fourier integral.
Additional important considerations must be taken into account in the presence of electrode blocking layers which introduce an infinite resis- tance to the passage of current a t the electrode- polymer interface. Blocking layers can be modeled with two additional capacitances in series, assumed to be identical for convenience. An equivalent circuit that includes the contribution form electrode block- ing layers, ionic conductivity, and dipole relaxations characterized by a single relaxation time, is shown below:
ce u ce
where p is ionic resistivity.
IMPEDANCE SPECTROSCOPY OF POLYMERS 437
Solving the above equivalent circuit for the real and imaginary components of complex impedance we obtain:
R p [ l - Rp7C1w2 + 7w2(RpC1 + RpC2 + T ) ] 2’ = (4a) (1 - Rp7~2C1)2 + w2(RpC1 + RpC2 + T ) ~
2 +- (4b) cew
where
C1 = e,CO; C2 = ( E , - t,)Co; and 7 = RC2
and
zone A, a t very low frequency, where the capacitance of electrode blocking layers contributes strongly to the overall polarization. At higher frequencies, in zone B, the dielectric signal is not affected by elec- trode polarization and the capacitance of the poly- mer becomes C = C1 + C2. At those frequencies only, the equivalents circuit reverts to a simple R-C par- allel model, whose imaginary impedance is given by eq. (5):
Taking a derivative of 2” with respect to angular frequency we get:
dZ” CRi(1 - w2R;C2) dw ( 1 + w2R:C2) = o (6) -- -
C, = t,S/L, with e0 the permittivity of free space. Equation (6) is equal to zero, i.e., 2” = Zkax, when the following condition is met:
RESULTS AND DISCUSSION
Calculation of Ionic Conductivity
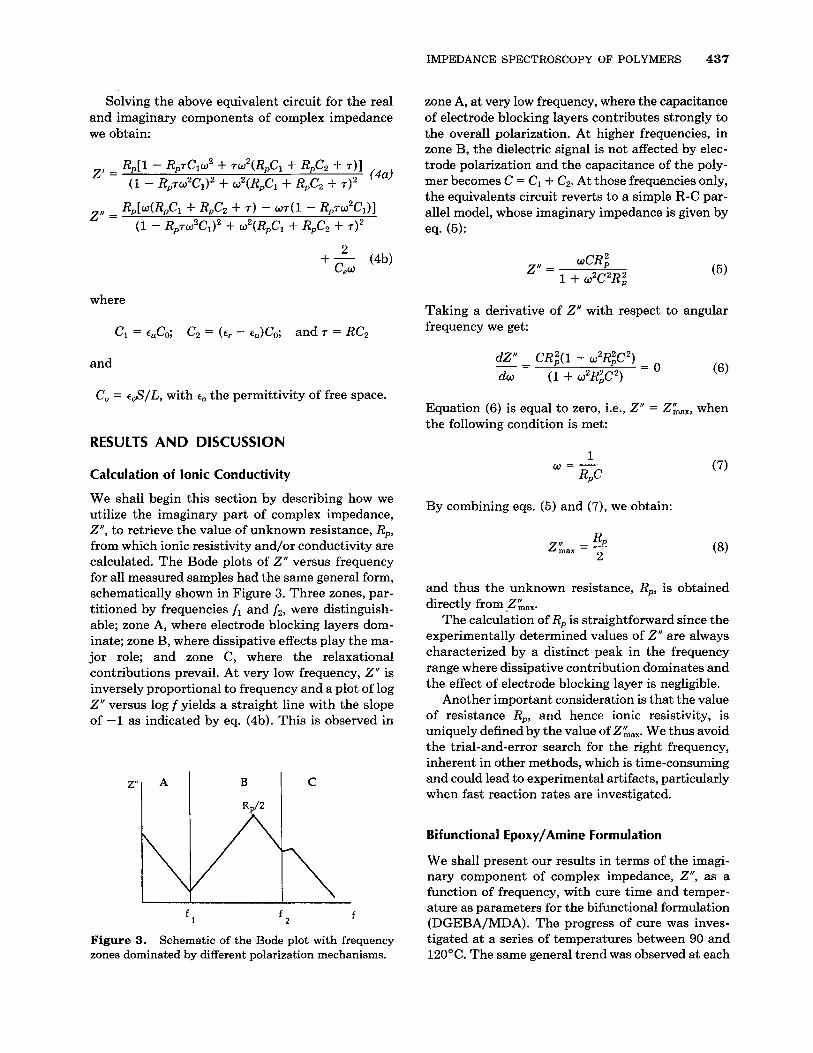
We shall begin this section by describing how we utilize the imaginary part of complex impedance, Z”, to retrieve the value of unknown resistance, Rp, from which ionic resistivity and/or conductivity are calculated. The Bode plots of 2“ versus frequency for all measured samples had the same general form, schematically shown in Figure 3. Three zones, par- titioned by frequencies f l and f2, were distinguish- able; zone A, where electrode blocking layers dom- inate; zone B, where dissipative effects play the ma- jor role; and zone C, where the relaxational contributions prevail. At very low frequency, 2” is inversely proportional to frequency and a plot of log 2” versus log f yields a straight line with the slope of -1 as indicated by eq. (4b). This is observed in
ZL
C
f l f 2 f
Figure 3. zones dominated by different polarization mechanisms.
Schematic of the Bode plot with frequency
1 a = - RPC
By combining eqs. (5) and (7), we obtain:
(7)
and thus the unknown resistance, Rp, is obtained directly from Zkax.
The calculation of Rp is straightforward since the experimentally determined values of 2” are always characterized by a distinct peak in the frequency range where dissipative contribution dominates and the effect of electrode blocking layer is negligible.
Another important consideration is that the value of resistance Rp, and hence ionic resistivity, is uniquely defined by the value of Zkax. We thus avoid the trial-and-error search for the right frequency, inherent in other methods, which is time-consuming and could lead to experimental artifacts, particularly when fast reaction rates are investigated.
Bifunctional Epoxy/Amine Formulation
We shall present our results in terms of the imagi- nary component of complex impedance, Z”, as a function of frequency, with cure time and temper- ature as parameters for the bifunctional formulation (DGEBA/MDA). The progress of cure was inves- tigated at a series of temperatures between 90 and 120°C. The same general trend was observed at each
438 BELLUCCI ET AL.
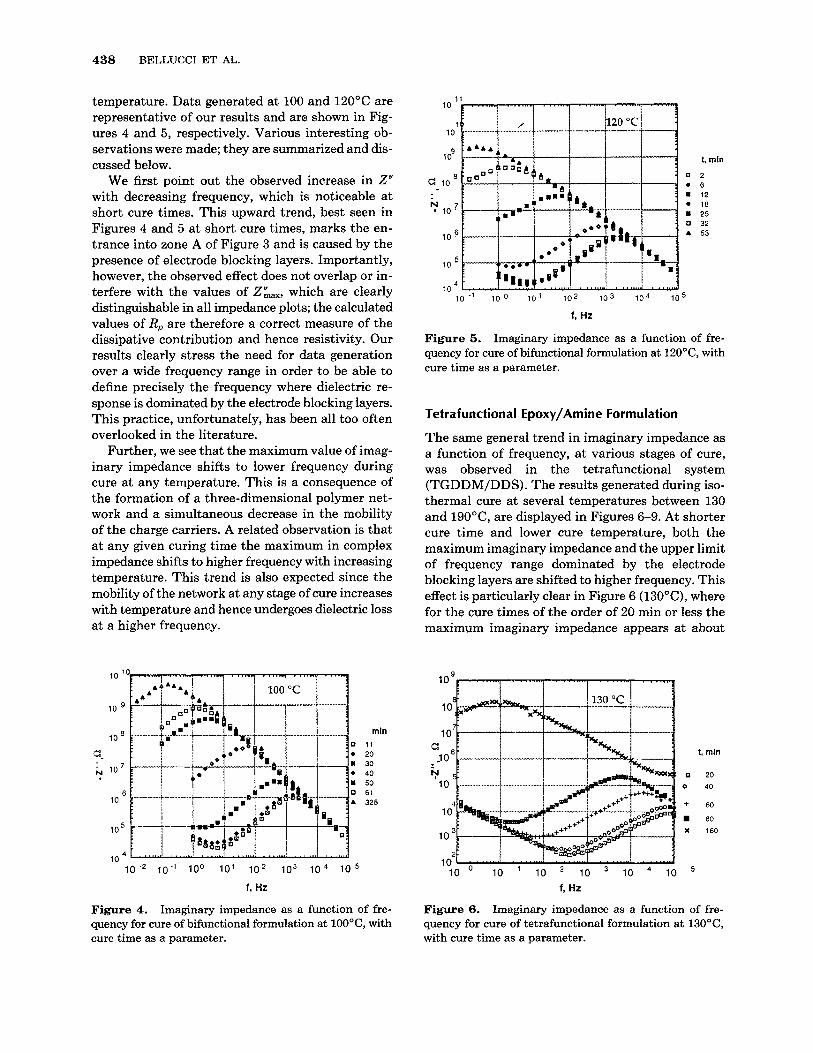
temperature. Data generated at 100 and 120°C are representative of our results and are shown in Fig- ures 4 and 5, respectively. Various interesting ob- servations were made; they are summarized and dis- cussed below.
We first point out the observed increase in 2” with decreasing frequency, which is noticeable at short cure times. This upward trend, best seen in Figures 4 and 5 at short cure times, marks the en- trance into zone A of Figure 3 and is caused by the presence of electrode blocking layers. Importantly, however, the observed effect does not overlap or in- terfere with the values of Zk,,, which are clearly distinguishable in all impedance plots; the calculated values of Rp are therefore a correct measure of the dissipative contribution and hence resistivity. Our results clearly stress the need for data generation over a wide frequency range in order to be able to define precisely the frequency where dielectric re- sponse is dominated by the electrode blocking layers. This practice, unfortunately, has been all too often overlooked in the literature.
Further, we see that the maximum value of imag- inary impedance shifts to lower frequency during cure at any temperature. This is a consequence of the formation of a three-dimensional polymer net- work and a simultaneous decrease in the mobility of the charge carriers. A related observation is that a t any given curing time the maximum in complex impedance shifts to higher frequency with increasing temperature. This trend is also expected since the mobility of the network at any stage of cure increases with temperature and hence undergoes dielectric loss at a higher frequency.
10.2 10-l 100 101 l o 2 l o3 lo4 10
f , Hr
mln 11 20 30 40 50 61 325
Figure 4. Imaginary impedance as a function of fre- quency for cure of bifunctional formulation at 100°C, with cure time as a parameter.
t, rnin 2 6 12 18 25 32 53
f, Hz
Figure 5. Imaginary impedance as a function of fre- quency for cure of bifunctional formulation at 120°C, with cure time as a parameter.
Tetrafunctional Epoxy/Amine Formulation
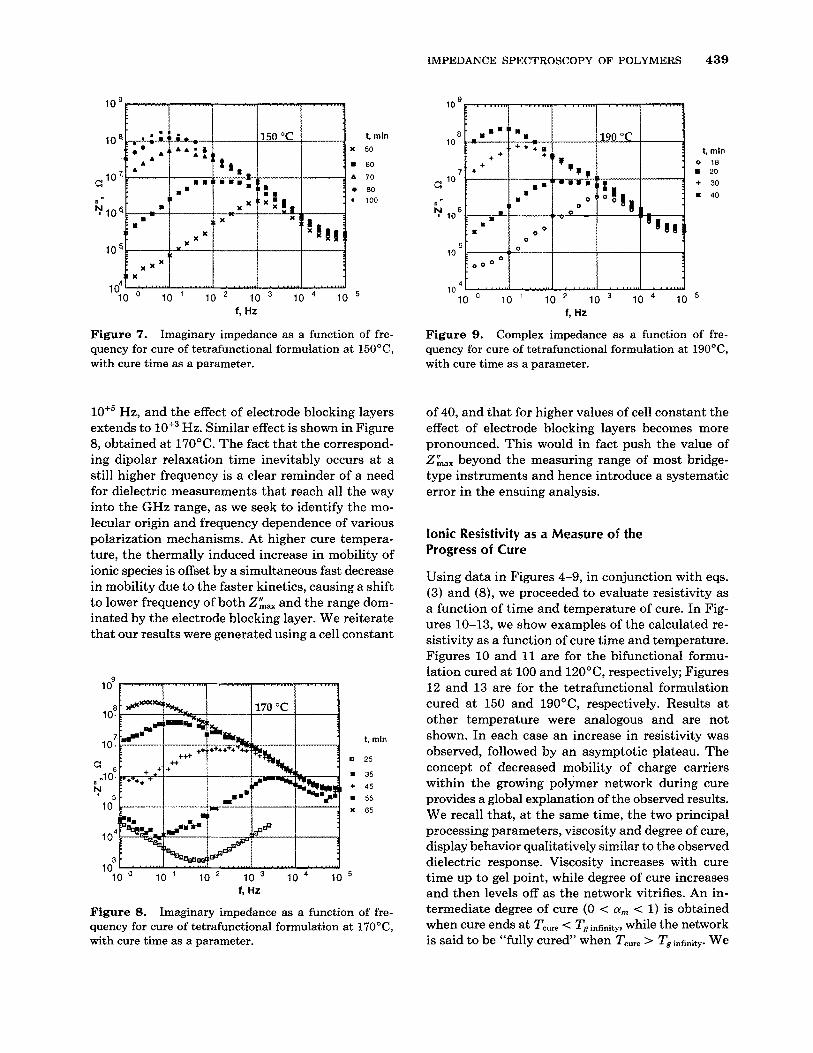
The same general trend in imaginary impedance as a function of frequency, at various stages of cure, was observed in the tetrafunctional system (TGDDM/DDS). The results generated during iso- thermal cure at several temperatures between 130 and 190°C, are displayed in Figures 6-9. At shorter cure time and lower cure temperature, both the maximum imaginary impedance and the upper limit of frequency range dominated by the electrode blocking layers are shifted to higher frequency. This effect is particularly clear in Figure 6 (130”C), where for the cure times of the order of 20 min or less the maximum imaginary impedance appears a t about
t o g E . . ......, . . ......, . . . ....., . , ....-, . . .1
t. min
a 20 0 40
+ 60
80 X 160
. - l o ’ l o * l o lo l o 10 O 5
f, Hz
Figure 6. Imaginary impedance as a function of fre- quency for cure of tetrafunctional formulation at 130°C, with cure time as a parameter.
IMPEDANCE SPECTROSCOPY OF POLYMERS 439
f, Hz
10
a 10
7
G lo
+ 1 0 6
5 10
10 10 a 10 ' 10 * 10 10 10
f , Hz
t, mln 0 18
20 + 30
40
5
Figure 7. Imaginary impedance as a function of fre- quency for cure of tetrafunctional formulation a t 150°C, with cure time as a parameter.
Figure 9. Complex impedance as a function of fre- quency for cure of tetrafunctional formulation at 190°C, with cure time as a parameter.
lof5 Hz, and the effect of electrode blocking layers extends to Hz. Similar effect is shown in Figure 8, obtained at 170°C. The fact that the correspond- ing dipolar relaxation time inevitably occurs at a still higher frequency is a clear reminder of a need for dielectric measurements that reach all the way into the GHz range, as we seek to identify the mo- lecular origin and frequency dependence of various polarization mechanisms. At higher cure tempera- ture, the thermally induced increase in mobility of ionic species is offset by a simultaneous fast decrease in mobility due to the faster kinetics, causing a shift to lower frequency of both ZLax and the range dom- inated by the electrode blocking layer. We reiterate that our results were generated using a cell constant
10 10 ' 10 10 10 10 5
1. mln
25
35
45
55 65
f, Hz
Figure 8. Imaginary impedance as a function of fre- quency for cure of tetrafunctional formulation a t 17OoC, with cure time as a parameter.
of 40, and that for higher values of cell constant the effect of electrode blocking layers becomes more pronounced. This would in fact push the value of ZZ,, beyond the measuring range of most bridge- type instruments and hence introduce a systematic error in the ensuing analysis.
Ionic Resistivity as a Measure of the Progress of Cure
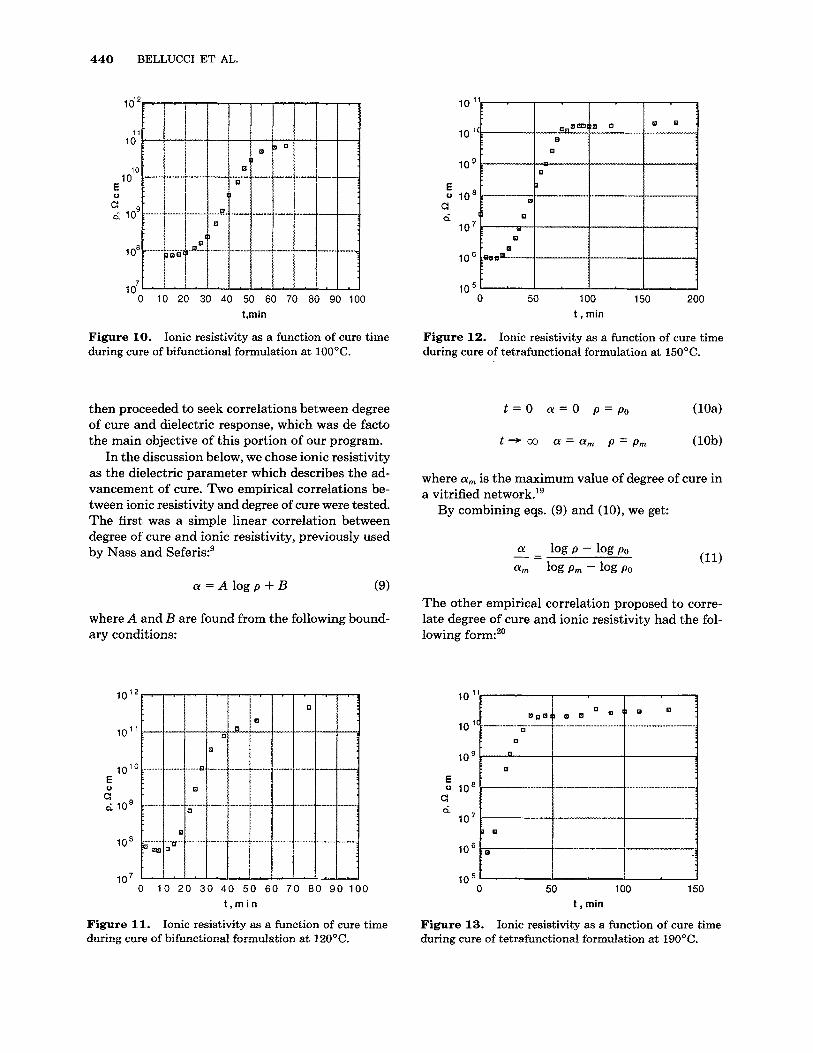
Using data in Figures 4-9, in conjunction with eqs. (3) and (8), we proceeded to evaluate resistivity as a function of time and temperature of cure. In Fig- ures 10-13, we show examples of the calculated re- sistivity as a function of cure time and temperature. Figures 10 and 11 are for the bifunctional formu- lation cured at 100 and 120"C, respectively; Figures 12 and 13 are for the tetrafunctional formulation cured at 150 and 190°C, respectively. Results at other temperature were analogous and are not shown. In each case an increase in resistivity was observed, followed by an asymptotic plateau. The concept of decreased mobility of charge carriers within the growing polymer network during cure provides a global explanation of the observed results. We recall that, at the same time, the two principal processing parameters, viscosity and degree of cure, display behavior qualitatively similar to the observed dielectric response. Viscosity increases with cure time up to gel point, while degree of cure increases and then levels off as the network vitrifies. An in- termediate degree of cure (0 < a, < 1) is obtained when cure ends at T,,, < Tg infinity, while the network is said to be "fully cured" when T,,,, > Tginfinity. We
440 BELLUCCI ET AL.
I"
0 10 20 30 40 50 60 70 80 90 100 t,min
Figure 10. during cure of bifunctional formulation at 100OC.
Ionic resistivity as a function of cure time
then proceeded to seek correlations between degree of cure and dielectric response, which was de facto the main objective of this portion of our program.
In the discussion below, we chose ionic resistivity as the dielectric parameter which describes the ad- vancement of cure. Two empirical correlations be- tween ionic resistivity and degree of cure were tested. The first was a simple linear correlation between degree of cure and ionic resistivity, previously used by Nass and Seferis:'
a = A log p + B (9)
where A and B are found from the following bound- ary conditions:
I"
0 10 20 30 4 0 5 0 6 0 7 0 80 90 100 t , m i n
Figure 11. during cure of bifunctional formulation at 120°C.
Ionic resistivity as a function of cure time
I "
0 50 100 150 200 t , min
Figure 12. during cure of tetrafunctional formulation at 150°C.
Ionic resistivity as a function of cure time
where a, is the maximum value of degree of cure in a vitrified netw01-k.'~
By combining eqs. (9) and (lo), we get:
The other empirical correlation proposed to corre- late degree of cure and ionic resistivity had the fol- lowing form:20
0 50 100 150 t , min
Figure 13. during cure of tetrafunctional formulation at 190OC.
Ionic resistivity as a function of cure time
IMPEDANCE SPECTROSCOPY OF POLYMERS 441
c I 1 6 0 0C 1 t! a
2 2
u.
aJ
P
0 70 20 30 40 50 60 70 80 90 100 110 120 130 t,min
0 . 4 ~ ~ ~ 1 (a)
0.2 * 0
I]
0.0 0 50 100 150
I , min
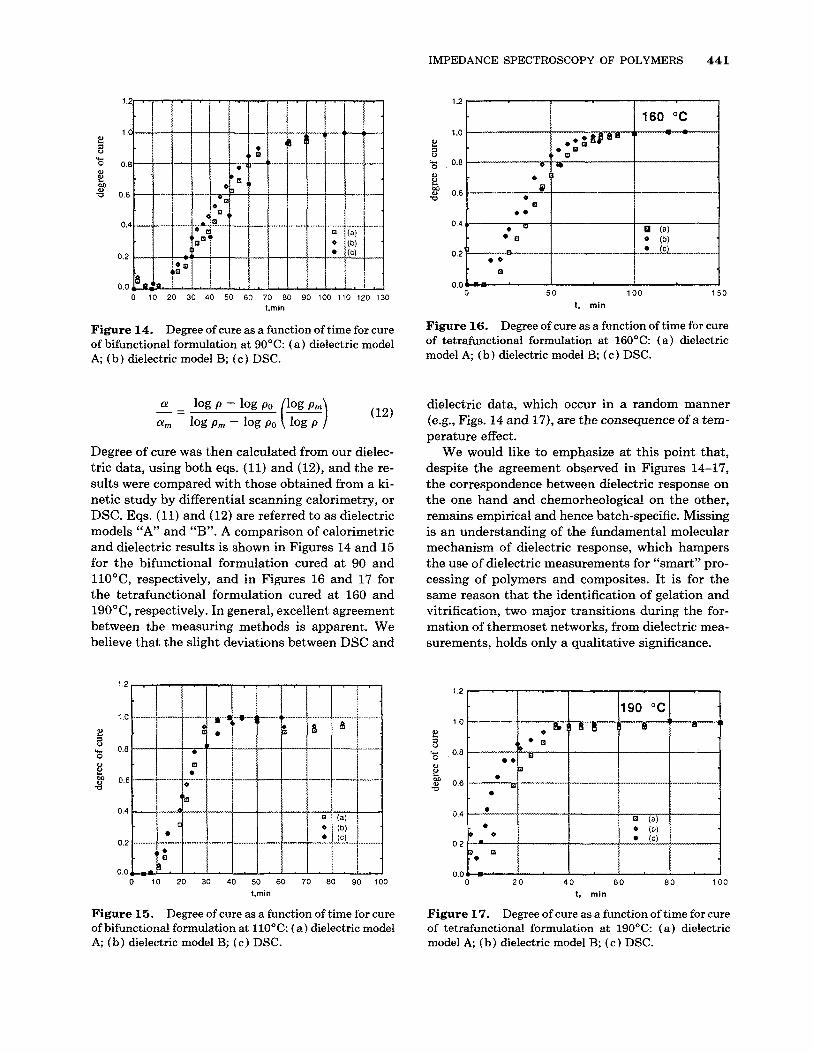
~i~~~ 14. of bifunctional formulation at 900~: ( a ) dielectric model A; (b) dielectric model B; (c ) DSC.
D~~~~~ of cure as a function oftime for Figure 16. Degree of cure as a function of time for cure of tetrafunctional formulation at 160°C: ( a ) dielectric model A; ( b ) dielectric model B; (c ) DSC.
Degree of cure was then calculated from our dielec- tric data, using both eqs. (11) and (12), and the re- sults were compared with those obtained from a ki- netic study by differential scanning calorimetry, or DSC. Eqs. (11) and (12) are referred to as dielectric models “A” and “B”. A comparison of calorimetric and dielectric results is shown in Figures 14 and 15 for the bifunctional formulation cured at 90 and llO°C, respectively, and in Figures 16 and 17 for the tetrafunctional formulation cured at 160 and 190°C, respectively. In general, excellent agreement between the measuring methods is apparent. We believe that the slight deviations between DSC and
0 10 20 30 40 50 60 70 80 90 100 t.min
dielectric data, which occur in a random manner (e.g., Figs. 14 and 17), are the consequence of a tem- perature effect.
We would like to emphasize at this point that, despite the agreement observed in Figures 14-17, the correspondence between dielectric response on the one hand and chemorheoiogical on the other, remains empirical and hence batch-specific. Missing is an understanding of the fundamental molecular mechanism of dielectric response, which hampers the use of dielectric measurements for “smart” pro- cessing of polymers and composites. It is for the same reason that the identification of gelation and vitrification, two major transitions during the for- mation of thermoset networks, from dielectric mea- surements, holds only a qualitative significance.
0 20 40 60 80 100
1 , min
Figure 15. Degree of cure as a function of time for cure of bifunctional formulation a t 110OC: (a) dielectric model A; (b) dielectric model B; (c) DSC.
Figure 17. Degree of cure as a function of time for cure of tetrafunctional formulation a t 190°C: ( a ) dielectric model A, (b) dielectric model B; (c) DSC.
442 BELLUCCI E T AL.
The Mechanism of Ionic Conductivity
A comprehensive investigation of the mechanism of ionic conductivity in reactive polymers has not been reported in the literature. We believe that such in- formation is necessary in order to relate the dielec- tric response to the molecular changes during the formation of thermoset networks in general, and, gelation and vitrification in particular. The two cru- cial unanswered questions regarding ionic conduc- tivity in reactive polymers pertain to; (1) the nature of the charge carriers, and (2) the conductivity mechanism. A brief discussion of unsolved issues follows.
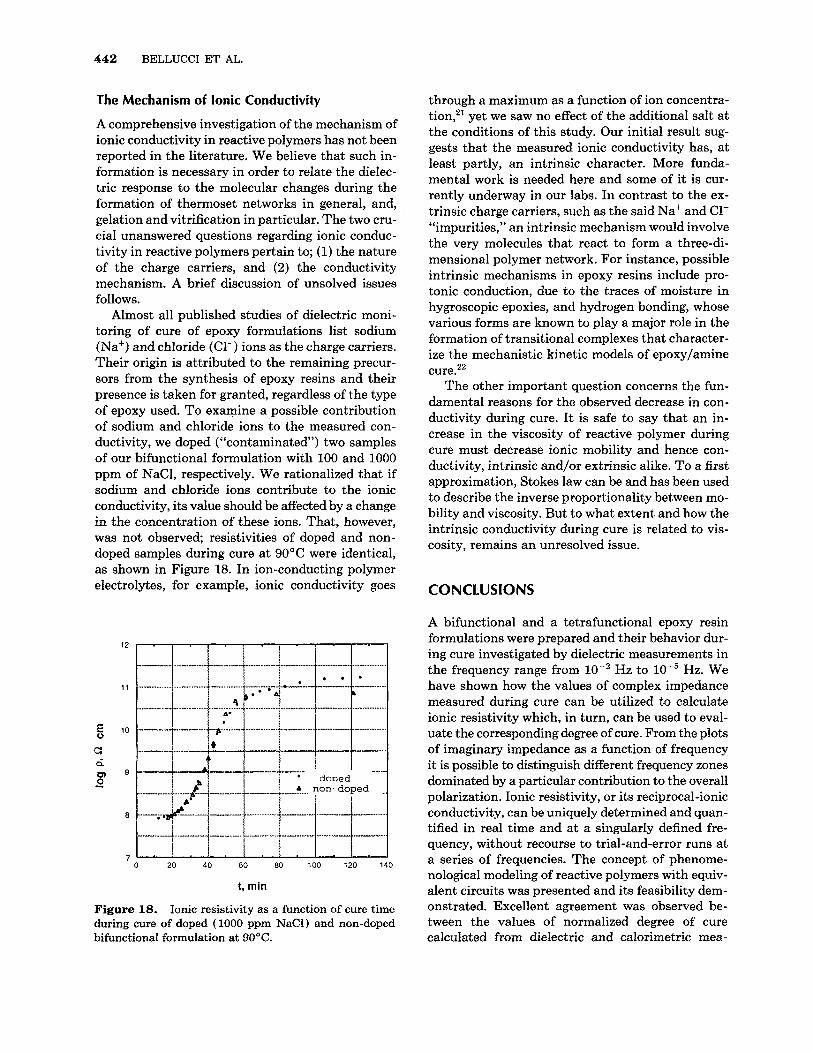
Almost all published studies of dielectric moni- toring of cure of epoxy formulations list sodium (Na') and chloride (C1-) ions as the charge carriers. Their origin is attributed to the remaining precur- sors from the synthesis of epoxy resins and their presence is taken for granted, regardless of the type of epoxy used. To examine a possible contribution of sodium and chloride ions to the measured con- ductivity, we doped ("contaminated") two samples of our bifunctional formulation with 100 and 1000 ppm of NaCl, respectively. We rationalized that if sodium and chloride ions contribute to the ionic conductivity, its value should be affected by a change in the concentration of these ions. That, however, was not observed; resistivities of doped and non- doped samples during cure at 90°C were identical, as shown in Figure 18. In ion-conducting polymer electrolytes, for example, ionic conductivity goes
0 20 40 60 80 100 120 140
1, min
Figure 18. Ionic resistivity as a function of cure time during cure of doped ( 1000 ppm NaCl) and non-doped bifunctional formulation at 90°C.
through a maximum as a function of ion concentra- tion,21 yet we saw no effect of the additional salt at the conditions of this study. Our initial result sug- gests that the measured ionic conductivity has, a t least partly, an intrinsic character. More funda- mental work is needed here and some of it is cur- rently underway in our labs. In contrast to the ex- trinsic charge carriers, such as the said Na' and C1- "impurities," an intrinsic mechanism would involve the very molecules that react to form a three-di- mensional polymer network. For instance, possible intrinsic mechanisms in epoxy resins include pro- tonic conduction, due to the traces of moisture in hygroscopic epoxies, and hydrogen bonding, whose various forms are known to play a major role in the formation of transitional complexes that character- ize the mechanistic kinetic models of epoxy/amine cure.22
The other important question concerns the fun- damental reasons for the observed decrease in con- ductivity during cure. It is safe to say that an in- crease in the viscosity of reactive polymer during cure must decrease ionic mobility and hence con- ductivity, intrinsic and/or extrinsic alike. To a first approximation, Stokes law can be and has been used to describe the inverse proportionality between mo- bility and viscosity. But to what extent and how the intrinsic conductivity during cure is related to vis- cosity, remains an unresolved issue.
CONCLUSlONS
A bifunctional and a tetrafunctional epoxy resin formulations were prepared and their behavior dur- ing cure investigated by dielectric measurements in the frequency range from Hz to Hz. We have shown how the values of complex impedance measured during cure can be utilized to calculate ionic resistivity which, in turn, can be used to eval- uate the corresponding degree of cure. From the plots of imaginary impedance as a function of frequency it is possible to distinguish different frequency zones dominated by a particular contribution to the overall polarization. Ionic resistivity, or its reciprocal-ionic conductivity, can be uniquely determined and quan- tified in real time and at a singularly defined fre- quency, without recourse to trial-and-error runs at a series of frequencies. The concept of phenome- nological modeling of reactive polymers with equiv- alent circuits was presented and its feasibility dem- onstrated. Excellent agreement was observed be- tween the values of normalized degree of cure calculated from dielectric and calorimetric mea-
IMPEDANCE SPECTROSCOPY OF POLYMERS 443
surements. The often invoked (though seldom stud- ied) concept of extrinsic conductivity caused by the presence of ionic “impurities” shouId be addressed in a fundamental study, since intrinsic charge mi- gration mechanisms involving reactive molecules could contribute to the overall ionic conductivity.
The financial support of CNR, Grant no:91.2077.CT.ll and of MPI (40% Funds), and a partial support (JM) by the Western Europe Program of the National Science Foundation (No. INT-9405461) are gratefully acknowl- edged.
REFERENCES AND NOTES
1. J. Mijovic, J. M. Kenny, A. Maffezzoli, A. Trivisano, F. Bellucci, and L. Nicolais, Comp. Sci. Tech., 49,277 (1993).
2. N. F. Sheppard, S. L. Garverick, D. R. Day, and S. D. Senturia, SAMPE Znt. Symp., 26 ,65 (1981).
3. S. D. Senturia and N. F. Sheppard, Adv. Polym. Sci., 80, l (1986) .
4. D. R. Day, SAMPE Int. Symp., 33,594 (1988). 5. D. E. Kranbuehl, S. E. Delos, and P. K. Jue, Polymer,
2 7 , l l (1986). 6. D. E. Kranbuehl, S. E. Delos, M. Hoff, L. Weller, L.
Haverty, and J. Seeley, SAMPE Int. Symp., 32,338 ( 1987).
7. D. E. Kranbuehl, M. HOE, P. Haverty, A. LOOS, and T. Freeman, SAMPE Int. Symp., 33,1276 (1988).
8. J. W. Lane, J. C. Seferis, and M. A. Bachmann, Polym. Eng. Sci., 26,346 ( 1986).
9. K. A. Nass and J. C. Seferis, Polym. Eng. Sci., 29 (5 ) , 315 (1989).
10. M. B. M. Mangion and G. P. Johari, J. Polym. Sci., Polym. Phys. Ed., 29,1117 (1991).
11. F. Bellucci, M. Valentino, L. Nicodemo, J. M. Kenny, L. Nicolais, and J. Mijovic, J. Polym. Sci., Polym. Phys. Ed., 32, 2519 (1994).
12. J. Mijovic, A. Fishbain, and J. Wijaya, Macromolecules, 25,986 ( 1992).
13. J. M. Kenny, unpublished data. 14. M. Sluyters-Rehbach and J. H. Sluyters, in Elec-
troanalytkal Chemistry, Vol. 4, A. J. Bard, Ed., Marcel Dekker, New York, 1977.
15. G. W. Walter, Corrosion Sci., 2 6 ( 9 ) , 681 (1986). 16. J. R. MacDonald, Impedance Spectroscopy, Wiley,
17. P. Debye, Polar Molecules, Chemical Catalog Company
18. R. H. Cole and K. S. Cole, J. Chern. Phys., 9, 341
19. J. M. Kenny and A. Trivisano, Polym. Eng. Sci., 31,
20. G. D’Alisa, B. S. thesis in Chemical Engineering,
21. Y. Okamoto, T. F. Yeh, H. S. Lee, and T. A. Skotheim,
22. J. Mijovic, A. Fishbain, and J. Wijaya, Macromolecules,
New York, 1987.
(Reinhold Publ. Corp.), New York, 1929.
(1941).
19 (1991).
University of Naples, 1991.
J. Polym. Sci., Polym. Chem. Ed., 31, 2573 (1993).
25,979 ( 1992).
Received March 25, 1994 Revised August 24, I994 Accepted September 12, 1994


