Embed Size (px)
Citation preview
Masaryk UniversityFaculty of Informatics
Implement detection ofduplicate test coverage for Java
applications
Bachelor’s Thesis
Jakub Schwan
Brno, Spring 2018

Replace this page with a copy of the official signed thesis assignment and acopy of the Statement of an Author.

Declaration
Hereby I declare that this paper is my original authorial work, whichI have worked out on my own. All sources, references, and literatureused or excerpted during elaboration of this work are properly citedand listed in complete reference to the due source.
Jakub Schwan
Advisor: Mgr. Marek Grác, Ph.D.
i

Acknowledgements
I would like to express my gratitude to my supervisor Mgr. MarekGrác, Ph.D., and consultant Ing. Radovan Synek for their willingness,guidance, valuable advice and comments, and time invested in con-sultations throughout the work.
Other thanks belong to the JaCoCo community, especially to MarcR. Hoffmann, for providing expert advice when analyzing JaCoCo.
iii
Abstract
The thesis aims to analyze and implement detection of duplicate testscoverage as part of the open sourcing tool for tests code coverage andto represent the results of founded duplications appropriately. Theresult of this work should help developers and testers to optimizetheir test runs.
iv
Keywords
Java, testing, code coverage, duplicate test detection, JaCoCo, bytecode,ASM
v

Contents
Introduction 1
1 Code coverage in the Java ecosystem 31.1 Java . . . . . . . . . . . . . . . . . . . . . . . . . . . . . . 3
1.1.1 Java bytecode . . . . . . . . . . . . . . . . . . . . 31.2 Code coverage . . . . . . . . . . . . . . . . . . . . . . . . . 4
1.2.1 Statement coverage . . . . . . . . . . . . . . . . . 51.2.2 Branch coverage . . . . . . . . . . . . . . . . . . . 5
1.3 ASM library . . . . . . . . . . . . . . . . . . . . . . . . . 71.3.1 Class visitors . . . . . . . . . . . . . . . . . . . . 71.3.2 Method visitors . . . . . . . . . . . . . . . . . . . 8
1.4 JaCoCo . . . . . . . . . . . . . . . . . . . . . . . . . . . . 121.4.1 Features of JaCoCo tool . . . . . . . . . . . . . . 121.4.2 Control Flow Analysis for Java Methods . . . . . 131.4.3 Instrumentation of the source code . . . . . . . . 131.4.4 Collecting of code coverage data . . . . . . . . . 191.4.5 Coverage report for the source code . . . . . . . 20
2 Design of detection duplicate code coverage 232.1 Obtain a location of the call . . . . . . . . . . . . . . . . . . 242.2 Filtering out the location of the source . . . . . . . . . . . . 252.3 Replacement of the inserted bytecode . . . . . . . . . . . . . 252.4 Runtime of the calls . . . . . . . . . . . . . . . . . . . . . . 262.5 Storing of the duplications . . . . . . . . . . . . . . . . . . 272.6 Report for users with information about duplicate test coverage 272.7 Extended JaCoCo with the new functionality . . . . . . . . . 282.8 Possible performance issues of the design . . . . . . . . . . . 28
3 Implementation 313.1 Filtering method . . . . . . . . . . . . . . . . . . . . . . . . 313.2 Insert adjust probe with external method call . . . . . . . . . 33
3.2.1 An inserted probe that calls static method . . . . 333.2.2 An inserted probe that calls a constructor of the
object . . . . . . . . . . . . . . . . . . . . . . . . . 34
4 Conclusion 37
vii

Bibliography 39
viii
List of Tables
1.1 A JaCoCo Flow Edges 151.2 A JaCoCo probes bybtecode instructions 181.3 The overhead per probe 18
ix

List of Figures
1.1 Code Coverage Report for JaCoCo 141.2 Code Coverage Report for JaCoCo 211.3 Detail of code coverage for a java class from JaCoCo
report 213.1 Filtering method for getting a location of the test
call. 32
xi

Introduction
Automated testing is one of the methods used to verify the properfunctionality of the software. Auto-tests have many advantages overmanual testing because they are fast and their management and devel-opment usually requires fewer human resources than manual testingof the application. Automated testing enables the application to betested quickly and inexpensively, even on multiple system platformswith different specifications.
Applications are written in different programming languages. Oneof the most used is the Java programming language. For Java-writtenapplications, there are plenty of test libraries, such as JUnit or AssertJor others, and can be tested thoroughly to help them.
Because there are even bigger applications where it is challengingto find out what is covered by the tests and for which parts of the testsare completely missing, tools have been developed to help automatetesting source code coverage. Tools that are used for Java-writtenapplications include JaCoCo, jCov, and others.
With these tools, we can implement automated tests that effec-tively cover almost the entire source code of the application. However,verifying such an extensive application can be very time-consuming,and runtime can be several hours, even though tests run on powerfulcomputers. If they can not experience technical problems in a long testrun, then duplicate source code coverage can be one of the causes ofautomated testing. For such large applications, it is not only difficultto trace such duplicates but also to decide whether it is a duplicate ofthe test.
If the tests run every time the source code is changed, then thegreat emphasis is on running the tests as quickly as possible, and thetime lags are undesirable. With such frequent iterations of tests, it ispossible to run only some parts of tests that include a covered code,but such parts may have a long run. For a large testing suits that havea long runtime, it is necessary to have more testing machines if theapplication should be tested in a certain amount of time. And moretesting machines, which are not always used at 100%, means higherfinancial costs for the testing environment.
1
This thesis aims to design and implement detection of duplicatecoverage tests for Java applications as part of the open sourcing tool fordetected pore tests and to represent the results found by duplicationappropriately. As a result, developers and testers can easily detectduplicate tests and make it easier to determine whether duplicatescan be deleted. Part of the test is also the recording of the test run.
The reader is expected to have basic knowledge of the Java pro-gramming language, Java Virtual Machine, and knows the principlesof automated application testing.
2
1 Code coverage in the Java ecosystem
1.1 Java
Programing language Java is an object-oriented programing languagedeveloped since the year 1991 and was first released in 1995. Thesyntax of this programing language is based on programming lan-guages C and C++. An application written in programing languageJava standardly walks through five phases - editing, compiling, load-ing, verifying and executing. Java is not translated into executable code,i.e., machine source code, but into pseudocode called bytecode [1].
Application compiled into the bytecode is executed by JVM1 re-gardless of computer architecture or operating system.
1.1.1 Java bytecode
Java bytecode is the instruction set of the Java virtual machine. Eachinstruction consists of a one-byte opcode followed by zero or moreoperands. For example, iadd, which will receive two integers as anoperand and add them together.
Java Virtual Machine:
To understand the details of the bytecode, we need to discuss how aJava Virtual Machine works regarding the execution of the bytecode.JVM is a platform-independent execution environment that convertsJava bytecode into machine language and executes it. A JVM is a stack-based machine. Each thread has a JVM stack which stores frames.A frame is created each time a method is invoked and consists ofan operand stack, an array of local variables, and a reference to theconstant runtime pool of the class of the current method. [2]
Stack Based Virtual Machines:
We need to know a little about stack-based VM to understand JavaBytecode better. A stack-based virtual machine the memory structure
1. JVM – Java Virtual Machine
3
1. Code coverage in the Java ecosystem
where the operands are stored is a stack data structure. Operationsare carried out by popping data from the stack, processing them andpushing in back the results in LIFO (Last in First Out) fashion. In astack-based virtual machine, the operation of adding two numberswould usually be carried out in the following manner. [3]
1.2 Code coverage
Code coverage is a measure which describes how many percents of thecode was used with individual tests. Applications with high percenttest coverage than have a much lesser tendency to display untreatederror rates of the software than systems that have a small percentageof tests coverage.
To determine how much of the code is covered by our tests, thecoverage criteria are used, which are the rules or requirements thatthe test set must satisfy. There are several different coverage criteria.
The main coverage criteria being [4]:
∙ Function coverage – This criteria checks if each function (orsubroutine) has been called in the program.
∙ Statement coverage – This criteria checks if each statement hasbeen executed.
∙ Branch coverage – This criteria checks if each branch of each con-troller structure (e.g., if or case statements), that can be calledduring program execution, has been executed. For example, ifwe have an if statement in which are both the true and falsebranches, then is checked that tests for the program executeboth branches.
∙ Condition coverage – This criteria checks if each Boolean sub-expression evaluated both to true and false conditions.
Some criteria can be combined because their principles are quitesimilar and thus obtain a more accurate result of code coverage bytests. For example, if we associate Branch coverage and Conditioncoverage, we do not have to measure the coverage rate separately forthese criteria, because we have a condition for each decision, and wecan go one of the possible branches.
4
1. Code coverage in the Java ecosystem
1.2.1 Statement coverage
Statement coverage is the most basic form of code coverage. A state-ment is covered if it is executed. Note that a statement does not nec-essarily correspond to a line of code. Multiple statements on a singleline can confuse issues - the reporting if nothing else. Where thereare sequences of statements without branches it is not necessary tocount the execution of every statement, just one will suffice, but peopleoften like the count of every line to be reported anyway, especially insummary statistics. [5]
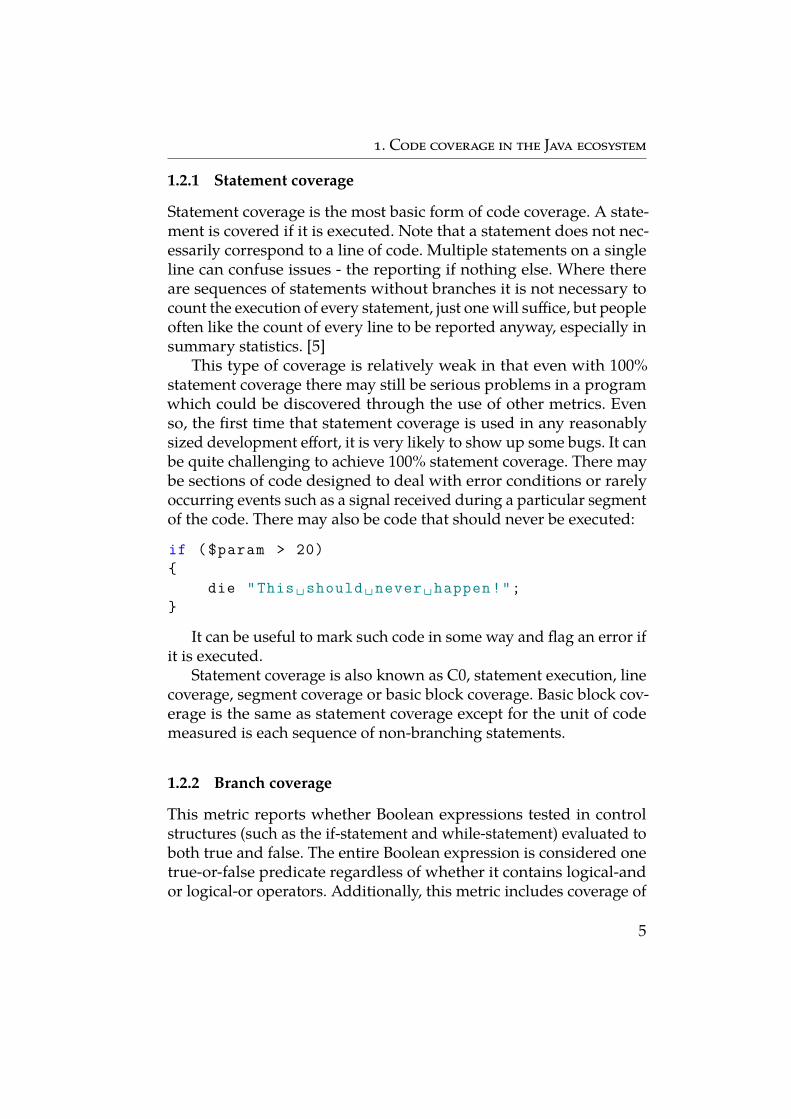
This type of coverage is relatively weak in that even with 100%statement coverage there may still be serious problems in a programwhich could be discovered through the use of other metrics. Evenso, the first time that statement coverage is used in any reasonablysized development effort, it is very likely to show up some bugs. It canbe quite challenging to achieve 100% statement coverage. There maybe sections of code designed to deal with error conditions or rarelyoccurring events such as a signal received during a particular segmentof the code. There may also be code that should never be executed:
if ($param > 20){
die "This␣should␣never␣happen!";}
It can be useful to mark such code in some way and flag an error ifit is executed.
Statement coverage is also known as C0, statement execution, linecoverage, segment coverage or basic block coverage. Basic block cov-erage is the same as statement coverage except for the unit of codemeasured is each sequence of non-branching statements.
1.2.2 Branch coverage
This metric reports whether Boolean expressions tested in controlstructures (such as the if-statement and while-statement) evaluated toboth true and false. The entire Boolean expression is considered onetrue-or-false predicate regardless of whether it contains logical-andor logical-or operators. Additionally, this metric includes coverage of
5
1. Code coverage in the Java ecosystem
switch-statement cases, exception handlers, and all points of entryand exit. Constant expressions controlling the flow are ignored. [5]
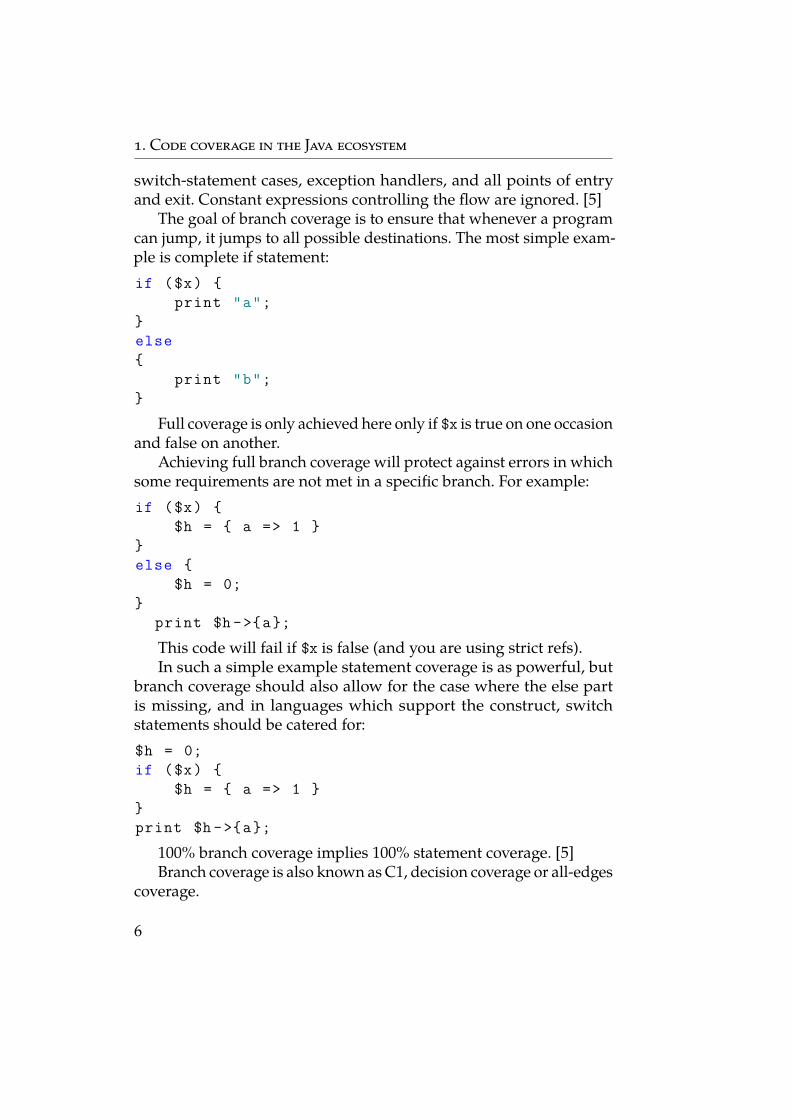
The goal of branch coverage is to ensure that whenever a programcan jump, it jumps to all possible destinations. The most simple exam-ple is complete if statement:if ($x) {
print "a";}else{
print "b";}
Full coverage is only achieved here only if $x is true on one occasionand false on another.
Achieving full branch coverage will protect against errors in whichsome requirements are not met in a specific branch. For example:if ($x) {
$h = { a => 1 }}else {
$h = 0;}
print $h ->{a};
This code will fail if $x is false (and you are using strict refs).In such a simple example statement coverage is as powerful, but
branch coverage should also allow for the case where the else partis missing, and in languages which support the construct, switchstatements should be catered for:$h = 0;if ($x) {
$h = { a => 1 }}print $h ->{a};
100% branch coverage implies 100% statement coverage. [5]Branch coverage is also known as C1, decision coverage or all-edges
coverage.
6
1. Code coverage in the Java ecosystem
1.3 ASM library
ASM2 is an all purpose Java bytecode manipulation and analysis frame-work. It can be used to modify existing classes or to generate classes,directly in binary form dynamically. ASM provides some commonbytecode transformations and analysis algorithms from which customcomplex transformations and code analysis tools can be built. ASMoffers similar functionality as other Java bytecode frameworks but isfocused on performance. Because it was designed and implemented tobe as small and as fast as possible, it is well suited for use in dynamicsystems (but can, of course, be used statically too, e.g., in compilers).[6]
The goal of the ASM library is to generate, transform and analyzecompiled Java classes, represented as byte arrays (as they are storedon disk and loaded in the Java Virtual Machine). For this purpose,ASM provides tools to read, write and transform such byte arrays byusing higher level concepts than bytes, such as numeric constants,strings, Java identifiers, Java types, Java class structure elements, etc.The scope of the ASM library is strictly limited to reading, writing,transforming and analyzing classes. [7]
ASM library provides a simple API3 for decomposing, modifying,and recomposing binary Java classes. ASM exposes the internal aggre-gate components of a given Java class through its visitor-oriented API.It also provides, on top of this visitor API, a tree API that representsclasses as object constructs. Both APIs can be used for modifying thebinary bytecode, as well as generating new bytecode (via injection ofnew code into the existing code, or through the generation of newclasses altogether). [8]
1.3.1 Class visitors
Since the visit of the class members can be interleaved (it is possibleto start visiting a field, then start visiting a method, go back to visitannotations of the field, continue with some instructions of the method,visit attributes of the field, add new instructions to the method, and
2. ASM – Keyword of C, which allows implements some function in assemblylanguage.3. API – Application Programming Interface
7
1. Code coverage in the Java ecosystem
so on), it is not possible to construct the class file’s byte array in asequential order, from beginning to end. Instead, it is necessary to useseveral byte vectors that can grow simultaneously. This is why thereare several writer classes, unlike for the reader case. [9]
ClassVisitor is an abstract class from org.objectweb.asm packagewhich provides methods to visit a Java class. Methods from this classmust be called in specific order. ClassVisitor is used as a root of thetree-base from which is possible to visit fields, methods, annotations,inner classes and so on.
The ClassWriter class is the main entry point. It contains the classheader elements and the lists of its fields and methods, as well as aSymbolTable instance, holding the constant pool items and the boot-strap methods of the class. This symbol table uses a hash set of Symbolobjects, to avoid adding the same item several times in the constantpool or the bootstrap methods array. The symbol table can be createdfrom an existing class by passing a ClassReader argument to its con-structor. This allows unchanged methods to be copied as is from aclass reader to a class writer, without visiting their content.
ClassWriter extends a ClassVisitor that generates a correspondingClassFile structure, as defined in the Java Virtual Machine Specifica-tion. ClassReader is a parser which makes a ClassVisitor visit a Class-File structure, as defined in the Java Virtual Machine Specification.This class parses the ClassFile content and calls the appropriate visitmethods of a given ClassVisitor for each field, method and bytecodeinstruction encountered.
ClassWriter can be used alone, to generate a new Java class. WithClassReader and adapter, ClassVisitor can be generated a modifiedclass from an existing Java class. [10, 11]
1.3.2 Method visitors
Generating whole methods in the ASM API is more involved thanother operations in the class. This involves a significant amount oflow-level byte-code manipulation. Method visitor has implementedmethods for bytecode manipulation in compiled classes. For practicaluses is better to modify an existing method to make it more accessibleor change a whole class to make it extensible.
8
1. Code coverage in the Java ecosystem
For visiting Java methods is in ASM API package org.objectweb.asmclass named MethodVisitor. Usage of this class is intuitive and similarto ClassVisitor, that means that methods of this class must be calledin specific order.
Implemented methods of the MethodVisito class required as inputan integer representation of the JVM instruction. In ASM API is aninterface called Opcodes, which contains constants representations ofJVM instructions. This interface does not define all the JVM opcodesbecause some opcodes are automatically handled [12].
ClassWriter can be used alone, to generate a new Java class. WithClassReader and adapter, ClassVisitor can be generated a modifiedclass from an existing Java class. [10, 11]
Java Virtual Machine instructions
A Java Virtual Machine instruction consists of an opcode specifyingthe operation to be performed, followed by zero or more operandsembodying values to be operated. Here is a list and description of theselected JVM instructions required for further work:
aload Load reference from the local variable. The index is an unsignedbyte that must be an index into the local variable array of thecurrent frame. The local variable at index must contain a ref-erence. The objectref4 in the local variable at index is pushedonto the operand stack.
bastore Store into byte or boolean array. The arrayref5 must be of typereference and must refer to an array whose components areof type byte or type boolean. The index and the value mustboth be of type int. The arrayref, index, and value are poppedfrom the operand stack. The int value is truncated to a byte andstored as the component of the array indexed by index.
iconst_<i> Push the int constant <i> (-1, 0, 1, 2, 3, 4 or 5) onto theoperand stack.
4. objectref – an object reference5. arrayref – an array reference
9
1. Code coverage in the Java ecosystem
bipush Push byte. The immediate byte is sign-extended to an intvalue. That value is pushed onto the operand stack.
new Create a new object. The unsigned indexbyte1 and indexbyte2are used to construct an index into the run-time constant pool ofthe current class. The run-time constant pool item at the indexmust be a symbolic reference to a class or interface type. Thenamed class or interface type is resolved and should result in aclass type. Memory for a new instance of that class is allocatedfrom the garbage-collected heap, and the instance variablesof the new object are initialized to their initial default values.The objectref, a reference to the instance, is pushed onto theoperand stack.
invokestatic Invoke a class (static) method. The unsigned indexbyte1and indexbyte2 are used to construct an index into the run-timeconstant pool of the current class. The run-time constant poolitem at that index must be a symbolic reference to a method,which gives the name and descriptor of the method as well asa symbolic reference to the class in which the method is to befound. The named method is resolved. The resolved methodmust be static, and therefore cannot be abstract.
On successful resolution of the method, the class that declaredthe resolved method is initialized if that class has not alreadybeen initialized. The operand stack must contain nargs argu-ment values, where the number, type, and order of the valuesmust be consistent with the descriptor of the resolved method.
invokespecial Invoke instance method; special handling for the su-perclass, private, and instance initialization method invoca-tions. The unsigned indexbyte1 and indexbyte2 are used toconstruct an index into the run-time constant pool of the cur-rent class. The run-time constant pool item at that index mustbe a symbolic reference to a method, which gives the name anddescriptor of the method as well as a symbolic reference to theclass in which the method is to be found. The named methodis resolved.
10
1. Code coverage in the Java ecosystem
Next, the resolved method is selected for invocation unlessall of the following conditions are true: The ACC_SUPER flag isset for the current class, the class of the resolved method is asuperclass of the current class, and the resolved method is notan instance initialization method.If the conditions are true, the actual method to be invoked isselected by the following lookup procedure. Let C be the directsuperclass of the current class: If C contains a declaration foran instance method with the same name and descriptor asthe resolved method, then this method will be invoked. Thelookup procedure terminates. Otherwise, if C has a superclass,this same lookup procedure is performed recursively using thedirect superclass of C. The method to be invoked is the result ofthe recursive invocation of this lookup procedure. Otherwise,an AbstractMethodError is raised.The objectref must be of type reference and must be followedon the operand stack by nargs argument values, where thenumber, type, and order of the values must be consistent withthe descriptor of the selected instance method.
areturn Return reference from the method. The objectref must beof type reference and must refer to an object of a type that isassignment compatible with the type represented by the returndescriptor of the current method. If the present method is asynchronized method, the monitor entered or reentered oninvocation of the method is updated and possibly exited as ifby execution of a monitorexit instruction in the current thread.If no exception is thrown, objectref is popped from the operandstack of the current frame and pushed onto the operand stackof the frame of the invoker. Any other values on the operandstack of the present method are discarded.
return Return void from the method. The current method must havereturn type void. If the present method is a synchronized method,the monitor entered or reentered on invocation of the method isupdated and possibly exited as if by execution of a monitorexitinstruction in the current thread. If no exception is thrown, anyvalues on the operand stack of the current frame are discarded.
11
1. Code coverage in the Java ecosystem
dup Duplicate the top value on the operand stack and push the du-plicated value onto the operand stack.
1.4 JaCoCo
JaCoCo6 is an open source code coverage tool for application wrote inprograming language Java [13]. JaCoCo has been created as a replace-ment for old and unused code coverage tool EMMA. The main goalof JaCoCo project is to provide a new standard for analyzing codecoverage for applications running on JVM.
JaCoCo is easy, flexible and well-documented library that can beeasily used and combined with existing scripts and tools. JaCoCo hasgood performance when using, and in particular, for large projects, aminimum of overhead is required.
1.4.1 Features of JaCoCo tool
Features of JaCoCo tool which is good to know.∙ Code coverage criteria are used to analyze coverage for instruc-
tions (C0), branches (C1), rows, methods, variables and com-plexity of cycles. [14]
∙ Functionality is based on Java bytecode7, so analysis can alsobe performed without source code8.
∙ Simple Java-based integration based on on-the-fly instrumenta-tion. It is possible to use other instrumentation scenarios thatare available through the JaCoCo API.
∙ It can be easily integrated with all applications running on JavaVM9. This makes it possible to use it to analyze code coverageof plain Java programs, web containers, or EJB servers10.
∙ Compatible with all released Java class file versions.
6. JaCoCo – Java Code Coverage7. Java bytecode is stored in files with .class extension.8. The source code for Java is stored in files with the .java extension.9. VM – virtual machine10. EJB – Enterprise Java Beans
12
1. Code coverage in the Java ecosystem
∙ Support for different JVM languages.
∙ Several report formats of analytical outputs (HTML, XML, CSV).
∙ Remote protocol and JMX11 control to request execution datadumps from the coverage agent at any point in time.
∙ Ant tasks to collect and manage execution data and create struc-tured coverage reports.
∙ Maven plug-in to collect coverage information and create re-ports in Maven builds.
1.4.2 Control Flow Analysis for Java Methods
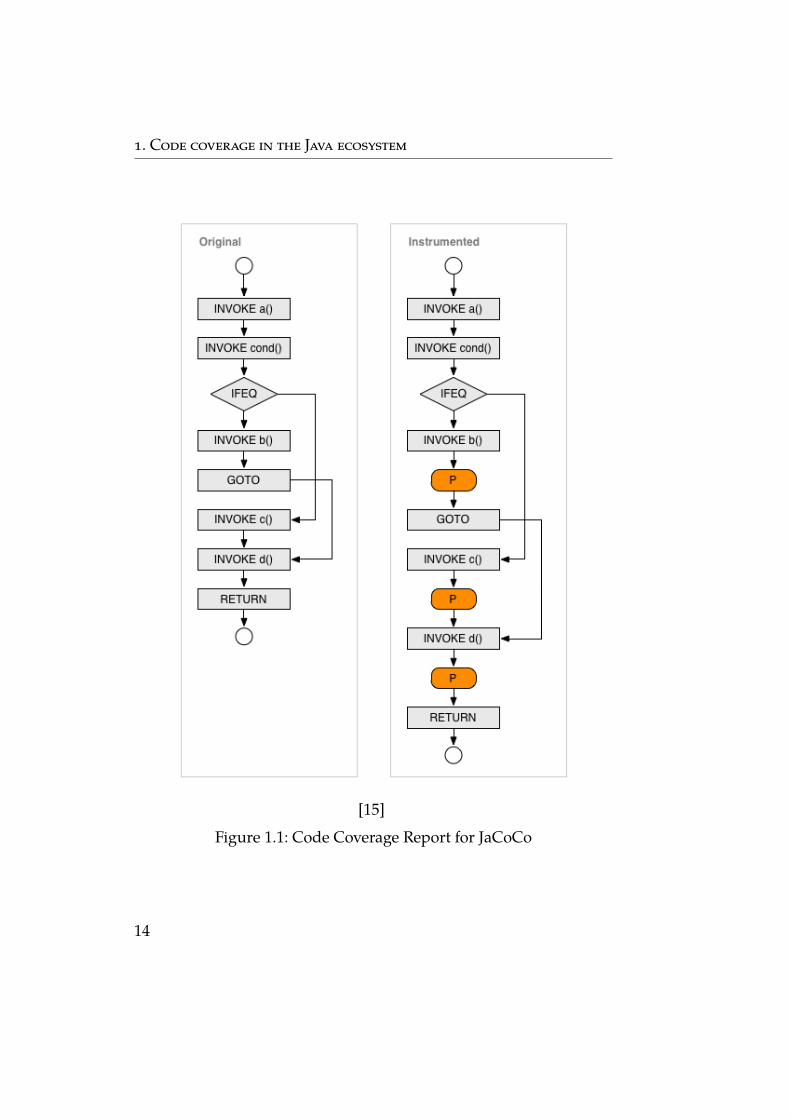
Implementing a coverage tool that supports statement (C0) as well asbranch coverage (C1) requires detailed analysis of the internal controlflow of Java methods. Due to the architecture of JaCoCo, this analysishappens on the bytecode of compiled class files. [15]
A graph can represent the possible control flow in the bytecode.The nodes are bytecode instruction, the edged of the graph representthe possible control flow between the instructions. The example of thecontrol flow represented by a graph is shown in the figure 1.1 at page14. In the image, the location marked with P is the location where theprobe is to be inserted.
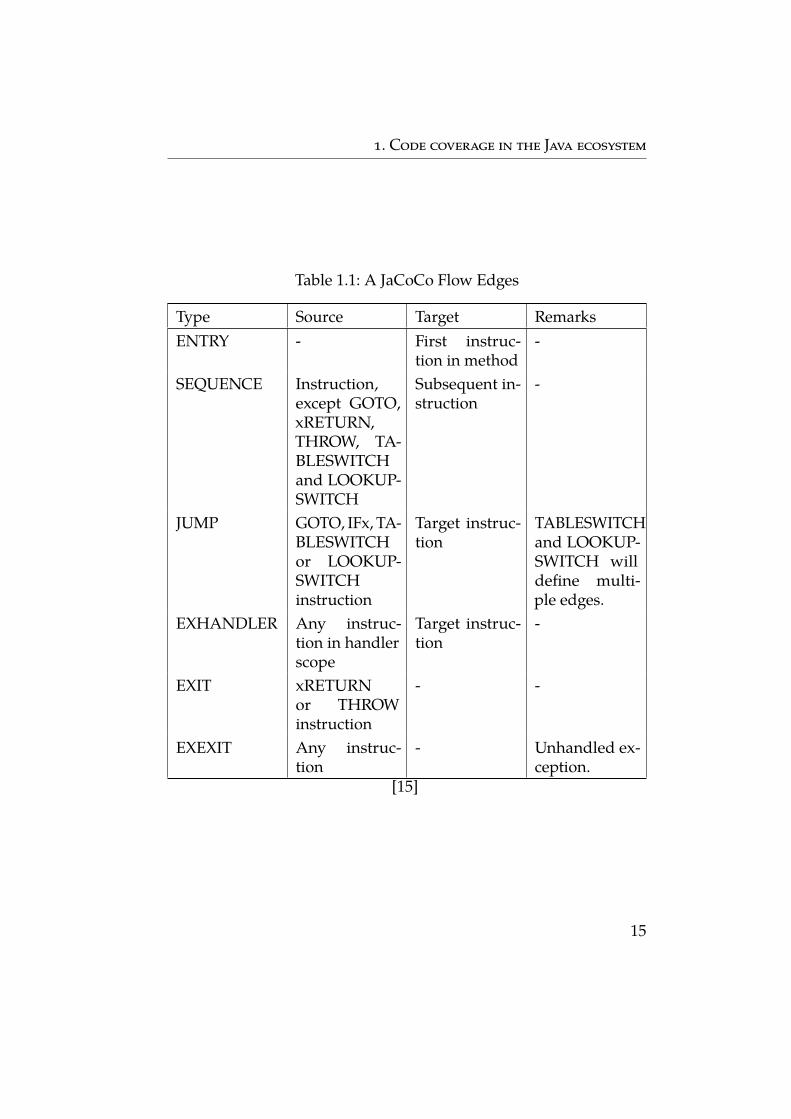
Flow Edges
The control flow graph of a Java method defined by Java bytecode mayhave the following Edges. Each edge connects a source instructionwith a target instruction. In some cases, the source instruction or thetarget instruction does not exist (virtual edges for method entry andexit) or cannot be exactly specified (exception handlers). In the table1.1 at page 15 is an overview of the flow edges.
1.4.3 Instrumentation of the source code
Instrumentation requires mechanisms to modify and generate Javabytecode. JaCoCo uses the ASM library for this purpose internally [16].
11. JMX – Java Management Extensions
13
1. Code coverage in the Java ecosystem
[15]
Figure 1.1: Code Coverage Report for JaCoCo
14
1. Code coverage in the Java ecosystem
Table 1.1: A JaCoCo Flow Edges
Type Source Target RemarksENTRY - First instruc-
tion in method-
SEQUENCE Instruction,except GOTO,xRETURN,THROW, TA-BLESWITCHand LOOKUP-SWITCH
Subsequent in-struction
-
JUMP GOTO, IFx, TA-BLESWITCHor LOOKUP-SWITCHinstruction
Target instruc-tion
TABLESWITCHand LOOKUP-SWITCH willdefine multi-ple edges.
EXHANDLER Any instruc-tion in handlerscope
Target instruc-tion
-
EXIT xRETURNor THROWinstruction
- -
EXEXIT Any instruc-tion
- Unhandled ex-ception.
[15]
15
1. Code coverage in the Java ecosystem
The ASM library is lightweight, easy to use and very efficient regardingmemory and CPU usage. It is actively maintained and includes ashuge regression test suite. Using of the ASM library for JaCoCo isdescribed in section 1.3 which starts at page 7.
Probe Insertion Strategy
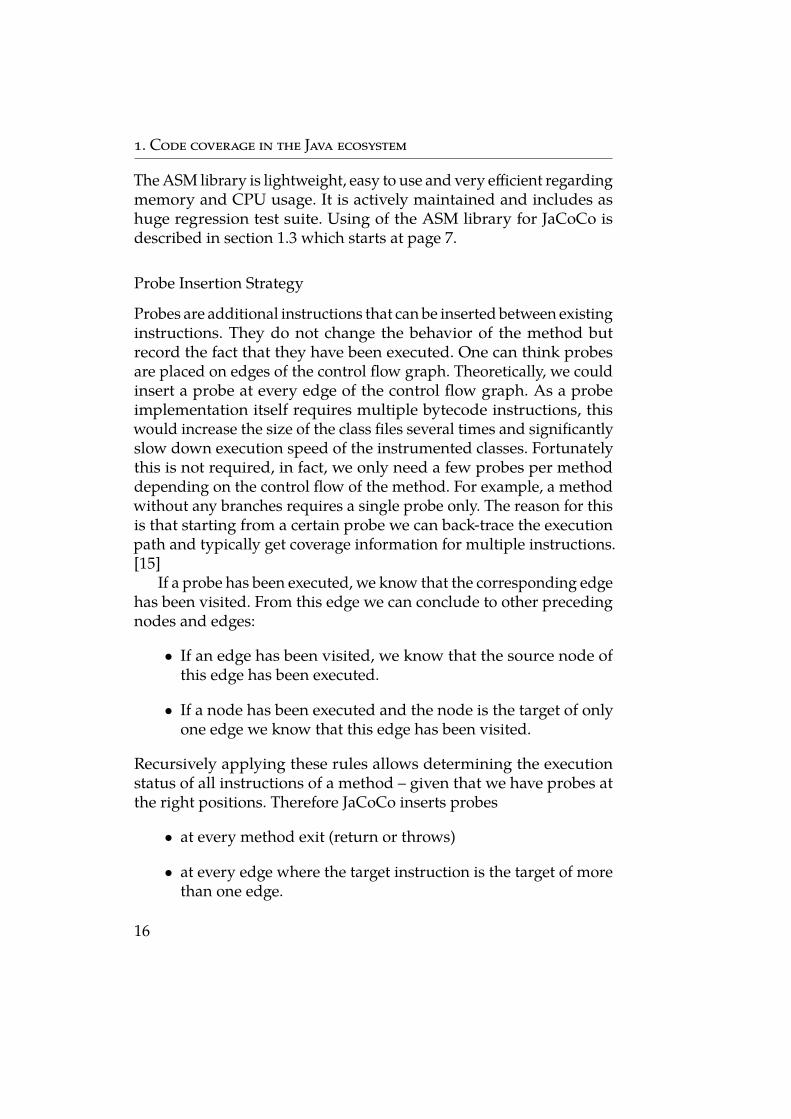
Probes are additional instructions that can be inserted between existinginstructions. They do not change the behavior of the method butrecord the fact that they have been executed. One can think probesare placed on edges of the control flow graph. Theoretically, we couldinsert a probe at every edge of the control flow graph. As a probeimplementation itself requires multiple bytecode instructions, thiswould increase the size of the class files several times and significantlyslow down execution speed of the instrumented classes. Fortunatelythis is not required, in fact, we only need a few probes per methoddepending on the control flow of the method. For example, a methodwithout any branches requires a single probe only. The reason for thisis that starting from a certain probe we can back-trace the executionpath and typically get coverage information for multiple instructions.[15]
If a probe has been executed, we know that the corresponding edgehas been visited. From this edge we can conclude to other precedingnodes and edges:
∙ If an edge has been visited, we know that the source node ofthis edge has been executed.
∙ If a node has been executed and the node is the target of onlyone edge we know that this edge has been visited.
Recursively applying these rules allows determining the executionstatus of all instructions of a method – given that we have probes atthe right positions. Therefore JaCoCo inserts probes
∙ at every method exit (return or throws)
∙ at every edge where the target instruction is the target of morethan one edge.
16
1. Code coverage in the Java ecosystem
We recall that a probe is simply a small sequence of additional instruc-tions that need to be inserted at a control flow edge. The following tableillustrates how these extra instructions are added in case of differentedge types.
Probe Implementation
Code coverage analysis is a runtime metric that provides executiondetails of the software under test. This requires detailed recording ofthe instructions (instruction coverage) that have been executed. Forbranch coverage also the outcome of decisions has to be recorded. Inany case, execution data is collected by so-called probes. A probe isa sequence of bytecode instructions that can be inserted into a Javamethod. When the probe is executed, this fact is recorded and canbe reported by the coverage runtime. The probe must not change thebehavior of the original code.
The only purpose of the probe is to record that it has been executedat least once. The probe does not record the number of times it hasbeen called or collects any timing information. The latter is out ofscope for code coverage analysis and more in the objective of a perfor-mance analysis tool. Typically multiple probes need to be inserted intoeach method. Therefore probes need to be identified. Also, the probeimplementation and the storage mechanism it depends on needs tobe thread safe as multi-threaded execution is a common scenario forjava applications (albeit not for plain unit tests). Probes must not haveany side effects on the original code of the method. Also, they shouldadd minimal overhead.
So to summarize the requirements for execution probes:
∙ Record execution∙ Identification for different probes∙ Thread safe∙ No side effects on application code∙ Minimal runtime overhead
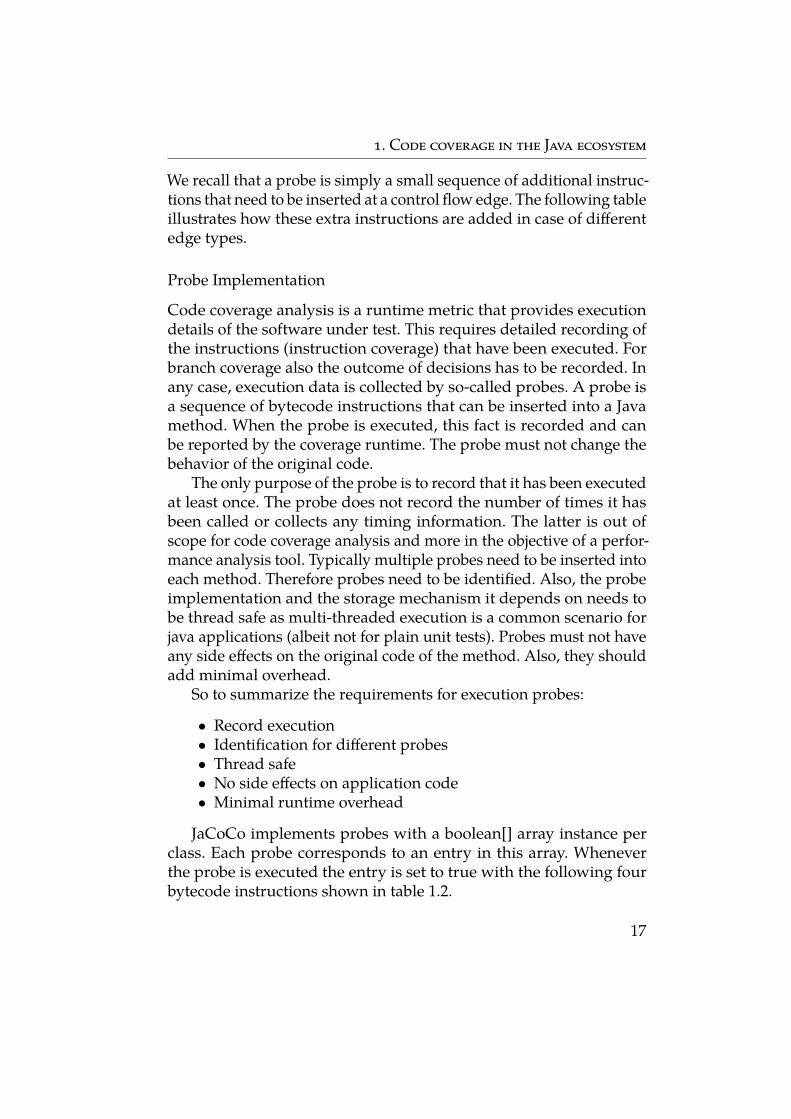
JaCoCo implements probes with a boolean[] array instance perclass. Each probe corresponds to an entry in this array. Wheneverthe probe is executed the entry is set to true with the following fourbytecode instructions shown in table 1.2.
17
1. Code coverage in the Java ecosystem
Table 1.2: A JaCoCo probes bybtecode instructions
ALOAD probearrayxPUSH probeidICONST_1BASTORE
Table 1.3: The overhead per probe
Possible Opcodes Min. Size [bytes] Max. Size [bytes]ALOAD_x, ALOAD 1 2ICONST_x, BIPUSH,SIPUSH, LDC, LDC_W
1 3
ICONST_1 1 1BASTORE 1 1Total: 4 7
Note that this probe code is thread-safe, does not modify theoperand stack or modify local variables and is also thread safe. Itdoes also not leave the method through an external call. The onlyprerequisite is that the probe array is available as a local variable. Forthis, at the beginning of each method, additional instrumentationcode needs to be added to obtain the array instance associated withthe belonging class. To avoid code duplication, the initialization isdelegated to a static private method jacocoinit() which is added toevery non-interface class.
The size of the probe code above depends on the position of theprobe array variable, and the value of the probe identifier as differentopcodes can be used. As calculated in the table below the overheadper probe ranges between 4 and 7 bytes of additional bytecode shownin table 1.3.
[15]
18
1. Code coverage in the Java ecosystem
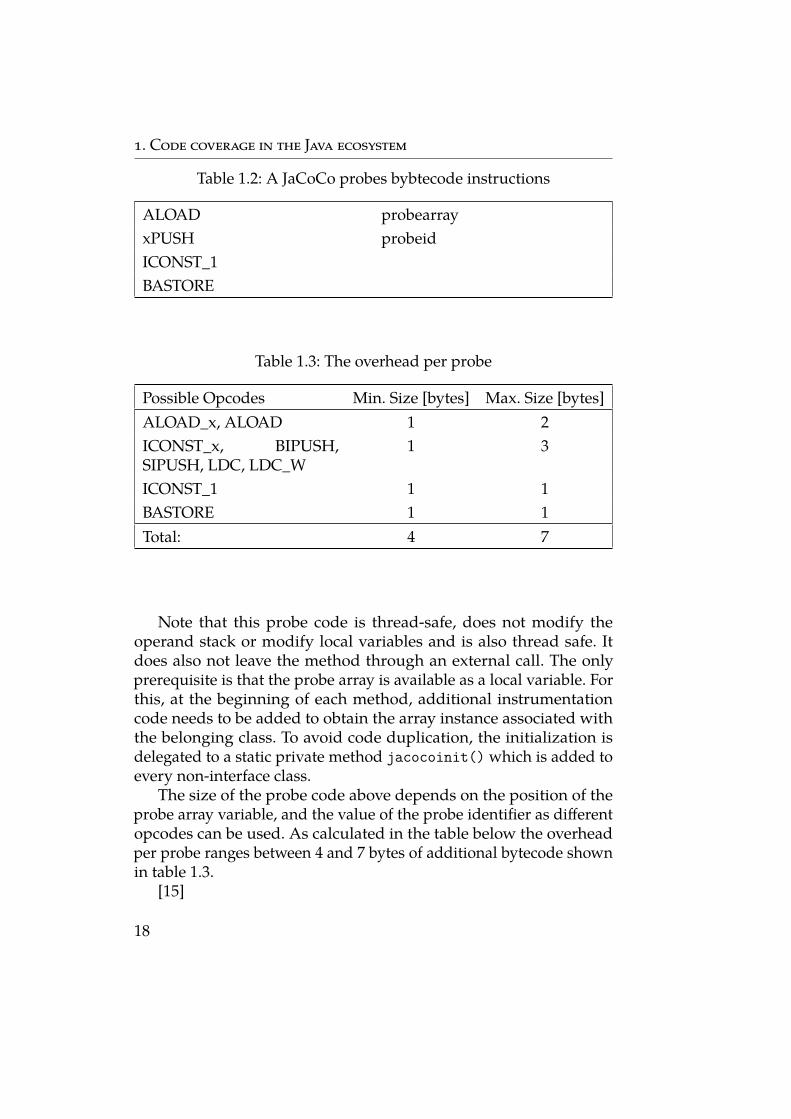
Implementation of the probe in JaCoCo
The implementation of the probe by calling methods from the ASMlibrary looks like this:
public void insertProbe(final int id) {mv.visitVarInsn(Opcodes.ALOAD , variable );InstrSupport.push(mv , id);mv.visitInsn(Opcodes.ICONST_1 );mv.visitInsn(Opcodes.BASTORE );
}
MethodVisitor instance (in example mv) is already configured byJaCoCo. The input value of the method that inserts the probe intothe source code is the id of the probe. The injected code must loadan array that store information about which code was executed. Thisis done using the method visitVarInsn(). Then, using the internalmethod, on the stack is placed the position on which the code passes.A constant value is then entered on the stack which indicates thecode passing. Finally, these changes are saved. This is done using theoperation BASTORE.
1.4.4 Collecting of code coverage data
Coverage data are collected and presented automatically when theapplication finishes running. If the application is forcibly stopped,then it is not possible to see the results of the analysis.
Data about code coverage of the particular program run are storedin coverage sessions. It contains the list of considered Java classes andJava packages along with the recorded coverage details. These sessionsare automatically created after the end of each run or can be returnedat the moment when the user sends a request for the session. At theend of the whole coverage analyze is created a coverage report from allcoverage sessions and all sessions are removed. One Coverage sessionusually represents a Java package.
During analysis, there are several sessions mainly if tests suites arerun in parallel.
19
1. Code coverage in the Java ecosystem
JaCoCo Agent
JaCoCo uses class file instrumentation to record execution coveragedata. Class files are instrumented on-the-fly using a so called Javaagent. This mechanism allows in-memory pre-processing of all classfiles during class loading independent of the application framework.The JaCoCo Ant tasks and JaCoCo Maven plug-in use the agent and itsoptions directly. The JaCoCo agent collects execution information anddumps it on request or when the JVM exits. There are three differentmodes of execution data output:
∙ File System: At JVM termination execution data is written to alocal file.
∙ TCP Socket Server: External tools can connect to the JVM andretrieve execution data over the socket connection. Optionalexecution data reset and execution data dump on VM exit ispossible.
∙ TCP Socket Client: At startup, the JaCoCo agent connects to agiven TCP endpoint. Execution data is written to the socket con-nection on request. Optional execution data reset and executiondata dump on VM exit is possible.
[13]
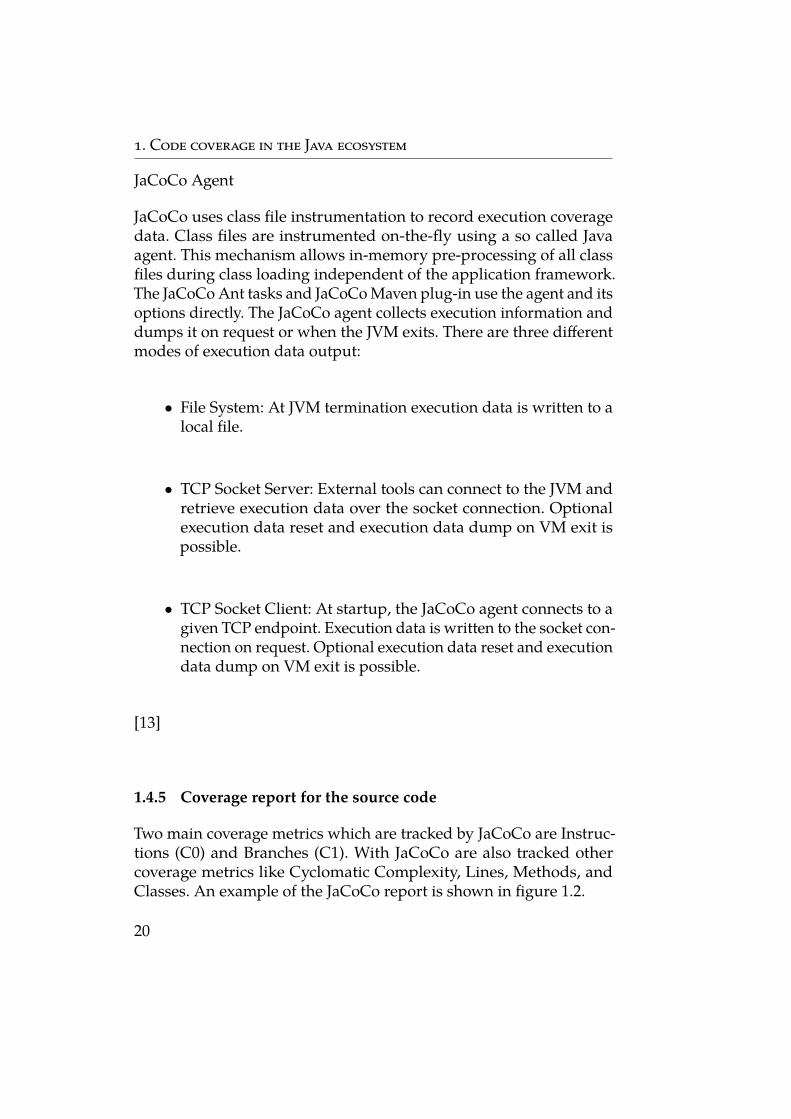
1.4.5 Coverage report for the source code
Two main coverage metrics which are tracked by JaCoCo are Instruc-tions (C0) and Branches (C1). With JaCoCo are also tracked othercoverage metrics like Cyclomatic Complexity, Lines, Methods, andClasses. An example of the JaCoCo report is shown in figure 1.2.
20
1. Code coverage in the Java ecosystem
[13]
Figure 1.2: Code Coverage Report for JaCoCo
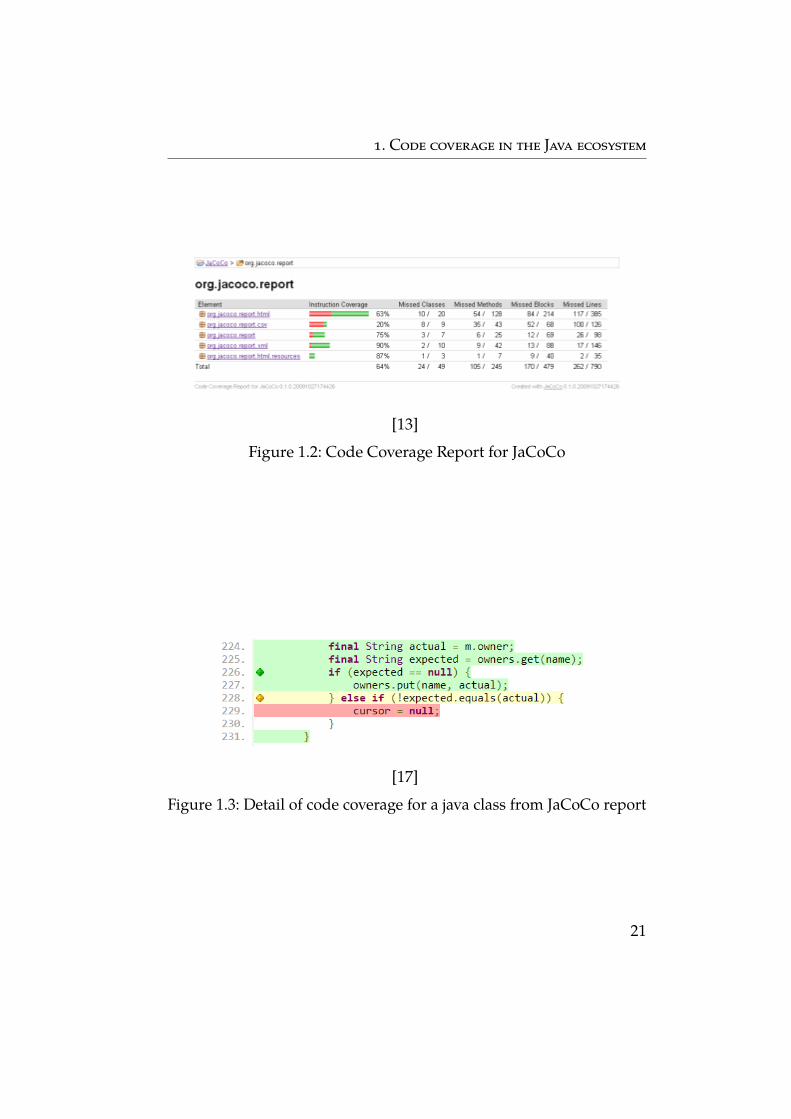
[17]
Figure 1.3: Detail of code coverage for a java class from JaCoCo report
21
1. Code coverage in the Java ecosystem
In JaCoCo report the source code’s lines have different colors. Adetailed example of a report view is in figure 1.3. These colors havethe following meaning:
∙ Green lines are fully covered lines of code.
∙ Yellow lines are partially covered lines.
∙ Red lines are not covered lines of code. These lines were notexecuted during an analyze run.
In JaCoCo report branches in the source code are marked with adiamond with different colors. These diamonds are at the first line ofthe decision branch. A detailed example of a report view is in figure1.3. Colors of diamonds have the following meaning:
∙ Green diamond indicates fully covered branch.
∙ Yellow diamond indicates partially covered branch. That meansthat branch was executed but was not completed. For example,an exception was thrown out of the decision branch.
∙ Red diamond indicates that the decision branch wasn’t calledduring analyze.
[13]
22
2 Design of detection duplicate code coverage
In this chapter is described the solution of detecting duplicate testcoverage in Java applications. In the JaCoCo are inserted probes asatomic operations. For the solution is not possible to get the locationof the call in atomic time. And it means that solution for detectingof duplicate calls increase the complexity of the whole run. For thesolution is necessary to detect duplicates without dependencies onthe current run.
For the solution is also not possible to use byte array from JaCoCo.If the byte array would be replaced by other data object, with a ca-pability to store duplicates locations into it, then it will increase theconsumption of memory and the whole analyze can fail because ofOutOfMemoryError exception. It’s needed to figure out how to cor-rectly store information about duplicates. It is also needed to store allinformation as an atomic operation to avoid issues with access to datavariables.
One of the requirements is not to replace or change the defaultbehavior of JaCoCo and its API. JaCoCo is widely used code coveragetool, and changes in API or JaCoCo’s functionality can break compati-bility to other projects, which depends on JaCoCo, or to other JaCoCousers.
In this chapter we focus on:
∙ how to get the location of the call
∙ how to filter out the source of the call
∙ how to replace bytecode probe in JaCoCo
∙ how to track runtime of the calls
∙ how to store data
∙ how to display a report
∙ how to extend JaCoCo with the new future and do not affectother
∙ possible performance issues of the design
23
2. Design of detection duplicate code coverage
2.1 Obtain a location of the call
The first problem is how can be obtained a location of the call, whichexecutes a part of the observed code. JaCoCo works with a compiledapplication, and it tracks usage of the source call. That means thatJaCoCo analyze does not have access to the test of the applicationand also it can be used different tests to check code coverage (e.g.,integration tests).
Because we do not know how the structure and content of the testslook like and we need to know how the application arrived at theobserved place, the best solution seems to use a stack trace. A stacktrace is a Java debugging tool which shows a call stack at a specifictime. A stack trace is mainly used with exceptions. It helps to trackdown causes of the exceptions and solve bugs in code. Stacktrace canbe generated manually with a system call so it can show the stack offunctions that were called up to that point. The following java codemust be called to generate stack trace manually:
Thread.currentThread (). getStackTrace ();
Stacktrace, after being obtained, is represented as an object arrayof StackTraceElement objects. Each element represents a single stackframe. All stack frames except for the one at the top of the stack repre-sent a method invocation. The frame at the top of the stack representsthe execution point at which was the stack trace generated. [18]
StackTraceElement class contains methods getClassName() andgetMethodName(). Method named getClassName() returns the fullyqualified name of the class. And method named getMethodName()returns the name of the method. Using these two methods, it can begot the name of the class and name of the method, which caused thesource code call when the stack trace was generated. The problem isthat in stack trace are also elements which shows a necessary systemcalls for the application run. So it is required to filter out the rightcalls.
From the StackTraceElement is possible to get more informationabout the call. But methods like getFileName(), which returns thename of the source file containing the execution point, or getLineNum-ber(), which returns the line number of the source line containing the
24
2. Design of detection duplicate code coverage
execution point represented by this stack trace element, are not neces-sary for the further work.
2.2 Filtering out the location of the source
In the stack trace is a lot of details about system calls and calls throughthy analyzed application. These informations are not needed for thefinal report. What is needed is only on StackTraceElement, whichcontains information about the source. Source are tests which are run-ning against the analyzed application. So source is get from the Stack-TraceElement by methods getClassName() and getMethodName().From these methods can be created source which contains class testname and methods test name (test scenario).
What is well know about the location of the source is that in thestack trace it can be found in the bottom part of the stack. It is becauseon the top of the stack is an element from where was stack generatedand at the bottom of the stack is a root of the call. However, the rootof the call does not have to be a source location. In the root of thestack is a system call which starts the whole run of analyze (if testsare part of it) or a call which starts test execution against the analyzedapplication.
What should not be forgotten is that test are normal Java classes.That means tests can implement testing interfaces or can have anabstract parent class. So filtering cannot rely on the first source foundbecause it may be an abstract class and this class is not the correctsource. It is needed to find the implementation of the abstract class inthe stack trace and this will be the correct source location. In the stack,the abstract calls are stored before the implementation call.
2.3 Replacement of the inserted bytecode
In actual version of JaCoCo are inserted probes, these probes insertinto the code of the application instruction to confirm passage. JaCoCoinstrumentation is described on page 13. The current state does notmeet the needs to insert other instruction. Because JaCoCo on the levelof bytecode it is necessary to add calling of the location as bytecodeinstructions. By adding a large number of bytecode instructions, there
25
2. Design of detection duplicate code coverage
is a risk that the code will be not able to run because of issues withstack stability and overflow. Java compiler is designed to compile Javacode to the optimal bytecode for application run.
To avoid some issues with bytecode instructions added into thecode is better to insert into the code calling for external method thanextending the actual instructions and complicated logic of the bytecodeinstruction added by JaCoCo. In the external method can be easilyimplemented functionality for detecting code coverage duplicates. Allthe logic of getting the source, filter the source location and saving ofthe result can be handled by this external class.
It may seem like that with added external class is changed call forgenerating the stack trace, but with external class is added only oneelement on the top of the stack above the observed place.
2.4 Runtime of the calls
Once the tests are completed, the time of each test is known. However,it can not be ascertained how long the single parts of the test lasted.Using this information, it would be possible to detect slow spots,especially bottlenecks, badly merging multi-thread operations, andinappropriate use of wait methods (e.g., Thread sleep).
After the in-depth exploration of JaCoCo and comprehension ofthe functional principles the requirement to track the time for howlong the tests were in the specific piece of code can be considered asinvalid. It is caused by how JaCoCo works with source code. JaCoCoinserts an atomic operation to the pieces of codes to track their usage.So JaCoCo cannot add timer before the observed part of the code andafter it. And JaCoCo does not know the tests, so it is hard to say whenis actual test executed and when the test ends.
For tracking could be added timestamps when is get a location ofthe call but this value does not say anything about the runtime of thepiece of code, it only says at which time JaCoCo gets the location ofthe call. Values could be connected with appropriate source locations.But these time values will be affected by getting the location code andfiltering out the corresponding test source.
26
2. Design of detection duplicate code coverage
2.5 Storing of the duplications
In JaCoCo is information about coverage represented by boolean arraywhere probe id is a location of the value in the array. So data aboutcode coverage are represented as primitive value true or false. Forextended functionality, when are detected duplicates, is required tostore data about all source calls. That means that one place can havefrom zero to N source calls represented as String, which consists ofa full class name and method name. Also storing should be able tohandle when is added some source call multiple times because sometest can call same code repeatedly (e.g. creating more instances of thetested object) and information about how many times was the pieceof code call is not required and storing of this redundant informationwill be very expensive for memory consumption.
Data should be represented by a default Java collection. To preservethe acquired data the most appropriate is a ConcurrentHashMap,which has an implementation of the set configured as a value. Usinga probe id, from the map can get the set for storing call locations.
To reduce a load on JVM memory and avoid to OutOfTheMemoryexceptions data should be saved into external (local) file. To save toa file is necessary to choose a suitable format such as JSON file orlocal database. Working with non-application storage can increase theoverall run time of the analysis. This increase causes access to the file.To improve performance, data can be stored after large parts.
2.6 Report for users with information aboutduplicate test coverage
JaCoCo provides by default well-looking report. For displaying theresults of duplicate locations is it needed to extend this report. TheJaCoCo report is created from the small parts (Java classes) and thenare results merged to the more significant pieces (packages). Smallestparts hold information about code coverage in numerical values whichfor better understand is represent in percents. Packages then add upand display the average of the all classes and sub-packages.
With new storage of data, report do not know which pieces of codewere visited (covered). Now from the stored data report know, which
27
2. Design of detection duplicate code coverage
place was visited from where. This requires changes in generationreport for the new functionality of JaCoCo. In the report the missingpieces do not get as false bytes from the array, but now is it represent apart of the code which was not executed by any test class. So in storagedata, this case is represented as an empty visitation of the code.
2.7 Extended JaCoCo with the new functionality
It is required not to break the actual functionality of JaCoCo. Existingusers should not be affected by new changes. They depend on thecurrent version of JaCoCo, and new changes can badly break theirconfigurations. Main code coverage analyzes functionality should stayuntouched and works fine after all changes will be done.
So the new functionality should not be turned on by default. There-fore it is necessary to implement all new functionality as extensionsof the current code, and during the implementation, the JaCoCo APIshould not be changed. New function added into an application in-terface is followed by big changes in code, so it is usually requiredto introduce changes like this with a major release version of theapplication. All these restrictions help prevent to break backwardcompatibility.
All code added to JaCoCo should have corresponding JUnit testcases. Ideally, tests are developed before or along with the actualimplementation. Test cases should verify every new feature. Test casesshould also reflect modified behavior.
2.8 Possible performance issues of the design
The control flow analysis and probe insertion strategy of JaCoCoallows recording instruction and branch coverage efficiently. In totalclasses instrumented with JaCoCo increase their size by about 30%.Because probe execution does not require any method calls, only localinstructions, the observed execution time overhead for instrumentedapplications typically is less than 10%. [15]
It is expected that performance of JaCoCo with the new functional-ity will increase. An increase of the size of instrumented classes shouldnot be massive, because inserted probes are similar in proportion to
28
2. Design of detection duplicate code coverage
the original one. In the JaCoCo extension are used method calls, andlocal instructions are not used. So observed execution time overheadfor instrumented applications by new probes will increase.
29

3 Implementation
In this chapter are introduced new features for expanding the func-tionality of JaCoCo. Implemented parts are written in a programinglanguage Java. The ASM library is used for bytecode manipulation.
One of the requirements is not to replace or change the defaultbehavior of JaCoCo and its API.
3.1 Filtering method
First, we must be able to get correct location of the source call. Fromthe probe, we get the array of stack trace elements as an input forthe filtering method. We do not need to change the input to any Javacollection. An array as the input value is quite suitable for us becausemostly in the filtering method we need to access to the stack traceelement and get from it a class name and method name. From thearray, we will only need to read the values. In arrays, we can accessthe specific element by its index. Reading stack trace element from thearray by its index is a constant operation with a size O(1). And it doesnot depend on the size of the array.
After a detailed examination of the JaCoCo functionality and ob-servation of stack trace generated by the source code of the applicationduring the test, we noticed how the source code was called and thushow it can be filtered out from which test was the code of the appli-cation executed. Since we know how JaCoCo was started, it can beused for filtering. Calling the source code of the application that weobserved with the probes is due to running tests. Therefore, fromthe stack trace, it can be observed that the tests are triggered by thereflection from the internal Java API which was triggered by the testrunner from the test framework.
Reflection is a feature in the Java programming language. It allowsan executing Java program to examine or "introspect" upon itself,and manipulate internal properties of the program. For example, it’spossible for a Java class to obtain the names of all its members anddisplay them. [19]
Runners are used for running test classes. A Runner runs tests andnotifies a RunNotifier of significant events as it does so.
31
3. Implementation
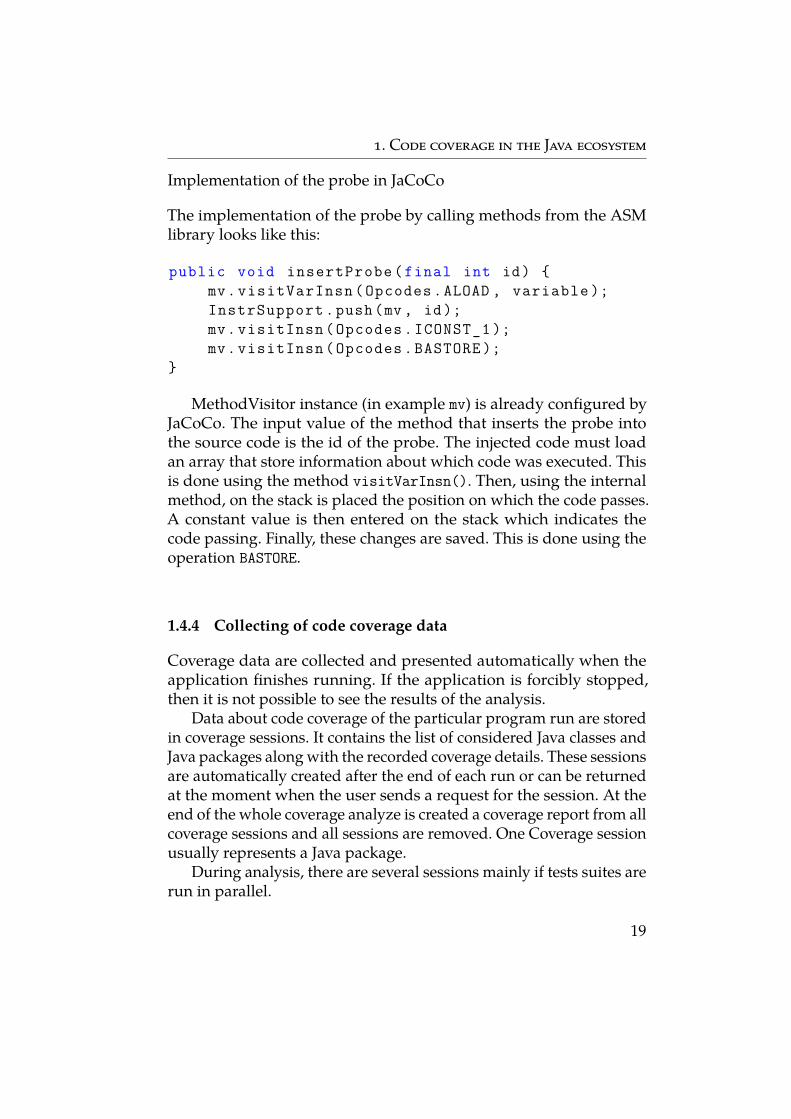
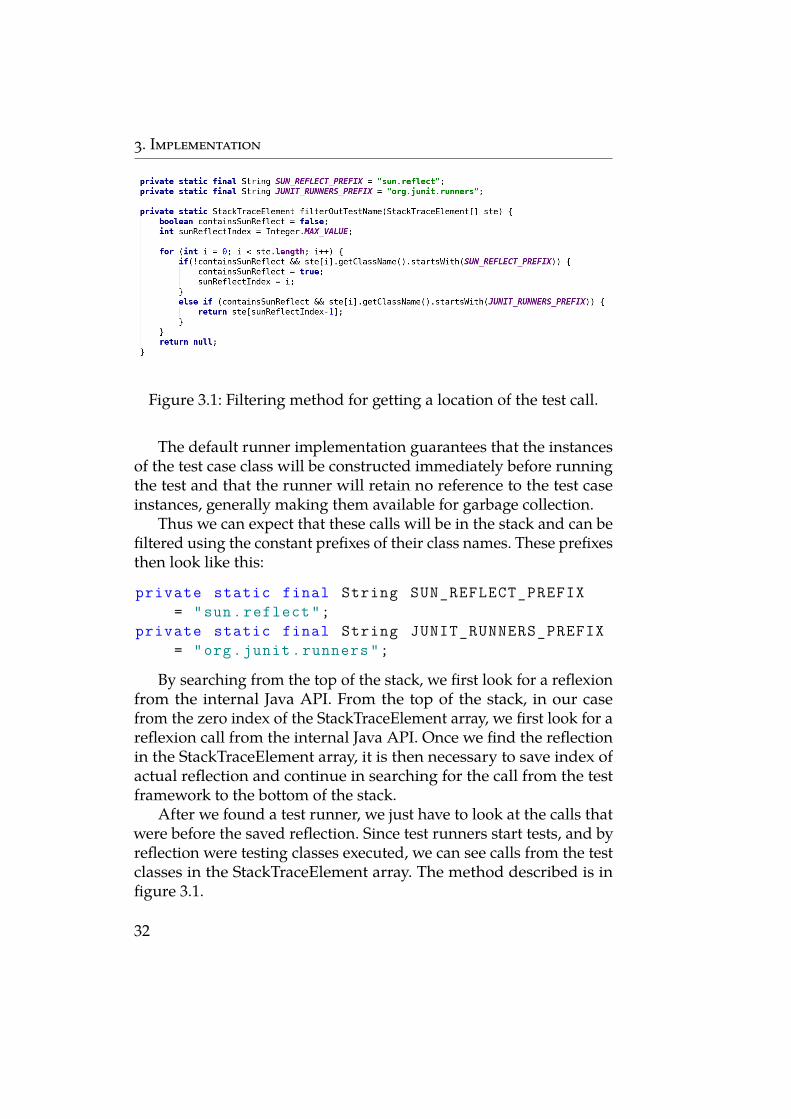
Figure 3.1: Filtering method for getting a location of the test call.
The default runner implementation guarantees that the instancesof the test case class will be constructed immediately before runningthe test and that the runner will retain no reference to the test caseinstances, generally making them available for garbage collection.
Thus we can expect that these calls will be in the stack and can befiltered using the constant prefixes of their class names. These prefixesthen look like this:
private static final String SUN_REFLECT_PREFIX= "sun.reflect";
private static final String JUNIT_RUNNERS_PREFIX= "org.junit.runners";
By searching from the top of the stack, we first look for a reflexionfrom the internal Java API. From the top of the stack, in our casefrom the zero index of the StackTraceElement array, we first look for areflexion call from the internal Java API. Once we find the reflectionin the StackTraceElement array, it is then necessary to save index ofactual reflection and continue in searching for the call from the testframework to the bottom of the stack.
After we found a test runner, we just have to look at the calls thatwere before the saved reflection. Since test runners start tests, and byreflection were testing classes executed, we can see calls from the testclasses in the StackTraceElement array. The method described is infigure 3.1.
32
3. Implementation
3.2 Insert adjust probe with external method call
Inserting probes into the source code of the application is subjectto complex strategies that are already part of JaCoCo. Inserting ofprobes is described in 1.4.3 on page 13. Since we want to keep theprobe insertion strategy into the source code, we will only extend theinsertion probe.
The Jacoco probe is a sequence of bytecode instructions, and theseinstructions are implemented using the ASM library. This is describein detail on page 17. Insert a new probe using the bytecode instructionsappears to be a possible solution. However, since we want to avoidthe complicated call of bytecode instructions through the ASM API,to get a StackTrace output and then filtering out the result and savingit, we insert a probe, which calls an external method.
External methods we will call from the newly added class namedLocationFilter to the internal JaCoCo core package called util. Thisclass includes a method that must to get a stack trace output, filter outthe results, and then save them.
3.2.1 An inserted probe that calls static method
The first option is to call a static method from a new class. The insertedprobe will look like this:
mv.visitMethodInsn(Opcodes.INVOKESTATIC ,Type.getInternalName(LocationFilter.class),"filter",Type.getMethodDescriptor(Type.VOID_TYPE),false);
mv.visitInsn(Opcodes.RETURN );
JaCoCo has already set up an ASM interface, so there is no need toconfigure class visitor and method visitor, we can modify the methodthat directly inserts new code into the correct location of the sourcecode. With this probe, we add a new static method call into the sourcecode.
MethodVisitor instance (in example mv) by method visitMethodInsnadd to source code a new bytecode instruction to execute a staticmethod. We need to set parameters of this method. With the first
33
3. Implementation
parameter, we specify the type of the method. The Opcode valueINVOKESTATIC means that the method is static. The next two valuesspecified full class name and name of the called method. By the fourthparameter value, we set types of the inputs and also the type value ofthe output. The last value is set to true if the called method is abstract.
By the method visitInsn, we add to the code instruction to returnfrom the called method. Because the called method is independentand has set a return type to void, then nothing more needs to behandled by the probe.
This probe set in the source code of the application caused ap-plication crash during JaCoCo analysis. The fall of the applicationwas caused by the recursive call of the inserted static method thatcaused an OutOfMemory Error. The subsequent addition of the re-turn instructions to bytecode of compiled application did not affectthe recursive behavior of the static method.
3.2.2 An inserted probe that calls a constructor of the object
As another option appears to call the constructor of the new class. Theinserted probe will look like this:
mv.visitTypeInsn(Opcodes.NEW ,Type.getInternalName(LocationFilter.class ));
mv.visitInsn(Opcodes.DUP);mv.visitMethodInsn(Opcodes.INVOKESPECIAL ,
Type.getInternalName(LocationFilter.class),"<init >",Type.getMethodDescriptor(Type.getObjectType(
Type.getInternalName(LocationFilter.class))
),false);
mv.visitVarInsn(Opcodes.ALOAD , variable );mv.visitInsn(Opcodes.ARETURN );
JaCoCo has already set up an ASM interface, so there is no need toconfigure class visitor and method visitor, we can modify the methodthat directly inserts new code into the correct location of the sourcecode. With this probe, we add a constructor call into the source code.
34
3. Implementation
MethodVisitor instance (in the example mv) by method visiteTypeInsnadd to source code information that we will be creating a new instanceof a specified object. Then we need to duplicate the previous type onthe top of the method visitInsn with the Opcodes instruction DUP.We need to duplicate it for the correct execution of constructor.
With method visitMethodInsn, we add to source code a new byte-code instruction to execute a static method. We need to set parametersof this method. With the first parameter, we specify the type of themethod. The Opcode value INVOKESPECIAL means that the method wecalled is a constructor of the object. The second value specifies a fullclass name. Then we need to set the method name, for a constructor,it is a string "<init>". By the fourth parameter, we set types of theinputs and also the type of the output. For the configuration, we canuse a Type class from ASM, and it’s method getMethodDescriptor,which returns a descriptor as a string value. The last value is set totrue if the called method is abstract.
By the method visitInsn, we add to the code instruction to returnfrom the called method. Because the called method creates a newinstance of the object we need to specify, that is returned an object byOpcode Opcodes.ARETURN. We do not need anymore to work with thisinstance of this object. So we can leave a new instance at is it and Javagarbage collector should delete it when it is not needed anymore.
Thus, the inserted probe into the source code, even if the instruc-tions for bytecode calls are followed in right order, causes the fall ofthe analyzed application. The application at runtime throws the errorthat the class with the inserted code has a wrong format and can not beexecuted. The ClassFormatError exception that an application dropsoff causes a supposedly wrong set of the constructor’s description. Forthe constructor description, a specified class from the ASM library isused to generate a description based on the entered data. This methodaccepts the output type as the first input parameter and then the typesof the all input parameters follows. Debugging of the extended sourcecode cannot be done with standard debugging tools, and because weextend already compiled code, files of type .class are in bytecode, andwe are not able to read.
35

4 Conclusion
This Bachelor Thesis aimed to extend the existing code coverage tool.Extended functionality of this tool should detect duplicate coverageand identify the length of the run of individual parts of the code.
In this work, it was possible to design a solution for detectingduplicate coverage, even though when this problem of this work wasintroducing to the JaCoCo developers, I got a feedback that somethinglike this with the help of JaCoCo cannot be done.
Detection of duplicate coverage tests can be done by locating a callto the source code. By using the Jacoco code insertion, we can simplyextend the functionality of the tool, and there is no need to change thebasic functionality of JaCoCo tool. For a reasonable representation ofthe result, the Jacoco reporting tool can be extended as well.
Already during the analysis, we found that it was not possibleto track the runtime of parts of the source code with JaCoCo. Thisis mainly due to how JaCoCo inserts the probes. Additionally, theinformation thus obtained would not correspond to real values, as thesource code is expanded to detect call coverage.
During the implementation section, we encountered problemsarising from the insertion of bytecode into an already compiled appli-cation. Although we correctly used the designated ASM library, thenewly inserted code into the application caused errors in its subse-quent run. Although we have followed the ASM documentation aswell as using ASM code insertion, the enriched application failed towork. However, in isolated cases, we were able to verify the source ofthe code call and its filtering.
The resulting extension can be activated using system properties,and the remaining JaCoCo settings should remain the same. Thanksto the fact that JaCoCo is an opensource tool, developers could usethis extension to reduce and clarify test kits and accelerate the runningof their test kits. The secondary feature is handy, as is the subsequentdetection of not used tests in large test sets because when the test isnot part of the listing, it was not used and therefore unnecessary. Thisway, you can safely remove test results from test sets without worryingabout the test results.
37
4. Conclusion
The implementation part could be completed in the future. Also infuture, An appropriate and interactive graphical view of results basedon data obtained during duplicate detection could also be added forthis extension. Currently proposed data representations can be quiteunclear for users who do not know the structure of the monitoredenvironment and test sets.
38
Bibliography
1. HEROUT, Pavel. Učebnice jazyka Java / Pavel Herout. 5. rozšířené vydání.České Budějovice: KOPP, 2010. ISBN 978-80-7232-398-2.
2. VENNERS, Bill. The Java Virtual Machine. McGraw-Hill, New York,1998.
3. Instrumenting Java Bytecode with ASM [online]. UCLA Computer Sci-ence, 2018 [visited on 2018-05-20]. Available from: http://web.cs.ucla.edu/~msb/cs239-tutorial/.
4. MYERS Glenford J., Tom BADGETT; SANDLER, Corey. The Art ofSoftware Testing. 3rd ed. Hoboken, N.J.: John Wiley and sons, 2012.ISBN 978-1-118-03196-4.
5. JOHNSON, Paul. Testing and Code Coverage. Munich Perl Mongers[http://munich. pm. org/](Ed.) 2002, pp. 97.
6. ASM: a very small and fast Java bytecode manipulation framework [online].INRIA, France Telecom, 2002–2018 [visited on 2018-05-20]. Availablefrom: http://asm.ow2.io/index.html.
7. BRUNETON, Eric. ASM 3.0 A Java bytecode engineering library. URL:http://download. forge. objectweb. org/asm/asmguide. pdf. 2007.
8. BRUNETON, Eric; LENGLET, Romain; COUPAYE, Thierry. ASM: acode manipulation tool to implement adaptable systems. Adaptableand extensible component systems. 2002, vol. 30, no. 19.
9. BRUNETON, Eric. ASM - Developer Guide [online]. 2018 [visited on2018-05-20]. Available from: http : / / asm . ow2 . io / developer -guide.html#classwriter.
10. ClassWriter (ASM 6.1.1) [online]. ASM, 2018 [visited on 2018-05-20].Available from: http://asm.ow2.io/javadoc/org/objectweb/asm/ClassWriter.html.
11. ClassReader (ASM 6.1.1) [online]. ASM, 2018 [visited on 2018-05-20].Available from: http://asm.ow2.io/javadoc/org/objectweb/asm/ClassReader.html.
12. Opcodes (ASM 6.1.1) [online]. ASM, 2018 [visited on 2018-05-20]. Avail-able from: http://asm.ow2.io/javadoc/org/objectweb/asm/Opcodes.html.
39
BIBLIOGRAPHY
13. JaCoCo Java Code Coverage Library [online]. EclEmma, 2009–2018 [vis-ited on 2018-05-20]. Available from: https://www.eclemma.org/jacoco/index.html.
14. JaCoCo - Coverage Counter [online]. EclEmma - Java Code Coverage forEclipse, 2009–2018 [visited on 2018-05-20]. Available from: https://www.jacoco.org/jacoco/trunk/doc/counters.html.
15. JaCoCo - Control Flow Analysis [online]. EclEmma - Java Code Coveragefor Eclipse, 2009–2018 [visited on 2018-05-20]. Available from: https://www.jacoco.org/jacoco/trunk/doc/flow.html.
16. JaCoCo - Implementation Design [online]. EclEmma - Java Code Cover-age for Eclipse, 2009–2018 [visited on 2018-05-20]. Available from:https://www.jacoco.org/jacoco/trunk/doc/implementation.html.
17. TryWithResourcesEcjFilter.java [online]. EclEmma - Java Code Coveragefor Eclipse, 2018 [visited on 2018-05-20]. Available from: https://www.jacoco.org/jacoco/trunk/coverage/org.jacoco.core/org.jacoco.core.internal.analysis.filter/TryWithResourcesEcjFilter.java.html#L224.
18. StackTraceElement (Java Platform SE 7 )M [online]. Oracle, 1993–2018[visited on 2018-05-20]. Available from: https://docs.oracle.com/javase/7/docs/api/java/lang/StackTraceElement.html.
19. MCCLUSKEY, Glen. Using java reflection. Java Developer Connection.1998.
40