Embed Size (px)
Citation preview

Environment and Development Economics: page 1 of 24 C© Cambridge University Press 2011doi:10.1017/S1355770X11000155
Implementation of REDD+ in sub-SaharanAfrica: state of knowledge, challenges andopportunities
MATIEU HENRYLaboratorio di Ecologia Forestale, Dipartimento di Scienze dell’AmbienteForestale e delle sue Risorse, Facoltà di Agraria, Università degli Studi dellaTuscia, Via Camillo de Lellis, snc – 01100, Viterbo, Italy; Institut deRecherche pour le Développement (IRD), UMR 210 Eco&Sols(INRA-IRD-SupAgro), France; and AgroParisTech-ENGREF, GEEFT,France. Email: [email protected]
DANAE MANIATISEnvironmental Change Institute, School of Geography and the Environment,University of Oxford, UK. Email: [email protected]
VINCENT GITZCentre International de Recherche sur l’Environnement et le Développement,France. Email: [email protected]
DAVID HUBERMANInternational Union for Conservation of Nature – Economics andEnvironment, Switzerland. Email: [email protected]
RICCARDO VALENTINILaboratorio di Ecologia Forestale, Dipartimento di Scienze dell’AmbienteForestale e delle sue Risorse, Facoltà di Agraria, Università degli Studi dellaTuscia, Italy. Email: [email protected]
Submitted 28, July 2009; revised 14, September 2010, 18 January 2011; accepted 6, May 2011
ABSTRACT. Deforestation and forest degradation represent an important part of globalCO2 emissions. The identification of the multiple drivers of land-use change, past andpresent forest cover change and associated carbon budget, and the presence of locallyadapted systems to allow for proper monitoring are particularly lacking in sub-SaharanAfrica (SSA). Any incentive system to reduce emissions from deforestation and forestdegradation (REDD+) will have to overcome those limits. This paper reviews the main
Thanks are given to the European Union for funding this research through theCarboafrica Project. The authors thank Alexandre Meybeck for his advice in theconduct of this research.
2 Matieu Henry et al.
challenges to implementing effective REDD+ mitigation activities in SSA. We estimatethat SSA is currently a net carbon sink of approximately 319 TgCO2 yr−1. Forestdegradation and deforestation put the forest carbon stock at risk (mean forest carbonstock is 57,679 TgC). Our results highlight the importance of looking beyond the forestsector to ensure that REDD+ efforts are aligned with agricultural and land-use policies.
1. IntroductionDeforestation and forest degradation significantly affect the global carbon(C) cycle: directly when forest biomass is burned and carbon dioxide (CO2)is emitted into the atmosphere, and indirectly after land-use change takesplace, resulting in further decomposition of organic matter, soil respirationand soil degradation and erosion processes (Schulze et al., 2002). Globally,land-use changes contributed to a net release of 5.5±2.6 Pg CO2 yr−1 duringthe period 1990–2005, which represented about 12 per cent of the totalanthropogenic CO2 emissions (Le Quéré et al., 2009). While the Africancontinent contributes less than 4 per cent to the global balance of CO2emissions (Canadell et al., 2009), it accounts for 20 per cent of the globalnet CO2 emissions from land-use, mainly from forest degradation anddeforestation, and for approximately 40 per cent of emissions from forestfires (Kituyi et al., 2005; van der Werf et al., 2006). Since forests contain largeaboveground C stocks, up to 255 MgC ha−1 in tropical rainforests (IPCC,2003), there is a growing concern to avoid the loss of such stocks.
Tropical forests are particularly vulnerable to climate change itself.Evidence has been presented that the tropical rainforest zone of sub-Saharan Africa (SSA) was the driest tropical rainforest region over theperiod 1960–1998 and that it has become drier in recent decades (Malhiand Wright, 2005). The African continent was also identified as being themost vulnerable to climate change and a priority region by the UnitedNations Framework Convention for Climate Change (UNFCCC, 2006).Climate perturbations could lead to further drying, making the forestsmore vulnerable to extreme climate phenomena and increasing the risk offorest fragmentation and fires. Therefore, the preservation of the health offorest ecosystems in Africa is central to any mitigation policy in the region(Williams et al., 2007).
Forests have increasingly been considered a critical issue under theUNFCCC negotiations, as the objective of mitigating climate change isunlikely to be reached without substantial action on deforestation andforest degradation. However, the question of how to include deforestationand forest degradation in an international mitigation scheme under theUNFCCC has been a difficult technical and political issue to resolve fromthe start of the negotiations in 1992 (Gitz, 2004). This is also reflectedin the great number of proposals and incentive frameworks made onthe topic (Parker et al., 2008). Following a process that started duringthe 13th Conference of Parties (COP) to the UNFCCC at Bali in 2007,a Decision (4/CP.15) was adopted in Copenhagen (UNFCCC, 2009) onmethodological guidance for what is now called ‘REDD+’ (for ‘ReducingEmissions from Deforestation and forest Degradation and the role of conservation,sustainable management of forests and enhancement of forest C stocks indeveloping countries’). This agreement at the methodological level was

Environment and Development Economics 3
accompanied by several financial pledges by developed countries. Duringthe Oslo Climate and Forest Conference, convened in May 2010, severaldeveloped countries jointly pledged $4 billion to support REDD+ policiesand measures. In December 2010 in Cancun, the 16th meeting of the COPadopted a Decision including ‘Policy approaches and positive incentives onissues relating to reducing emissions from deforestation and forest degradationin developing countries; and the role of conservation, sustainable management offorests and enhancement of forest carbon stocks in developing countries’. Whilethere is high interest in seeing such initiatives take form, more workremains to be done to ensure that national-level REDD+ programmes aresuccessfully established and implemented. Specifically, a key challengefor developing countries wishing to take part in the expected REDD+mechanism will be to design operational, national forest monitoringsystems to support the Measurement, Reporting and Verification (MRV)requirements of the Decisions and the UNFCCC.
Challenges to ensure a suitable implementation of REDD+ activitiesare further complicated by three important distinctive issues. First, manyhuman-induced drivers of various kinds (economic, institutional, etc.)interact and may result in forest cover loss and degradation. As thedynamics that animate the various political, institutional, economic andsocial factors that shape land-use decisions and trends are both complexand interrelated, it is difficult to assess their specific role in drivingdeforestation and forest degradation. Any REDD+ mitigation mechanismseeking to provide effective incentives to reduce forest loss should takeinto account the complexity of the aforementioned underlying drivers and,under the recent COP16 Decision, parties are indeed encouraged to findeffective ways to reduce the human pressure on forests that results ingreenhouse gas (GHG) emissions, including actions to address the driversof deforestation (article 68).
Second, the establishment of accurate quantification systems is essentialin the context of REDD+ as it is a results-based mechanism. Thismeans that countries would only receive compensation for reducingloss, enhancing or conserving based on verifiable results that havebeen measured and reported to the UNFCCC. The need for accuratequantification applies both to the determination of any reference levelsand/or reference emission levels, and to the estimation of the results asthey are compared to such levels. Consequently, countries will have to putin place a system to assess forest cover, C stocks and their changes, in spaceand time, and report on any uncertainties in their data. This requires aharmonized approach for the identification of different types of forests andthe obtention of sufficient and reliable ground data on forest C stocks andstock change.
Third, several countries face important technical, financial andinstitutional challenges that exacerbate the difficulty of designing andimplementing national forest monitoring systems. Technologies exist suchas satellite imagery and in situ flux measurement techniques. Ways must befound for appropriate integration of specific national circumstances whiletaking into account the UNFCCC reporting guidelines; these elements areconsidered in the REDD+ Decisions.

4 Matieu Henry et al.
Any effective REDD+ system in SSA will have to address the threechallenges of the fight of multiple underlying drivers (section 2), thenecessity of accurate quantification of C budgets (section 3), and theimplementation of forest and carbon monitoring systems for REDD+(section 4).
It should be noted that COP 16 has requested that the SubsidiaryBody for Scientific and Technological Advice develop a work program:to identify land use, land-use change and forestry activities in developingcountries, in particular those that are linked to the drivers of deforestationand forest degradation; to identify the associated methodological issuesto estimate emissions and removals resulting from these activities;and to develop, as necessary, modalities for measuring, reporting andverifying anthropogenic forest-related emissions by sources and removalsby sinks, forest carbon stocks, forest carbon stock and forest area changesresulting from the implementation of REDD+ activities. This paperaims at characterizing the challenges for implementing effective REDD+mitigation activities in SSA.
2. Drivers of forest degradation and deforestationin Sub-Saharan AfricaThe design of REDD+ policies should first rely on the identification andunderstanding of the drivers of deforestation and forest degradation.Previous studies have identified, described and assessed numerous driversand impacts of the process of deforestation (Angelsen and Kaimowitz,1999; Soares-Filho et al., 2006; DeFries et al., 2010). Quantification of therelative strength and impact of the different drivers of deforestation is adifficult task, particularly in SSA where data on deforestation itself is notwell known (Tiffen, 2003). Below we present some of the proximate andunderlying deforestation and forest degradation factors in the SSA context,such as unsustainable forest management, fuelwood and agriculture, anddrivers related to the social, economic and political context of forests.
2.1 The forestry sectorForestry in SSA represents a major source of livelihood for a largeproportion of the population. It is an important source of employmentin the region, providing jobs for approximately 500,000 people (Lebedys,2008). It is a particularly important source of income and employmentin remote areas. Still, the contribution of forestry to the wider economyremains quite marginal. In the countries of the Congo Basin, for instance,forestry represents just 0.22–6.5 per cent of GDP (de Wasseige et al., 2009). Ithas also been reported that the productivity of the timber industry in SSAis the lowest in the world (Lebedys, 2008).
The evolution of the forestry sector in SSA over the past centuryhas witnessed a gradual transition from large-scale concessions (pre-independence) to smaller scale and more specialized operations (post-independence) (Nasi et al., 2006). The high demand for timber comingfrom Europe in the post-World War II years contributed significantly tothe expansion of the infrastructure, facilitating the growth of the forestrysector in SSA. More recently, European demand for timber from SSA is

Environment and Development Economics 5
supplemented by North American and, increasingly, Asian markets (ITTO,2008). This process has occurred in conjunction with the development oftechnical capacity as well as infrastructure, such as roads, which havein turn facilitated access for agricultural expansion and harvesting offuelwood and non-timber forest products such as bushmeat (Geist andLambin, 2001). Little consideration was given to the sustainability of theforestry industry for most of the 20th century; it was only in the 1990s thatecological criteria and formal management plans were incorporated intoSSA forestry policies (Nasi et al., 2006). In many instances, roads have beencreated specifically to facilitate the timber trade, thereby making forestsmore accessible to further exploitation. As a result, it has been reported thatthe forests of SSA are among the most fragmented in the world, especiallyin the western part of the continent (Rudel and Roper, 1997).
The impacts of timber extraction on forest cover extend beyond theremoval of trees, due to the creation of roads, skid trails, logging baysand tree falls in the exploited areas. Cases of over-exploitation of thetimber resource have also been observed (Birikorang et al., 2001). Thisstudy found that in 1995, the timber industry’s extraction was far abovethe annual allowable cut with an over-exploitation ranging from 22 to532 per cent for different tree species in Ghana. Fluctuations in timberprices vary according to market demand but also according to the typeof tree species being exploited. It has been found that only 50 per cent ofthe total volume of the biomass is extracted, leaving the other half in theforest to decompose (Aina et al., 2005). While significant progress has beenmade in terms of developing best practices for the timber industry, such asthose certified by the Forest Stewardship Council, only 5.2 per cent of theforests of the Congo Basin are currently certified (de Wasseige et al., 2009).High costs as well as lack of technical and institutional capacity have beenhighlighted as significant barriers to the implementation of sustainableforest management in the region (Kalu and Modugu, 2010).
2.2 FuelwoodIn SSA, the extraction of timber from forests is eight times less significantthan the extraction of fuelwood (figure 1a). Approximately two-thirds ofglobal fuelwood use occurs in SSA (FAOSTAT), where it is used by 80 percent of the population as the main source of energy (UN, 2007). Despite agrowing urban population, the use of fuelwood remains the main sourceof energy in cities (Arnold et al., 2006). Recent trends suggest that, inurban centres, fuelwood is gradually being replaced by charcoal, whichis considered a ‘transition fuel’ on the road towards the greater integrationof electricity and LPG (Arnold et al., 2006). As is the case for timber andother resources, the availability of fuelwood continues to decrease as thedemands of a growing population increase. Current levels of extractionlargely exceed the regenerative capacity of the forests (Arnold et al., 2006).Although it is difficult to clearly map the relationship between the removalof fuelwood and deforestation, as a lot of fuelwood is collected from non-forest lands (e.g. pastures, savannahs), the extraction of fuelwood has beenfound to be the most significant driver of the loss of forest cover in SSA

6 Matieu Henry et al.
0
0.2
0.4
0.6
0.8
1
1.2
0
100,000
200,000
300,000
400,000
500,000
600,000
1961 1966 1971 1976 1981 1986 1991 1996 2001 2006
Fuelwood (1,000 CUM)
Roundwood (1,000 CUM)
Fuelwood (CUM/capita)
Roundwood (CUM/capita)
20,000
30,000
40,000
50,000
60,000
70,000
80,000
90,000
100,000
110,000
120,000
1961 1971 1981 1991 2001
Population (10,000 hab)
Agriculture (1,000 tonnes)
Yield (kg/ha)
Area harvested (1,000 ha)
Forest Area (10,000 ha)
(b)
(a)
CU
M/C
apita
Vol
ume
(1,
000
CU
M)
Vol
ume
(1,
000
CU
M)
Figure 1. Evolution of agricultural, timber and roundwood production in SSA: (a)represents the evolution of fuelwood and roundwood production; (b) represents theevolution of cereal production, population and forest losses.Note: CUM, cubic meters.Source: The data were obtained from FAOSAT.

Environment and Development Economics 7
(Ninnin, 1994). However, it remains difficult to assess the impacts of thisactivity, as it is largely informal and difficult to monitor.
2.3 AgricultureWith a population that is mainly rural (62 per cent of the total population)(UNFPA, 2007), agriculture represents the main source of income in SSA.Approximately 70 per cent of the population works in the agriculturalsector, of whom about half live on less than $1 per day (World Bank, 2008).As shown in figure 1b and data from FAOSTAT, agricultural productivityhas almost stagnated in the last decade, and is increasingly unable to meetthe demands of a growing population (Tiffen, 2003; Hazell and Diao, 2005;FAO, 2006c). Some of the factors limiting the productivity of agricultureinclude the degradation of soils and loss of fertility, diseases, climatechange, insufficient capital and inadequate policies.
It has been suggested that the slow development of the agriculturalsector in SSA can be explained by the poor competitiveness of the Africanmodel of agricultural development in the international marketplace,which has led to a strong dependency on foreign supply (Diao et al.,2010). Moreover, the underdeveloped transport systems and infrastructurehave significantly limited the capacity of developing national andregional markets for agricultural products, thereby allowing greatercompetitiveness for foreign products (Hazell and Diao, 2005). Morerecently, it has been observed that African agricultural policies have tendedto enhance comparative advantages for specific cash crops, at the expenseof subsistence agriculture on which most of the smallholders depend(Beintema and Stads, 2004).
Agricultural intensification, through the increase of yields, is acornerstone of both food security and land-use policies in SSA. The Foodand Agricultural Organisation of the United Nations (FAO) estimates thatthe population in SSA is expected to rise by 102 per cent until 2050(FAOSTAT). However, the current trend in cereal yield increase in SSAis only +0.14% yr−1 for cereals for the period 2000–2007. Without anincrease in yields, necessary increases in agricultural production in SSA arelikely to result from further land clearing or massive imports. Maintainingthe current SSA per capita domestic food production and consumptionrates, trade levels, market prices and agricultural mix without increasingSSA agricultural areas would require an additional intensification of theagricultural production per ha of +1.8% yr−1 until 2050, more than 10 timesthe current rate of increase in agricultural yields in SSA.
2.4 Underlying factors of forest degradation and deforestationSeveral indirect factors have been associated with the processes ofdeforestation and forest degradation in SSA. Generally speaking,the FAO (2003) mentions forest policy, persistent conflict and war,demography and population movement, low economic growth andpoverty, debt and dependence on development assistance, constraintsarising from globalization, predominance of the informal sector andinadequate investment as the main underlying drivers of deforestation anddegradation in the region.

8 Matieu Henry et al.
Arguably one of the most complex factors that has hindered effortsto ensure a more sustainable management of forest resources in SSA isthe issue of land tenure. In many instances, deforestation is motivatedvia attempts by people to secure their land rights through commercialexploitation. In many countries, the unclear (and often conflicting)relationship between traditional and administrative entities has made landtenure and property rights particularly complex issues to resolve (Cox et al.,2003). It has been shown in Ghana that the formalization of land tenure hasfacilitated the process of intensified agricultural production and enhancedproductivity (Kasanga, 1988; Goldstein and Udry, 2005).
More generally, inadequate implementation and compliance with forestand related policies has been a considerable hurdle to overcome inmany countries (Buba et al., 2010). The persistent presence of conflicts inmany parts of the continent has seriously compromised the capacity ofmany governments to adequately manage their natural resources. Weakgovernance makes the development prospects more difficult, especially interms of attracting foreign investments (Buba et al., 2010). As a result, mostcountries lack the means and the capacity required to implement the tasksneeded to ensure a sustainable management of their natural resources. Thisis one of the reasons that REDD+ was built on a three-phase approach:(1) readiness process, (2) results-based demonstration activities, and (3)results-based actions that should be fully measured, reported and verified(article 73 in the Cancun agreements).
The lack of institutional capacity is a particularly important constraintin the implementation of the reforms necessary to both meet people’sneeds and better manage the natural resources that are increasinglydegraded (UNEP, 2006). First, we note that most of the institutions lackthe financial, technical and human resources to enable the managementof their territory. Second, agricultural R&D is declining in half of theSSA countries (Beintema and Stads, 2004), putting at risk their ability toproduce the necessary information for the implementation of sustainableland management policies. In the following section we seek to analyzethe state of knowledge, the quantification of C stocks, C flows and thecontribution from deforestation and forest degradation.
3. The current sub-Saharan carbon budget
3.1 Carbon stocks in SSAForest C can be divided into aboveground and belowground C, the latterincluding the root component and the soil organic matter component.Most of the forest C stock in Africa is situated in the SSA region andmore precisely in the Congo Basin (figure 2). Estimates of average forestC density in SSA biomes range from 63 to 265 MgC ha−1 (Bombelli et al.,2009). Tropical rain forests reveal the highest C density (155, 57 and 52 MgCha−1 for, respectively, aboveground carbon (AGC), root carbon (RC) andsoil organic carbon (SOC), while minimum values are found in subtropicalmountain forests due to climatic and soil fertility constraints (25, 5 and 33MgC ha−1 for AGC, RC and SOC respectively).

Environment and Development Economics 9
Figure 2. Forest distribution in Africa based on GLOBCOVER
In an attempt to improve the aboveground C stock estimates for SSAwe used the Globcover map (Defourny et al., 2006) and the average Cdensity data used by the Intergovernmental Panel on Climate Change(IPCC, 2003) and the Carbon Dioxide Information Analysis Center (Gibbs,2006) (see figure A1 in online appendix available at http://journals.cambridge.org/EDE). Previous carbon stock assessment in SSA usedcoarser spatial resolution or did not consider the whole continent (Gibbset al., 2007; Baccini et al., 2008; Goetz et al., 2009). The assessment of forestarea was made based on the Globcover map and using a definition offorest with a tree cover above 15 per cent. The average C density datawere assigned to their respective land cover descriptors using ArcGis 3.2(ESRI, 2008). We estimated that aboveground forest C stocks for SSA were57,679 TgC (ranging from 9,967 to 105,391 TgC) (table 1) which is lower

10M
atieuH
enryetal.
Table 1. The impact of deforestation on forest carbon stocks in SSA
Forest carbon stocks (2005) Deforestation (2000–2005) LULUCF Total carbon flux
AreaGlobcover SOCa AGC
AnnualChange
AGC losses (+ gain, –loss) Emissions Removals Emissions
This study FRA This studyNational Communication
(UNFCCC)
(1000 ha) (TgC) (TgC) (%) (TgCo2 yr−1)
Country Average Range Average Range
Angola 68449 2194 5546 (1400 – 9693) −0.2 −41 −(10 – 71) – – –Botswana 2540 42 74 (30 – 119) −1 −3 −(1 – 4) −9 + 42 −14Comoros 89 8 10 (1 – 19) −7.4 −3 −(0.4 – 5) – – –Kenya 14580 553 509 (108 – 910) −0.3 −6 −(1 – 10) – – –Lesotho 874 42 9 (6 – 12) 2.7 +0.89 +(0.6 – 1) −5 +3 −6Madagascar 22390 1058 1335 (266 – 2404) −0.3 −15 −(3 – 26) −454 +672 −456Malawi 3735 178 230 (66 – 394) −0.9 −8 −(2 – 13) −22 +1 −26Mozambique 45921 1604 2715 (865 – 4566) −0.3 −30 −(10 – 50) −31 +1 −43Namibia 2171 38 67 (30 – 104) −0.9 −2 −(1 – 3) −5 +6 −7South Africa 25414 631 648 (331 – 966) 0 0 0 −1 +0.01 −1Swaziland 1009 55 24 (13 – 36) 0.9 +0.81 +(0.4 – 1) −4 +6 −6Uganda 4528 174 339 (80 – 598) −2.2 −27 −(6 – 48) – – –United Republicof Tanzania 40817 2063 2206 (652 – 3760) −1.1 −89 −(26 – 152) −91 +4 −105Zambia 36938 2577 2423 (590 – 4256) −1 −91 −(25 – 156) – – –Zimbabwe 7377 190 197 (118 – 277) −1.7 −12 −(7 – 17) – – –Total Eastern and
SouthernAfrica
276831 11408 16335 (4557 – 28113) −0.7 −324 −(93 – 554) −623 +736 −665

Environmentand
Developm
entEconomics
11
Burkina Faso 2270 70 98 (40 – 155) −0.3 −1 −(0.44 – 2) −11 +7 −13Chad 12057 403 447 (215 – 679) −0.7 −11 −(5 – 17) −29 +67 −30Djibouti 18 0.27 0.41 (0 – 1) 0 0 0 −2 +2 −2Eritrea 1255 33 27 (9 – 45) −0.3 0 −(0.10 – 0.5) −4 +1 −9Ethiopia 26939 795 687 (187 – 1187) −1.1 −28 −(8 – 48) −58 +28 −68Mali 5468 188 220 (81 – 360) −0.8 −6 −(2 – 11) −38 +38 −39Niger 1618 33 59 (10 – 109) −1 −2 −(0.4 – 4) −8 +0 −9Somalia 12937 223 457 (68 – 846) −1 −17 −(3 – 31) – – –Sudan 45429 1553 2152 (725 – 3579) −0.8 −63 −(21 – 105) −83 +13 −93Total Northern
Africa107990 3297 4148 (1337 – 6960) −0.7 −129 −(40 – 218) −233 +156 −262
Benin 3564 123 204 (53 – 355) −2.5 −19 −(5 – 33) – – –Burundi 1311 81 15 (8 – 23) −5.2 −3 −(1 – 4) −1 +3 −2Cameroon 31127 1804 2996 (297 – 5696) −1 −110 −(11 – 209) −46 +6 −52Central AfricanRepublic
45627 1660 2965 (603 – 5326) −0.1 −11 −(2 – 20) – – –
Congo 22478 2879 2869 (185 – 5553) −0.1 −11 −(0.7 – 20) −14 +83 −15Côte d’Ivoire 15375 556 1192 (177 – 2207) 0.1 +4 +(0.7 – 8) −80 +96 −104D.R. of the Congo 168169 8402 19211 (1854 – 36569) −0.2 −141 −(14 – 268) −468 +598 −480EquatorialGuinea
2298 150 294 (15 – 574) −0.9 −10 −(0.5 – 19) – – –
Gabon 21185 1086 2757 (143 – 5372) 0 0 0 −3 +504 −9Gambia 192 8 19 (5 – 32) 0.4 +0.27 +(0.1 – 0.5) −32 +81 −36Ghana 9464 340 708 (141 – 1275) −2 −52 −(10 – 94) −12 +26 −20Guinea 12308 559 874 (169 – 1579) −0.5 −16 −(3 – 29) −88 +102 −100Guinea-Bissau 1753 76 167 (30 – 305) −0.5 −3 −(0.6 – 6) – – –Liberia 5702 315 745 (39 – 1451) −1.8 −49 −(3 – 96) – – –Nigeria 21048 822 1623 (244 – 3003) −3.3 −196 − (30 – 363) −173 +37 −331Rwanda 888 62 4 (2 – 5) 6.9 +0.89 −(0.5 + 1) −1 +8 −10Sao Tome and
Principe73 5 10 (1 – 19) 0 0 0 – – –

12M
atieuH
enryetal.
Table 1. Continued
Forest carbon stocks (2005) Deforestation (2000–2005) LULUCF Total carbon flux
AreaGlobcover SOCa AGC
AnnualChange
AGC losses (+ gain, –loss) Emissions Removals Emissions
This study FRA This studyNational Communication
(UNFCCC)
(1000 ha) (TgC) (TgC) (%) (TgCo2 yr−1)
Country Average Range Average Range
Senegal 3291 115 135 (46 – 225) −0.5 −2 −(0.8 – 4) −23 +26 −30Sierra Leone 3047 150 299 (33 – 565) −0.7 −8 −(0.8 – 15) – – –Togo 1805 63 108 (27 – 188) −4.5 −18 −(4 – 31) −24 +0 −26Total Congo
basin290885 15981 31093 (3096 – 59089) −0.46 −282 −(28 – 536) −532 +1191 −556
Total Westernand CentralAfrica
370706 19257 37196 (4074 – 70318) −0.5 −643 −(84 –1201) −967 +1568 −1215
Total Africa 755527 33962 57679 (9967 – 105391) −0.62 −1095 −(217 –1973)
−1823 +2461 −2142
Notes: Estimation of the C emissions from LULUCF, total emissions, removals and the net emissions is based on the UNFCCC nationalcommunication to the UNFCCC. The data for Sao Tome and Principe, Uganda, Sierra Leone, Guinea-Bissau and Comoros were nottaken into account because the data were considered not reliable. In total, nine countries submitted a forest definition to the UNFCCC,except for Gambia 1993, Sierra Leone 1990, Togo 1995 and Burundi 1998. The minimum and maximum AGC were calculated usingthe minimum and maximum forest cover and carbon stocks in each of the land cover classes. The average was calculated assuming anormal distribution of AGC.aFrom Henry et al. (2009).

Environment and Development Economics 13
0
5
10
15
20
25
30C
arbo
n de
nsity
(kg
.m-2
)
Figure 3. Average densities for AGC and SOC in SSA countries. AGC was obtainedusing the IPCC and CDIAC carbon stock data and the GLOBCOVER land coverproduct. SOC was based on the data reported by Henry et al. (2009)
than the 59,514 TgC estimated by FAO (2007). In addition, the FAO datadid not consider 12 SSA countries and each country reported the datausing different methodologies, thereby limiting data comparability. Theimportant variations of AGC are related to the variation of forest coverwithin each class of land cover and the variability for the associated AGCamount for each of the land cover classes. For example, the AGC in tropicalrainforest ranges from 65 to 255 MgC, forest cover in forest land coverranges from 40 to 100 per cent and AGC in forest land cover class rangesfrom 42 to 255 MgC ha−1.
Using the Harmonized World Soil Database (FAO/IIASA/ISRIC/ISSCAS/JRC, 2008), the ISRIC soil properties database, the Globcover mapand the methodology described in Henry et al. (2009), it was possible toestimate the SOC in the 0–30 cm soil layer in forest ecosystems. We foundthat the soil compartment of the forests contains 33,962 TgC (table 1).Unfortunately, it was not possible to estimate the variability of the soilC content as only one value of C content per soil type was reported inthe original database. Furthermore, 63 per cent of the C stock in forestecosystems is contained in the aboveground component, while the rest iscontained as SOC in the 0–30 cm soil layer. It is important to note thatthis estimate does not consider the litter, the root and the soil below 30cm depth. However, carbon in aboveground biomass and in topsoils (0–30cm) are the most affected by deforestation and forest degradation (Bombelliet al., 2009, Henry et al., 2009).
Unsurprisingly, C density in forests varies considerably betweencountries (table 1; figure 3), and also within countries. We find that theDemocratic Republic of Congo (DRC) has the highest C density both in
14 Matieu Henry et al.
AGC and SOC (128 and 128 MgC ha−1 respectively). However, estimatesfound in the literature for a given country can vary significantly, pointing tothe importance of uncertainties. The uncertainty is close to 100 per cent forthe case of DRC: our AGC estimate is 19,211 TgC AGC, while FAO (2006b)reported 18,688 TgC, Baccini et al. (2008) 17,350 TgC, Gibbs et al. (2007)20,400–36,672 TgC, Nasi et al. (2009) 27,258 TgC and Gaston et al. (1998)16,316 TgC. Existing uncertainties in present land carbon stocks estimateswill have to be taken into account in the challenge of quantification underREDD+, and highlight the need for a harmonized set of assessment andmeasurement techniques (see section 4).
3.2 DeforestationThe impact of deforestation on C stocks can be broadly calculated based onthe C stock change and the forest land area converted to other land uses.When considering the C stock change, the conversion of forests to otherland-use types involves significant changes in C stocks, in AGC, RC andSOC. Regarding SOC, for example, the conversion of forest or woodlandsto farmland in the tropics reduces the SOC content by about 20–50 per centof the original C in the topsoil at equilibrium (Henry et al., 2009). Accordingto Bombelli et al. (2009), in the humid tropical ecosystems of Cameroon, thelowest SOC was observed in cropland (44 MgC ha−1), while primary forestsSOC density is as high as 50 MgC ha−1 (for open forests) to 100 MgC ha−1
(for undisturbed forests).When using the forest definition provided by Globcover, the C
stock calculation presented above (see figure A1), and national rate ofdeforestation from the 2005 Forest Resource Assessment of the FAO(2006b), it appeared that 1,095 (227–2,028) TgCO2 year−1 were lost fromdeforestation (table 1). Moreover, 59 per cent of the CO2 losses fromdeforestation were found in western and central Africa, with the CongoBasin representing 279 (216–1,973) TgCO2 and 26 per cent of the CO2losses from deforestation in SSA. These estimates were lower than thosereported by Houghton and Hackler (2006), of 946 TgCO2 yr−1, whichwere based on the total forest area in SSA in 2000. If we extrapolatefor the total forest area of SSA (756 Mha), our estimate is 1,104 TgCO2yr−1, which is 158 TgCO2 yr−1 higher than Houghton and Hackler’sestimate. The discrepancies mainly arise from different C density datarather than estimates of deforestation since the rate is supposed to decreasebetween the periods 1990–2000 and 2000–2005. However, since the FAOestimate is based on the national communications, discrepancies can alsobe observed on the rate of deforestation. The use of remote sensing presentsthe advantages of providing consistent data over time and being a moreappropriate tool for forest monitoring (DeFries et al., 2005; Achard et al.,2007).
3.3 Selective logging and forest degradationSo far, few studies have attempted to estimate the impact of forestdegradation in SSA both in terms of degraded forest land area anddegraded C stock losses. Here we differentiate selective logging and forest
Environment and Development Economics 15
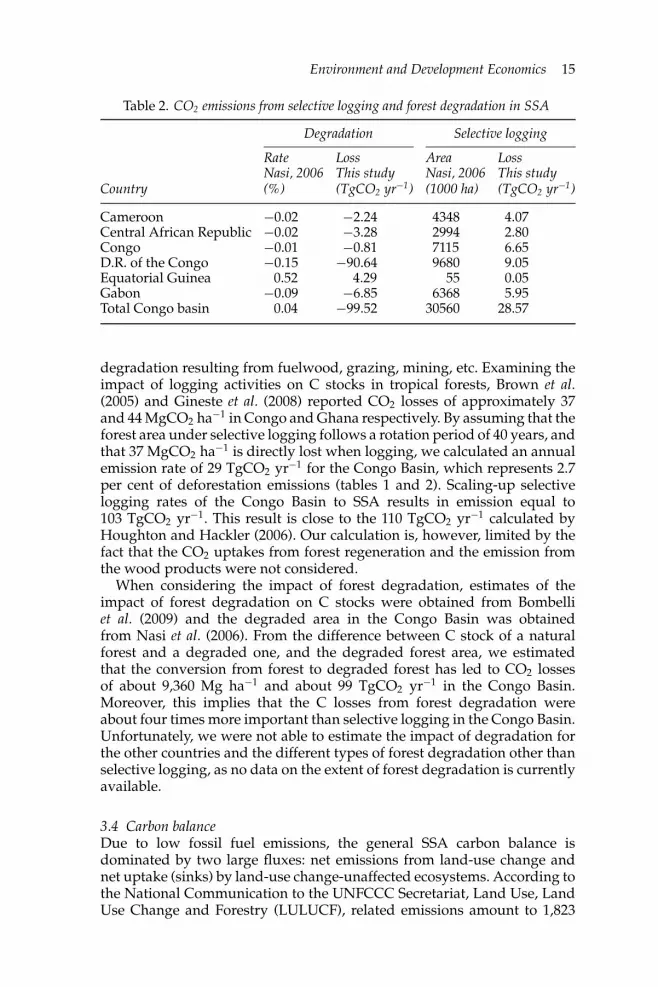
Table 2. CO2 emissions from selective logging and forest degradation in SSA
Degradation Selective logging
Rate Loss Area LossNasi, 2006 This study Nasi, 2006 This study
Country (%) (TgCO2 yr−1) (1000 ha) (TgCO2 yr−1)
Cameroon −0.02 −2.24 4348 4.07Central African Republic −0.02 −3.28 2994 2.80Congo −0.01 −0.81 7115 6.65D.R. of the Congo −0.15 −90.64 9680 9.05Equatorial Guinea 0.52 4.29 55 0.05Gabon −0.09 −6.85 6368 5.95Total Congo basin 0.04 −99.52 30560 28.57
degradation resulting from fuelwood, grazing, mining, etc. Examining theimpact of logging activities on C stocks in tropical forests, Brown et al.(2005) and Gineste et al. (2008) reported CO2 losses of approximately 37and 44 MgCO2 ha−1 in Congo and Ghana respectively. By assuming that theforest area under selective logging follows a rotation period of 40 years, andthat 37 MgCO2 ha−1 is directly lost when logging, we calculated an annualemission rate of 29 TgCO2 yr−1 for the Congo Basin, which represents 2.7per cent of deforestation emissions (tables 1 and 2). Scaling-up selectivelogging rates of the Congo Basin to SSA results in emission equal to103 TgCO2 yr−1. This result is close to the 110 TgCO2 yr−1 calculated byHoughton and Hackler (2006). Our calculation is, however, limited by thefact that the CO2 uptakes from forest regeneration and the emission fromthe wood products were not considered.
When considering the impact of forest degradation, estimates of theimpact of forest degradation on C stocks were obtained from Bombelliet al. (2009) and the degraded area in the Congo Basin was obtainedfrom Nasi et al. (2006). From the difference between C stock of a naturalforest and a degraded one, and the degraded forest area, we estimatedthat the conversion from forest to degraded forest has led to CO2 lossesof about 9,360 Mg ha−1 and about 99 TgCO2 yr−1 in the Congo Basin.Moreover, this implies that the C losses from forest degradation wereabout four times more important than selective logging in the Congo Basin.Unfortunately, we were not able to estimate the impact of degradation forthe other countries and the different types of forest degradation other thanselective logging, as no data on the extent of forest degradation is currentlyavailable.
3.4 Carbon balanceDue to low fossil fuel emissions, the general SSA carbon balance isdominated by two large fluxes: net emissions from land-use change andnet uptake (sinks) by land-use change-unaffected ecosystems. According tothe National Communication to the UNFCCC Secretariat, Land Use, LandUse Change and Forestry (LULUCF), related emissions amount to 1,823

16 Matieu Henry et al.
TgCO2 yr−1 and LULUCF removals amount to 2,461 TgCO2 yr−1 (table 1).Combining fossil fuel emissions and land-based emissions and removals,SSA is currently a net sink of 319 TgCO2 yr−1. It appears that AGC lossfrom deforestation represents 60 and 51 per cent of the LULUCF and totalemissions in SSA respectively. In some countries such as Madagascar andthe DRC the AGC contribution is much lower. This is mainly explainedby the fact that the contribution to the LULUCF emissions from thesoil compartment is about 70 and 50 per cent respectively for the twocountries. Additional contributions come from the conversion of grasslandand biomass burning. The DRC represents 31 per cent of the LULUCFemissions of SSA, Madagascar the highest removal with 27 per cent of SSA,and Gabon the highest net emissions with 495 TgCO2 yr−1. It should benoted that the data for 14 countries1 (representing 27 per cent of the area, 18per cent of the population, 25 per cent of the total C stocks and 27 per centof CO2 emissions from deforestation (table 1)) were not included in thiscalculation as the data were not communicated to the UNFCCC or werenot considered reliable.
3.5 Uncertainties of C balance assessmentThe uncertainties associated with the current knowledge of the SSAecosystems carbon balance are rather high, as shown by the differentestimates (section 3.1). Our understanding and knowledge of the C cyclein SSA and its global scale is limited by the integration of spatio-temporaldata. Important variability of AGC (10–105 PgC) and AGC losses fromdeforestation (0.2–2 PgCO2 yr−1) results from the combination of severalfactors. Most important are the variation of C in one vegetation form,forest cover in one land cover class, and deforestation rate estimates.The current land cover descriptors are different from those used duringfield measurements. Developing a common classification system suchas the SOTER soil classification (FAO, 1995) would make a meaningfulcontribution to improving the classification of vegetation forms. Presently,the ecological classification used in this study may not represent theAGC variability found in the different vegetation forms. This induces animportant variability within each of the ecological zones. While developingecological zones that are more representative to the AGC will decreasethe AGC variability, applying complex and numerous vegetation classesis limited by the number of available ground C data.
Additionally, several methodological choices such as the diameterthreshold, the allometric model, the carbon pool, the stratification, the plotsize and the sampling strategy influence the consistency and comparabilityof the results. The uncertainties associated with the current knowledgeof the SSA ecosystems carbon balance are rather high as shown bythe different estimates (section 3.1). Ciais et al. (2011) showed that theuncertainties are particularly high for ecosystems such as savannas and
1 Angola, Benin, Central African Republic, Comoros, Equatorial Guinea, Sao Tomeand Principe, Guinea Bissau, Kenya, Liberia, Sierra Leone, Somalia, Uganda,Zambia and Zimbabwe.

Environment and Development Economics 17
Table 3. Mitigation activities potentially included under REDD
Type of forest change Reduced (negative) change Enhanced (positive) change
Forest change (includedas LULUCF)
Reduced deforestation Enhancement of forestcarbon stocks
Forest remaining asforest
Reduced forestdegradation
Enhancement of forestcarbon stocks, forestconservation,sustainablemanagement of forests
tropical African forests; and vegetation dynamics such as deforestation,forest degradation and the impact of fires.
The implementation of actions to reduce GHG emissions fromdeforestation and forest degradation in the framework of the REDD+mechanism requires the quantification of emission reductions andremovals. This in turn raises the crucial issue of available methods toestimate C stocks and stock changes, and their adaptation to the SSAcontext. The development of national forest monitoring systems willfacilitate the development of methods to measure C and improve thequality of the data. The next section will discuss the different technical andmethodological issues related to the quantification of emission reductionsunder REDD+ in SSA.
4. Quantification of emission reduction and removals through theREDD+ mechanism in SSASeveral issues have to be successively solved when implementing an MRVsystem, such as: (1) the definition of forest and degraded forest; (2) themonitoring of forest activities; (3) the estimation of forest area and areachanges (activity data (AD)); (4) the estimation of C stocks and theirchanges (emission factors (EF)); and (5) the estimation of the net balancefrom emissions and/or removals by sinks on the forest land (through aGHG inventory). Each of these points will be briefly discussed.
4.1 REDD+ and the IPCC guidance and guidelinesThe IPCC provides guidelines and guidance that form the basis for howcountries can estimate and monitor emissions and removals from REDD+activities (IPCC, 2003, 2006). Based on the principles of consistency,transparency, comparability, completeness and accuracy, the guidelinesallow the countries to establish national systems for GHG reporting underthe UNFCCC that are comparable between Parties. For REDD+, the use ofthe IPCC guidance and guidelines by developing countries is requested inDecision 4/CP.15.
The result of human-induced activities on land-use change can fall intothree categories in the IPCC good practices guidance for LULUCF: (i) forestland converted to other land, (ii) forest land remaining forest land, and (iii)other land converted to forest land (table 3).

18 Matieu Henry et al.
4.2 Defining forest and degraded forestForest types differ widely, determined by factors including latitude,temperature, rainfall patterns, soil composition and human activity. Astudy of the various definitions of forests (FAO, 2006a) found that morethan 800 different definitions for forests were in use in the world. Differentdefinitions are required for different purposes and at different scales. Inthe context of REDD+, the responsibility of defining forest and degradedforest will be held by the countries and the definitions will be submitted tothe UNFCCC Secretariat. It is probable that the REDD+ activities will haveto be defined, too. However, there is no clear frontier to categorize forestdegradation and deforestation. It is important to note that, for the moment,only nine countries in SSA2 have communicated a definition for ‘forest’under the UNFCCC. Another issue for SSA is that forest ‘degradation’ isa more widespread and important phenomenon than ‘deforestation’ andthat there is currently no agreed definition for it under the UNFCCC.
4.3 Measuring activity dataAssessing AD consists of providing spatially explicit forest changestowards other land uses and management types of forest area and viceversa. In order to obtain such data, the use of remote sensing was identifiedas the most reliable way to produce data to allow reporting based onthe IPCC requirements. Several methods and technologies can be used toidentify forest changes. Different types of sensors can be used, such asoptical, radar and laser/Lidar (see table A1 in online appendix). Accordingto GOFC-GOLD (2009) and Achard et al. (2007), it is possible to detectdeforestation with confidence from the 1990s using medium-resolutionoptical images such as Landsat. However, the use of Landsat imageries iscurrently limited because of the low time frequency and the difficulty ofobtaining cloud-free images. If cloud cover is a limiting factor, cloud-freesatellite images with higher time frequency such as AVHRR, MODIS andSPOT-VGT, and radar sensors such as ALOS-PALSAR can be used. Whilethe two options are cost effective, it appears that coarse images may notbe adapted for direct estimation at a national level and the use of radarsensors for this purpose is still in its infancy in tropical forests.
When identifying the various forms of forest degradation in SSA, mostof the current attempts to monitor forest cover change with remote sensingfocused on selective logging (Laporte et al., 2007) and forest fires (Royand Boschetti, 2009), and other forms of forest degradation have beenconsidered as almost undetectable (Peres et al., 2006). It appears that it ischallenging to identify forest degradation with mid- and coarse-resolutionimagery (Imbernon, 2004; Souza et al., 2005). The use of fine-resolutionimages such as IKONOS and Quickbird could be an alternative, but maynot satisfy operational national forest monitoring systems for REDD+ dueto their low temporal resolution, their relatively small-area coverage andtheir cost (see table A1). However, they can still be used for the verificationof forest maps from coarse- to mid-resolution imagery (Fuller, 2006). Lidar
2 Kenya, Madagascar, South Africa, Uganda, Ethiopia, Mali, Niger, DRC andGhana.

Environment and Development Economics 19
technology is a promising method because it provides information on theforest structure in three dimensions. However, it has to be used with highspatial resolution imagery (Hilker et al., 2008), is particularly expensive,and provides only one estimate in time. Nonetheless, the need for asynergetic and complementary use of approaches is necessary to monitorthe dynamics of forests in SSA.
4.4 Measuring emission factorsThe emission factors are derived from assessments of the changes in Cstocks in the various C pools of a forest. The IPCC recognizes five forestpools where C is stored: aboveground biomass, belowground biomass,litter, dead wood and SOC. The estimation of tree biomass is mostly basedon the use of allometric equations, which adds complexity to the relationbetween dendrometric parameters that are directly measurable during thefield inventories and the biomass that is not directly measureable. Whileseveral biomass allometric equation databases were developed for Europe(Zianis et al., 2005) and for South America (Návar, 2009), no inventory dataexists for SSA.
Most of the available and accessible data for SSA are volume estimatesfrom national forest inventories. However, conversion of volume tobiomass is limited by the availability of conversion factors and wooddensity data (Henry et al., 2010). Assessing C in the other C pools (deadbiomass, belowground biomass, litter and SOC) is even more difficult. Forexample, the impact of the conversion of forest to other land use on the SOCis little known. While conversion of forests to pasture or selectively loggedforest is not believed to significantly change SOC (Guo and Gifford, 2002)and may actually increase the soil organic matter content (Sombroek et al.,1993), shifting cultivation results in a reduction of soil C by half (Detwiler,1986). To our knowledge, no study reported estimates of the impact offorest degradation on SOC.
When analysing the national communication for the Forest ResourceAssessment of the FAO, it appeared that only seven SSA countries usespecific national data. Even the default values proposed by the IPCC do notcover all the ecological zones (e.g. subtropical humid forests). Moreover,there is an important need to support scientific research to improve themethods and the coefficients used to estimate C stocks.
5. ConclusionDeforestation and forest degradation already represent an important partof worldwide CO2 emissions (20 per cent, of which 25–35 per cent arein SSA), and therefore reducing the loss of forest C stocks is likely torepresent an essential part of any worldwide atmospheric CO2 stabilizationpolicy. Within the international negotiations on climate change, growingconsideration has been given to issues of land-use change and incentives toreduce deforestation, forest degradation, and the conservation of existingforests, especially in developing countries. The adoption of REDD+ asa mitigation action under the UNFCCC is a promising step towardsthese goals. To be appropriately designed, implemented and effective,it will, however, require: (1) a close understanding of the underlying

20 Matieu Henry et al.
drivers of land-use change; (2) an accurate knowledge of past andpresent forest state, related C stocks and their changes; and (3) theexistence of robust, accurate, locally adapted national systems to allow forsuitable monitoring. It will also need solid institutional, legal and controlframeworks at national and local levels. Since REDD+ is a results-basedincentive scheme, it cannot exist without measured, reported and verifiedemission reductions (Cancun agreements, article 73). This highlights theparamount need for national forest and forest carbon monitoring systems,with important technical, institutional and financial difficulties to be solvedregarding the production, availability, accuracy, comparability, consistencyand transparency of forest C data, EF and AD.
The effectiveness of REDD+ will also require creating incentives outsidethe forest frontier. To feed the world population, any attempt to limit forestloss is likely to be successful only if accompanied by policies aiming atthe intensification of agricultural production. Agricultural intensificationat the global scale had an important mitigation effect in the past, byproviding greater yields per ha and avoiding substantial land-use changesthat would have occurred without the increases in yields obtained since1960 (Burney et al., 2010). Reducing emission from deforestation needs tohappen simultaneously with efforts to increase yields in non-forested landsto satisfy demands for agricultural products (DeFries et al., 2010). To date,considerations relating to agricultural policies remain marginal to ongoingREDD+ discussions. However, domestic agricultural intensification has apotentially central role in a domestic REDD+ policy because it allows fordecreasing the pressure on national forest resources. It will also have animpact in terms of reduced forest loss elsewhere, through a reduction ofthe need to import agricultural products.
ReferencesAchard, F., R. DeFries, H. Eva, M. Hansen, P. Mayaux, and H.-J. Stibig (2007), ‘
Pan-tropical monitoring of deforestation’, Environmental Research Letters 2: 1–13.Aina, O.M., A.C. Adetogun, M.O. Adedokun, and M.A. Onilude (2005), ‘Alternative
cooking fuels from sawmill wastes’, paper presented at the Farm ManagementAssociation of Nigeria Conference, 18–20 October, Asaba, Nigeria.
Angelsen, A. and D. Kaimowitz (1999), ‘Rethinking the causes of deforestation:lessons from economic models’, The World Bank Research Observer 14: 73–98.
Arnold, J.E.M., G. Köhlin, and R. Persson (2006), ‘Woodfuels, livelihoods, and policyinterventions: changing perspectives’, World Development 34: 596–611.
Baccini, A., N. Laporte, S.J. Goetz, M. Sun, and H. Dong (2008), ‘A first mapof tropical Africa’s above-ground biomass derived from satellite imagery’,Environment Research Letters 3: 045011.
Beintema, N.M. and G.-J. Stads (2004), ‘Sub-Saharan African agricultural research:recent investment trends’, Outlook on Agriculture 33: 239–246.
Birikorang, G., R. Okai, K. Asenso-Okyere, S. Afrane, and G. Robinson (2001),‘Ghana wood industry and log export ban study’, Forestry Commission Reportto the Ministry of Lands and Forestry, Forestry Commission, Accra, Ghana.
Bombelli, A., M. Henry, S. Castaldi, S. Adu-Bredu, A. Arneth, A. de Grandcourt, E.Grieco, W.L. Kutsch, V. Lehsten, A. Rasile, M. Reichstein, K. Tansey, U. Weber,and R. Valentini (2009), ‘An outlook on the Sub-Saharan Africa carbon balance’,Biogeosciences 6: 2193–2205.

Environment and Development Economics 21
Brown, S., T. Pearson, N. Moore, A. Parveen, S. Ambagis, and D. Shoch (2005),‘Impact of selective logging on the carbon stocks of tropical forests: Republicof Congo as a case study’, Report submitted to the United States Agency forInternational Development, Winrock International, Arlington, VA.
Buba, J., A. Karsenty, and N. Bassaler (2010), ‘La lutte contre la déforestation dansles “États fragiles”: une vision renouvelée de l’aide au développement’, La Notede Veille 180: 1–12 [in French].
Burney, J.A., S.J. Davis, and D.B. Lobell (2010), ‘Greenhouse gas mitigation byagricultural intensification’, PNAS 107(26): 12052–12057.
Canadell, J.G., M.R. Raupach, and R.A. Houghton (2009), ‘Anthropogenic CO2emissions in Africa’, Biogeosciences 6: 463–468.
Ciais, P., A. Bombelli, M. Williams, S.L. Piao, J. Chave, C.M. Ryan, M. Henry,P. Brender, and R. Valentini (2011), ‘The carbon balance of Africa: synthesis ofrecent research studies’, Philosophical Transactions of the Royal Society A 369: 1–20.
Cox, M., P. Munro-Faure, J. Dey-Abbas, J. Rouse, and S. Baas (2003), ‘Land reform,land settlement and cooperatives’, Food and Agriculture Organization of theUnited Nations, Rome.
de Wasseige, C., D. Devers, P. de Marcken, R. Eba’a Atyi, R. Nasi, and P. Mayaux(2009), The Forests of the Congo Basin – State of the Forest 2008, Luxembourg:Publications Office of the European Union.
Defourny, P., C. Vancutsem, P. Bicheron, C. Brockmann, F. Nino, and M.L.L.Schouten (2006), ‘Globcover: a 300 m global land cover product for 2005 usingEnvisat Meris time series’, Proceedings of ISPRS Commission VII Symposium: RemoteSensing from Pixels to Processes, Enschede, The Netherlands, pp. 8–11.
DeFries, R.S., G. Asner, F. Achard, C. Justice, N. Laporte, K. Price, C. Small, andJ. Townshend (2005), ‘Monitoring tropical deforestation from emerging carbonmarkets’, in P. Moutinho and S. Schartzman (eds), Remote Sensing Analysis ofTropical Deforestation and Baselines for Carbon Crediting and Biodiversity, Belém,Brazil: Instituto de Pesquisa Ambiental da Amazônia, pp. 35–44.
DeFries, R.S., T.K. Rudel, M. Uriarte, and M. Hansen (2010), ‘Deforestation drivenby urban population growth and agricultural trade in the twenty-first century’,Nature Geoscience 3: 178–181.
Detwiler, R.P. (1986), ‘Land use change and the global carbon cycle: the role oftropical soils’, Biogeochemistry 2: 67–93.
Diao, X., P. Hazell, and J. Thurlow (2010), ‘The role of agriculture in Africandevelopment’, World Development 38: 1375–1383.
ESRI (2008), ArcGIS Desktop 9.3 Service Pack, Redland, CA: ESRI.FAO (1995) ‘Global and national soils and terrain digital databases (SOTER)’, World
Soil Resources Reports 74, Rev. 1, Food and Agriculture Organization of theUnited Nations, Rome.
FAO (2003), ‘The state of food and agriculture in Africa’, Special Report preparedfor the Conference of Ministers of Agriculture of the African Union, 1–2 July 2003,Maputo, Mozambique.
FAO (2006a), ‘Choosing a forest definition for the Clean Development Mechanism’,Forest and Climate Change Working Paper No. 4, Food and AgricultureOrganisation of the United Nations, Rome.
FAO (2006b), Global Forest Resources Assessment 2005, Food and AgricultureOrganization of the United Nations, Rome.
FAO (2006c), ‘Prospects for food, nutrition, agriculture and major commoditygroups, world agriculture: towards 2030/2050’, Interim Report, Global Perspect-ive Studies Unit, Food and Agriculture Organization of the United Nations,Rome.
FAO (2007), State of the World’s Forests, Food and Agriculture Organization of theUnited Nations, Rome.

22 Matieu Henry et al.
FAO/IIASA/ISRIC/ISSCAS/JRC (2008), ‘Harmonized world soil database (version1.0)’, Food and Agriculture Organization of the United Nations, Rome andInternational Institute for Applied Systems Analysis, Laxenburg, Austria.
Fuller, D.O. (2006), ‘Tropical forest monitoring and remote sensing: a new era oftransparency in forest governance?’ Singapore Journal of Tropical Geography 27(1):15–29.
Gaston, G., S. Brown, L. Massimiliano, and K.D. Singh (1998), ‘State and change incarbon pools in the forests of tropical Africa’, Global Change Biology 4: 97–114.
Geist, H.J. and E.F. Lambin (2001), ‘What drives tropical deforestation?’, LUCCReport Series No. 4, University of Louvain, Louvain-la-Neuve.
Gibbs, H.K. (2006), ‘Olson’s major world ecosystem complexes ranked by carbonin live vegetation: an updated database using the GLC2000 land cover product’,Carbon Dioxide Information Center, Oak Ridge National Laboratory, Oak Ridge,TN.
Gibbs, H.K., S. Brown, J.O. Niles, and J.A. Foley (2007), ‘Monitoring and estimatingtropical forest carbon stocks: making REDD a reality’, Environmental ResearchLetters 2: 045023.
Gineste, M., S. Martel, M. Henry, S. Adu-Bredu, and L. Saint-André (2008),‘Estimating the impact of selective logging on aboveground carbon stocks inBoi Tano Forest Reserve’, Proceedings of the Carboafrica Annual Meeting, 25–27November, Accra, Ghana.
Gitz, V. (2004), ‘Changement d’usage des terres et politiques climatiques globales’,Ph.D. thesis, AgroParisTech/ENGREF, Paris [in French].
Goetz, S.J., A. Baccini, N.T. Laporte, T. Johns, W. Walker, J. Kellndorfer, R.A.Houghton, and M. Sun. (2009), ‘Mapping and monitoring carbon stocks withsatellite observations: a comparison of methods’, Carbon Balance and Management4: 1–7.
GOFC-GOLD (2009), ‘Reducing greenhouse gas emissions from deforestation anddegradation in developing countries: a sourcebook of methods and proceduresfor monitoring, measuring and reporting’, GOFC-GOLD Report version COP14–2, GOFC-GOLD Project Office, Natural Resources Canada, Alberta.
Goldstein, M. and C. Udry (2005), ‘The profits of power: land rights and agriculturalinvestment in Ghana’, Working Paper 929, Economic Growth Center, YaleUniversity, New Haven, CT.
Guo, L. and R.M. Gifford (2002), ‘Soil carbon stocks and land use change: a meta-analysis’, Global Change Biology 8: 345–360.
Hazell, P. and X. Diao (2005), ‘The role of agriculture and small farmers in economicdevelopment’, paper presented at the Future of Small Farms Workshop, 26–29June, Wye College, UK.
Henry, M., R. Valentini, and M. Bernoux (2009), ‘Soil carbon stocks in ecoregions ofAfrica’, Biogeosciences for Discussions 6: 797–823.
Henry, M., A. Besnard, W.A. Asante, J. Eshun, S. Adu-Bredu, R. Valentini, M.Bernoux, and L. Saint-André (2010), ‘Wood density, phytomass variations withinand among trees, and allometric equations in a tropical rainforest of Africa’, ForestEcology and Management 260: 1375–1388.
Hilker, T., M.A. Wulder, and N.C. Coops (2008), ‘Update of forest inventory datawith lidar and high spatial resolution satellite imagery’, Canadian Journal of RemoteSensing 34: 5–12.
Houghton, R.A. and J.L. Hackler (2006), ‘Emissions of carbon from land use changein sub-Saharan Africa’, Journal of Geophysical Research 111: G02003.
Imbernon, J. (2004), ‘A spatial approach to deforestation phenomena, what remotesensing can contribute’, in D. Babin (ed.), Beyond Tropical Deforestation, Paris:UNESCO, CIRAD, pp. 13–22.

Environment and Development Economics 23
IPCC (2003), Good Practice Guidance for Land Use, Land-Use Changeand Forestry, Institute for Global Environmental Strategies for theIntergovernmental Panel on Climate Change, [Available at] http://www.ipcc-nggip.iges.or.jp/public/gpglulucf.htm.
IPCC (2006), 2006 IPCC Guidelines for National Greenhouse Gas Inventories, Hayama,Japan: Institute for Global Environmental Strategies.
ITTO (2008), Annual Review and Assessment of the World Timber Situation, Yokohama,Japan: International Tropical Timber Organization.
Kalu, C. and W.W. Modugu (2010), ‘Econometric analysis of managementapproaches of West African natural forests’, Research Journal of Social Sciences 5:7–11.
Kasanga, R.K. (1988), ‘Land tenure and the development dialogue, the mythconcerning communal landholding in Ghana’, Occasional Paper No. 19,Department of Land Economy, University of Cambridge, Cambridge.
Kituyi, E., S.O. Wandiga, M.O. Andreae, and G.B. Helas (2005), ‘Biomass burning inAfrica: role in atmospheric change and opportunities for emission mitigation’,in P. Sum Low (ed.), Climate Change and Africa, Cambridge University Press,Cambridge, pp. 79–89.
Laporte, N., F. Merry, A. Baccini, S. Goetz, J. Stabach, and M. Bowman (2007),‘Reducing CO2 emissions from deforestation and degradation in the democraticrepublic of Congo: a first look’, Report prepared by the Woods Hole ResearchCenter, Falmouth, MA.
Le Quéré, C., M.R. Raupach, J.G. Canadell, et al. (2009), ‘Trends in the sources andsinks of carbon dioxide’, Nature Geoscience 2: 831–836.
Lebedys, A. (2008), ‘Contribution of the forestry sector to national economies, 1990–2006’, Forest Finance Working Paper FSFM/ACC/08, FAO, Rome.
Malhi, Y. and J. Wright (2005), ‘Late twentieth-century patterns and trends in theclimate of tropical forest regions’, in Y. Malhi and O. Philips (eds), Tropical Forestsand Global Atmospheric Change, Oxford: Oxford University Press, pp. 3–16.
Nasi, R., B. Cassagne, and A. Billand (2006), ‘Forest management in Central Africa:where are we?’ International Forestry Review 8: 14–20.
Nasi, R., P. Mayaux, D. Devers, N. Bayol, R. Eba’a Atyi, A. Mugnier, B. Cassagne,A. Billand, and D. Sonwa (2009), ‘A first look at carbon stocks and their variationin Congo Basin forests’, in C. de Wasseige, D. Devers, P. de Marcken, R. Eba’aAtyi, R. Nasi and P. Mayaux (eds), The Forests of the Congo Basin: State of the Forest,Luxembourg: Publications Office of the European Union, pp. 191–208.
Návar, J. (2009), ‘Biomass component equations for Latin American species andgroups of species’, Annual of Forest Sciences 66: 208–216.
Ninnin, B. (1994), ‘Eléments d’économie spatiale des énergies traditionnelles:application au cas de cinq pays Sahéliens: Burkina Faso, Gambie, Mali, Niger,Sénégal’, Programme Régional pour le Secteur des Energies Traditionelles(RPTES), Africa Region, World Bank, Washington, DC [in French].
Parker, C., A. Mitchell, M. Trivedi, and N. Mardas (2008), Little REDD Book: AGuide to Governmental and Non-Governmental Proposals for Reducing Emissions fromDeforestation and Degradation, Oxford: Global Canopy Foundation.
Peres, C.A., J. Barlow, and W.F. Laurance (2006), ‘Detecting anthropogenicdisturbance in tropical forests’, TRENDS in Ecology and Evolution 21: 227–229.
Roy, D.P. and L. Boschetti (2009), ‘Southern Africa Validation of the MODIS, L3JRCand GlobCarbon Burned-Area Products’, IEEE Transactions on Geoscience andRemote Sensing 47: 1032–1044.
Rudel, T. and J. Roper (1997), ‘Forest fragmentation in the humid tropics: a cross-national analysis’, Singapore Journal of Tropical Geography 18: 99–109.

24 Matieu Henry et al.
Schulze, E.D., E. Beck, and K. Müller-Hohenstein (2002), ‘Human influence oncarbon balance and significance for global climate’, in Plant Ecology, Berlin:Springer-Verlag, pp. 641–648.
Soares-Filho, B.S., D.C. Nepstad, L.M. Curran, G.C. Cerqueira, R.A. Garcia, C.A.Ramos, E. Voll, A. McDonald, P. Lefebvre, and P. Schlesinger (2006), ‘Modellingconservation in the Amazon basin’, Nature 440: 520–523.
Sombroek, W., F.O. Nachtergaele, and A. Hebel (1993), ‘Amounts, dynamics andsequestering of carbon in tropical and subtropical soils’, Ambio 22: 417–426.
Souza, C.M.J., D.A. Roberts, and M.A. Cochrane (2005), ‘Combining spectral andspatial information to map canopy damage from selective logging and forestfires’, Remote Sensing of Environment 98: 329–343.
Tiffen, M. (2003), ‘Transition in sub-Saharan Africa: agriculture, urbanization andincome growth’, World Development 31: 1343–1366.
UN (2007), The Millennium Development Goals Report 2007, New York: UnitedNations.
UNEP (2006), Africa Environment Outlook, Division of Early Warning andAssessment, United Nations Environment Programme, Nairobi, Kenya.
UNFCCC (2006), ‘Impacts, vulnerability and adaptation to climate change inAfrica’, United Nations Framework for Climate Change Convention, Accra,Ghana.
UNFCCC (2009), ‘4/CP.15 Methodological guidance for activities relating toreducing emissions from deforestation and forest degradation and the role ofconservation, sustainable management of forests and enhancement of forestcarbon stocks in developing countries’, United Nations Framework for ClimateChange Convention, Copenhagen.
UNFPA (2007), ‘State of world population 2007: unleashing the potential of urbangrowth’, Geneva: United Nations Population Fund.
van der Werf, G.R., J.T. Randerson, L. Giglio, G.J. Collatz, P.S. Kasibhatla, and A.FArellano Jr. (2006), ‘Interannual variability in global biomass burning emissionsfrom 1997 to 2004’, Atmospheric Chemistry and Physics 6: 3423–3441.
Williams, P., N.P. Hanan, J.C. Neff, R.J. Scholes, J.A. Berry, A.S. Denning, and D.F.Baker (2007), ‘Africa and the global carbon cycle’, Carbon Balance and Management2: 1–13.
World Bank (2008), ‘The agenda for agriculture-based countries of sub-SaharanAfrica’, Agriculture for Development Policy Brief, The World Bank, Washington,DC.
Zianis, D., P. Muukkonen, R. Mäkipää, and M. Mencuccini (2005), ‘Biomass andstem volume equations for tree species in Europe’, Silva Fennica Monographs4: 1–63.