Embed Size (px)
Citation preview

.4gricultural Systems 40 (1992) 237-264
Implementing the Systems Approach in Pest Management
P. S. Teng & S. Savary
International Rice Research Institute. PO Box 933. Manila. The Philippines
A BSTRA CT
Three broad phases ntav be distinguished in the application of the s.vstetns approach to pest management. Prior to about 1970, much emphttsis was placed on the development of concepts and moth, ling techniques: in the 1970s and earlt" 1980s, a series of pest simuhtthm models for ker pests was devehlped: amL bt the htte 1980s, some crop ttml socio-economic'
fitt'tors were #zcorporated to develop decishm-aids .l.or .htrmers aml e.vten- sionists. Significant advances have been made ill mt'thoth~h~g.r at three h'vels--Level I on pest constraint charucterization attd pest man~tgement domain definition, Level 2 on quantitative and qualitative descriptions ~I the pest-crop-ecosystem interJaces, and Level 3 on the development o.f specific tools ]'or applying .uwtems techniques bt pest management. The three levels are htterlbzked, as shown in several crop-pest ecosystems such as potato pests in the Mid-Western USA, groumbutt diseases in West Africa, attd rh'e pests hz Tropical Asia. Anah'sis oJ'pest proJih's over thne, resulting in the characteri-ation of rehttionships among componettts q/" ~t st'stem and #~tproved s.t'stem definition, has resulted ht more J'ocussed analysis of sub-systems. Pest simulation ntodels commonly shnuhtte the dynamics of singh" diseases or insects as they are affected h)" the host aml physical environment. Pest or pest-crop models find little application for pest management unless they tire used within the context ¢~" the socio- economic'factors influencing the considered srstem and are athtpted to the application domain. This has been accomplished #z several ways. Shnpli- fled pest models or shnplified decision rules Jrom crop-pest mo~h'ls with economic values ~tssigned to their outputs have been used Jor managh~g several pathosvstems. Predictive models have been used to define zones of equivalent pest risk to guide extrapolation oJ'pest management technology
237
.4gricultural Systems 0308-521X, 9~'S05.00 ~ 1992 Elsevier Science Publishers Ltd, England. Printed in Great Britain

238 P. S, Tcn~,, S. Satart
.from kcv ~ite.s to a broader area. and to deploy host plant resistance. For agricultural development and. more speci[icall.v. Jbr an accelerated a~h~ption ~[ the systems approach in pest management, a toolkit may have to he developed to re~htce the lag time between generation of global principh's and ~h'velopment of site-apecific management tactics and strategies.
INTRODUCTION
Pest management is a set of activities in agricultural production aimed at keeping pest populations or injury within economically and socially acceptable loss levels. Management implies both knowledge and interven- tion. One important concept that has found much application in modern pest nlanagement is that of Integrated Pest Management (IPM: Stern et
a[., 1957), which stresses the rational use of a combination of pest control techniques while enhancing the role of natural regulatory mecha- nisms to producc an cconomically and socially acceptable yield with no adverse cfl'ccts on the environment (Teng, 1991a). Pest management is complex, involving many componcnts (e.g. pest, crop, beneficial organ- isms, non-target organisms) and with man's production-oriented inter- vcntions (such as ploughing, pesticides) superimposed on a variable, physical environment (c.g. weather). The scientific basis for pest manage- mcnt was initially based on singlc-I,Lctor and single-pest studies which expanded to multiplc-htctor, multiple-pest studies and strategies. This coincided with actual demonstrations of how system components were linked, and how to manage one pest without due regard to other pests, was to invite problems. In the early years of pest management, mathematical modeling and even computer simulation were attempted (Watt, 1962) although without explicit recognition of the influence of a conceptual base which was later called the systems approach.
The application of the systems approach to pest management may be considered as having started with the development of computer simula- tion models for insects and diseases in the late 1960s (Ruesink, 1976: Teng, 1985a). Prior to about 1970, much emphasis was on the develop- ment of techniques 1or simulation and statistical modeling of disease and insect life cycles: in the 1970s and early 1980s. a series of simulation models lbr pests was developed: the late 1980s saw work to broaden the approach by including the crop and socio-economic factors and, concur- rently, research to develop decision-aids for farmers and extensionists. It ~as also opportune that the same forces that fuelled application of the IPM concept to pest management also encouraged the application of a systems approach to pest management.

hnplementing the systems approach in pest management 239
A system is a limited part of reality that contains inter-related elements (de Wit, 1982): a system represents more than the mere addition of its components, Our interpretation of this approach is therefore that it proposes a holistic view in which systems management is predicated on the admission that overall system behavior will be influenced by changes in any system component. Therefore, to develop an IPM scheme that fits into a sustainable farming system requires that the system first be analyzed. The practical tools of pest management often trade-off system inputs with outputs (e.g. pesticide costs versus losses) in an environment where perceptions of human and agricultural risk prevail. Pest manage- ment research is continually being challenged to derive usable tools for developing tactics and strategies that account for the human element. As will be discussed, the systems approach provides such tools in the form of simulation and decision models.
Significant advances have been made in systems methodology at three levels:
Level I:
Level 2:
Level 3:
identifying pest problems and the pest management domain, i.e. the boundaries in time and space where pest-induced yield losses require specific measures. The objective is to identify intervention points for pest management; quantitative and qualitative descriptions of the pest-crop-- ecosystem interfaces to enable development of sustainable pest management tactics and strategies; and development of specific tools for applying systems techniques in tactical and strategic aspects of pest management.
The three levels are interlinked and may be illustrated by several crolY- pest systems such as potato pests in the Mid-Western USA (K. B. Johnson et al., 1986, 1987), groundnut diseases in West Africa (Savary & Zadoks, 1992c) and rice pests in Tropical Asia IHeong, 1990).
Scientists researching the application of the systems approach to pest management recognize that systems analysis is part of the approach (Teng, 1985a; Kranz & Hau, 1980; Heong, 1985) although there is dis- agreement as to what constitutes systems analysis. Dent & Anderson (1971) specified distinctive, yet interactive, steps in systems research-- Problem definition, Objective specification, Learning about system, Formulation of initial system model, Experimentation, Design and for- mulation of detailed system model, Model Evaluation and Experimenta- tion, Use of valid model for system design. The first four steps may be considered as systems analysis if the term is used in a 'technique' sense (Teng. 1985a). However, management scientists have often equated

240 P. S. Teng. S. Savarv
systems analysis with a procedure for decision analysis, for example. "systems analysis is a systematic approach to helping a decision maker choose a course of action by investigating his full problem, searching out objectives and alternatives and comparing them in the light of their con- sequences using an appropriate framework ... to bring expert judgment and intuition to bear on the problem" (Quade & Boucher, 1968, as cited by Heong, 1990). The apparent dichotomy of approaches using essen- tially the same systems paradigm in agriculture has resulted, on the one hand, in biological scientists emphasizing models as a medium for expressing the systems approach, and management scientists, on the other hand, using conceptual models. In pest management, the preoccupation with modeling was very evident in the 1970s and 1980s, and relatively little effort was put into applying the concept in. ironically, a more holistic manner in which the biological systems are considered to function, within a milieu of social and economic factors. A framework to reconcile the conceptual systems approach with systems modeling was proposed by Teng (1985h). In this paper, the view put tbrward is that both approaches are part of the same encompassing concept and have roles to play in pest management. While models are useful tools for synthesizing intbrmation and hypotheses, their application must be in the context of the system to be managed. Implicit in the latter is determination of the socio-economic characteristics within which the model, its outputs or a simplilied version of the model, must operate to assist in decision-making for pcst management. Hence, we tirst discuss the domain in ~hich pest management and models function. We then review and present some approaches to modeling the biological system, and follow on with a section on implementation.
DEFINITION OF PEST PROBLEMS AND THE PEST M A N A G E M E N T DOMAIN
Methodology for improved problem definition includes the early work on crop loss profiles, followed by the synoptic approaches and integrated pest surveys in several countries. The analysis of pest seasonal and historical profile patterns and the qualitative interpretation of hierarchi- cal relationships among components of a system, have also been success- fully applied in rice (Heong. 1990) and potato (K. B. Johnson et al., 1987). Recently, a significant step was made with the use of methods (e.g. correspondence analysis), that allow the identification of corresponding pest profiles and patterns of cropping practices in a crop ecosystem that may be jointly amenable to solution. This improved problem definition

Implementing the systems approach in pest management 241
has resulted in more focussed development of descriptive and quantita- tive models at the sub-system level.
Identification of problems and intervention points
The systems approach is particularly relevant to problem definition and hierarchization in complex agricultural systems (Teng, 1985a.b). Too often is the systems approach, or systems analysis, equated to the development, testing, and evaluation of a simulation model.
Heong (1985) has reviewed the semi-quantitative methods to address key issues in pest management. Among these methods is the use of pest profiles over time. i.e. the diagrammatic representation of the succession of pests during the cropping season, at the various development stages of the crop (Fig. 1). A damage matrix (Heong, 1985: Savary, 1987) may allow the identification of the most important pests, and help in prioritiz- ing pests to be managed and/or research actions to be taken. Decision trees (Norton, 1976. 1982: Mumford, 1981; Heong, 1983) can be devel- oped to compare methods for selected pests, and identify questions to be solved before implementing these methods, such as the planting times, or the damage thresholds.
In using the systems approach to improve pest management, one tangible output is a list of intervention points where the system behavior may be improved. These may take the form of research gaps (e.g.
Pest Seasonal Profiles
Leaf fo lde rs
Stemborers
Brown Planlhopper
Green Leafhopper! T u n g r o
Blast
Sheath Bl igh t
Bacter ia l l .eaf B l igh t
False Smut
Fig. I.
/
, ,~ . . J
l ] • .
Rice Developmentat Stages
Seasonal rice I~St profile for Central Luzon. Philippines.

"3 "1 _4_ P S Tt'n¢. S. S m a r t
research needed to determine i f a particular pest does cause economic losses), specific policy changes needed to facilitate changes at a farm level (e.g. the removal of pesticide subsidies), or specific implementation steps (e.g. need to initiate a pilot project to show that current pest management practices can be changed). A sequence of steps may be conceptualized as in Fig. 2 (from Teng, 1985h). The role of systems analysis (RHS of Fig. 2) is to provide a reliable description of the system so that relevant questions are raised to guide the subsequent implementa- tion.
A case study to apply quantitative and qualitative techniques for systems analysis, with the explicit aim of improving pest management. was undertaken by a group of scientists in the mid-western states of the USA (S. B. Johnson et al.. 1987). This case illustrates many salient
( -",~:,-~-- ~ t~nagement I - - - - - - ~ F=.~-~' I"'- [ System J ~
i i
Management . . . . . . . . . . . . . . . . . . . . . . . . . . . . System
i
Outputs ',; , ,.
V ,
~ i opumum Pest J Management J System
i i [ -- J
Monitoring & Survedlance
t i
System . . . . . . .,41, Descripl=on
& Analysis
+ I Consb'amt
Identfficat=on
J General,on ol
Knowledge
. I lL }
e
I R
. . _ ::.'.T.::-':':: .~J Evaluabon
F'ig. 2.
t Quahtative
Models
I
Schenmlic of ph,,sts I,,, ~ipply the s~slem_,, ,ippro~tch in pe~l m,,na~emcn( (after Teng. 1985h)

Implementing the systems approach in pest management 243
points. In spite of the long history of research into potato pest problems, and the large investment of human resources and funds, there was rela- tively little to show for applying the IPM concept on this crop. The driv- ing need therefore was for a systematic process of determining research needs and to prioritize these so that a system of competitive funding could be developed to satisfy these needs and consequently, lead to increased implementation of IPM. The authors used cluster analysis to classify potato production areas into zones with common soil attributes, as a basis for potential technology generation. Decision trees were then determined for different production systems (e.g. seed versus table potato) from payoff matrices (Table 1) derived to allow an exploration of the potential benefits accruing if information was available to reduce costs of production associated with a decision. To determine research gaps, the authors accessed the USDA CRIS Dialog database on projects, and from the database classified the number of research projects on potato being funded by both the public and private sector, into specific categories such as IPM, breeding, and non-chemical control. The AGRI- COLA database was also accessed for numbers of publications since 1970 on different pests and pest management techniques. The above gave
TABLE I Example of a PayolT Matrix for Seed Potato Derived from Decision Tree Analysis.
Sho~,ing Cost Factors for Decisions
D,'cL~ion no~h,s Pest pressure ('osthw
Low Medium Iligh
Years in rotation 0 0.8 ().7 0.65 $0.00 I 0.9 0-8 0.7 $15.00 2 1.0 0.95 0.90 $30-00 3- 1.0 1.0 0.95 $45-00
Fumigation Yes 1.0 IO 1.0 5200.00 No 1-0 I 0 0.95 $0.0
Fertilization Lo~" $10"20 Medium $22.50 High $54.00
Seed-treat with insecticide Yes 1-0 1.0 1.0 $6.00 No 1.0 1.0 0.95 $0.00

244 P S. Ten,v.. S. Savarv
an estimate of amount of research available at that time on a specific topic. A survey of potato workers and producers determined their perceptions of the ranked order of problems that required attention in order to improve the implementation of potato IPM. A series of workshops was then held with both research and extension personnel to develop a set of research guidelines for the competitive funding of projects. These guidelines were subsequently adopted by the Regional IPM Committee for funding via USDA and appear to still be meeting the needs. Application of the systems approach in the above example ensured that grower and field needs were met through the research process but, at the same time. that quality science was assured through a competitive grants process in which only the best, peer-reviewed projects were funded.
Quantitative approaches using survey and yield loss data
Priority setting lbr pest control--i.e, the identification of key pests--has long been, and still is, an essential activity in crop protection. It is seldom that crops arc exposed to a single pest ill a lield, but rather that sev- eral pests t~:cur simultaneously or in sequence during the cropping season (Padwick, 1956). An early approach for dealing with several pests is the "crop loss prolilc" methodology applicd to bean yield losses in Colombia (Pinstrup-Andersen eta/. , 1976: Chiarappa. 1980). This approach has the considerable advantage of providing quantitative estimates of the contribu- tion of each constraint to the total yield loss. However, the use of multiple regression assumes independence of the constraints and does not allow any analysis of pest interactions. This study may be considered among the first of a series, where a set of pest constraints of a crop, simultaneously with environmental variables, and variables representing the current cropping practices, were considered. Pests only constituted some of the "yield deter- mining variables" (Wiese, 1982). The approach may also be considered an attempt to incorporate the concept of the production situation (de Wit, 1982; Penning de Vries, 1982), i.e. the set of environmental variables that lead to a given yield output of the system. Many statistical techniques were applied to address complex, multivariate data sets generated by surweys. The study by Stynes (1980) is often quoted as an example of rigorous statistical analysis of such a data set, that involves principal components, canonical correlation, and multiple regression analyses. In practice, the available statistical tools are many, depending on the data and the objectives of the study; a review of such methods, useful in plant pathology, was given by Madden (1983).

Implementing the systems approach m pest management 245
An objective criterion for ranking pests is their respective contribution to yield loss. The FAO definition for yield loss is the difference between the attainable yield (i.e. the result of good crop husbandry, including judicial use of pesticides) and the actual yield (the yield obtained under current crop husbandry practices; Zadoks & Schein, 1979). It may prove a valuable exercise to consider how these two theoretical definitions, and therefore the concept of yield loss itself, can be converted into opera- tional definitions (Zadoks, 1972), leading to measurements and compar- isons. In the case of the system: groundnut-rust-leafspot in West Africa, the operational definition for the attainable yield was the yield estimated in a fungicide-protected, disease-free plot: this yield value was in turn used to represent a given production situation (Savary & Zadoks, 1992a).
A basic tool in pest management is the threshold theory, although other decision-making models exist such as marginal analysis, decision theory, and behavioral models (Mumford & Norton, 1984). Key con- cepts associated with the threshold theory are the injury caused to the crop, the yield loss, and the economic loss. These can be related to one another by functional relationships (Zadoks, 1985), such as the yield loss function (where yield loss is associated with varying injuries), or the eco- nomic loss function (where economic loss is associated with varying yield loss). Following a systems approach implies that interactions among pests, and interactions between pests and the production situation (repre- sented by the attainable yield) are to be considered, in some cases, such as bacterial leaf blight on rice, there is no interaction between the varia- tion of attainable yield and disease severity on relative yield loss (Reddy et ai., 1979), whereas in other cases, such as aphids on wheat (Rabbinge et al., 1981), or rust on groundnut (Savary & Zadoks, 1992b), the relative yield loss increases with increasing attainable yield.
Another approach may be considered, which does not rely upon quantitative variables to be explained from explanatory variables, but puts emphasis on characterization of the patterns of relationships among variables. This approach involves the categorization of qualitative infor- mation, i.e. variables that are ordinal by nature (e.g. the variety planted), or cardinal variables (e.g. yield) using chosen, preset boundaries. The coded, cardinal variables can then be simultaneously analyzed with ordinal variables. The method proceeds stepwise, by defining classes and class boundaries for each quantitative variable, building contingency tables, performing chi-square tests, and executing correspondence analyses (Hill, 1974; Greenacre, 1984). The first of these steps, the classification and coding of quantitative variables, is probably crucial, since it takes into account the distribution frequency of each variable, so that the filling of the classes (e.g. low, average, and high yield) would be

246 P. S. Teng. S. Savarv
commensurate. This phase also provides the unique opportunity to take into account errors in measurements of variables (as for yield, see e.g. Poate, 1988), introduce in the structure of the data set hypotheses that can be presently tested (e.g. key or threshold values of a variable, used as a class boundary), or consider the meaning of a 'low" or 'high" yield. Correspondence analysis allows the pictorial representation of contin- gency tables. The variables are classes, represented by their frequencies. A series of axes are defined, each of them accounting for a fraction of the total inertia represented by the data set, the inertia of each class being the product of its frequency by the squared distance to the origin of axes, When dealing with categorized variables which incorporate a natural progression (i.e. disease appearance, and further increase), graphs can be interpreted from the patterns of paths of increasing disease severities, and their possible correspondences. Parallel movement along two paths indicates correspondence, whereas orthogonality indicates independence (Lebart & F~nelon, 1975: de Lagarde, 1983).
This approach was used to analyze the relationships between ground- nut yield, diseases, and production situations in West Africa (Savary & Zadoks, 1992a). A database was established from a series of six simple. independent experiments, involving combinations of input factors and disease levels. The experiments produced three yield variables: Y, the actual yield of any plot, Y.,, the attainable yield (fungicide-protected plots), and Y,~,., the reference yield of one experiment (fungicide-protected plot in replicates where input factors are set to default levels). Figure 3 shows a correspondence analysis between the actual yield (Y), the reference yield ( Y J , and presence (DI)/absence (DO) of groundnut diseases, regardless of the disease or its intensity. The sequence of classes for each variable is delineated (e.g. from Y I to Y5), and the resulting paths analyzed. This analysis indicates two phases in actual yield (Y) progress: (I) a first phase of parallel increase of the actual yield, along with the reference yield, independent of disease levels (the vector D0-DI is orthog'onal to this direction; Fig. 3(b)); and (2) a second phase where the increase of actual yield, still depending on that of reference yield, is opposed to the occurrence of diseases (Fig. 3(c)). The graph indicates a threshold in reference yield, above which the increase of actual yield does not only depend on the improvement of the production situation through input factors, but also on the occurrence of diseases. Figure 3 indicates a threshold in the improvement of the production situation, in terms of the hazard incurred by pest constraints. The threshold is represented by a class of reference yields ranging from 1400 to 2300 kg/ha. The analysis indicates that progress in yield beyond this threshold cannot be foreseen without effective control of rust and leafspot diseases.

Implementing the systems" approach in pest m,nagement
1 Yref3 I
a ..o.... ] • "" O! "~
oOl°°°~ • Y!
Yref2
Y3
Y$
- 1 i I
-1.S -0.~ 0.5
247
1
0
-1
/ 1 O
b
-1.5 -0.5 0.5
-1.5 4).5 0.5
Fig. 3. An example of correspondence analysis on variations of actual yield of pcanLzt in West Africa. Three variables only are involved in this analysis: the actual yield '~' (from low YI to high YS), the reference yield Y,~-(i.e. the attainable yield under refer- ence level of inputs), and the presence DI/absence DO of I'oliar diseases. The tv,'o stages
indicated by the diagram (part b and part c) are explained in the text.

248 P. s. Teng. S. Savary
QUANTITATIVE AND QUALITATIVE MODELS OF PEST-CROP SYSTEMS
Pest models commonly simulate the dynamics of single diseases or insects as they are affected by host and physical environment. Bitrophic models (i.e. single pest-crop models, Teng, 1985a) such as early blight-potato (Johnson & Teng, 1990) and rust-leafspot-groundnut (Savary et al.,
1990) have been developed. The mere process of delineating the system to be modeled, its limits, its components, and their relations, has a very high heuristic value in itself (Zadoks, 1971: Zeng, 1991): it leads to the revelation of research gaps and the identification of research priorities. Our intention in this paper is not to give a comprehensive review of pest modeling techniques (Ruesink, 1976: Kranz & Hau, 1980: Teng, 1985a), but rather to discuss several issues in modeling which we consider to be important when the implementation of modeling in pest management is considered.
Q u a l i t a t i v e m o d e l s
A conceptual, qualitative model of a host-parasite system constructed with paper, pencil and mental tools, could potentially find application in pest management (Teng, 1987). This approach has been used in training traditional pest scientists in developing countries in the technique of systems analysis as a mental tool, but with the output as a description of the system. Two-dimension rectangular matrices are used, for example, to represent the monocyclic process-weather effects relations in rice blast disease (Table 2).
T A B L E 2
Blast Disease Cycle Weather Effects Matrix
Lif~'-c.rch, eh'ment.~ ; l ' e a t h e r components
Tt'tnp~'rulttrt" D¢'w
lligh L~m' Yes No
Rainfall
High Low
S p o r e g e r m i n a t i o n + * + + * ~ + 0 + + 0
Sporulation + + + + * 0 +
S p o r e l i b e r a t i o n 0 0 - ~- - +
I n f e c t i o n ~ +- , - * + + + 0 0 0
+ indicates positive effect. - indicates negative effect and 0 no effect; no. of "*" or "-" indicates magnitude of effect.

Implementing the systems approach in pest management 249
The type of effect of a weather component on a monocyclic process is described by assigning a rating system such as that shown (Table 2), in which three '+s" would imply a positive effect, while 0 would imply no known effect while a ' - " would mean a negative effect. The + or - in each cell of the matrix could in turn be substituted by some known knowledge; for example, it is known that cool temperatures (<26°C) favor sporulation and infection while high tropical temperatures (>28°C) impede blast development (Teng et al., 1991a). A crop-disease or crop- insect system may be completely described by assembling a number of rectangular matrices, each of which describes an aspect of the system (Teng, 1985b). Examples of other rectangular matrices are those on pesticides-target organisms, pesticides-pest components, pests-yield, and pesticides-non-target organisms. Collectively, these matrices represent a conceptual model of the pest management system, while singly they each may be used to provide some practical guidance for pest management action.
Quantitative models
These are mathematical models, commonly designed for computer simulation and consisting of a set of linked equations. Many such models have been developed in entomology and plant pathology and the reader is referred to previous papers for more complete discussions of these models (Royle et al., 1988; Teng & Yuen, 1991). Our purpose in this paper is to point out the relevance of such models to the implemen- tation process in pest management. The majority of pest models are of the population dynamic, single-species type, in which individual life-cycle components (stages) are driven by specific environmental (e.g. tempera- ture, rainfall) or host variables (e.g. leaf area index, host plant resist- ance). The first models were developed for temperate systems such as tomato early blight, potato late blight, European corn borer and Heliotis spp. on cotton (Ruesink, 1976; Teng, 1985a). More recently, models for tropical systems have been reported, especially for rice pests such as the brown planthopper (Holt et al., 1989) and blast disease (Teng et al., 1991b).
Language and model structure While the earlier pest models were mainly written for execution on main- frame computers, present-day models are almost exclusively operational on microcomputers. The structure of models has also become more elegant as programming languages such as PASCAL and C allow better structuring and documentation in comparison to FORTRAN. Computer

"50 P. S. Ten e. S. Savart
i wr
Cro~
ACB_~I~$
qlldull
AC8
h m l l 6
R ale_egglay,ng
TRPDEATH
adul ls ~ ' ~
_ ~ Rile TrilG~JIIS
Tri_q~lg$
"~ Rale_Trda'~e
tq
Rt¢
SURT
Trl_latvae
Ace_, . . . . . / / I / su.v_~a,L
Lfm,t3
densdy
Fig. 4.
I I i l t ACBJxoae ACB_larvae ACB_e,ggs
Relational diagram of a bitrophic sinlulation model showing links between the parasite and the prey (after Teng & Hofer, 1991 ).
languages for computer simulation remain a divisive methodological issue, together with the question of the computer operating system. The majority of pest models have been written in FORTRAN, while newer models have utilized special languages such as CSMP TM or STELLA TM
which allow modelers to concentrate more on the concepts behind models instead of the mechanics of programming. In Fig. 4 (a bitrophic model of Asian corn borer and Trichogramma furnacalis) the rectangular boxes represent state variables, while the circles joined to solid double lines between two state variables represent rates, and circles joined by single lines to the rates represent auxiliaries.

lmplementtng the systems approach in pe.gt management 251
BLASTSIM.2. a blast shmdation model o f intermediate complexit.v An issue that has recently received attention among disease modelers is whether a "top-down' or a "bottom-up' approach is more suitable for developing models for practical applications (Teng & Yuen, 1991). The "top-down" approach implies starting from a relatively simple model (or concept) and building increasing complexity into the model until it reaches an acceptable level of detail and accuracy/precision in its predic- tions of system behavior (Zadoks, 1971: Teng et al., 1991b). Van der Plank (1963) had proposed that all disease epidemics be explained by three phenomena--the latency, infectious period and a multiplication factor--and that additional detail would merely be expansions of the three variables describing these phenomena. In contrast, a "bottom-up" approach is one in which the model is used as an information/hypothesis synthesizing entity, and much detail concerning the life-stages of an insect or pathogen are captured. Examples are the disease models of tomato early blight of Waggoner & Horsfall (1969) and barley leaf rust (Teng et aL, 1980).
A more current and pragmatic approach towards model building is exemplified by BLASTS1M.2 for tropical leaf blast (Teng & Calvero, 1991) in which the model was developed for use as a predictive tool in zoning environments for their potential to favor the disease. The model simulates a leaf blast monocycle, with the stages of spore production, spore release, spore deposition, penetration and colonization, latency, lesion production, and lesion growth. Each of these stages is affected by several interacting climatic, edaphic and agronomic factors (i.e. driving variables) that influence the rate by which the monocycle moves. Simula- tion is on a daily time step and all state variables in the monocycle occur in sequence, starting from sporulation to lesion development, and are completed in one day. The time lag between events (specifically in the sporulation, release and deposition) is not discernible because of the daily interval. BLASTSIM.2 is continually being improved as we com- plete experiments to refine the functional relationships. It is currently being tested by collaborators in several Asian countries.
Model htitialization and input data Pest simulation models require input variables to initialize and run the model. These include weather variables such as daily maximum and minimum temperature, duration of leaf wetness per day, and rainfall amount per day. Daily cycles or time steps are common. Host variables include the growth stage or age of the crop, cuitivar susceptibility to the pest, planting density, etc. A problem that commonly causes difficulties with early season simulations is the relatively high deviation in simulated

252 P. S Teng. S. Savarv
pest state variables from observed variables. This is because of initial values estimated and used to initialize model runs (Teng & Yuen, 1991). Lack of historical weather data in developing countries is another difficulty, especially data on dew or leaf wetness, and dew has been a con- sistent limitation in most programs. The availability of models simulating dew is still confined either to regression equations or is location-specific. Others have used recorded leaf wetness (BLASTSIM.I of Teng et al., 1991b) or a switch function (PYRICULARIA of Gunther, 1986) in simulating the effect of dew on disease development. In developing their tropical blast model, Teng & Calvero (1991) used a dew simulation component which predicted dew period and amount per day through a model, DEWFOR, developed to simulate leaf wetness in The Netherlands (Weihong & Goudriaan, 1990). DEWFOR uses the energy budget approach (Pedro & Gillespie, 1982) combined with the electrical analogue of the heat transfer procedure in a crop canopy. Separately, this model requires several macro-climatic and crop variables to predict wetness. Predicted values of dew period are used in BLASTSIM.2 to drive the infection process.
The lack of standardized datasets for model development and valida- tion has been, and still is, a major constraint on widespread use of models in the tropics. Two transnational projects to overcome this constraint deserve mention--the International Benchmark Sites Network for Agrotechnology Transfer (IBSNAT)Project based at the University of Hawaii. and the Systems Analysis in Rice Production (SARP) Project based jointly at the Agricultural University, Wageningen, in The Netherlands and at IRRI, Philippines. IBSNAT, for example, has pioneered the use of the Minimum Data Set (MDS) concept, in which a defined set of environmental and host variables is measured at collabora- tive sites worldwide in an attempt to collect databases for model evalua- tion. SARP has attempted the same in selected countries of South, East and Southeast Asia. These two projects are also largely responsible for developing standardized peripheral programs in support oi" model appli- cation: for example, the 'weather generation' module developed through IBSNAT allows probabilistic simulation of weather series for examining potential pest development or crop growth at a location.
Dealing with spatial u.wects and dispersal All epidemics increase in time and space (Van der Plank, 1963). Because of the difficulties associated with modeling spatial aspects of epidemics, early pest models did not explicitly include a spatial element in their structure and instead emphasized the temporal increase in pest popula- tion or host injury. The first comprehensive systems model developed

Implementing the systems approach in pest management 253
with spatial simulation as the main focus was EPIMUL (Kampmeijer & Zadoks, 1977), aimed at simulation of foci expansion and epidemic development in mixtures of host plants such as in multilines. The mechanics and concepts involved with dispersal (passive) and movement (active) of pests have recently been reviewed (Van der Werf et al., 1989; MacKenzie et al., 1985: Hutchins et al., 1988) and much progress has been made that appears to be concomitant with improvements in the speed and power of microcomputers. Within-field simulation of epidemics has been done by treating single plants or groups of plants (e.g. rice hills) as the units for simulation and specifying the type of interaction between the units (e.g. dispersal gradient of spores). Spatial simulation is demanding in terms of computing capability and it has yet to be demonstrated whether the information obtained provides any increase in usefulness compared to that of temporal models for tactical disease management decisions. It may, however, be useful for pests that have focal rather than general spread characteristics.
Another type of spatial modeling concerns the large area movement or dispersal of insects and the spread of diseases, including insect migra- tion. Much of this modeling has relied on trajectory analysis, with good success having been achieved for black cutworm on corn in the mid- western part of the USA(Hutchins et al., 1988) and tobacco blue mold for the southern part of the US and the Caribbean (Main et al., 1985). Spatial modeling also deals with pandemics (i.e. transregional epidemics), and is particularly relevant when considering quarantine pests (Heesterbeek & Zadoks, 1987) or the deployment of resistant varieties against races of a pathogen (Zeng, 1991 ).
Beyond bitrophic sys tems In applying systems concepts and simulation techniques to pest model- ing, most activity appears to have been concentrated on single pest species. The concept of coupling pest models to crop models has received much attention in the scientific literature (Rouse, 1988: Pinnschmidt et al., 1990) and at meetings (Teng & Yuen, 1990). Pests like leafhoppers (K. B. Johnson et al., 1987) and early blight (Johnson & Teng, 1990) have been coupled to a potato model using relatively simple driving functions for the pest population. In both these cases, the pest had an effect on the host species, but the host species had relatively little effect on the dynamics of the pest species. Pinnschmidt et aL (1990) considered true coupling to be when both pest and crop populations interact dynamically in each time step and exert an influence on each other's state variables, such as with blast on the CERES-RICE model (Pinnschmidt et al., 1990).

254 P..S" Tcn~..~ Savury
Biocontrol systems which operate at the bitrophic level, i.e. predator/ parasite--prey relationships, have been the subject of much mathematical modeling but relatively little dynamic systems simulation (Ruesink, 1976). in the tropics, knowledge gaps exist on the population dynamics of natural enemies and their interactions with prey populations. Teng 8,: Hofer (1991) developed a Trichogramma-Asian corn borer dynamic model (Fig. 4) to simulate strategies of inundative releases using STELLA. In their model, life stages of the parasite interact directly with life stages of the prey in each time step. Releases of the adult wasp are modeled as pulses into the system. The authors also coupled a simple yield loss function to the number of larvae per plant, from which tunnel length per plant is estimated at a specific growth stage and the effect on yield is estimated IFernandez et al., 1992). The next step in increasing the realism of this bitrophic model would be to couple the Tricho- grammu-corn borer model to a corn crop model such as CERES- MAIZE to make it a truly tritrophic system. This is a potentially exciting challenge for systems modeling.
.tlodel evaluation Compared to the situation in the 1970s, pest modelers presently appear to be more aware of the need for empirical validation of their models. i lowever, divergent views still exist on how much validation is needed before a system model can become useful, with some workers stressing st~,tistical proof of model validity (Teng et ul., 1980) while others feel that a general examination of output is sutlicient (Rabbinge et al., 1989). The techniques l\~r validation have been reviewed and discussed else- where (Teng. 1985a) and it is encouraging to see both subjective and objective tests included in most scientilic papers on models. Few pest models have been subject to formal procedures for sensitivity analysis, ~,hhough Teng (198(I) applied random search optimization procedures to determine system sensitivity to combinations of latent period, sporula- tion, and infectivity for reducing yield losses caused by barley leaf rust. Multicriteria optimization techniques offer much potential in determin- ing which sets of parameters in pest models are most amenable to genetic or cultural manipulation in pest management, and more research needs to bc done on this.
APPLYING SYSTEMS TECHNIQUES IN TACTICAL AND STRATEGIC PEST MANAGEMENT
Pest or pest-crop models lind little application for pest management unless they are used within the context of the socio-economic factors
Implementing the systems approach in pest management 255
influencing the considered system and are adapted to the application domain. Models do not necessarily have to be used in their entirety for pest management; their outputs such as yield loss thresholds, or simplified versions of detailed models requiring fewer inputs, may suffice and be practical.
Rationalization of pesticide use
This has been accomplished in several ways. Simplified pest models or simplified decision rules from crop--pest models with economic values assigned to their outputs have been used for managing sugarbeet Cercospora leafspot (Shane et al., 1985), sweet corn common rust (Teng, 1987), wheat diseases (Zadoks, 1984, 1989), and rice blast (Surin et a/., 1991). Detailed simulation models have been used to design strategies for insecticide use (Heong, 1990) and to predict disease epidemics (Teng et ai., 1978).
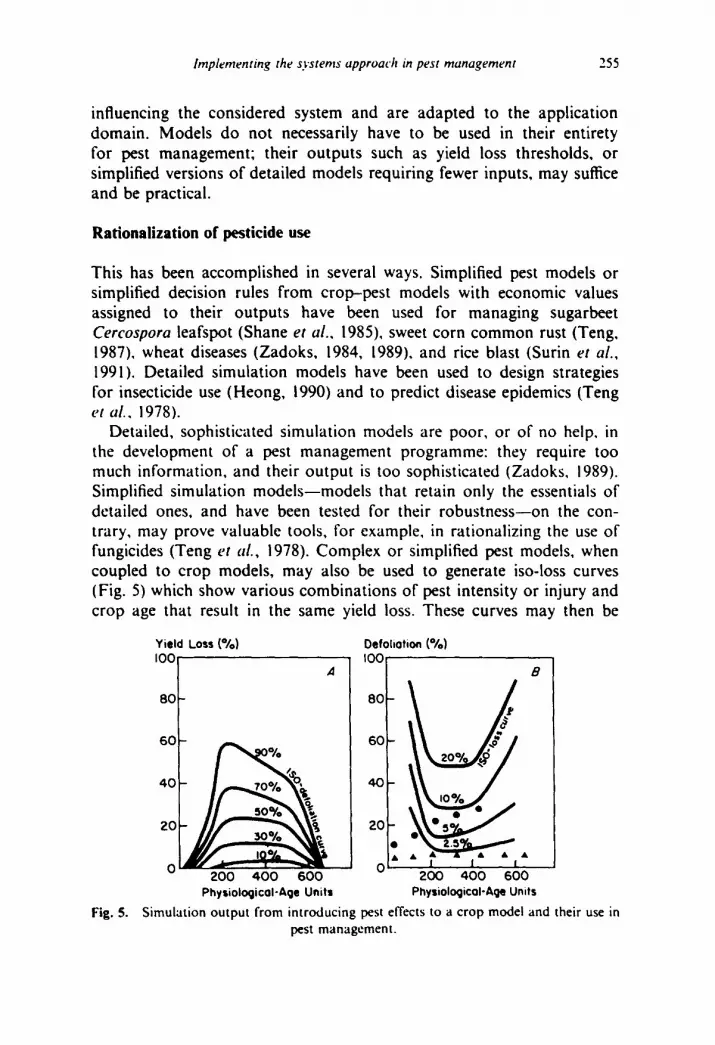
Detailed, sophisticated simulation models are poor, or of no help, in the development of a pest management programme: they require too much information, and their output is too sophisticated (Zadoks, 1989). Simplified simulation models--models that retain only the essentials of detailed ones, and have been tested for their robustness--on the con- trary, may prove valuable tools, for example, in rationalizing the use of fungicides (Teng et al., 1978). Complex or simplified pest models, when coupled to crop models, may also be used to generate iso-loss curves (Fig. 5) which show various combinations of pest intensity or injury and crop age that result in the same yield loss. These curves may then be
Fig. 5.
Yield Loss (%) Oefoliotion (%)
I001 Z)O A B
'° I °°
0 O " I | I A 200 400 600 200 400 600
Physioloc~icoI-Ac|e Units PhysioloqicoloAQe Units
Simulation output from introducing pest effects to a crop model and their use in pest management.

256 P. S. ?'eng. S. Savarv
used in a scouting program in pest management, in which preset levels of acceptable loss are used to decide on the timing of control measures. Pest management programs in the future will probably take the form of a series of interlinked decision rules, or simple models, each representing one pest sub-system of the considered crop system. The coefficients or parameters of this multiple decision support system would be functions of the cropping practices, and could be altered in relation to the recom- mendation domains (i.e. the combination of farm economic context and agro-ecoiogical zones) where the output of the decision support system would be applicable. If such an architecture was to be considered, the linkage between the decision support system and the recommendation domains would play a considerable role. The development of extrapola- tion methodologies that can simultaneously handle agroecological and economic factors involved in decision-making in agriculture, such as geographic information systems (GIS), may play a key role in helping to define these multi-attribute recommendation domains.
Risk analysis
One exciting new use of models is for analyzing the risk associated with the introduction of exotic pests into ecosystems in which they have not
O e m s ~ . m i e a o l r m between pest cycie comgeeHmUm
end emvircmmentll #8mctem*l (m~mcy~c me ly i , )
O u e m l J c ~ el r e l ~ b4nw~m pe~ dym.~x~,
end e a v ~ m fecSero (pdycyciic e M l ~ )
QuanUflcatia~ d r e l e l ~ ~ peec dymmke
end crop
i [ S i m ~ of ~ d ~ a e 8 : "
. . . . I . . . . . . . . . . . . . . . . . . . . 1
Fig. 6. Schematic showing suggested steps in using models for risk analysis.

hnplementing the systems approach in pest management 257
previously been known to exist. Yang et al. (1991) have demonstrated the feasibility of the approach with a soybean rust model, SOYRUST, which when run with continental USA weather data predicted potential areas for epidemics. The authors further linked model disease estimates to a soybean crop model and determined potential losses attributable to rust epidemics. Their approach is, however, a simplistic one, and we propose a generic approach, as illustrated in Fig. 6, in which models of different complexities may be used to estimate the needed disease and yield effects.
Andow et al. (1989) used a potato model to estimate the benefits from reduction of yield losses if non-ice nucleating bacteria, produced through bioengineering, ~ere released into the environment. The methodology they used resulted in probability curves for yield losses with different release scenarios and allowed an evaluation of the value of the technol- ogy. The work illustrates an important application of models to assess situations where actual field work on a pest is not possible because of concern for potential hazards, and simulation appears to be the ideal tool for exploring the options (Teng, 1991b).
Pest management information systems
Kenmore et al. (1985) described three different types of "IPM program pathologies', namely: political, social, and perceptual. Each of these pathologies is a cause of failures of 1PM programmes. Considerable attention is being paid to the conditions under which an IPM program can be adopted by farmers, and be successful. The farmer's behavior and reaction towards risk have been studied in a number of instances. Many authors consider that, among farming communities, there is a much higher proportion of insurers (Mumford, 1981 )--who would prevent risk at any cost--than of investors--who keep profit as the main goal. The proportion however, varies considerably depending on the farm size, the investments in the crops, and the production objectives (Kenmore et al.,
1985). it seems therefore that the farmer's perception and attitude towards risk are related to the production situation, taken in its broadest sense.
Because the presence of several pest constraints is the rule rather than the exception, the adoption of an IPM program by farmers is often linked with its potential to address several pests at the same time (Zadoks, 1989). Examples of IPM programs involving a number of pests differing in their nature are few: the Michigan State IPM program (CIPM, 1983), the EPIPRE program for control of pests and diseases in wheat (Zadoks. 1984), and the BLITECAST program (MacKenzie,

258 P. S. Teng. S. Sa~ar'
1981) are frequently quoted examples. Although the principles for developing pest management information systems appear to be well- founded, their measurable adoption by farmers often appears to be low and one reason may be that the technology is still ahead of the need. In developing countries, computer-based pest management is a long way from realization even in the more advanced of such countries in Asia.
A modification to the concept of using detailed pest simulation models in an information system is to incorporate the simplified outputs of simulations (such as expected crop losses caused by specific pest pop- ulations) into an information system. This was done in New Zealand for barley leaf rust (Thornton & Dent, 1984), and although the technology was sound, farmer adoption has been low.
Every effort should therefore be spent to develop a pest management programme in close contact with farming communities (Kenmore et al.,
1985). The systems approach must incorporate strong social sciences inputs, and allow characterization of production objectives, farmers" perception of pest injuries and losses, farmers" needs, and farmers" means to implement the IPM programme.
Predictive pest zoning
Pest zoning is an idea that has particular appeal for large-area pest management, in which both strategies and tactics can be merged to achieve optimal management, in theory, pest population dynamic models can be run with the requisite environmental data and used to determine a probabilistic value of the likelihood of severe epidemics at a site (Yuen & Tcng, 1990). Site predictions can then be extrapolated using appropriate geostatistical techniques to derive zones of equivalent epidemic potential for a pest. This has been shown for tropical rice blast using techniques developed by the IBSNAT project, although work is currently ongoing to test the validity of the predictions. Having zonal information would allow strategic decisions within each zone on what rice varieties could be grown and how long host plant resistance would be expected to last. Historical climate data from sites have been shown to be useful for characterizing the conduciveness of a site to specific diseases by Coakley (1990) for wheat diseases, while the prediction of riskiness of an environment to tomato viruses was also successfully done in Arizona using geostatistics and GIS (Nelson, 1991, pers. comm.); the zones were then used to guide extension workers in the selection of disease management options. As weather systems become more access- ible and timely, and GIS software more user-friendly and powerful, it is likely that the integration of disease predictive systems with online

Implementing the systems approach in pest management 259
weather and weather-interpolation systems will be achieved to provide information for management; such a prototype system is undergoing testing in New Mexico by Fields et al. (1991).
CONCLUDING REMARKS
The systems approach is now more relevant and important than at any previous time because of increasing realization of the inter-relatedness between components of fragile ecosystems, especially those of food crops such as rice-based agroecosystems, where major pest outbreaks have occurred in Asia because of non-holistic pest management practices in the past. For agricultural development, and more specifically, for an acceler- ated adoption of the systems approach in pest management, a toolkit may have to be developed for countries in order to reduce the lag time between generation of global principles and development of site-specific man- agement tools. To generate this toolkit, we propose that an inter- national collaborative effort for harmonization be developed, involving advanced laboratories, national programs and international organizations. This collaborative effort could facilitate the sharing of models, the harmon- ization of model design, the collection of common data sets for model validation, and most importantly, facilitate the application of models or their outputs to solve specific problems of agricultural development.
Although this paper has concentrated on the methodology of computer- based systems approaches to pest management, we would like to stress that the application of the philosophy inherent in the approach to pest management is very much incorporated in Integrated Pest Management. IPM has been the driving force behind modern crop protection in the advanced countries since the 1960s, and in Asia to some extent on the major crops, since the early 1980s (Teng, 1985b). As noted earlier, IPM stresses holism, utilizing agroecological principles but translating them into a socio-economic framework which stresses human resource develop- ment. The application of the IPM approach is likely to spread to more pests and more crops in the developing world, and the challenge to prac- titioners of the systems approach to pest management is to produce useful tools that can contribute to the momentum that now exists.
REFERENCES
Andow, D. A., Teng, P. S., Johnson, K. B. & Snapp, S. S. (1989). Simulating the effects of bioengineered non-ice nucleating bacteria on potato yields. Agric. Systems, 29, 81-92.

260 P. S. Teng. S. Savarv
Chiarappa. L. (ed.)(1980). Crop Loss Assessment Methods. Supplement No. 3. FAO,Comm. Agric. Bureaux. Farnham, England. 123 pp.
CIPM (1983). Consortium for Integrated Pest Management. Success Stories. 198 pp.
Coakley, S. M. (1990). Using historical weather and pest data for pest zoning. in Crop Loss Assessment in Rice, pp. 303-12. IRRI: Los Banos.
Dent, J. B. & Anderson, J. R. (1971). Systems, management and agriculture. In Systems Analysis m Agricuhural Management. eds J. B. Dent & J. R. Anderson. Wiley, New York, pp. 3-16.
Fernandez. P. G., Hofer, J. & Teng, P. S. (1992). Determination of loss coefficients for the Asian cornborer by means of on-farm sampling in the Philippines. In Proceedings of the Third International Conference on Plant Protection in the Tropics. Genting Highlands, Malaysia, 20-23 March 1990. (In press.)
Fields, C.. Liddell, C., Newberry, J. & Woodard, J. (1991). Integration of a predictive model of peanut web blotch with a terrain-sensitive weather interpolation system. Paper No. 3A.1, 20th Conference on Agricultural and Forest Meteorology, Salt Lake City, Utah. American Meteorological Society, 45 Beacon St., Boston, MA 02108-3693.
Greenacre. M. J. (1984). Theory and Application oJ" Correspondence ,4nalysis. Academic Press, London.
Gunther, H. (1986). Simulation of the epidemiology of Pyriculariu oo'zae in rice: a first attempt. Report of a 3-months MSc project. Agricultural Uni- versity Wageningen, 82 pp.
Heesterbeeks, J. A. P. & Zadoks, J. C. (1987). Modelling pandemics of quarantine pests and diseases: problems and perspectives. Crop Protection, 6, 211-21.
Heong, K. L. (1983). Decision analysis in pest forecasting. MARDi Res. Bull., I I, 62-70.
Heong, K. L. (1985). Systems analysis in solving pest management problems. in Integrated Pest Management in Malaysia, eds B. S. Lee, W. H. Loke & K. L. Heong. Malaysian Plant Protection Society, Kuala Lumpur, pp. 133~,9.
Heong, K. L. (1990). Systems analysis and modelling in pest management. In Crop Loss Assessment in Rice. International Rice Research Institute, Manila, pp. 215-28.
Hill, M. O. (1974). Correspondence analysis: a neglected multivariate method. ARRI. Statist., 23, 340-54.
Holt, J., Wareing, D. R., Norton, G. A. & Cook, A. G. (1989). A simulation of the impact of immigration on brown planthopper population dynamics in tropical rice. J. Plant Prof. Tropics, 6. 173-87.
Hutchins. S. H., Smelser, R. B., & Pedigo, L. P. (1988). Insect migration: atmospheric modeling and industrial application of an ecological phenom- enon. Bull. Entomol. Soc. America, 34, 9-16.
Johnson. K. B. (1986). Systems analysis and modeling of yield loss in potato caused by interacting populations of early blight, Verticillium wilt, and the potato leafhopper. PhD Dissertation, University of Minnesota, 201 pp.
Johnson, K. B. & Teng, P. S. (1990). Coupling a disease progress model for early blight to a model of potato growth. Phytopatholog),, 80, 416--25.

Implementing the systems approach in pest management 261
Johnson, K. B., Teng, P. S. & Radcliffe, E. B. (1987). Coupling feeding effects of potato leafhopper, Empoasca fabae, nymphs to a model of potato growth. Environ. EntomoL, 16, 250-8.
Johnson, S. B., Teng. P. S., Bird, G. W., Grafius, E., Nelson, D. & Rouse, D. I. (1987). Analysis of potato production systems and identification of IPM research needs in the North-central Region. USDA NCR Publication. 52 pp.
Kampmeijer, P. & Zadoks, J. C. (1977). EPIMUL, a simulator of foci and epidemics in mixtures, multilines, and mosaics of resistant and susceptible plants. Simulation Monograph, Pudoc, Wageningen. 50 pp.
Kenmore, P. E., Heong, K. L. & Putter, C. A. (1985). Political, social and perceptual aspects of integrated pest management programmes. In Proceed- ings of the Seminar on Integrated Pest Management in Malaysia, eds B. S. Lee, W. H. Loke & K. L. Heong. Malaysian Plant Protection Society, Kuala Lumpur, Malaysia, pp. 47-66.
Kranz, J. & Hau, B. (1980). Systems analysis in epidemiology. Annual Rev. Phytopathol., 18, 67-83.
De Lagarde, J. (1983). Initiation d l'Analyse des Donndes. Bordas, Paris. 157 pp. Lebart, L. & F6nelon, J. P. (1975). Statistiques et lnformatiques Appliqudes.
Dunod, Paris. 439 pp. MacKenzie, D. R. (1981). Scheduling fungicide applications for potato late
blight with BLITECAST. Plant Disease, 65, 394--9. MacKenzie, D. R., Barfield, C. S., Kennedy. G. C., Berger, R. D. & Taranto,
D. J. (1985). The Movement and Dispersal of Agriculturally Important Biotic Pests. Claitor's Publishing Division, Baton Rouge, Louisiana. 611 pp.
Madden, L. V. (1983) Measuring and modeling crop loss at the field level. Phytopathoiogy, 73, 159 I-6.
Main, C. E., Davis, J. M. & Moss, M. A. (1985). The biometeorology of blue mold of tobacco: Part I. A case study in the epidemiology of the disease, In The Movement and Dispersal of Agriculturally Important Biotic Agents, eds D. R. Mackenzie, C. S. Barfield, G. C. Kennedy, R. D. Berger & D. J. Taranto. Ciaitor's Publishing Division, Baton Rouge, Louisiana, pp. 453-72.
Mumford, J. D. (1981). Pest control and decision making: Sugar beet in England. J. Agric. Econ., 32, 31--41.
Mumford, J. D. & Norton, G. A. (1984). Economics of decision making in pest management. Annual Rev. Entomol., 29, 157-74.
Norton, G. A. (1976). Analysis of decision making in plant protection. Agro- ecosystems, 3, 27 44.
Norton, G. A. (1982). A decision analysis approach to integrated pest control. Crop Protection, I, 147--64.
Padwick, G. W. (1956). Losses caused by plant diseases in the tropics. Comm. Mycological Institute, Kew, Surrey, Phytopath. Papers No. 1.60 pp.
Pedro, M. J. & Gillespie, T. J. (1982). Estimating dew duration. II. Utilizing standard weather station data. Agric. Meteorology, 25, 297-310.
Penning de Vries, F. W. T. (1982). Systems analysis and models of crop growth. In Simulation of Plant Growth and Crop Prop Production, eds F. W. T. Penning de Vries & H. H. Van Laar. Pudoc, Wageningen, pp. 9-19.
Pinnschmidt, H., Teng, P. S., Yuen, J. E. & Djurle, A. (1990). Coupling pest effects to the IBSNAT CERES crop model for rice. Phytopathology, 80, 997.
262 P. S. Teng. S. Savarv
Pinstrup-Andersen, P., de Londono, N. & lnfante, M. (1976). A suggested procedure for estimating yield and production losses in crops. PANS, 22. 359-65.
Poate, D. (1988). A review of methods for measuring crop production from small-holder producers. Expl. Agric., 24, !-14.
Rabbinge, R., Drees. E. M., Van der Graaf. M.. Verberne, F. C. M.. & Wesserlo. A. (1981). Damage effects of cereal aphids in wheat. Neth. J. Plant Pathol., 87, 217-32.
Rabbinge, R., Ward. S. A. & van Laar, H. H. (eds) (1989). Shnulation and systems management in crop protection. Pudoc, Wageningen.
Reddy, A. P. K., Rouse, D. T. & MacKenzie, D. R. (1979). Relationship between nitrogen fertilization, bacterial leaf blight severity, and yield of rice. Ph.vtopathology, 69, 971-3.
Rouse. D. I. (1988). Use of crop-growth models to predict the effects of disease. Annual Rev. Phytopathol., 26, 183-201.
Royle, D. J., Rabbinge, R. & Fluckiger, C. R. (1988). Pest and Disease Models in Forecasting. Crop Loss Appraisal attd Decision-Supported Crop Protection Systems. IUBC. WRPS Bulletin 188/IX/2.95 pp.
Ruesink, W. G. (1976). Status of the systems approach to pest management. Annual Rev. Entomol., 21.27-44.
Savary. S. (1987). Enqufite sur les maladies fongiques de I'arachide (Arachis hypog~ea) en C6te d'lvoire. I. M6thodes d'enqufite et 6tude descriptive: Its conditions culturales et les principales maladies. Neth. J. Plant. Pathol.. 93, 167-88.
Savary. S., de Jong. P. D., Rabbinge, R. & Zadoks, J. C. (1990). Dynamic simulation of groundnut rust: a preliminary model. Agric. Systems, 32, 113-41.
Savary, S. & Zadoks. J. C. (1992a). An analysis of crop loss in the multiple pathosystem: groundnut-rust-late leaf spot. !. Six experiments. Crop Protection. i !, 99-109.
Savary, S. & Zadoks, J. C. (1992b). An analysis of crop loss in the multiple pathosystem: groundnut-rust-late leaf spot. II. A study of the interactions between diseases and crop intensification in factorial experiments. Crop Protection. !I, 110-20.
Savary, S. & Zadoks, J. C. (1992c). An analysis of crop loss in the multiple pathosystem: groundnut-rust-late leaf spot. I!1, Correspondence analyses. Crop Protection, ! I, 229-39.
Shane, W. W., Teng, P. S., Laney, A. & Cattanach, A. (1985). Management of Cercospora leafspot of sugarbeets: Decision aids. North Dakota Farm Research, 43, 3-5.
Stern, V. M., Smith, R. L.. Van den Bosch, R. & Hagen, K. S. (1957). The integrated control concept. Hilgardia, 29, 81-101.
Stynes, B. A. (1980). Synoptic methodologies for crop loss assessment. In Crop Loss Assessment, Misc. Publ. Univ. Minn. Agric. Exp. Stn. 7, 166-75.
Surin, A.. Arunyanart, P., Rojanahusdin, W., Munkong, S., Dhitikiattipong, R. & Disthaporn. S. (1991). Using empirical blast models to establish disease management recommendations in Thailand. In Rice Blast Modeling arid Forecasthtg. IRRI, Los Baflos, pp. 69-74.

Implementing the systems approach m pest management 263
Teng, P. S. (1980). Exploratory and optimization computer experiments for designing management systems of barley leaf rust. Phytopathology, 71, 260.
Teng, P. S. (1985a). A comparison of simulation approaches to epidemic model- ing. Annual Rev. Phytopathol., 23. 25i-79.
Teng. P. S. (1985b). Integrating crop and pest management: the need for comprehensive management of yield constraints. J. Plant Protection in the Tropics, 2, 15-26.
Teng, P. S. (1987). The systems approach to pest management. In Crop Loss Assessment and Pest Management, ed. P. S. Teng. American Phytopatho- logical Society Press, St. Paul, pp. 160-7.
Teng, P. S. (1991a). IPM activities at the International Rice Research Institute. Philippine Pest Management, i, 4-13.
Teng, P. S. (1991b). Modeling and non-modeling approaches to assessing the impact of field releases of bioengineered organisms. Phytopathology, 80, ! 137-42.
Teng, P. S. & Calvero, S. B. (1991). Computer simulation of tropical rice-leaf blast pathosystem using BLASTSIM.2. Phytopathology, 81. 1143.
Teng, P. S. & Hofer, J. (1991). Assessing the impact of biological control in plant protection. In Biological Control in the Tropics. eds P. A. C. Ooi. G, S. Lim & P. S. Teng. Malaysian Plant Protection Society, Kuala Lumpur.
Teng, P. S. & Yuen, J. E. (eds) (1990). Proceedings of Workshop on Modeling Pest-Crop Interactions, University of Hawaii, 7-10 January 1990. Research Extension Series 120. University of Hawaii, College of Tropical Agriculture and Human Resources. 57 pp.
Teng, P. S. & Yuen, J. E. (1991). Epidemics models: lessons from plant pathology, in Risk Assessment in Genetic' Enghaeering: Environmental Release of Organisms, eds M. Levin & H. Strauss. McGraw Hill, pp. 272-96.
Teng, P. S., Blackie, M. J. & Close, R. C. (1978). Simulation modelling of plant diseases to rationalize fungicide use. Outlook Agric., 9, 273-7.
Teng, P. S., Blackie, M. J. & Close, R. C. (1980). Simulation of the barley leaf rust epidemic: structure and validation of BARSIM.I. Agric. S)'stet~t~', 5. 55-73.
Teng, P. S., Klein-Gebbinck. H. & Pinnschmidt, H. (1991a), An analysis of the blast pathosystem to guide modeling and forecasting. In Rice Blast Modeling and Forecasting. IRRI, Los Baftos, pp. 1-30.
Teng, P. S., Calvero. S. & Pinnschmidt, H, (1991b). Simulation of rice patho- systems and disease losses. In Systems Simulation at IRRI, eds F. W. T. Penning de Fries, M. J, Kropff, P. S. Teng & G. J. D. Kirk. IRR1 Research Paper Series No. 151, pp. 27-33.
Thornton. P. K. & Dent. J. B. (1984). An information system for the control of Puccinia hordei. II. Implementation. Agric. Systems. 15, 225-43.
Van der Plank. J. E. (1963). Plant Diseases: Epidemics and Control. Academic Press, New York. 349 pp.
Van der Werf. W., Rossing. W. A. H., Rabbinge, R., de ,long, M. D. & Mols. P. J. M. (1989). Approaches to modelling the spatial dynamics of pests and diseases. In PARASITIS 88. Proc. of scientific congress. Barcelona, October 1988. eds R. Cavalloro & V. Delucchi. pp. 89-119.

264 P. S l-¢'ne. S. Savar~
Waggoner, P. & Horsfall, J. G. (1969). EPIDEM. a simulator of plant disease written for a computer. Connecticut Agriculture Experiment Station Bulletin No. 698. pp. 1-80.
Watt. K. F. (1962). Use of mathematics in population ecology. Annual Rev. Entomol.. 7. 243-60.
Weihong. L. & Goudriaan. J. (19901. Dew formalion in crops--a simulation study (DRAFT).
Wiese. M. V. ~1982). Crop management by comprehensive appraisal of yield determining variables. Annual Rev. Phytopathol.. 20, 419-32.
Yang. X. B.. Dowler, W. M. & Rover. M. H. (I991). Assessing the risk and potential impact of an exotic plant disease. Pkmt Disease, 75. 976-82.
Yuen, J. E. & Teng. P. S. (1990). Assessing risk with stochastic dominance. PhytopathohJgy, 80, 997.
Zadoks. J. C. (1971). Systems analysis and the dynamics of epidemics. Phyto- pathoh~g.v. 6 I. 61)0- I 0.
Zadoks. J. C. (1972). Methodology in epidemiological research. Annual Rev. Phytopathoh~gy, I0. 253--76.
Zadoks. J. C. (1984). EPIPRE: a disease and pest management system for winter wheat developed in the Netherlands. EPPO Bull.. ! I, 365-9.
Zadoks. J. C. (1985). On the conceptual basis of crop loss assessment: the threshold theory. Annual Rev. Phytopathol.. 23. 455-73.
Zadoks, J. C. (1989). EPIPRE, a computer-based decision support system for pest and disease control in wheat: its development and implementation in Europe. In Phmt Disease Epith,mioh~gy. I'ol. 2." Genetics. Resistance. and .l, lanugement, eds K. J. Leonard & W. E. Fry. McGraw-Hill Publishing Company, New York, pp. 3-29.
Zadoks. J. C. & Schein, R. D. (19791. Ephh,mh~h~g.v and Phmt Disease Manage- merit. Oxford University Press. New York. 427 pp.
Zcng, Shih-Mai (1991). PANCRIN. a prototype model of the pandemic culti~ar-racc interaction of yellow rust on wheat in China. Phmt Pathoh)g.v, 40. 287-95.


