Embed Size (px)
Citation preview
443
Dissolved inorganic phosphate (henceforth referred to asPi) is an essential nutrient for growth and metabolic function-ing (e.g., nucleic acids, lipids, energy-transferring molecules)
of living organisms, including marine microbial communities.Pi can be limiting for growth in many lakes and in some olig-otrophic areas of the world ocean, where nanomolar concen-trations are measured (Björkman et al. 2000; Wu et al. 2000;Moutin et al. 2002; Van Den Broeck et al. 2004). Measuring Pi
uptake fluxes through different compartments of planktoniccommunities permits both to determine the main actorsresponsible for the bulk P fluxes and to assess the taxon-spe-cific response of aquatic microorganisms to fluctuating Pi con-centrations. This approach was developed primarily using sizefractionation with different membrane porosities (e.g.,Nausch et al. 2004; Tanaka et al. 2004; Flaten et al. 2005;Duhamel et al. 2007; Nowlin et al. 2007). However, intercom-parisons between studies are challenging because of the arbi-trary choice of pore sizes and membrane types, and such Pi
uptake measurements suffer from overlapping in consecutive
Improved methodology to measure taxon-specific phosphateuptake in live and unfiltered samplesAgathe Talarmin1,2,3*, France Van Wambeke1, Solange Duhamel4, Philippe Catala2,3, Thierry Moutin5, and PhilippeLebaron2,31Laboratoire de Microbiologie, Géochimie, et Ecologie Marines, UMR INSU/CNRS 6117, Université de la Méditerranée, Campusde Luminy, Case 901, F-13288 Marseille, Cedex 9, France2UPMC Univ Paris 06, Laboratoire ARAGO - Observatoire Océanologique, F-66651 Banyuls/mer, France3CNRS, UMR 7621, LOMIC, Observatoire Océanologique, F-66651 Banyuls/mer, France4Department of Oceanography, Center for Microbial Oceanography: Research and Education (C-MORE) and School of Oceanand Earth Science and Technology (SOEST), University of Hawaii, Honolulu, HI 96822, USA5Laboratoire d’Océanographie Physique et Biogéochimique, UMR CNRS 6535, Université de la Méditerranée, Campus deLuminy, F-13288 Marseille, Cedex 9, France
AbstractMicroorganisms play a major role in the marine phosphate biogeochemical cycle but the relative contribution
of picoplanktonic groups is not well understood. Previous studies have shown that combining uptake mea-surements of radiolabeled dissolved inorganic phosphate (Pi) substrate with cell sorting by flow cytometry is apowerful tool for the assessment of Pi fluxes at the cell-specific level. Nevertheless, using 33P to trace Pi uptake, weshow that treatments involving fixation and filtration of the sorted groups (i.e., heterotrophic prokaryotes,Synechococcus and piconanophytoeukaryotes) induce leakage of radioactive Pi (up to 50% of the signal), resultingin a sizeable underestimation of the taxon-specific Pi uptake. We suggest an alternative protocol, which signifi-cantly reduces this bias. Using this optimized protocol, the samples were treated with an excess of nonradioac-tive Pi to stop the incubation and sorted fractions were directly collected in microtubes for radioactivity count-ing, avoiding signal loss due to filtration. Sorted groups were strongly and differently impacted by fixation (0.5%PFA), with the exception of Synechococcus cells, which showed once a 10% lower signal in samples treated withthe previously used protocols compared with samples treated with ours. Based on the integrity of the live sortedcells, our improved protocol provides reproducible and accurate estimations of the taxon-specific Pi uptake (≤ 11%variation on cellular uptake rates, sd/average, n = 69). It was successfully applied to P-depleted oligotrophic sea-water samples from the Mediterranean and will allow a comparison of taxon-specific uptake rates between sites.
*Corresponding author: E-mail: [email protected]
AcknowledgmentsWe thank C. Tricoire from the Oceanological Observatory in Banyuls-
sur-Mer (France), the crew of the R/V Nereis II (CNRS/INSU/UPMC) forsampling at the MOLA station. We are grateful to R. Mackie-Arnaud andJ. M. Brown for the English improvements. This methodological devel-opment was conducted in the framework of the BOUM project(Biogeochemistry from the Oligotrophic to UltraoligotrophicMediterranean) supported by the LEFE-CYBER (Les Enveloppes Fluides etL’Environnement) national program and the SESAME European pro-gram. Part of this work was funded by the French Research andEducation Council.
DOI 10.4319/lom.2011.9.443
Limnol. Oceanogr.: Methods 9, 2011, 443–453© 2011, by the American Society of Limnology and Oceanography, Inc.
LIMNOLOGYand
OCEANOGRAPHY: METHODS
size-classes. This lack of specificity may lead to inaccurate esti-mations, particularly in oligotrophic environments wheresmall-sized organisms dominate both autotrophic and het-erotrophic compartments of the food web (Cotner and Bid-danda 2002).
Flow cytometric cell sorting of radiolabeled samples is apromising tool to better characterize taxon-specific activities,like in the measurement of Pi uptake at the group level(Zubkov et al. 2007; Larsen et al. 2008; Casey et al. 2009;Michelou et al. 2011). These authors reported a non-negligibleloss of radioactive signal after sample fixation, which is com-monly used to stop uptake of radiolabeled compounds.
In the present study, we provide an in-depth investigation ofradioactive signal losses due to fixation and introduce an alter-native protocol to measure taxon-specific Pi uptake in naturalsamples that significantly minimizes signal loss. We also com-pare our revised protocol with existing ones, exposing the com-bined impact of fixation and filtration on the measurements.Methodological aspects that have not been highly documentedthus far are developed, such as the preparation and values ofblanks, and storage experiments of labeled samples.
The method presented here leads to a more accurate char-acterization of the taxon-specific Pi uptake, thus reducinguncertainties regarding the Pi fluxes through the microbialcompartments of the surface ocean. This protocol is sensitive,reproducible, cost- and time-efficient, and finally, is easy touse on fresh samples both onboard and in the laboratory.
Materials and proceduresSample collection
Most of the tests were conducted on coastal marine seawa-ter samples collected during March 2008 from the olig-otrophic Bay of Banyuls-sur-mer, France (NW MediterraneanSea, Médernach et al. 2001; Grémare et al. 2003). Seawater waseasily accessible and used immediately after sampling. How-ever, additional tests were run on samples from MOLA andSOLA stations or on those acquired during the BOUM cruise inthe Mediterranean Sea. In this case, sample origin is specifiedin the text and in the legends.Pi analysis
Samples for dissolved inorganic phosphate analysis werefiltered on combusted GF/F membrane after sampling, beforebeing stored frozen (–20°C) in polyethylene bottles and beinganalyzed according to Tréguer and Le Corre (1975) on a Skalarautoanalyzer, with a detection limit of 20 nM.Pi uptake
Fresh seawater samples (10 mL) were transferred into acid-washed and sample-rinsed polycarbonate flasks and were thenspiked with 1.37 105 Bq of a carrier-free [33P]-orthophosphoricacid solution (Perkin Elmer, equivalent to a 25 pM final Pi con-centration added). Incubations were carried out at room tem-perature (20 ± 2°C) for 1 h, and stopped by the addition of 100µL of a 10 mM non-radioactive KH2PO4 solution (i.e., coldchase, 100 µM final concentration). Four milliliters of each
sample (blanks and triplicates) was stored at 4°C for a shorttime, in the dark, and reserved for bulk Pi uptake determina-tion within 1 h after cold chase. Gentle filtration (< 100mbars) was applied through a 0.2 µm porosity polycarbonatemembrane (25 mm diameter) positioned on a GF/C filter thathad been soaked with a saturated solution of KH2PO4, using a12-position Millipore manifold. Once no liquid remained onthe membranes, pressure was increased to 600 mbars for 5 s toeliminate unincorporated 33P. For clarity, this filtrationmethod will be referred to as “live filtration procedure.” Fivemilliliters of Phase Combining System scintillation cocktail(PCS, GE Healthcare) were added to 6.5 mL polyethylene scin-tillation vials containing the dry filters. Radioactivity wascounted using a scintillation counter (Beckman CoulterLS6500).
The leftover 6 mL samples were kept at 4°C in the dark forcell sorting analyses, which started within less than 30 minafter cold chase (see “Cell sorting”).Sample blank
As a control for nonbiological assimilation of radiolabeledPi, an excess of a cold KH2PO4 solution was added to a dupli-cated seawater sample at a final concentration of 100 µM, 15min before the radioactive spiking. Replicated controls werethen sorted for each group and their average blank value wassystematically subtracted from the signal measured in regu-lar samples (in dpm cell–1). For the bulk activity determina-tion, the blank value was subtracted from the whole signal(in dpm mL–1).Flow cytometric analyses
Fluorescent beads (1.002 µm; Polysciences Europe) weresystematically added to the samples before analysis as aninternal standard, for both sample enumeration and cell sort-ing. Three cytometric groups were analyzed (Fig. 1): het-erotrophic prokaryotes (Hprok), Synechococcus (Syn), whereaspicophytoeukaryotes and the few nanophytoeukaryotes weregathered as 1 group (Pic). Prochlorococcus cyanobacteria wereabsent from coastal and offshore samples at the time testswere conducted.
Enumeration of autotrophic and heterotrophic organismsThree milliliters of the original seawater sample was fixed
with formaldehyde (final concentration 2%) immediatelyafter sampling. Samples were kept at 4°C for less than 12 hbefore analysis using a FACSCalibur flow cytometer (BectonDickinson) equipped with an air-cooled argon laser (488 nm,15 mW). Autotrophic cells were enumerated in 2-mL subsam-ples according to Marie et al. (2000). Syn were discriminatedfrom other autotrophic cells (Pic) using their orange fluores-cence signal (585 ± 21 nm) originating from the phycoery-thrin pigment (Fig. 1A).
Hprok cell enumeration was processed on 1 mL fixed sub-samples. The nucleic acid dye SYBR Green I (Invitrogen –Molecular Probes) was added at 0.025% (vol/vol) final con-centration and incubated for 15 min at room temperature andin the dark before FCM analysis (Lebaron et al. 1998; Ober-
Talarmin et al. P uptake of live picoplankton
444
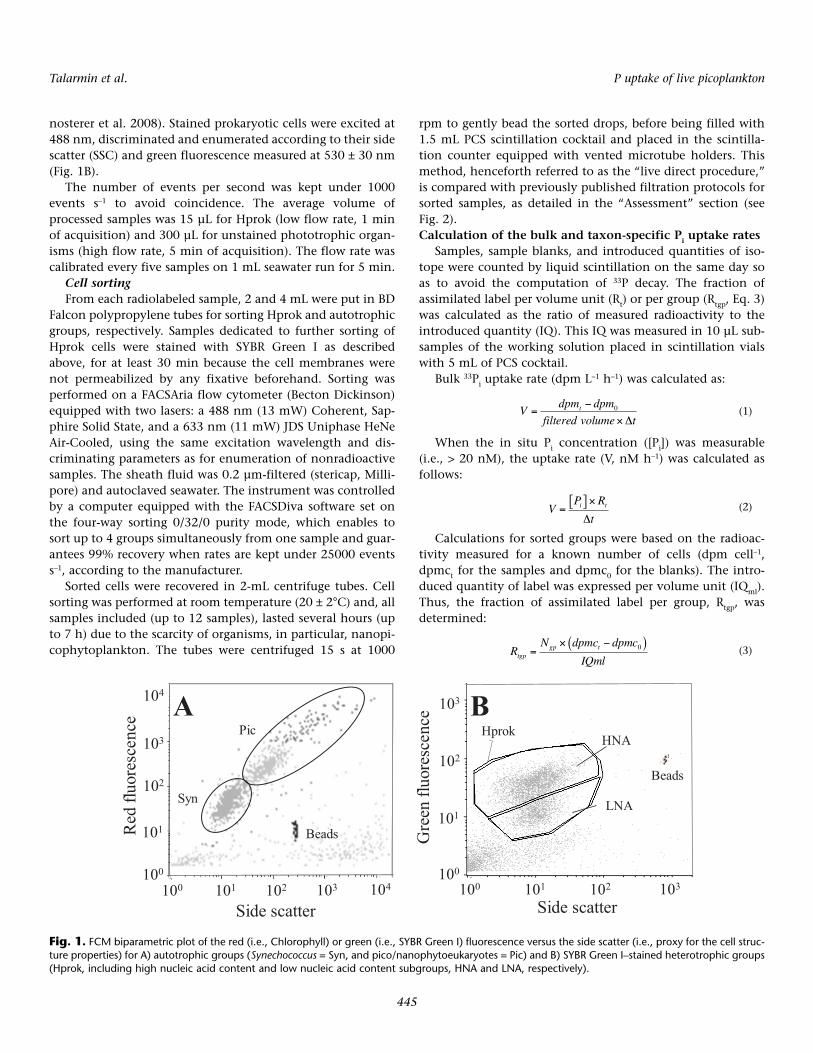
nosterer et al. 2008). Stained prokaryotic cells were excited at488 nm, discriminated and enumerated according to their sidescatter (SSC) and green fluorescence measured at 530 ± 30 nm(Fig. 1B).
The number of events per second was kept under 1000events s–1 to avoid coincidence. The average volume ofprocessed samples was 15 µL for Hprok (low flow rate, 1 minof acquisition) and 300 µL for unstained phototrophic organ-isms (high flow rate, 5 min of acquisition). The flow rate wascalibrated every five samples on 1 mL seawater run for 5 min.
Cell sortingFrom each radiolabeled sample, 2 and 4 mL were put in BD
Falcon polypropylene tubes for sorting Hprok and autotrophicgroups, respectively. Samples dedicated to further sorting ofHprok cells were stained with SYBR Green I as describedabove, for at least 30 min because the cell membranes werenot permeabilized by any fixative beforehand. Sorting wasperformed on a FACSAria flow cytometer (Becton Dickinson)equipped with two lasers: a 488 nm (13 mW) Coherent, Sap-phire Solid State, and a 633 nm (11 mW) JDS Uniphase HeNeAir-Cooled, using the same excitation wavelength and dis-criminating parameters as for enumeration of nonradioactivesamples. The sheath fluid was 0.2 µm-filtered (stericap, Milli-pore) and autoclaved seawater. The instrument was controlledby a computer equipped with the FACSDiva software set onthe four-way sorting 0/32/0 purity mode, which enables tosort up to 4 groups simultaneously from one sample and guar-antees 99% recovery when rates are kept under 25000 eventss–1, according to the manufacturer.
Sorted cells were recovered in 2-mL centrifuge tubes. Cellsorting was performed at room temperature (20 ± 2°C) and, allsamples included (up to 12 samples), lasted several hours (upto 7 h) due to the scarcity of organisms, in particular, nanopi-cophytoplankton. The tubes were centrifuged 15 s at 1000
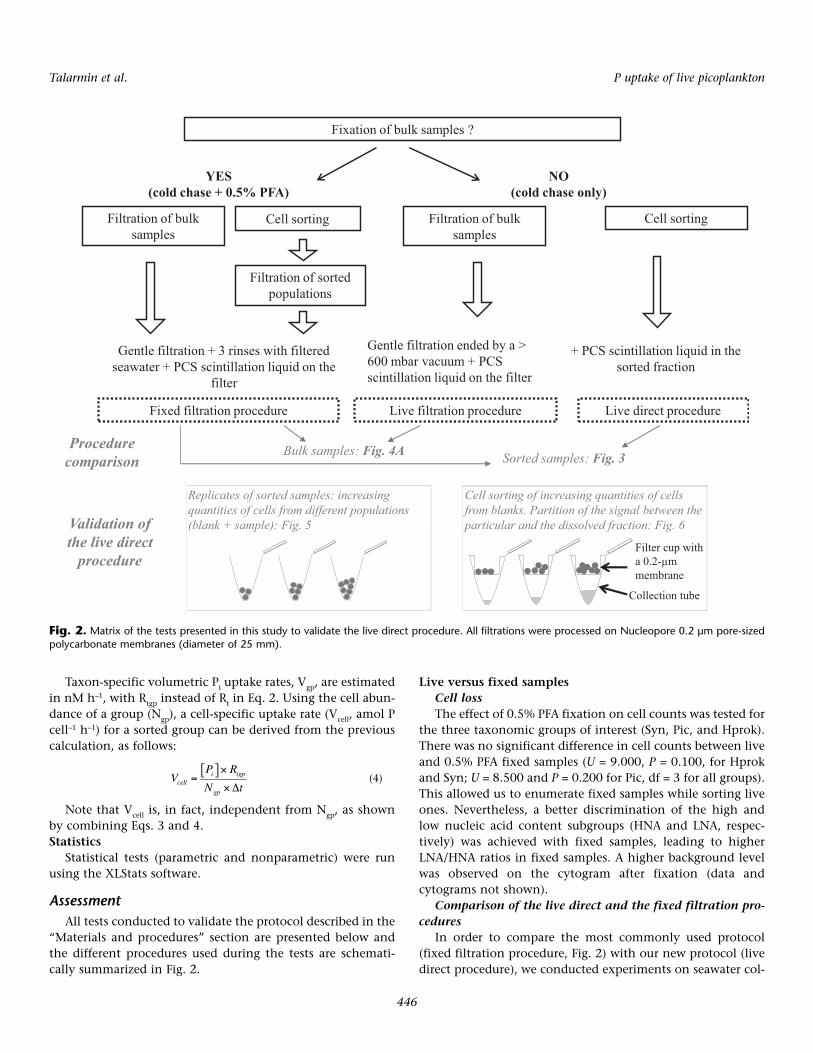
rpm to gently bead the sorted drops, before being filled with1.5 mL PCS scintillation cocktail and placed in the scintilla-tion counter equipped with vented microtube holders. Thismethod, henceforth referred to as the “live direct procedure,”is compared with previously published filtration protocols forsorted samples, as detailed in the “Assessment” section (seeFig. 2).Calculation of the bulk and taxon-specific Pi uptake rates
Samples, sample blanks, and introduced quantities of iso-tope were counted by liquid scintillation on the same day soas to avoid the computation of 33P decay. The fraction ofassimilated label per volume unit (Rt) or per group (Rtgp, Eq. 3)was calculated as the ratio of measured radioactivity to theintroduced quantity (IQ). This IQ was measured in 10 µL sub-samples of the working solution placed in scintillation vialswith 5 mL of PCS cocktail.
Bulk 33Pi uptake rate (dpm L–1 h–1) was calculated as:
(1)
When the in situ Pi concentration ([Pi]) was measurable(i.e., > 20 nM), the uptake rate (V, nM h–1) was calculated asfollows:
(2)
Calculations for sorted groups were based on the radioac-tivity measured for a known number of cells (dpm cell–1,dpmct for the samples and dpmc0 for the blanks). The intro-duced quantity of label was expressed per volume unit (IQml).Thus, the fraction of assimilated label per group, Rtgp, wasdetermined:
(3)
Vdpm dpm
filtered volume tt=−
×
0
Δ
VP R
ti t=
[ ] ×
Δ
RN dpmc dpmc
IQmltgp
gp t=
× −( )0
Talarmin et al. P uptake of live picoplankton
445
HNA
LNA
103
102
101
100
103102101100
Side scatter
Gre
en fl
uore
scen
ce
Beads
Hprok
Red
fluor
esce
nce
Side scatter
103
102
101
100
103102101100
104
104
Syn
Pic
Beads
BAHprok
HNA
LNA
Beads
Fig. 1. FCM biparametric plot of the red (i.e., Chlorophyll) or green (i.e., SYBR Green I) fluorescence versus the side scatter (i.e., proxy for the cell struc-ture properties) for A) autotrophic groups (Synechococcus = Syn, and pico/nanophytoeukaryotes = Pic) and B) SYBR Green I–stained heterotrophic groups(Hprok, including high nucleic acid content and low nucleic acid content subgroups, HNA and LNA, respectively).
Taxon-specific volumetric Pi uptake rates, Vgp, are estimatedin nM h–1, with Rtgp instead of Rt in Eq. 2. Using the cell abun-dance of a group (Ngp), a cell-specific uptake rate (Vcell, amol Pcell–1 h–1) for a sorted group can be derived from the previouscalculation, as follows:
(4)
Note that Vcell is, in fact, independent from Ngp, as shownby combining Eqs. 3 and 4.Statistics
Statistical tests (parametric and nonparametric) were runusing the XLStats software.
AssessmentAll tests conducted to validate the protocol described in the
“Materials and procedures” section are presented below andthe different procedures used during the tests are schemati-cally summarized in Fig. 2.
Live versus fixed samplesCell lossThe effect of 0.5% PFA fixation on cell counts was tested for
the three taxonomic groups of interest (Syn, Pic, and Hprok).There was no significant difference in cell counts between liveand 0.5% PFA fixed samples (U = 9.000, P = 0.100, for Hprokand Syn; U = 8.500 and P = 0.200 for Pic, df = 3 for all groups).This allowed us to enumerate fixed samples while sorting liveones. Nevertheless, a better discrimination of the high andlow nucleic acid content subgroups (HNA and LNA, respec-tively) was achieved with fixed samples, leading to higherLNA/HNA ratios in fixed samples. A higher background levelwas observed on the cytogram after fixation (data andcytograms not shown).
Comparison of the live direct and the fixed filtration pro-cedures
In order to compare the most commonly used protocol(fixed filtration procedure, Fig. 2) with our new protocol (livedirect procedure), we conducted experiments on seawater col-
VP R
N tcell
i tgp
gp
=[ ]×
× Δ
Talarmin et al. P uptake of live picoplankton
446
Filtration of bulk samples
+ PCS scintillation liquid in the sorted fraction
Gentle filtration ended by a > 600 mbar vacuum + PCS scintillation liquid on the filter
Gentle filtration + 3 rinses with filtered seawater + PCS scintillation liquid on the
filter
Fixation of bulk samples ?
YES (cold chase + 0.5% PFA)
NO (cold chase only)
Fixed filtration procedure Live direct procedure Live filtration procedure
Cell sorting Filtration of bulk samples
Cell sorting
Filtration of sorted populations
Bulk samples: Fig. 4A Sorted samples: Fig. 3
Validation of the live direct
procedure
Replicates of sorted samples: increasing quantities of cells from different populations (blank + sample): Fig. 5
Cell sorting of increasing quantities of cells from blanks. Partition of the signal between the particular and the dissolved fraction: Fig. 6
Procedure comparison
Filter cup with a 0.2-µm membrane
Collection tube
Fig. 2. Matrix of the tests presented in this study to validate the live direct procedure. All filtrations were processed on Nucleopore 0.2 µm pore-sizedpolycarbonate membranes (diameter of 25 mm).
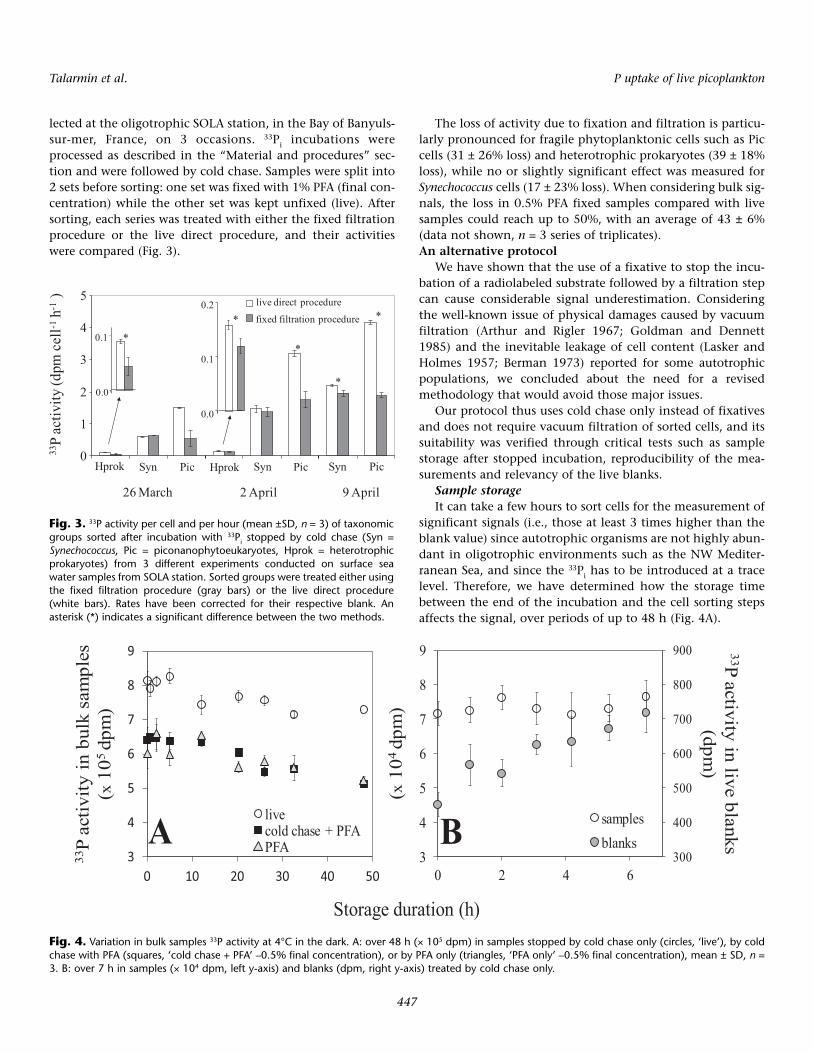
lected at the oligotrophic SOLA station, in the Bay of Banyuls-sur-mer, France, on 3 occasions. 33Pi incubations wereprocessed as described in the “Material and procedures” sec-tion and were followed by cold chase. Samples were split into2 sets before sorting: one set was fixed with 1% PFA (final con-centration) while the other set was kept unfixed (live). Aftersorting, each series was treated with either the fixed filtrationprocedure or the live direct procedure, and their activitieswere compared (Fig. 3).
The loss of activity due to fixation and filtration is particu-larly pronounced for fragile phytoplanktonic cells such as Piccells (31 ± 26% loss) and heterotrophic prokaryotes (39 ± 18%loss), while no or slightly significant effect was measured forSynechococcus cells (17 ± 23% loss). When considering bulk sig-nals, the loss in 0.5% PFA fixed samples compared with livesamples could reach up to 50%, with an average of 43 ± 6%(data not shown, n = 3 series of triplicates).An alternative protocol
We have shown that the use of a fixative to stop the incu-bation of a radiolabeled substrate followed by a filtration stepcan cause considerable signal underestimation. Consideringthe well-known issue of physical damages caused by vacuumfiltration (Arthur and Rigler 1967; Goldman and Dennett1985) and the inevitable leakage of cell content (Lasker andHolmes 1957; Berman 1973) reported for some autotrophicpopulations, we concluded about the need for a revisedmethodology that would avoid those major issues.
Our protocol thus uses cold chase only instead of fixativesand does not require vacuum filtration of sorted cells, and itssuitability was verified through critical tests such as samplestorage after stopped incubation, reproducibility of the mea-surements and relevancy of the live blanks.
Sample storageIt can take a few hours to sort cells for the measurement of
significant signals (i.e., those at least 3 times higher than theblank value) since autotrophic organisms are not highly abun-dant in oligotrophic environments such as the NW Mediter-ranean Sea, and since the 33Pi has to be introduced at a tracelevel. Therefore, we have determined how the storage timebetween the end of the incubation and the cell sorting stepsaffects the signal, over periods of up to 48 h (Fig. 4A).
Talarmin et al. P uptake of live picoplankton
447
0
1
2
3
4
5
Hprok PicSyn Syn Pic Syn Pic
live direct procedure
fixed filtration procedure
0.0
0.1
Hprok
0.0
0.1
0.2
26 March 2 April 9 April
33P
activ
ity(d
pmce
ll-1h-1
)
**
*
*
*
Fig. 3. 33P activity per cell and per hour (mean ±SD, n = 3) of taxonomicgroups sorted after incubation with 33Pi stopped by cold chase (Syn =Synechococcus, Pic = piconanophytoeukaryotes, Hprok = heterotrophicprokaryotes) from 3 different experiments conducted on surface seawater samples from SOLA station. Sorted groups were treated either usingthe fixed filtration procedure (gray bars) or the live direct procedure(white bars). Rates have been corrected for their respective blank. Anasterisk (*) indicates a significant difference between the two methods.
3
4
5
6
7
8
9
0 10 20 30 40 50
livecold chase + PFAPFA
Storage duration (h)
33P
activ
ityin
bul
ksa
mpl
es(x
105 dp
m)
BA
33P activityin live blanks
(dpm)
300
400
500
600
700
800
900
3
4
5
6
7
8
9
0 2 4 6
samplesblanks
(x10
4 dp
m)
Fig. 4. Variation in bulk samples 33P activity at 4°C in the dark. A: over 48 h (× 105 dpm) in samples stopped by cold chase only (circles, ‘live’), by coldchase with PFA (squares, ‘cold chase + PFA’ –0.5% final concentration), or by PFA only (triangles, ‘PFA only’ –0.5% final concentration), mean ± SD, n =3. B: over 7 h in samples (× 104 dpm, left y-axis) and blanks (dpm, right y-axis) treated by cold chase only.
The effect of storage at 4°C in the dark was tested on 30 mLsamples and incubation was stopped either by cold chase only,by cold chase followed by 0.5% PFA fixation, or by a 0.5% PFAfixation only (Fig. 4A). Three milliliter subsamples were fil-tered at different times after cold chase. Fixed samples weresubjected to the fixed filtration procedure (Fig. 2), whereas livesamples were treated with the live filtration procedure. Activ-ities in both 0.5% PFA fixation treatments (PFA only or coldchase + PFA) were not significantly different (F = 1.167, α =0.01, df1 = 8, df2 = 8, P = 0.833), therefore data were pooled (n= 6 at each time point) for further description and comparisonwith the live filtration procedure. Immediately following theend of incubation (0 h, Fig. 4A), the signal measured in fixedbulk series was significantly lower (24%, t = 7.589, df = 4, P <0.001) than in the live series. This result underlines the imme-diate effect of PFA on signal loss. After 48 h storage, signal losswas 10% in the live series whereas it was significantly higherin the fixed samples (20% and 13% for the cold chase + PFAand the PFA series, respectively). The storage of live samples isthus more reliable in terms of signal conservation over 48 hthan is the storage of fixed samples.
Considering that the use of PFA leads to high signal loss,this test was conducted again on live samples only, for ashorter duration and shorter time intervals (7 h, Fig. 4B). Inthe samples, radioactivity did not vary significantly (F = 1.610,df = 6, P = 0.168) over the 7 h following cold chase (Fig. 4B),suggesting that within this period there was no loss of 33Pi sig-nal. We also focused in this test on the time variability of thelive blank signals. In spite of a significant signal increase overtime (63%, F = 15.92, df = 6, P < 0.10–4), blank signalsremained low over 7 h storage (452 to 719 dpm, Fig. 4B), rep-resenting less than 1% of the lowest sample activity. Blank sig-nal can thus be considered as a background signal. A delay of7 h was the maximum storage time necessary for processingsamples from the oligotrophic NW Mediterranean, and so, aslong as this time is respected, the activity did not change sig-nificantly. For longer periods (up to 48 h), a loss is observedbut values are still reasonable and quantifiable. Using livesamples allowed optimal conservation of the signal over 7 h
with no significant change and with the lowest loss over 48 h,when compared with other treatments involving a fixative.
ReproducibilityThe reproducibility of Pi uptake measurement was assessed
on live unfiltered sorted samples in order to check the relia-bility of the method and to avoid, if possible, the need forreplication in further work (Table 1). Variability is comparedwith results obtained in fixed sorted samples after the fixed fil-tration procedure.
The mean coefficient of variation (CV) of the 33P uptakerates was significantly higher when samples were treated withthe fixed filtration procedure (P = 0.033, Table 1), and bothmethods were evaluated using comparable ranges of sortedcells and uptake rates. These results show that the live directprocedure described in this study provides more reproduciblevalues than the fixed filtration procedure for measuringtaxon-specific Pi uptake rates. We have thus applied this opti-mized method based on live and unfiltered sorted fractions toassess Pi uptake from natural samples.
Blank preparationIn previous methods, blanks corresponded to samples with
addition of a reagent (e.g., HgCl2, trichloroacetic acid, PFA)that killed cells before addition of the radioactive isotope(Duhamel et al. 2006; Tanaka et al. 2006; Larsen et al. 2008).To compare live blanks with the killed blanks cited in the lit-erature, triplicate 10 mL samples were treated either with 4%trichloracetic acid (Tanaka et al. 2006; Larsen et al. 2008),HgCl2 (20 mg L–1 final concentration, Kattner 1999; Moutin etal. 2005), or with 1% PFA final concentration (Zubkov et al.2007). Only bulk unsorted samples were used in this test: theywere treated either with the live filtration procedure or withthe fixed filtration procedure, for live and killed blanks,respectively. Fifteen minutes after the addition of the testedreagents, samples were spiked with 33Pi. Cold chase was per-formed in all samples 1 h after the label spiking, and was fol-lowed by filtration. No significant difference was foundbetween live blanks obtained with an excess of Pi and blankstreated with a fixative (K = 8.007, df = 3, P = 0.046, data notshown). In this experiment, the blanks obtained by the differ-
Talarmin et al. P uptake of live picoplankton
448
Table 1. Variability of the 33Pi uptake rates (dpm cell–1 h–1) measured for different samples and groups treated with the live direct pro-cedure or the fixed filtration procedure: range of the quantity of sorted cells and measured uptake rates, mean and range of coefficientsof variation (CV) calculated on n triplicated values.
N 33P uptake rates(cells mL–1) (dpm cell–1 h–1) CV (%)
Material Procedure n Min Max Min Max Mean Min Max
sorted Syn direct live 24 1500 20000 0.0024 1.137 4.9 1.03 11.33sorted Pic direct live 27 1500 15000 0.0022 4.173 6.1 0.87 20.83sorted Hprok direct live 18 50000 500000 0.0010 0.121 11.0 3.23 30.22sorted Syn fixed filtration 9 1000 12000 0.0138 1.046 20.8 4.94 45.29sorted Pic fixed filtration 9 1000 9000 0.0228 1.110 11.7 3.96 20.69sorted Hprok fixed filtration 7 25700 400000 0.0053 0.141 15.4 2.74 28.13
ent treatments represented less than 2% of the signal mea-sured in the samples.
Live blanks submitted to early cold chase 15 min before theradioactive isotope addition were also used in our protocolbecause blank values were low and were comparable to valuesmeasured in killed blanks, and finally because the scatter-grams visualized from samples and blanks were similar.
In the following tests, only the live direct procedure isinvolved to check the validity of our protocol.
Blank-to-signal valuesData were used to test the variability among samples of the
blank-to-signal ratio (Table 2). The blank-to-signal ratio wasgenerally lower for bulk activity than for sorted groupsbecause of the nonincorporated radioactivity recovered in themicro tubes (see next paragraph). For Hprok sorts, blank-to-signal ratio reached up to 0.35 (Table 2).
These results obtained on samples from various environ-ments show that blank values are variable but that they repre-sent, on average, less than 7% and 17% of the signals mea-sured in regular samples from autotrophic and heterotrophicsorted samples, respectively.
Due to their high variability, these results emphasize thenecessity of measuring a blank value for each sorted group. AsHprok group was always the fraction collected that wasaccompanied by the largest volume of liquid, we further inves-tigated the origin of the blank signal and its evolution follow-ing increasing numbers of cells sorted.
Origin of the blank signal in the live direct procedure:In the present protocol, scintillation cocktail was added
directly to the sorted fractions, which were composed of up to300 µL of a mixture of sorted cells and liquid. We chose thePCS scintillation cocktail because of its potential to mix withup to 50% saline solutions (e.g., seawater).
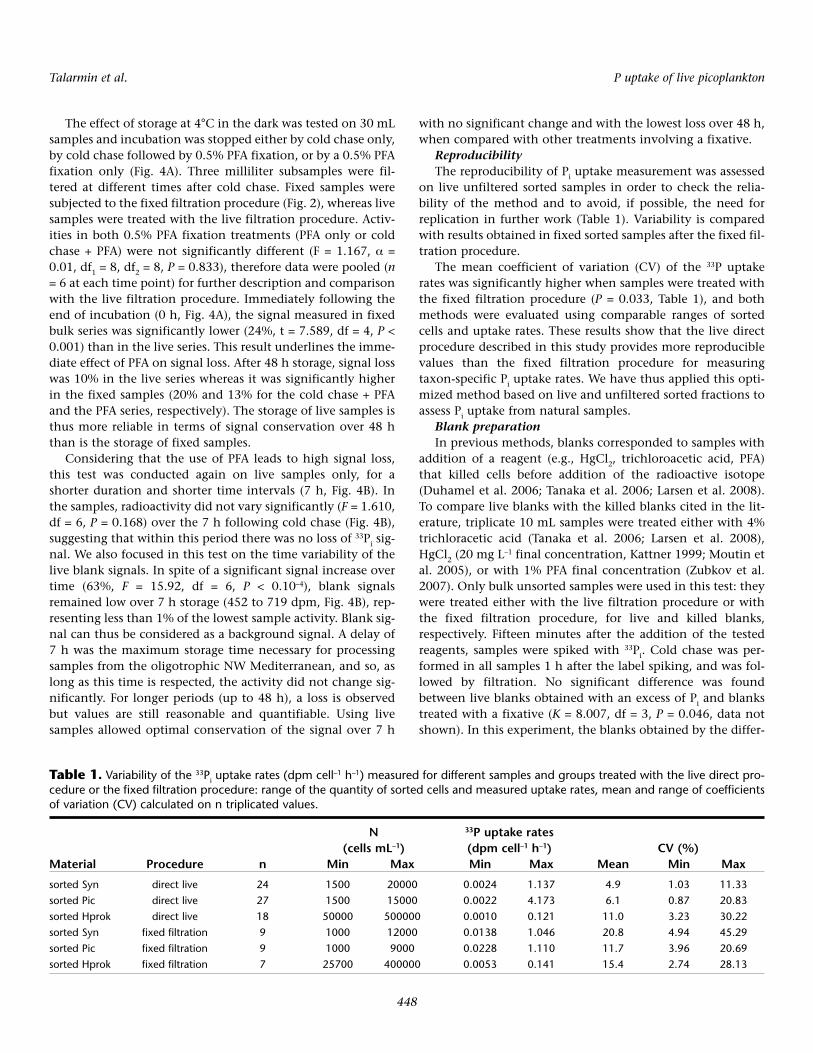
Each sorted fraction is composed of drops containing thetargeted cells surrounded by an undetermined volume of liq-uid (sample seawater and sheath fluid). Since the radioactivityin live blanks increased with the number of sorted cells(Fig. 5), the potential source(s) of nonincorporated radioactiv-ity recovered in the sorted fractions had to be quantified.
For the next experiment, Hprok was chosen because of itshigher blank-to-signal values compared to other groups, andalso because sorting this group leads to the recovery of thehighest volumes of liquid. Increasing numbers of Hprok cellsfrom live blanks were sorted in triplicate. To separate the par-ticulate from the dissolved fractions, sorted cells were recov-ered in 2 mL micro tubes (Ultrafree MC, Millipore) containinga filter cup equipped with an inner 0.22 µm Durapore mem-brane (cf. experimental design, Fig. 2). After 15 to 60 s of cen-trifugation at 1000 rpm, the filter cup was removed and wasinserted into a scintillation vial with PCS cocktail to deter-mine the particulate fraction activity.
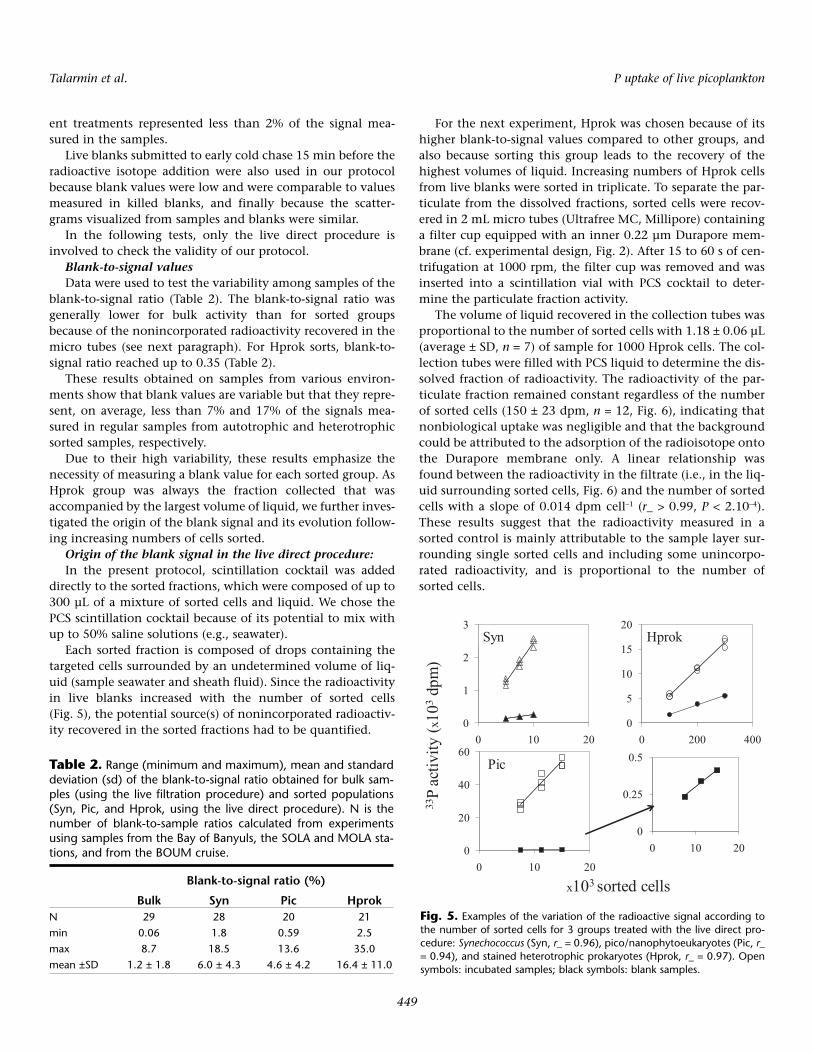
The volume of liquid recovered in the collection tubes wasproportional to the number of sorted cells with 1.18 ± 0.06 µL(average ± SD, n = 7) of sample for 1000 Hprok cells. The col-lection tubes were filled with PCS liquid to determine the dis-solved fraction of radioactivity. The radioactivity of the par-ticulate fraction remained constant regardless of the numberof sorted cells (150 ± 23 dpm, n = 12, Fig. 6), indicating thatnonbiological uptake was negligible and that the backgroundcould be attributed to the adsorption of the radioisotope ontothe Durapore membrane only. A linear relationship wasfound between the radioactivity in the filtrate (i.e., in the liq-uid surrounding sorted cells, Fig. 6) and the number of sortedcells with a slope of 0.014 dpm cell–1 (r_ > 0.99, P < 2.10–4).These results suggest that the radioactivity measured in asorted control is mainly attributable to the sample layer sur-rounding single sorted cells and including some unincorpo-rated radioactivity, and is proportional to the number ofsorted cells.
Talarmin et al. P uptake of live picoplankton
449
Table 2. Range (minimum and maximum), mean and standarddeviation (sd) of the blank-to-signal ratio obtained for bulk sam-ples (using the live filtration procedure) and sorted populations(Syn, Pic, and Hprok, using the live direct procedure). N is thenumber of blank-to-sample ratios calculated from experimentsusing samples from the Bay of Banyuls, the SOLA and MOLA sta-tions, and from the BOUM cruise.
Blank-to-signal ratio (%)
Bulk Syn Pic HprokN 29 28 20 21min 0.06 1.8 0.59 2.5max 8.7 18.5 13.6 35.0mean ±SD 1.2 ± 1.8 6.0 ± 4.3 4.6 ± 4.2 16.4 ± 11.0
33P
activ
ity(x
103
dpm
)
x103 sorted cells
0
20
40
60
0 10 20
0
5
10
15
20
0 200 4000
1
2
3
0 10 20
Pic
HprokSyn
0
0.25
0.5
0 10 20
Fig. 5. Examples of the variation of the radioactive signal according tothe number of sorted cells for 3 groups treated with the live direct pro-cedure: Synechococcus (Syn, r_ = 0.96), pico/nanophytoeukaryotes (Pic, r_= 0.94), and stained heterotrophic prokaryotes (Hprok, r_ = 0.97). Opensymbols: incubated samples; black symbols: blank samples.
This test proves that the nonbiological activity obtainedin samples prepared according to our new protocol is duesolely to the dissolved fraction and is correctly measured inthe live blanks.
ApplicationWe applied our improved method on triplicate samples
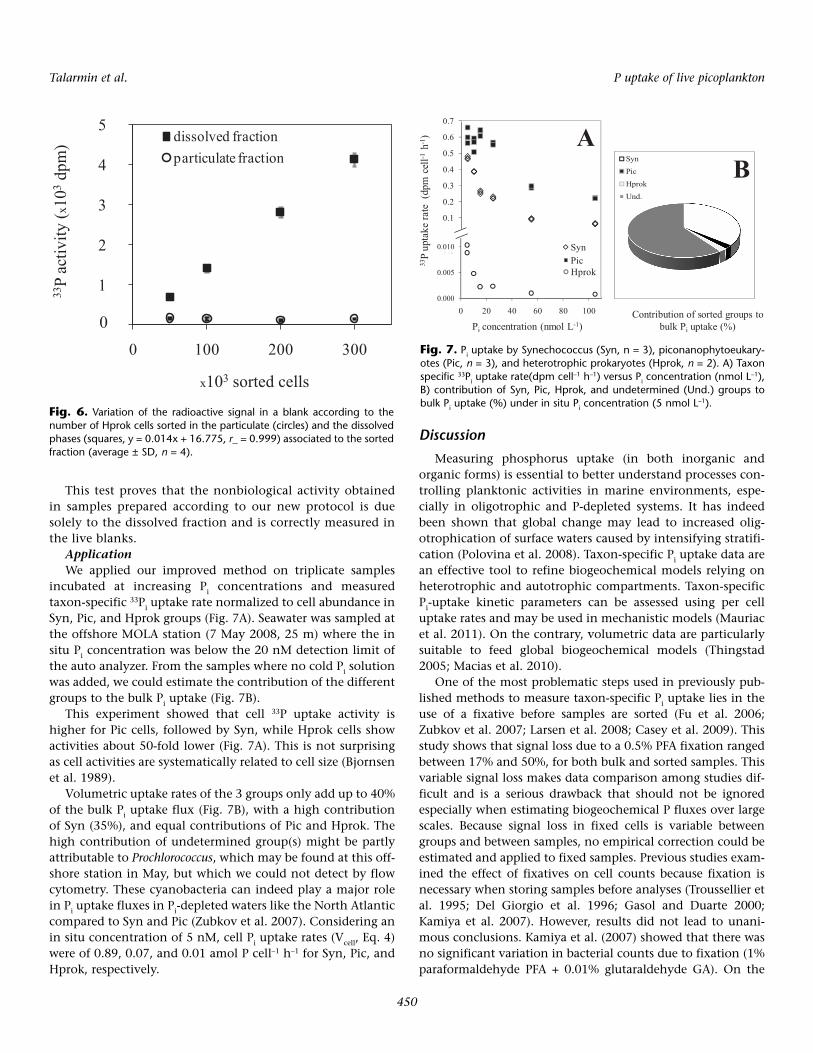
incubated at increasing Pi concentrations and measuredtaxon-specific 33Pi uptake rate normalized to cell abundance inSyn, Pic, and Hprok groups (Fig. 7A). Seawater was sampled atthe offshore MOLA station (7 May 2008, 25 m) where the insitu Pi concentration was below the 20 nM detection limit ofthe auto analyzer. From the samples where no cold Pi solutionwas added, we could estimate the contribution of the differentgroups to the bulk Pi uptake (Fig. 7B).
This experiment showed that cell 33P uptake activity ishigher for Pic cells, followed by Syn, while Hprok cells showactivities about 50-fold lower (Fig. 7A). This is not surprisingas cell activities are systematically related to cell size (Bjornsenet al. 1989).
Volumetric uptake rates of the 3 groups only add up to 40%of the bulk Pi uptake flux (Fig. 7B), with a high contributionof Syn (35%), and equal contributions of Pic and Hprok. Thehigh contribution of undetermined group(s) might be partlyattributable to Prochlorococcus, which may be found at this off-shore station in May, but which we could not detect by flowcytometry. These cyanobacteria can indeed play a major rolein Pi uptake fluxes in Pi-depleted waters like the North Atlanticcompared to Syn and Pic (Zubkov et al. 2007). Considering anin situ concentration of 5 nM, cell Pi uptake rates (Vcell, Eq. 4)were of 0.89, 0.07, and 0.01 amol P cell–1 h–1 for Syn, Pic, andHprok, respectively.
Discussion
Measuring phosphorus uptake (in both inorganic andorganic forms) is essential to better understand processes con-trolling planktonic activities in marine environments, espe-cially in oligotrophic and P-depleted systems. It has indeedbeen shown that global change may lead to increased olig-otrophication of surface waters caused by intensifying stratifi-cation (Polovina et al. 2008). Taxon-specific Pi uptake data arean effective tool to refine biogeochemical models relying onheterotrophic and autotrophic compartments. Taxon-specificPi-uptake kinetic parameters can be assessed using per celluptake rates and may be used in mechanistic models (Mauriacet al. 2011). On the contrary, volumetric data are particularlysuitable to feed global biogeochemical models (Thingstad2005; Macias et al. 2010).
One of the most problematic steps used in previously pub-lished methods to measure taxon-specific Pi uptake lies in theuse of a fixative before samples are sorted (Fu et al. 2006;Zubkov et al. 2007; Larsen et al. 2008; Casey et al. 2009). Thisstudy shows that signal loss due to a 0.5% PFA fixation rangedbetween 17% and 50%, for both bulk and sorted samples. Thisvariable signal loss makes data comparison among studies dif-ficult and is a serious drawback that should not be ignoredespecially when estimating biogeochemical P fluxes over largescales. Because signal loss in fixed cells is variable betweengroups and between samples, no empirical correction could beestimated and applied to fixed samples. Previous studies exam-ined the effect of fixatives on cell counts because fixation isnecessary when storing samples before analyses (Troussellier etal. 1995; Del Giorgio et al. 1996; Gasol and Duarte 2000;Kamiya et al. 2007). However, results did not lead to unani-mous conclusions. Kamiya et al. (2007) showed that there wasno significant variation in bacterial counts due to fixation (1%paraformaldehyde PFA + 0.01% glutaraldehyde GA). On the
Talarmin et al. P uptake of live picoplankton
450
-
1
2
3
4
5
0 100 200 300
dissolved fractionparticulate fraction
33P
activ
ity (x
103 d
pm)
x103 sorted cells
0
Fig. 6. Variation of the radioactive signal in a blank according to thenumber of Hprok cells sorted in the particulate (circles) and the dissolvedphases (squares, y = 0.014x + 16.775, r_ = 0.999) associated to the sortedfraction (average ± SD, n = 4).
-0.1
0.0
0.1
0.2
0.3
0.4
0.5
0.6
0.7
Hprok
SynPic
0.000
0.005
0.010
0 20 40 60 80 100
33P
upta
kera
te (
dpm
cell-1
h-1)
Pi concentration (nmol L-1)
A
Contribution of sorted groups to bulk Pi uptake (%)
BSyn
Pic
Hprok
Und.
Fig. 7. Pi uptake by Synechococcus (Syn, n = 3), piconanophytoeukary-otes (Pic, n = 3), and heterotrophic prokaryotes (Hprok, n = 2). A) Taxonspecific 33Pi uptake rate(dpm cell
–1 h–1) versus Pi concentration (nmol L–1),
B) contribution of Syn, Pic, Hprok, and undetermined (Und.) groups tobulk Pi uptake (%) under in situ Pi concentration (5 nmol L
–1).
contrary, Troussellier et al. (1995) concluded that each fixative(formaldehyde FA, PFA, and GA, 2% final concentration) has adifferent effect on a given group, generally inducing a decreasein bacterial counts. We found no significant cell loss in fixedsamples (analyzed 1 h after fixation) as compared to live sam-ples. Thus, cell leakage, rather than cell loss, should explain theloss of radioactive signal after sample fixation. In Pi uptakestudies, sample fixation has often been controversial (Zubkovet al. 2007; Larsen et al. 2008) and our study demonstrates thereliability of an alternative protocol avoiding fixation.
By avoiding the fixation and filtration steps, the improvedprotocol presented here saves considerable costs due to mate-rials (e.g., filters, vials, cocktail) and radioactivity handling.Our methodology has been tested in a Mediterranean areathrough coastal and offshore sampling, and it works in thosePi-depleted (< 20 nM) surface and low-biomass oligotrophicwaters (comparable to the Sargasso Sea).
With the use of a single sample for the treatment of thebulk community and the sorted fractions, it is also possible tooptimize time by reducing the number of replicates or increas-ing the number of samples to process (e.g., more depths ortreatments). Taxon-specific Pi uptake rates measured in olig-otrophic samples with this optimized protocol are less affectedby methodological biases, and thus provided more accurateestimates.
Using this improved methodology, Pi uptake by phyto-planktonic eukaryotes might lead to higher values in environ-ment where it may have been underestimated due to cell leak-age. To assess Pi fluxes in a microbial planktonic foodweb, thenext methodological limit will be the feasibility of sortinglarge-sized and undamaged cells (e.g., flagellates, nano-micro-phytoplankton cells).
Comments and recommendationsWhen using the presented improved protocol, nonincor-
porated radioisotope present in the liquid surrounding eachsorted cell is recovered in the sorted fractions and is notremoved as with a filtration procedure. This signal needs to bequantified in a blank and subtracted from the activity of agiven group. To accurately measure taxon-specific Pi uptakerates, we recommend to systematically prepare blanks andsubstract its value to the corresponding group of interest.
Although by-sorting was shown to be insignificant in natu-ral communities from the Sargasso Sea (Zubkov et al. 2007),we recommend checking the by-sorting of heterotrophs alongwith autotrophs when starting a series of experiments, evenwhen using the highest purity level on the sorter. Using thelowest signals detected in sorted Hprok along our study andresults from Larsen et al. (2008: autotrophic to heterotrophicby-sorting ratio from 1.51 to 4.86), we evaluated the biasintroduced by by-sorting. Calculations were processed to max-imize the by-sorting impact on Pi uptake measurements, andresulted in a 10% overestimation of Pic uptake rates, which isclose to the inner variability of cell uptake rate measurements
(Table 1). A hypothesis might be that these by-sorted het-erotrophic prokaryotes are attached to pico/nanophy-toeukaryotes and that they could supply autotrophic cellswith freshly incorporated and/or regenerated Pi (Carrillo et al.2008).
Our method is sufficiently sensitive to be applied to natu-ral groups from P-depleted environments; however it shouldbe used only when samples can be fully processed shortly aftersampling. When fixation is necessary in place of an opera-tional embarked cell sorter, the leakage of radioactive Pi due tofixation should be checked systematically for all groups andall samples.
As for traditional bulk measurements, several steps of theprotocol require adjustment according to cell abundance andactivity, as well as Pi turnover time, before this method can beapplied to a new environment. We thus recommend users runseveral tests to adjust the quantity of introduced label, incu-bation time and incubated volume, the number of sorted cellsand potential by-sorting before using the protocol describedin this study with their samples. We recommend using ourimproved protocol to measure taxon-specific Pi uptake rates sothat measurements can be compared between systems.
Finally, a future step in the evaluation of the contributionof taxonomic groups to the total Pi uptake will be the deter-mination of biomass-specific Pi uptake rates (i.e., the Pi uptakeper biomass unit instead of Pi uptake per abundance unit). Tomeasure accurate values of P biomass obtained from the samesample as the labeled sample, a high resolution techniquesuch as X-ray fluorescence spectroscopy is necessary. This is, sofar, the most accurate method to obtain a specific P cellularcontent (fg P cell–1, Tanaka et al. 2006; Løvdal et al. 2008),when there is enough particulate material samples.
ReferencesArthur, C. R., and F. H. Rigler. 1967. A possible source of error
in the 14C method of measuring primary productivity. Lim-nol. Oceanogr. 12:121-124 [doi:10.4319/lo.1967.12. 1.0121].
Berman, T. 1973. Modifications in filtration methods for themeasurement of inorganic 14C uptake by photosyntheticalgae. J. Phycol. 9:327-330 [doi:10.1111/j.1529-8817.1973.tb04100.x].
Björkman, K., A. L. Thomson-Bulldis, and D. M. Karl. 2000.Phosphorus dynamics in the North Pacific subtropical gyre.Aquat. Microb. Ecol. 22:185-198 [doi:10.3354/ame022185].
Bjornsen, P. K., B. Riemann, J. Pock-Steen, T. G. Nielsen, and S.J. Horsted. 1989. Regulation of Bacterioplankton produc-tion and cell volume in a eutrophic estuary. Appl. Environ.Microbiol. 55:1512-1518.
Carrillo, P., M. Villar-Argaiz, and J. Medina-Sánchez. 2008.Does microorganism stoichiometry predict microbial foodweb interactions after a phosphorus pulse? Microb. Ecol.56:350-363 [doi:10.1007/s00248-007-9353-8].
Casey, J. R., and others. 2009. Phytoplankton taxon-specificorthophosphate (Pi) and ATP utilization in the western sub-
Talarmin et al. P uptake of live picoplankton
451
tropical North Atlantic. Aquat. Microb. Ecol. 58:31-44.[doi:10.3354/ame01348].
Cotner, J. B., and B. A. Biddanda. 2002. Small players, largerole: microbial influence on biogeochemical processes inpelagic aquatic ecosystems. Ecosystems 5:105-121[doi:10.1007/s10021-001-0059-3].
del Giorgio, P. A., D. F. Bird, Y. T. Prairie, and D. Planas. 1996.Flow cytometric determination of bacterial abundance inlake plankton with the green nucleic acid stain SYTO 13.Limnol. Oceanogr. 41:783-789 [doi:10.4319/lo.1996.41.4.0783].
Duhamel, S., F. Zeman, and T. Moutin. 2006. A dual-labelingmethod for the simultaneous measurement of dissolvedinorganic carbon and phosphate uptake by marine plank-tonic species. Limnol. Oceanogr. Methods 4:416-425[doi:10.4319/lom.2006.4.416].
———, and others. 2007. Growth and specific P-uptake ratesof bacterial and phytoplanktonic communities in theSoutheast Pacific (BIOSOPE cruise). Biogeosciences 4:941-956.
Flaten, G. A. F., and others. 2005. Studies of the microbial P-cycle during a Lagrangian phosphate-addition experimentin the Eastern Mediterranean. Deep Sea Res. II 52:2928-2943 [doi:10.1016/j.dsr2.2005.08.010].
Fu, F. X., Y. Zhang, Y. Feng, and D. A. Hutchins. 2006. Phos-phate and ATP uptake and growth kinetics in axenic cul-tures of the cyanobacterium Synechococcus CCMP 1334.Eur. J. Phycol. 41:15-28 [doi:10.1080/09670260500505037].
Gasol, J. M., and C. M. Duarte. 2000. Comparative analyses inaquatic microbial ecology: how far do they go? FEMSMicrobiol. Ecol. 31:99-106 [doi:10.1111/j.1574-6941.2000.tb00675.x].
Goldman, J. C., and M. R. Dennett. 1985. Susceptibility ofsome marine phytoplankton species to cell breakage duringfiltration and post-filtration rinsing. J. Exp. Mar. Biol. Ecol.86:47-58 [doi:10.1016/0022-0981(85)90041-3].
Grémare, A., and others. 2003. The effects of a strong winterstorm on physical and biological variables at a shelf site inthe Mediterranean. Oceanol. Acta 26:407-419. [doi:10.1016/S0399-1784(03)00029-X].
Kamiya, E., S. Izumiyama, M. Nishimura, J. G. Mitchell, and K.Kogure. 2007. Effects of fixation and storage on flow cyto-metric analysis of marine bacteria. J. Oceanogr. 63:101-112[doi:10.1007/s10872-007-0008-7].
Kattner, G. 1999. Storage of dissolved inorganic nutrients inseawater: poisoning with mercuric chloride. Mar. Chem.67:61-66 [doi:10.1016/S0304-4203(99)00049-3].
Larsen, A., T. Tanaka, M. V. Zubkov, and T. F. Thingstad. 2008.P-affinity measurements of specific osmotroph populationsusing cell-sorting flow cytometry. Limnol. Oceanogr. Meth-ods 6:355-363 [doi:10.4319/lom.2008.6.355].
Lasker, R., and R. W. Holmes. 1957. Variability in retention ofmarine phytoplankton by membrane filters. Nature180:1295-1296 [doi:10.1038/1801295a0].
Lebaron, P., N. Parthuisot, and P. Catala. 1998. Comparison ofblue nucleic acid dyes for flow cytometric enumeration ofbacteria in aquatic systems. Appl. Environ. Microbiol.64:1725-1730.
Løvdal, T., E. Skjoldal, M. Heldal, S. Norland, and T. Thingstad.2008. Changes in morphology and elemental compositionof Vibrio splendidus along a gradient from carbon-limitedto phosphate-limited growth. Microb. Ecol. 55:152-161[doi:10.1007/s00248-007-9262-x].
Macias, D., E. Ramirez-Romero, and C. M. Garcia. 2010. Effectof nutrient input frequency on the structure and dynamicsof the marine pelagic community: A modeling approach. J.Mar. Res. 68:119-151 [doi:10.1357/002224010793078979].
Marie, D., N. Simon, L. Guillou, F. Partensky, and D. Vaulot.2000. DNA/RNA analysis of phytoplankton by flow cytom-etry UNIT 11.12. In J. P. Robinson, Z. Darzynkiewicz, P. N.Dean, A. Orfao, P. S. Rabinovitch, C. C. Stewart., H. J.Tanke, L. L. Wheeless [ed.], Current protocols in cytometry.John Wiley & Sons [doi:10.1002/0471142956. cy1112s11].
Mauriac, R., T. Moutin, and M. Baklouti. 2011. Accumulationof DOC in low phosphate low chlorophyll (LPLC) area: is itrelated to higher production under high N:P ratio? Biogeo-sciences 8:933-950 [doi:10.5194/bg-8-933-2011].
Médernach, L., A. Grémare, J. M. Amouroux, J. C. Colomines,and G. Vétion. 2001. Temporal changes in the amino acidcontents of particulate organic matter sedimenting in theBay of Banyuls-sur-Mer (northwestern Mediterranean).Mar. Ecol. Progr. Ser. 214:55-65.
Michelou, V. K., M. W. Lomas, and D. L. Kirchman. 2011.Phosphate and adenosine-5′-triphosphate uptake bycyanobacteria and heterotrophic bacteria in the SargassoSea. Limnol. and Oceanogr. 56:323-332 [doi:10.4319/lo.2011. 56.1.0323].
Moutin, T., and others. 2002. Does competition for nanomo-lar phosphate supply explain the predominance of thecyanobacterium Synechococcus? Limnol. Oceanogr. 47:1562-1567 [doi:10.4319/lo.2002.47.5.1562].
———, N. Van Den Broeck, B. Beker, C. Dupouy, P. Rimmelin,and A. Le Bouteiller. 2005. Phosphate availability controlsTrichodesmium spp. biomass in the SW Pacific Ocean. Mar.Ecol. Progr. Ser. 207:15-21.
Nausch, M., G. Nausch, and N. Wasmund. 2004. Phosphorusdynamics during the transition from nitrogen to phosphatelimitation in the central Baltic Sea. Mar. Ecol. Progr. Ser.266:15-25 [doi:10.3354/meps266015].
Nowlin, W. H., J. M. Davies, and A. Mazumder. 2007. Plank-tonic phosphorus pool sizes and cycling efficiency incoastal and interior British Columbia lakes. Freshw. Biol.52:860-877 [doi:10.1111/j.1365-2427.2007.01734.x].
Obernosterer, I., and others. 2008. Biochemical characteristicsand bacterial community structure of the sea surface micro-layer in the South Pacific Ocean. Biogeosciences 5:693-705[doi:10.5194/bg-5-693-2008].
Polovina, J. J., E. A. Howell, and M. Abecassis. 2008. Ocean’s
Talarmin et al. P uptake of live picoplankton
452
least productive waters are expanding. Geophys. Res. Lett.35: L03618 [doi:10.1029/2007GL031745].
Tanaka, T., F. Rassoulzadegan, and T. F. Thingstad. 2004.Orthophosphate uptake by heterotrophic bacteria,cyanobacteria, and autotrophic nanoflagellates in Ville-franche Bay, northwestern Mediterranean: Vertical, sea-sonal, and short-term variations of the competitive rela-tionship for phosphorus. Limnol. Oceanogr. 49:1063-1072[doi:10.4319/lo.2004.49.4.1063].
———, and others. 2006. Specific affinity for phosphateuptake and specific alkaline phosphatase activity as diag-nostic tools for detecting phosphorus-limited phytoplank-ton and bacteria. Estuar. Coasts 29:1226-1241.
Thingstad, T. F. 2005. Simulating the response to phosphateadditions in the oligotrophic eastern Mediterranean usingan idealized four-member microbial food web model. DeepSea Res. II 52:3074-3089 [doi:10.1016/j.dsr2.2005.08.016].
Tréguer, P., and P. Le Corre. 1975. Utilisation de l’AutoAnalyserII Technicon, p. 1-110. In Universite de Bretagne Occiden-tale [ed.], Manuel d’analyse des sels nutritifs dans l’eau demer. Université de Bretagne Occidentale, Laboratoire deChimie Marine.
Troussellier, M., C. Courties, and S. Zettelmaier. 1995. Flow
cytometric analysis of coastal lagoon bacterioplankton andpicophytoplankton: fixation and storage effects. Estuar.Coast. Shelf Sci. 40:621-633 [doi:10.1006/ecss.1995.0042].
Van Den Broeck, N., T. Moutin, M. Rodier, and A. Le Bouteiller.2004. Seasonal variations of phosphate availability in theSW Pacific Ocean near New Caledonia. MEPS 268:1-12[doi:10.3354/meps268001].
Wu, J., W. Sunda, E. A. Boyle, and D. M. Karl. 2000. Phosphatedepletion in the Western North Atlantic Ocean. Science289:759-762 [doi:10.1126/science.289.5480.759].
Zubkov, M. V., and others. 2007. Microbial control of phos-phate in the nutrient-depleted North Atlantic subtropicalgyre. Environ. Microbiol. 9:2079-2089 [doi:10.1111/j.1462-2920.2007.01324.x].
Submitted 31 March 2011Revised 23 August 2011
Accepted 9 September 2011
Talarmin et al. P uptake of live picoplankton
453


![Binder 173, Plagiorchiidae A-B [Trematoda Taxon Notebooks]](https://img.pdfslide.net/doc/110x75/6327234c051fac18490e18bf/binder-173-plagiorchiidae-a-b-trematoda-taxon-notebooks.jpg)

![Binder 033-034, Clinosomidae [Trematoda Taxon Notebooks]](https://img.pdfslide.net/doc/110x75/633cbcc3b319078eca05c9ee/binder-033-034-clinosomidae-trematoda-taxon-notebooks.jpg)
