Embed Size (px)
Citation preview

Published: March 18, 2011
r 2011 American Chemical Society 2377 dx.doi.org/10.1021/pr1011729 | J. Proteome Res. 2011, 10, 2377–2388
ARTICLE
pubs.acs.org/jpr
Improved Peptide Identification by Targeted Fragmentation UsingCID, HCD and ETD on an LTQ-Orbitrap VelosChristian K. Frese,†,‡ A. F. Maarten Altelaar,†,‡ Marco L. Hennrich,†,‡ Dirk Nolting,§ Martin Zeller,§
Jens Griep-Raming,§ Albert J. R. Heck,†,‡ and Shabaz Mohammed*,†,‡
†Biomolecular Mass Spectrometry and Proteomics Group, Bijvoet Center for Biomolecular Research and Utrecht Institute forPharmaceutical Sciences, Utrecht University, Padualaan 8, 3584 CH Utrecht, The Netherlands‡Netherlands Proteomics Centre, Padualaan 8, 3584 CH Utrecht, The Netherlands§Thermo Fisher Scientific, Bremen, Germany
bS Supporting Information
’ INTRODUCTION
Peptide sequencing is the key step in commonly employedbottom-up approaches within mass spectrometry-based proteo-mics. Usually proteins are digested with enzymes such as trypsinfollowed by 1- or 2-dimensional chromatographic separationtechniques prior to tandemMS analysis.1 The current method ofchoice for peptide sequencing is collision induced dissociation(CID).2 Dependent on the instrument type three collisionenergy regimes can be distinguished. High energy CID (>1 keV)is commonly employed in sector field and TOF/TOF instru-ments. Low energy CID, which is predominantly applied withinproteomics workflows, can be subdivided into resonant-excita-tion CID (<2 eV; used in ion traps) and beam-type CID (∼100eV; QqQ or QqTOF instruments). In general, the fragmentationprocess starts with the isolation of the precursor ions followed bycollisions with neutral gas atoms, which leads to a conversion ofthe kinetic energy into internal vibrational energy. As thevibrational energy exceeds a certain threshold, covalent peptidebonds may break. Since the dissociation rate is lower than theenergy redistribution rate, the energy is randomly distributed
over all atom bonds. Consequently, it is predominantly theweakest bond that breaks. The resulting fragment ions are usedto obtain the peptide sequence by a database search. Resonantexcitation, or so-called ion trap CID, differs slightly from beam-type CID. The fragmentation pattern of beam-type CID is due tothe higher energy applied and the shorter activation time whencompared to ion trap CID. Both b- and y-ions are observed in iontrap CID, whereas the higher energy levels in beam-type CIDlead to a predominance of y-ions; b-ions can fragment further toa-ions or smaller species.3,4
Available fragmentation techniques besides CID include elec-tron-based approaches such as electron capture dissociation(ECD) and electron transfer dissociation (ETD).5,6 Tandemmass spectrometers enabled with ETD are becoming morepopular within the mass spectrometry community due to thetechnique being implement on a number of configurationsincluding Q-TOFs,7 Q-TRAPs,8 linear ion trap-Orbitrap hybrid
Received: November 23, 2010
ABSTRACT: Over the past decade peptide sequencing bycollision induced dissociation (CID) has become the method ofchoice in mass spectrometry-based proteomics. The develop-ment of alternative fragmentation techniques such as electrontransfer dissociation (ETD) has extended the possibilitieswithin tandem mass spectrometry. Recent advances in instru-mentation allow peptide fragment ions to be detected with highspeed and sensitivity (e.g., in a 2D or 3D ion trap) or at highresolution and high mass accuracy (e.g., an Orbitrap or a ToF).Here, we describe a comprehensive experimental comparison ofusing ETD, ion-trap CID, and beam type CID (HCD) incombination with either linear ion trap or Orbitrap readoutfor the large-scale analysis of tryptic peptides. We investigate which combination of fragmentation technique and mass analyzerprovides the best performance for the analysis of distinct peptide populations such as N-acetylated, phosphorylated, and trypticpeptides with up to twomissed cleavages. We found that HCD provides more peptide identifications than CID and ETD for doublycharged peptides. In terms ofMascot score, ETD FT outperforms the other techniques for peptides with charge states higher than 2.Our data shows that there is a trade-off between spectral quality and speed when using the Orbitrap for fragment ion detection. Weconclude that a decision-tree regulated combination of higher-energy collisional dissociation (HCD) and ETD can improve theaverage Mascot score.
KEYWORDS: ETD, Orbitrap Velos, HCD, data-dependent decision tree, peptide fragmentation

2378 dx.doi.org/10.1021/pr1011729 |J. Proteome Res. 2011, 10, 2377–2388
Journal of Proteome Research ARTICLE
instruments,9 and Fourier transform ion cyclotron resonancemass spectrometers.10 Unfortunately, ECD is currently limited toa few instrument types such as FT-ICR cells or linear ion trap-QTOF instruments since they allow trapping of electrons andanalyte cations simultaneously.11,12 In contrast to collisioninduced dissociation, ETD and ECD induce cleavage of theN�CR bond and generate c- and z-type fragment ions. Severalstudies demonstrated that ETD is particularly useful for peptideswith charge states >2.13�16 Furthermore, electron driven frag-mentation techniques offer advantages for the analysis of acidlabile post-translational modifications such as phosphoryla-tion.17�19 Overall, it is widely accepted that the outcome offragmentation upon ETD activation is highly dependent onprecursor charge state and that ETD can be used complementaryto CID to increase the number of identifications as well as peptidesequence coverage.15,16,20,21 In 2008, Coon and co-workers intro-duced a data-dependent decision tree logic that chooses “on-the-fly” the appropriate activation technique depending on theprecursor charge state andm/z. The method increases the numberof successful MS/MS events and improves the level of protein IDsthat one can achieve using a single method.22
In recent years hybrid tandem mass spectrometers havebecome available that combine a linear ion trap with anOrbitrap.23 This combination allows for a high resolution MSspectrumwith an excellent mass accuracy in the Orbitrap and theability to perform rapid MS/MS (several Hz) in the ion trap.Olsen et al. reported in 2007 on the development of the additionof a multipole collision cell to the LTQ-Orbitrap instrument,which then allowed low energy beam-type CID generatingspectra similar to those of triple quadrupole and Q-TOF instru-ments.24 In order to distinguish between ion trap CID and beamtype CID performed in the multipole (and to not confuse it withhigh energy CID), the latter was referred to as higher-energyC-trap dissociation (HCD). Through such an activation process,low mass ions are now observable since there is no 1/3 masscutoff present for the multipole, which makes it more suitable forthe analysis of reporter ions derived from chemical labelingreagents such as iTRAQ or TMT.25�28 In 2009, the dual-pressure linear ion trap-Orbitrap became available, whichallowed the generation of faster and more efficient ion trapMS/MS. The improvements were made possible through the useof two ion traps operating at different pressure regimes. Theinstrument was also equipped with a more optimized geometryfor HCD transmission and extraction.29,30 This instrument hasthree possible ways of sequencing a peptide: CID, HCD, andETD. Each has been shown to be very capable, with each havingadvantages and disadvantages.
The hybrid linear ion trap-Orbitrap instrument is currentlyone of the most used instruments in high-throughput proteomicsand offers multiple peptide fragmentation techniques. Severalstudies have been performed comparing CID and ETD or CIDand HCD. It is widely accepted that CID and ETD can be usedcomplementarily to cover different parts of a complex peptidemixture and to increase sequence coverage.15�17,19,20,22,31,32
However, there is still ambiguity whether CID or HCD performsbest for peptide identification.25,29,33,34 To the best of ourknowledge, there is no direct comparison between all threefragmentation techniques in combination with either linear iontrap or Orbitrap detection. Choosing the best fragmentationtechnique for different populations of peptides is crucial toincrease the number of peptides and proteins that can beidentified from a complex sample. The recently updated Orbitrap
instrument allows the use of all three fragmentation modes, CID,HCD, and ETD, in combination with either ion trap or Orbitrapmass analysis. Here, we report a comprehensive comparison of allcombinations of fragmentation techniques and mass analyzersfor peptides derived from a tryptic digest. We analyzed distinctpopulations of peptides as well as whole cell lysates, and weanswer the question of which combination of fragmenta-tion technique and mass analyzer gives the highest number ofpeptide IDs.
’MATERIAL AND METHODS
Sample PreparationHEK293 cells were cultured at 37 �C and 5% CO2 in DMEM
high glucose medium containing 10% FCS, 10 mM L-glutamineand 5% penicillin/streptomycin (all Lonza). Cells were harvestedby trypsinization and washed three times with PBS buffer. Cellswere lysed in lysis buffer (8 M urea, 1 tablet Complete MiniEDTA-free Cocktail (Roche), 1 tablet PhosSTOP PhosphataseInhibitor Cocktail (Roche), in 10 mL 50 mM ammoniumbicarbonate buffer) by sonication. The lysate was centrifugedfor 15 min at 20,000g, and the supernatant was transferred intonew tubes. The BCA assay (Pierce) was used to determine theprotein concentration; 2,750 μg protein was reduced (2 mMdithiothreitol, 25 min at 56 �C) and alkylated (4 mM iodoace-tamide, 30 min at room temperature in the dark). Lys-C wasadded in a 1:75 (w/w) ratio and incubated for 4 h at 37 �C. Thesample was diluted four times with 50 mM ammonium bicarbo-nate buffer. Sequencing grade trypsin (Promega) was added in a1:100 (w/w) ratio and the incubation was carried out overnightat 37 �C. The digested lysate was desalted by C18 solid phaseextraction (Sep-Pak Vac C18 cartridge 3 cc/200 mg, Waters),dried down, and reconstituted in 10% formic acid.
Peptide Fractionation and Mass SpectrometryFractionation by low-pH strong cation exchange chromatog-
raphy was performed as described previously using a Poly-sulfoethyl A column (200 mm � 2.1 mm, 5 μm, 200 Å, PolyLCInc.).35 Collected fractions were dried down in a vacuum con-centrator and reconstituted in 100 μL 10% formic acid. Thesamples were analyzed on an ETD enabled Orbitrap Velosinstrument (Thermo Fisher Scientific, Bremen) connected toan Agilent 1200 HPLC system. All columns were packed in-house. The trap column was made using Aqua C18 material(Phenomenex, Torrance, CA). Reprosil-pur C18 3 μm (Dr.Maisch, Ammerbuch-Entringen, Germany) was used for the35 cm analytical column with 50 μm inner diameter. Solvent Aconsisted of 0.1 M acetic acid (Merck) in deionized water (Milli-Q,Millipore), and solvent B consisted of 0.1M acetic acid in 80%acetonitrile (Biosolve). The flow rate of 5 μL/min was passivelysplit and reduced to an effective flow rate of 100 nL/min. Thegradients were as follows: 60 min LC method, 10 min solvent A;10�40% solvent B within 30 min; 100% solvent B for 2 min;15 min solvent A. 180 min LC method: 10 min solvent A;10�25% solvent B within 107 min; 25�50% solvent B within35 min; 100% solvent B for 2 min; 15 min solvent A. 300 min LCmethod: 10 min solvent A; 10�23% solvent B within 230 min;23�50% solvent B within 37 min; 100% solvent B for 2 min;15 min solvent A. All instrument methods for the Orbitrap Veloswere set up in the data dependent acquisition mode. After thesurvey scan the 10 most intense precursors were selected forsubsequent fragmentation using optimal settings for each

2379 dx.doi.org/10.1021/pr1011729 |J. Proteome Res. 2011, 10, 2377–2388
Journal of Proteome Research ARTICLE
activation technique (see Table 1 for parameter details). Thenormalized collision energy was set to 35% for both CID andHCD. Supplemental activation was enabled for ETD. The signalthreshold for triggering an MS/MS event was set to 500 counts.For internal mass calibration the 445.120025 ion was used as lockmass with a target lock mass abundance of 0%. The low masscutoff for HCD and ETD FT was set to 180 m/z. Charge statescreening was enabled, and precursors with unknown chargestate or a charge state of 1 were excluded. Dynamic exclusion wasenabled (exclusion size list 500, exclusion duration 25 s for the60 min methods and 90 s for the 180 and 300 min methods). Forthe decision tree methods the procedures option was enabled.The settings for the FT based decision tree were as follows: ETDwas performed instead of HCD if the charge state was 3 and m/zwas less than 800, or if the charge state was 4 and them/zwas lessthan 900, or if the charge state was 5 and m/z was less than 950.The modified decision tree was set up to use ETD with LTQreadout instead of HCD if the charge state was 3 andm/zwas lessthan 750. ETD was performed for all precursor ions with chargestates >3. The fragment ions were analyzed in the Orbitrapinstead of the LTQ if the charge state was 4 andm/zwas less than1000. A schematic overview of the modified decision treealgorithm can be found in Supplemental Figure S1. The previewmode option for the survey scan was disabled for both decisiontree methods.
Data AnalysisPeak lists were generated from the raw data files using
Proteome Discoverer version 1.2 (Thermo Fisher Scientific,Bremen). For the SCX data, one peak list was generated perfragmentation mode. The non-fragment filter was used tosimplify ETD spectra with the following settings: the precursorpeak was removed within a 4 Da window, charged reducedprecursors were removed within a 2 Da window, and neutrallosses from charged reduced precursors were removed within a 2Da window (the maximum neutral loss mass was set to 120 Da).An in-house developed perl script was used to filter CID peaklists (minimum fragment ion count was set to 100, maximumnumber of fragment ions was set to 100). Peak list files fromOrbitrap detection (HCD, CID FT, and ETD FT) were deiso-toped and charge deconvoluted, as described elsewhere.36
Briefly, spectra are simplified by removing all except the mono-isotopic peak from isotopic clusters and converting them/z valueof monoisotopic peaks from higher charged species into the 1þ
charged state.37 Peak lists were searched against swissprot(version 56.2, taxonomy filter was set toHomo sapiens) includinga list of common contaminants using Mascot software version2.3.02 (Matrix Science, UK). Trypsin was chosen as cleavagespecificity with a maximum number of allowed missed cleavagesof two. Carbamidomethylation (C) was set as a fixed modifica-tion and oxidation (M), acetylation (protein N-term) andphosphorylation (STY) were used as variable modifications.The searches were performed using a peptide tolerance of 50ppm and a product ion tolerance of 0.6 Da (ion trap readout) and0.05 Da (Orbitrap readout), respectively. For further filtering thedecoy search option was enabled. The resulting dat files wereexported and filtered for <1% false discovery rate at peptide levelusing in-house developed software “Rockerbox” (version 1.2.6)utilizing the percolator algorithm.38 In brief, percolator extractsfeatures from the dat files and uses a support vector machine tocreate parsed PSMs.39 Widening the Mascot search space bysetting the peptide tolerance to 50 ppm provides a sufficienttraining data set for the percolator algorithm to distinguishbetween true positive and decoy hits (Supplemental FigureS2). Hence there is no fixed Mascot score cutoff because peptidematches are accepted until a FDR rate of 1% is reached. However,only PSMs with Mascot scores >20 were accepted to ensure thatonly high quality data is allowed for this study.
’RESULTS AND DISCUSSION
This study was aimed at providing a fair, comprehensiveevaluation of all possible combinations of peptide fragmentationtechniques and mass spectrometric detection modes and toelucidate the feasibility and performance of each method forefficient, routine peptide sequencing. For the purpose ofthe evaluation we generated populations of the main peptidecompositions generally sequenced by mass spectrometry:N-acetylated peptides, singly phosphorylated, and tryptic pep-tides with 0, 1, and 2 missed cleavages (5 discrete peptide pools).All peptide pools were generated from a trypsinized HEK293 celllysate that had been subjected to fractionation by low-pHSCX.21,35 These peptide pools were analyzed using a 150 mingradient (180 min total analysis time), and the 10 most intenseprecursors from each full scan were selected for MS/MS. Eachpool was analyzed five times using exclusively either CID or ETDwith LTQmass analysis (referred to as CID, ETD), CID or ETDwith Orbitrap readout (CID FT, ETD FT), or HCD (only
Table 1. Orbitrap Velos Parameter Settings of Methods Used for Analyses
2380 dx.doi.org/10.1021/pr1011729 |J. Proteome Res. 2011, 10, 2377–2388
Journal of Proteome Research ARTICLE
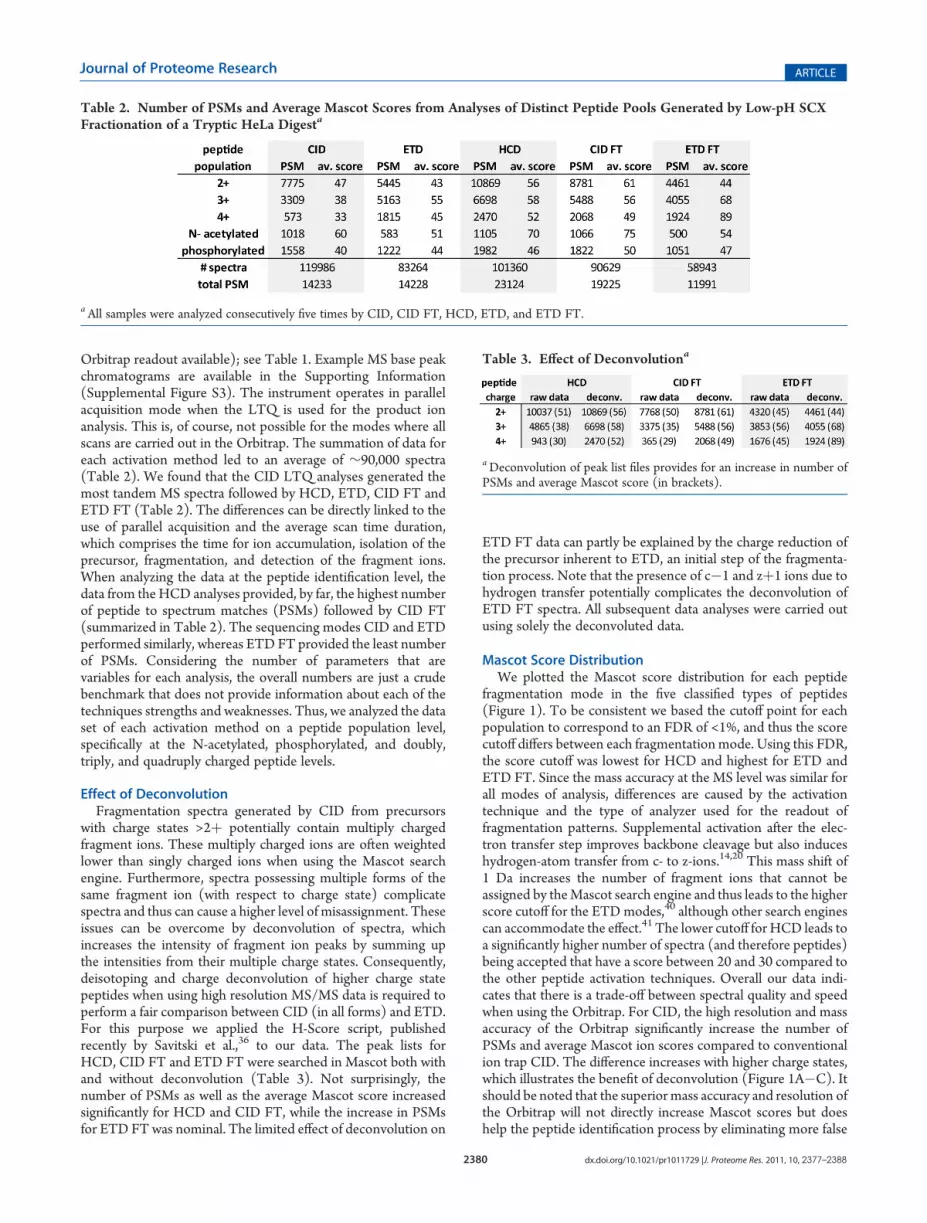
Orbitrap readout available); see Table 1. Example MS base peakchromatograms are available in the Supporting Information(Supplemental Figure S3). The instrument operates in parallelacquisition mode when the LTQ is used for the product ionanalysis. This is, of course, not possible for the modes where allscans are carried out in the Orbitrap. The summation of data foreach activation method led to an average of ∼90,000 spectra(Table 2). We found that the CID LTQ analyses generated themost tandem MS spectra followed by HCD, ETD, CID FT andETD FT (Table 2). The differences can be directly linked to theuse of parallel acquisition and the average scan time duration,which comprises the time for ion accumulation, isolation of theprecursor, fragmentation, and detection of the fragment ions.When analyzing the data at the peptide identification level, thedata from theHCD analyses provided, by far, the highest numberof peptide to spectrum matches (PSMs) followed by CID FT(summarized in Table 2). The sequencing modes CID and ETDperformed similarly, whereas ETD FT provided the least numberof PSMs. Considering the number of parameters that arevariables for each analysis, the overall numbers are just a crudebenchmark that does not provide information about each of thetechniques strengths and weaknesses. Thus, we analyzed the dataset of each activation method on a peptide population level,specifically at the N-acetylated, phosphorylated, and doubly,triply, and quadruply charged peptide levels.
Effect of DeconvolutionFragmentation spectra generated by CID from precursors
with charge states >2þ potentially contain multiply chargedfragment ions. These multiply charged ions are often weightedlower than singly charged ions when using the Mascot searchengine. Furthermore, spectra possessing multiple forms of thesame fragment ion (with respect to charge state) complicatespectra and thus can cause a higher level of misassignment. Theseissues can be overcome by deconvolution of spectra, whichincreases the intensity of fragment ion peaks by summing upthe intensities from their multiple charge states. Consequently,deisotoping and charge deconvolution of higher charge statepeptides when using high resolution MS/MS data is required toperform a fair comparison between CID (in all forms) and ETD.For this purpose we applied the H-Score script, publishedrecently by Savitski et al.,36 to our data. The peak lists forHCD, CID FT and ETD FT were searched in Mascot both withand without deconvolution (Table 3). Not surprisingly, thenumber of PSMs as well as the average Mascot score increasedsignificantly for HCD and CID FT, while the increase in PSMsfor ETD FTwas nominal. The limited effect of deconvolution on
ETD FT data can partly be explained by the charge reduction ofthe precursor inherent to ETD, an initial step of the fragmenta-tion process. Note that the presence of c�1 and zþ1 ions due tohydrogen transfer potentially complicates the deconvolution ofETD FT spectra. All subsequent data analyses were carried outusing solely the deconvoluted data.
Mascot Score DistributionWe plotted the Mascot score distribution for each peptide
fragmentation mode in the five classified types of peptides(Figure 1). To be consistent we based the cutoff point for eachpopulation to correspond to an FDR of <1%, and thus the scorecutoff differs between each fragmentationmode. Using this FDR,the score cutoff was lowest for HCD and highest for ETD andETD FT. Since the mass accuracy at the MS level was similar forall modes of analysis, differences are caused by the activationtechnique and the type of analyzer used for the readout offragmentation patterns. Supplemental activation after the elec-tron transfer step improves backbone cleavage but also induceshydrogen-atom transfer from c- to z-ions.14,20 This mass shift of1 Da increases the number of fragment ions that cannot beassigned by theMascot search engine and thus leads to the higherscore cutoff for the ETDmodes,40 although other search enginescan accommodate the effect.41 The lower cutoff for HCD leads toa significantly higher number of spectra (and therefore peptides)being accepted that have a score between 20 and 30 compared tothe other peptide activation techniques. Overall our data indi-cates that there is a trade-off between spectral quality and speedwhen using the Orbitrap. For CID, the high resolution and massaccuracy of the Orbitrap significantly increase the number ofPSMs and average Mascot ion scores compared to conventionalion trap CID. The difference increases with higher charge states,which illustrates the benefit of deconvolution (Figure 1A�C). Itshould be noted that the superior mass accuracy and resolution ofthe Orbitrap will not directly increase Mascot scores but doeshelp the peptide identification process by eliminating more false
Table 2. Number of PSMs and Average Mascot Scores from Analyses of Distinct Peptide Pools Generated by Low-pH SCXFractionation of a Tryptic HeLa Digesta
aAll samples were analyzed consecutively five times by CID, CID FT, HCD, ETD, and ETD FT.
Table 3. Effect of Deconvolutiona
aDeconvolution of peak list files provides for an increase in number ofPSMs and average Mascot score (in brackets).

2381 dx.doi.org/10.1021/pr1011729 |J. Proteome Res. 2011, 10, 2377–2388
Journal of Proteome Research ARTICLE
positives, i.e., a lower Mascot score can be reached with the sameFDR value using higher quality tandem mass spectra.
Regular tryptic peptides contain two basic groups that arelocated at the N-terminus and at the C-terminal lysine orarginine, and such peptides are often doubly charged in the gasphase. Clearly for these peptides the collisional dissociationmodes HCD and CID FT provide almost equally the highestnumber of PSMs also in the higher Mascot ion score ranges(Figure 1A). However, this result is partially helped by morepeptides with lower scores being disproportionately added to the
data set at a taken threshold of 1% FDR when compared to otheractivation modes. The slightly lower number of PSMs for ETDFT compared to ETD can be attributed to the slower scancycle time.
Previous studies have shown that ETD is more suitable thanCID for the identification of peptides that carry more than twocharges.14,15 Not surprisingly, for 3þ peptides the majority of thePSMs identified by ETD are in theMascot score range of 40�60,whereas the CID andCID FTmodes provide the highest numberof PSMs between Mascot scores from 20 to 40 (Figure 1B). For
Figure 1. Histograms illustrating theMascot ion score distribution of the doubly (A), triply (B), quadruply (C), phosphorylated (D), and N-acetylated(E) peptides that were identified from the analyses of SCX-fractionated tryptic peptides. Samples were analyzed consecutively for five times employingeither CID, HCD, ETD, CID FT, or ETD FT. Data bars are normalized to the highest value within each population.

2382 dx.doi.org/10.1021/pr1011729 |J. Proteome Res. 2011, 10, 2377–2388
Journal of Proteome Research ARTICLE
both CID and ETD higher Mascot scores are obtained when theOrbitrap is chosen as mass analyzer. In particular, ETD FT showsa Mascot score distribution that is shifted toward higher ionscores, which is also reflected in the highest average Mascot scoreamong all fragmentationmodes. HCDprovides by far the highestnumber of PSMs for triply charged peptides. However, theaverage Mascot score and Mascot score distribution is similarto ETD andCID FT. For quadruply charged peptides theMascotscore distributions for all fragmentation modes except ETD FTresemble the 3þ peptide distributions but are shifted towardlower Mascot score ranges (Figure 1C). Here, ETD FT clearlyoutperforms all other fragmentation modes in terms of Mascotscore, providing more than one-third of all PSMs above Mascotion scores of 100. Taking into account that the scan cycle timeof ETD FT is significantly higher compared to HCD, our datasuggest that ETD in combination with Orbitrap fragment iondetection provides spectra with the highest quality compared toall other fragmentation modes.
Globally, the differences in performance of the five fragmen-tation modes observed for the doubly charged peptides(Figure 1A) are similar in the case of phosphopeptides(Figure 1D) and N-acetylated peptides (Figure 1E). Activationwith HCD provides the most PSMs followed by CID FT, CID,ETD, and ETD FT being last. The Mascot score distribution ofN-acetylated peptides differs from the other peptide populations.Close inspection revealed that the high scoring PSMs observed inthe data in Figure 1E originated largely from a few N-acetylatedpeptides that had been sequenced many times. The performance
of the ETDmodes in terms of number of PSMs as well as Mascotscores is poor compared to HCD and the CID modes whenanalyzing N-acetylated peptides (Figure 1E, Table 2). Thisfinding is in line with our expectations since N-acetylatedpeptides are less basic due to the blocked amine group at theN-terminus, which prevents protonation at this position. Insummary, HCD and CID FT perform equally well for bothN-acetylated and phosphopeptides in terms of number ofidentifications when there is a single basic amino acid pre-sent. This is in line with a recent study published by Mann andco-workers.33
Influence of Peptide Mass on Mascot ScoresNext, we investigated the influence of peptide mass onMascot
scores for doubly, triply, and quadruply charged peptides. Thegeneral trend for doubly charged peptides is that the averageMascot score increases with peptide mass (Figure 2), which isparticularly amplified for CID, CID FT, and HCD. The increasein score with mass can be explained simply by the increase inprobable fragment ions with mass. For ETD and ETD FT theMascot scores also increase with higher peptide mass but scoresare, in general, significantly lower compared to the otherfragmentation modes. The ETD modes provide few doublycharged PSMs with masses above 2000 Da. This cutoff seemsartificial and may be attributed to supplemental activation beingunable to operate on charge reduced species with m/z above2000. In the case of triply charged peptides the influence ofpeptide mass on Mascot scores decreases for ion trap CID
Figure 2. Density scatter plots display the influence of peptide mass on Mascot ion scores for doubly charged peptides identified from the analysis oftryptic peptides after SCX fractionation. Darker color indicates more data points.

2383 dx.doi.org/10.1021/pr1011729 |J. Proteome Res. 2011, 10, 2377–2388
Journal of Proteome Research ARTICLE
(Figure 3). Comparing the result to CID FT indicates thatdeconvolution of multiply charged fragment ions is required forobtaining higher Mascot ion scores. In contrast the outcome ofthe fragmentation by ETD seems to be less dependent onprecursor mass. Here, high and low scoring PSMs are observedover the whole mass range. Again, being able to deconvolute theETD FT data leads to the generation of higher ion scores.However, the positive effect of deconvolution in the case oftriply charged peptides analyzed by ETD FT is smaller comparedto CID FT. The limited effect of deconvolution of spectra fromtriply charged peptides being fragmented by ETD FT can beexplained by the fact that such spectra consist mostly of singlycharged fragments. In general, the same holds for quadruplycharged peptides (Supplemental Figure S4). The Mascot ionscores seem to be less influenced by peptide mass. For 4þpeptides the effect of deconvolution also boosts the ETD FTMascot scores since there is now high probability of generatingdoubly and triply charged fragments.
Overlap in Peptide Identifications between the Fragmenta-tion Modes
We investigated the overlap in identifications for each peptidepopulation to examine whether fragmentationmodes were eithermore alike or more complementary. We calculated the overlap inpeptide identifications between CID, HCD, and ETD and alsobetween CID FT, HCD, and ETD FT. We further investigatedwhich fragmentation mode provides the highest Mascot score
from the overlapping unique peptides that were identified by allthree fragmentation modes. Not surprisingly, for the doublycharged peptide population HCD provides the highest numberof unique peptides (22%). Only 5% and 11% of the doublycharged peptides are exclusively identified by ETD and CID,respectively (Figure 4A). Between all three techniques 2,812unique peptides were successfully sequenced.Within the overlap,HCD provides for 72% of these overlapping peptides the highestMascot score followed by CID (17%) and ETD (11%). Adifferent distribution is observed when comparing HCD, CIDFT and ETD FT (Figure 4B). Here, CID FT provides for 55%of the overlapping peptides the highest Mascot score. CID FTspectra exhibit b- and y-ions over the whole mass range incontrast to HCD spectra that are dominated by y-ions. Theaddition of b-ions lead to higher Mascot scores, which mightexplain the prevalence of CID FT over HCD.
For triply charged peptides the number of unique IDs is higherfor HCD compared to ETD (Figure 4C). The overlap betweenCID and HCD is high, whereas HCD and ETD provide morecomplementary unique peptide. The distribution of thehighest scoring peptides within the overlap suggests thatETD can be used complementarily to HCD for peptides withcharge states higher than 2. The comparison between HCD,CID FT, and ETD FT for triply charged peptides furtherindicates that ETD FT spectra can be considered to be moredata-rich compared to HCD and CID FT as the highest Mascotscore of 55% of all overlapping peptides was provided by ETD
Figure 3. Density scatter plots display the influence of peptide mass on Mascot ion scores for triply charged peptides identified from the analysisof tryptic peptides after SCX fractionation. Darker color indicates more data points. Mascot ion scores increase significantly with peptide length forCID FT and HCD. The influence of peptide mass on Mascot scores is negligibly low for CID, ETD, and ETD FT.

2384 dx.doi.org/10.1021/pr1011729 |J. Proteome Res. 2011, 10, 2377–2388
Journal of Proteome Research ARTICLE
FT (Figure 4D). Comparing ETD FT with CID FT and HCDfor quadruply charged peptides shows that 82% of all peptidesexhibit higher Mascot scores when sequenced by ETD FT,which clearly demonstrates the superior ability of ETD forthe analysis of multiply charged peptides (SupplementalFigure S5B).
In the case of N-acetylated and singly phosphorylated peptidesthe distribution of the highest Mascot scores from the
overlapping unique peptides resembles the results of the regulartryptic 2þ peptides to a great extent. HCD provides the majorityof the highest scoring peptides in comparison with ion trap CIDand ETD (Supplemental Figures S6A, S7A) and on the otherhand CID FT dominates the distribution when the FT basedfragmentation modes are compared (Supplemental FiguresS6B, S7B). Note, however, that a higher Mascot score by itselfdoes not necessarily translate into improved phosphositelocalization.19,42,43
Analysis of a Complex Peptide MixtureWe then investigated the performance of each fragmentation
mode for the analysis of non-fractionated samples. We analyzedwhole human cell lysate digests directly by RP-LC-MS/MS usinga 5 h LC analysis and a range of Top10 methods. Data for allacquisition modes was acquired in triplicate to investigate therepeatability of the results. The general trends for the cell lysatedigests are in line with the outcome of the analyses of the SCXfractionated separate peptide pools, discussed above. In brief,HCD outperforms all other fragmentation modes followed byCID FT. The activation strategies ETD FT, ETD and CIDperform approximately on the same level (Table 4, separateresults from triplicate runs can be found in SupplementaryTable 1). As expected the number of MS/MS spectra acquireddiffers largely between the fragmentation modes because of thedifferences in duty cycle. Interestingly, the number of PSMs doesnot correlate with the number of acquired MS/MS spectra. Forexample, the number of PSMs identified byCID andHCDdifferslargely, even though approximately the same number of MS/MSscans was acquired in both modes. Consequently, the successrate, defined as the number of PSMs divided by the number ofMS/MS scans acquired, varies among the fragmentation modes.The highest success rate for an individual technique wasobtained byHCD (49%). Not surprisingly, the ion trap detectionmodes clearly exhibit a lower success rate compared to theequivalent FT detection modes, which is caused both by thelarger number of MS/MS spectra acquired (faster scan cycletime) and the poorer spectral quality (low resolution) of theion trap.
Furthermore, we performed additional experiments where theamount of material analyzed was reduced to test if the apparentsuperior sensitivity of the linear ion trap can overcome theadvantages of the high mass accuracy and resolution of theOrbitrap.29 We performed equivalent analyses but now using100 ng and 10 ng of human cell lysate. For this particular analysis,we restricted the types of analyses to HCD, CID, or ETD. Thenumber of MS/MS spectra acquired for each activation mode isalmost identical (Table 3) when analyzing these lower amountsof material, indicating that the CID mode does not benefit fromthe higher duty cycle of the LTQ. Strikingly, HCD results inmore than twice as many PSMs as CID and three times morethan ETD. This trend remains the same when analyzing 10 ng ofdigested human cell lysate, indicating that the improved HCDcell performs on the same level as the linear ion trap in terms ofsensitivity.
We repeated the 100 ng experiment but using a shorter LCgradient (total analysis time 60 min) and Top10 methods(Table 5). Additionally, we performed a CID Top20 method.As expected, the number of MS/MS spectra acquired directlyreflects the scan cycle duration of each fragmentation mode.In the CID analyses 9,021 (Top10) and 9,408 (Top20),respectively, spectra were acquired. Switching from Top10 to
Figure 4. Overlap of the doubly (A, B) and triply (C, D) chargedpeptides that were identified from the SCX-fractionated tryptic HeLadigest. Venn diagrams illustrate the overlap of the unique peptidesidentified between CID, HCD, and ETD (A, C) and between CID FT,HCD, and ETD FT (B, D). Pie charts show the number of uniquepeptides with the highest Mascot score per fragmentation mode withinthe peptides that were identified by all three fragmentation modes.

2385 dx.doi.org/10.1021/pr1011729 |J. Proteome Res. 2011, 10, 2377–2388
Journal of Proteome Research ARTICLE
Top20 had a minimal effect. Due to the slower cycle time therewere fewer spectra acquired in the HCD (6,462), ETD (4,096),CID FT (4,957), and ETD FT (3,549) analyses. The averagenumber ofMS/MS scans per second was highest for CID (4.7 forTop10 and 5.0 for Top20) followed by HCD (4.0), CID FT(2.8), ETD (2.3), and ETDFT (1.8). The short LC gradient timeleads to a large number of peptides coeluting at any time, and sounder-sampling would be guaranteed and, in principle, therewould be constant maxima of MS/MS events per cycle. There-fore, we calculated the number of MS/MS scans during eachcycle over the main elution window (between RT 23.5 and52 min of the LC gradient). All fragmentation modes except forCID were triggering the maximum number of MS/MS scansduring the analysis (Table 5). In the case of CID the instrumentwas triggering in 85% (Top10) and 38% (Top20), respectively,of the time the maximum number of MS/MS scans per MS scan,which demonstrates the higher speed compared to the otherfragmentation modes. The complexity of the sample is of suchsignificance that it was surprising that the Top20method was notcompletely maxed out. Possible reasons are poor choice of
triggering thresholds, imperfect peak picking, and insufficientdynamic range of the instrument. In an ion trap the total charge issplit between all ions trapped, peptides and chemical noise. The1million “charges” limitation (caused by the C-trap44) combinedwith the charge being distributed will lead to a compression ofthe dynamic range. Low abundant components will have toofew charges in order to have an acceptable signal for detection.Nevertheless, the success rates of all fragmentation modes arehigher for the 60 min analyses when compared to their 5 hanalogues, a fact that can be explained only by the highabundant “proteotypic” precursor ions being selected forfragmentation due to the limitations in scan cycle speed.Interestingly, in terms of number of PSMs there is littledifference between Top10 and Top20 CID. The Top20method results in approximately 500 additional MS/MS spec-tra; however, the number of PSMs and proteins identified ison the same level. HCD still outperforms all other fragmenta-tion modes in terms of PSMs, but in the case of CID andETD the faster scan cycle time make the ion trap modespreferable.
Table 4. Triplicate Analysis of a Complex Peptide Mixture Derived from a Tryptic HeLa Cell Digesta
aDifferent amounts were analyzed over a 5 h LC gradient employing CID, CID FT, HCD, ETD, or ETDFTmethods. Additionally the same sample wasanalyzed using the FT based and a modified decision tree method. The success rate was calculated by dividing the number of peptide identifications bythe number of MS/MS scans.
Table 5. Triplicate Analysis of a Complex Peptide Mixture Using 60 min LC Gradients and Different Fragmentation Modesa
aA 100 ng sample of a tryptic Hela digest was analyzed consecutively by Top10 methods employing CID, CID FT, HCD, ETD, and ETD FT.Additionally a Top20 method was set up and used for CID analysis.

2386 dx.doi.org/10.1021/pr1011729 |J. Proteome Res. 2011, 10, 2377–2388
Journal of Proteome Research ARTICLE
Performance of aData-DependentDecision Tree EmployingHCD, ETD, and ETD FT
Our results show that HCD performs very well for doublycharged peptides. ETD and ETD FT provided the best results interms of Mascot score for peptides with charge states higher thantwo. We next investigated if it is possible to benefit from thecomplementary performance of the two techniques in a data-dependent fashion. Earlier, Swaney et al. showed that a data-dependent decision tree (ddDT) algorithm utilizing CID andETD improves the sequencing success rate and generates moreidentifications than CID or ETD alone.22 For our experiment weinitially had to choose a compromise for the instrument settings.So far, the instrument control software does not allow theprogramming of a ddDT logic that uses HCD with Orbitrapreadout and ETD with ion trap readout because it is not possibleto switch the mass analyzer used for MS/MS readout. Further-more, we had optimized the AGC settings for each fragmentationmode for best results. Again the control software allows only oneAGC value for the activation mode (regardless of the type ofactivation) so we chose target settings that are a compromise forHCD and ETD FT (Table 1). The FT based ddDT performsHCD for all doubly charged precursors and ETD for highercharged precursors. By addressing the most suitable fragmenta-tion technique for each peptide we hoped to increase the numberof peptide IDs, the average Mascot score and the overall successrate. We analyzed the same amount of the human cell digest(1 μg) using the Top10 FT based decision tree HCD/ETD FTmethod on a 5 h gradient. In total, 34,178 MS/MS spectra wereacquired where HCD contributed with 19,229 and ETD FT with14,925 spectra. The success rates for HCD and ETD FT withinthe FT based ddDT are 59% and 48%, respectively. As expected,the FT based ddDT method provides about the same number ofPSMs as HCD alone (Table 4). However, the average Mascotscore significantly increases. Next, we modified the instrumentsoftware to allow switching between LTQ and Orbitrap analyzerand to apply separate AGC target values for the ddDT. Thisenabled us to use HCD, ETD and ETD FT in one single run andaddress every precursor by the most suitable fragmentationmode. Not surprisingly, the modified ddDT performs on thesame level as HCD in terms of identified PSMs and proteins. Themajority of the PSMs is provided by HCD (11,521) followed byETD (5,435) and ETD FT (1,447). The overall success rate of55% illustrates that more than every second MS/MS spectrumled to statistically significant peptide identification. Compared tothe regular FT based ddDT, the modified one performs equallybut provides slightly higher Mascot scores. Although the ddDTlogic directs every precursor to either HCD, ETD, or ETD FTfragmentation, there are several peptides that were identified bymultiple fragmentation modes (Figure 5). This can be explainedby the fact that some peptide ions can be present in differentcharge states. Altogether this illustrates the feasibility of a data-dependent decision tree logic combining the advantages ofdifferent fragmentation techniques (HCD, ETD) and massanalyzers (LTQ, Orbitrap) for enhanced peptide identification.
’CONCLUSION AND OUTLOOK
Our experiments were aimed to evaluate all possible combina-tions of fragmentation and detection modes on the currentversion of an Orbitrap Velos instrument. In all analyses thesuccess rate for HCD was significantly higher than for all othermodes. HCD performs best for doubly charged peptides, singly
phosphorylated peptides, and N-acetylated peptides. ETD FToutperforms the other techniques for peptides with chargesstates >2 in terms of Mascot scores. We found that the spectralquality of Orbitrap detection data is superior to ion trap data,especially when considering charge deconvolution. However, themain discriminating factor for obtaining the highest number ofPSMs is scan cycle speed, as indicated by the larger number ofidentified PSMs from HCD fragmentation when compared toETD FT.We showed that, despite the high sensitivity of the dualpressure linear ion trap, HCD still generates better results thanCID even for very low amounts of peptides. We expect that ETDFT will benefit dramatically from further improvements in speedand product ion transmission from the ion trap to the Orbitrap.We further expect that a dynamic AGC parameter dependent onprecursor charge and m/z value could improve the success ratefor multiply charged peptides. The number of possibly obser-vable fragment ions increases with increasing peptide length andcharge state. Consequently, the product ion signal-to-noise ratiogets worse. Higher AGC values for peptides with higher chargesstates and m/z could help compensate for this. Assigning thepeptides to the most suitable fragmentation mode is a keychallenge for obtaining the highest number of PSMs. We showedthat a modified data-dependent decision tree method employingHCD, ETD, and ETD FT performs similar to HCD alone for theanalysis of a complex peptide mixture but provides a higheraverage Mascot score.
’ASSOCIATED CONTENT
bS Supporting InformationSchematic representation of the probabilistic modified deci-
sion tree algorithm; analytical charts of Mascot data generated
Figure 5. Venn diagrams illustrating the contribution of the differentfragmentation in terms of unique peptides and proteins for the FT basedddDT (A) and modified ddDT (B).

2387 dx.doi.org/10.1021/pr1011729 |J. Proteome Res. 2011, 10, 2377–2388
Journal of Proteome Research ARTICLE
from one of the LCMS analyses; example MS base peakchromatograms of five consecutive analyses using the differentfragmentation modes illustrating the high repeatability of the LCseparation; density scatter plots displaying the influence ofpeptide mass on Mascot scores for quadruply charged peptides;overlap of the quadruply charged, N-acetylated, and phosphory-lated peptides that were identified from the SCX-fractionatedtryptic HeLa digest; table of the number of PSMs identified foreach activation technique with respect to individual LCMSanalyses and for all analyses. All data are available as a scaffoldfile on tranche at https://proteomecommons.org using thefollowing hash: L0u/QC4fuLOfEI43/5þAea2ko37cIzjOU4l-fSa5rZxlD9DmXcUvo1TFD7HYus8 V3YRKX9/Hg0lIpXy5t2-q5SJ2BOEbMAAAAAAAABdw==. This material is available freeof charge via the Internet at http://pubs.acs.org.
’AUTHOR INFORMATION
Corresponding Author*E-mail: [email protected] or [email protected].
’ACKNOWLEDGMENT
This research was performed within the framework ofCTMM, the Center for Translational Molecular Medicine(www.ctmm.nl), project CIRCULATING CELLS (grant 01C-102), and supported by The Netherlands Heart Foundation.Additionally, The Netherlands Proteomics Centre, a programembedded in The Netherlands Genomics Initiative, is kindlyacknowledged for financial support.
’ABBREVIATIONS
CID, collision induced dissociation; TOF, time-of-flight; QqQ,triple quadrupole; QqTOF, quadrupole time-of-flight; Q-TRAP,quadrupole linear ion trap; ECD, electron capture dissociation;ETD, electron transfer dissociation; FT-ICR, Fourier-transformion cyclotron resonance;MS/MS, tandem mass spectrometry;HCD, higher-energy collisional dissociation; SCX, strong cationexchange; FT,Orbitrap readout; PSM, peptide spectrummatch;AGC,automatic gain control; FDR, false discovery rate
’REFERENCES
(1) Washburn, M. P.; Wolters, D.; Yates, J. R., 3rd Large-scaleanalysis of the yeast proteome by multidimensional protein identifica-tion technology. Nat. Biotechnol. 2001, 19 (3), 242–7.(2) Hunt, D. F.; Yates, J. R., 3rd; Shabanowitz, J.;Winston, S.; Hauer,
C. R. Protein sequencing by tandemmass spectrometry. Proc. Natl. Acad.Sci. U.S.A. 1986, 83 (17), 6233–7.(3) Vachet, R. W.; Ray, K. L.; Glish, G. L. Origin of product ions in
theMS/MS spectra of peptides in a quadrupole ion trap. J. Am. Soc. MassSpectrom. 1998, 9 (4), 341–4.(4) Lau, K. W.; Hart, S. R.; Lynch, J. A.; Wong, S. C.; Hubbard, S. J.;
Gaskell, S. J. Observations on the detection of b- and y-type ions in thecollisionally activated decomposition spectra of protonated peptides.Rapid Commun. Mass Spectrom. 2009, 23 (10), 1508–14.(5) Syka, J. E.; Coon, J. J.; Schroeder, M. J.; Shabanowitz, J.; Hunt,
D. F. Peptide and protein sequence analysis by electron transferdissociation mass spectrometry. Proc. Natl. Acad. Sci. U.S.A. 2004, 101(26), 9528–33.(6) Zubarev, R. A. Electron-capture dissociation tandem mass
spectrometry. Curr. Opin. Biotechnol. 2004, 15 (1), 12–6.(7) Xia, Y.; Chrisman, P. A.; Erickson, D. E.; Liu, J.; Liang, X.;
Londry, F. A.; Yang, M. J.; McLuckey, S. A. Implementation of ion/ion
reactions in a quadrupole/time-of-flight tandem mass spectrometer.Anal. Chem. 2006, 78 (12), 4146–54.
(8) Pitteri, S. J.; Chrisman, P. A.; Hogan, J. M.; McLuckey, S. A.Electron transfer ion/ion reactions in a three-dimensional quadrupoleion trap: reactions of doubly and triply protonated peptides with SO2*.Anal. Chem. 2005, 77 (6), 1831–9.
(9) McAlister, G. C.; Berggren,W. T.; Griep-Raming, J.; Horning, S.;Makarov, A.; Phanstiel, D.; Stafford, G.; Swaney, D. L.; Syka, J. E.;Zabrouskov, V.; Coon, J. J. A proteomics grade electron transferdissociation-enabled hybrid linear ion trap-orbitrap mass spectrometer.J. Proteome Res. 2008, 7 (8), 3127–36.
(10) Kaplan, D. A.; Hartmer, R.; Speir, J. P.; Stoermer, C.; Gumerov,D.; Easterling, M. L.; Brekenfeld, A.; Kim, T.; Laukien, F.; Park,M. A. Electron transfer dissociation in the hexapole collision cellof a hybrid quadrupole-hexapole Fourier transform ion cyclotronresonance mass spectrometer. Rapid Commun. Mass Spectrom. 2008,22 (3), 271–8.
(11) Satake, H.; Hasegawa, H.; Hirabayashi, A.; Hashimoto, Y.;Baba, T.; Masuda, K. Fast multiple electron capture dissociation in alinear radio frequency quadrupole ion trap. Anal. Chem. 2007, 79 (22),8755–61.
(12) Axelsson, J.; Palmblad, M.; Hakansson, K.; Hakansson, P.Electron capture dissociation of substance P using a commerciallyavailable Fourier transform ion cyclotron resonance mass spectrometer.Rapid Commun. Mass Spectrom. 1999, 13 (6), 474–7.
(13) Altelaar, A. F.; Mohammed, S.; Brans, M. A.; Adan, R. A.; Heck,A. J. Improved identification of endogenous peptides from murinenervous tissue by multiplexed peptide extraction methods and multi-plexed mass spectrometric analysis. J. Proteome Res. 2009, 8 (2), 870–6.
(14) Swaney, D. L.; McAlister, G. C.; Wirtala, M.; Schwartz, J. C.;Syka, J. E.; Coon, J. J. Supplemental activation method for high-efficiency electron-transfer dissociation of doubly protonated peptideprecursors. Anal. Chem. 2007, 79 (2), 477–85.
(15) Good, D. M.; Wirtala, M.; McAlister, G. C.; Coon, J. J.Performance characteristics of electron transfer dissociation mass spec-trometry. Mol. Cell. Proteomics 2007, 6 (11), 1942–51.
(16) van den Toorn, H. W. P.; Mohammed, S.; Gouw, J. W.;van Breukelen, B.; Heck, A. J. R. Targeted SCX based peptide fractiona-tion for optimal sequencing by collision induced, and electron ttransferdissociation. J. Proteomics Bioinform. 2008, 1 (8), 379–88.
(17) Mikesh, L. M.; Ueberheide, B.; Chi, A.; Coon, J. J.; Syka, J. E.;Shabanowitz, J.; Hunt, D. F. The utility of ETD mass spectrometry inproteomic analysis. Biochim. Biophys. Acta 2006, 1764 (12), 1811–22.
(18) Wiesner, J.; Premsler, T.; Sickmann, A. Application of electrontransfer dissociation (ETD) for the analysis of posttranslationalmodifications. Proteomics 2008, 8 (21), 4466–83.
(19) Boersema, P. J.; Mohammed, S.; Heck, A. J. Phosphopeptidefragmentation and analysis by mass spectrometry. J Mass Spectrom 2009,44 (6), 861–78.
(20) Molina, H.; Matthiesen, R.; Kandasamy, K.; Pandey, A. Com-prehensive comparison of collision induced dissociation and electrontransfer dissociation. Anal. Chem. 2008, 80 (13), 4825–35.
(21) Taouatas, N.; Altelaar, A. F.; Drugan, M. M.; Helbig, A. O.;Mohammed, S.; Heck, A. J. Strong cation exchange-based fractionationof Lys-N-generated peptides facilitates the targeted analysis of post-translational modifications. Mol. Cell. Proteomics 2009, 8 (1), 190–200.
(22) Swaney, D. L.; McAlister, G. C.; Coon, J. J. Decision tree-driventandem mass spectrometry for shotgun proteomics. Nat. Methods 2008,5 (11), 959–64.
(23) Makarov, A.; Denisov, E.; Kholomeev, A.; Balschun, W.; Lange,O.; Strupat, K.; Horning, S. Performance evaluation of a hybrid linear iontrap/orbitrap mass spectrometer. Anal. Chem. 2006, 78 (7), 2113–20.
(24) Olsen, J. V.; Macek, B.; Lange, O.; Makarov, A.; Horning, S.;Mann, M. Higher-energy C-trap dissociation for peptide modificationanalysis. Nat. Methods 2007, 4 (9), 709–12.
(25) Zhang, Y.; Ficarro, S. B.; Li, S.; Marto, J. A. Optimized OrbitrapHCD for quantitative analysis of phosphopeptides. J. Am. Soc. MassSpectrom. 2009, 20 (8), 1425–34.

2388 dx.doi.org/10.1021/pr1011729 |J. Proteome Res. 2011, 10, 2377–2388
Journal of Proteome Research ARTICLE
(26) Kocher, T.; Pichler, P.; Schutzbier, M.; Stingl, C.; Kaul, A.;Teucher, N.; Hasenfuss, G.; Penninger, J. M.; Mechtler, K. Highprecision quantitative proteomics using iTRAQ on an LTQ Orbitrap:a new mass spectrometric method combining the benefits of all.J. Proteome Res. 2009, 8 (10), 4743–52.(27) Mischerikow, N.; van Nierop, P.; Li, K. W.; Bernstein, H. G.;
Smit, A. B.; Heck, A. J.; Altelaar, A. F. Gaining efficiency by parallelquantification and identification of iTRAQ-labeled peptides using HCDand decision tree guided CID/ETD on an LTQ Orbitrap. Analyst 2010,135 (10), 2643–52.(28) Zhang, J.; Wang, Y.; Li, S. Deuterium isobaric amine-reactive
tags for quantitative proteomics. Anal. Chem. 2010, 82 (18), 7588–95.(29) Olsen, J. V.; Schwartz, J. C.; Griep-Raming, J.; Nielsen, M. L.;
Damoc, E.; Denisov, E.; Lange, O.; Remes, P.; Taylor, D.; Splendore,M.;Wouters, E. R.; Senko, M.; Makarov, A.; Mann, M.; Horning, S. A dualpressure linear ion trap Orbitrap instrument with very high sequencingspeed. Mol Cell Proteomics 2009, 8 (12), 2759–69.(30) Second, T. P.; Blethrow, J. D.; Schwartz, J. C.; Merrihew, G. E.;
MacCoss, M. J.; Swaney, D. L.; Russell, J. D.; Coon, J. J.; Zabrouskov, V.Dual-pressure linear ion trap mass spectrometer improving the analysisof complex protein mixtures. Anal. Chem. 2009, 81 (18), 7757–65.(31) Sobott, F.; Watt, S. J.; Smith, J.; Edelmann,M. J.; Kramer, H. B.;
Kessler, B. M. Comparison of CID versus ETD based MS/MS frag-mentation for the analysis of protein ubiquitination. J. Am. Soc. MassSpectrom. 2009, 20 (9), 1652–9.(32) Scott, N. E.; Parker, B. L.; Connolly, A. M.; Paulech, J.;
Edwards, A. V.; Crossett, B.; Falconer, L.; Kolarich, D.; Djordjevic,S. P.; Hojrup, P.; Packer, N. H.; Larsen, M. R.; Cordwell, S. J.Simultaneous glycan-peptide characterization using hydrophilic inter-action chromatography and parallel fragmentation by CID, HCD andETD-MS applied to the N-linked glycoproteome of Campylobacterjejuni. Mol. Cell. Proteomics 2010, 10, M000031MCP201.(33) Nagaraj, N.; D’Souza, R. C.; Cox, J.; Olsen, J. V.; Mann, M.
Feasibility of large scale phosphoproteomics with higher energy colli-sional dissociation fragmentation. J. Proteome Res. 2010, 9, 6786–94.(34) McAlister, G. C.; Phanstiel, D.; Wenger, C. D.; Lee, M. V.;
Coon, J. J. Analysis of tandemmass spectra by FTMS for improved large-scale proteomics with superior protein quantification. Anal. Chem. 2010,82 (1), 316–22.(35) Gauci, S.; Helbig, A. O.; Slijper, M.; Krijgsveld, J.; Heck, A. J.;
Mohammed, S. Lys-N and trypsin cover complementary parts of thephosphoproteome in a refined SCX-based approach. Anal. Chem. 2009,81 (11), 4493–501.(36) Savitski, M. M.; Mathieson, T.; Becher, I.; Bantscheff, M.
H-score, a mass accuracy driven rescoring approach for improvedpeptide identification in modification rich samples. J. Proteome Res.2010, 9 (11), 5511–6.(37) Green, B. N.; Hutton, T.; Vinogradov, S. N. Analysis of complex
protein and glycoprotein mixtures by electrospray ionization massspectrometry with maximum entropy processing. Methods Mol. Biol.1996, 61, 279–94.(38) van den Toorn, H. W.; Munoz, J.; Mohammed, S.; Raijmakers,
R.; Heck, A. J.; van Breukelen, B. RockerBox: analysis and filtering ofmassive proteomics search results. J. Proteome Res. 2010, 10, 1420–4.(39) Kall, L.; Canterbury, J. D.; Weston, J.; Noble, W. S.; MacCoss,
M. J. Semi-supervised learning for peptide identification from shotgunproteomics datasets. Nat. Methods 2007, 4 (11), 923–5.(40) Sun, R. X.; Dong, M. Q.; Song, C. Q.; Chi, H.; Yang, B.; Xiu,
L. Y.; Tao, L.; Jing, Z. Y.; Liu, C.;Wang, L. H.; Fu, Y.; He, S.M. Improvedpeptide identification for proteomic analysis based on comprehensivecharacterization of electron transfer dissociation spectra. J. Proteome Res.2010, 9, 6354–67.(41) Kim, S.; Mischerikow, N.; Bandeira, N.; Navarro, J. D.; Wich,
L.; Mohammed, S.; Heck, A. J.; Pevzner, P. A. The generating function ofCID, ETD, and CID/ETD pairs of tandemmass spectra: applications todatabase search. Mol. Cel.l Proteomics 2010, 9 (12), 2840–52.(42) Mischerikow, N.; Altelaar, A. F.; Navarro, J. D.; Mohammed, S.;
Heck, A. J. Comparative assessment of site assignments in CID and
electron transfer dissociation spectra of phosphopeptides discloseslimited relocation of phosphate groups. Mol. Cell. Proteomics 2010, 9(10), 2140–8.
(43) Palumbo, A. M.; Smith, S. A.; Kalcic, C. L.; Dantus, M.;Stemmer, P. M.; Reid, G. E. Tandem mass spectrometry strategies forphosphoproteome analysis. Mass Spectrom. Rev. 2011, Epub ahead ofprint; DOI: 10.1002/mas.20310.
(44) Makarov, A.; Denisov, E.; Lange, O.; Horning, S. Dynamicrange of mass accuracy in LTQ Orbitrap hybrid mass spectrometer.J. Am. Soc. Mass Spectrom. 2006, 17 (7), 977–82.


