Embed Size (px)
Citation preview
Improving assessment and modellingof climate change impacts on globalterrestrial biodiversitySean M. McMahon1, Sandy P. Harrison2, W. Scott Armbruster3,12,13,Patrick J. Bartlein4, Colin M. Beale5, Mary E. Edwards6, Jens Kattge7,Guy Midgley8, Xavier Morin9,10 and I. Colin Prentice2,11
1 Smithsonian Institution Global Earth Observatory, Smithsonian Environmental Research Center, Edgewater, MD 21307, USA2 School of Biological Sciences, Macquarie University, North Ryde, NSW 2109, Australia3 School of Biological Sciences, University of Portsmouth, Portsmouth, UK, PO1 2DY4 Department of Geography, University of Oregon, Eugene, OR 97403, USA5 Department of Biology, University of York, York, UK, YO10 5DD6 School of Geography, University of Southampton, Southampton, UK, SO17 1BJ7 Max-Planck-Institute for Biogeochemistry, Hans-Knoll Str. 10, 07745 Jena, Germany8 South African National Biodiversity Institute, Pretoria 0001, South Africa9 Centre d’Ecologie Fonctionnelle et Evolutive, CNRS, 34293 Montpellier Cedex 5, France10 Forest Ecology Group, Institute of Terrestrial Ecosystems, Department of Environmental Sciences, ETH Zurich, 8092 Zurich,
Switzerland11 Grantham Institute, and Division of Biology, Imperial College, Silwood Park, Ascot, UK, SL5 7PY12 Institute of Arctic Biology, University of Alaska, Fairbanks, AK 99775, USA13 Department of Biology, NTNU N-7491 Trondheim, Norway
Understanding how species and ecosystems respond toclimate change has become a major focus of ecology andconservation biology. Modelling approaches provideimportant tools for making future projections, but cur-rent models of the climate-biosphere interface remainoverly simplistic, undermining the credibility of projec-tions. We identify five ways in which substantialadvances could be made in the next few years: (i) im-proving the accessibility and efficiency of biodiversitymonitoring data, (ii) quantifying the main determinantsof the sensitivity of species to climate change, (iii) incor-porating community dynamics into projections of biodi-versity responses, (iv) accounting for the influence ofevolutionary processes on the response of species toclimate change, and (v) improving the biophysical rulesets that define functional groupings of species in globalmodels.
The ‘need to know’ basis of climate change andbiodiversityBiodiversity, or the presence, abundance and genetic vari-ation of organisms in an ecosystem, underpins the provi-sion of ecological, environmental, social and economicgoods and services, and is substantially responsible forthe resilience of these services under climate change andother environmental stresses [1,2]. The conservation ofgenetic, species and ecosystem biodiversity in the face ofglobal climate change and increasing human pressure on
Review
Glossary
Adaptive capacity: the ability of a system to change in response to
environmental forcing. This could include measures of genetic variation or
phenotypic plasticity in a population or biodiversity in a community.
Allee effect: describes how small populations can show decreased growth rate
with lower population density, potentially accelerating local extirpation.
Causes can range from inbreeding depression, reduced interactions between
reproductive individuals, and lower population resilience to disturbance
because of reduced genetic variation.
Biome shifts: changes in the distribution of climatically-determined major
vegetation types in response to a change in environmental conditions.
Examples include the change from tundra to boreal forest because of
increasing temperatures in high latitudes and elevations or the change from
forest to savannah because of decreased precipitation or changes in
disturbance regimes.
CEM: climate envelope models (also referred to as ‘habitat’ or ‘niche’ models)
predict current and future species ranges based on correlations between
observed species occurrences and climate variables.
DGVM: dynamic global vegetation models simulate the distribution of major
vegetation types and terrestrial carbon cycling as a function of climatically-
determined physiological limits on the growth of component plant functional
types (PFTs) and competition between these PFTs. DGVMs can be used with
some confidence to predict changes in the broad-scale behaviour of terrestrial
vegetation in response to observed climate changes in the recent past, and are
increasingly being used to explore the consequences of future climate
scenarios.
DNA barcoding: the use of easily identified genetic markers to identify species
from any material containing genetic material. This can greatly improve the
efficiency in identifying species in the field.
Earth system models: numerical models that simulate the interactions
between global biogeochemical cycles, climate and the biosphere.
Keystone species: a species that is thought to be essential to the functioning of
a community or ecosystem.
NPP: net primary productivity refers to the change in organic mass (i.e. carbon)
in an organism, community or system over time because of the absorption of
carbon dioxide. NPP refers to the difference between photosynthesis (gross
primary productivity) and respiration.
Palaeoecology: the field in ecology that uses data (palaeo-observations)
documenting changes in past physical and biological systems to understand
the land is mandated by the International Convention onBiological Diversity (http://www.cbd.int/). There is a large
the response of ecosystems to changes in climate and other environmentalCorresponding author: McMahon, S.M. ([email protected]).
0169-5347/$ – see front matter . Published by Elsevier Ltd. doi:10.1016/j.tree.2011.02.012 Trends in Ecology and Evolution, May 2011, Vol. 26, No. 5 249

Review Trends in Ecology and Evolution May 2011, Vol. 26, No. 5
factors. For example, pollen and plant macrofossils recovered from lake
sediments can be used to reconstruct changes in vegetation assemblages
through time. These data form a record of past ecological states.
PFT: a plant functional type is a group of species that display similar
adaptations to environmental factors or perform similar functions within an
ecosystem. Plant functional types are generally defined using plant functional
traits related to, for example, life form, leaf form, phenology and bioclimatic
limits.
Plant functional traits: are measurable characteristics of plants that are
believed to be diagnostic of physiological adaptations to environmental
stressors, and are thus used to identify groups of species (or plant functional
types) that have specific advantages in given environments. Examples include
leaf mass per area (or specific leaf area), wood density and seed mass.
and fast-growing body of evidence that anthropogenicclimate change is affecting phenology and species distribu-tion, most prominently in the northern extratropics wherethe registration of climate change is most marked [3,4].Significant biome shifts (both gains and losses) have beenprojected as a result of anticipated 21st century climatechanges [5]. However, in commonwith other areas of globalchange science, the credibility of these predictions is limit-ed by incomplete theoretical understanding, predictivetools that are acknowledged to be imperfect, and insuffi-cient data to test, develop and improve model projections.
IPCCWorking Group 2 [4] identified some of the criticalchallenges to predicting climate change effects on biodi-versity. These included: (i) inadequate understanding ofthe multiplicity of interacting drivers on changes in eco-systems, especially interactions involving land manage-ment; (ii) inadequate representation of the couplingbetween ecosystems and climate in models; (iii) failureof both climate-envelope models and dynamic global vege-tation models (DGVMs) (see Glossary) to incorporate therange of processes known to influence species distribu-tions; and (iv) neglect of changing disturbance regimesas a response to, and an influence on, climate-drivenecosystem changes. The Working Group went on to makespecific recommendations for research priorities to reducethese uncertainties. Research in the four years since thepublication of the Working Group report has begun toaddress some of these issues [6,7]. Nevertheless, much
[()TD$FIG]1 2
4 3
Monitoring programs Species rangemodels
Genetic variation/plasticity Community dyn
Figure 1. A diagram showing the links between the five areas identified here as ‘gaps’ in
arrows represent the flow of information. This information can be derived from observa
monitoring (Gap 1) and genetic information (Gap 4) are the basis for descriptions of the ab
inform models about community dynamics (Gap 3) and species ranges (Gap 2). We have a
which populations change in response to climate and other factors. These process mo
functional traits, information that is needed to improve the inference of large-scale (conti
250
still remains to be done to enhance predictive capacity.Here, we adopt the pragmatic approach of identifying gapsin relevant biological knowledge that could be filled rela-tively quickly because the basic tools required already existor are being actively developed, and the obstacles to beovercome are therefore the barriers to coordination andcollaboration rather than fundamental methodologicalissues. Although many potential gaps could be identifiedthat would address climate impacts on particular speciesor biomes, we highlight generic opportunities that apply tothe determination of climate-related risks to global biodi-versity, and which are achievable in the medium term.These opportunities relate to: (i) improving the efficiencyand accessibility of biodiversity monitoring data sets; (ii)developing tools that quantify the relative importance ofclimatic and non-climatic factors in governing the distri-bution of individual species or functional groups and ac-count for them in making projections; (iii) incorporatingcommunity dynamics into models that project theresponses of species and biodiversity; (iv) consideringthe influence of genetic variability, adaptive processesand phenotypic plasticity on the responses to climatechange; and (v) representing functional diversity in DGVMand Earth Systemmodels. We examine each of these areasin turn and indicate ways to capitalize on recent progress,by integrating theoretical insights from diverse fields toimprove our modelling capacity and using modern andpalaeo-observations to test these models (Figure 1). Weconclude by suggesting ten practical measures to improvepredictive capacity.
Gap 1: improvement of comprehensive globalbiodiversity monitoringBiodiversity monitoring is carried out for two distinct butrelated goals. The first is to document natural levels ofglobal biodiversity, establishing a baseline catalogue oftaxa against which to measure changes in biodiversityand determine whether targets for biodiversity conserva-tion are being met. The second goal is to estimate rates of
5
Global vegetation models
amics
TRENDS in Ecology & Evolution
our current ability to predict the consequence of climate change for biodiversity. The
tions or large-scale models of species viability and ecosystem change. Population
undance, spatial distribution and genetic variability of species. This information can
rgued for the development and use of process models to capture the mechanisms by
dels can, in turn, provide information about the behaviour of species with similar
nental and global) terrestrial vegetation in response to climate change.

Review Trends in Ecology and Evolution May 2011, Vol. 26, No. 5
change in biodiversity and determine the mechanismsresponsible for those changes, therefore creating quantita-tive links to multiple stressors involved, potentially offer-ing an ‘early warning’ of the impacts of climate change onthe biosphere [4]. Although monitoring is improvingthrough the use of new technologies, such as DNA barcod-ing [8], camera traps (http://www.teamnetwork.org/), andstandardized sampling protocols, many local monitoringprogrammes do not have a clearly articulated purpose oran approach that allows for the quantification of errors anduncertainties [9]. Furthermore, there are major gaps in thegeographic coverage of monitoring sites in some high-di-versity biomes, including the wet tropics and much of theSouthernHemisphere. There are also crucial gaps in termsof monitoring key taxonomic and functional groups; forexample, there is almost no monitoring of soil microbialcommunities despite evidence that these play an impor-tant role in determining the successful establishment ofvegetation [10]. Furthermore, there is little considerationof the processes that influence the response of vegetation toclimate change (processes which could in turn be influ-enced by climate, such as fire) in the choice of monitoringsites.
New monitoring initiatives in Europe and North Amer-ica (e.g. the National Ecological Observatory Network:NEON [11], http://www.neoninc.org/; GEO BON [12,13])will help determine mechanisms that might put certaintaxonomic or functional groups at risk. As important asthese are, they do not address monitoring needs in biodi-versity-rich regions of the world [14]. Global programs offera way forward. The Smithsonian Institution Global EarthObservatory (SIGEO), which consists of 41 forest plotsaround the world (http://www.sigeo.si.edu/), has numeroussites in biodiversity-rich regions to monitor tree biodiver-sity. These efforts successfully catalogue an immenseamount of plot-specific baseline data on tree biodiversity,but census results also highlight global monitoring chal-lenges, especially for the second goal, understandingmechanisms that change biodiversity. For example, the1173 identified tree species (of 356 000 total trees) in the52 ha SIGEO plot in Lambir, Malaysia [15] offers animpressive beginning baseline data set (goal 1), but demon-strates the level of data collection necessary to infer re-gional species rareness, range, ecological determinants ofrange, and other variables important to biodiversitychange (goal 2). The Forest Inventory and Analysis pro-gram (http://fia.fs.fed.us/) in the United States consists ofover 140 000 small plots, effectively covering species pres-ence and abundance across the entire country, but the totalnumber of tree species in North America is less than theSIGEO site in Lambir.
Clearly, there exists a need to establish new monitoringsites and monitoring programs, balancing coverage andsampling intensity, building off of core research, but hereemphasis would be best placed on locating the sites withrespect to key geographical and ecological gaps identifiedby current programs and research, and developing processunderstanding with those data. It is also crucial thatmonitoring sites sample data relevant to climate changethreats (e.g. local climate and edaphic data). There areprotocols for monitoring biodiversity [16]: a priority is to
standardize these protocols to ensure that data collected atone site are comparable to those collected elsewhere.Establishing these protocols, and providing the trainingthat is required to implement them, will be an importantcommunity- and capacity-building effort.
Gap 2: quantifying the main determinants of thesensitivity of species to climate changeClimate can have strong and direct influence on speciesdistributions. Limitations or shifts in the distribution ofspecies can therefore offer a clear indicator of climateinduced changes in biodiversity [3]. Most models used topredict changes in species distributions rely on climaticenvelopemodels (CEMs: see e.g. [17–19]; also referred to as‘niche-based’ or ‘habitat’ models) that describe statisticalrelations between environmental variables and observeddistributions. CEMs assume thatmacro-climate acts as theprimary determinant of the distributions of species, andoffer a simple, relatively easy approach to determiningbasic climatic determinants of a species range and shiftsin that range because of changes in the input climatevariables. This most basic approach to the interface be-tween climate and biodiversity does not attempt to estab-lish the underlying mechanisms that determine ranges,such as functional traits, demographic vital rates, or com-petition. Further, CEMs treat species-climate relations asconstant and species as non-interacting entities [20] (seeGap 3) and typically disregard potentially important influ-ences of fine-scale habitat variability, temporal climatevariability, and CO2 fertilization [21]. Because of theircorrelative nature, CEMs can do a reasonable job linkingclimate to observed patterns, but future predictions de-rived from these models have no basis for assessment.Keenan et al. [22] used nine different CEM-type modelsto analyze distribution data on three Mediterranean treespecies and found that most models serviceably predictedcurrent distributions given observed variables (includingclimate and geographical data), but varied widely in howthey predicted future habitat suitability (e.g. Quercus ilexwas predicted to lose anywhere between 5.65 and 88.42percent of its current suitable habitat by the period 2050–
2080 depending on which of the nine CEM models wasused).
Can more detailed models do better? Process-basedmodels [23,24] represent a step away from the correlativefoundation of CEMs by incorporating physiological or de-mographic mechanisms to build predictions of futurechanges in species distributions [25]. The trade-off is thatthese models require information about the physiology ofspecies and local competitive interactions that is not al-ways available [26]. Comparison of CEMs and process-based models suggests substantial advances can be madeby directly modelling processes [27]. In the same articlementioned above, Keenan et al. [22] tested a model thatincorporated NPP growth because of increasing CO2 levelsand found a significant influence of this mechanism onpredictions of future suitable habitat.
Both correlative and mechanistic models of species dis-tributions typically ignore biotic and abiotic influences ongeographical distributions that are not related to climate[28]. Competition [26] and dispersal limitation [29] can
251

Review Trends in Ecology and Evolution May 2011, Vol. 26, No. 5
also play a role in defining species ranges (but see [30]). Therelative importance of climatic and non-climatic factors ininfluencing distribution varies among species and acrossranges, with some evidence that arctic/boreal species aremore strongly climate limited than temperate/tropical spe-cies [31]. Furthermore, the distribution of some speciesshows no apparent association with climate [31,32].
Understanding what determines the sensitivity of indi-vidual species to climate is of fundamental interest [24,27],but pragmatically needs to be quantified across a widerrange of functional groups. Recent statistical approacheshave focused on quantifying the degree to which speciesdistributions are in equilibrium with climate [33] or therelative contribution of climatic and non-climatic factorsusing appropriate null models to formulate testable hy-potheses [31,32]. New applications of spatially-explicithierarchical models offer an alternative modelling methodthat allows direct estimation of the relative importance ofbiotic and abiotic processes in shaping species distribu-tions. Although some work is required to determine whichof these statistical tools are most suitable for specificanalyses, and to standardize the methods, the key taskis to apply them to continental-scale datasets and identifywhich species are highly sensitive to climate and which arecomparatively insensitive. This approach might also de-termine species resilience to climate change across taxo-nomic and functional groups, facilitating improvedtreatment of resilience within global-scale models.
Gap 3: community dynamics and projections ofbiodiversity responsesAs has happened in the recent geological past (Box 1),future climate change will probably generate novel assem-blages of species, as existing communities gain and losespecies, and these different assemblages could affect large-scale patterns and processes such as biome boundary shiftsand ecosystem function [34]. Community dynamics, the
Box 1. Palaeoecological evidence
There has been wide recognition that palaeoecological studies have
an important role to play in conservation strategies: providing
baseline information about natural ecosystems, documenting the
range of responses to natural variability, and identifying situations in
which critical changes in ecosystem functioning occur [74]. The past
does not provide direct analogues for the future, but past climate
changes have been as large and as fast as those projected in the
future [75]. During the Last Glacial, for example, temperature shifts of
up to 10–16 8C occurred in Greenland and the northern extratropics,
sometimes within a few decades [76]. The response of terrestrial
ecosystems to past climate changes is documented by pollen, plant
macrofossils and organic biomarkers in, and the carbon isotopic
composition of, dated sedimentary deposits [77]. Changes in
disturbance through fire are documented by recalcitrant charcoal in
sedimentary deposits [78]. These records show that both vegetation
and disturbance adjusted to rapid climate changes during the
Last Glacial within 50–200 years of the initial disturbance ([79–81];
Figure I). The rapid vegetation response implies either rapid long-
distance migration or rapid expansion of small in situ refugial
populations in local microhabitats; both have been documented in
the fossil record and the latter mechanism is supported by both fossil
evidence (see e.g. [82]) and genetic studies of modern populations
(see e.g. [83,84]). Rapid climate changes have occurred in past warm
(interglacial) periods [85] and have also given rise to rapid changes in
252
interactions between species in an assemblage, can changeradically with the loss of certain species, affecting thepersistence of communities and their consequent contribu-tion to biomes and the biosphere (Figure 1). Species arelinked through interactions such as competition, predationand mutualism. Depending on the strength and structureof these links, the loss of a species because of climatechange or other human interventions can radically affectthe behaviour of the entire system [35]. The collapse of acommunity can exceptionally occur with the loss of a single‘keystone’ species [36], but functional redundancy andgeneralist interactions, both allowing extirpated speciesroles in the community to be filled by other species, canbuffer communities against multiple extinctions. The out-come of interactions between species, although crucial toinference about large-scale patterns, is difficult to predictand requires extensive information about population andspecies networks (Figure 1). Better predictions about com-munity dynamics begins with sound ecological knowledgeabout which species interact and with what effect. With anincrease of data from monitoring programs (Gap 1), aconcerted effort should be put into systematizing thisknowledge as it relates to community dynamics for predic-tive purposes at large scales.
A number of new methods estimate how changes in thephysical environment can affect species interactions. Sto-chastic demographic models combine information aboutlife-history change over time under different environmen-tal conditions and can be built in such a way (e.g. usinghierarchical Bayesian methods) that they offer extrapola-tion of output over space and into the future [37,38]. As thetaxonomic and geographical scope of local and regionalmodels of communities increases, output from these mod-els should provide insight into common behaviours ofcommunities that can be applied broadly. Thebault andFontaine [39] demonstrated that mutualistic networks ofplants and pollinators and trophic networks of herbivores
ecosystems and disturbance (e.g. [86]). Detailed studies of the
response of terrestrial vegetation to climate changes since the Last
Glacial Maximum (ca 21 000 years ago) show that species respond in
an individualistic way to climate changes, giving rise to assemblages
that do not occur today [87]. At certain times in the past, vegetation
types that are today confined to small areas expanded to occupy very
large areas of the northern continents [88]. Palaeodata provide an
observational basis for understanding the multi-faceted responses
to diverse, large and sometimes very rapid climate changes, far
beyond the limited palette represented by the instrumental record
[18]. Although there have been examples where palaeoecological
information has been used to guide conservation or restoration
activities (e.g. [89]), only limited use has been made of palaeoeco-
logical evidence to date in the context of biodiversity studies [90].
This is partly because palaeoecology has, until recently, largely been
site focused and descriptive. With the advent of global data sets
documenting key aspects of the terrestrial biosphere (e.g. vegetation
distribution; fire: [78,80]), and statistical tools to analyze such data
sets, palaeoecological data can now be used to quantify the relations
between climate change and ecosystem responses. Furthermore, the
large-scale synthesis facilitated by these data sets provides concrete
tests of the ability of DGVMs to simulate processes, such as
migration, which operate at timescales precluding the use of historic
records.

[()TD$FIG]
Rapid warming events Rapid cooling events
Tem
pera
ture
inde
xC
O2
(ppm
)D
ust c
once
ntra
tion
(ng
g-1 )
4
3
2
1
0
-1
-2
-3
-4
100
50
0
-50
-100
50
25
0
-25
-50
0.2
0.1
0
-0.1
-0.2
20
10
0
-10
-20
2000
1000
0
-1000
-2000
2000 1000 0 1000 2000 2000 1000 0 1000 2000(Before event) (Before event)(After event) (After event)
Fire (C
harcoal Z-S
cores)N
2 O (ppbv)
CH
4 (ppbv)
TRENDS in Ecology & Evolution
Years Years
Figure I. Superposed epoch analysis of ice-core and biomass-burning records over the interval 80 ka to 10 ka. This analysis shows the consistent response of a time
series to the repeated occurrence of the abrupt warming and cooling events that define the Dansgaard-Oeschger (D-O) cycles during the Last Glacial period. The
Greenland oxygen-isotope record (a), an index of regional temperature, shows the characteristic saw-tooth pattern of an individual D-O cycle, is compared to ice-core
records of (b) CH4, (c) CO2, (d) N2O, and (e) dust concentration (an index of vegetation cover, with more vegetation meaning less dust erosion and transport), and (f) a
composite curve of transformed and standardized charcoal concentrations (an index of biomass burning) from a global network of terrestrial and marine cores. All of
these records show distinctive responses associated with the occurrence of abrupt warming or cooling in Greenland [79].
Review Trends in Ecology and Evolution May 2011, Vol. 26, No. 5
and plants are stable over time with very different inter-action architectures. Mutualist networks show greaterstability with highly connected and nested network archi-tecture, whereas trophic networks show greater stabilitywhen highly modular and loosely connected. Combiningquantified expectations of interaction outcomes using newmodelling approaches with theoretical expectations of com-munity stability and resilience based on interaction archi-tecture offers a promising way to build predictions aboutecosystem changes. These quantified links can then informlarge-scale simulations that cannot explicitly model thecomplexity of fine-scale community dynamics.
Gap 4: accounting for the influence of genetic variabilityand adaptive processes on species responses to climatechangePopulations of nearly all species of sexually reproducingorganisms exhibit considerable genetic variation. Esti-mates of genetic variation, based on selection studies[40], quantitative genetic studies [41], and studies of neu-tral markers and quantitative trait loci [42], suggest thatmost populations of most species have significant potentialto respond evolutionarily to changing climate, givenenough time and selective pressure [43]. For a given levelof genetic variation, a functionally significant evolutionary
253
Box 2. Plant functional types and global modelling
Functional classification of plant species has been seen as a
necessary tool for monitoring the effects of environmental change
and ecosystem management (e.g. [91]), for mapping vegetation
patterns (e.g. [88]), and most particularly, for the construction of
global vegetation models (e.g. [55]). It is now widely recognized that
there are two broad, non-congruent, categories of functional types:
functional effect types and functional response types [54]. Func-
tional effect types group together species that have a common
impact on one or more aspects of ecosystem functioning, such as
productivity, decomposition or nutrient availability (see e.g. [92]).
Functional response types group together species that have a
common response to one or more environmental factors, such as
climate stressors, resource availability or disturbance (see e.g. [53]).
Plant functional types can be classified a priori based on assump-
tions about functionality or based on correlations between mor-
phological, physiological, biogeochemical, reproductive or
demographic characteristics or traits. Several functional classifica-
tion schemes have been proposed (see e.g. [50,93]), adapted for
specific purposes. Global models, whether these are stand-alone
equilibrium or dynamic vegetation models (DGVMs) or representa-
tions of vegetation dynamics within the land-surface schemes of
earth system models, use a scheme related to the functional
response to climate and assuming a priori that life form (e.g. tree,
shrub, herb), leaf type (e.g. broadleaf, needleleaf, scaleleaf) and
phenology (e.g. deciduous, evergreen) are key traits with climatic
significance (see [50]). These schemes could additionally recognize
categories related to bioclimatic thresholds, for example tolerance
with respect to extreme low or high temperatures (e.g. cold
hardiness, heat stress mortality). In general, through computational
limitations and lack of empirical data, the number of plant functional
types used in global models (see Table S1) is considerably smaller
in number than the number of such types used for vegetation
mapping or monitoring purposes. This opens up the possibility of
using existing empirical research on plant response types with
respect to, for example, disturbance through grazing or fire, nutrient
status, and atmospheric CO2 concentration (e.g. [53]), to expand
these classifications. The recognition that both functionality and
response are expressed through readily observable traits [54]
means that the ever-growing datasets on trait distribution could
also be exploited to refine functional classification schemes.
Review Trends in Ecology and Evolution May 2011, Vol. 26, No. 5
response to climate change is inversely proportional togeneration time and positively correlated with the magni-tude of environmental change, contingent upon demo-graphic contributions to fitness [44]. The most probablecandidates for evolutionary response to rapid climatechange will therefore be short-lived species, such as bacte-ria, arthropods and annual plants, and species experienc-ing the largest shifts in climate or disturbance regime.Plasticity, the development of a range of phenotypes fromone genotype [41], is an alternative response to climatechange. Plasticity can be non-adaptive (e.g. reduced repro-ductive output in stunted organisms) or adaptive (e.g.smaller leaves increasing survival in heat- or drought-stressed plants). Selection for greater plasticity has beendemonstrated for breeding dates of passerine birds inresponse to climate change [45].
The process of change in range can itself lead to evolu-tion, particularly at the leading and trailing edges of thespecies range [46], albeit with a cost in effective populationsize and genetic variation. Selection pressures at leadingand trailing edges are different because the environmentsare different: at the leading edge, the species is migratinginto an already established community, whereas at thetrailing edge it is suffering demographic decline and po-tential Allee effects. Evolutionary potential at the leadingedge can be enhanced or impeded by gene flow from themain range of the species, but at the trailing edge evolutionwill depend on existing genetic variation and can be affect-ed by isolation of populations.
Genetic variation and micro-evolutionary capacity arerarely taken into account in predictions of species or ecosys-tem responses to climate change, partly because of a lack ofsystematized information. The role of genetic diversity andphenotypic plasticity in buffering communities against theeffects of changing climate could be assessed by combiningexperimentally derived data and knowledge of spatial pro-cesses in ecosystem and vegetation models. Taxonomicpatterns of plasticity andadaptive capacity can be identifiedby meta-analysis of existing population-genetic data,with broad representation across clades, supplemented bylaboratory tests of species responses to specific climatestresses. A particularly promising advancement in this typeof analysis involves the mathematical integration of popu-lation-genetic and phylogenetic-comparative methods forassessing both short-term and long-term evolutionary re-sponse of populations and species to changing climate [47].
Gap 5: improving the biophysical rule sets that definefunctional groupings of plant species in global modelsDGVMs (e.g. [48]) simulate changes in vegetation distri-bution, allowing for competition between different plantfunctional types (PFTs) rather than species (Box 2). Thecurrent generation of DGVMs employs a limited set ofPFTs (< 15 PFTs, Table S1), as do land-surface schemesin climate models (see e.g. [49]) (Table S1). This simplifi-cation of biodiversity is an elegant solution that providescredible simulations of biogeochemical processes and eco-system structure, but constrains their usefulness for pre-dicting how future climate changes might affect vegetationdistribution and biodiversity. One way to improve thebiological realism of DGVMs is to increase the number
254
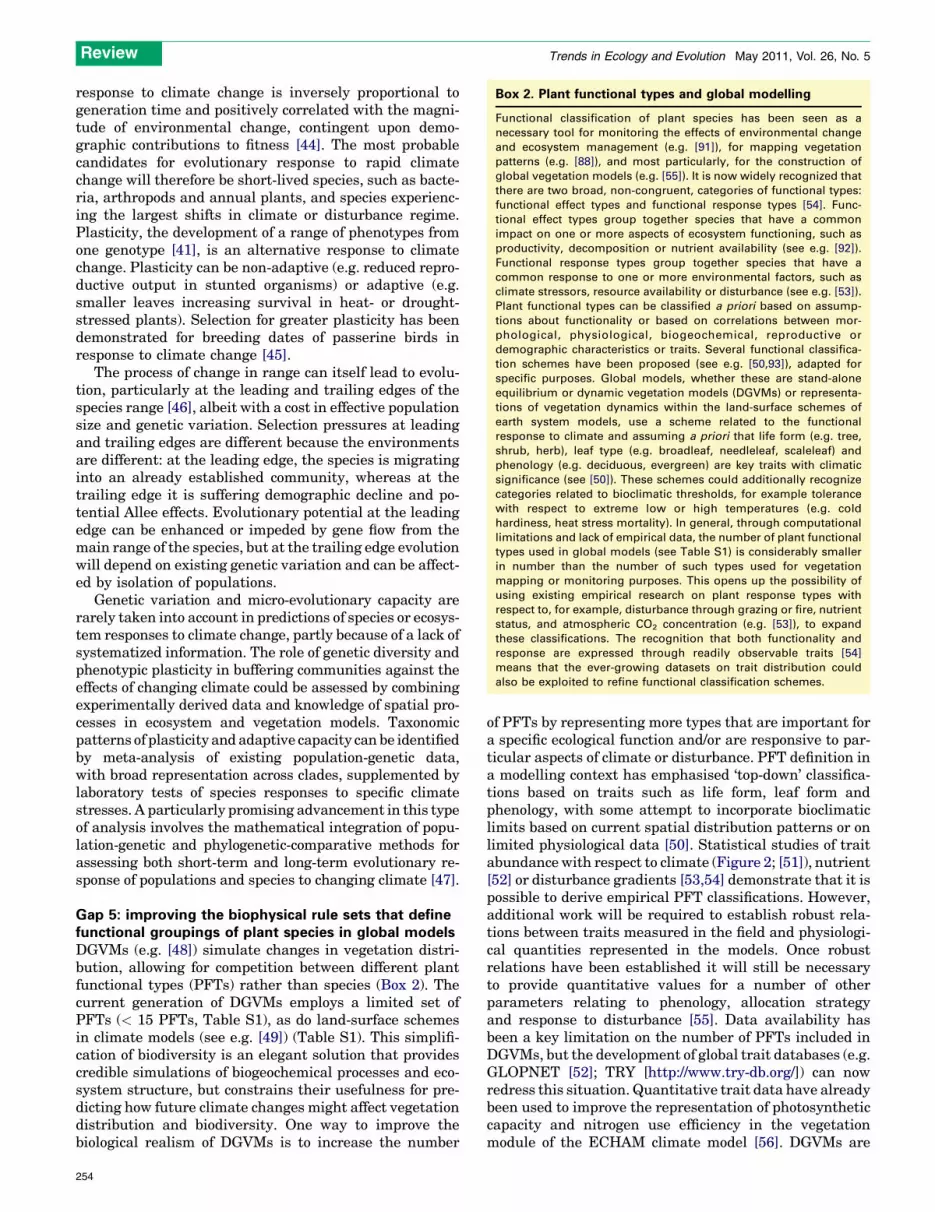
of PFTs by representing more types that are important fora specific ecological function and/or are responsive to par-ticular aspects of climate or disturbance. PFT definition ina modelling context has emphasised ‘top-down’ classifica-tions based on traits such as life form, leaf form andphenology, with some attempt to incorporate bioclimaticlimits based on current spatial distribution patterns or onlimited physiological data [50]. Statistical studies of traitabundance with respect to climate (Figure 2; [51]), nutrient[52] or disturbance gradients [53,54] demonstrate that it ispossible to derive empirical PFT classifications. However,additional work will be required to establish robust rela-tions between traits measured in the field and physiologi-cal quantities represented in the models. Once robustrelations have been established it will still be necessaryto provide quantitative values for a number of otherparameters relating to phenology, allocation strategyand response to disturbance [55]. Data availability hasbeen a key limitation on the number of PFTs included inDGVMs, but the development of global trait databases (e.g.GLOPNET [52]; TRY [http://www.try-db.org/]) can nowredress this situation. Quantitative trait data have alreadybeen used to improve the representation of photosyntheticcapacity and nitrogen use efficiency in the vegetationmodule of the ECHAM climate model [56]. DGVMs are

[()TD$FIG]
.7
.6
.5
.4
.3
.2
.1
0.0
.6
.5
.4
.3
.2
.1
0.0
.6
.5
.4
.3
.2
.1
0.0
.6
.5
.4
.3
.2
.1
0.0
400
300
200
100
01 2 3 4 5
Pic
o
Lept
o
Nan
o
Mic
roN
oto
Mes
o
Mac
ro
Leaf size
TRENDS in Ecology & Evolution
Num
ber
of s
ites
All species
Tree
Perennial forb
Perennial grass Annual grass
Annual forb
shrub
R2=0.40
R2=0.84
R2=0.22
R2=0.07 R2=0.23
R2=0.24
R2=0.47
αα
αα
GDD0 (Kdays)
2000
2500
3000
3500
4000
4500
5000
2000
2500
3000
3500
4000
4500
5000
1-2Key:
2.1-33.1-44.1-55.1-6
Figure 2. An example of climate-trait relations along climate gradients in China (from [51]). Expression of average leaf size as a function of aridity (as measured by the ratio of
actual to potential evapotranspiration, a) and summer temperate (as measured by the accumulated temperature sum during the growing season above 0 8C, GDD0) across all
species and within different life forms. For analytical purposes, leaf size was divided into 7 categories: 1 = pico (leaf area< 5 mm2), 2 = lepto (leaf area 5–25 mm2), 3 = nano (leaf
area 25–250 mm2), 4 = micro (leaf area 250–2000 mm2), 5 = noto (leaf area 2000–4500 mm2), 6 = meso (leaf area 4500–20 000 mm2), and 7 = macro (leaf area 20 000–150 000 mm2).
Leaf size decreases with increasing aridity and with increasing summer temperature, overall and within most life forms. The relations are all statistically significant ( p < 0.001).
Review Trends in Ecology and Evolution May 2011, Vol. 26, No. 5
also moving beyond ‘hard-wired’ specification of parametervalues for PFTs to allow environmentally plastic traits toadapt to environmental changes [57,58], in which casequantitative trait data are equally important to test mod-elled trait values (Gap 4).
Improved PFT representation in DGVMs will requiresystematic studies of trait relations with key environmen-tal factors, and the refinement of the rule sets that definePFTs in the current generation of DGVMs. Further devel-
opment of existing trait databases will be needed to havesufficient coverage of all pertinent traits. Table S2 lists asubset of traits we have identified as the most crucial, andthe availability of measurements of these traits in the TRYdatabase. (This is not a comprehensive list but does repre-sent a growing consensus on the most important primaryinformation likely to be needed, and obtainable, to repre-sent PFTs in next-generation DGVMs. Measurements onall of these traits however are available for only about 50
255

Review Trends in Ecology and Evolution May 2011, Vol. 26, No. 5
species. Additional field measurements might need to bemade in key ecosystems, but should be complemented byexploitation of other resources such as regional floras orherbaria [51]; this is increasingly feasible, given the rapidgrowth of digital resources. Until recently, trait researchhas focused on how the possession of particular traits, ortrait combinations, affects plant performance. Additional
Table 1. Description of existing models used to predict the distribhas specific characteristics (drivers, spatial scale) and specific pu
Type of model Examples Level of
development
Drivers
Demographic
models
Sortie [66]
ForClim [67]
ED [68]
Individual/
population
Abiotic
(climate,
nutrient, so
conditions
water
availability
land-use) a
biotic (intr
and inter-
specific
competitio
SDMs Climatic envelope
habitat-based
BIOCLIM [69]
BIOMOD [70]
Species Abiotic
(climate, s
conditions
Process-based NicheMapper [71]
Phenofit [72,73]
Individual/
population/
species
DGVMs LPJ [48] Functional
types/ biomes
Abiotic
(climate, s
conditions
land-use) a
biotic (only
among
functional
types)
256
research is required on how traits or suites of traits pos-sessed collectively by co-existing species influence ecosys-tem function. Meta-analyses will be needed to link traits,demographic characteristics and environmental factors ina phylogenetic context. There needs to be a closer integra-tion between statistical analyses of traits and processstudies relating traits explicitly to plant performance, to
ution of populations, species or vegetation types. Each modelrposes, gaps and advantages
Spatial scale Purposes Advantages Gaps
il
,
,
nd
a-
n)
Landscape/
regional
Relative
abundance of
species in a
community
Explicit
representation
of population
dynamics and
competition
Progress to be
made on the
effect of
climate, link
with species
distribution
[Gap 1, 3,4]
oil
)
Regional/
continental
Predicting the
impact of
climate change
on species
distribution
Possible to
calibrate for
many
organisms /
widely used in
conservation
plans
Validation
problematic,
progress to be
made on
incorporation
of ecological
processes and
incorporation
of genetic
variability
improvement
of migration
processes/
evolutionary
processes [Gap
2–4]
Understanding
current species
distributions
and predicting
the impact of
climate change
on
distributions
External
validation is
possible,
identifying
limiting factors
and processes
for observed
species ranges
and for
predictions,
can
incorporate
climate factors
but also other
factors (e.g.
land-use), can
take account of
genetic
variability
across
individuals/
populations
Requires
ecological
knowledge
(which
increases as
spatial scale
becomes
finer), relevant
ecological
data, currently
developed for
only a few taxa,
lack of
migration
processes [Gap
2–3]
oil
,
nd
Continental/
global
Identifying
limiting factors
and processes
for observed
biomes/
predicting the
impact of
global change
on biome
distribution
Global picture
of vegetation-
disturbance
regimes
Definition of
functional
types, only
broad-scale
changes [Gap
3, 5]

Review Trends in Ecology and Evolution May 2011, Vol. 26, No. 5
be able to use trait data operationally for ecosystemmodel-ling. Ideally, a new rule set for PFT definition shouldaccount for trade-offs between investment in key traitsthat underpin both simulation of PFT performance under arange of climate conditions and the outcome of competitiveinteractions between them.
Modelling future changes in biodiversity:considerations and caveatsModelling currently provides the most comprehensive andflexible approach to generating probabilistic projections ofchanges in biodiversity under future climate scenarios.Models can use new information derived from observationsor other model output to forecast dynamics in complexcontexts, such as global change. To advance estimates ofbiodiversity loss under climate change, existing modelsneed to take into account the importance of climatic andnon-climatic factors to species ranges, the influence ofdisturbance on species and ecosystems, of species interac-tions in determining population dynamics, and the poten-tial for species to adjust to climate changes through plasticresponses, adaptive evolution andmigration. However, theconstruction of evermore complexmodels incorporating allof these multifarious interactions and processes is notnecessarily a good solution. Model complexity has a cost,in terms of computing resources and increased error prop-agation.
As in climate modelling (see e.g. [59]), it is probable thatunderstanding the impact of climate change on biodiversi-ty will require the application of a hierarchy of ecologicalmodels; the choice of model being dependent on the type ofquestion being asked and the spatio-temporal scale ofinterest [25]. Existing models (Table 1) have been designedfor various purposes and operate at different scales. Link-ing existing models that operate at compatible scales couldprovide a way forward: for instance, linking species distri-bution and demographic models to take biotic interactionsinto account [46], and linkingmechanistic dispersalmodelswith DGVMs to simulate migration processes [60]. Theincorporation of dispersal processes and constraints inDGVMs has been extensively discussed [34]; the requiredtheory development is advancing [61] and has been incor-porated to some degree in landscape-scale modelling [62].
Genetic diversity and the potential effects of climatechange on biodiversity as mediated through plastic orevolutionary responses are not yet considered at any levelin this hierarchy of models. Advances in evolutionaryecology need to be incorporated within the modellingframework. We have argued that increasing the numberof PFTs within existing DGVMs, particularly if this expan-sion is based on analyses of trait–climate relations,will produce a major improvement in our ability to modelfuture changes in biodiversity. It should also be possibleto incorporate genetic diversity and adaptive plasticitywithin PFTs through probabilistic representation ofkey processes. It should be possible now to incorporatedispersal andmigration explicitly (perhaps probabilistical-ly) into DGVMs as well. We suspect the main limitationto doing this has been the lack of relevant observationsto test the response of ecosystems and species to rapidclimate changes. However, the palaeorecord offers useful
targets [62] and a global perspective on such response isnow possible thanks to the collection and compilation ofpalaeoecological data covering multiple episodes of rapidclimate change (see Box 1).
Perhaps the opportunity for the most rapid progressthrough a hierarchical approach lies in applying processrepresentations that have been developed for DGVMs tolocal and regional scale analyses by translating dynami-cally modelled ‘species envelopes’ into DGVM parameters.One variant of this approach has been successfully imple-mented for relatively depauperate tree floras of northernEurope [63] and proposed as feasible for the tree flora ofNorth America [64]. In this variant, the aim is dynamicsimulation using the full DGVM with species substitutedfor PFTs, but this would be impractical for large anddiverse assemblages. An alternative approach would onlypredict changes in species ranges (dynamically determined[Gaps 2 and 3]) but would do so with improved predictiveconfidence. Further, this approach would allow inclusionof directly measured quantitative trait information (e.g.extreme cold tolerance) where available and generalizationto a wider set of organisms through the substitution ofclimate controlled variables for different life-history char-acteristics [65].
Conclusions and recommendationsWehave identified five research areas in which substantialprogress could be made in the near future that wouldimprove understanding of large-scale biodiversity–climaterelations and advance the predictive ability of climate–
biosphere models (Figure 1). Progress requires action, andwe have identified ten measures (1–10 below) that need tobe taken. (1) Creating on-line repositories for data fromexisting monitoring sites will allow real-time access toglobal datasets on biodiversity and also assist in ensuringdata quality and facilitating synthesis. (2) The globalmonitoring of biodiversity will also benefit from standard-izing protocols for measuring biodiversity, accompanied byprovision of training in their implementation. This willalso facilitate capacity building in developing regions thatcontain the majority of the species on earth. (3) Establish-ing monitoring sites that fill key geographical and ecologi-cal gaps is crucial to understanding species ranges andcommunity dynamics. (4) The development and applica-tion of methodological and statistical toolkits that can usemonitoring data will aid in the quantification of speciessensitivity to climatic and non-climatic factors. The appli-cation of new statistical tools will also help (5) quantify thesensitivity of individual species to climate across taxonom-ic and functional groups. (6) Meta-analyses of laboratoryand field observations of genetic diversity can begin todetermine the relation between genetic patterns and resil-ience to climate change across broad geographic regionsand taxanomic units. (7) Expanding trait databases byadding information from regional floras and herbariaand targeted field campaigns will (8) help derive improvedparameterizations and more realistic PFT classificationsin DGVMs. (9) Incorporating demographic processes, plas-ticity, genetic variability and dispersal within DGVMs willalso aid in developing better large-scale models of vegeta-tion change. Finally, (10) the application of hierarchical
257

Review Trends in Ecology and Evolution May 2011, Vol. 26, No. 5
modelling approaches using multiple sources of data, in-cluding palaeodata, to address biodiversity responses toenvironmental changes at different temporal and spatialscales will critically improve predictive models of biodiver-sity change under current and future climate scenarios.
We do not wish to suggest that these are the onlymeasures that would improve understanding of how cli-mate change will affect biodiversity. Rather, these actionsaddress tractable problems that through enhanced colla-borations between different scientific communities canmore effectively address global changes in biodiversity.This ‘big science’ effort will require collaboration betweenecologists, physiologists, climatologists, statisticians, com-puter scientists, and other disciplines. Above all, we mustincorporate isolated, place-based study of communities andpopulations into continental and global frameworks ofquantitative biodiversity modelling. Such an effort canincorporate the abundance of insights gained from ecologi-cal field studies into a quantitative framework applicableto conservation policy.
AcknowledgementsThis paper was conceived at a workshop on Biodiversity and ClimateChange held at the Royal Botanic Gardens, Kew and sponsored byQUEST (http://quest.bris.ac.uk/), a flagship programme of the UKNatural Environment Research Council (NERC), the GranthamInstitute for Climate Change at Imperial College London, and theRoyal Botanic Gardens, Kew. We thank the workshop organizers forproviding a workshop structure that allowed us to focus on gaps andpractical solutions, and the other participants for stimulating discussions.This manuscript has benefited from comments by Georgina Mace. Partialfunding for SMM came from HSBC Bank Climate Partnership.
Appendix A. Supplementary dataSupplementary data associated with this article can befound, in the online version, at doi:10.1016/j.tree.2011.02.012.
References1 Folke, C. et al. (2005) Regime shifts, resilience and biodiversity in
ecosystem management. Annual Review of Ecology Evolution andSystematics 35, 557–581
2 Thompson, I. et al. (2009) Forest Resilience, Biodiversity, and ClimateChange. A Synthesis of the Biodiversity/Resilience/StabilityRelationship in Forest Ecosystems. CBD Technical Series No. 43,Secretariat of the Convention on Biological Diversity.
3 Parmesan, C. and Yohe, G. (2003) A globally coherent fingerprint ofclimate change impacts across natural systems. Nature 421, 37–42
4 Fischlin, A. and Midgley, G.F. (2007) Contribution of working group IIto the Fourth Assessment Report of the Intergovernmental Panel onClimate Change. In Climate Change 2007: Impacts, Adaptation andVulnerability (Parry, M.L. et al., eds), Cambridge University Press
5 Williams, J.W. et al. (2007) Projected distributions of novel anddisappearing climates by 2100 AD. PNAS 104, 5738–5742
6 Kapos, V. et al. (2008) Carbon and Biodiversity: A Demonstration Atlas,UNEP-WCMC
7 Heller, N.E. and Zavaleta, E.S. (2009) Biodiversity management in theface of climate change: a review of 22 years of recommendations.Biological Conservation 142, 14–32
8 Lahaye, R. et al. (2008) DNA barcoding the floras of biodiversityhotspots. Proc. Natl. Acad. Sci. U.S.A. 105, 2923
9 Yoccoz, N.G. et al. (2001) Monitoring of biological diversity in space andtime. Trends Ecol. Evol. 16, 446–453
10 Lindenmayer, D. (1999) Future directions for biodiversity conservationin managed forests: indicator species, impact studies and monitoringprograms. Forest Ecol. Manag. 115, 277–287
11 Pereira, H.M. and Cooper, H.D. (2006) Towards the global monitoringof biodiversity change. Trends Ecol. Evol. 123–129
258
12 Mace, G.M. et al. (2010) Biodiversity targets after 2010. Curr. Opin.Environ. Sustainability 2, 3–8
13 Scholes, R.J. et al. (2008) Toward a global biodiversity observingsystem. Science 321, 1044–1045
14 Danielsen, F. et al. (2003) Biodiversity monitoring in developingcountries: what are we trying to achieve? Oryx 37, 1–3
15 Lee, H. et al. (2002) Floristic and structural diversity of 52 hectares ofmixed dipterocarp forest in Lambir Hills National Park, Sarawak,Malaysia. J. Trop. Forest Sci. 14, 379–400
16 Hurford, C. et al., eds (2009) Conservation Monitoring in FreshwaterHabitats: A Practical Guide and Case Studies, Springer
17 Epstein, H.E. et al. (2007) Simulating future changes in arctic andsubarctic vegetation. Comput. Sci. Eng. 9, 12–23
18 Mckenney, D.W. et al. (2007) Potential impacts of climate change on thedistribution of North American trees. Bioscience 57, 939–948
19 Thomas, C.D. et al. (2006) Range retractions and extinction in the faceof climate warming. Trends Ecol. Evol. 21, 415–416
20 Heikkinen, R.K. et al. (2006) Methods and uncertainties in bioclimaticenvelope modelling under climate change. Prog. Phys. Geography 30,751–777
21 Willis, K.J. and Bhagwat, S.A. (2009) Biodiversity and climate change.Science 326, 806–807
22 Keenan, T. et al. (2011) Predicting the future of forests in theMediterranean under climate change, with niche- and process-basedmodels: CO2 matters! Global Change Biol. 17, 565–579
23 Morin, X. et al. (2007) Process-based modeling of tree species’distributions. What limits temperate tree species’ range boundaries?Ecology 88, 2280–2291
24 Kearney, M. and Porter, W. (2009) Mechanistic niche modelling:combining physiological and spatial data to predict species’ ranges.Ecol. Lett. 12, 334–350
25 Morin, X. and Lechowicz, M.J. (2008) Contemporary perspectives onthe niche that can improvemodels of species range shifts under climatechange. Biol. Lett. 4, 573–576
26 Clark, J.S. et al. (2010) High dimensional coexitence based onindividual variation: a synthesis of evidence.Ecol. Monogr. 80, 569–608
27 Morin, X. and Thuiller, W. (2009) Comparing niche- and process-basedmodels to reduce prediction uncertainty in species range shifts underclimate change. Ecology 90, 1301–1313
28 Meier, E.S. et al. (2011) Co-occurrence patterns of trees along macro-climatic gradients and their potential influence on the present andfuture distribution of Fagus sylvatica L. J. Biogeography 38, 371–
38229 Condit, R. (2002) Beta-diversity in tropical forest trees. Science 295,
666–66930 Gove, A. et al. (2009) Dispersal traits linked to range size through range
location, not dispersal ability, in Western Australian angiosperms.Global Ecol. Biogeography 18, 596–606
31 Beale, C. et al. (2008) Opening the climate envelope reveals nomacroscale associations with climate in European birds. Proc. Natl.Acad. Sci. U.S.A. 105, 14908
32 Chapman, D.S. (2010) Weak climatic associations among British plantdistributions. Global Ecol. Biogeography 19, 831–841
33 Svenning, J.C. and Skov, F. (2004) Limited filling of the potential rangein European tree species. Ecol. Lett. 7, 565–573
34 Neilson, R.P. et al. (2005) Forecasting regional to global plantmigration in response to climate change. Bioscience 55, 749–759
35 Bastolla, U. et al. (2009) The architecture of mutualistic networksminimizes competition and increases biodiversity. Nature 458, 1018–
102036 Paine, R.T. (1995) A conversation on refining the concept of keystone
species. Conservation Biol. 9, 962–96437 Evans, M. et al. (2008) Modeling the effect of fire on the demography of
Dicerandra frutescens ssp (Lamiaceae), an endangered plant endemicto Florida scrub. Popul. Ecol. 50, 53–62
38 Latimer, A.M. et al. (2009) Hierarchical models facilitate spatialanalysis of large data sets: a case study on invasive plant species inthe northeastern United States. Ecol. Lett. 12, 144–154
39 Thebault, E. and Fontaine, C. (2010) Stability of ecologicalcommunities and the architecture of mutualistic and trophicnetworks. Science 329, 853–856
40 Falconer, D. and MacKay, T. (1996) Introduction to QuantitativeGenetics, Longman

Review Trends in Ecology and Evolution May 2011, Vol. 26, No. 5
41 Schlichting, C.D. and Pigliucci, M. (1998) Phenotypic Evolution,Sinauer
42 Jackson, T. et al. (1998) Identification of two QTL influencing uppertemperature tolerance in three rainbow trout (Oncorhynchus mykiss)half-sib families. Heredity 80, 143–151
43 Jump, A. et al. (2009) The altitude-for-latitude disparity in the rangeretractions of woody species. Trends Ecol. Evol. 24, 694–701
44 Metcalf, C. and Pavard, S. (2007)Why evolutionary biologists should bedemographers. Trends Ecol. Evol. 22, 205–212
45 Nussey, D. et al. (2005) Selection on heritable phenotypic plasticity in awild bird population. Science 310, 304–306
46 Thuiller, W. et al. (2008) Predicting global change impacts on plantspecies’ distributions: future challenges. Perspect. Plant Ecol., Evol.Syst. 9, 137–152
47 Salamin, N. et al. (2010) Assessing rapid evolution in a changingenvironment. Trends Ecol. Evol. 25, 692–698
48 Sitch, S. et al. (2003) Evaluation of ecosystem dynamics, plantgeography and terrestrial carbon cycling in the LPJ dynamic globalvegetation model. Global Change Biol. 9, 161–185
49 Krinner, G. et al. (2005) A dynamic global vegetation model for studiesof the coupled atmosphere-biosphere system. Global Biogeochem.Cycles 19, 1–33
50 Harrison, S.P., Prentice, I.C., Sutra, J-P., Barboni, D., Kohfeld, K.E.and Ni, J. (2010) Towards a global scheme of plant functional types forecosystem modelling, palaeoecology and climate impact research. J.Vegetation Sci. 21, 300–317
51 Meng, T. et al. (2009) Plant morphometric traits and climate gradientsin northern China: a meta-analysis using quadrat and flora data. Ann.Bot. 104, 1217–1229
52 Wright, I.J. et al. (2004) The worldwide leaf economics spectrum.Nature 428, 821–827
53 Diaz, S. et al. (2007) Plant trait responses to grazing – a globalsynthesis. Global Change Biol. 13, 313–341
54 Lavorel, S. (2007) Plant functional types: are we getting any closer tothe Holy Grail? In Terrestrial Ecosystems in a Changing World(Canadell, J.G. et al., eds), pp. 149–164, Springer-Verlag
55 Prentice, I.C. et al. (2007) Dynamic global vegetation modelling:quantifying terrestrial ecosystem responses to large-scaleenvironmental change. In Terrestrial Ecosystems in a ChangingWorld (Canadell, J.G., ed.), Springer-Verlag
56 Kattge, J. et al. (2009) Quantifying photosynthetic capacity andnitrogen use efficiency for earth system models. Global Change Biol.15, 976–991
57 Scheiter, S. and Higgins, S.I. (2009) Impacts of climate change on thevegetation of Africa: an adaptive dynamic vegetation modellingapproach. Global Change Biol. 15, 2224–2246
58 Zaehle, S. and Friend, A.D. (2010) Carbon and nitrogen cycle dynamicsin the O-CN land surface model: 1 Model description, site-scaleevaluation, and sensitivity to parameter estimates. GlobalBiogeochem. Cycl. 24, DOI: 10.1029/2009GB003521
59 Treut, L. et al. (2007) Historical overview of climate change. In ClimateChange 2007: The Physical Science Basis. Contribution of WorkingGroup I to the Fourth Assessment Report of the Intergovernmental Panelon Climate Change (Solomon, S., ed.), Cambridge University Press
60 Midgley, G.F. et al. (2007) Plant species migration as a key uncertaintyin predicting future impacts of climate change on ecosystems: progressand challenges. In Terrestrial Ecosystems in a Changing World(Canadell, J., ed.), pp. 129–137, Springer
61 Nathan, R. et al. (2008) Mechanisms of long-distance seed dispersal.Trends Ecol. Evol. 23, 638–647
62 Lischke, H. et al. (2006) TreeMig: a forest-landscape model forsimulating spatio-temporal patterns from stand to landscape scale.Ecol. Model 199, 409–420
63 Miller, P.A. et al. (2008) Exploring climatic and biotic controls onHolocene vegetation change in Fennoscandia. J. Ecol. 96, 247–259
64 Purves, D. and Pacala, S. (2008) Predictive models of forest dynamics.Science 320, 1452–1453
65 Kearney, M and Porter, W. (2009) Mechanistic niche modelling:combining physiological and spatial data to predict species’ ranges.Ecol. Lett. 12, 334–350
66 Pacala, S.W. and Deutschman, D.J. (1995) Details that matter: thespatial structure of individual trees maintains forest ecosystemfunction. Oikos 74, 357–365
67 Bugmann, H.K.M. (1996) A simplified forest model to study speciescomposition along climate gradients. Ecology 77, 2055–2074
68 Moorcroft, P.R. et al. (2001) A method for scaling vegetation dynamics:the ecosystem demography model (ED). Ecol. Monogr. 71, 557–585
69 Nix, H. (1986) A biogeographic analysis of Australian elapid snakes. InAtlas of Elapid Snakes of Australia (Longmore, R., ed.), pp. 4–15,Australian Government Publishing Service
70 Thuiller, W. (2003) BIOMOD - optimizing predictions of speciesdistributions and projecting potential future shifts under globalchange. Global Change Biol. 9, 1353–1362
71 Kearney, M. et al. (2009) Integrating biophysical models andevolutionary theory to predict climatic impacts on species’ ranges:the dengue mosquito Aedes aegypti in Australia. Funct. Ecol. 23, 528–
53872 Chuine, I. and Beaubien, E.G. (2001) Phenology is amajor determinant
of tree species range. Ecol. Lett. 4, 500–51073 Morin, X. et al. (2007) Process-based modeling of species’ distributions:
what limits temperate tree species’ range boundaries? Ecology 88,2280–2291
74 Davies, A.L. and Bunting, M.J. (2010) Applications of palaeoecology inconservation. Open Ecol. J. 3, 54–67
75 Jansen, E. et al. (2007) Palaeoclimate. In Climate Change 2007: ThePhysical Science Basis. Contribution of Working Group I to the FourthAssessment Report of the Intergovernmental Panel on Climate Change(Solomon, S., ed.), Cambridge University Press
76 Wolff, E.W. et al. (2010) Millennial-scale variability during the lastglacial: the ice core record. Quaternary Sci. Rev. 29, 2828–2838
77 Bradley, R. (1985) Quaternary Paleoclimatology: Methods ofPaleoclimatic Reconstruction, Allen & Unwin
78 Power, M.J. et al. (2008) Changes in fire activity since the LGM: anassessment based on a global synthesis and analysis of charcoal data.Climate Dyn. 30, 887–907
79 Arneth, A. et al. (2010) Terrestrial biogeochemical feedbacks in theclimate system. Nat. Geosci. 3, 525–532
80 Daniau, A.L. et al. (2010) Fire regimes during the last glacial.Quaternary Sci. Rev. 29, 2918–2930
81 Harrison, S.P. and Sanchez Goni, M.F. (2010) Global patterns ofvegetation response to millennial-scale variability during the lastglacial: a synthesis. Quaternary Sci. Rev. 29, 2957–2980
82 Bradshaw, R.H.W. and Zackrisson, O (1990) A two thousand yearhistory of a northern Swedish boreal forest stand. Quaternary Sci.Rev. 29, 2918–2930
83 McLachlan, J.S. et al. (2005) Molecular indicators of tree migrationcapacity under rapid climate change. Ecology 86, 2088–2098
84 Provan, J. and Bennett, K.D. (2008) Phylogeographic insights intocryptic glacial refugia. Trends Ecol. Evol. 23, 564–571
85 Wang, Y. et al. (2008) Millennial- and orbital-scale changes inthe East Asian monsoon over the past 224 000 years. Nature 451,1090–1093
86 Marchant, R. and Hooghiemstra, H. (2004) Rapid environmentalchange in African and South American tropics around 4000 yearsbefore present: a review. Earth Sci. Rev. 66, 217–260
87 Williams, J.W. et al. (2004) Late-quaternary vegetation dynamicsin North America: scaling from taxa to biomes. Ecol. Monogr. 74,309–334
88 Bigelow, N.H. et al. (2003) Climatic change and Arctic ecosystems I.Vegetation changes north of 558N between the last glacial maximum,mid-Holocene, and present. J. Geophys. Research-Atmosphere 108,8170
89 Burney, D.A and Burney, L.P. (2007) Paleoecology and ‘‘inter-situ’’restoration on Kaua’i, Hawai’i. Front Ecol. Environ. 5, 483–490
90 Froyd, C.A. andWillis, K.J. (2008) Emerging issues in biodiversity andconservation management: the need for a palaeoecological perspective.Quaternary Sci. Rev. 27, 1723–1732
91 Dormann, C.F. and Woodin, S.J. (2002) Climate change in the Arctic:using plant functional types in a meta-analysis of field experiments.Funct. Ecol. 16, 4–17
92 Cornwell, W.K. et al. (2008) Plant species traits are the predominantcontrol on litter decomposition rates within biomes worldwide. Ecol.Lett. 11, 1065–1071
93 Diaz, S. and Cabido, M. (1997) Plant functional types and ecosystemfunction in relation to global change. J. Vegetation Sci. 8, 463–474
259


