Embed Size (px)
Citation preview
In-depth characterization of the microRNAtranscriptome in a leukemia progression modelFlorian Kuchenbauer,1,4 Ryan D. Morin,2,4 Bob Argiropoulos,1 Oleh I. Petriv,3
Malachi Griffith,2 Michael Heuser,1 Eric Yung,1 Jessica Piper,1 Allen Delaney,2
Anna-Liisa Prabhu,2 Yongjun Zhao,2 Helen McDonald,2 Thomas Zeng,2 Martin Hirst,2
Carl L. Hansen,3 Marco A. Marra,2,5,6 and R. Keith Humphries1,5,6
1Terry Fox Laboratory, BC Cancer Agency, Vancouver, British Columbia V5Z 1L3, Canada; 2Genome Sciences Centre,BC Cancer Agency, Vancouver, British Columbia V5Z 1L3, Canada; 3Michael Smith Laboratories, University of British Columbia,Vancouver V6T 1Z1, British Columbia, Canada
MicroRNAs (miRNAs) have been shown to play important roles in physiological as well as multiple malignantprocesses, including acute myeloid leukemia (AML). In an effort to gain further insight into the role of miRNAs inAML, we have applied the Illumina massively parallel sequencing platform to carry out an in-depth analysis of themiRNA transcriptome in a murine leukemia progression model. This model simulates the stepwise conversion of amyeloid progenitor cell by an engineered overexpression of the nucleoporin 98 (NUP98)–homeobox HOXD13 fusiongene (ND13), to aggressive AML inducing cells upon transduction with the oncogenic collaborator Meis1. From thisdata set, we identified 307 miRNA/miRNA* species in the ND13 cells and 306 miRNA/miRNA* species inND13+Meis1 cells, corresponding to 223 and 219 miRNA genes. Sequence counts varied between two and 136,558,indicating a remarkable expression range between the detected miRNA species. The large number of miRNAsexpressed and the nature of differential expression suggest that leukemic progression as modeled here is dictated bythe repertoire of shared, but differentially expressed miRNAs. Our finding of extensive sequence variations (isomiRs)for almost all miRNA and miRNA* species adds additional complexity to the miRNA transcriptome. A stringenttarget prediction analysis coupled with in vitro target validation revealed the potential for miRNA-mediated releaseof oncogenes that facilitates leukemic progression from the preleukemic to leukemia inducing state. Finally, 55 novelmiRNAs species were identified in our data set, adding further complexity to the emerging world of small RNAs.
[Supplemental material is available online at www.genome.org.]
MicroRNAs (miRNAs) are short RNA molecules, 19–25 nucleo-tides (nt) in length, recently identified to play key roles in regu-lating gene expression by inhibiting translation and/or triggeringdegradation of target mRNAs (Bartel 2004). Their maturationfrom a primary miRNA transcript (pri-miRNAs) to pre-miRNAhairpins and finally short double-stranded RNA duplexes is regu-lated by the nucleoplasmic enzyme RNASEN and its cytoplasmiccounterpart DICER1 (Lund et al. 2004). Based on thermodynamicstability, one of the mature strands is thought to be preferentiallyincorporated into the RNA inducing silencing complex (RISC)protein complex, producing a biologically active miRNA,whereas the other is considered as inactive strand called miRNA*(star) or passenger strand (O’Toole et al. 2006). The maturemiRNA comprises a “seed region”, including the nucleotides 2–7of the 5� end (Grimson et al. 2007). The seed region primarilydefines the specificity of a miRNA toward the 3� UTR of its targetmRNAs (Grimson et al. 2007; Jongen-Lavrencic et al. 2008). EachmiRNA generally has a few hundred predicted target mRNAs, but
only a small set of these interactions have been experimentallyvalidated. Thus far, 678 human miRNA sequences have beencataloged (miRBase, release 11, 2008) and identified by eithercloning or computational prediction.
The emerging awareness of the large number of miRNAs,their complex expression patterns, and broad range of potentialtargets has triggered major interest in understanding their pos-sible regulatory functions. Indeed it is now clear that miRNAsplay critical roles in physiological (Looijenga et al. 2007; Park etal. 2007; Tang et al. 2007; Thatcher et al. 2007; Wang et al. 2007)as well as multiple malignant processes (Bandres et al. 2007; Her-nando 2007; Jay et al. 2007; Looijenga et al. 2007; Lui et al. 2007;Negrini et al. 2007; Porkka et al. 2007; Sevignani et al. 2007; Shellet al. 2007; Tran et al. 2007; Yu et al. 2007b). Specifically in thecontext of hematologic malignancies, seminal studies from thegroup of Carlo Croce have strongly linked miRNAs to lymphomadevelopment (Calin et al. 2002, 2004, 2005). Recent findingsindicate miRNA expression profiling as a useful tool for classifi-cation and prognostic purposes in acute myelogenous leukemia(AML) (Debernardi et al. 2007; Mi et al. 2007; Garzon et al. 2008;Isken et al. 2008) and point to involvement of specific miRNAslike miR-223 and the miRNA 17-106a cluster in myeloid regula-tory networks such as CEBPA and the receptor for CSF1 (alsoknown as M-CSF) (Fazi et al. 2005, 2007; Fontana et al. 2007).These initial findings encourage further efforts directed at obtain-ing a comprehensive and quantitative picture of the miRNA tran-
4These authors contributed equally to this work.5These authors contributed equally to this work.6Corresponding authors.E-mail [email protected]; fax (604) 675-8178.E-mail [email protected]; fax (604) 877-0712.Article published online before print. Article and publication date are at http://www.genome.org/cgi/doi/10.1101/gr.077578.108.
Letter
18:1787–1797 ©2008 by Cold Spring Harbor Laboratory Press; ISSN 1088-9051/08; www.genome.org Genome Research 1787www.genome.org
scriptome to gain further insights into the multistep process ofAML development.
Such efforts to date have principally relied on methods todetect single miRNAs or on a larger scale to profile the miRNAtranscriptome using real-time PCR or microarray platforms.These methods are limited as they are restricted to the detectionand profiling of known miRNA sequences previously identifiedby sequencing or homology searches (Griffiths-Jones 2006).These approaches feature reliable reproducibility and facilitateclustering of samples by similar miRNA expression profiles (Davi-son et al. 2006; Porkka et al. 2007). Alternative sequenced-basedmethods for miRNA profiling, while initially complex and ex-pensive due to laborious cloning techniques (Aravin and Tuschl2005; Pfeffer et al. 2005), are now becoming practical due to thedevelopment of “next generation” sequencing strategies. In ad-dition to enabling the detection of miRNA variation in maturemiRNA length, as well as enzymatic modification of miRNAssuch as RNA editing (Kawahara et al. 2007) and 3� nucleotideadditions (Ruby et al. 2006; Landgraf et al. 2007), these newerhigh-throughput strategies permit high-resolution views of ex-pressed miRNAs over a wide dynamic range of expression levels.In-depth miRNA profiling by sequencing has already been real-ized in several tissues from different organisms including Cae-norhabditis elegans (Ruby et al. 2006), Arabidopsis thaliana (Mar-gulies et al. 2005), primates (Berezikov et al. 2006b), and humanembryonic stem cells (Morin et al. 2008) using massively parallelsequencing.
In an effort to gain further insights into the role of miRNAsin AML, we have applied the Illumina massively parallel sequenc-ing platform to carry out an in-depth, quantitative compara-tive analysis of miRNA expression in a murine model of leukemiaprogression (Pineault et al. 2005). This leukemia model simulatesthe stepwise conversion of a nonleukemic myeloid progenitorcell, induced from normal mouse bone marrow by engineeredoverexpression of the nucleoporin 98 (NUP98)–homeoboxgene HOXD13 fusion gene (ND13), to a highly aggressive AMLinducing cells upon transduction with the potent oncogenic col-laborator Meis1 (Pineault et al. 2005; Pineault et al. 2003). Ourresults provide a comprehensive view of the miRNA transcrip-tome in a well-defined leukemia progression model and revealboth a striking repertoire of expressed miRNAs, including iden-tification of 55 novel miRNAs, and a remarkable range of expres-sion levels spanning some five orders of magnitude. Interest-ingly, few miRNAs were detected that were uniquely expressed inthe preleukemic versus leukemic state, but multiple differentiallyexpressed miRNAs were identified, thus suggesting that the func-tional role for miRNAs in leukemic transformation may be highlycomplex. Adding to this complexity, we show that almost allmiRNAs exhibited isoforms of variable length and thus poten-tially distinct function.
Results
All experiments were carried out using a Hox-based leukemia pro-gression model as previously described (Pineault et al. 2005). Tomodel the preleukemic state, we used a murine bone marrow–derived cell line generated by transduction with the ND13 fusiongene. These cells are growth factor dependent and are transplant-able, giving rise to short-term myeloid restricted repopulationwithout evolution to leukemia over extended in vivo follow-up(Pineault et al. 2005). As a model of progression to the leukemic
state, we transduced the ND13 cell line with the Hox cofactorMeis1, thus generating a cell line that remains growth factor de-pendent but induces aggressive and rapidly fatal myeloid leu-kemia upon transplantation (Pineault et al. 2003, 2005). Both celllines exhibit stable, homogenous, and almost identical immunephenotypes of primitive hematopoietic progenitors and stabledifferential in vivo functional properties of preleukemic versusleukemic cells (for details, refer to Methods and SupplementalFig. 1).
Sequencing and annotation of small RNAs
Small RNAs were isolated from the preleukemic progenitor line,hereafter referred to as ND13, and the leukemic line, here-after referred to as ND13+Meis1, and processed to allow deepsequencing on the Illumina platform (previously known asSolexa sequencing). A total of 9.56 � 107 and 7.23 � 107 readswere sequenced from the myeloid progenitor ND13 and leuke-mic ND13+Meis1 cell lines, respectively, producing (after re-moval of ambiguous reads), 3.4 � 106 (ND13) and 2.6 � 106
(ND13+Meis1) unique 27 nt reads. After mapping the sequencesto the mouse genome (NCBI Build 37), a total of 3.90 � 105
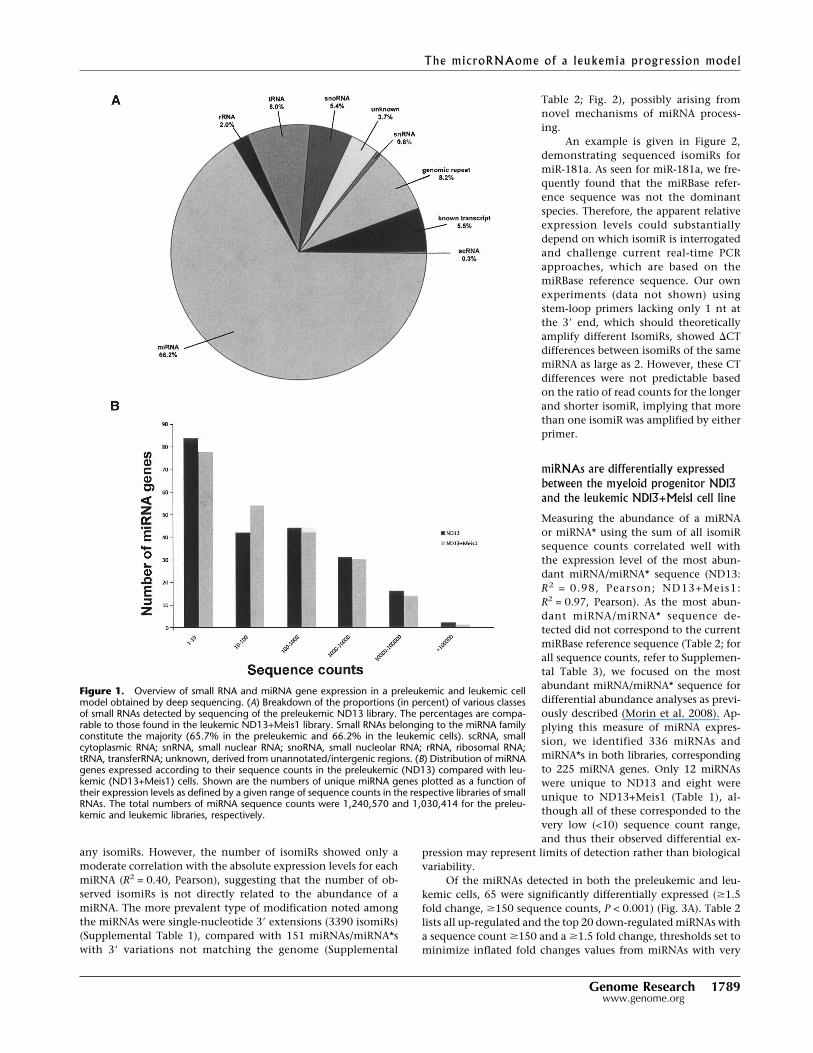
(ND13) and 2.96 � 105 (ND13+Meis1) unique small RNA se-quences remained. Each of these sequences was classified eitheras a known class of small RNAs, genomic repeats, degradationfragments of larger noncoding RNAs, known mRNA sequences,or small RNAs deriving from unannotated intergenic regions(Fig. 1A). The most abundant (based on read count) RNA speciesin both libraries were classifiable as known miRNAs (65% of to-tal) (Fig. 1A) and corresponding to some 220 miRNA genes (seebelow and Table 1). The ranges of all sequence counts for eachmiRNA gene are plotted in Figure 1B. Both libraries show a simi-lar distribution of expression levels with count ranges for a givenunique miRNA species, spanning two (to minimize considerationof reads deriving from sequencing errors, singletons were ex-cluded, see Methods) to over 1.3 � 105 (ND13) and 1 � 106
(ND13+Meis1) sequence counts, respectively. Exemplified forND13 cells, ∼8% of miRNAs and miRNA*s were detected at highsequence counts (>104), and ∼14% were detected in the interme-diate 103–104 sequence count range; the remaining 77% weredetected in the low range of two to 1000 sequence counts. Thusthe sequence data reveal a wide range of expression levels formiRNAs spanning over five orders of magnitude (Table 1).
Sequence variations in miRNAs
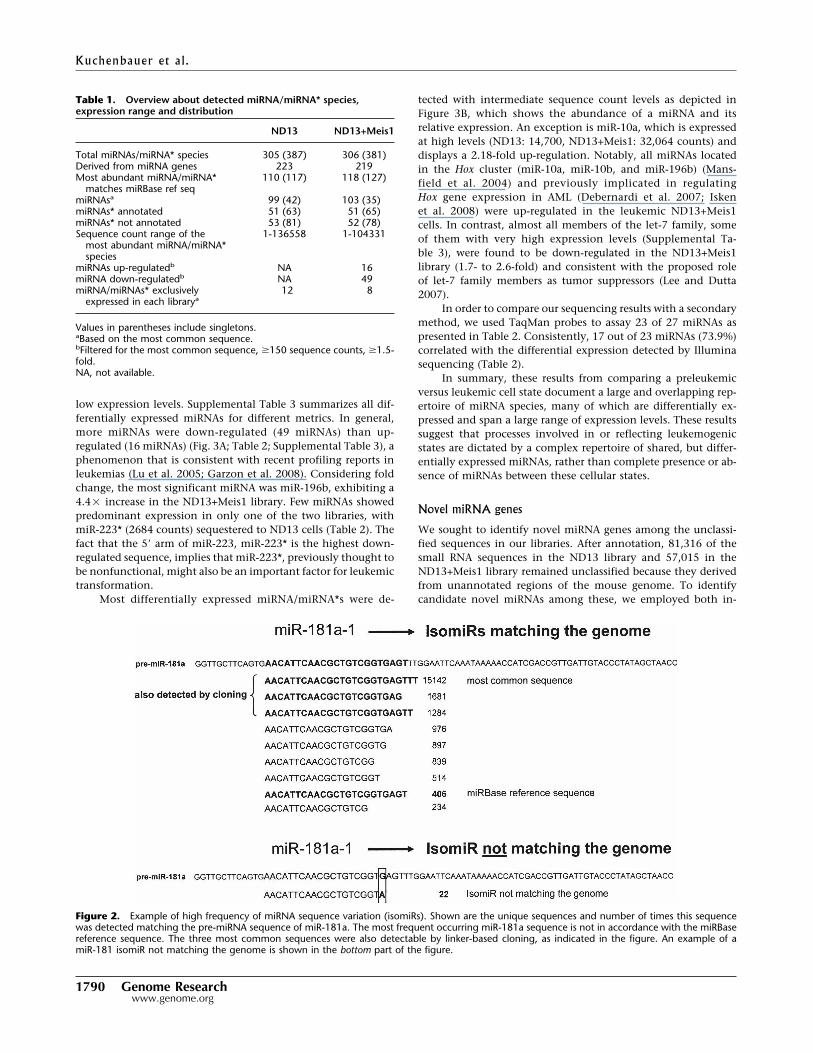
In both libraries, miRNA sequences frequently exhibited varia-tions from their “reference” sequences as currently described inmiRBase, thus indicating multiple mature variants that we here-after refer to as isomiRs. Evidence of isomiRs of a similar naturewere also detected in a limited sequence analysis using a linker-based miRNA cloning approach from the same RNA pools (Fu etal. 2005), suggesting that isomiRs are not due to artifacts createdfrom massively parallel sequencing (Fig. 2). Our analysis revealedtwo major classes of variants or isomiRs. Most isomiRs show vari-ability at their 5� and/or 3� ends, likely resulting from variationsin the pre-miRNA secondary structures that result in variablecleavage sites for RNASEN and DICER. In total, we found 3390isomiRs for a total of 336 sequenced miRNAs and miRNA*s, cor-responding to 225 miRNA genes from both libraries (Table 1;Supplemental Table 1). The number of different isomiRs for agiven miRNA ranged from one to 74. Only 22 miRNAs ormiRNA*s (all with very low sequence counts, <50) did not exhibit
Kuchenbauer et al.
1788 Genome Researchwww.genome.org
any isomiRs. However, the number of isomiRs showed only amoderate correlation with the absolute expression levels for eachmiRNA (R2 = 0.40, Pearson), suggesting that the number of ob-served isomiRs is not directly related to the abundance of amiRNA. The more prevalent type of modification noted amongthe miRNAs were single-nucleotide 3� extensions (3390 isomiRs)(Supplemental Table 1), compared with 151 miRNAs/miRNA*swith 3� variations not matching the genome (Supplemental
Table 2; Fig. 2), possibly arising fromnovel mechanisms of miRNA process-ing.
An example is given in Figure 2,demonstrating sequenced isomiRs formiR-181a. As seen for miR-181a, we fre-quently found that the miRBase refer-ence sequence was not the dominantspecies. Therefore, the apparent relativeexpression levels could substantiallydepend on which isomiR is interrogatedand challenge current real-time PCRapproaches, which are based on themiRBase reference sequence. Our ownexperiments (data not shown) usingstem-loop primers lacking only 1 nt atthe 3� end, which should theoreticallyamplify different IsomiRs, showed �CTdifferences between isomiRs of the samemiRNA as large as 2. However, these CTdifferences were not predictable basedon the ratio of read counts for the longerand shorter isomiR, implying that morethan one isomiR was amplified by eitherprimer.
miRNAs are differentially expressedbetween the myeloid progenitor ND13and the leukemic ND13+Meis1 cell line
Measuring the abundance of a miRNAor miRNA* using the sum of all isomiRsequence counts correlated well withthe expression level of the most abun-dant miRNA/miRNA* sequence (ND13:R2 = 0.98, Pearson; ND13+Meis1:R2 = 0.97, Pearson). As the most abun-dant miRNA/miRNA* sequence de-tected did not correspond to the currentmiRBase reference sequence (Table 2; forall sequence counts, refer to Supplemen-tal Table 3), we focused on the mostabundant miRNA/miRNA* sequence fordifferential abundance analyses as previ-ously described (Morin et al. 2008). Ap-plying this measure of miRNA expres-sion, we identified 336 miRNAs andmiRNA*s in both libraries, correspondingto 225 miRNA genes. Only 12 miRNAswere unique to ND13 and eight wereunique to ND13+Meis1 (Table 1), al-though all of these corresponded to thevery low (<10) sequence count range,and thus their observed differential ex-
pression may represent limits of detection rather than biologicalvariability.
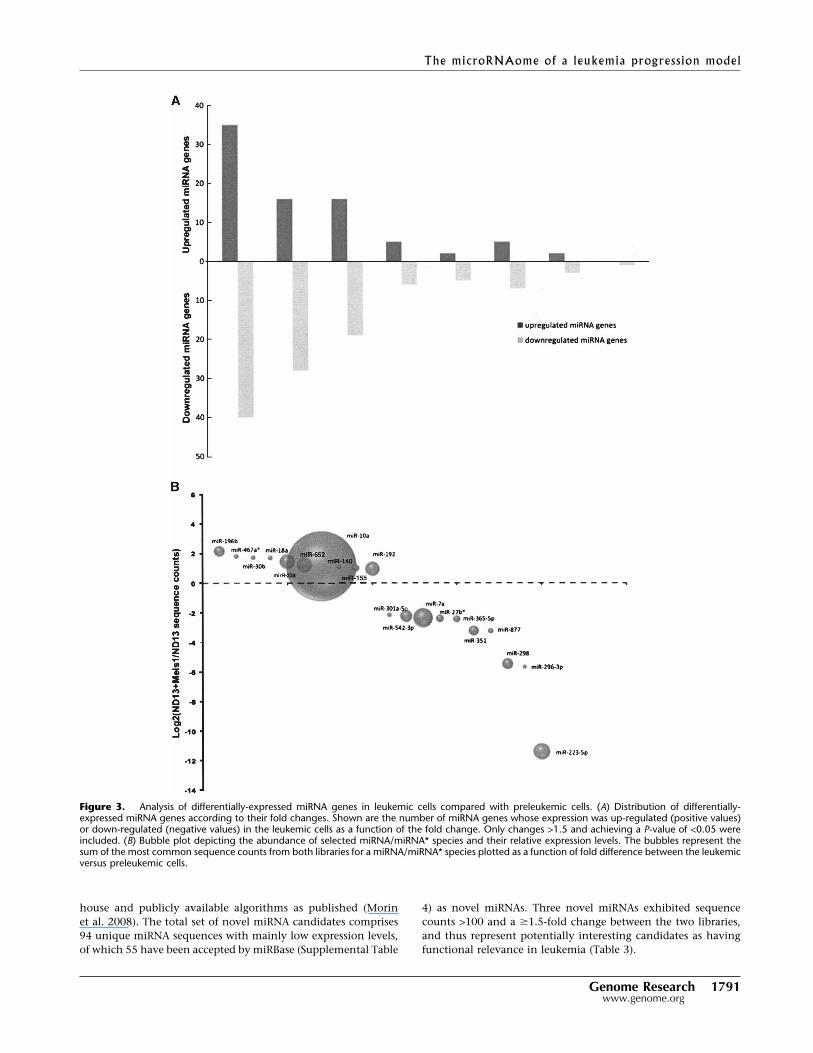
Of the miRNAs detected in both the preleukemic and leu-kemic cells, 65 were significantly differentially expressed (�1.5fold change, �150 sequence counts, P < 0.001) (Fig. 3A). Table 2lists all up-regulated and the top 20 down-regulated miRNAs witha sequence count �150 and a �1.5 fold change, thresholds set tominimize inflated fold changes values from miRNAs with very
Figure 1. Overview of small RNA and miRNA gene expression in a preleukemic and leukemic cellmodel obtained by deep sequencing. (A) Breakdown of the proportions (in percent) of various classesof small RNAs detected by sequencing of the preleukemic ND13 library. The percentages are compa-rable to those found in the leukemic ND13+Meis1 library. Small RNAs belonging to the miRNA familyconstitute the majority (65.7% in the preleukemic and 66.2% in the leukemic cells). scRNA, smallcytoplasmic RNA; snRNA, small nuclear RNA; snoRNA, small nucleolar RNA; rRNA, ribosomal RNA;tRNA, transferRNA; unknown, derived from unannotated/intergenic regions. (B) Distribution of miRNAgenes expressed according to their sequence counts in the preleukemic (ND13) compared with leu-kemic (ND13+Meis1) cells. Shown are the numbers of unique miRNA genes plotted as a function oftheir expression levels as defined by a given range of sequence counts in the respective libraries of smallRNAs. The total numbers of miRNA sequence counts were 1,240,570 and 1,030,414 for the preleu-kemic and leukemic libraries, respectively.
The microRNAome of a leukemia progression model
Genome Research 1789www.genome.org
low expression levels. Supplemental Table 3 summarizes all dif-ferentially expressed miRNAs for different metrics. In general,more miRNAs were down-regulated (49 miRNAs) than up-regulated (16 miRNAs) (Fig. 3A; Table 2; Supplemental Table 3), aphenomenon that is consistent with recent profiling reports inleukemias (Lu et al. 2005; Garzon et al. 2008). Considering foldchange, the most significant miRNA was miR-196b, exhibiting a4.4� increase in the ND13+Meis1 library. Few miRNAs showedpredominant expression in only one of the two libraries, withmiR-223* (2684 counts) sequestered to ND13 cells (Table 2). Thefact that the 5� arm of miR-223, miR-223* is the highest down-regulated sequence, implies that miR-223*, previously thought tobe nonfunctional, might also be an important factor for leukemictransformation.
Most differentially expressed miRNA/miRNA*s were de-
tected with intermediate sequence count levels as depicted inFigure 3B, which shows the abundance of a miRNA and itsrelative expression. An exception is miR-10a, which is expressedat high levels (ND13: 14,700, ND13+Meis1: 32,064 counts) anddisplays a 2.18-fold up-regulation. Notably, all miRNAs locatedin the Hox cluster (miR-10a, miR-10b, and miR-196b) (Mans-field et al. 2004) and previously implicated in regulatingHox gene expression in AML (Debernardi et al. 2007; Iskenet al. 2008) were up-regulated in the leukemic ND13+Meis1cells. In contrast, almost all members of the let-7 family, someof them with very high expression levels (Supplemental Ta-ble 3), were found to be down-regulated in the ND13+Meis1library (1.7- to 2.6-fold) and consistent with the proposed roleof let-7 family members as tumor suppressors (Lee and Dutta2007).
In order to compare our sequencing results with a secondarymethod, we used TaqMan probes to assay 23 of 27 miRNAs aspresented in Table 2. Consistently, 17 out of 23 miRNAs (73.9%)correlated with the differential expression detected by Illuminasequencing (Table 2).
In summary, these results from comparing a preleukemicversus leukemic cell state document a large and overlapping rep-ertoire of miRNA species, many of which are differentially ex-pressed and span a large range of expression levels. These resultssuggest that processes involved in or reflecting leukemogenicstates are dictated by a complex repertoire of shared, but differ-entially expressed miRNAs, rather than complete presence or ab-sence of miRNAs between these cellular states.
Novel miRNA genes
We sought to identify novel miRNA genes among the unclassi-fied sequences in our libraries. After annotation, 81,316 of thesmall RNA sequences in the ND13 library and 57,015 in theND13+Meis1 library remained unclassified because they derivedfrom unannotated regions of the mouse genome. To identifycandidate novel miRNAs among these, we employed both in-
Figure 2. Example of high frequency of miRNA sequence variation (isomiRs). Shown are the unique sequences and number of times this sequencewas detected matching the pre-miRNA sequence of miR-181a. The most frequent occurring miR-181a sequence is not in accordance with the miRBasereference sequence. The three most common sequences were also detectable by linker-based cloning, as indicated in the figure. An example of amiR-181 isomiR not matching the genome is shown in the bottom part of the figure.
Table 1. Overview about detected miRNA/miRNA* species,expression range and distribution
ND13 ND13+Meis1
Total miRNAs/miRNA* species 305 (387) 306 (381)Derived from miRNA genes 223 219Most abundant miRNA/miRNA*
matches miRBase ref seq110 (117) 118 (127)
miRNAsa 99 (42) 103 (35)miRNAs* annotated 51 (63) 51 (65)miRNAs* not annotated 53 (81) 52 (78)Sequence count range of the
most abundant miRNA/miRNA*species
1-136558 1-104331
miRNAs up-regulatedb NA 16miRNA down-regulatedb NA 49miRNA/miRNAs* exclusively
expressed in each librarya12 8
Values in parentheses include singletons.aBased on the most common sequence.bFiltered for the most common sequence, �150 sequence counts, �1.5-fold.NA, not available.
Kuchenbauer et al.
1790 Genome Researchwww.genome.org
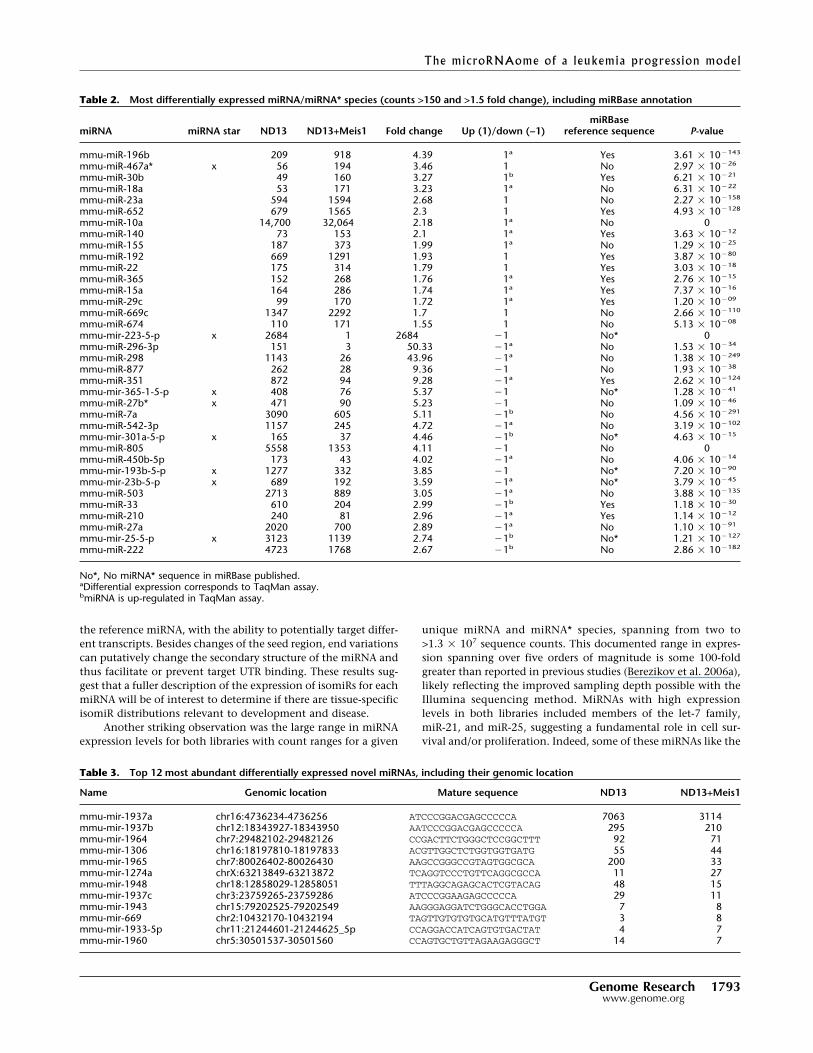
house and publicly available algorithms as published (Morinet al. 2008). The total set of novel miRNA candidates comprises94 unique miRNA sequences with mainly low expression levels,of which 55 have been accepted by miRBase (Supplemental Table
4) as novel miRNAs. Three novel miRNAs exhibited sequencecounts >100 and a �1.5-fold change between the two libraries,and thus represent potentially interesting candidates as havingfunctional relevance in leukemia (Table 3).
Figure 3. Analysis of differentially-expressed miRNA genes in leukemic cells compared with preleukemic cells. (A) Distribution of differentially-expressed miRNA genes according to their fold changes. Shown are the number of miRNA genes whose expression was up-regulated (positive values)or down-regulated (negative values) in the leukemic cells as a function of the fold change. Only changes >1.5 and achieving a P-value of <0.05 wereincluded. (B) Bubble plot depicting the abundance of selected miRNA/miRNA* species and their relative expression levels. The bubbles represent thesum of the most common sequence counts from both libraries for a miRNA/miRNA* species plotted as a function of fold difference between the leukemicversus preleukemic cells.
The microRNAome of a leukemia progression model
Genome Research 1791www.genome.org
Targets of differentially expressed miRNAs
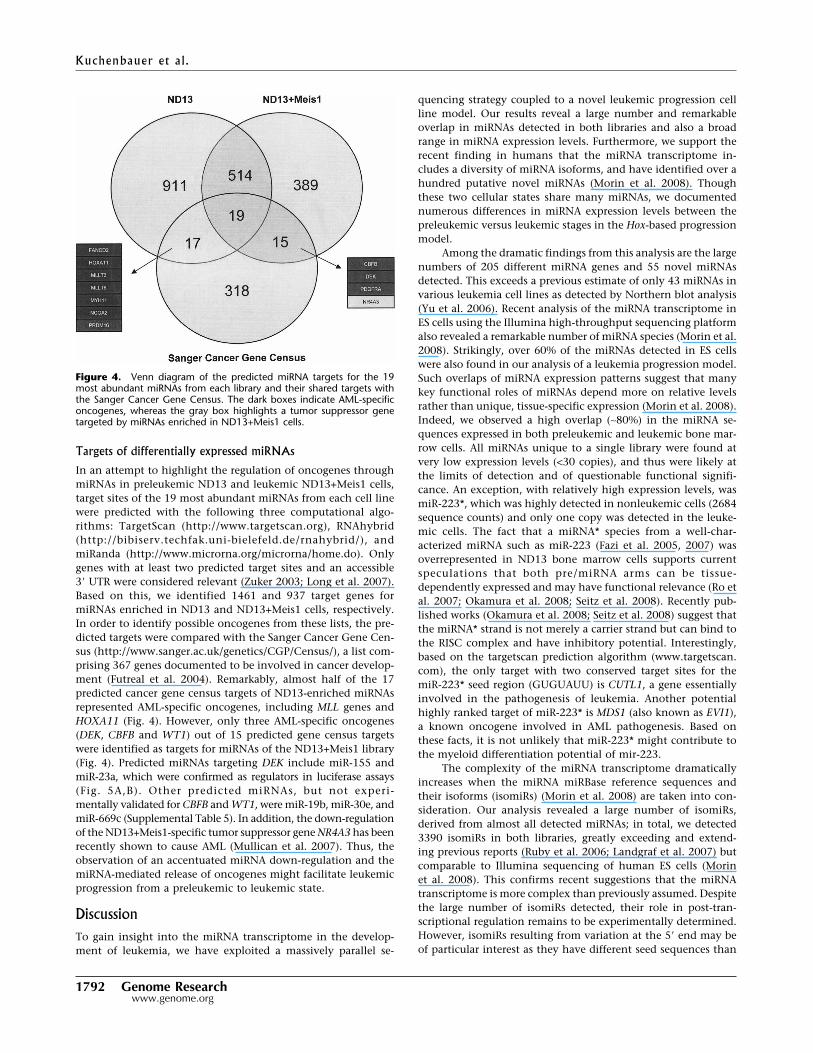
In an attempt to highlight the regulation of oncogenes throughmiRNAs in preleukemic ND13 and leukemic ND13+Meis1 cells,target sites of the 19 most abundant miRNAs from each cell linewere predicted with the following three computational algo-rithms: TargetScan (http://www.targetscan.org), RNAhybrid(http://bibiserv.techfak.uni-bielefeld.de/rnahybrid/), andmiRanda (http://www.microrna.org/microrna/home.do). Onlygenes with at least two predicted target sites and an accessible3� UTR were considered relevant (Zuker 2003; Long et al. 2007).Based on this, we identified 1461 and 937 target genes formiRNAs enriched in ND13 and ND13+Meis1 cells, respectively.In order to identify possible oncogenes from these lists, the pre-dicted targets were compared with the Sanger Cancer Gene Cen-sus (http://www.sanger.ac.uk/genetics/CGP/Census/), a list com-prising 367 genes documented to be involved in cancer develop-ment (Futreal et al. 2004). Remarkably, almost half of the 17predicted cancer gene census targets of ND13-enriched miRNAsrepresented AML-specific oncogenes, including MLL genes andHOXA11 (Fig. 4). However, only three AML-specific oncogenes(DEK, CBFB and WT1) out of 15 predicted gene census targetswere identified as targets for miRNAs of the ND13+Meis1 library(Fig. 4). Predicted miRNAs targeting DEK include miR-155 andmiR-23a, which were confirmed as regulators in luciferase assays(Fig. 5A,B). Other predicted miRNAs, but not experi-mentally validated for CBFB and WT1, were miR-19b, miR-30e, andmiR-669c (Supplemental Table 5). In addition, the down-regulationof the ND13+Meis1-specific tumor suppressor gene NR4A3 has beenrecently shown to cause AML (Mullican et al. 2007). Thus, theobservation of an accentuated miRNA down-regulation and themiRNA-mediated release of oncogenes might facilitate leukemicprogression from a preleukemic to leukemic state.
DiscussionTo gain insight into the miRNA transcriptome in the develop-ment of leukemia, we have exploited a massively parallel se-
quencing strategy coupled to a novel leukemic progression cellline model. Our results reveal a large number and remarkableoverlap in miRNAs detected in both libraries and also a broadrange in miRNA expression levels. Furthermore, we support therecent finding in humans that the miRNA transcriptome in-cludes a diversity of miRNA isoforms, and have identified over ahundred putative novel miRNAs (Morin et al. 2008). Thoughthese two cellular states share many miRNAs, we documentednumerous differences in miRNA expression levels between thepreleukemic versus leukemic stages in the Hox-based progressionmodel.
Among the dramatic findings from this analysis are the largenumbers of 205 different miRNA genes and 55 novel miRNAsdetected. This exceeds a previous estimate of only 43 miRNAs invarious leukemia cell lines as detected by Northern blot analysis(Yu et al. 2006). Recent analysis of the miRNA transcriptome inES cells using the Illumina high-throughput sequencing platformalso revealed a remarkable number of miRNA species (Morin et al.2008). Strikingly, over 60% of the miRNAs detected in ES cellswere also found in our analysis of a leukemia progression model.Such overlaps of miRNA expression patterns suggest that manykey functional roles of miRNAs depend more on relative levelsrather than unique, tissue-specific expression (Morin et al. 2008).Indeed, we observed a high overlap (∼80%) in the miRNA se-quences expressed in both preleukemic and leukemic bone mar-row cells. All miRNAs unique to a single library were found atvery low expression levels (<30 copies), and thus were likely atthe limits of detection and of questionable functional signifi-cance. An exception, with relatively high expression levels, wasmiR-223*, which was highly detected in nonleukemic cells (2684sequence counts) and only one copy was detected in the leuke-mic cells. The fact that a miRNA* species from a well-char-acterized miRNA such as miR-223 (Fazi et al. 2005, 2007) wasoverrepresented in ND13 bone marrow cells supports currentspeculations that both pre/miRNA arms can be tissue-dependently expressed and may have functional relevance (Ro etal. 2007; Okamura et al. 2008; Seitz et al. 2008). Recently pub-lished works (Okamura et al. 2008; Seitz et al. 2008) suggest thatthe miRNA* strand is not merely a carrier strand but can bind tothe RISC complex and have inhibitory potential. Interestingly,based on the targetscan prediction algorithm (www.targetscan.com), the only target with two conserved target sites for themiR-223* seed region (GUGUAUU) is CUTL1, a gene essentiallyinvolved in the pathogenesis of leukemia. Another potentialhighly ranked target of miR-223* is MDS1 (also known as EVI1),a known oncogene involved in AML pathogenesis. Based onthese facts, it is not unlikely that miR-223* might contribute tothe myeloid differentiation potential of mir-223.
The complexity of the miRNA transcriptome dramaticallyincreases when the miRNA miRBase reference sequences andtheir isoforms (isomiRs) (Morin et al. 2008) are taken into con-sideration. Our analysis revealed a large number of isomiRs,derived from almost all detected miRNAs; in total, we detected3390 isomiRs in both libraries, greatly exceeding and extend-ing previous reports (Ruby et al. 2006; Landgraf et al. 2007) butcomparable to Illumina sequencing of human ES cells (Morinet al. 2008). This confirms recent suggestions that the miRNAtranscriptome is more complex than previously assumed. Despitethe large number of isomiRs detected, their role in post-tran-scriptional regulation remains to be experimentally determined.However, isomiRs resulting from variation at the 5� end may beof particular interest as they have different seed sequences than
Figure 4. Venn diagram of the predicted miRNA targets for the 19most abundant miRNAs from each library and their shared targets withthe Sanger Cancer Gene Census. The dark boxes indicate AML-specificoncogenes, whereas the gray box highlights a tumor suppressor genetargeted by miRNAs enriched in ND13+Meis1 cells.
Kuchenbauer et al.
1792 Genome Researchwww.genome.org
the reference miRNA, with the ability to potentially target differ-ent transcripts. Besides changes of the seed region, end variationscan putatively change the secondary structure of the miRNA andthus facilitate or prevent target UTR binding. These results sug-gest that a fuller description of the expression of isomiRs for eachmiRNA will be of interest to determine if there are tissue-specificisomiR distributions relevant to development and disease.
Another striking observation was the large range in miRNAexpression levels for both libraries with count ranges for a given
unique miRNA and miRNA* species, spanning from two to>1.3 � 107 sequence counts. This documented range in expres-sion spanning over five orders of magnitude is some 100-foldgreater than reported in previous studies (Berezikov et al. 2006a),likely reflecting the improved sampling depth possible with theIllumina sequencing method. MiRNAs with high expressionlevels in both libraries included members of the let-7 family,miR-21, and miR-25, suggesting a fundamental role in cell sur-vival and/or proliferation. Indeed, some of these miRNAs like the
Table 2. Most differentially expressed miRNA/miRNA* species (counts >150 and >1.5 fold change), including miRBase annotation
miRNA miRNA star ND13 ND13+Meis1 Fold change Up (1)/down (−1)miRBase
reference sequence P-value
mmu-miR-196b 209 918 4.39 1a Yes 3.61 � 10�143
mmu-miR-467a* x 56 194 3.46 1 No 2.97 � 10�26
mmu-miR-30b 49 160 3.27 1b Yes 6.21 � 10�21
mmu-miR-18a 53 171 3.23 1a No 6.31 � 10�22
mmu-miR-23a 594 1594 2.68 1 No 2.27 � 10�158
mmu-miR-652 679 1565 2.3 1 Yes 4.93 � 10�128
mmu-miR-10a 14,700 32,064 2.18 1a No 0mmu-miR-140 73 153 2.1 1a Yes 3.63 � 10�12
mmu-miR-155 187 373 1.99 1a No 1.29 � 10�25
mmu-miR-192 669 1291 1.93 1 Yes 3.87 � 10�80
mmu-miR-22 175 314 1.79 1 Yes 3.03 � 10�18
mmu-miR-365 152 268 1.76 1a Yes 2.76 � 10�15
mmu-miR-15a 164 286 1.74 1a Yes 7.37 � 10�16
mmu-miR-29c 99 170 1.72 1a Yes 1.20 � 10�09
mmu-miR-669c 1347 2292 1.7 1 No 2.66 � 10�110
mmu-miR-674 110 171 1.55 1 No 5.13 � 10�08
mmu-mir-223-5-p x 2684 1 2684 �1 No* 0mmu-miR-296-3p 151 3 50.33 �1a No 1.53 � 10�34
mmu-miR-298 1143 26 43.96 �1a No 1.38 � 10�249
mmu-miR-877 262 28 9.36 �1 No 1.93 � 10�38
mmu-miR-351 872 94 9.28 �1a Yes 2.62 � 10�124
mmu-mir-365-1-5-p x 408 76 5.37 �1 No* 1.28 � 10�41
mmu-miR-27b* x 471 90 5.23 �1 No 1.09 � 10�46
mmu-miR-7a 3090 605 5.11 �1b No 4.56 � 10�291
mmu-miR-542-3p 1157 245 4.72 �1a No 3.19 � 10�102
mmu-mir-301a-5-p x 165 37 4.46 �1b No* 4.63 � 10�15
mmu-miR-805 5558 1353 4.11 �1 No 0mmu-miR-450b-5p 173 43 4.02 �1a No 4.06 � 10�14
mmu-mir-193b-5-p x 1277 332 3.85 �1 No* 7.20 � 10�90
mmu-mir-23b-5-p x 689 192 3.59 �1a No* 3.79 � 10�45
mmu-miR-503 2713 889 3.05 �1a No 3.88 � 10�135
mmu-miR-33 610 204 2.99 �1b Yes 1.18 � 10�30
mmu-miR-210 240 81 2.96 �1a Yes 1.14 � 10�12
mmu-miR-27a 2020 700 2.89 �1a No 1.10 � 10�91
mmu-mir-25-5-p x 3123 1139 2.74 �1b No* 1.21 � 10�127
mmu-miR-222 4723 1768 2.67 �1b No 2.86 � 10�182
No*, No miRNA* sequence in miRBase published.aDifferential expression corresponds to TaqMan assay.bmiRNA is up-regulated in TaqMan assay.
Table 3. Top 12 most abundant differentially expressed novel miRNAs, including their genomic location
Name Genomic location Mature sequence ND13 ND13+Meis1
mmu-mir-1937a chr16:4736234-4736256 ATCCCGGACGAGCCCCCA 7063 3114mmu-mir-1937b chr12:18343927-18343950 AATCCCGGACGAGCCCCCA 295 210mmu-mir-1964 chr7:29482102-29482126 CCGACTTCTGGGCTCCGGCTTT 92 71mmu-mir-1306 chr16:18197810-18197833 ACGTTGGCTCTGGTGGTGATG 55 44mmu-mir-1965 chr7:80026402-80026430 AAGCCGGGCCGTAGTGGCGCA 200 33mmu-mir-1274a chrX:63213849-63213872 TCAGGTCCCTGTTCAGGCGCCA 11 27mmu-mir-1948 chr18:12858029-12858051 TTTAGGCAGAGCACTCGTACAG 48 15mmu-mir-1937c chr3:23759265-23759286 ATCCCGGAAGAGCCCCCA 29 11mmu-mir-1943 chr15:79202525-79202549 AAGGGAGGATCTGGGCACCTGGA 7 8mmu-mir-669 chr2:10432170-10432194 TAGTTGTGTGTGCATGTTTATGT 3 8mmu-mir-1933-5p chr11:21244601-21244625_5p CCAGGACCATCAGTGTGACTAT 4 7mmu-mir-1960 chr5:30501537-30501560 CCAGTGCTGTTAGAAGAGGGCT 14 7
The microRNAome of a leukemia progression model
Genome Research 1793www.genome.org
let-7 family and miR-21 have been shown to be highly expressedin other tissue libraries (Ibarra et al. 2007; Morin et al. 2008) andin the context of cancer (Chan et al. 2005; Mayr et al. 2007).
Interestingly, all miRNAs located in the Hox cluster (miR-10a,miR-10b, and miR-196b) were up-regulated in the leukemicND13+Meis1 cells. Although the function of these miRNAs inAML is unknown, recent AML profiling reports point toward dis-tinct roles in leukemogenesis (Garzon et al. 2008; Isken et al.2008; Jongen-Lavrencic et al. 2008). Furthermore, miR-10b seemsto be a key factor modulating the ability of breast cancer cells tometastasize (Ma et al. 2007). In contrast, almost all members ofthe known tumor suppressor miRNA family let-7 (Johnson et al.2005; Akao et al. 2006; Lee and Dutta 2006, 2007; Mayr et al.2007; Yu et al. 2007a) were down-regulated in the leukemic stateexamined here, raising the intriguing possibility that this down-regulation is linked to the erosion of key self-renewal and differ-entiation programs in leukemic stem cells similar to breast cancerstem cells as shown recently (Johnson et al. 2005; Akao et al.2006; Lee and Dutta 2006, 2007; Mayr et al. 2007; Yu et al.2007a). Although it is difficult to compare our model system torecent miRNA profiling approaches in human AML, the depth ofthe presented work might complement these studies (Garzon etal. 2008; Isken et al. 2008; Jongen-Lavrencic et al. 2008). Similaras in the mentioned works, we also found an up-regulation of allmiRNAs located in the Hox cluster, as well as a down-regulationof let-7 family members. However, all published works do notprovide more than a quantitative approach, which does not
cover questions about isomiRs, novelmiRNAs, and disease specific mutationswithin the miRNA transcriptome. Thesequestions will be more likely covered byfuture high-throughput sequencing ap-proaches, providing the genomic resolu-tion to understand the undergoingchanges of the miRNA transcriptomewithin the development of AML.
In order to highlight potential on-cogenes as targets for miRNAs highly ex-pressed in both libraries, we took intoaccount cooperative target selection and3� UTR accessibility. Comparing all pre-dicted targets with the Sanger CancerGene Census (Futreal et al. 2004), weidentified unique cancer related targetgenes for miRNAs of both libraries. No-tably, our analysis suggested that innonleukemic ND13, cell leukemia-specific oncogenes were more frequentlytargeted, whereas within ND13+Meis1almost no leukemia-specific oncogeneswere targeted. These predictions wereexperimentally validated for the Dek on-cogene. Therefore, it can be speculated iftargeting of specific oncogenes throughmiRNAs could tip the balance from thepreleukemic to leukemic state.
With few exceptions, recent large-scale cloning efforts have provided mini-mal yields of new miRNA genes, mainlydue to the dominance of the highly ex-pressed miRNAs in small RNA libraries(Landgraf et al. 2007). We present 55
novel miRNA genes that have passed multiple levels of annota-tion criteria (Morin et al. 2008). Although the majority of thesenovel miRNAs were expressed at modest to low levels and onlythree showed differential expression in this model, further assess-ment of their expression and roles in other tissues and diseaseswill be of interest. Notably, the predicted novel miRNAs alsoexhibit 3� variations, which match or do not match the genome,similar to the above-mentioned isomiRs (data not shown).
Applying the massively parallel Illumina sequencing plat-form has allowed us to generate an accurate and comprehensivepicture of the miRNA transcriptome in a Hox/Meis1 leukemiaprogression model at great depth. Following a combination ofnovel miRNA annotation and discovery techniques, we have re-vealed a large list of expressed miRNA/miRNA* sequences. Inaddition to a large range of expressed miRNA genes with dra-matic expression ranges, we detected massive 5� and 3� sequencevariations within each miRNA/miRNA* species, called isomiRs,adding an additional layer of complexity to the known miRNAsequences.
Methods
Generation of the ND13 and ND13+Meis1 bone marrow celllinesMice were bred and maintained at the British Columbia CancerResearch Center Animal Facility (Vancouver, Canada). All experi-
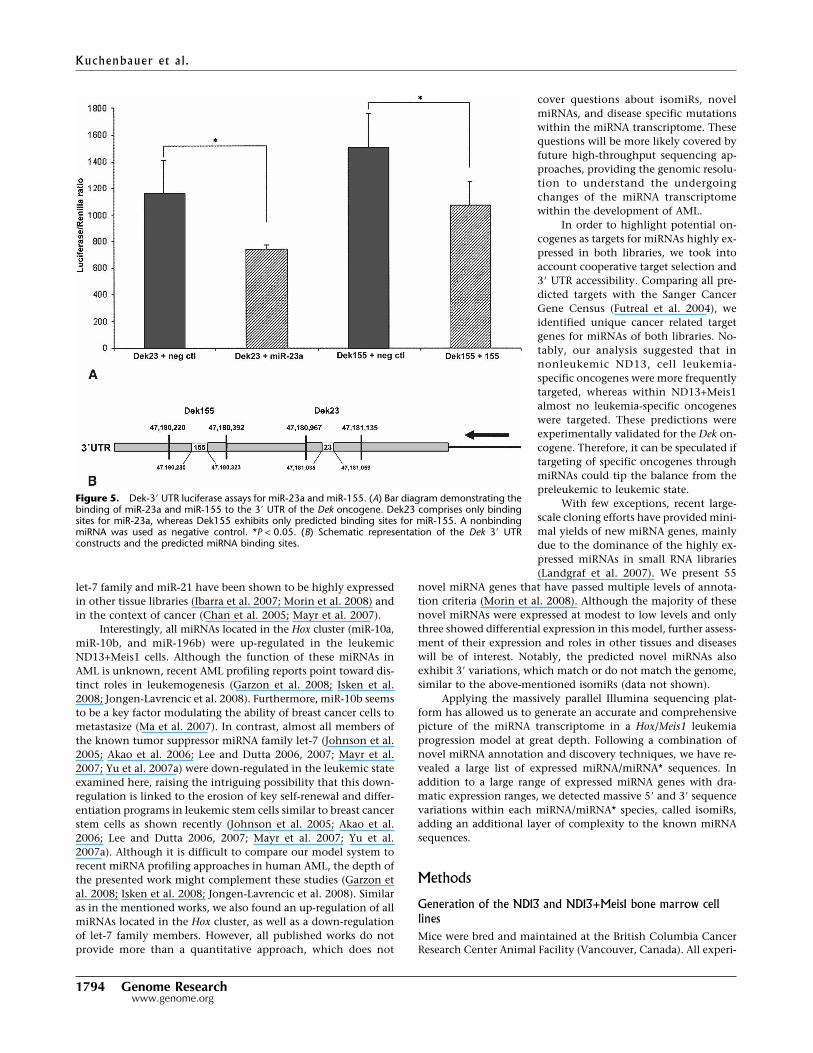
Figure 5. Dek-3� UTR luciferase assays for miR-23a and miR-155. (A) Bar diagram demonstrating thebinding of miR-23a and miR-155 to the 3� UTR of the Dek oncogene. Dek23 comprises only bindingsites for miR-23a, whereas Dek155 exhibits only predicted binding sites for miR-155. A nonbindingmiRNA was used as negative control. *P < 0.05. (B) Schematic representation of the Dek 3� UTRconstructs and the predicted miRNA binding sites.
Kuchenbauer et al.
1794 Genome Researchwww.genome.org
mental protocols were approved by the University of British Co-lumbia Animal Care Committee. Establishment and character-ization of the ND13 preleukemic BM cell lines was as previouslydescribed (Pineault et al. 2005). In brief, a polyclonal represen-tative line was established from BM cells from C57Bl/6J micefreshly transduced with the ND13-PAC virus, selected with puro-mycin at a concentration of 3 mg/mL for 5 d and maintained ata concentration 2 mg/mL in liquid culture (Dulbecco’s modifiedEagle’s medium [DMEM]) supplemented with 15% fetal bovineserum (FBS), 10 ng/mL of human interleukin-6 (hIL-6), 6 ng/mLof murine interleukin-3 (mIL3), and 100 ng/mL of murine stemcell factor (mSCF). All culture media and growth factors wereobtained from StemCell Technologies Inc. (Vancouver, Canada).Cells were counted with the Vi-Cell XR Cell Viability Analyzer(Beckman Coulter Inc.). To generate the ND13+Meis1 BM cellline, puromycin-selected ND13 BM cells as described above weretransduced by co-cultivation on irradiated (4000 cGy) E86 pro-ducers for Meis1-YFP, respectively, for a period of 2 d in the pres-ence of 5 µg/mL of protamine sulfate (Sigma) and sorted forYFP-positive cells with the FACSVantage SE (Becton Dickinson).Both, ND13 and ND13+Meis1 bone marrow cell lines were keptin culture for 40–50 d and tested for YFP by flow-cytometryanalysis (FACS), immunophenotyped by FACS, and injected intoC57Bl/6J mice to test their in vivo properties. The lines werefrozen in multiple vials with between 1 � 106 and 3 � 106 cellsfrom both lines in 1 mL of 90% newborn calf serum (Invitrogen)and 10% DMSO (Sigma).
Small RNA library preparationCultured ND13 and ND13+Meis1 cells were harvested and RNAextracted with TRIzol, as previously described (Argiropoulos et al.2008). The extracted RNA was subjected to miRNA library con-struction (ND13, ND13+Meis1) according to the protocol pub-lished by Morin et al. (2008).
Differential expression detectionAll unique small RNA sequences were compared between the twolibraries (ND13 and ND13+Meis1) for differential expression us-ing the Fisher exact test and Bonferroni correction. Sequenceswere deemed significantly differentially expressed if the P-valuegiven by this method was <0.001, and there was at least a 1.5-foldchange in sequence counts between the two libraries. In practice,all miRNAs with this combination of fold change and expressionlevel were deemed statistically significant. Unless stated other-wise, comparison of miRNA expression between libraries regardsthe most frequently observed isomiR as the diagnostic sequencefor evaluation of differential expression.
Cloning, annotation, and prediction of novel miRNAsA limited small RNA sequence analysis was performed accordingto the protocol of Fu et al. (2005). The annotation procedure wasperformed as described but employed annotations from miRBaseversion 11 and the Mus musculus genome (NCBI build 37). NovelmiRNAs were predicted as previously described (Morin et al.2008).
Real-time quantitative TaqMan PCR assaysMiRNA real-time quantification was performed using the Bio-Mark 48.48 Dynamic Array System (Fluidigm Corporation) andTaqMan MicroRNA Assays (Applied Biosystems) according to themanufacturer’s instructions. The reverse transcriptase reactionusing TaqMan stem-loop primers was performed according to theprotocol of Tang et al. (2006).
Cooperative miRNA target predictionPredicted targets for the 19 highest expressed miRNAs from eachlibrary were downloaded from TargetScan (http://www.targetscan.org), RNAHybrid (http://bibiserv.techfak.uni-bielefeld.de/rnahybrid/), and miRanda (http://www.microrna.org/miranda_new.html). Only miRNAs with counts of at least 100 inND13 or ND13+Meis1 were included in the target analyses.Genes with target sites for at least two coexpressed miRNAs fromone or both libraries were identified as potential cooperativetargets. To compensate for potential bias, genes with numerouspredicted miRNA target sites were given a lower rank than thosewith few predicted target sites. The rank score of a gene wascalculated by dividing the number of target sites for coexpressedmiRNAs by the total number of target sites for that gene. Weused a cutoff of 0.15 (rank) to produce the two sets of high-ranked candidate cooperative targets of ND13-enriched andND13+Meis1-enriched miRNAs. Predicted targets were only con-sidered relevant if their 3� UTR was accessible based by secondarystructure folding predicted by Mfold 3.2 (Zuker 2003).
Luciferase assaysTwo fragments of Dek-3� UTR with binding sites for either miR-23a(Dek23; chr13:47180220–47180392) or miR-155 (Dek155;chr13:47180967–47181135) (Fig. 5B) were cloned into pMirRe-port (Ambion) and transfected with hsa-miR-155 (Ambion), hsa-miR-23a (Ambion) or a negative control miRNA (Ambion) into293T cells. For the 3� UTR-luciferase assays, 200 ng of pMirRe-port-3� UTR, 10 pmol of miRNAs, and 0.17 ng of thymidine ki-nase-Renilla were cotransfected into 6 � 105 293T cells (24-wellformat) using the Lipofectamine 2000 transfection reagent (In-vitrogen). The assays were read in the Lumat LB 9507 tube lumi-nometer (EG&G Berthold) and the luciferase/Renilla ratio calcu-lated. Student’s t-test was used for statistical analysis, andP < 0.05 was considered as significant.
AcknowledgmentsWe thank the staff at Illumina, Inc. for technical assistance. Wealso thank Patty Rosten for her invaluable knowledge, as well asDr. Daniel Starzynowski, Dr. Aly Karsan, and Dr. Andrew Wengfor inspiring discussions and helpful advice. This project wasfunded in part by The Terry Fox Foundation through the Na-tional Cancer Institute of Canada and by the Canadian Stem CellNetwork. F.K. is supported by the Deutsche Forschungsgemein-schaft Germany (grant no. Ku 2288/1-1). M.H. is supported bythe Deutsche Forschungsgemeinschaft Germany (grant no. He5240/1-1). E.Y. is a recipient of postdoctoral fellowships from theMichael Smith Foundation for Health Research and the Cana-dian Institute of Health Research. M.A.M. is a Michael SmithFoundation for Health Research Senior Scholar. R.D.M. receivesstipends from the Michael Smith Foundation for Health Researchand the Canadian Institutes for Health Research. M.G. is sup-ported by scholarships from the Michael Smith Foundation forHealth Research and the Natural Sciences and Engineering Re-search Council.
References
Akao, Y., Nakagawa, Y., and Naoe, T. 2006. let-7 microRNA functions asa potential growth suppressor in human colon cancer cells. Biol.Pharm. Bull. 29: 903–906.
Aravin, A. and Tuschl, T. 2005. Identification and characterization ofsmall RNAs involved in RNA silencing. FEBS Lett. 579: 5830–5840.
Argiropoulos, B., Palmqvist, L., Yung, E., Kuchenbauer, F., Heuser, M.,Sly, L.M., Wan, A., Krystal, G., and Humphries, R.K. 2008. Linkage
The microRNAome of a leukemia progression model
Genome Research 1795www.genome.org
of Meis1 leukemogenic activity to multiple downstream effectorsincluding Trib2 and Ccl3. Exp. Hematol. 36: 845–859.
Bandres, E., Agirre, X., Ramirez, N., Zarate, R., and Garcia-Foncillas, J.2007. MicroRNAs as cancer players: Potential clinical and biologicaleffects. DNA Cell Biol. 26: 273–282.
Bartel, D.P. 2004. MicroRNAs: Genomics, biogenesis, mechanism, andfunction. Cell 116: 281–297.
Berezikov, E., Cuppen, E., and Plasterk, R.H. 2006a. Approaches tomicroRNA discovery. Nat. Genet. 38: S2–S7.
Berezikov, E., Thuemmler, F., van Laake, L.W., Kondova, I., Bontrop, R.,Cuppen, E., and Plasterk, R.H. 2006b. Diversity of microRNAs inhuman and chimpanzee brain. Nat. Genet. 38: 1375–1377.
Calin, G.A., Dumitru, C.D., Shimizu, M., Bichi, R., Zupo, S., Noch, E.,Aldler, H., Rattan, S., Keating, M., Rai, K., et al. 2002. Frequentdeletions and down-regulation of micro-RNA genes miR15 andmiR16 at 13q14 in chronic lymphocytic leukemia. Proc. Natl. Acad.Sci. 99: 15524–15529.
Calin, G.A., Liu, C.G., Sevignani, C., Ferracin, M., Felli, N., Dumitru,C.D., Shimizu, M., Cimmino, A., Zupo, S., Dono, M., et al. 2004.MicroRNA profiling reveals distinct signatures in B cell chroniclymphocytic leukemias. Proc. Natl. Acad. Sci. 101: 11755–11760.
Calin, G.A., Ferracin, M., Cimmino, A., Di Leva, G., Shimizu, M.,Wojcik, S.E., Iorio, M.V., Visone, R., Sever, N.I., Fabbri, M., et al.2005. A microRNA signature associated with prognosis andprogression in chronic lymphocytic leukemia. N. Engl. J. Med.353: 1793–1801.
Chan, J.A., Krichevsky, A.M., and Kosik, K.S. 2005. MicroRNA-21 isan antiapoptotic factor in human glioblastoma cells. Cancer Res.65: 6029–6033.
Davison, T.S., Johnson, C.D., and Andruss, B.F. 2006. Analyzingmicro-RNA expression using microarrays. Methods Enzymol.411: 14–34.
Debernardi, S., Skoulakis, S., Molloy, G., Chaplin, T., Dixon-McIver, A.,and Young, B.D. 2007. MicroRNA miR-181a correlates withmorphological sub-class of acute myeloid leukaemia and theexpression of its target genes in global genome-wide analysis.Leukemia 21: 912–916.
Fazi, F., Rosa, A., Fatica, A., Gelmetti, V., De Marchis, M.L., Nervi, C.,and Bozzoni, I. 2005. A minicircuitry comprised of microRNA-223and transcription factors NFI-A and C/EBPalpha regulates humangranulopoiesis. Cell 123: 819–831.
Fazi, F., Racanicchi, S., Zardo, G., Starnes, L.M., Mancini, M., Travaglini,L., Diverio, D., Ammatuna, E., Cimino, G., Lo-Coco, F., et al. 2007.Epigenetic silencing of the myelopoiesis regulator microRNA-223by the AML1/ETO oncoprotein. Cancer Cell 12: 457–466.
Fontana, L., Pelosi, E., Greco, P., Racanicchi, S., Testa, U., Liuzzi, F.,Croce, C.M., Brunetti, E., Grignani, F., and Peschle, C. 2007.MicroRNAs 17-5p–20a–106a control monocytopoiesis through AML1targeting and M-CSF receptor upregulation. Nat. Cell Biol.9: 775–787.
Fu, H., Tie, Y., Xu, C., Zhang, Z., Zhu, J., Shi, Y., Jiang, H., Sun, Z., andZheng, X. 2005. Identification of human fetal liver miRNAs by anovel method. FEBS Lett. 579: 3849–3854.
Futreal, P.A., Coin, L., Marshall, M., Down, T., Hubbard, T., Wooster, R.,Rahman, N., and Stratton, M.R. 2004. A census of human cancergenes. Nat. Rev. Cancer 4: 177–183.
Garzon, R., Volinia, S., Liu, C.G., Fernandez-Cymering, C., Palumbo, T.,Pichiorri, F., Fabbri, M., Coombes, K., Alder, H., Nakamura, T., et al.2008. MicroRNA signatures associated with cytogenetics andprognosis in acute myeloid leukemia. Blood 111: 3183–3189.
Griffiths-Jones, S. 2006. miRBase: The microRNA sequence database.Methods Mol. Biol. 342: 129–138.
Grimson, A., Farh, K.K., Johnston, W.K., Garrett-Engele, P., Lim, L.P.,and Bartel, D.P. 2007. MicroRNA targeting specificity in mammals:Determinants beyond seed pairing. Mol. Cell 27: 91–105.
Hernando, E. 2007. MicroRNAs and cancer: Role in tumorigenesis,patient classification and therapy. Clin. Transl. Oncol. 9: 155–160.
Ibarra, I., Erlich, Y., Muthuswamy, S.K., Sachidanandam, R., andHannon, G.J. 2007. A role for microRNAs in maintenance of mousemammary epithelial progenitor cells. Genes & Dev. 21: 3238–3243.
Isken, F., Steffen, B., Merk, S., Dugas, M., Markus, B., Tidow, N.,Zuhlsdorf, M., Illmer, T., Thiede, C., Berdel, W.E., et al. 2008.Identification of acute myeloid leukaemia associated microRNAexpression patterns. Br. J. Haematol. 140: 153–161.
Jay, C., Nemunaitis, J., Chen, P., Fulgham, P., and Tong, A.W. 2007.miRNA profiling for diagnosis and prognosis of human cancer. DNACell Biol. 26: 293–300.
Johnson, S.M., Grosshans, H., Shingara, J., Byrom, M., Jarvis, R., Cheng,A., Labourier, E., Reinert, K.L., Brown, D., and Slack, F.J. 2005. RAS isregulated by the let-7 microRNA family. Cell 120: 635–647.
Jongen-Lavrencic, M., Sun, S.M., Dijkstra, M.K., Valk, P.J., and
Lowenberg, B. 2008. MicroRNA expression profiling in relation tothe genetic heterogeneity of acute myeloid leukemia. Blood111: 5078–5085.
Kawahara, Y., Zinshteyn, B., Chendrimada, T.P., Shiekhattar, R., andNishikura, K. 2007. RNA editing of the microRNA-151 precursorblocks cleavage by the Dicer–TRBP complex. EMBO Rep. 8: 763–769.
Landgraf, P., Rusu, M., Sheridan, R., Sewer, A., Iovino, N., Aravin, A.,Pfeffer, S., Rice, A., Kamphorst, A.O., Landthaler, M., et al. 2007. Amammalian microRNA expression atlas based on small RNA librarysequencing. Cell 129: 1401–1414.
Lee, Y.S. and Dutta, A. 2006. MicroRNAs: Small but potent oncogenes ortumor suppressors. Curr. Opin. Investig. Drugs 7: 560–564.
Lee, Y.S. and Dutta, A. 2007. The tumor suppressor microRNA let-7represses the HMGA2 oncogene. Genes & Dev. 21: 1025–1030.
Long, D., Lee, R., Williams, P., Chan, C.Y., Ambros, V., and Ding, Y.2007. Potent effect of target structure on microRNA function. Nat.Struct. Mol. Biol. 14: 287–294.
Looijenga, L.H., Gillis, A.J., Stoop, H., Hersmus, R., and Oosterhuis, J.W.2007. Relevance of microRNAs in normal and malignantdevelopment, including human testicular germ cell tumours. Int JAndrol. 30: 304–314.
Lu, J., Getz, G., Miska, E.A., Alvarez-Saavedra, E., Lamb, J., Peck, D.,Sweet-Cordero, A., Ebert, B.L., Mak, R.H., Ferrando, A.A., et al. 2005.MicroRNA expression profiles classify human cancers. Nature435: 834–838.
Lui, W.O., Pourmand, N., Patterson, B.K., and Fire, A. 2007. Patterns ofknown and novel small RNAs in human cervical cancer. Cancer Res.67: 6031–6043.
Lund, E., Guttinger, S., Calado, A., Dahlberg, J.E., and Kutay, U. 2004.Nuclear export of microRNA precursors. Science 303: 95–98.
Ma, L., Teruya-Feldstein, J., and Weinberg, R.A. 2007. Tumour invasionand metastasis initiated by microRNA-10b in breast cancer. Nature449: 682–688.
Mansfield, J.H., Harfe, B.D., Nissen, R., Obenauer, J., Srineel, J.,Chaudhuri, A., Farzan-Kashani, R., Zuker, M., Pasquinelli, A.E.,Ruvkun, G., et al. 2004. MicroRNA-responsive “sensor” transgenesuncover Hox-like and other developmentally regulated patterns ofvertebrate microRNA expression. Nat. Genet. 36: 1079–1083.
Margulies, M., Egholm, M., Altman, W.E., Attiya, S., Bader, J.S., Bemben,L.A., Berka, J., Braverman, M.S., Chen, Y.J., Chen, Z., et al. 2005.Genome sequencing in microfabricated high-density picolitrereactors. Nature 437: 376–380.
Mayr, C., Hemann, M.T., and Bartel, D.P. 2007. Disrupting the pairingbetween let-7 and Hmga2 enhances oncogenic transformation.Science 315: 1576–1579.
Mi, S., Lu, J., Sun, M., Li, Z., Zhang, H., Neilly, M.B., Wang, Y., Qian, Z.,Jin, J., Zhang, Y., et al. 2007. MicroRNA expression signaturesaccurately discriminate acute lymphoblastic leukemia from acutemyeloid leukemia. Proc. Natl. Acad. Sci. 104: 19971–19976.
Morin, R.D., O’Connor, M.D., Griffith, M., Kuchenbauer, F., Delaney,A., Prabhu, A.L., Zhao, Y., McDonald, H., Zeng, T., Hirst, M., et al.2008. Application of massively parallel sequencing to microRNAprofiling and discovery in human embryonic stem cells. Genome Res.18: 610–621.
Mullican, S.E., Zhang, S., Konopleva, M., Ruvolo, V., Andreeff, M.,Milbrandt, J., and Conneely, O.M. 2007. Abrogation of nuclearreceptors Nr4a3 and Nr4a1 leads to development of acute myeloidleukemia. Nat. Med. 13: 730–735.
Negrini, M., Ferracin, M., Sabbioni, S., and Croce, C.M. 2007.MicroRNAs in human cancer: From research to therapy. J. Cell Sci.120: 1833–1840.
Okamura, K., Phillips, M.D., Tyler, D.M., Duan, H., Chou, Y.T., and Lai,E.C. 2008. The regulatory activity of microRNA* species hassubstantial influence on microRNA and 3� UTR evolution. Nat.Struct. Mol. Biol. 15: 354–363.
O’Toole, A.S., Miller, S., Haines, N., Zink, M.C., and Serra, M.J. 2006.Comprehensive thermodynamic analysis of 3� double-nucleotideoverhangs neighboring Watson-Crick terminal base pairs. NucleicAcids Res. 34: 3338–3344.
Park, J.K., Liu, X., Strauss, T.J., McKearin, D.M., and Liu, Q. 2007. ThemiRNA pathway intrinsically controls self-renewal of Drosophilagermline stem cells. Curr. Biol. 17: 533–538.
Pfeffer, S., Sewer, A., Lagos-Quintana, M., Sheridan, R., Sander, C.,Grasser, F.A., van Dyk, L.F., Ho, C.K., Shuman, S., Chien, M., et al.2005. Identification of microRNAs of the herpesvirus family. Nat.Methods 2: 269–276.
Pineault, N., Buske, C., Feuring-Buske, M., Abramovich, C., Rosten, P.,Hogge, D.E., Aplan, P.D., and Humphries, R.K. 2003. Induction ofacute myeloid leukemia in mice by the human leukemia-specificfusion gene NUP98-HOXD13 in concert with Meis1. Blood101: 4529–4538.
Kuchenbauer et al.
1796 Genome Researchwww.genome.org
Pineault, N., Abramovich, C., and Humphries, R.K. 2005. Transplantablecell lines generated with NUP98-Hox fusion genes undergo leukemicprogression by Meis1 independent of its binding to DNA. Leukemia19: 636–643.
Porkka, K.P., Pfeiffer, M.J., Waltering, K.K., Vessella, R.L., Tammela, T.L.,and Visakorpi, T. 2007. MicroRNA expression profiling in prostatecancer. Cancer Res. 67: 6130–6135.
Ro, S., Park, C., Young, D., Sanders, K.M., and Yan, W. 2007.Tissue-dependent paired expression of miRNAs. Nucleic Acids Res.35: 5944–5953.
Ruby, J.G., Jan, C., Player, C., Axtell, M.J., Lee, W., Nusbaum, C., Ge, H.,and Bartel, D.P. 2006. Large-scale sequencing reveals 21U-RNAs andadditional microRNAs and endogenous siRNAs in C. elegans. Cell127: 1193–1207.
Seitz, H., Ghildiyal, M., and Zamore, P.D. 2008. Argonaute loadingimproves the 5� precision of both microRNAs and their miRNAstrands in flies. Curr. Biol. 18: 147–151.
Sevignani, C., Calin, G.A., Nnadi, S.C., Shimizu, M., Davuluri, R.V.,Hyslop, T., Demant, P., Croce, C.M., and Siracusa, L.D. 2007.MicroRNA genes are frequently located near mouse cancersusceptibility loci. Proc. Natl. Acad. Sci. 104: 8017–8022.
Shell, S., Park, S.M., Radjabi, A.R., Schickel, R., Kistner, E.O., Jewell,D.A., Feig, C., Lengyel, E., and Peter, M.E. 2007. Let-7 expressiondefines two differentiation stages of cancer. Proc. Natl. Acad. Sci.104: 11400–11405.
Tang, F., Hajkova, P., Barton, S.C., O’Carroll, D., Lee, C., Lao, K., andSurani, M.A. 2006. 220-plex microRNA expression profile of a singlecell. Nat. Protocols 1: 1154–1159.
Tang, F., Kaneda, M., O’Carroll, D., Hajkova, P., Barton, S.C., Sun, Y.A.,
Lee, C., Tarakhovsky, A., Lao, K., and Surani, M.A. 2007. MaternalmicroRNAs are essential for mouse zygotic development. Genes &Dev. 21: 644–648.
Thatcher, E.J., Flynt, A.S., Li, N., Patton, J.R., and Patton, J.G. 2007.miRNA expression analysis during normal zebrafish developmentand following inhibition of the Hedgehog and Notch signalingpathways. Dev. Dyn. 236: 2172–2180.
Tran, N., McLean, T., Zhang, X., Zhao, C.J., Thomson, J.M., O’Brien, C.,and Rose, B. 2007. MicroRNA expression profiles in head and neckcancer cell lines. Biochem. Biophys. Res. Commun. 358: 12–17.
Wang, Y., Medvid, R., Melton, C., Jaenisch, R., and Blelloch, R. 2007.DGCR8 is essential for microRNA biogenesis and silencing ofembryonic stem cell self-renewal. Nat. Genet. 39: 380–385.
Yu, J., Wang, F., Yang, G.H., Wang, F.L., Ma, Y.N., Du, Z.W., andZhang, J.W. 2006. Human microRNA clusters: Genomic organizationand expression profile in leukemia cell lines. Biochem. Biophys. Res.Commun. 349: 59–68.
Yu, F., Yao, H., Zhu, P., Zhang, X., Pan, Q., Gong, C., Huang, Y., Hu, X.,Su, F., Lieberman, J., et al. 2007a. let-7 regulates self renewal andtumorigenicity of breast cancer cells. Cell 131: 1109–1123.
Yu, S.L., Chen, H.Y., Yang, P.C., and Chen, J.J. 2007b. UniqueMicroRNA signature and clinical outcome of cancers. DNA Cell Biol.26: 283–292.
Zuker, M. 2003. Mfold web server for nucleic acid folding andhybridization prediction. Nucleic Acids Res. 31: 3406–3415.
Received February 17, 2008; accepted in revised form August 13, 2008.
The microRNAome of a leukemia progression model
Genome Research 1797www.genome.org


