Embed Size (px)
Citation preview
Current Medicinal Chemistry, 2012, 19, 1721-1730 1721
1875-533X/12 $58.00+.00 © 2012 Bentham Science Publishers
In Vitro – In Vivo Correlation of Gene Expression Alterations Induced by Liver Carcinogens
T. Heise#,1, M. Schug#,2, D. Storm1, H. Ellinger-Ziegelbauer3, H.J. Ahr3, B. Hellwig4, J. Rahnenführer4, A. Ghallab2, G. Guenther2, J. Sisnaiske2, R. Reif2, P. Godoy2, H. Mielke1, U. Gundert-Remy1, A. Lampen1, A. Oberemm*,1 and J.G. Hengstler*,2
1Federal Institute for Risk Assessment, 10589 Berlin, Germany 2Leibniz Research Centre for Working Environment and Human Factors (IfADo), 44139 Dortmund, Germany 3Toxicology, Bayer Pharma AG, 42096 Wuppertal, Germany 4Department of Statistics, Dortmund University of Technology, 44221 Dortmund, Germany
Abstract: Although cultivated hepatocytes are widely used in the studies of drug metabolism, their application in toxicogenomics is considered as problematic, because previous studies have reported only little overlap between chemically induced gene expression alterations in liver in vivo and in cultivated hepatocytes. Here, we identified 22 genes that were altered in livers of rats after oral administration of the liver carcinogens aflatoxin B1 (AB1), 2-nitrofluorene (2-NF), methapyrilene (MP) or piperonyl-butoxide (PBO). The functions of the 22 genes have been classified into two groups. Genes related to stress response, DNA repair or metabolism and genes associated with cell proliferation, respectively. Next, rat hepatocyte sandwich cultures were exposed to AB1, 2-NF, MP or PBO for 24h and expression of the above mentioned genes was determined by RT-qPCR. Significant correlations between the degree of gene expression alterations in vivo and in vitro were obtained for the stress, DNA repair and metabolism associated genes at concentrations covering a range from cytotoxic concentrations to non-toxic/in vivo relevant concentrations. In contrast to the stress associated genes, no significant in vivo/in vitro correlation was obtained for the genes associated with cell proliferation. To understand the reason of this discrepancy, we compared replacement proliferation in vivo and in vitro. While hepatocytes in vivo, killed after administration of hepatotoxic compounds, are rapidly replaced by proliferating surviving cells, in vitro no replacement proliferation as evidenced by BrdU incorporation was observed after washing out hepatotoxic concentrations of MP. In conclusion, there is a good correlation between gene expression alterations induced by liver carcinogens in vivo and in cultivated hepatocytes. However, it should be considered that cultivated primary hepatocytes do not show replacement proliferation explaining the in vivo/in vitro discrepancy concerning proliferation associated genes.
Keywords: Hepatocytes, in vitro, sandwich culture, toxicogenomics, carcinogens, genotoxic, non-genotoxic, stress response genes, proliferation.
INTRODUCTION
Toxicogenomic-based approaches represent a promising tool to elucidate mechanisms of toxicity and to identify signatures related to carcinogenic events and tumor development [1-6]. Several in vivo studies have shown that it is possible to identify carcinogens using genomic signatures [7-10]. [11] identified cellular pathways affected by genotoxic and non-genotoxic carcinogens in rat liver and used a training set of genotoxic liver carcinogens, non-genotoxic liver carcinogens and non-carcinogenic compounds to establish a classification algorithm which allowed prediction of a follow-up set of compounds with 88% accuracy [7]. Similarly, [8] identified a multi-gene biomarker that predicts long term liver tumor formation.
The latter examples illustrate that toxicogenomics represent in vivo a powerful tool to predict liver carcinogenicity from gene expression alterations in liver tissue after short term exposure. There is a general agreement that it would represent an enormous advantage if cultivated hepatocytes could be used for this purpose instead of animals [12-19]. Although hepatocyte cultures represent a well accepted tool for toxicity studies [20, 21], enzyme induction [22-24], hepatotoxicity [25-27] and signal transduction [28-31], their contribution in toxicogenomics is considered as problematic. This critical attitude comes from two observations: First, it has been reported that there is only a little overlap between gene expression
*Address correspondence to these authors at the Federal Institute for Risk Assessment, 10589 Berlin, Germany; Tel: +493018412-0; Fax: +49 30 18412-3851; E-mail: [email protected] Leibniz Research Centre for Working Environment and Human Factors (IfADo), 44139 Dortmund, Germany; Tel: +492311084-0; Fax: +49 231 1084 403; E-mail: [email protected] #contributed equally.
alterations induced in liver in vivo and in cultivated hepatocytes [32]. For example, paracetamol altered expression of 1349 genes in rat liver in vivo, 368 genes in rat hepatocytes cultivated in a standard medium and 1289 genes in rat hepatocytes cultivated in a modified medium containing enzyme inducers. However, only 18 (1.4%) and 2 (0.5%) of the genes altered in vitro (in hepatocytes cultivated in modified and standard medium, respectively, considering only alterations in the same direction) were also altered in vivo. Unexpectedly, there was no overlap of gene expression which was altered in both in vitro systems with hepatocytes and in vivo in livers of rats [40]. Second, cultivated hepatocytes are problematic for toxicogenomics, because basal levels of gene expression are not stable since more than 500 genes are already changed when primary hepatocytes are brought into culture [33-35]. Recently, we have identified a mechanism responsible for the gene expression alterations of cultivated hepatocytes [36-38]. Upon attachment, cultivated hepatocytes show enhanced focal adhesion kinase/src activity causing features of epithelial to mesenchymal transition (EMT) via the Raf/Mek/Erk and resistance to apoptosis via the PI3K/Akt pathway. These effects can be ameliorated but not completely avoided in sandwich cultures. Although the long term goal must be a further improvement of hepatocyte in vitro systems, we already started a toxicogenomics program based on the currently best available systems with cultivated hepatocytes. Recently, we could show that after some technical optimization, a hepatocyte sandwich culture system can be applied to reproducibly detect gene expression alterations of the non-genotoxic liver carcinogen MP at in vivo relevant concentrations [38]. In the present study, we compared expression of genes in vivo in rat liver to primary hepatocytes cultivated in sandwich culture. Gene expression alterations were induced by two non-genotoxic (methapyrilene, piperonyl butoxide) and by two genotoxic (aflatoxin B1, 2-nitrofluorene) liver carcinogens.
1722 Current Medicinal Chemistry, 2012 Vol. 19, No. 11 Heise et al.
MATERIALS AND METHODS
Chemicals
Williams Medium E, Penicillin/Streptomycin solution and SeraPlus (FBS) were obtained from PAN-Biotech (Aidenbach, Germany). 10x DMEM was ordered from Biozol (Eching, Germany). Gentamicin (10 mg/mL) was purchased from Invitrogen Corp. (Karlsruhe, Germany). PBO, 2-NF, AB1, Dexamethasone and MP were ordered from Sigma-Aldrich Chemie GmbH (Taufkirchen, Germany) (Chemical structures in Suppl. Fig. 6). Rat-tail tendon collagen I for sandwich culture was provided by Roche (Mannheim, Germany).
Animals
Male Wistar rats with a body weight of 250 g were purchased from Charles River (Sulzfeld, Germany). The animals had free access to food (ssniff, Soest, Germany) and water and were housed until reaching a weight of 300-400 g. The animals were kept under controlled temperature (18–26°C), humidity (30–70%), and lighting (12 h light/dark cycle) and were acclimated for a minimum of 6 days.
Isolation, Cultivation and Treatment of Primary Rat Hepatocytes
Isolation and cultivation of hepatocytes were performed according to [38], with minor modification: Hepatocytes were isolated from male Wistar rats using a technique described by [21]. In brief, the animals were anesthetized using an i.p.-injection of a combination of 20 mg/kg xylazine (Rompun 2 %, Bayer, Leverkusen, Germany) and 61.5 mg/kg ketamine (Ratiopharm, Ulm, Germany). The liver was perfused via the vena portae for 15 min with an EGTA-buffer at 37 °C. The constant temperature was achieved using an inline heating system (SAHARAInline, Transmed Sarstedt Group, Bad Wünnenberg, Germany). The EGTA-buffer consists of 248 mL glucose-solution (9 g/L D-glucose), 40 mL KH-buffer (60 g/L NaCl, 1.75 g/L KCl, and 1.6 g/L KH2PO4; adjusted to pH 7.4), 40 mL HEPES-buffer (60 g/L HEPES; adjusted to pH 8.5), 60 mL amino acid solution (0.27 g/L L-alanine, 0.14 g/L L-aspartic acid, 0.4 g/L L-asparagine, 0.27 g/L L-citrulline, 0.14 g/L L-cysteine, 1 g/L L-histidine, 1 g/L L-glutamic acid, 1 g/L L-glycin, 0.4 g/L L-isoleucine, 0.8 g/L L-leucine, 1.3 g/L L-lysine, 0.55 g/L L-methionine, 0.65 g/L L-ornithine, 0.55 g/L L-phenylalanine, 0.55 g/L L-proline, 0.65 g/L L-serine, 1.35 g/L L-threonine, 0.65 g/L L-tryptophan, 0.55 g/L L-tyrosine, 0.8 g/L L-valine; amino acids that could not be dissolved at neutral pH were dissolved by addition of 10 N NaOH at pH 11.0 and thereafter adjusted to pH 7.6), 2 mL glutamine solution (7 g/L L-glutamine, freshly prepared) and 0.8 mL EGTA-solution (47.5 g/L EGTA, dissolved by addition of NaOH, adjusted to pH 7.6). Subsequently, perfusion was continued for 15 min with a collagenase buffer (37 °C) consisting of 155 mL glucose solution, 25 mL KH-buffer, 25 mL HEPES-buffer, 38 mL amino acid solution, 10 mL CaCl2 solution (19 g/L CaCl2 x 2 H2O), 2.5 mL glutamine solution and 90 mg collagenase type I (Sigma, Taufkirchen, Germany) that were dissolved in the prewarmed mixture of the above mentioned solutions immediately before use. After perfusion, the liver was dissected and dissociated in suspension buffer (124 mL glucose-solution, 20 mL KH buffer, 20 mL HEPES buffer (pH 7.6), 30 mL amino acid solution, 2 mL glutamine solution, 1.6 mL CaCl2 solution, 0.8 mL MgSO4 solution (24.6 g/L MgSO4 x7 H2O) and 0.4 g bovine serum albumin). The liver cell suspension was filtered through a 100 µm cell strainer, centrifuged for 5 min at 50 x g, washed twice with suspension buffer, centrifuged again and resuspended in 30 mL suspension buffer. Cell viability was assessed using Trypan blue dye exclusion
rate and hepatocytes with a viability greater than 70 % were used. The collagen sandwich cultures were prepared by adding 12 mL of 0.2 % (v/v) acetic acid to the lyophilized collagen. After dissolving the collagen over night at 4 °C, 1.2 mL of 10x DMEM was added and the acid solution was neutralized by adding 1M NaOH solution. 250 µl of the collagen solution were added to each well of the 6-well plate (Sarstedt, Nümbrecht, Germany) and solidified for 30 minutes. For attachment, 2 mL of Williams Medium E (WME) (with 10 % FBS, 100 units/mL Penicillin, 0.1 mg/mL streptomycin, 10 µg/mL gentamycine, 100 nM dexamethasone) were added to each well. Hepatocytes were plated with a density of 1x10⁶ cells per well. Cells were cultured at 37 °C and 5 % CO2 in a humified atmosphere. 3 h after seeding cells attached to the first layer of the collagen-sandwich were washed with warm (37 °C) WME including the same additives as for hepatocyte culture and compound exposure. The second layer of the collagen-sandwich was added and after 30 minutes of gelation, WME was added. Sandwich cultures of primary rat hepatocytes from at least three different donor animals were incubated with test substances after an overnight cultivation of the primary hepatocytes in the following concentrations: MP: 0.39, 6.25, 100 µM; PBO: 4, 20, 100 µM; AB1: 2, 8, 32 nM; 2-NF: 2, 10, 50 µM. As mentioned before, hepatocytes were incubated on 6-well dishes, whereby three wells of each dish were used for compound exposures and three wells as corresponding solvent controls. This procedure resulted in three technical replicates per experiment. In addition, three biological replicates were performed using hepatocytes from three rats and performing the experiments at different days. The time schedule of hepatocyte cultivation and compound exposure is as follows: day 0 (beginning at 8:00 am last step at 3:00 pm): preparation of rats, liver perfusion preparation of the sandwich cultures, day 1 (3:00 pm): start of compound exposure, day 2 (3:00 pm): end of compound exposure period, harvesting of cells and RNA.
RNA Isolation and Quantitative RT-PCR
RNA isolation and RT-PCR were performed according to [38], with minor modification: After the 24h compound exposure period at day 2 the culture medium was removed and 1 mL of QIAzol (QIAGEN, Hilden, Germany) was added immediately to the hepatocyte cultures. RNA isolation was performed according to the manufacturer’s instruction. The quality of RNA was assessed using a NanoDrop ND-1000. 2 µg of RNA were reverse transcribed to cDNA using the High Capacity cDNA Reverse Transcription Kit (Applied Biosystems, Darmstadt, Germany) according to the protocol provided by the manufacturer. Real-time quantitative PCR was performed on an ABI 7900 HT Fast Real-Time PCR system (Applied Biosystems). 100 ng of cDNA was used per reaction and the PCR conditions followed the standard specifications recommended by the manufacturer. 18S ribosomal RNA or beta-actin was used for normalization. The TaqMan technique was used for gene expression analysis. Genes selected for in vitro analysis belong to the categories detoxification response, regeneration, oxidative stress response, oxidative stress response/DNA damage response (p53-related), cell cycle progression, cell survival and general stress response. Calculation of relative gene expression was performed using the 2-ΔΔCt method. The RNA expression of the untreated cells at the beginning of the compound exposure period was set as the calibrator. The time-matched untreated cells represent the control.
Cell Viability Assay and PBPK Modeling
The effect of MP, PBO, 2-NF and AB1 on the viability of primary hepatocytes was determined using the CellTiter-Blue® Cell Viability Assay (Promega, Mannheim, Germany). The hepatocytes were incubated for 72 h with the following concentrations of the
In Vitro – In Vivo Correlation of Gene Expression Alterations Induced by Liver Carcinogens Current Medicinal Chemistry, 2012 Vol. 19, No. 11 1723
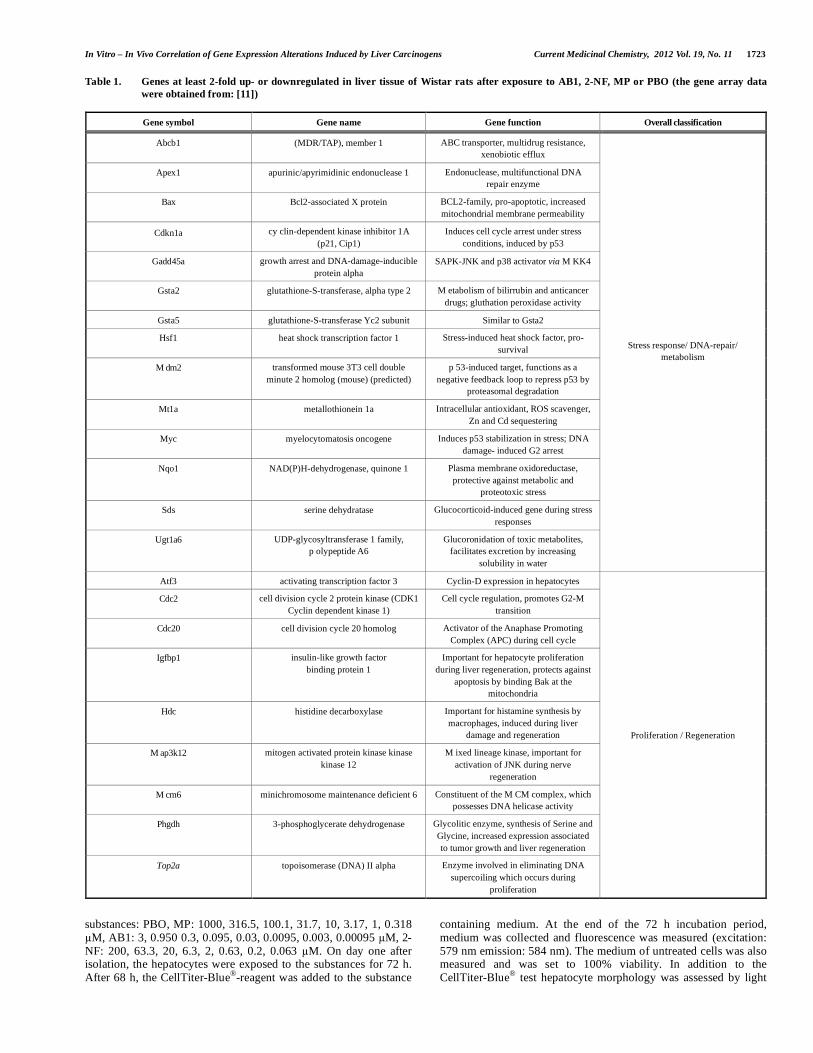
Table 1. Genes at least 2-fold up- or downregulated in liver tissue of Wistar rats after exposure to AB1, 2-NF, MP or PBO (the gene array data were obtained from: [11])
Gene symbol Gene name Gene function Overall classification
Abcb1 (MDR/TAP), member 1 ABC transporter, multidrug resistance, xenobiotic efflux
Apex1 apurinic/apyrimidinic endonuclease 1 Endonuclease, multifunctional DNA repair enzyme
Bax Bcl2-associated X protein BCL2-family, pro-apoptotic, increased mitochondrial membrane permeability
Cdkn1a cy clin-dependent kinase inhibitor 1A (p21, Cip1)
Induces cell cycle arrest under stress conditions, induced by p53
Gadd45a growth arrest and DNA-damage-inducible protein alpha
SAPK-JNK and p38 activator via M KK4
Gsta2 glutathione-S-transferase, alpha type 2 M etabolism of bilirrubin and anticancer drugs; gluthation peroxidase activity
Gsta5 glutathione-S-transferase Yc2 subunit Similar to Gsta2
Hsf1 heat shock transcription factor 1 Stress-induced heat shock factor, pro-survival
M dm2 transformed mouse 3T3 cell double minute 2 homolog (mouse) (predicted)
p 53-induced target, functions as a negative feedback loop to repress p53 by
proteasomal degradation
Mt1a metallothionein 1a Intracellular antioxidant, ROS scavenger, Zn and Cd sequestering
Myc myelocytomatosis oncogene Induces p53 stabilization in stress; DNA damage- induced G2 arrest
Nqo1 NAD(P)H-dehydrogenase, quinone 1 Plasma membrane oxidoreductase, protective against metabolic and
proteotoxic stress
Sds serine dehydratase Glucocorticoid-induced gene during stress responses
Ugt1a6 UDP-glycosyltransferase 1 family, p olypeptide A6
Glucoronidation of toxic metabolites, facilitates excretion by increasing
solubility in water
Stress response/ DNA-repair/ metabolism
Atf3 activating transcription factor 3 Cyclin-D expression in hepatocytes
Cdc2 cell division cycle 2 protein kinase (CDK1 Cyclin dependent kinase 1)
Cell cycle regulation, promotes G2-M transition
Cdc20 cell division cycle 20 homolog Activator of the Anaphase Promoting Complex (APC) during cell cycle
Igfbp1 insulin-like growth factor binding protein 1
Important for hepatocyte proliferation during liver regeneration, protects against
apoptosis by binding Bak at the mitochondria
Hdc histidine decarboxylase Important for histamine synthesis by macrophages, induced during liver
damage and regeneration
M ap3k12 mitogen activated protein kinase kinase kinase 12
M ixed lineage kinase, important for activation of JNK during nerve
regeneration
M cm6 minichromosome maintenance deficient 6 Constituent of the M CM complex, which possesses DNA helicase activity
Phgdh 3-phosphoglycerate dehydrogenase Glycolitic enzyme, synthesis of Serine and Glycine, increased expression associated to tumor growth and liver regeneration
Top2a topoisomerase (DNA) II alpha Enzyme involved in eliminating DNA supercoiling which occurs during
proliferation
Proliferation / Regeneration
substances: PBO, MP: 1000, 316.5, 100.1, 31.7, 10, 3.17, 1, 0.318 µM, AB1: 3, 0.950 0.3, 0.095, 0.03, 0.0095, 0.003, 0.00095 µM, 2-NF: 200, 63.3, 20, 6.3, 2, 0.63, 0.2, 0.063 µM. On day one after isolation, the hepatocytes were exposed to the substances for 72 h. After 68 h, the CellTiter-Blue®-reagent was added to the substance
containing medium. At the end of the 72 h incubation period, medium was collected and fluorescence was measured (excitation: 579 nm emission: 584 nm). The medium of untreated cells was also measured and was set to 100% viability. In addition to the CellTiter-Blue® test hepatocyte morphology was assessed by light
1724 Current Medicinal Chemistry, 2012 Vol. 19, No. 11 Heise et al.
microscopy. PBPK modeling was performed as described by [39].
In Vivo Data
In order to investigate a possible in vivo/in vitro correlation of gene expression alterations, we selected several genes from the study of [11] known to be deregulated in response to 24 h short-term exposure to genotoxic or non-genotoxic compounds in vivo. In the latter study male Wistar rats were exposed to genotoxic or non-genotoxic compounds, deregulated genes were detected by microarray analysis and assigned to different functional categories. For the current in vitro study we selected genes that were at least 2-fold up- or downregulated by one of the compounds AB1, 2-NF, MP and PBO in vivo. This resulted in 22 genes listed in Table 1. In addition we added Atf3 as a negative control gene since it was altered less than 2-fold in vivo. The fold change shown in Table 2 is the mean-value of all replicates used in the study of [11].
In Vitro Data
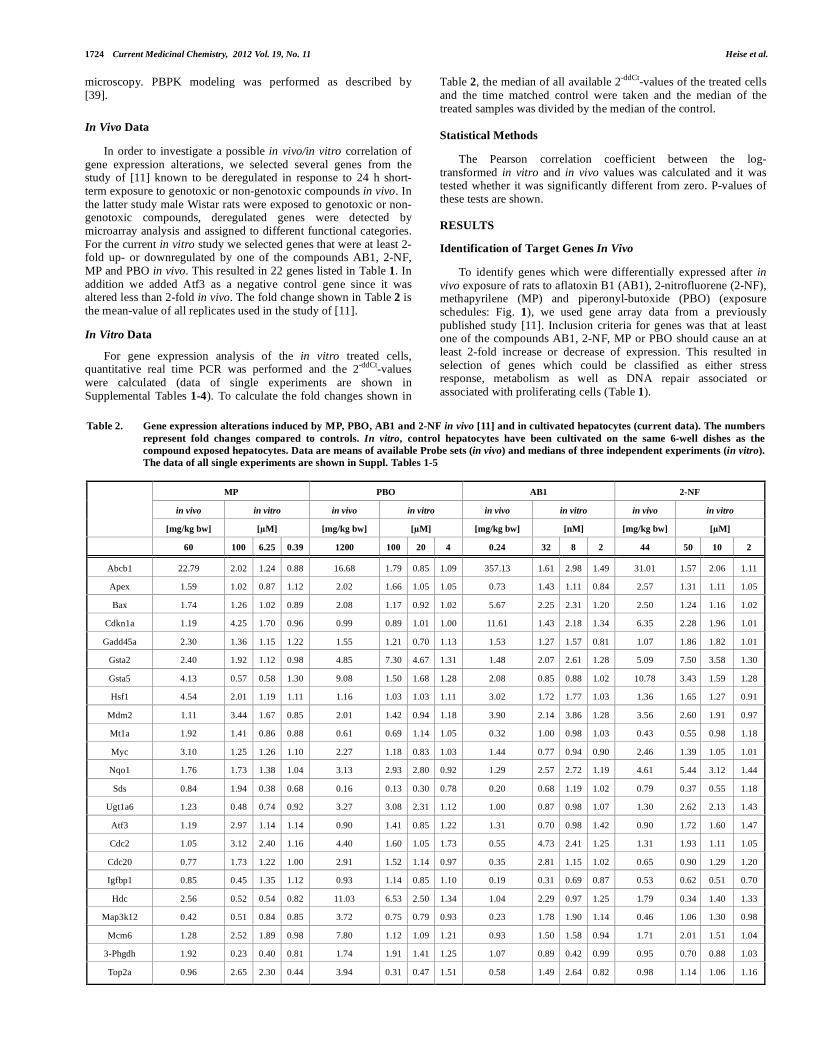
For gene expression analysis of the in vitro treated cells, quantitative real time PCR was performed and the 2-ddCt-values were calculated (data of single experiments are shown in Supplemental Tables 1-4). To calculate the fold changes shown in
Table 2, the median of all available 2-ddCt-values of the treated cells and the time matched control were taken and the median of the treated samples was divided by the median of the control.
Statistical Methods
The Pearson correlation coefficient between the log-transformed in vitro and in vivo values was calculated and it was tested whether it was significantly different from zero. P-values of these tests are shown.
RESULTS
Identification of Target Genes In Vivo
To identify genes which were differentially expressed after in vivo exposure of rats to aflatoxin B1 (AB1), 2-nitrofluorene (2-NF), methapyrilene (MP) and piperonyl-butoxide (PBO) (exposure schedules: Fig. 1), we used gene array data from a previously published study [11]. Inclusion criteria for genes was that at least one of the compounds AB1, 2-NF, MP or PBO should cause an at least 2-fold increase or decrease of expression. This resulted in selection of genes which could be classified as either stress response, metabolism as well as DNA repair associated or associated with proliferating cells (Table 1).
Table 2. Gene expression alterations induced by MP, PBO, AB1 and 2-NF in vivo [11] and in cultivated hepatocytes (current data). The numbers represent fold changes compared to controls. In vitro, control hepatocytes have been cultivated on the same 6-well dishes as the compound exposed hepatocytes. Data are means of available Probe sets (in vivo) and medians of three independent experiments (in vitro). The data of all single experiments are shown in Suppl. Tables 1-5
MP PBO AB1 2-NF
in vivo in vitro in vivo in vitro in vivo in vitro in vivo in vitro
[mg/kg bw] [µM] [mg/kg bw] [µM] [mg/kg bw] [nM] [mg/kg bw] [µM]
60 100 6.25 0.39 1200 100 20 4 0.24 32 8 2 44 50 10 2
Abcb1 22.79 2.02 1.24 0.88 16.68 1.79 0.85 1.09 357.13 1.61 2.98 1.49 31.01 1.57 2.06 1.11
Apex 1.59 1.02 0.87 1.12 2.02 1.66 1.05 1.05 0.73 1.43 1.11 0.84 2.57 1.31 1.11 1.05
Bax 1.74 1.26 1.02 0.89 2.08 1.17 0.92 1.02 5.67 2.25 2.31 1.20 2.50 1.24 1.16 1.02
Cdkn1a 1.19 4.25 1.70 0.96 0.99 0.89 1.01 1.00 11.61 1.43 2.18 1.34 6.35 2.28 1.96 1.01
Gadd45a 2.30 1.36 1.15 1.22 1.55 1.21 0.70 1.13 1.53 1.27 1.57 0.81 1.07 1.86 1.82 1.01
Gsta2 2.40 1.92 1.12 0.98 4.85 7.30 4.67 1.31 1.48 2.07 2.61 1.28 5.09 7.50 3.58 1.30
Gsta5 4.13 0.57 0.58 1.30 9.08 1.50 1.68 1.28 2.08 0.85 0.88 1.02 10.78 3.43 1.59 1.28
Hsf1 4.54 2.01 1.19 1.11 1.16 1.03 1.03 1.11 3.02 1.72 1.77 1.03 1.36 1.65 1.27 0.91
Mdm2 1.11 3.44 1.67 0.85 2.01 1.42 0.94 1.18 3.90 2.14 3.86 1.28 3.56 2.60 1.91 0.97
Mt1a 1.92 1.41 0.86 0.88 0.61 0.69 1.14 1.05 0.32 1.00 0.98 1.03 0.43 0.55 0.98 1.18
Myc 3.10 1.25 1.26 1.10 2.27 1.18 0.83 1.03 1.44 0.77 0.94 0.90 2.46 1.39 1.05 1.01
Nqo1 1.76 1.73 1.38 1.04 3.13 2.93 2.80 0.92 1.29 2.57 2.72 1.19 4.61 5.44 3.12 1.44
Sds 0.84 1.94 0.38 0.68 0.16 0.13 0.30 0.78 0.20 0.68 1.19 1.02 0.79 0.37 0.55 1.18
Ugt1a6 1.23 0.48 0.74 0.92 3.27 3.08 2.31 1.12 1.00 0.87 0.98 1.07 1.30 2.62 2.13 1.43
Atf3 1.19 2.97 1.14 1.14 0.90 1.41 0.85 1.22 1.31 0.70 0.98 1.42 0.90 1.72 1.60 1.47
Cdc2 1.05 3.12 2.40 1.16 4.40 1.60 1.05 1.73 0.55 4.73 2.41 1.25 1.31 1.93 1.11 1.05
Cdc20 0.77 1.73 1.22 1.00 2.91 1.52 1.14 0.97 0.35 2.81 1.15 1.02 0.65 0.90 1.29 1.20
Igfbp1 0.85 0.45 1.35 1.12 0.93 1.14 0.85 1.10 0.19 0.31 0.69 0.87 0.53 0.62 0.51 0.70
Hdc 2.56 0.52 0.54 0.82 11.03 6.53 2.50 1.34 1.04 2.29 0.97 1.25 1.79 0.34 1.40 1.33
Map3k12 0.42 0.51 0.84 0.85 3.72 0.75 0.79 0.93 0.23 1.78 1.90 1.14 0.46 1.06 1.30 0.98
Mcm6 1.28 2.52 1.89 0.98 7.80 1.12 1.09 1.21 0.93 1.50 1.58 0.94 1.71 2.01 1.51 1.04
3-Phgdh 1.92 0.23 0.40 0.81 1.74 1.91 1.41 1.25 1.07 0.89 0.42 0.99 0.95 0.70 0.88 1.03
Top2a 0.96 2.65 2.30 0.44 3.94 0.31 0.47 1.51 0.58 1.49 2.64 0.82 0.98 1.14 1.06 1.16
In Vitro – In Vivo Correlation of Gene Expression Alterations Induced by Liver Carcinogens Current Medicinal Chemistry, 2012 Vol. 19, No. 11 1725
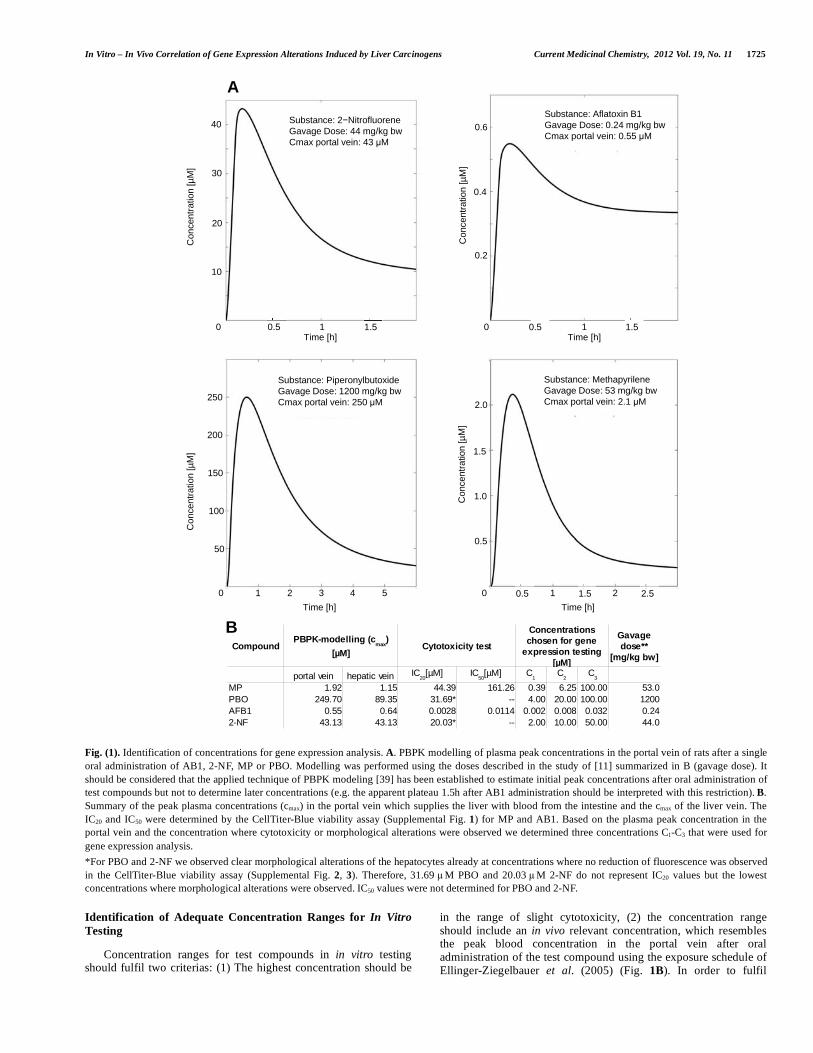
Fig. (1). Identification of concentrations for gene expression analysis. A. PBPK modelling of plasma peak concentrations in the portal vein of rats after a single oral administration of AB1, 2-NF, MP or PBO. Modelling was performed using the doses described in the study of [11] summarized in B (gavage dose). It should be considered that the applied technique of PBPK modeling [39] has been established to estimate initial peak concentrations after oral administration of test compounds but not to determine later concentrations (e.g. the apparent plateau 1.5h after AB1 administration should be interpreted with this restriction). B. Summary of the peak plasma concentrations (cmax) in the portal vein which supplies the liver with blood from the intestine and the cmax of the liver vein. The IC20 and IC50 were determined by the CellTiter-Blue viability assay (Supplemental Fig. 1) for MP and AB1. Based on the plasma peak concentration in the portal vein and the concentration where cytotoxicity or morphological alterations were observed we determined three concentrations C1-C3 that were used for gene expression analysis. *For PBO and 2-NF we observed clear morphological alterations of the hepatocytes already at concentrations where no reduction of fluorescence was observed in the CellTiter-Blue viability assay (Supplemental Fig. 2, 3). Therefore, 31.69 µM PBO and 20.03 µM 2-NF do not represent IC20 values but the lowest concentrations where morphological alterations were observed. IC50 values were not determined for PBO and 2-NF.
Identification of Adequate Concentration Ranges for In Vitro Testing
Concentration ranges for test compounds in in vitro testing should fulfil two criterias: (1) The highest concentration should be
in the range of slight cytotoxicity, (2) the concentration range should include an in vivo relevant concentration, which resembles the peak blood concentration in the portal vein after oral administration of the test compound using the exposure schedule of Ellinger-Ziegelbauer et al. (2005) (Fig. 1B). In order to fulfil
Compound Cytotoxicity test
portal vein hepatic veinMP 1.92 1.15 44.39 161.26 0.39 6.25 100.00 53.0PBO 249.70 89.35 31.69* -- 4.00 20.00 100.00 1200AFB1 0.55 0.64 0.0028 0.0114 0.002 0.008 0.032 0.242-NF 43.13 43.13 20.03* -- 2.00 10.00 50.00 44.0
PBPK-modelling (cmax
) [µM]
Concentrations chosen for gene
expression testing [µM]
Gavage dose**
[mg/kg bw]IC
20[µM] IC
50[µM] C
1C
2C
3
Con
cent
ratio
n [µ
M]
Con
cent
ratio
n [µ
M]
Con
cent
ratio
n [µ
M]
Con
cent
ratio
n [µ
M]
0
50
100
150
200
0
10
20
30
40
2.0
1.5
1.0
0.5
0
0.2
0.4
0.6
Time [h]
1 2 3 4 5
Time [h]
1 2
0 1Time [h] Time [h]
250
Substance: 2−NitrofluoreneGavage Dose: 44 mg/kg bwCmax portal vein: 43 μM
Substance: Aflatoxin B1Gavage Dose: 0.24 mg/kg bwCmax portal vein: 0.55 μM
Substance: PiperonylbutoxideGavage Dose: 1200 mg/kg bwCmax portal vein: 250 μM
Substance: MethapyrileneGavage Dose: 53 mg/kg bwCmax portal vein: 2.1 μM
10.5 1.5 0.5 1.5
0.5 1.5 2.5
A
B
1726 Current Medicinal Chemistry, 2012 Vol. 19, No. 11 Heise et al.
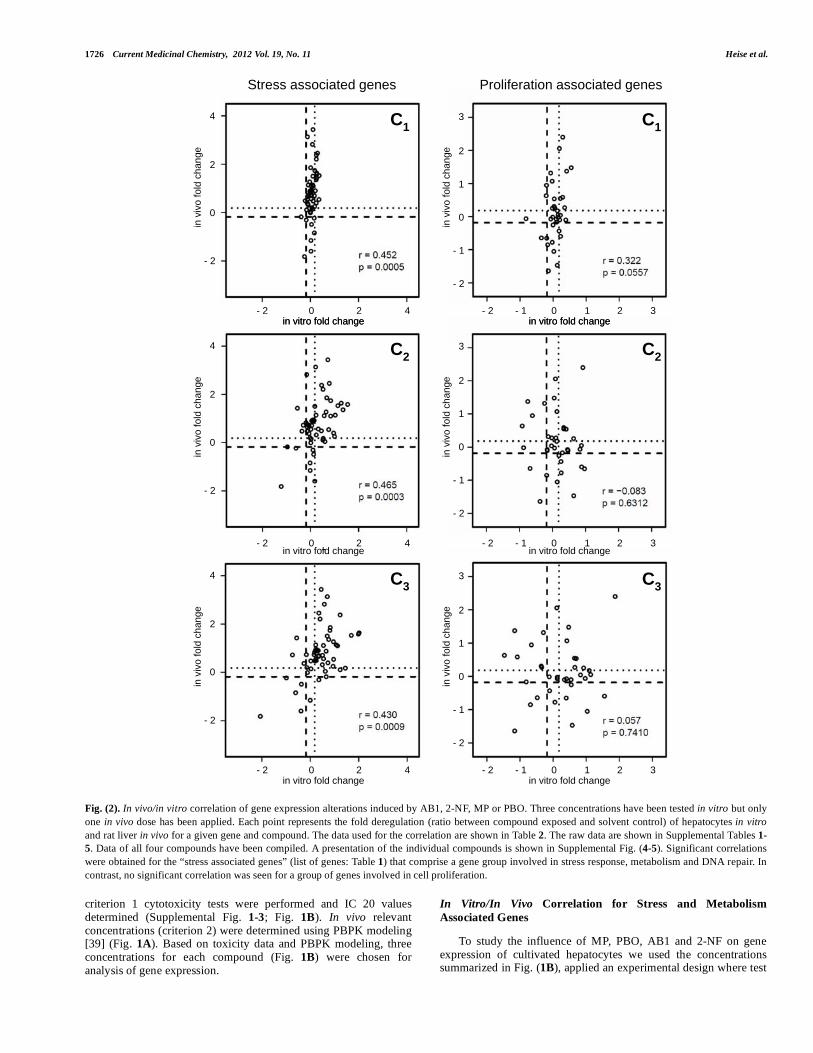
Fig. (2). In vivo/in vitro correlation of gene expression alterations induced by AB1, 2-NF, MP or PBO. Three concentrations have been tested in vitro but only one in vivo dose has been applied. Each point represents the fold deregulation (ratio between compound exposed and solvent control) of hepatocytes in vitro and rat liver in vivo for a given gene and compound. The data used for the correlation are shown in Table 2. The raw data are shown in Supplemental Tables 1-5. Data of all four compounds have been compiled. A presentation of the individual compounds is shown in Supplemental Fig. (4-5). Significant correlations were obtained for the “stress associated genes” (list of genes: Table 1) that comprise a gene group involved in stress response, metabolism and DNA repair. In contrast, no significant correlation was seen for a group of genes involved in cell proliferation.
criterion 1 cytotoxicity tests were performed and IC 20 values determined (Supplemental Fig. 1-3; Fig. 1B). In vivo relevant concentrations (criterion 2) were determined using PBPK modeling [39] (Fig. 1A). Based on toxicity data and PBPK modeling, three concentrations for each compound (Fig. 1B) were chosen for analysis of gene expression.
In Vitro/In Vivo Correlation for Stress and Metabolism Associated Genes
To study the influence of MP, PBO, AB1 and 2-NF on gene expression of cultivated hepatocytes we used the concentrations summarized in Fig. (1B), applied an experimental design where test
- 2 0 2 4 0- 1- 2 1 2 3
- 2
0
2
4
- 2
- 1
0
1
2
3
- 2
0
2
4
- 2
0
2
4
- 2 0 2 4 0- 1- 2 1 2 3
- 2 0 2 4 0- 1- 2 1 2 3
- 2
- 1
0
1
2
3
- 2
- 1
0
1
2
3
in vitro fold change
in vitro fold change
in vitro fold changein vitro fold change
in vitro fold change
in vitro fold change
in vitro fold changein vitro fold change
in v
ivo
fold
cha
nge
in v
ivo
fold
cha
nge
in v
ivo
fold
cha
nge
in v
ivo
fold
cha
nge
in v
ivo
fold
cha
nge
in v
ivo
fold
cha
nge
C1
C2
C3
C1
C2
C3
Stress associated genes Proliferation associated genes
In Vitro – In Vivo Correlation of Gene Expression Alterations Induced by Liver Carcinogens Current Medicinal Chemistry, 2012 Vol. 19, No. 11 1727
compound exposed hepatocytes and controls were cultivated on the same 6-well dish (3 wells exposed; 3 wells solvent controls), exposed for 24 h and performed all experiments with three technical and three biological replicates (from different rats isolated at different days). The results show a specific pattern of gene expression changes induced by each compound (Table 2).
The aim of this study was to compare test compound induced gene expression alterations in vitro and in vivo. Therefore, we performed a correlation analysis of fold changes in vivo vs. in vitro. For this purpose ratios between exposed and control animals were calculated for the selected 23 genes and similarly the fold
deregulation was calculated as the ratio between exposed hepatocytes and controls in vitro (Table 2). A good in vitro/in vivo correlation for gene expression alterations was obtained for the stress response, DNA repair and metabolism associated genes (Fig. 2). However, no correlation was obtained for genes associated with proliferation of cells. For the stress response, DNA repair and metabolism associated genes similar correlation coefficients were obtained for the high (C3, r=0.430, p=0.0009), the intermediate (C2, r=0.465, p=0.0003) and the low (C1, 0.452, p=0.0005) in vitro concentrations (Fig. 2). The extent of gene expression deregulation was concentration dependent with higher effects in C3 compared to
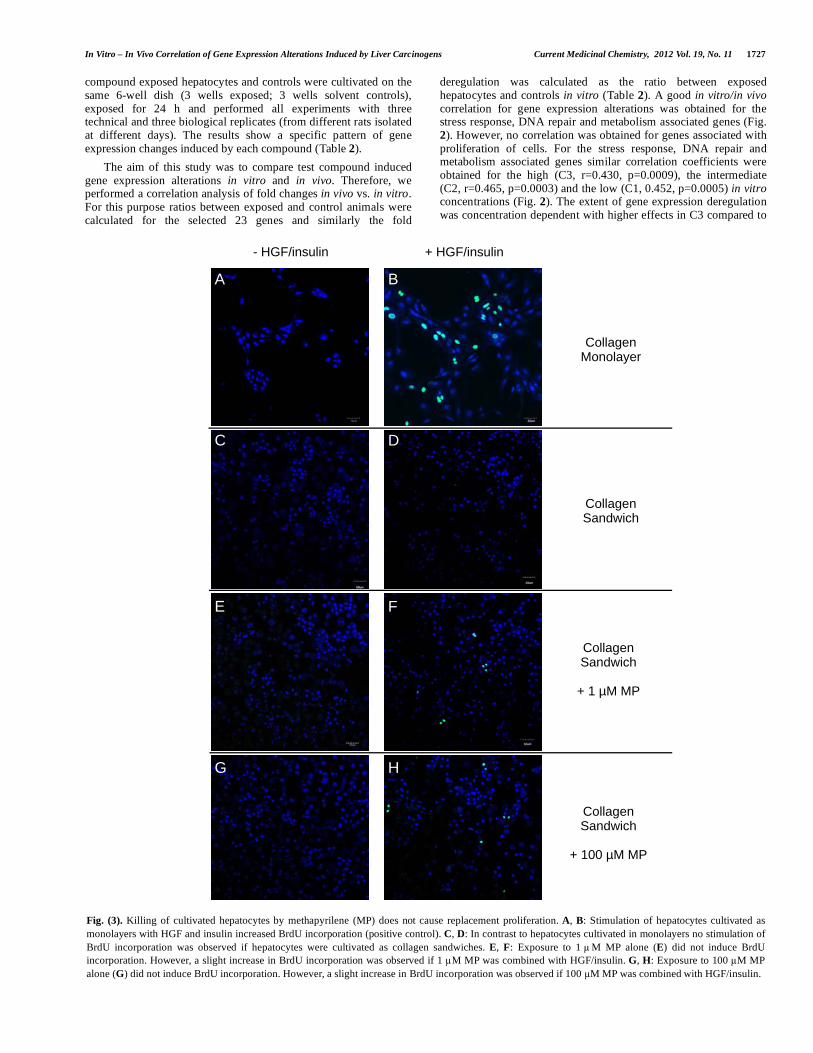
Fig. (3). Killing of cultivated hepatocytes by methapyrilene (MP) does not cause replacement proliferation. A, B: Stimulation of hepatocytes cultivated as monolayers with HGF and insulin increased BrdU incorporation (positive control). C, D: In contrast to hepatocytes cultivated in monolayers no stimulation of BrdU incorporation was observed if hepatocytes were cultivated as collagen sandwiches. E, F: Exposure to 1 µM MP alone (E) did not induce BrdU incorporation. However, a slight increase in BrdU incorporation was observed if 1 µM MP was combined with HGF/insulin. G, H: Exposure to 100 µM MP alone (G) did not induce BrdU incorporation. However, a slight increase in BrdU incorporation was observed if 100 µM MP was combined with HGF/insulin.
- HGF/insulin + HGF/insulin
CollagenMonolayer
CollagenSandwich
CollagenSandwich
+ 1 µM MP
CollagenSandwich
+ 100 µM MP
A B
C D
E F
G H
1728 Current Medicinal Chemistry, 2012 Vol. 19, No. 11 Heise et al.
C2 and to C1 (Fig. 2). Fig. (2) summarizes the effects of MP, PBO, AB1 and 2-NF without differentiating between the individual compounds. However, similar results were also obtained for each of the individual compounds (Supplemental Fig. 4-5).
Replacement Proliferation Explains In Vitro/In Vivo Discrepancies
The analyses described in the previous paragraphs have shown a good in vitro/in vivo correlation for stress, DNA repair or metabolism associated genes but a lack of correlation for genes associated with proliferation of cells. An explanation for the discrepancy could be replacement proliferation. It is obvious that such complex processes can not occur in vitro. To study if cultivated hepatocytes can show replacement proliferation we exposed sandwich cultures to cytotoxic concentrations of MP and studied if the surviving cells proliferate after washing out the test compound. Obviously, there was no BrdU incorporation in response to hepatocyte killing by MP (Fig. 3A, 3C, 3E, 3G), although hepatocytes were able to proliferate in response to HGF/insulin which were used as positive controls (Fig. 3B, 3D, 3F, 3H).
DISCUSSION
The current study shows a good in vitro/in vivo correlation of gene expression alterations induced by liver carcinogens. At least genes involved in stress response, DNA repair and metabolism respond similarly in liver tissue of rats and in hepatocytes in sandwich culture. This good result is encouraging considering that previous studies found only a little overlap between chemically induced gene expression alterations in cultivated hepatocytes and in liver tissue after in vivo exposure of rats [40]. In addition, cultivated hepatocytes represent an extremely dynamic system where more than 500 genes are up- or downregulated after hepatocytes are isolated from their physiological microenvironment and brought into culture [33-35]. In principle, noisy basal gene expression levels represent unfavorable conditions for toxicogenomic studies. Several reasons may explain the surprisingly good in vitro/in vivo correlation observed in the present study.
First, it should be considered that cultivated primary hepatocytes are not able to undergo replacement proliferation. Recently, we have modeled the spatial-temporal response of liver tissue to acute toxicity [41-43]. Destruction of liver tissue leads to a proliferation response of hepatocytes which is maximal about two days after toxic insult. Next, the daughter hepatocytes rearrange themselves in a coordinated process which is orchestrated by sinusoidal endothelial cells [41]. In other words, cultivated hepatocytes in the currently available in vitro systems do not proliferate to substitute for neighboring cells that have been killed
by exposure to the test compound. Therefore, genes usually associated to proliferation should be considered separately if in vitro/in vivo correlations are performed. Although an in vitro system capable of replacement proliferation would represent an important progress, a lack of this feature does not necessarily compromise its applicability for toxicity testing. It should be considered that replacement proliferation represents a secondary event after cells have been stressed, which possibly is specific for the individual chemical before they underwent cell death. It seems plausible that the primary events (initial response to chemically induced cell stress) may be sufficient to capture a compound specific fingerprint at the gene expression level (see also [10]). An interesting observation was that the combination of cytotoxic stress by MP in combination with HGF/insulin increased BrdU incorporation, which was not the case for sole MP nor for sole HGF/insulin exposure. Perhaps in the presence of mitogenic cytokines, sandwich cultures can acquire the ability of replacement proliferation. However, this aspect was not further studied in the current experiments.
Second, a number of technical optimizations should be performed before the sandwich culture system is used for gene expression studies. It is critical that solvent controls and compound exposed cells are cultivated on the same 6-well dish. It is also important to perform compound exposures between 24 and 48 h after plating the hepatocytes. The reason is that most basal gene expression alterations occur during the first 24 h, meaning that the noisiest period is already over when starting with test compound exposure. Finally, the test systems should be optimized in a way that activation of the Raf/Mek/Erk and PI3K/Akt pathways is minimized as described by [36].
Third, it should be considered that previous studies may have produced misleading results because of a suboptimal study design. In the study of [40] where genome wide alterations in gene expression patterns caused by paracetamol are compared in vivo and in vitro, Wistar rats have been used in vitro, whereas F344 rats were studied in vivo. There is practically no overlap of genes altered in the two Wistar rat hepatocyte in vitro systems and the F344 rats in vivo. However, it is unclear to which degree the difference in rat strains has contributed to the in vitro/in vivo discrepancy. In the current study, we used Wistar rats for both in vivo and in vitro studies. Besides deficiencies in study design, it should also be taken into account that toxicokinetics may be responsible for in vitro/in vivo discrepancies. In vitro the test compound is added to the culture medium usually leading to a relatively constant exposure over the cultivation period. In vivo half-life often is much shorter so that many compounds are almost completely excreted after 24 h with the consequence that transiently deregulated genes may have returned to control levels. An ongoing project in our laboratory currently studies to which degree different toxicokinetics in vitro and in vivo explain in vitro/in vivo
Table 3. Methapyrilene alone does not cause replacement proliferation of cultivated hepatocytes. M: Monolayer cultures, S: Sandwich cultures. The data correspond to the experimental design described in Fig. (3)
Culture conditions % of BrdU positive nuclei
Culture type Methapyrilene [µM] HGF/insulin 24h 48h 72h
M M
0 0
no yes
0.0 ± 0.0 0.0 ± 0.0
0.0 ± 0.0 25.3 ± 2.0
0.0 ± 0.0 22.2 ± 2.1
S S
0 0
no yes
0.0 ± 0.0 0.0 ± 0.0
0.0 ± 0.0 0.0 ± 0.0
0.0 ± 0.0 0.0 ± 0.0
S S
1 1
no yes
0.0 ± 0.0 0.0 ± 0.0
0.0 ± 0.0 4.0 ± 1.0
0.0 ± 0.0 4.0 ± 1.0
S S
100 100
no yes
0.0 ± 0.0 0.0 ± 0.0
0.0 ± 0.0 4.5 ± 0.5
0.0 ± 0.0 6.5 ± 0.5
In Vitro – In Vivo Correlation of Gene Expression Alterations Induced by Liver Carcinogens Current Medicinal Chemistry, 2012 Vol. 19, No. 11 1729
discrepancies of gene expression (Schug et al., in preparation, 2012).
An important conclusion of this study is that significant in vivo/in vitro correlations of gene expression alterations were obtained for a large range of in vitro concentrations. Although, the smallest extent of gene expression deregulation was obtained for the lowest in vitro concentration (C1) this still was sufficient to allow a significant correlation with the corresponding effects observed in vivo. The largest gene expression alterations were obtained for the highest, cytotoxic in vitro concentration (C3). Of course this should not be interpreted in a way that cytotoxic concentrations are adequate for analysis of gene expression alterations in vitro. It should be considered that we have chosen genes known to be deregulated by the test compounds in vivo. It cannot be excluded that the applied toxic in vitro concentrations besides influencing the “in vivo relevant genes” additionally induce an unspecific toxicity associated gene expression response. This is currently systematically analyzed by genome wide analyses. The choice of adequate in vitro concentrations for the current study was not trivial. The highest in vitro concentration (C3) was in a cytotoxic range for all tested compounds (Fig. 1B). It should be considered that cytotoxicity tests were performed with a 72 h exposure period, because cell killing of hepatocytes requires relatively long time periods for some test compounds. On the other hand gene expression analysis was performed already after 24 h of compound exposure. This means that expression of genes was analyzed in cells that still survived after 24 h but partly would die within the following 48 h. In contrast, the lowest in vitro concentration (C1) was even below the maximal in vivo blood concentration in the portal vein calculated by PBPK modelling (Fig. 1B). Although the extent of gene deregulation was small, the low concentration (C1) was still sufficient to cause expression alterations that correlate with those obtained in rats in vivo. This approach of choosing on the one hand cytotoxic and on the other hand in vivo relevant concentrations was straightforward for 2-NF, MP and PBO. However, for AB1 a difficult scenario was obtained, because PBPK modeling predicted that peak concentrations in the portal vein after administration of 0.24 mg/kg bw (the dose applied in the in vivo study of [11]) correspond to cytotoxic in vitro concentrations. This model prediction was surprising and requires experimental verification in future. Nevertheless, gene expression analyses for AB1 also showed concentration dependent effects in vitro (Table 2) as well as a good correlation with the in vivo results (Suppl. Fig. 4-5) similar to the other tested compounds.
In most cases a concentration dependent effect could be observed for the three concentrations (Table 2). For a relatively small number of experiments, an induction was observed for the low and intermediate concentration but a weaker effect for the highest concentration (e.g. Abcb1 for 2-NF). This scenario might be explained by toxicity of the highest concentration. This was also observed for several genes after exposure to the highest concentration of AB1 (32 nM).
In the present study, we selected genes which were affected in vivo and compared the observed expression alterations to the corresponding responses in vitro. Of course this approach does not exclude that in vitro (unspecific) gene expression alterations may be induced that do not occur in vivo. This aspect is currently under investigation in a gene array study.
In conclusion, this study has shown a good in vivo/in vitro correlation of genes representing certain pathways to be deregulated by the rat liver carcinogens aflatoxin B1, 2-nitrofluorene, methapyrilene and piperonyl-butoxide over a wide concentration range. However, it is important to consider that cultivated hepatocytes in contrast to the liver in vivo do not undergo replacement proliferation and therefore genes associated with proliferation cannot be predicted with the currently applied in vitro
system, a function which does appear to be characteristically affected by e.g. non-genotoxic carcinogens.
ACKNOWLEDGMENTS AND CONFLICT OF INTEREST
This project was funded by the German Federal Ministry of Education and Research; Grant No 0313854A+C. There is no conflict of interest.
SUPPLEMENTARY MATERIAL
Supplementary material is available on the publishers Web site along with the published article.
REFERENCES
[1] Hamadeh, H.K., Knight, B.L., Haugen, A.C., Sieber, S., Amin, R.P., Bushel, P.R., Stoll, R., Blanchard, K., Jayadev, S., Tennant, R.W., Cunningham, M.L., Afshari, C.A. & Paules, R.S. Methapyrilene toxicity: anchorage of pathologic observations to gene expression alterations. Toxicol. Pathol., 2002, 30(4), 470-482
[2] Thybaud, V., Le Fevre, A.-C. & Boitier, E. Application of toxicogenomics to genetic toxicology risk assessment. Environ. Mol. Mutagen., 2007, 48(5), 369-379
[3] Glahn, F., Schmidt-Heck, W., Zellmer, S., Guthke, R., Wiese, J., Golka, K., Hergenröder, R., Degen, G.H., Lehmann, T., Hermes, M., Schormann, W., Brulport, M., Bauer, A., Bedawy, E., Gebhardt, R., Hengstler, J.G. & Foth, H. Cadmium, cobalt and lead cause stress response, cell cycle deregulation and increased steroid as well as xenobiotic metabolism in primary normal human bronchial epithelial cells which is coordinated by at least nine transcription factors. Arch. Toxicol., 2008, 82(8), 513-524
[4] Schmidt, M., Böhm, D., von Törne, C., Steiner, E., Puhl, A., Pilch, H., Lehr, H.-A., Hengstler, J.G., Kölbl, H. & Gehrmann, M. The humoral immune system has a key prognostic impact in node-negative breast cancer. Cancer Res., 2008, 68(13), 5405-5413
[5] Hellwig, B., Hengstler, J.G., Schmidt, M., Gehrmann, M.C., Schormann, W. & Rahnenführer, J. Comparison of scores for bimodality of gene expression distributions and genome-wide evaluation of the prognostic relevance of high-scoring genes. BMC Bioinformatics, 2010, 11, 276
[6] Cadenas, C., Franckenstein, D., Schmidt, M., Gehrmann, M., Hermes, M., Geppert, B., Schormann, W., Maccoux, L.J., Schug, M., Schumann, A., Wilhelm, C., Freis, E., Ickstadt, K., Rahnenführer, J., Baumbach, J.I., Sickmann, A. & Hengstler, J.G. Role of thioredoxin reductase 1 and thioredoxin interacting protein in prognosis of breast cancer. Breast Cancer Res., 2010, 12(3), R44
[7] Ellinger-Ziegelbauer, H., Gmuender, H., Bandenburg, A. & Ahr, H.J. Prediction of a carcinogenic potential of rat hepatocarcinogens using toxicogenomics analysis of short-term in vivo studies. Mutat. Res., 2008, 637(1-2), 23-39
[8] Fielden, M.R., Brennan, R. & Gollub, J. A gene expression biomarker provides early prediction and mechanistic assessment of hepatic tumor induction by nongenotoxic chemicals. Toxicol. Sci., 2007, 99(1), 90-100
[9] Nie, A.Y., McMillian, M., Parker, J.B., Leone, A., Bryant, S., Yieh, L., Bittner, A., Nelson, J., Carmen, A., Wan, J. & Lord, P.G. Predictive toxicogenomics approaches reveal underlying molecular mechanisms of nongenotoxic carcinogenicity. Mol. Carcinog., 2006, 45(12), 914-933
[10] Fielden, M.R., Adai, A., Dunn, 2nd, R.T., Olaharski, A., Searfoss, G., Sina, J., Aubrecht, J., Boitier, E., Nioi, P., Auerbach, S., Jacobson-Kram, D., Raghavan, N., Yang, Y., Kincaid, A., Sherlock, J., Chen, S.-J., Car, B. & , On behalf of the Predictive Safety Testing Consortium, C.W.G. Development and Evaluation of a Genomic Signature for the Prediction and Mechanistic Assessment of Nongenotoxic Hepatocarcinogens in the Rat. Toxicol. Sci., 2011, [Epub ahead of print]
[11] Ellinger-Ziegelbauer, H., Stuart, B., Wahle, B., Bomann, W. & Ahr, H.J. Comparison of the expression profiles induced by genotoxic and nongenotoxic carcinogens in rat liver. Mutat. Res., 2005, 575(1-2), 61-84
[12] Hewitt, N.J., Lechón, M.J.G., Houston, J.B., Hallifax, D., Brown, H.S., Maurel, P., Kenna, J.G., Gustavsson, L., Lohmann, C., Skonberg, C., Guillouzo, A., Tuschl, G., Li, A.P., LeCluyse, E., Groothuis, G.M.M. & Hengstler, J.G. Primary hepatocytes: current understanding of the regulation of metabolic enzymes and transporter proteins, and pharmaceutical practice for the use of hepatocytes in metabolism, enzyme induction, transporter, clearance, and hepatotoxicity studies. Drug Metab. Rev., 2007, 39(1), 159-234
[13] Hengstler, J.G., Godoy, P. & Bolt, H.M. The dilemma of cultivated hepatocytes. Arch. Toxicol., 2009, 83(2), 101-103
[14] Ullrich, A., Stolz, D.B., Ellis, E.C., Strom, S.C., Michalopoulos, G.K., Hengstler, J.G. & Runge, D. Long term cultures of primary human hepatocytes as an alternative to drug testing in animals. ALTEX, 2009, 26(4), 295-302
1730 Current Medicinal Chemistry, 2012 Vol. 19, No. 11 Heise et al.
[15] Aurich, H., Sgodda, M., Kaltwasser, P., Vetter, M., Weise, A., Liehr, T., Brulport, M., Hengstler, J.G., Dollinger, M.M., Fleig, W.E. & Christ, B. Hepatocyte differentiation of mesenchymal stem cells from human adipose tissue in vitro promotes hepatic integration in vivo. Gut, 2009, 58(4), 570-581
[16] Riquelme, P., Wundt, J., Hutchinson, J.A., Brulport, M., Jun, Y., Sotnikova, A., Girreser, U., Braun, F., Gövert, F., Soria, B., Nüssler, A., Clement, B., Hengstler, J.G. & Fändrich, F. A refined characterisation of the NeoHepatocyte phenotype necessitates a reappraisal of the transdifferentiation hypothesis. Differentiation, 2009, 77(3), 263-276
[17] Brulport, M., Schormann, W., Bauer, A., Hermes, M., Elsner, C., Hammersen, F.J., Beerheide, W., Spitkovsky, D., Härtig, W., Nussler, A., Horn, L.C., Edelmann, J., Pelz-Ackermann, O., Petersen, J., Kamprad, M., von Mach, M., Lupp, A., Zulewski, H. & Hengstler, J.G. Fate of extrahepatic human stem and precursor cells after transplantation into mouse livers. Hepatology, Leibniz Research Centre for Working Environment and Human Factors, Dortmund, Germany. [email protected], 2007, 46(3), 861-870
[18] Hengstler, J.G., Brulport, M., Schormann, W., Bauer, A., Hermes, M., Nussler, A.K., Fandrich, F., Ruhnke, M., Ungefroren, H., Griffin, L., Bockamp, E., Oesch, F. & von Mach, M.-A. Generation of human hepatocytes by stem cell technology: definition of the hepatocyte. Expert Opin. Drug Metab. Toxicol., 2005, 1(1), 61-74
[19] Gebhardt, R., Hengstler, J.G., Müller, D., Glöckner, R., Buenning, P., Laube, B., Schmelzer, E., Ullrich, M., Utesch, D., Hewitt, N., Ringel, M., Hilz, B.R., Bader, A., Langsch, A., Koose, T., Burger, H.-J., Maas, J. & Oesch, F. New hepatocyte in vitro systems for drug metabolism: metabolic capacity and recommendations for application in basic research and drug development, standard operation procedures. Drug Metab. Rev., 2003, 35(2-3), 145-213
[20] Carmo, H., Hengstler, J.G., de Boer, D., Ringel, M., Remião, F., Carvalho, F., Fernandes, E., dos Reys, L.A., Oesch, F. & de Lourdes Bastos, M. Metabolic pathways of 4-bromo-2,5-dimethoxyphenethylamine (2C-B): analysis of phase I metabolism with hepatocytes of six species including human. Toxicology, 2005, 206(1), 75-89
[21] Hengstler, J.G., Utesch, D., Steinberg, P., Platt, K.L., Diener, B., Ringel, M., Swales, N., Fischer, T., Biefang, K., Gerl, M., Böttger, T. & Oesch, F. Cryopreserved primary hepatocytes as a constantly available in vitro model for the evaluation of human and animal drug metabolism and enzyme induction. Drug Metab. Rev., 2000, 32(1), 81-118
[22] Saussele, T., Burk, O., Blievernicht, J.K., Klein, K., Nussler, A., Nussler, N., Hengstler, J.G., Eichelbaum, M., Schwab, M. & Zanger, U.M. Selective induction of human hepatic cytochromes P450 2B6 and 3A4 by metamizole. Clin. Pharmacol. Ther., 2007, 82(3), 265-274
[23] Kafert-Kasting, S., Alexandrova, K., Barthold, M., Laube, B., Friedrich, G., Arseniev, L. & Hengstler, J.G. Enzyme induction in cryopreserved human hepatocyte cultures. Toxicology, 2006, 220(2-3), 117-125
[24] Ringel, M., von Mach, M.A., Santos, R., Feilen, P.J., Brulport, M., Hermes, M., Bauer, A.W., Schormann, W., Tanner, B., Schön, M.R., Oesch, F. & Hengstler, J.G. Hepatocytes cultured in alginate microspheres: an optimized technique to study enzyme induction. Toxicology, 2005, 206(1), 153-167
[25] Ullrich, A., Berg, C., Hengstler, J.G. & Runge, D. Use of a standardised and validated long-term human hepatocyte culture system for repetitive analyses of drugs: repeated administrations of acetaminophen reduces albumin and urea secretion. ALTEX, 2007, 24(1), 35-40
[26] Bauer, A., Schumann, A., Gilbert, M., Wilhelm, C., Hengstler, J.G., Schiller, J. & Fuchs, B. Evaluation of carbon tetrachloride-induced stress on rat hepatocytes by 31P NMR and MALDI-TOF mass spectrometry: lysophosphatidylcholine generation from unsaturated phosphatidylcholines. Chem. Phys. Lipids, 2009, 159(1), 21-29
[27] Schumann, A., Bauer, A., Hermes, M., Gilbert, M., Hengstler, J.G. & Wilhelm, C. A rapid and easy to handle thermoluminescence based technique for evaluation of carbon tetrachloride-induced oxidative stress on rat hepatocytes. Arch. Toxicol., 2009, 83(7), 709-720
[28] Ilowski, M., Kleespies, A., de Toni, E.N., Donabauer, B., Jauch, K.-W., Hengstler, J.G. & Thasler, W.E. Augmenter of liver regeneration (ALR) protects human hepatocytes against apoptosis. Biochem. Biophys. Res. Commun., 2011, 404(1), 148-152
[29] Ilowski, M., Putz, C., Weiss, T.S., Brand, S., Jauch, K.-W., Hengstler, J.G. & Thasler, W.E. Augmenter of liver regeneration causes different kinetics of ERK1/2 and Akt/PKB phosphorylation than EGF and induces hepatocyte proliferation in an EGF receptor independent and liver specific manner. Biochem. Biophys. Res. Commun., 2010, 394(4), 915-920
[30] Godoy, P., Lakkapamu, S., Schug, M., Bauer, A., Stewart, J.D., Bedawi, E., Hammad, S., Amin, J., Marchan, R., Schormann, W., Maccoux, L., von Recklinghausen, I., Reif, R. & Hengstler, J.G. Dexamethasone-dependent versus -independent markers of epithelial to mesenchymal transition in primary hepatocytes. Biol. Chem., 2010, 391(1), 73-83
[31] Klingmüller, U., Bauer, A., Bohl, S., Nickel, P.J., Breitkopf, K., Dooley, S., Zellmer, S., Kern, C., Merfort, I., Sparna, T., Donauer, J., Walz, G., Geyer, M., Kreutz, C., Hermes, M., Götschel, F., Hecht, A., Walter, D., Egger, L., Neubert, K., Borner, C., Brulport, M., Schormann, W., Sauer, C., Baumann, F., Preiss, R., MacNelly, S., Godoy, P., Wiercinska, E., Ciuclan, L., Edelmann, J., Zeilinger, K., Heinrich, M., Zanger, U.M., Gebhardt, R., Maiwald, T., Heinrich, R., Timmer, J., von Weizsäcker, F. & Hengstler, J.G. Primary mouse hepatocytes for systems biology approaches: a standardized in vitro system for modelling of signal transduction pathways. Syst. Biol. (Stevenage), 2006, 153(6), 433-447
[32] Kienhuis, A.S., van de Poll, M.C.G., Dejong, C.H.C., Gottschalk, R., van Herwijnen, M., Boorsma, A., Kleinjans, J.C.S., Stierum, R.H. & van Delft, J.H.M. A toxicogenomics-based parallelogram approach to evaluate the relevance of coumarin-induced responses in primary human hepatocytes in vitro for humans in vivo. Toxicol. In Vitro, 2009, 23(6), 1163-1169
[33] Beigel, J., Fella, K., Kramer, P.-J., Kroeger, M. & Hewitt, P. Genomics and proteomics analysis of cultured primary rat hepatocytes. Toxicol. In Vitro, 2008, 22(1), 171-181
[34] Tuschl, G. & Mueller, S.O. Effects of cell culture conditions on primary rat hepatocytes-cell morphology and differential gene expression. Toxicology, 2006, 218(2-3), 205-215
[35] Zellmer, S., Schmidt-Heck, W., Godoy, P., Weng, H., Meyer, C., Lehmann, T., Sparna, T., Schormann, W., Hammad, S., Kreutz, C., Timmer, J., von Weizsäcker, F., Thürmann, P.A., Merfort, I., Guthke, R., Dooley, S., Hengstler, J.G. & Gebhardt, R. Transcription factors ETF, E2F, and SP-1 are involved in cytokine-independent proliferation of murine hepatocytes. Hepatology, 2010, 52(6), 2127-2136
[36] Godoy, P., Hengstler, J.G., Ilkavets, I., Meyer, C., Bachmann, A., Müller, A., Tuschl, G., Mueller, S.O. & Dooley, S. Extracellular matrix modulates sensitivity of hepatocytes to fibroblastoid dedifferentiation and transforming growth factor beta-induced apoptosis. Hepatology, 2009, 49(6), 2031-2043
[37] Godoy, P., Lakkapamu, S., Schug, M., Bauer, A., Stewart, J.D., Bedawi, E., Hammad, S., Amin, J., Marchan, R., Schormann, W., Maccoux, L., von Recklinghausen, I., Reif, R. & Hengstler, J.G. Dexamethasone-dependent versus -independent markers of epithelial to mesenchymal transition in primary hepatocytes. Biol. Chem., 2010, 391(1), 73-83
[38] Schug, M., Heise, T., Bauer, A., Storm, D., Blaszkewicz, M., Bedawy, E., Brulport, M., Geppert, B., Hermes, M., Föllmann, W., Rapp, K., Maccoux, L., Schormann, W., Appel, K.E., Oberemm, A., Gundert-Remy, U. & Hengstler, J.G. Primary rat hepatocytes as in vitro system for gene expression studies: comparison of sandwich, Matrigel and 2D cultures. Arch. Toxicol., 2008, 82(12), 923-931
[39] Mielke, H., Anger, L.T., Schug, M., Hengstler, J.G., Stahlmann, R. & Gundert-Remy, U. A physiologically based toxicokinetic modelling approach to predict relevant concentrations for in vitro testing. Arch Toxicol., 2011, 85(6), 555-563
[40] Kienhuis, A.S., van de Poll, M.C.G., Wortelboer, H., van Herwijnen, M., Gottschalk, R., Dejong, C.H.C., Boorsma, A., Paules, R.S., Kleinjans, J.C.S., Stierum, R.H. & van Delft, J.H.M. Parallelogram approach using rat-human in vitro and rat in vivo toxicogenomics predicts acetaminophen-induced hepatotoxicity in humans. Toxicol. Sci., 2009, 107(2), 544-552
[41] Hoehme, S., Brulport, M., Bauer, A., Bedawy, E., Schormann, W., Hermes, M., Puppe, V., Gebhardt, R., Zellmer, S., Schwarz, M., Bockamp, E., Timmel, T., Hengstler, J.G. & Drasdo, D. Prediction and validation of cell alignment along microvessels as order principle to restore tissue architecture in liver regeneration. Proc. Natl. Acad. Sci. U S A, 2010, 107(23), 10371-10376
[42] Höhme, S., Hengstler, J.G., Brulport, M., Schäfer, M., Bauer, A., Gebhardt, R. & Drasdo, D. Mathematical modelling of liver regeneration after intoxication with CCl(4). Chem. Biol. Interact., 2007, 168(1), 74-93
[43] Leibniz Research Centre for Working Environment and Human Factors http://www.ifado.de/en/research_applications/research_groups/susceptibility/research/link2/index.html video 2
Received: September 26, 2011 Revised: December 07, 2011 Accepted: December 08, 2011


