Embed Size (px)
Citation preview

64
This article can be downloaded from http://www.iajlb.com/currentissue.php
Indo-Am. J. of LifeSc & Bt., 2014 Rajendra Singh and B B Singh, 2014
INCIDENCE AND BIODIVERSITY OF RICELAND SPIDERS(ARTHROPODA : ARACHNIDA) IN NORTHEASTERN
UTTAR PRADESH, INDIA
B B Singh1 and Rajendra Singh2*
Spider samples were taken after planting the rice crop until harvesting at 15 days interval(DAT) at randomly selected 8 sites in four districts (Kushinagar, Deoria, Gorakhpur andMahrajganj) of northeastern Uttar Pradesh, India. A total of 13,303 individuals belongingto 58 species, 28 genera and 10 families were collected. Among them, 9 (53.3%), 11(33.6%), 35 (12.8%), and 3 (0.3%) species were most dominant, dominant, agrophile andrare, respectively. The most dominant species was Tetragnatha javana (7.23%) followedby Pardosa pseudoannulata (6.89%); Tetragnatha mandibulata (6.34%); Pardosa birmanica
(6.33%); Hippasa holmerae (5.70%); Tetragnatha maxillosa (5.46%); Oxyopes javanus (5.31%);Hippasa partita (5.05%); and Camaricus formosus (4.95%), Araneus ellipticus (4.89%),Clubiona japonicola (4.43%), Leucauge decorata (4.19%), Neoscona theisi (3.88%), Lycosa
mackenziei (3.86%), Plexippus paykulli (3.00%), Plexippus calcutaensis (2.52%), Plexippus
petersi (2.01%), Leucauge celebesiana (1.99%), Pardosa sumatrana (1.58%), and an araneidspecies (1.29%). Of the total catch, 30.9% were juveniles and proportion of males was0.72. Lycosidae and Tetragnathidae accounted for the largest population, eachrepresenting 29.85% and 27.95%, respectively. Among six foraging guilds, orb weabers(44.3%) formed the most dominant guild followed by ground runners (30.0%), stalkers(15.2%), foliage runners (5.3%), ambusers (5.1%) and space builder (0.1%). Differentecological indices were calculated at all 8 locations and 8 DATs and its consequenceswere discussed.
Keywords: Riceland, Spiders, Ecological indices, Biodiversity of spiders, Foraging guilds
*Corresponding Author: Rajendra Singh � [email protected]
INTRODUCTIONSpiders are potential biological control agentsin agroecosystems (Riechert, 1984; Barrion andLitsinger, 1995). Many workers have described
1 Department of Agricultural Zoology and Entomology, PG College, Itawah, UP.2 Department of Zoology, DDU Gorakhpur University, Gorakhpur-273009, UP, India.
Indo-Am. J. of LifeSc & Bt., 2014 ISSN 2347-2243 www.iajlb.com
Vol. 2, No. 1, February 2014
© 2014 IAJLB. All Rights Reserved
Research Paper
spider species abundance or its composition indifferent agroecosystems (Wisnieswka andProkopy, 1997; Rodrigues et al., 2009),quantitative observations on the abundance of
65
This article can be downloaded from http://www.iajlb.com/currentissue.php
Indo-Am. J. of LifeSc & Bt., 2014 Rajendra Singh and B B Singh, 2014
spiders (Carroll and Hoyt, 1984; Sudhikumar etal., 2005a, b) or recorded spider predation events(Tahir and Butt, 2008; Chauhan et al., 2009). Arice (Oryza sativa Linn.) field is a complexagroecosystem, containing many aquatic, semi-aquatic, and terrestrial species. Spiders are wellrepresented among the many predators foundin this habitat (Barrion and Litsinger, 1994,1995). Numerous surveys of spiders have beenconducted in the rice growing regions of Asia(Heong et al., 1991, Misra and Srivastava, 1993;Barrion and Litsinger, 1995; Kim, 1995a, b;Barrion and Schoenly, 1999; Mukhtar, 2004;Sebastian et al., 2005). The spider fauna of therice fields in India has been studied by manyauthors in the different parts of the country(Anbalagan and Narayanaswamy, 1999; Pathakand Saha, 1999; Bhattacharya, 2000). However,it is a less common practice among workers tocompare spider abundance at different stages ofcrop growth with the exception of the work ofBanerji et al. (1993) and Sudhikumar et al.(2005a). There has been less study on the
seasonal variation of spiders and their ecologicalimpact. In this work, the data were presented tocompare the abundance and richness of spidersduring different stages of the crop growth.
MATERIALS AND METHODS
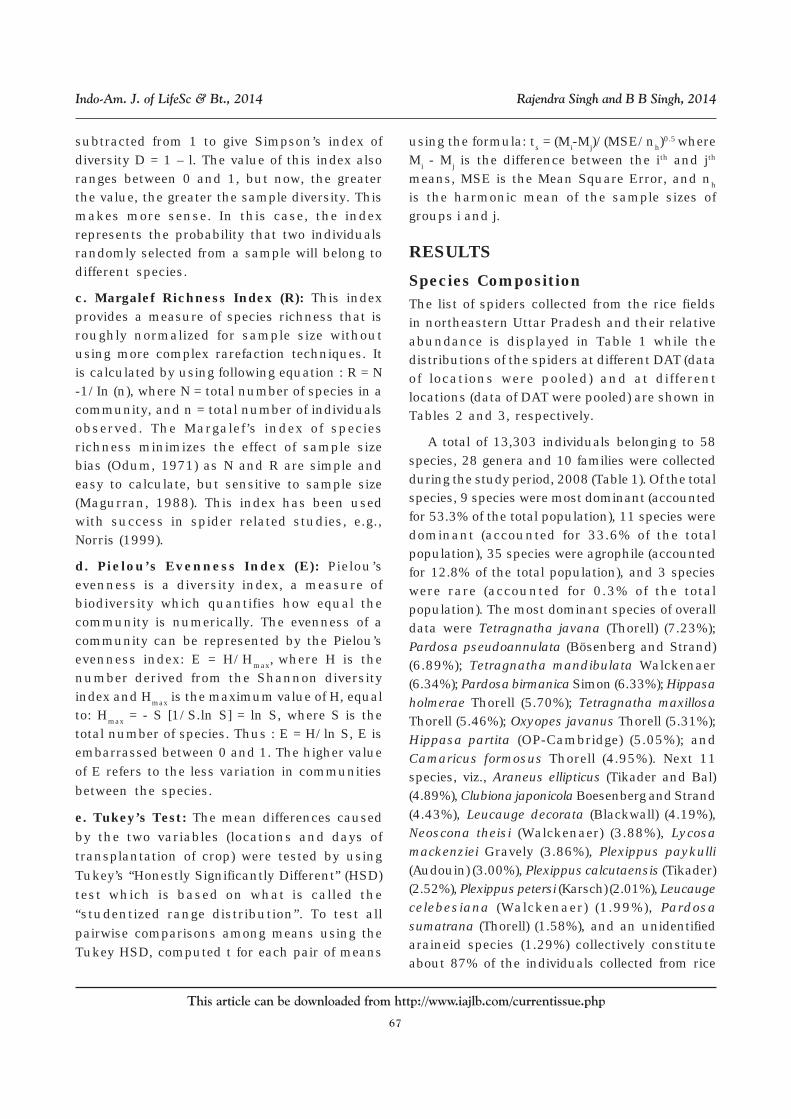
Site of InvestigationThe present investigation was carried out for aperiod of crop (kharif) seasons, 2008. Samplingwas conducted at the following randomly selected8 sites: 1. Padrauna (26° 53’ 44" n, 83° 58’ 21" E,84 m asl), 2. Ramkola (26° 54’ 09" N, 83° 50’ 31"E, 84 m asl) (District - Kushinagar); 3. Deoria(26° 30’ 46" N, 83° 48’ 60" E, 77 m asl), 4.Bhatparrani (26° 17’ 44" N, 84° 02’ 24" E, 70 masl) (District - Deoria); 5. Chaurichaura (26° 38’40" N, 83° 34’ 38" E, 78 m asl), 6. Pipraich (26°49’ 25" N, 83° 31’ 06" E, 84 m asl) (District -Gorakhpur); 7. Mahrajganj (27° 08’ 33" N, 83°34’ 15" E, 93 m asl) and 8. Partawal (26° 57’ 55"N, 83° 36’ 03" E, 89 m asl) (District - Mahrajganj)(Figure 1). Two districts Kushinagar and
Figure 1: Map of the Study Site (1-8) in 4 Districts of Northeast Uttar Pradesh(Courtesy www.mapofindia.com)
66
This article can be downloaded from http://www.iajlb.com/currentissue.php
Indo-Am. J. of LifeSc & Bt., 2014 Rajendra Singh and B B Singh, 2014
Mahrajganj are adjacent and near the foot ofHimalayas with typical terai climate. Remainingtwo districts, Deoria and Gorakhpur are southto the above districts. All the districts are wellinundated by several rivers and riverines. Morethan 80% of the total annual rainfall is receivedduring the crop season, July to October.
Sampling MethodsSampling of spiders was done followingSudhikumar et al. (2005) every 15 Days AfterTransplantation (DAT) of crop from 4 quadrates(1 x 1 m) placed at four corners of 10 x 10 m areaby visual search method between 9.00 – 11.00a.m. A sufficient core area was left to avoid edgeeffects. All 4 quadrates were searched for a totalof one hour. Eight visits were made per site. Atotal of 32 quadrates were studied per site.Spiders were also collected from the groundstratum and from the terminals of plants.Specimens from each quadrate were preservedin 75% alcohol in the field and identified andcounted under a stereo-zoom microscope in thelaboratory. Each mature specimen that could notbe identified was included as a species, but itsgenus was not added in the total genera.
Spiders were classified as most dominantspecies (> 5.0% of the total population), dominant(1-5% of the total population), agrophile (0.1-1.0%of the total population) and rare (< 0.1% of thetotal population).
DATA ANALYSIS FOR DIVERSITYINDICESIn this study, the Shannon-Wiener diversityindex (H), which is sensitive to changes in theabundance of rare species in a community, wasapplied because it incorporated the speciesrichness and evenness and adapted to a simplestatistical analysis. In addition, Simpson index(l), which is sensitive to changes in the mostabundant species in a community, Margalefrichness index (R) and Pielou’s evenness index(E) of spider communities were also calculated
for a comparison. Characteristics of each indexare given below.
a. Shannon-Wiener Diversity Index (H):Historically, the Shannon-Wiener diversityindex has been used to measure the effects ofhabitat quality such as effects of pollutioneffluents. Recently, this index has fallen out offavor, because it does not take into accounthabitat specific parameters required by specificspecies. Though the results of the Shannon-Wiener index needs to be used with caution, itstill provides a good learning tool for comparingtwo distinct habitats. It combines twoquantifiable measures: the species richness(the number of species within the community)and the species equitability (how even are thenumbers of individual species). It is computedby using following equation: H = –Σpi ln pi, wherepi = the observed proportion of a particularspecies (Solow, 1993). A value near to zero wouldindicate that every species in the sample is thesame. A value near 4.6 would indicate that thenumber of individuals are evenly distributedbetween all the species. Values in the middleare ambiguous which is an obvious flaw of thisindex and, thus, care are taken when using thisindex.
b. Simpson Index (l) and Simpson’s DiversityIndex (D): Simpson’s diversity index (also knownas species diversity index) is often used toquantify the biodiversity of a habitat. It takesinto account the number of species present, aswell as the relative abundance of each species.The Simpson index represents the probabilitythat two randomly selected individuals in thehabitat will not belong to the same species. It iscomputed by using following equation: l = Σni (ni-1)/[N (N-1)], where ni = the number ofindividuals of species i, and N = Σni (Solow, 1993).The value of l ranges between 0 and 1. With thisindex, 0 represents infinite diversity and 1, nodiversity. That is, the bigger the value of l, thelower the diversity. This is neither intuitive norlogical, so to get over this problem, l is often
67
This article can be downloaded from http://www.iajlb.com/currentissue.php
Indo-Am. J. of LifeSc & Bt., 2014 Rajendra Singh and B B Singh, 2014
subtracted from 1 to give Simpson’s index ofdiversity D = 1 – l. The value of this index alsoranges between 0 and 1, but now, the greaterthe value, the greater the sample diversity. Thismakes more sense. In this case, the indexrepresents the probability that two individualsrandomly selected from a sample will belong todifferent species.
c. Margalef Richness Index (R): This indexprovides a measure of species richness that isroughly normalized for sample size withoutusing more complex rarefaction techniques. Itis calculated by using following equation : R = N-1/In (n), where N = total number of species in acommunity, and n = total number of individualsobserved. The Margalef’s index of speciesrichness minimizes the effect of sample sizebias (Odum, 1971) as N and R are simple andeasy to calculate, but sensitive to sample size(Magurran, 1988). This index has been usedwith success in spider related studies, e.g.,Norris (1999).
d. Pielou’s Evenness Index (E): Pielou’sevenness is a diversity index, a measure ofbiodiversity which quantifies how equal thecommunity is numerically. The evenness of acommunity can be represented by the Pielou’sevenness index: E = H/Hmax, where H is thenumber derived from the Shannon diversityindex and Hmax is the maximum value of H, equalto: Hmax = - S [1/S.ln S] = ln S, where S is thetotal number of species. Thus : E = H/ln S, E isembarrassed between 0 and 1. The higher valueof E refers to the less variation in communities
between the species.
e. Tukey’s Test: The mean differences caused
by the two variables (locations and days of
transplantation of crop) were tested by using
Tukey’s “Honestly Significantly Different” (HSD)test which is based on what is called the
“studentized range distribution”. To test all
pairwise comparisons among means using theTukey HSD, computed t for each pair of means
using the formula: ts = (Mi-Mj)/(MSE/nh)0.5 where
Mi - Mj is the difference between the ith and jth
means, MSE is the Mean Square Error, and nh
is the harmonic mean of the sample sizes ofgroups i and j.
RESULTS
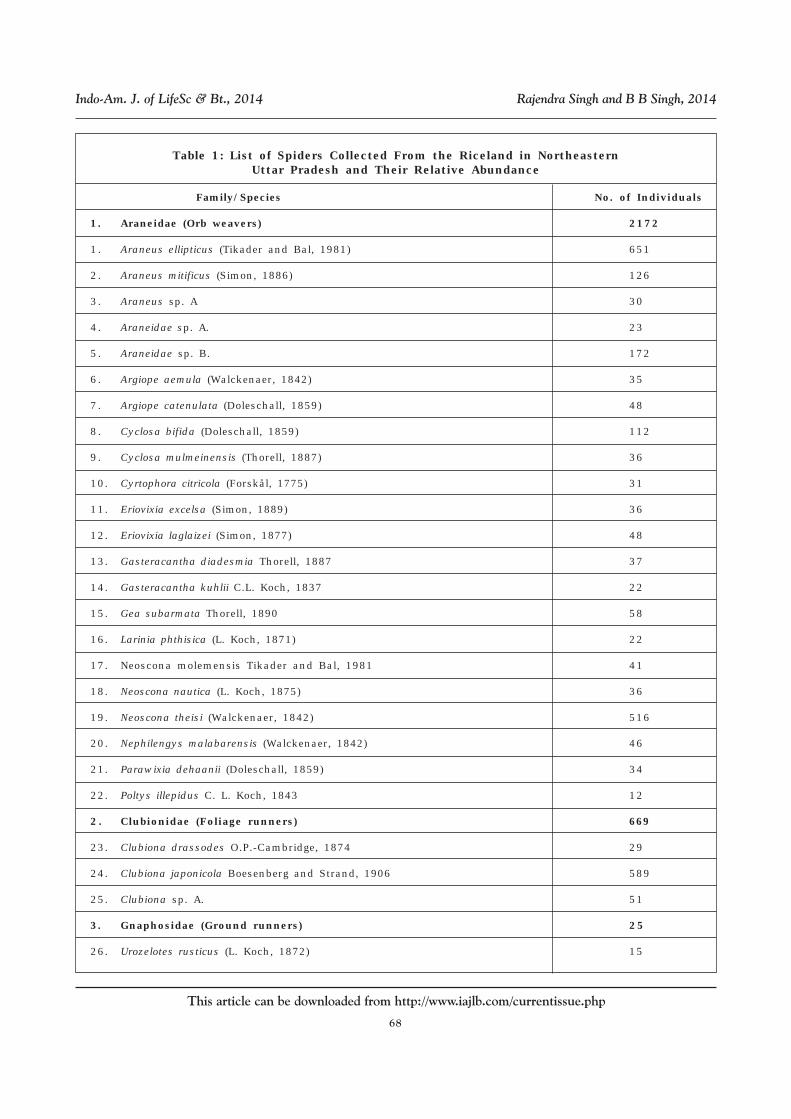
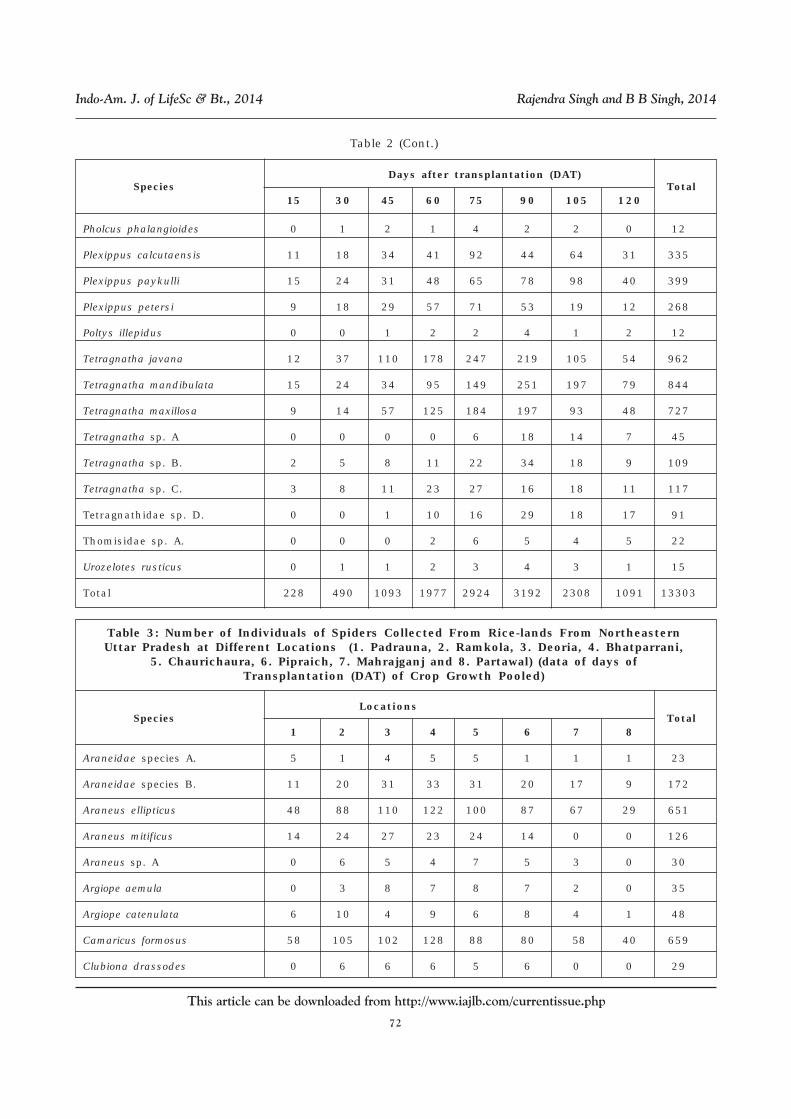
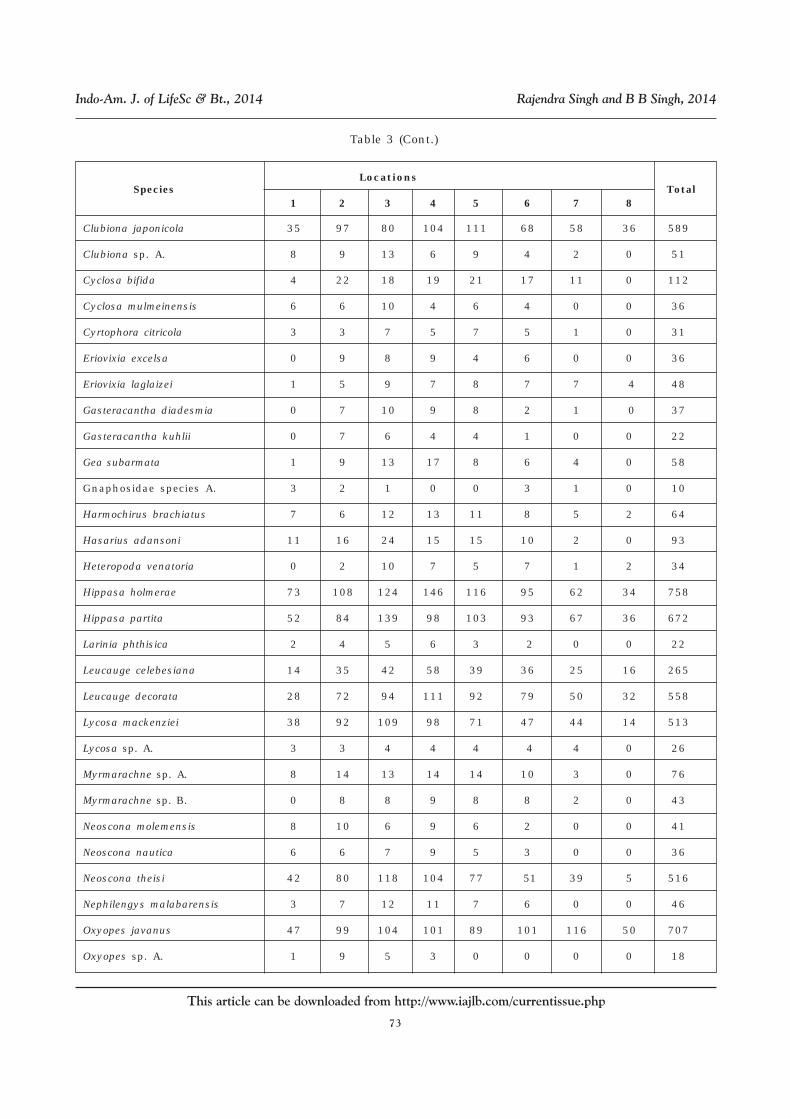
Species CompositionThe list of spiders collected from the rice fieldsin northeastern Uttar Pradesh and their relativeabundance is displayed in Table 1 while thedistributions of the spiders at different DAT (dataof locations were pooled) and at differentlocations (data of DAT were pooled) are shown inTables 2 and 3, respectively.
A total of 13,303 individuals belonging to 58species, 28 genera and 10 families were collectedduring the study period, 2008 (Table 1). Of the totalspecies, 9 species were most dominant (accountedfor 53.3% of the total population), 11 species weredominant (accounted for 33.6% of the totalpopulation), 35 species were agrophile (accountedfor 12.8% of the total population), and 3 specieswere rare (accounted for 0.3% of the totalpopulation). The most dominant species of overalldata were Tetragnatha javana (Thorell) (7.23%);Pardosa pseudoannulata (Bösenberg and Strand)(6.89%); Tetragnatha mandibulata Walckenaer(6.34%); Pardosa birmanica Simon (6.33%); Hippasaholmerae Thorell (5.70%); Tetragnatha maxillosaThorell (5.46%); Oxyopes javanus Thorell (5.31%);Hippasa partita (OP-Cambridge) (5.05%); andCamaricus formosus Thorell (4.95%). Next 11species, viz., Araneus ellipticus (Tikader and Bal)(4.89%), Clubiona japonicola Boesenberg and Strand(4.43%), Leucauge decorata (Blackwall) (4.19%),Neoscona theisi (Walckenaer) (3.88%), Lycosamackenziei Gravely (3.86%), Plexippus paykulli(Audouin) (3.00%), Plexippus calcutaensis (Tikader)(2.52%), Plexippus petersi (Karsch) (2.01%), Leucaugecelebesiana (Walckenaer) (1.99%), Pardosasumatrana (Thorell) (1.58%), and an unidentifiedaraineid species (1.29%) collectively constituteabout 87% of the individuals collected from rice
68
This article can be downloaded from http://www.iajlb.com/currentissue.php
Indo-Am. J. of LifeSc & Bt., 2014 Rajendra Singh and B B Singh, 2014
Table 1: List of Spiders Collected From the Riceland in NortheasternUttar Pradesh and Their Relative Abundance
Family/Species No. of Individuals
1. Araneidae (Orb weavers) 2172
1. Araneus ellipticus (Tikader and Bal, 1981) 651
2. Araneus mitificus (Simon, 1886) 126
3. Araneus sp. A 30
4. Araneidae sp. A. 23
5. Araneidae sp. B. 172
6. Argiope aemula (Walckenaer, 1842) 35
7. Argiope catenulata (Doleschall, 1859) 48
8. Cyclosa bifida (Doleschall, 1859) 112
9. Cyclosa mulmeinensis (Thorell, 1887) 36
10. Cyrtophora citricola (Forskål, 1775) 31
11. Eriovixia excelsa (Simon, 1889) 36
12. Eriovixia laglaizei (Simon, 1877) 48
13. Gasteracantha diadesmia Thorell, 1887 37
14. Gasteracantha kuhlii C.L. Koch, 1837 22
15. Gea subarmata Thorell, 1890 58
16. Larinia phthisica (L. Koch, 1871) 22
17. Neoscona molemensis Tikader and Bal, 1981 41
18. Neoscona nautica (L. Koch, 1875) 36
19. Neoscona theisi (Walckenaer, 1842) 516
20. Nephilengys malabarensis (Walckenaer, 1842) 46
21. Parawixia dehaanii (Doleschall, 1859) 34
22. Poltys illepidus C. L. Koch, 1843 12
2. Clubionidae (Foliage runners) 669
23. Clubiona drassodes O.P.-Cambridge, 1874 29
24. Clubiona japonicola Boesenberg and Strand, 1906 589
25. Clubiona sp. A. 51
3. Gnaphosidae (Ground runners) 25
26. Urozelotes rusticus (L. Koch, 1872) 15
69
This article can be downloaded from http://www.iajlb.com/currentissue.php
Indo-Am. J. of LifeSc & Bt., 2014 Rajendra Singh and B B Singh, 2014
Family/Species No. of Individuals
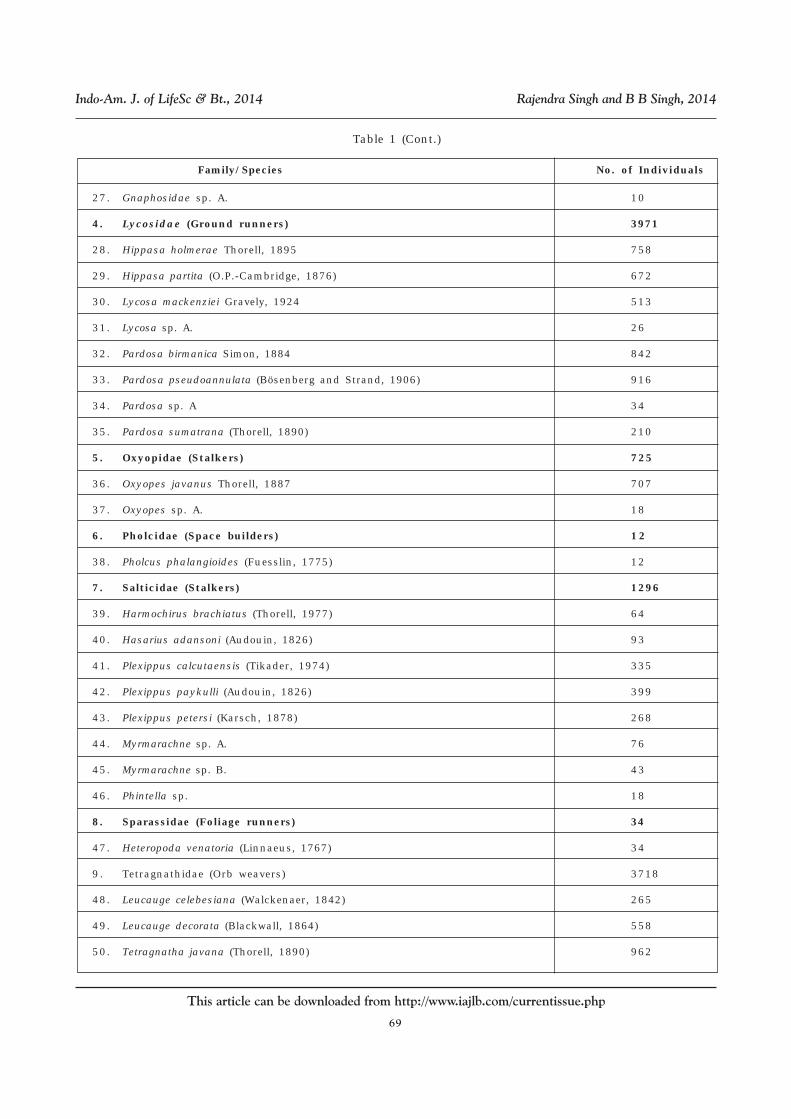
Table 1 (Cont.)
27. Gnaphosidae sp. A. 10
4. Lycosidae (Ground runners) 3971
28. Hippasa holmerae Thorell, 1895 758
29. Hippasa partita (O.P.-Cambridge, 1876) 672
30. Lycosa mackenziei Gravely, 1924 513
31. Lycosa sp. A. 26
32. Pardosa birmanica Simon, 1884 842
33. Pardosa pseudoannulata (Bösenberg and Strand, 1906) 916
34. Pardosa sp. A 34
35. Pardosa sumatrana (Thorell, 1890) 210
5. Oxyopidae (Stalkers) 725
36. Oxyopes javanus Thorell, 1887 707
37. Oxyopes sp. A. 18
6. Pholcidae (Space builders) 12
38. Pholcus phalangioides (Fuesslin, 1775) 12
7. Salticidae (Stalkers) 1296
39. Harmochirus brachiatus (Thorell, 1977) 64
40. Hasarius adansoni (Audouin, 1826) 93
41. Plexippus calcutaensis (Tikader, 1974) 335
42. Plexippus paykulli (Audouin, 1826) 399
43. Plexippus petersi (Karsch, 1878) 268
44. Myrmarachne sp. A. 76
45. Myrmarachne sp. B. 43
46. Phintella sp. 18
8. Sparassidae (Foliage runners) 34
47. Heteropoda venatoria (Linnaeus, 1767) 34
9. Tetragnathidae (Orb weavers) 3718
48. Leucauge celebesiana (Walckenaer, 1842) 265
49. Leucauge decorata (Blackwall, 1864) 558
50. Tetragnatha javana (Thorell, 1890) 962
70
This article can be downloaded from http://www.iajlb.com/currentissue.php
Indo-Am. J. of LifeSc & Bt., 2014 Rajendra Singh and B B Singh, 2014
Family/Species No. of Individuals
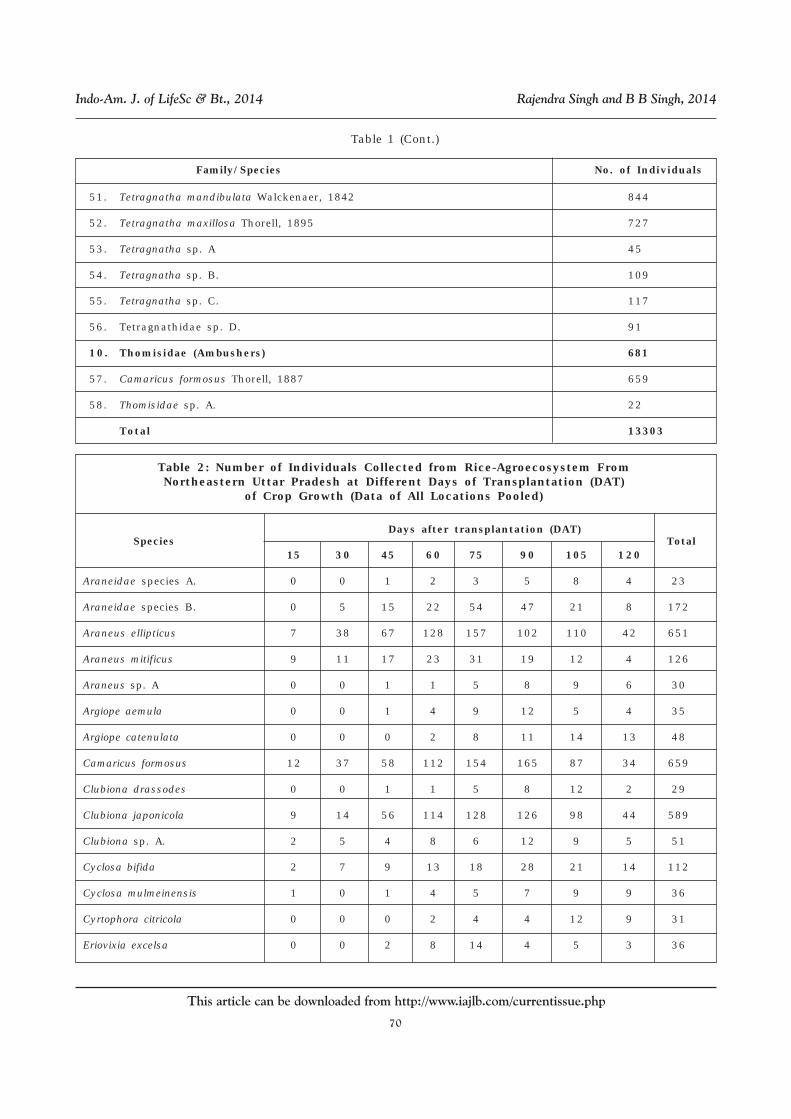
Table 1 (Cont.)
51. Tetragnatha mandibulata Walckenaer, 1842 844
52. Tetragnatha maxillosa Thorell, 1895 727
53. Tetragnatha sp. A 45
54. Tetragnatha sp. B. 109
55. Tetragnatha sp. C. 117
56. Tetragnathidae sp. D. 91
10. Thomisidae (Ambushers) 681
57. Camaricus formosus Thorell, 1887 659
58. Thomisidae sp. A. 22
Total 13303
Table 2: Number of Individuals Collected from Rice-Agroecosystem FromNortheastern Uttar Pradesh at Different Days of Transplantation (DAT)
of Crop Growth (Data of All Locations Pooled)
Species
Days after transplantation (DAT) Total
15 30 45 60 75 90 105 120
Araneidae species A. 0 0 1 2 3 5 8 4 23
Araneidae species B. 0 5 15 22 54 47 21 8 172
Araneus ellipticus 7 38 67 128 157 102 110 42 651
Araneus mitificus 9 11 17 23 31 19 12 4 126
Araneus sp. A 0 0 1 1 5 8 9 6 30
Argiope aemula 0 0 1 4 9 12 5 4 35
Argiope catenulata 0 0 0 2 8 11 14 13 48
Camaricus formosus 12 37 58 112 154 165 87 34 659
Clubiona drassodes 0 0 1 1 5 8 12 2 29
Clubiona japonicola 9 14 56 114 128 126 98 44 589
Clubiona sp. A. 2 5 4 8 6 12 9 5 51
Cyclosa bifida 2 7 9 13 18 28 21 14 112
Cyclosa mulmeinensis 1 0 1 4 5 7 9 9 36
Cyrtophora citricola 0 0 0 2 4 4 12 9 31
Eriovixia excelsa 0 0 2 8 14 4 5 3 36
71
This article can be downloaded from http://www.iajlb.com/currentissue.php
Indo-Am. J. of LifeSc & Bt., 2014 Rajendra Singh and B B Singh, 2014
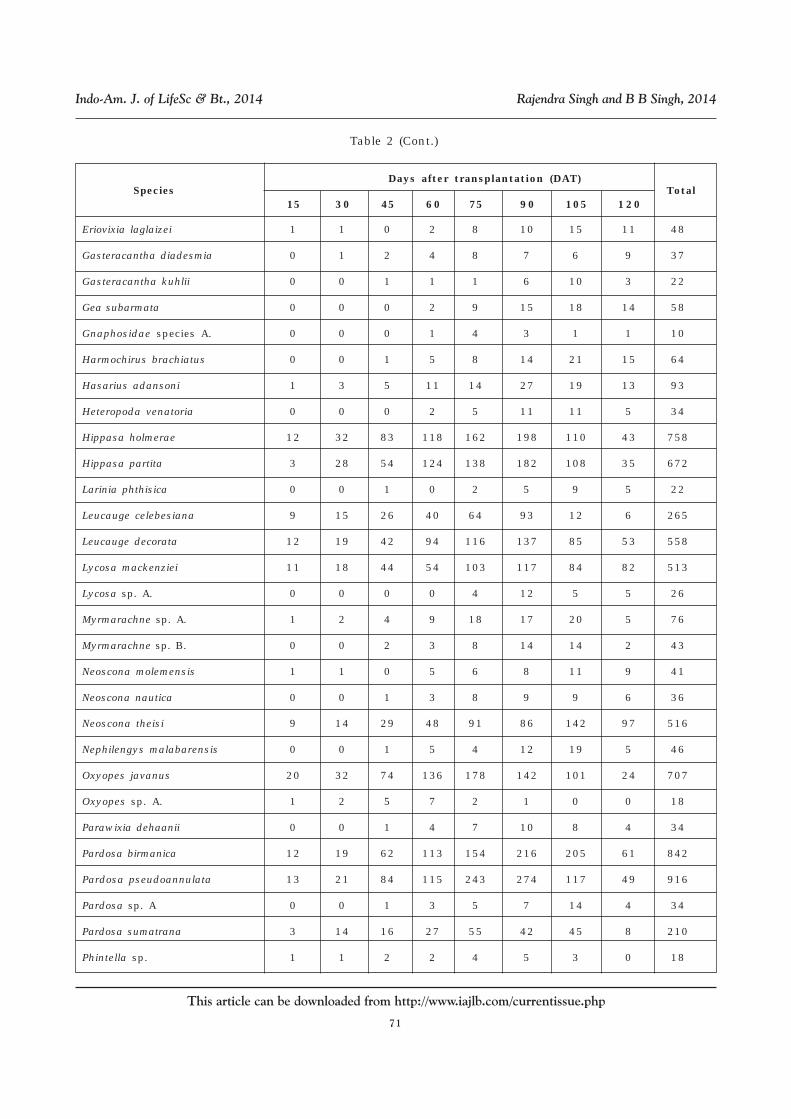
Table 2 (Cont.)
Species
Days after transplantation (DAT) Total
15 30 45 60 75 90 105 120
Eriovixia laglaizei 1 1 0 2 8 10 15 11 48
Gasteracantha diadesmia 0 1 2 4 8 7 6 9 37
Gasteracantha kuhlii 0 0 1 1 1 6 10 3 22
Gea subarmata 0 0 0 2 9 15 18 14 58
Gnaphosidae species A. 0 0 0 1 4 3 1 1 10
Harmochirus brachiatus 0 0 1 5 8 14 21 15 64
Hasarius adansoni 1 3 5 11 14 27 19 13 93
Heteropoda venatoria 0 0 0 2 5 11 11 5 34
Hippasa holmerae 12 32 83 118 162 198 110 43 758
Hippasa partita 3 28 54 124 138 182 108 35 672
Larinia phthisica 0 0 1 0 2 5 9 5 22
Leucauge celebesiana 9 15 26 40 64 93 12 6 265
Leucauge decorata 12 19 42 94 116 137 85 53 558
Lycosa mackenziei 11 18 44 54 103 117 84 82 513
Lycosa sp. A. 0 0 0 0 4 12 5 5 26
Myrmarachne sp. A. 1 2 4 9 18 17 20 5 76
Myrmarachne sp. B. 0 0 2 3 8 14 14 2 43
Neoscona molemensis 1 1 0 5 6 8 11 9 41
Neoscona nautica 0 0 1 3 8 9 9 6 36
Neoscona theisi 9 14 29 48 91 86 142 97 516
Nephilengys malabarensis 0 0 1 5 4 12 19 5 46
Oxyopes javanus 20 32 74 136 178 142 101 24 707
Oxyopes sp. A. 1 2 5 7 2 1 0 0 18
Parawixia dehaanii 0 0 1 4 7 10 8 4 34
Pardosa birmanica 12 19 62 113 154 216 205 61 842
Pardosa pseudoannulata 13 21 84 115 243 274 117 49 916
Pardosa sp. A 0 0 1 3 5 7 14 4 34
Pardosa sumatrana 3 14 16 27 55 42 45 8 210
Phintella sp. 1 1 2 2 4 5 3 0 18
72
This article can be downloaded from http://www.iajlb.com/currentissue.php
Indo-Am. J. of LifeSc & Bt., 2014 Rajendra Singh and B B Singh, 2014
Table 2 (Cont.)
Species
Days after transplantation (DAT) Total
15 30 45 60 75 90 105 120
Pholcus phalangioides 0 1 2 1 4 2 2 0 12
Plexippus calcutaensis 11 18 34 41 92 44 64 31 335
Plexippus paykulli 15 24 31 48 65 78 98 40 399
Plexippus petersi 9 18 29 57 71 53 19 12 268
Poltys illepidus 0 0 1 2 2 4 1 2 12
Tetragnatha javana 12 37 110 178 247 219 105 54 962
Tetragnatha mandibulata 15 24 34 95 149 251 197 79 844
Tetragnatha maxillosa 9 14 57 125 184 197 93 48 727
Tetragnatha sp. A 0 0 0 0 6 18 14 7 45
Tetragnatha sp. B. 2 5 8 11 22 34 18 9 109
Tetragnatha sp. C. 3 8 11 23 27 16 18 11 117
Tetragnathidae sp. D. 0 0 1 10 16 29 18 17 91
Thomisidae sp. A. 0 0 0 2 6 5 4 5 22
Urozelotes rusticus 0 1 1 2 3 4 3 1 15
Total 228 490 1093 1977 2924 3192 2308 1091 13303
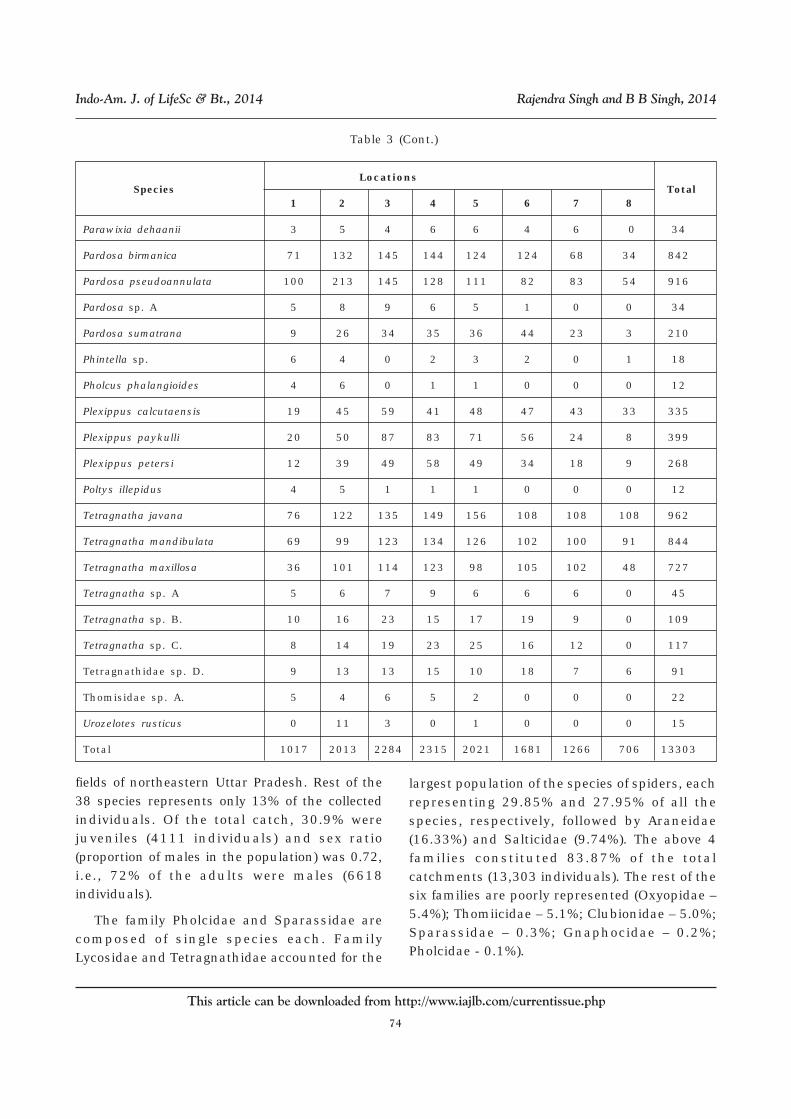
Table 3: Number of Individuals of Spiders Collected From Rice-lands From NortheasternUttar Pradesh at Different Locations (1. Padrauna, 2. Ramkola, 3. Deoria, 4. Bhatparrani,
5. Chaurichaura, 6. Pipraich, 7. Mahrajganj and 8. Partawal) (data of days ofTransplantation (DAT) of Crop Growth Pooled)
Species
Locations Total
1 2 3 4 5 6 7 8
Araneidae species A. 5 1 4 5 5 1 1 1 23
Araneidae species B. 11 20 31 33 31 20 17 9 172
Araneus ellipticus 48 88 110 122 100 87 67 29 651
Araneus mitificus 14 24 27 23 24 14 0 0 126
Araneus sp. A 0 6 5 4 7 5 3 0 30
Argiope aemula 0 3 8 7 8 7 2 0 35
Argiope catenulata 6 10 4 9 6 8 4 1 48
Camaricus formosus 58 105 102 128 88 80 58 40 659
Clubiona drassodes 0 6 6 6 5 6 0 0 29
73
This article can be downloaded from http://www.iajlb.com/currentissue.php
Indo-Am. J. of LifeSc & Bt., 2014 Rajendra Singh and B B Singh, 2014
Table 3 (Cont.)
Species
Locations Total
1 2 3 4 5 6 7 8
Clubiona japonicola 35 97 80 104 111 68 58 36 589
Clubiona sp. A. 8 9 13 6 9 4 2 0 51
Cyclosa bifida 4 22 18 19 21 17 11 0 112
Cyclosa mulmeinensis 6 6 10 4 6 4 0 0 36
Cyrtophora citricola 3 3 7 5 7 5 1 0 31
Eriovixia excelsa 0 9 8 9 4 6 0 0 36
Eriovixia laglaizei 1 5 9 7 8 7 7 4 48
Gasteracantha diadesmia 0 7 10 9 8 2 1 0 37
Gasteracantha kuhlii 0 7 6 4 4 1 0 0 22
Gea subarmata 1 9 13 17 8 6 4 0 58
Gnaphosidae species A. 3 2 1 0 0 3 1 0 10
Harmochirus brachiatus 7 6 12 13 11 8 5 2 64
Hasarius adansoni 11 16 24 15 15 10 2 0 93
Heteropoda venatoria 0 2 10 7 5 7 1 2 34
Hippasa holmerae 73 108 124 146 116 95 62 34 758
Hippasa partita 52 84 139 98 103 93 67 36 672
Larinia phthisica 2 4 5 6 3 2 0 0 22
Leucauge celebesiana 14 35 42 58 39 36 25 16 265
Leucauge decorata 28 72 94 111 92 79 50 32 558
Lycosa mackenziei 38 92 109 98 71 47 44 14 513
Lycosa sp. A. 3 3 4 4 4 4 4 0 26
Myrmarachne sp. A. 8 14 13 14 14 10 3 0 76
Myrmarachne sp. B. 0 8 8 9 8 8 2 0 43
Neoscona molemensis 8 10 6 9 6 2 0 0 41
Neoscona nautica 6 6 7 9 5 3 0 0 36
Neoscona theisi 42 80 118 104 77 51 39 5 516
Nephilengys malabarensis 3 7 12 11 7 6 0 0 46
Oxyopes javanus 47 99 104 101 89 101 116 50 707
Oxyopes sp. A. 1 9 5 3 0 0 0 0 18
74
This article can be downloaded from http://www.iajlb.com/currentissue.php
Indo-Am. J. of LifeSc & Bt., 2014 Rajendra Singh and B B Singh, 2014
Table 3 (Cont.)
Species
Locations Total
1 2 3 4 5 6 7 8
Parawixia dehaanii 3 5 4 6 6 4 6 0 34
Pardosa birmanica 71 132 145 144 124 124 68 34 842
Pardosa pseudoannulata 100 213 145 128 111 82 83 54 916
Pardosa sp. A 5 8 9 6 5 1 0 0 34
Pardosa sumatrana 9 26 34 35 36 44 23 3 210
Phintella sp. 6 4 0 2 3 2 0 1 18
Pholcus phalangioides 4 6 0 1 1 0 0 0 12
Plexippus calcutaensis 19 45 59 41 48 47 43 33 335
Plexippus paykulli 20 50 87 83 71 56 24 8 399
Plexippus petersi 12 39 49 58 49 34 18 9 268
Poltys illepidus 4 5 1 1 1 0 0 0 12
Tetragnatha javana 76 122 135 149 156 108 108 108 962
Tetragnatha mandibulata 69 99 123 134 126 102 100 91 844
Tetragnatha maxillosa 36 101 114 123 98 105 102 48 727
Tetragnatha sp. A 5 6 7 9 6 6 6 0 45
Tetragnatha sp. B. 10 16 23 15 17 19 9 0 109
Tetragnatha sp. C. 8 14 19 23 25 16 12 0 117
Tetragnathidae sp. D. 9 13 13 15 10 18 7 6 91
Thomisidae sp. A. 5 4 6 5 2 0 0 0 22
Urozelotes rusticus 0 11 3 0 1 0 0 0 15
Total 1017 2013 2284 2315 2021 1681 1266 706 13303
fields of northeastern Uttar Pradesh. Rest of the38 species represents only 13% of the collectedindividuals. Of the total catch, 30.9% werejuveniles (4111 individuals) and sex ratio(proportion of males in the population) was 0.72,i.e., 72% of the adults were males (6618individuals).
The family Pholcidae and Sparassidae arecomposed of single species each. FamilyLycosidae and Tetragnathidae accounted for the
largest population of the species of spiders, eachrepresenting 29.85% and 27.95% of all thespecies, respectively, followed by Araneidae(16.33%) and Salticidae (9.74%). The above 4families constituted 83.87% of the totalcatchments (13,303 individuals). The rest of thesix families are poorly represented (Oxyopidae –5.4%); Thomiicidae – 5.1%; Clubionidae – 5.0%;Sparassidae – 0.3%; Gnaphocidae – 0.2%;Pholcidae - 0.1%).
75
This article can be downloaded from http://www.iajlb.com/currentissue.php
Indo-Am. J. of LifeSc & Bt., 2014 Rajendra Singh and B B Singh, 2014
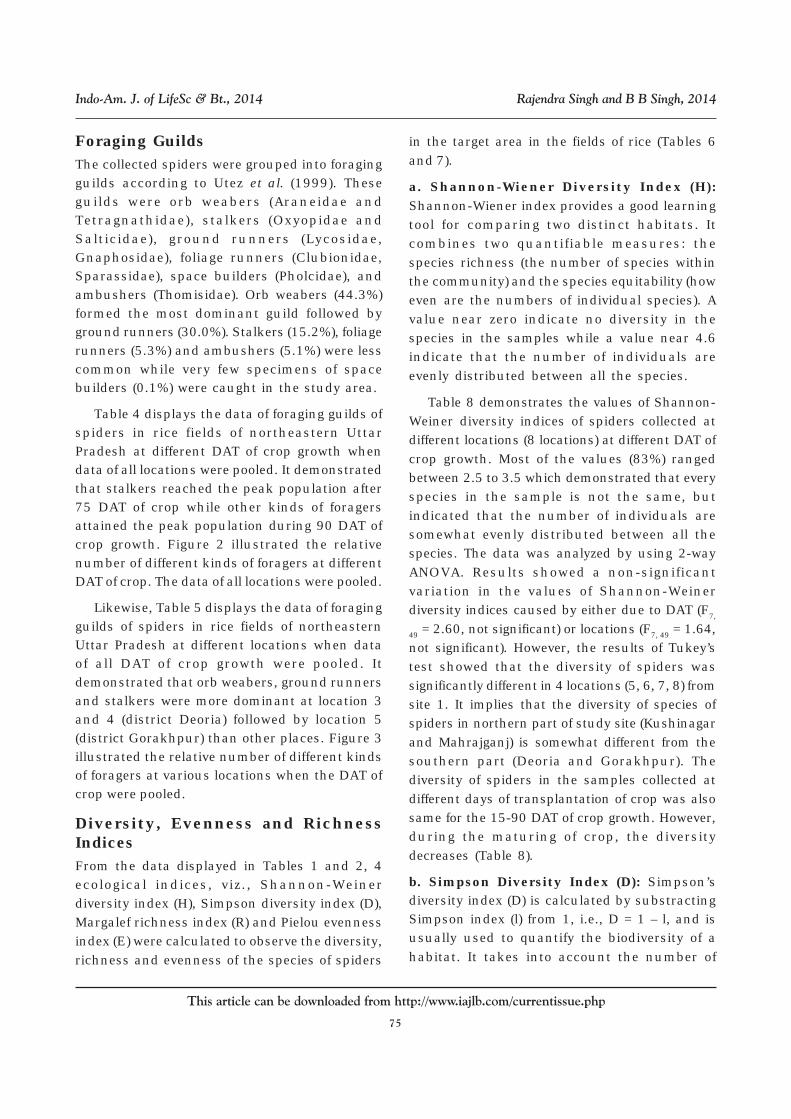
Foraging GuildsThe collected spiders were grouped into foragingguilds according to Utez et al. (1999). Theseguilds were orb weabers (Araneidae andTetragnathidae), stalkers (Oxyopidae andSalticidae), ground runners (Lycosidae,Gnaphosidae), foliage runners (Clubionidae,Sparassidae), space builders (Pholcidae), andambushers (Thomisidae). Orb weabers (44.3%)formed the most dominant guild followed byground runners (30.0%). Stalkers (15.2%), foliagerunners (5.3%) and ambushers (5.1%) were lesscommon while very few specimens of spacebuilders (0.1%) were caught in the study area.
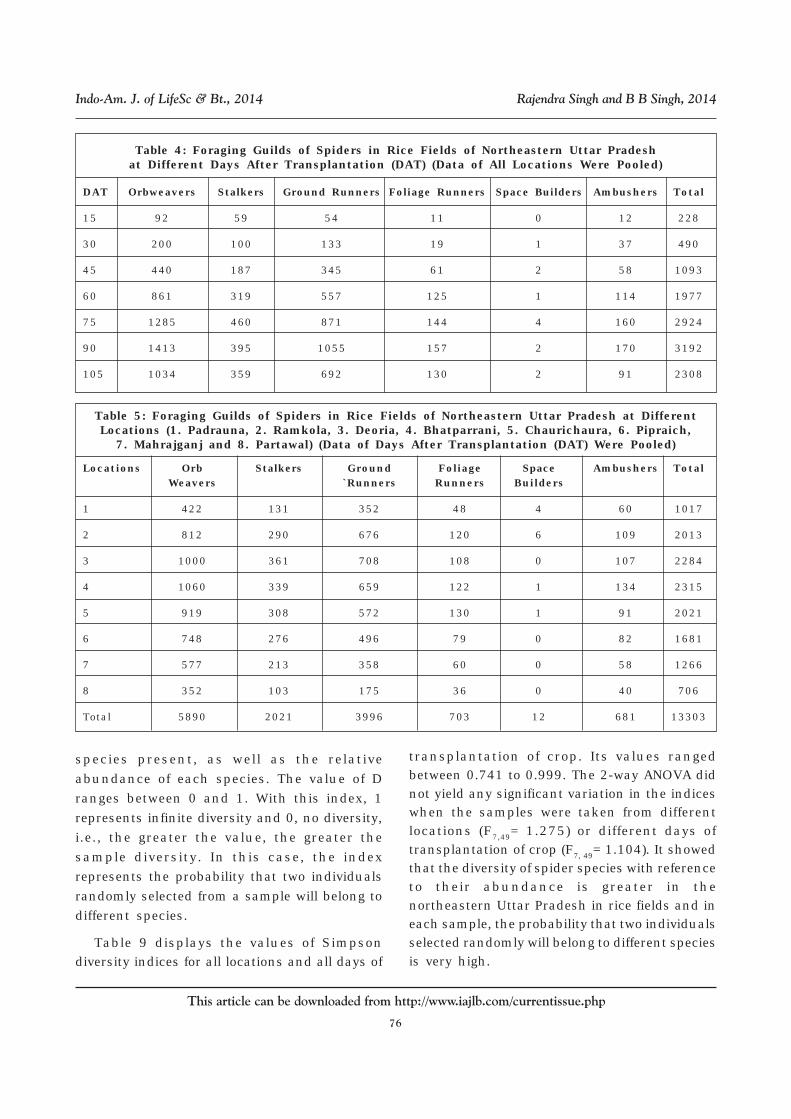
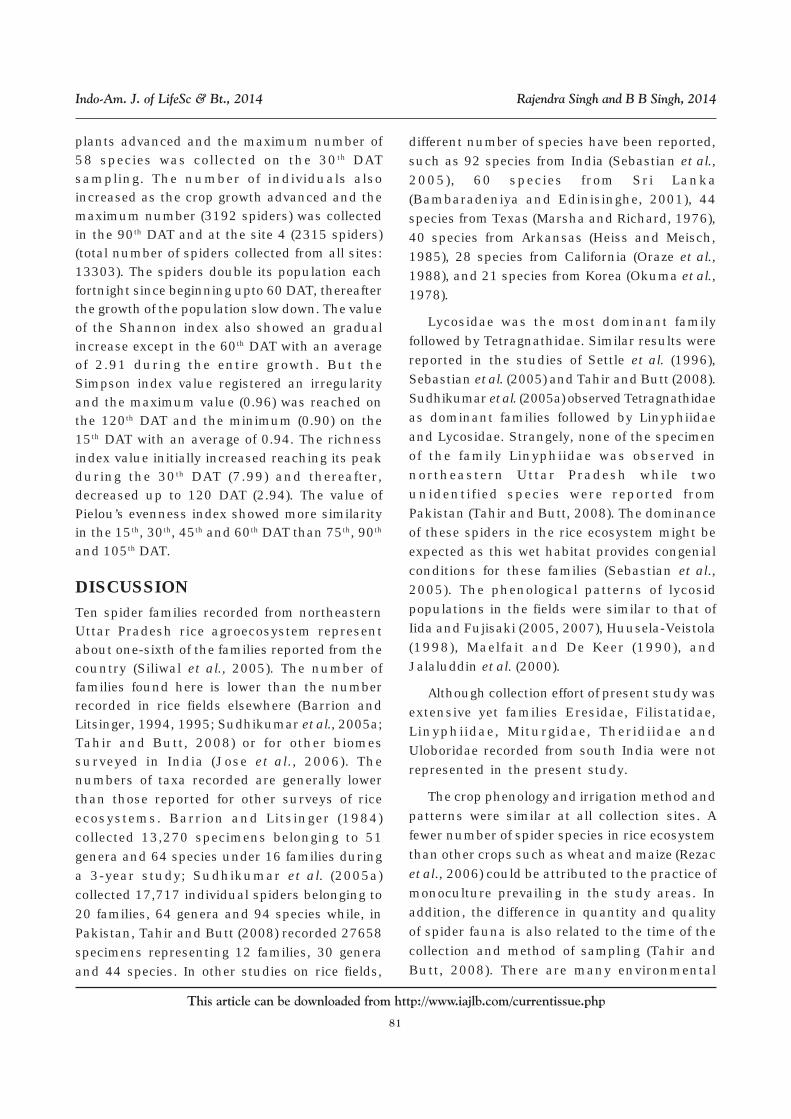
Table 4 displays the data of foraging guilds ofspiders in rice fields of northeastern UttarPradesh at different DAT of crop growth whendata of all locations were pooled. It demonstratedthat stalkers reached the peak population after75 DAT of crop while other kinds of foragersattained the peak population during 90 DAT ofcrop growth. Figure 2 illustrated the relativenumber of different kinds of foragers at differentDAT of crop. The data of all locations were pooled.
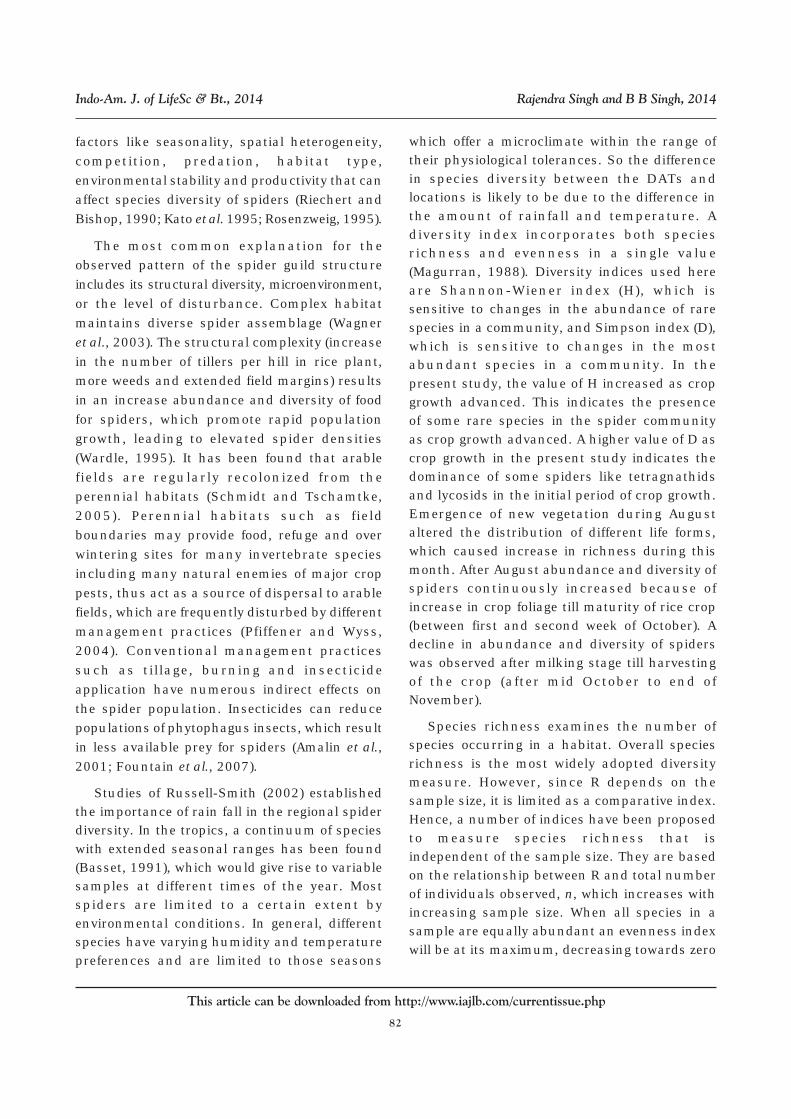
Likewise, Table 5 displays the data of foragingguilds of spiders in rice fields of northeasternUttar Pradesh at different locations when dataof all DAT of crop growth were pooled. Itdemonstrated that orb weabers, ground runnersand stalkers were more dominant at location 3and 4 (district Deoria) followed by location 5(district Gorakhpur) than other places. Figure 3illustrated the relative number of different kindsof foragers at various locations when the DAT ofcrop were pooled.
Diversity, Evenness and RichnessIndicesFrom the data displayed in Tables 1 and 2, 4ecological indices, viz., Shannon-Weinerdiversity index (H), Simpson diversity index (D),Margalef richness index (R) and Pielou evennessindex (E) were calculated to observe the diversity,richness and evenness of the species of spiders
in the target area in the fields of rice (Tables 6and 7).
a. Shannon-Wiener Diversity Index (H):Shannon-Wiener index provides a good learningtool for comparing two distinct habitats. Itcombines two quantifiable measures: thespecies richness (the number of species withinthe community) and the species equitability (howeven are the numbers of individual species). Avalue near zero indicate no diversity in thespecies in the samples while a value near 4.6indicate that the number of individuals areevenly distributed between all the species.
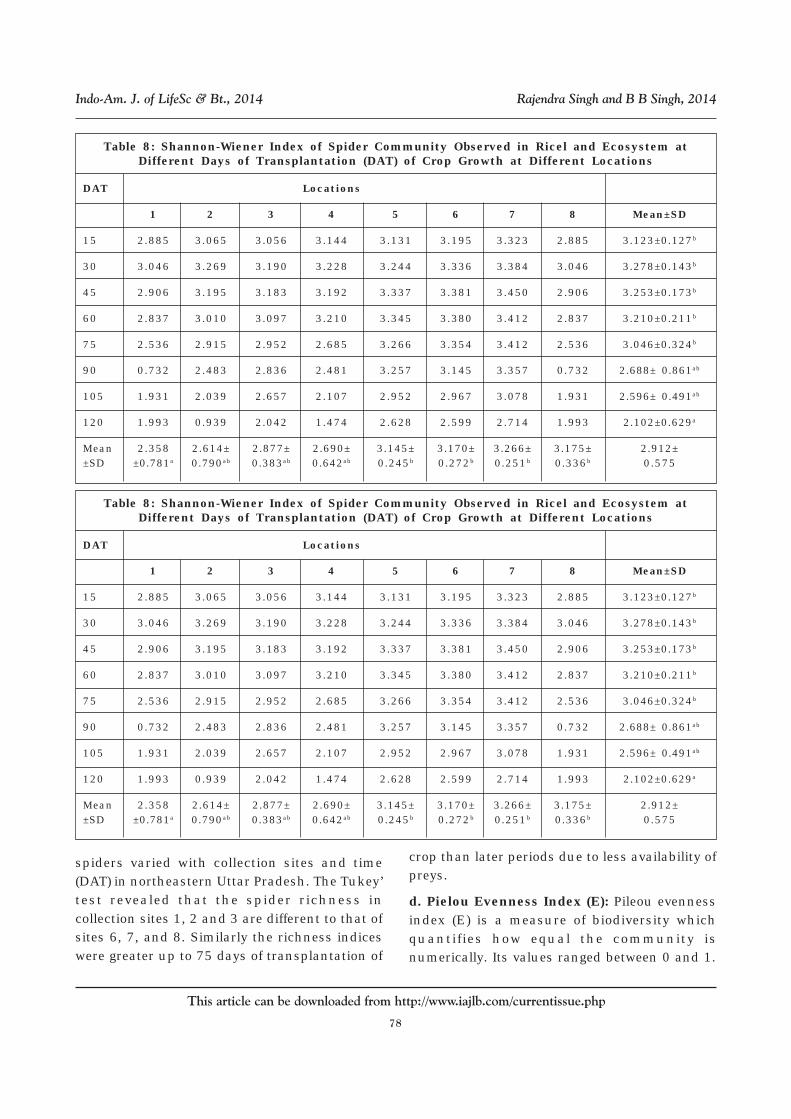
Table 8 demonstrates the values of Shannon-Weiner diversity indices of spiders collected atdifferent locations (8 locations) at different DAT ofcrop growth. Most of the values (83%) rangedbetween 2.5 to 3.5 which demonstrated that everyspecies in the sample is not the same, butindicated that the number of individuals aresomewhat evenly distributed between all thespecies. The data was analyzed by using 2-wayANOVA. Results showed a non-significantvariation in the values of Shannon-Weinerdiversity indices caused by either due to DAT (F7,
49 = 2.60, not significant) or locations (F7, 49 = 1.64,not significant). However, the results of Tukey’stest showed that the diversity of spiders wassignificantly different in 4 locations (5, 6, 7, 8) fromsite 1. It implies that the diversity of species ofspiders in northern part of study site (Kushinagarand Mahrajganj) is somewhat different from thesouthern part (Deoria and Gorakhpur). Thediversity of spiders in the samples collected atdifferent days of transplantation of crop was alsosame for the 15-90 DAT of crop growth. However,during the maturing of crop, the diversitydecreases (Table 8).
b. Simpson Diversity Index (D): Simpson’sdiversity index (D) is calculated by substractingSimpson index (l) from 1, i.e., D = 1 – l, and isusually used to quantify the biodiversity of ahabitat. It takes into account the number of
76
This article can be downloaded from http://www.iajlb.com/currentissue.php
Indo-Am. J. of LifeSc & Bt., 2014 Rajendra Singh and B B Singh, 2014
Table 4: Foraging Guilds of Spiders in Rice Fields of Northeastern Uttar Pradeshat Different Days After Transplantation (DAT) (Data of All Locations Were Pooled)
DAT Orbweavers Stalkers Ground Runners Foliage Runners Space Builders Ambushers Total
15 92 59 54 11 0 12 228
30 200 100 133 19 1 37 490
45 440 187 345 61 2 58 1093
60 861 319 557 125 1 114 1977
75 1285 460 871 144 4 160 2924
90 1413 395 1055 157 2 170 3192
105 1034 359 692 130 2 91 2308
Table 5: Foraging Guilds of Spiders in Rice Fields of Northeastern Uttar Pradesh at DifferentLocations (1. Padrauna, 2. Ramkola, 3. Deoria, 4. Bhatparrani, 5. Chaurichaura, 6. Pipraich,
7. Mahrajganj and 8. Partawal) (Data of Days After Transplantation (DAT) Were Pooled)
Locations Orb Stalkers Ground Foliage Space Ambushers TotalWeavers `Runners Runners Builders
1 422 131 352 48 4 60 1017
2 812 290 676 120 6 109 2013
3 1000 361 708 108 0 107 2284
4 1060 339 659 122 1 134 2315
5 919 308 572 130 1 91 2021
6 748 276 496 79 0 82 1681
7 577 213 358 60 0 58 1266
8 352 103 175 36 0 40 706
Total 5890 2021 3996 703 12 681 13303
species present, as well as the relative
abundance of each species. The value of D
ranges between 0 and 1. With this index, 1
represents infinite diversity and 0, no diversity,
i.e., the greater the value, the greater the
sample diversity. In this case, the index
represents the probability that two individuals
randomly selected from a sample will belong to
different species.
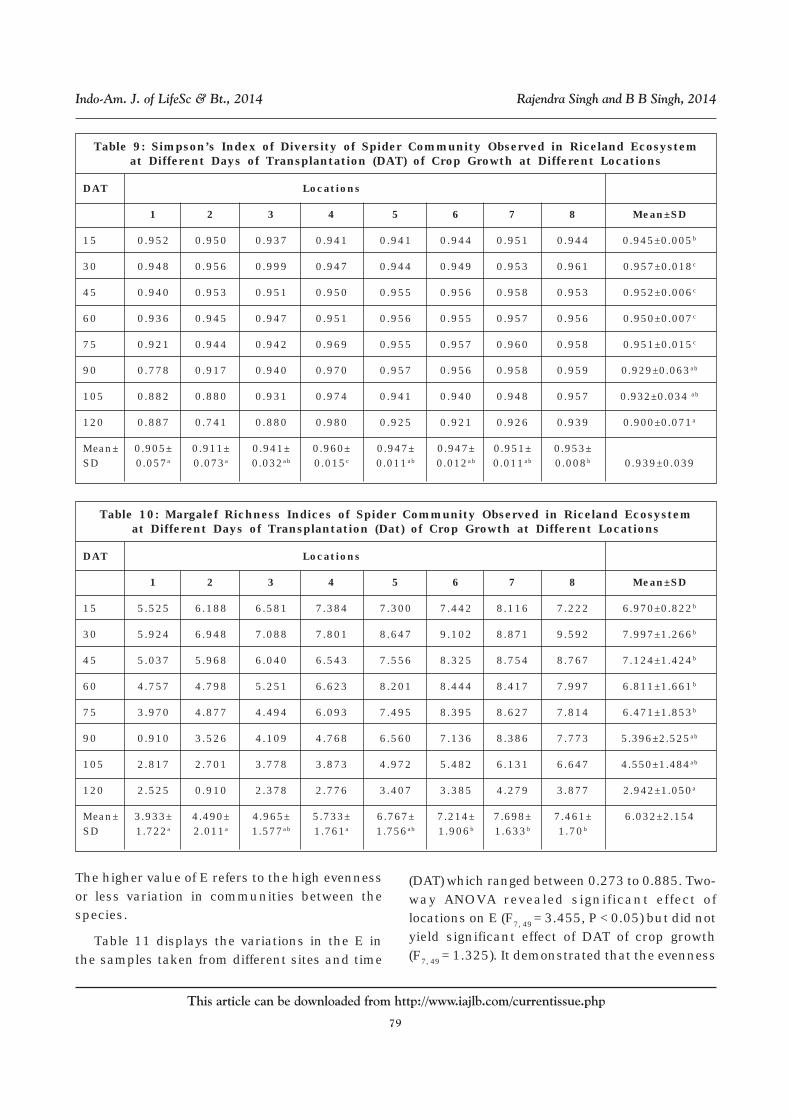
Table 9 displays the values of Simpsondiversity indices for all locations and all days of
transplantation of crop. Its values rangedbetween 0.741 to 0.999. The 2-way ANOVA didnot yield any significant variation in the indiceswhen the samples were taken from differentlocations (F7,49= 1.275) or different days oftransplantation of crop (F7, 49= 1.104). It showedthat the diversity of spider species with referenceto their abundance is greater in thenortheastern Uttar Pradesh in rice fields and ineach sample, the probability that two individualsselected randomly will belong to different speciesis very high.
77
This article can be downloaded from http://www.iajlb.com/currentissue.php
Indo-Am. J. of LifeSc & Bt., 2014 Rajendra Singh and B B Singh, 2014
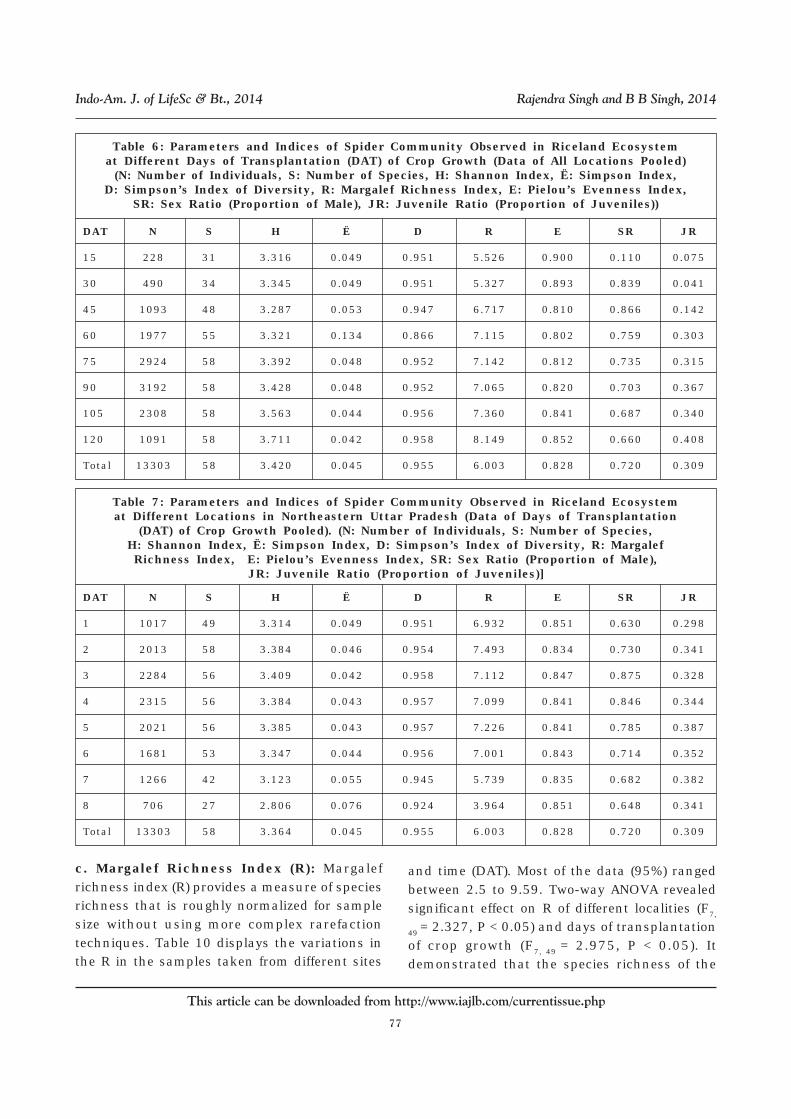
Table 6: Parameters and Indices of Spider Community Observed in Riceland Ecosystemat Different Days of Transplantation (DAT) of Crop Growth (Data of All Locations Pooled)
(N: Number of Individuals, S: Number of Species, H: Shannon Index, Ë: Simpson Index,D: Simpson’s Index of Diversity, R: Margalef Richness Index, E: Pielou’s Evenness Index,
SR: Sex Ratio (Proportion of Male), JR: Juvenile Ratio (Proportion of Juveniles))
DAT N S H Ë D R E SR JR
15 228 31 3.316 0.049 0.951 5.526 0.900 0.110 0.075
30 490 34 3.345 0.049 0.951 5.327 0.893 0.839 0.041
45 1093 48 3.287 0.053 0.947 6.717 0.810 0.866 0.142
60 1977 55 3.321 0.134 0.866 7.115 0.802 0.759 0.303
75 2924 58 3.392 0.048 0.952 7.142 0.812 0.735 0.315
90 3192 58 3.428 0.048 0.952 7.065 0.820 0.703 0.367
105 2308 58 3.563 0.044 0.956 7.360 0.841 0.687 0.340
120 1091 58 3.711 0.042 0.958 8.149 0.852 0.660 0.408
Total 13303 58 3.420 0.045 0.955 6.003 0.828 0.720 0.309
Table 7: Parameters and Indices of Spider Community Observed in Riceland Ecosystemat Different Locations in Northeastern Uttar Pradesh (Data of Days of Transplantation
(DAT) of Crop Growth Pooled). (N: Number of Individuals, S: Number of Species,H: Shannon Index, Ë: Simpson Index, D: Simpson’s Index of Diversity, R: MargalefRichness Index, E: Pielou’s Evenness Index, SR: Sex Ratio (Proportion of Male),
JR: Juvenile Ratio (Proportion of Juveniles)]
DAT N S H Ë D R E SR JR
1 1017 49 3.314 0.049 0.951 6.932 0.851 0.630 0.298
2 2013 58 3.384 0.046 0.954 7.493 0.834 0.730 0.341
3 2284 56 3.409 0.042 0.958 7.112 0.847 0.875 0.328
4 2315 56 3.384 0.043 0.957 7.099 0.841 0.846 0.344
5 2021 56 3.385 0.043 0.957 7.226 0.841 0.785 0.387
6 1681 53 3.347 0.044 0.956 7.001 0.843 0.714 0.352
7 1266 42 3.123 0.055 0.945 5.739 0.835 0.682 0.382
8 706 27 2.806 0.076 0.924 3.964 0.851 0.648 0.341
Total 13303 58 3.364 0.045 0.955 6.003 0.828 0.720 0.309
c. Margalef Richness Index (R): Margalefrichness index (R) provides a measure of speciesrichness that is roughly normalized for samplesize without using more complex rarefactiontechniques. Table 10 displays the variations inthe R in the samples taken from different sites
and time (DAT). Most of the data (95%) rangedbetween 2.5 to 9.59. Two-way ANOVA revealedsignificant effect on R of different localities (F7,
49 = 2.327, P < 0.05) and days of transplantationof crop growth (F7, 49 = 2.975, P < 0.05). Itdemonstrated that the species richness of the
78
This article can be downloaded from http://www.iajlb.com/currentissue.php
Indo-Am. J. of LifeSc & Bt., 2014 Rajendra Singh and B B Singh, 2014
Table 8: Shannon-Wiener Index of Spider Community Observed in Ricel and Ecosystem atDifferent Days of Transplantation (DAT) of Crop Growth at Different Locations
DAT Locations
1 2 3 4 5 6 7 8 Mean±SD
15 2.885 3.065 3.056 3.144 3.131 3.195 3.323 2.885 3.123±0.127b
30 3.046 3.269 3.190 3.228 3.244 3.336 3.384 3.046 3.278±0.143b
45 2.906 3.195 3.183 3.192 3.337 3.381 3.450 2.906 3.253±0.173b
60 2.837 3.010 3.097 3.210 3.345 3.380 3.412 2.837 3.210±0.211b
75 2.536 2.915 2.952 2.685 3.266 3.354 3.412 2.536 3.046±0.324b
90 0.732 2.483 2.836 2.481 3.257 3.145 3.357 0.732 2.688± 0.861ab
105 1.931 2.039 2.657 2.107 2.952 2.967 3.078 1.931 2.596± 0.491ab
120 1.993 0.939 2.042 1.474 2.628 2.599 2.714 1.993 2.102±0.629a
Mean 2.358 2.614± 2.877± 2.690± 3.145± 3.170± 3.266± 3.175± 2.912±±SD ±0.781a 0.790ab 0.383ab 0.642ab 0.245b 0.272b 0.251b 0.336b 0.575
spiders varied with collection sites and time(DAT) in northeastern Uttar Pradesh. The Tukey’test revealed that the spider richness incollection sites 1, 2 and 3 are different to that ofsites 6, 7, and 8. Similarly the richness indiceswere greater up to 75 days of transplantation of
crop than later periods due to less availability ofpreys.
d. Pielou Evenness Index (E): Pileou evennessindex (E) is a measure of biodiversity whichquantifies how equal the community isnumerically. Its values ranged between 0 and 1.
79
This article can be downloaded from http://www.iajlb.com/currentissue.php
Indo-Am. J. of LifeSc & Bt., 2014 Rajendra Singh and B B Singh, 2014
Table 9: Simpson’s Index of Diversity of Spider Community Observed in Riceland Ecosystemat Different Days of Transplantation (DAT) of Crop Growth at Different Locations
DAT Locations
1 2 3 4 5 6 7 8 Mean±SD
15 0.952 0.950 0.937 0.941 0.941 0.944 0.951 0.944 0.945±0.005b
30 0.948 0.956 0.999 0.947 0.944 0.949 0.953 0.961 0.957±0.018c
45 0.940 0.953 0.951 0.950 0.955 0.956 0.958 0.953 0.952±0.006c
60 0.936 0.945 0.947 0.951 0.956 0.955 0.957 0.956 0.950±0.007c
75 0.921 0.944 0.942 0.969 0.955 0.957 0.960 0.958 0.951±0.015c
90 0.778 0.917 0.940 0.970 0.957 0.956 0.958 0.959 0.929±0.063ab
105 0.882 0.880 0.931 0.974 0.941 0.940 0.948 0.957 0.932±0.034 ab
120 0.887 0.741 0.880 0.980 0.925 0.921 0.926 0.939 0.900±0.071a
Mean± 0.905± 0.911± 0.941± 0.960± 0.947± 0.947± 0.951± 0.953±SD 0.057a 0.073a 0.032ab 0.015c 0.011ab 0.012ab 0.011ab 0.008b 0.939±0.039
Table 10: Margalef Richness Indices of Spider Community Observed in Riceland Ecosystemat Different Days of Transplantation (Dat) of Crop Growth at Different Locations
DAT Locations
1 2 3 4 5 6 7 8 Mean±SD
15 5.525 6.188 6.581 7.384 7.300 7.442 8.116 7.222 6.970±0.822b
30 5.924 6.948 7.088 7.801 8.647 9.102 8.871 9.592 7.997±1.266b
45 5.037 5.968 6.040 6.543 7.556 8.325 8.754 8.767 7.124±1.424b
60 4.757 4.798 5.251 6.623 8.201 8.444 8.417 7.997 6.811±1.661b
75 3.970 4.877 4.494 6.093 7.495 8.395 8.627 7.814 6.471±1.853b
90 0.910 3.526 4.109 4.768 6.560 7.136 8.386 7.773 5.396±2.525ab
105 2.817 2.701 3.778 3.873 4.972 5.482 6.131 6.647 4.550±1.484ab
120 2.525 0.910 2.378 2.776 3.407 3.385 4.279 3.877 2.942±1.050a
Mean± 3.933± 4.490± 4.965± 5.733± 6.767± 7.214± 7.698± 7.461± 6.032±2.154SD 1.722a 2.011a 1.577ab 1.761a 1.756ab 1.906b 1.633b 1.70b
The higher value of E refers to the high evennessor less variation in communities between thespecies.
Table 11 displays the variations in the E inthe samples taken from different sites and time
(DAT) which ranged between 0.273 to 0.885. Two-way ANOVA revealed significant effect oflocations on E (F7, 49 = 3.455, P < 0.05) but did notyield significant effect of DAT of crop growth(F7, 49 = 1.325). It demonstrated that the evenness
80
This article can be downloaded from http://www.iajlb.com/currentissue.php
Indo-Am. J. of LifeSc & Bt., 2014 Rajendra Singh and B B Singh, 2014
Table 11: Pielou Evenness Indices of Spider Community Observed in Riceland Ecosystemat Different Days of Transplantation (Dat) of Crop Growth at Different Locations
DAT Locations
1 2 3 4 5 6 7 8 Mean±SD
15 0.885 0.862 0.694 0.645 0.586 0.580 0.627 0.718 0.700±0.118b
30 0.820 0.757 0.611 0.560 0.529 0.542 0.589 0.705 0.639±0.108ab
45 0.732 0.681 0.601 0.550 0.536 0.541 0.581 0.643 0.608±0.071ab
60 0.750 0.657 0.581 0.545 0.538 0.538 0.574 0.644 0.603±0.075ab
75 0.719 0.646 0.577 0.455 0.532 0.542 0.589 0.620 0.585±0.080a
90 0.667 0.625 0.583 0.422 0.548 0.522 0.587 0.640 0.574±0.078a
105 0.777 0.612 0.590 0.371 0.524 0.508 0.555 0.651 0.574±0.118a
120 0.719 0.427 0.540 0.273 0.527 0.489 0.528 0.589 0.511±0.128a
Mean± 0.759± 0.658± 0.597± 0.477± 0.540± 0.533± 0.579± 0.651± 0.599±0.107SD 0.068c 0.125b 0.044b 0.120a 0.020a 0.027a 0.029b 0.042b
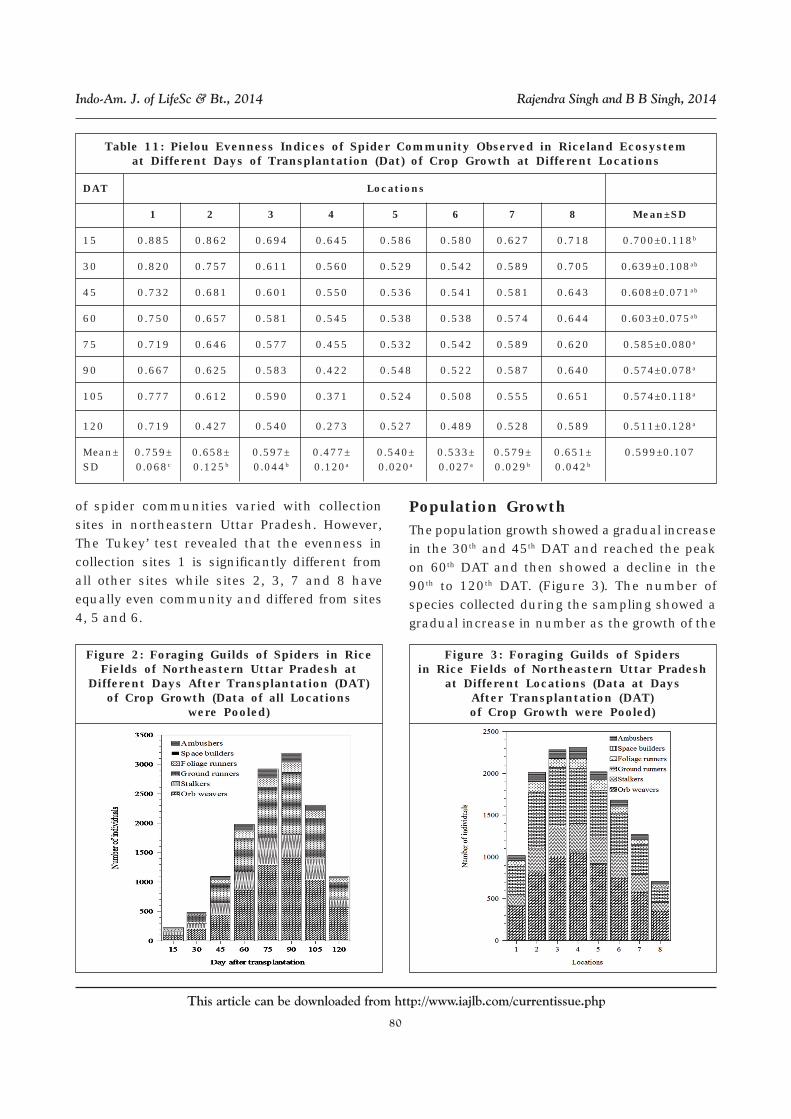
of spider communities varied with collectionsites in northeastern Uttar Pradesh. However,The Tukey’ test revealed that the evenness incollection sites 1 is significantly different fromall other sites while sites 2, 3, 7 and 8 haveequally even community and differed from sites4, 5 and 6.
Population GrowthThe population growth showed a gradual increasein the 30th and 45th DAT and reached the peakon 60th DAT and then showed a decline in the90th to 120th DAT. (Figure 3). The number ofspecies collected during the sampling showed agradual increase in number as the growth of the
Figure 2: Foraging Guilds of Spiders in RiceFields of Northeastern Uttar Pradesh at
Different Days After Transplantation (DAT)of Crop Growth (Data of all Locations
were Pooled)
Figure 3: Foraging Guilds of Spidersin Rice Fields of Northeastern Uttar Pradesh
at Different Locations (Data at DaysAfter Transplantation (DAT)of Crop Growth were Pooled)
81
This article can be downloaded from http://www.iajlb.com/currentissue.php
Indo-Am. J. of LifeSc & Bt., 2014 Rajendra Singh and B B Singh, 2014
plants advanced and the maximum number of58 species was collected on the 30th DATsampling. The number of individuals alsoincreased as the crop growth advanced and themaximum number (3192 spiders) was collectedin the 90th DAT and at the site 4 (2315 spiders)(total number of spiders collected from all sites:13303). The spiders double its population eachfortnight since beginning upto 60 DAT, thereafterthe growth of the population slow down. The valueof the Shannon index also showed an gradualincrease except in the 60th DAT with an averageof 2.91 during the entire growth. But theSimpson index value registered an irregularityand the maximum value (0.96) was reached onthe 120th DAT and the minimum (0.90) on the15th DAT with an average of 0.94. The richnessindex value initially increased reaching its peakduring the 30th DAT (7.99) and thereafter,decreased up to 120 DAT (2.94). The value ofPielou’s evenness index showed more similarityin the 15th, 30th, 45th and 60th DAT than 75th, 90th
and 105th DAT.
DISCUSSIONTen spider families recorded from northeasternUttar Pradesh rice agroecosystem representabout one-sixth of the families reported from thecountry (Siliwal et al., 2005). The number offamilies found here is lower than the numberrecorded in rice fields elsewhere (Barrion andLitsinger, 1994, 1995; Sudhikumar et al., 2005a;Tahir and Butt, 2008) or for other biomessurveyed in India (Jose et al., 2006). Thenumbers of taxa recorded are generally lowerthan those reported for other surveys of riceecosystems. Barrion and Litsinger (1984)collected 13,270 specimens belonging to 51genera and 64 species under 16 families duringa 3-year study; Sudhikumar et al. (2005a)collected 17,717 individual spiders belonging to20 families, 64 genera and 94 species while, inPakistan, Tahir and Butt (2008) recorded 27658specimens representing 12 families, 30 generaand 44 species. In other studies on rice fields,
different number of species have been reported,such as 92 species from India (Sebastian et al.,2005), 60 species from Sri Lanka(Bambaradeniya and Edinisinghe, 2001), 44species from Texas (Marsha and Richard, 1976),40 species from Arkansas (Heiss and Meisch,1985), 28 species from California (Oraze et al.,1988), and 21 species from Korea (Okuma et al.,1978).
Lycosidae was the most dominant familyfollowed by Tetragnathidae. Similar results werereported in the studies of Settle et al. (1996),Sebastian et al. (2005) and Tahir and Butt (2008).Sudhikumar et al. (2005a) observed Tetragnathidaeas dominant families followed by Linyphiidaeand Lycosidae. Strangely, none of the specimenof the family Linyphiidae was observed innortheastern Uttar Pradesh while twounidentified species were reported fromPakistan (Tahir and Butt, 2008). The dominanceof these spiders in the rice ecosystem might beexpected as this wet habitat provides congenialconditions for these families (Sebastian et al.,2005). The phenological patterns of lycosidpopulations in the fields were similar to that ofIida and Fujisaki (2005, 2007), Huusela-Veistola(1998), Maelfait and De Keer (1990), andJalaluddin et al. (2000).
Although collection effort of present study wasextensive yet families Eresidae, Filistatidae,Linyphiidae, Miturgidae, Theridiidae andUloboridae recorded from south India were notrepresented in the present study.
The crop phenology and irrigation method and
patterns were similar at all collection sites. A
fewer number of spider species in rice ecosystem
than other crops such as wheat and maize (Rezac
et al., 2006) could be attributed to the practice of
monoculture prevailing in the study areas. Inaddition, the difference in quantity and quality
of spider fauna is also related to the time of the
collection and method of sampling (Tahir and
Butt, 2008). There are many environmental
82
This article can be downloaded from http://www.iajlb.com/currentissue.php
Indo-Am. J. of LifeSc & Bt., 2014 Rajendra Singh and B B Singh, 2014
factors like seasonality, spatial heterogeneity,
competition, predation, habitat type,
environmental stability and productivity that canaffect species diversity of spiders (Riechert and
Bishop, 1990; Kato et al. 1995; Rosenzweig, 1995).
The most common explanation for theobserved pattern of the spider guild structure
includes its structural diversity, microenvironment,
or the level of disturbance. Complex habitat
maintains diverse spider assemblage (Wagner
et al., 2003). The structural complexity (increase
in the number of tillers per hill in rice plant,more weeds and extended field margins) results
in an increase abundance and diversity of food
for spiders, which promote rapid population
growth, leading to elevated spider densities
(Wardle, 1995). It has been found that arable
fields are regularly recolonized from theperennial habitats (Schmidt and Tschamtke,
2005). Perennial habitats such as field
boundaries may provide food, refuge and over
wintering sites for many invertebrate species
including many natural enemies of major crop
pests, thus act as a source of dispersal to arablefields, which are frequently disturbed by different
management practices (Pfiffener and Wyss,
2004). Conventional management practices
such as tillage, burning and insecticide
application have numerous indirect effects on
the spider population. Insecticides can reducepopulations of phytophagus insects, which result
in less available prey for spiders (Amalin et al.,
2001; Fountain et al., 2007).
Studies of Russell-Smith (2002) establishedthe importance of rain fall in the regional spiderdiversity. In the tropics, a continuum of specieswith extended seasonal ranges has been found(Basset, 1991), which would give rise to variablesamples at different times of the year. Mostspiders are limited to a certain extent byenvironmental conditions. In general, differentspecies have varying humidity and temperaturepreferences and are limited to those seasons
which offer a microclimate within the range oftheir physiological tolerances. So the differencein species diversity between the DATs andlocations is likely to be due to the difference inthe amount of rainfall and temperature. Adiversity index incorporates both speciesrichness and evenness in a single value(Magurran, 1988). Diversity indices used hereare Shannon-Wiener index (H), which issensitive to changes in the abundance of rarespecies in a community, and Simpson index (D),which is sensitive to changes in the mostabundant species in a community. In thepresent study, the value of H increased as cropgrowth advanced. This indicates the presenceof some rare species in the spider communityas crop growth advanced. A higher value of D ascrop growth in the present study indicates thedominance of some spiders like tetragnathidsand lycosids in the initial period of crop growth.Emergence of new vegetation during Augustaltered the distribution of different life forms,which caused increase in richness during thismonth. After August abundance and diversity ofspiders continuously increased because ofincrease in crop foliage till maturity of rice crop(between first and second week of October). Adecline in abundance and diversity of spiderswas observed after milking stage till harvestingof the crop (after mid October to end ofNovember).
Species richness examines the number ofspecies occurring in a habitat. Overall speciesrichness is the most widely adopted diversitymeasure. However, since R depends on thesample size, it is limited as a comparative index.Hence, a number of indices have been proposedto measure species richness that isindependent of the sample size. They are basedon the relationship between R and total numberof individuals observed, n, which increases withincreasing sample size. When all species in asample are equally abundant an evenness indexwill be at its maximum, decreasing towards zero
83
This article can be downloaded from http://www.iajlb.com/currentissue.php
Indo-Am. J. of LifeSc & Bt., 2014 Rajendra Singh and B B Singh, 2014
as the relative abundance of the speciesdiverges away from evenness. Probably, the mostcommon evenness index used by ecologists isE. An evenness index should be independent ofthe number of species in the sample. It hasshown that the addition of a rare species to asample that contains only a few species greatlychange the value of E. Additionally, there aremany factors that determine the speciescomposition. This may be related to the changesin the vegetation structure of the habitat.Longback, Kajak (1965) found that relative spiderand prey densities were related to the structuraldiversity of the habitat, and Turnbull (1966)attributed similar relative predator and preydensities to environmental conditions operatingin both groups. According to Turnbull (1973),most webs have specific attachment and spacerequirements. Cherrett (1964) found that adultorb weavers in a grass land habitat needed avertical space of at least 25-30 cm2 for webplacements, a factor which strongly limited thosespiders to certain habitats. Other workers havealso found the availability of specific structuralfeatures to limit the habitats occupied by variousweb-builders (Duffey, 1962). Structurally complexcrops, providing a wider assortment of resources,would be predicted to support a more diversespider assemblage, thus increasing the chancesof the “best” match between spiders and insectpests. The results of this study also indicate theinfluence of vegetation structure on the diversityof resident spider community. The web buildingand plant wandering spiders rely on vegetationfor some part of their lives, either for findingfood, building retreats or for web building. Thestructure of the vegetation is, therefore,expected to influence the diversity of spidersfound in the habitat. Studies have demonstratedthat a correlation exists between the structuralcomplexity of habitat and species diversity (Uetz,1979; Andow, 1991). Uetz (1991) suggests thatstructurally more complex plants can support amore diverse spider community. Downie et al.
(1999) and New (1999) have demonstrated thatthe spiders are extremely sensitive to smallchanges in the habitat structure; includinghabitat complexity and microclimatecharacteristics. Thus the physical structure ofthe environments has an important influenceon the habitat preferences of spider speciesespecially web-building species (Hurd and Fagan,1992). Vegetation structure seems to influencethe spider composition on family level becausesimilar families cluster within a similar habitattype. The result also indicates that similarspecies are present at specific stage of cropgrowth. This provides valuable insights as to whycertain species may dominate at different timesof the season. Vegetation architecture plays amajor role in the species composition foundwithin a habitat (Greenstone, 1984; Scheidler,1990), and vegetation which is structurally morecomplex can sustain higher abundance anddiversity of spiders (Hatley and MacMahon,1980). The final stage of the crop results in ahabitat that is more complex and can supporthigher diversity. Surveys have demonstratedthat spiders respond numerically to the diversityand complexity of the vegetation (Rypstra, 1983;Halaj et al., 1998; Sudhikumar et al., 2005a, b).In addition, the difference in the seasonalabundance of spiders may be due to the variationin patterns of activity of individual spiders andthe phenology of total spider community (Coreyet al., 1998).
An increase in the spider populationaccording to the plant growth tends to depend onprey availability and, if the density of preybecomes higher, spiders are expected to
increase proportionally to some extent. The peakof population density of spiders coincides with
an increase of insect pests (Kiritani et al., 1972,
Kiritani, 1979). It has already been pointed out
by Kobayashi (1961) that the values of correlation
coefficients between the population density of
insect pests and that of spiders tend to increasefrom negative to positive form as crop growth
84
This article can be downloaded from http://www.iajlb.com/currentissue.php
Indo-Am. J. of LifeSc & Bt., 2014 Rajendra Singh and B B Singh, 2014
advanced. As no quantitative evaluation was
done on the insect pest density during this study,
further investigations should be carried out toreveal the influence of insect pests on the
resident spider community. The amount of preys
alone does not affect the density of spiders. What
can be cited as other important factors is the
number of surviving individuals after
hibernation and other repair works related toagriculture. The growth of weeds quickens the
time of draining water from paddy fields and this
is considered to promote migration of spiders
from dikes to paddy fields and dikes can act as
an over wintering place of pests and as a source
of spiders (van den Bosh and Telford ,1964). Thechanges noted in spider association with specific
crop stage at different sampling times were
related to the flowering state of the crop.
Although it is reasonable to expect a significant
influence of crop characteristics on structuring
the resident spider community, the importanceof adjacent habitats must also be considered
(Duelli et al., 1990). Neighboring habitats may
also influence the composition of crop spider
fauna indirectly by modifying the dispersal of
potential spider prey and predators in the patchy
agricultural landscapes (Polis et al., 1998). Thequality of the adjacent habitats influences the
spider composition of the focal habitat via
multitudes of direct and indirect channels. Since
no data were collected from the adjacent
habitats and bunds, more studies are needed to
reveal the influence of these habitats on theoccurrence of spiders in the rice field proper.
CONCLUSION• Spiders are potential predators of insects
feeding on rice and help in maintaining theirpopulation under check.
• Before this study, no work was carried outabout the species composition of spiders andtheir diversity in riceland ecosystem inNortheastern Uttar Pradesh.
• The survey conducted in four district ofGorakhpur Division, viz., Kushinagar,Maharajganj, Gorakhpur and Deoria revealedthe presence of 58 species under 28 generain 10 families. Out of this figure only 41species were identified up to species taxon.Rests were identified only up to generic orfamily level.
• The most dominant species were Tetragnathajavana (Thorell) followed by Pardosapseudoannulata (Bösenberg and Strand),Tetragnatha mandibulata Walckenaer, Pardosabirmanica Simon, Hippasa holmerae Thorell,Tetragnatha maxillosa Thorell, Oxyopesjavanus Thorell, Hippasa partita (O.P.-Cambridge), and Camaricus formosus Thorell.
• Of the total catch (13,303), 30.9% werejuveniles (4111 individuals) and sex ratio(proportion of males in the population) was0.72, i.e., 72% of the adults were males (6618individuals).
• The spiders form 6 foraging guilds : (a) orbweabers (Araneidae and Tetragnathidae), (b)stalkers (Oxyopidae and Salticidae), (c) groundrunners (Lycosidae, Gnaphosidae), (d) foliagerunners (Clubionidae, Sparassidae), (e) spacebuilders (Pholcidae), and (f) ambushers(Thomisidae).
• Orb weabers (44.3%) formed the mostdominant guild followed by ground runners(30.0%), stalkers (15.2%), foliage runners(5.3%), ambusers (5.1%) and space builders(0.1%).
• Data demonstrated that stalkers reached thepeak population after 75 days oftransplantation of crop while other kinds offoragers attained the peak population during90 days of transplantation of crop growth.
• From the data of field study, 4 ecologicalindices, viz., Shannon-Weiner diversity index(H), Simpson diversity index (D), Margalefrichness index (R) and Pielou evenness index
85
This article can be downloaded from http://www.iajlb.com/currentissue.php
Indo-Am. J. of LifeSc & Bt., 2014 Rajendra Singh and B B Singh, 2014
(E) were calculated to observe the diversity,richness and evenness of the species ofspiders in the target area in the fields of rice.
• The values of Shannon-Weiner diversityindices of spiders ranged between 2.5 to 3.5which demonstrated that every species in thesample is not the same but indicated that thenumbers of individuals are somewhat evenlydistributed between all the species.
• Simpson’s diversity index (D) ranged between0 and 1 which represents the probability thattwo individuals randomly selected from asample will belong to different species.
• The variations in Margalef richness index (R)demonstrated that the species richness of thespiders varied with collection sites and time(DAT) in northeastern Uttar Pradesh.
• Pileou evenness index (E) values rangedbetween 0 and 1 that demonstrated that theevenness of spider communities varied withcollection sites in northeastern UttarPradesh.
• The population growth of spiders in ricelandecosystem in northeastern Uttar Pradeshshowed a gradual increase in the 30th and 45th
DAT and reached the peak on 60th DAT andthen showed a decline in the 90th to 120th DAT.
ACKNOWLEDGMENTThe authors thank the Head of the Departmentof Zoology, DDU Gorakhpur University forproviding necessary facilities. The authorsdeclare that there is no conflict of interestsregarding the publication of this article.
REFERENCES1. Amalin D M, Pena J E, McSorley R,
Browning H W and Crane J H (2001),“Comparison of different sampling methodsand effect of pesticide application on spiderpopulations in line orchard in SouthFlorida”, Env. Ent., Vol. 30, pp. 1021-1027.
2. Anbalagan G and Narayanaswamy P (1999),“Population fluctuation of spiders in therice ecosystem of Tamil Nadu”, Entomon,Vol. 24, No. 1, pp. 91–95.
3. Andow D A (1991), “Vegetational diversityand arthropod population response”, Annu.Rev. Ent., Vol. 36, pp. 561-586.
4. Bambaradeniya C N B and Edirisinghe J P(2001), “The ecological role of spiders inrice fields of Sri Lanka”, Biodiversity, Vol.2, No. 4, pp. 3-10.
5. Banerji D K, Nanda P K, Bera P K and SenS C (1993), “Seasonal abundance of someimportant spider groups in rice agro-ecosystem”, Rec. Zool. Surv. India, Vol. 93,pp. 275-281.
6. Barrion A T and Litsinger J A (1984), “Thespider fauna of Philippine riceagroecosystems”, II. Wetland”, PhilippineEnt., Vol. 6, pp. 11-37.
7. Barrion A T and Litsinger J A (1994),“Taxonomy of rice insect pests and theirarthropod parasites and predators”, InHeinrichs E A (ed.), Biology and Managementof Rice Insects, Wiley Eastern, New Delhi,pp. 363-486.
8. Barrion A T and Litsinger J A (1995),“Riceland spiders of South and SoutheastAsia”, CAB International, Wallingford,England, p. 736.
9. Barrion A T and Schoenly K (1999),“Advances in biological control in tropicalrice agroecosystems”, DFID/CPP Rice CropProtection Workshop, BRRI, Gazipur,Bangladesh, Vol. 1, pp. 36-41.
10. Basset Y (1991), “The seasonality of arborealarthropods within an Australian rainforesttree”, Ecol. Ent., Vol. 16, pp. 265-278.
11. Bhattacharya S (2000), “Biodiversity ofspiders in the rice fields of Kalyani, WestBengal, India”, Res. J. Chem. and Env.,Vol. 4, pp. 75-76.
86
This article can be downloaded from http://www.iajlb.com/currentissue.php
Indo-Am. J. of LifeSc & Bt., 2014 Rajendra Singh and B B Singh, 2014
12. Carroll D P and Hoyt S C (1984), “Naturalenemies and their effects on apple aphidAphis pomi Degeer (Homoptera : Aphididae),colonies on young apple trees in centralWashington”, Env. Ent., Vol. 13, pp. 469-481.
13. Chauhan R, Sihag V and Singh N P (2009),“Distribution and biocontrol potential ofchosen spiders”, J. Biopestic., Vol. 2, No. 2,pp. 151-155.
14. Cherret J M (1964), “The distribution ofspiders on the moor house national naturereserve, Westmorland”, J. Anim. Ecol., Vol.33, pp. 27-48.
15. Corey D T, Stout I J and Edwards G B (1998),“Ground surface spider fauna in Floridasandhill communities”, J. Arachnol., Vol.26, pp. 303-316.
16. Downie I S, Wilson W L, Abernethy V J,Mccracken D I, Foster G N, Ribers I, MurphyK J and Waterhouse A (1999), “The impactof different agricultural land use on epigealspider diversity in Scotland”, J. InsectConserv., Vol. 3, pp. 273-286.
17. Duelli P, Studer M, Marchand I and JakobS (1990), “Population movements ofarthropods between natural and cultivatedareas”, Biol. Conserv., Vol. 54, pp. 193-207.
18. Duffey E (1962), “A population study ofspiders in limestone grass land : The fieldlayer fauna”, Oikos, Vol. 13, pp. 15-34.
19. Fountain M T, Brown V K, Gange A C,William O C, Symondson W O C and MurrayP J (2007), “The effects of the insecticidechlorpyrifos on spider and Collembolacommunities”, Pedobiologia, Vol. 51, pp.147-158.
20. Greenstone M J (1984), “Determinants ofweb spider species diversity, pp. vegetationstructural diversity vs. prey availability”,Oecologia, Vol. 62, pp. 299-304.
21. Halaj J, Ross D W and Moldenke A R (1998),
“Habitat structure and prey availability aspredictors of the abundance andcommunity organization of spiders inwestern Oregon forest canopies”, J.Arachnol., Vol. 26, pp. 201-220.
22. Hatley C L and Macmahon J A (1980),“Spider community organization :Seasonal variation and the role ofvegetation architecture”, Env. Ent., Vol. 9,pp. 632-639.
23. Heiss J S and Meisch M V (1985), “Spiders(Araneae) associated with rice in Arkansaswith notes on species compositions ofpopulations”, Southwestern Naturalist, Vol.30, pp. 119-127.
24. Heong, K L, Aquino, G B and Barrion, A T(1991), “Arthropod community structuresof rice ecosystems in the Philippines”, Bull.Ent. Res., Vol. 81, pp. 407–416.
25. Hurd L E and Fagan W F (1992), “Cursorialspiders and succession, pp. Age or habitatstructure?”, Oecologia, Vol. 92, pp. 215-221.
26. Huusela-Veistola E (1998), “Effect ofperennial grass stripes on spider (Aranae)in cereal fields and impact on pesticideside effect”, J. Appl. Entomol., Vol. 122, pp.575-583.
27. Iida H and Fujisaki K (2005), “Adaptivesignificance of gregarious phase innymphs of wolf spiders Pardosapseudoanulata (Araneae : Lycosidae”, J.Appl. Ent. and Zool., Vol. 40, pp. 649- 657.
28. Iida H and Fujisaki K (2007), “Seasonalchange in resource allocation within anindividual offspring of the wolf spider.Pardosa pseudoannulcaa (Araneae, pp.Lycosidae)”, Physiol. Ent., Vol. 32, pp. 81 -86.
29. Jalaluddin S M, Mohan R, Velusamy R andSadakathulla S (2000), “Predatory behaviorin rice varieties under sodic soilconditions”, J. Ent., Vol. 25, pp. 347-249.
87
This article can be downloaded from http://www.iajlb.com/currentissue.php
Indo-Am. J. of LifeSc & Bt., 2014 Rajendra Singh and B B Singh, 2014
30. Jose K S, Sudhikumar A V, Davis S andSebastian P A (2006), “Preliminary studieson the spider fauna (Arachnida : Araneae)in Parambikulam wildlife sanctuary inWestern Ghats, Kerala, India”, J. BombayNat. Hist. Soc., Vol. 102, No. 3, pp. 13-23.
31. Kajak A (1965), “An analysis of foodrelations between the spiders Araneuscornutus Clerck and Araneus quadratusClerck and their prey in meadows”, Ekol.Polska-Seria A, Vol. 13, pp. 1-46.
32. Kato M, Inoue T, Hamid A A, Nagamitsu T,Merdek M B, Nona A R, Hino T, Yamane Sand Yumoto T (1995), “Seasonality andvertical structure of light attracted insectcommunities in a dipterocarp forest inSarawak”, Res. Popul. Ecol., Vol. 37, pp. 59-79.
33. Kim J P (1995a), “The spider fauna ofChindo Island, Korea”, Korean Arachnol.,Vol. 11, No. 1, pp. 73-82.
34. Kim J P (1995b), “A new species of genusHelicius (Araneae : Salticidae) from Korea”,Korean Arachnol., Vol. 11, No. 2, pp. 1-5.
35. Kiritani K, Kawahara S, Sasaba T andNakasuji F (1972), “Quantitative evaluationof predation by spiders on the green riceleaf hopper, Nephotettix cincticeps Uhler, bya sight count method”, Res. Popul. Ecol., Vol.13, pp. 187-200.
36. Kiritani K (1979), “Pest management inrice”, Annu. Rev. Ent., Vol. 24, pp. 279-312.
37. Kobayashi H (1961), “Studies on the effectof insecticides sprayed for the control ofrice stem borers upon the populationdensity of plant- and leaf- hoppers”, Specialreport on the forecasting of outbreaks ofdiseases and insect pests, Vol. 6, pp. 120-126.
38. Maelfait J P and De Keer R (1990), “Theborder zone of an intensively grazed
pasture as a corridor for spiders (Araneae)”,Biol. Conserv., Vol. 54, pp. 223-238.
39. Magurran A E (1988), “Ecological diversityand its measurement”, New Jersey,Princeton University Press, p. 255.
40. Marsha W W and Richard C H (1976),“Spider population of southeast Texas ricefields”, Southwest. Nat., Vol. 21, No. 1, pp.37-48.
41. Misra A K and Srivastava S K (1993),“Composition and dynamics of spider faunain the rice field”, J. Appl. Zool. Res., Vol. 4,pp. 105-106.
42. Mukhtar M K (2004), “Taxonomic studieson the foliage spider fauna of Punjab”, Ph.D.Thesis, University of Agriculture,Faisalabad.
43. New T R (1999), “Untangling the web:spiders and the challenges of invertebrateconservation”, J. Insect Conserv., Vol. 3, pp.251-256.
44. Norris K C (1999), “Quantifying changethrough time in spider assemblages :sampling methods, indices and sources oferror”, J. Insect Conserv., Vol. 3, pp. 309-325.
45. Odum E P (1971), “Fundamentals of Ecology”,Third Edition, Philadelphia, Saunders,petitioner, p. 574.
46. Okuma C, Lee M H and Hokyo N (1978),“Fauna of spiders in a paddy field inSuweon, Korea”, Esakia, Vol. 11, pp. 81-88.
47. Oraze M J, Grigarick A A, Lynch J H andSmith K A (1988), “Spider fauna of floodedrice fields in northern California”, JArachnol., Vol. 16, pp. 331-337.
48. Pathak S and Saha N N (1999), “Spiderfauna of rice ecosystem in Barak valleyzone of Assam, India”, Indian J. Ent., Vol. 2,pp. 211-212.
49. Pfiffener L and Wyss E (2004), “Sown
88
This article can be downloaded from http://www.iajlb.com/currentissue.php
Indo-Am. J. of LifeSc & Bt., 2014 Rajendra Singh and B B Singh, 2014
wildXower strips to enhance naturalenemies of agricultural pests in annualand perennial cropping system”, In: Gurr,G M, Wratten, S D and Altier, M A (Eds.)Ecological Engineering for Pest Management:Advances in Habitat Manipulation forArthropods”, CSIRO Press, Collingwood,pp. 165–186.
50. Polis G A, Hurd S D, Jackson C T, Sanchez-Pinero F (1998), “Multifactor populationlimitation: variable spatial and temporalcontrol of spiders on Gulf of Californiaislands”, Ecology, Vol. 79, pp. 490-502.
51. Rezac M, Kral J, Musilova J and Pekar S(2006), “Unusual karyotype diversity in theEuropean spiders of the genus Atypus(Araneae : Atypidae)”, Hereditas, Vol. 143,pp. 123-129.
52. Riechert S E (1984), “Spiders as biologicalcontrol agents”, Annu. Rev. Ent., Vol. 29, pp.299-320.
53. Riechert S E and Bishop L (1990), “Preycontrol by an assemblage of generalistpredators : Spiders in garden test systems”,Ecology, Vol. 71, pp. 1441-1450.
54. Rodrigues E N L, Mendonça M De S and OttR (2009), “Spider diversity in a riceagroecosystem and adjacent areas insouthern Brazil”, Rev. Colomb. Ent., Vol. 35,No. 1, pp. 89-97.
55. Rosenzweig M L (1995), “Species Diversityin Space and Time”, Cambridge UniversityPress, Cambridge, UK, pp. 458.
56. Russell-Smith A (2002), “A comparison ofthe diversity and composition of ground-active spiders in Mkomazi Game Reserve,Tanzania and Etosha National Park,Namibia”, J Arachnol., Vol. 30, pp. 383-388.
57. Rypstra A L (1983), “The importance of foodand space in limiting web- spider densities:A test using field enclosures”, Oecologia,Vol. 59, pp. 312-316.
58. Scheidler M (1990), “Influence of habitat
structure and vegetation architecture on
spiders”, Zool. Anz., Vol. 225, pp. 333-340.
59. Schmidt M H and Tscharntke T (2005),
“The role of perennial habitats for Central
European farmland spiders”, Agric. Ecosys.
and Env., Vol. 105, 235-242.
60. Sebastian P A, Mathew M J, Beevi S P,
Joseph J and Biju C R (2005), “The spiderfauna of the irrigated rice ecosystem in
central Kelala, India across different
elevational ranges”, J. Arachnol., Vol. 33,
No. 2, pp. 247-255.
61. Settle W H, Ariawan H, Astuti E, Cahyana
W, Hakim A L, Hindayana D, Lestari A S
and Pajarningsih (1996), “Managing tropical
rice pests through conservation of
generalist natural enemies and alternativeprey”, Ecology, Vol. 77, No. 7, pp. 1975-1988.
62. Siliwal M, Molur S and Biswas B K (2005),
“Indian spiders (Arachnida: Araneae):updated checklist 2005”, Zoos’ Print J. Vol.
20, No. 10, pp. 1999-2049.
63. Solow A R (1993), “A simple test for changein community structure”, J. Anim. Ecol.,
Vol. 62, pp. 191-193.
64. Sudhikumar A V, Mathew M J, Sunish Eand Sebastian P A (2005b), “Seasonal
variation in spider abundance in Kuttanad
rice agroecosystem, Kerala, India
(Araneae)”, Eur. Arachnol., Acta zool.
Bulgarica, Suppl. No. 1, pp. 181-190.
65. Sudhikumar A V, Mathew M J, Sunish E,
Murugesan S and Sebastian P A (2005a),
“Preliminary studies on the spider fauna
in Mannavan shoal forest, Kerala, India(Araneae)”, Eur. Arachnol., Acta zool.
Bulgarica, Suppl. No. 1, pp. 319-327.
66. Tahir H M and Butt A (2008), “Activities ofspiders in rice fields of central Punjab,
89
This article can be downloaded from http://www.iajlb.com/currentissue.php
Indo-Am. J. of LifeSc & Bt., 2014 Rajendra Singh and B B Singh, 2014
Pakistan”, Acta Zool. Sinica, Vol. 54, No. 4,pp. 701-711.
67. Turnbull A L (1966), “A population of spidersand their potential prey in an overgrazedpasture in eastern Ontario”, Can. J. Zool.,Vol. 44, pp. 557-583.
68. Turnbull A L (1973), “Ecology of the truespiders (Araneomorphae)”, Annu. Rev. Ent.,Vol. 18, pp. 305-348.
69. Uetz G W (1979), “The influence of variationin litter habitats on spider communities”,Oecologia, Vol. 40, pp. 29-42.
70. Uetz G W (1991), “Habitat structure andspider foraging”, In McCoy E D, Bell S A andMushinsky H R (Eds.), Habitat Structure; the
Physical Arrangement of Objects in Space,Chapman and Hall, London, pp. 325-348.
71. Uetz G W, Halaj J and Cady A B (1999),“Guild structure of spiders in major crops”,J. Arachnol., Vol. 27, pp. 270-280.
72. Van den Bosch R and Telford A D (1964),
“Environmental modification and biological
control. In: DeBach, P (ed.), Biological Control
of Insect Pests and Weeds”, Chapman and
Hall, London, pp. 459-488.
73. Wagner J D, Toft S and Wise D H (2003),
“Spatial stratification in litter depth by
forest floor spiders”, J. Arachnol., Vol. 31,
pp. 28-39.
74. Wardle D A (1995), “Impacts of disturbance on
detritus food webs in agro-ecosystems of
contrasting tillage and weed management
practices”, Adv. Ecol. Res., Vol. 26, pp. 105–185.
75. Wisniewska J and Prokopy R J (1997),
“Pesticide effect on faunal composition,
abundance, and body length of spiders
(Araneae) in apple orchards”, Env. Ent., Vol.
26, pp. 763-776.