Embed Size (px)
Citation preview

Increased Expression and Altered Methylation ofHERVWE1 in the Human Placentas of Smaller Fetusesfrom Monozygotic, Dichorionic, Discordant TwinsYu Gao1,2., Zhiming He1,2., Zilian Wang , Yanmin Luo , Hongyu Sun3, Yi Zhou1, Linhuan Huang ,
Manchao Li , Qun Fang *, Shiwen Jiang2,4*
1 Fetal Medicine Center, Department of Obstetrics and Gynecology, The First Affiliated Hospital of Sun Yat-Sen University, Guangzhou, Guang Dong Province, People’s
Republic of China, 2 Hoskins Center, Department of Biological Science, Mercer University School of Medicine, Savannah, Georgia, United States of America, 3 Department
of Forensic Medicine, Sun Yat-Sen University, Guangzhou, Guang Dong Province, People’s Republic of China, 4 Department of Obstetrics and Gynecology, Mayo College of
Medicine, Rochester, Minnesota, United States of America
Abstract
Background: The human endogenous retroviral family W, Env(C7), member 1 gene (HERVWE1) is thought to participate introphoblast cell fusion, and its expression is diminished in the placentas of singleton intrauterine growth-retardedpregnancies. However, there is limited information about the role of HERVWE1 in discordant fetal growth in twins. This studywas to compare HERVWE1 gene expression between the placentas of discordant monozygotic twins and to identify itsregulation by methylation.
Methodology/Principal Findings: Fetuses from twenty-one pairs of monozygotic, dichorionic, discordant twins weremarked as ‘‘smaller’’ or ‘‘larger’’ according to birth weight. Placental HERVWE1 mRNA and protein expression profiles wereanalyzed using quantitative RT-PCR and immunohistochemistry (IHC) staining. Methylation profiles of the HERVWE1promoter region were analyzed using a pyrosequencing assay. DNA methyltransferase (DNMT) transcript levels wereanalyzed by RT-PCR. 5-methyl cytosine (5-MC) was stained using an immunohistochemical assay. There was a significantnegative correlation between HERVWE1 mRNA levels and birth weight in twins (P,0.01). Whereas the mean methylationlevel of the HERVWE1 promoter region was diminished in the smaller group in discordant twins(P,0.01), increased mRNAand protein levels of HERVWE1 were found in smaller fetuses compared with larger fetuses in discordant twins(P,0.01).There was no significant difference in 5-MC staining intensity between discordant twins (P.0.05). The DNMT3b3 mRNAlevels in the smaller group were significantly downregulated compared with the larger group in discordant twins(P,0.05),whereas the DNMT3b7 mRNA levels in the smaller group were significantly upregulated compared with the larger group indiscordant twins(P,0.05).
Conclusions/Significance: In discordant, monozygotic, dichorionic twins, HERVWE1 expression was higher in smaller fetusesand lower in larger fetuses. Methylation of the HERVWE1 gene promoter region may participate in the regulation ofHERVWE1 gene expression in discordant twin pregnancies.
Citation: Gao Y, He Z, Wang Z, Luo Y, Sun H, et al. (2012) Increased Expression and Altered Methylation of HERVWE1 in the Human Placentas of Smaller Fetusesfrom Monozygotic, Dichorionic, Discordant Twins. PLoS ONE 7(3): e33503. doi:10.1371/journal.pone.0033503
Editor: Pierre-Antoine Defossez, Universite Paris-Diderot, France
Received September 20, 2011; Accepted February 10, 2012; Published March 21, 2012
Copyright: � 2012 Gao et al. This is an open-access article distributed under the terms of the Creative Commons Attribution License, which permits unrestricteduse, distribution, and reproduction in any medium, provided the original author and source are credited.
Funding: No current external funding sources received for this study.
Competing Interests: The authors have declared that no competing interests exist.
* E-mail: [email protected] (QF); [email protected] (SJ)
. These authors contributed equally to this work.
Introduction
The placenta plays an important role in fetal growth and
development. Its key structure, a syncytium, maintains maternal-
fetal nutrient transport and releases hormones. The structure of
the syncytium in the placenta undergoes significant changes during
intrauterine growth retardation (IUGR) [1]. Over the past few
years, researchers have found that human endogenous retroviral
family W, Env (C7), member 1 (HERVWE1), which is highly
expressed in placental tissue, is the critical gene that regulates the
action and preservation of the syncytium [1,2]. The protein
product of HERVWE1 is syncytin-1, which mediates special
functions in the placenta, including fusion, proliferation, anti-
apoptosis, and immune suppression [3,4]. The fusion function of
syncytin-1 promotes the merging of cytotrophoblast cells to form
the syncytiotrophoblast cell, which secretes several endocrine
hormones that promote fetal growth, such as human chorionic
gonadotrophin (HCG) and human chorionic somatomammotro-
pin (HCS). HERVWE1 expression is regulated by transcription
factors, hormones, cytokines, environmental conditions, and DNA
methylation. Chen and colleagues have proven that DNA
methylation is one of the most important mechanisms for
regulating HERVWE1 [5]. Matouskova and Gimenez have shown
that promoter region hypermethylation diminished HERVWE1
PLoS ONE | www.plosone.org 1 March 2012 | Volume 7 | Issue 3 | e33503
1 1 1
1 1

transcript levels, whereas hypomethylation enhanced its transcript
levels in placental and several non-placental tissues [6,7]. Aside
from the gene-specific promoter region methylation profile, global
genomic methylation and the key enzymes regulating DNA
methylation (DNA methyltransferases, DNMTs) may affect gene
expression. In the last five years, HERVWE1 expression has been
found to be suppressed in IUGR placentas [8,9]. However,
previous research has focused on singleton pregnancies. The
evidence in multiple pregnancies remains limited.
Monozygotic twins have identical inherited backgrounds and
similar intrauterine circumstances. However, phenotypic discrep-
ancies generally do exist between monozygotic twins [10,11]. For
example, birth weight discordance, which is defined as an inter-
twin birth weight difference of greater than 20%, is one abnormal
twin fetal growth pattern [12,13]. An unbalanced placental blood
supply caused by vessel anastomosis is one of the most important
pathogeneses leading to weight discordance in monozygotic,
monochorionic twins [14,15]. However, this cannot explain the
discordance in monozygotic, dichorionic twins as these twins share
the same DNA sequence and similar circumstances, and there are
seldom communicating branch vessels in the placenta. Unequal
placental sharing has been identified in some discordant weight
cases due to a lack of anastomoses [16]. However, the details of
this molecular mechanism remain unclear.
Some researchers have studied the phenotypic differences
between adult monozygotic twins and found that epigenetic
modification is one of the most important causes [17–20].
However, most of these studies focused on adult diseases, such
as psychiatric disorders [11,21,22], multiple sclerosis [20,23], and
systemic lupus erythematosus [24], and the study specimens were
peripheral blood or epithelial cells. Few studies have examined
intrauterine epigenetic modification in the placenta of discordant,
monozygotic twins. Moreover, Fraga and coworkers pointed out
that it takes a long time to accumulate significant changes in
epigenetic modification [25]. It is still unclear whether epigenetic
regulation affects fetal growth discordance during early life.
In this study, we investigated whether differential expression of
HERVWE1 and/or methylation of its promoter region were
related to differences in the birth weight of twins, using gene
expression and methylation analyses to examine placentas from
monozygotic, dichorionic, discordant twins. In addition, we
hypothesized that the key enzymes that regulate DNA methylation
(DNMTs) contribute to the alterative methylation profile of the
HERVWE1 promoter region in monozygotic, dichorionic, discor-
dant twins. As far as we are aware, this study is the first to use
placenta samples from monozygotic, dichorionic twins to study
HERVWE1. Our findings may increase our understanding of the
role of the placenta in maintaining normal fetal growth in twin
pregnancies.
Material and Methods
Case enrollmentAll of the data for the twin pregnancies were collected at the
First Affiliated Hospital of Sun Yat-Sen University, China, from
July 2003 to December 2009. All intrauterine fetal deaths, IUGR,
twin-twin transfusion syndromes (TTTS), and infants delivered
before 26 gestational weeks were excluded from the study.
Chorionicity was determined by a pathology exam after delivery.
The total number of dichorionic twin pregnancies was 336.
Among these cases, 134 pairs of different-sex twins were excluded
due to dizygosity. Zygosity identification was applied in the cases
of 202 pairs of same-sex twins. A total of 56 pairs were identified as
monozygotic twins based on zygosity identification using a
capillary electrophoresis assay. Among those pairs, there were 21
pairs of discordant twins for whom the birth weight difference was
at least 20%. All 42 infants were enrolled into the larger or smaller
group by pair according to birth weight. All of these cases were
managed expectantly without any interventions. In addition, we
collected data from 10 cases of singleton pregnancies delivered at
30–36 weeks for the singleton control group,and 24 pairs of
concordant monozygotic dichorionic twins delivered at 30–36
weeks for the twins control group, for whom the birth weight
difference was less than 20%. All the cases included in this study
were delivered by cesarean section. All of the patients’ parents or
guardians were informed about the following research data
collection. Consent was signed prior to enrollment. This study
was approved by the Sun Yat-sen University Institutional Review
Board.
Sample collectionWithin 15 minutes after delivery, placental tissue from around
the individual insertion region of the umbilical cord was collected.
The placental tissue was excised from inside the placental lobules,
avoiding both the maternal surface and the amniotic membrane.
Three 262 cm tissue samples were excised and washed 3 times in
sterilized, ice-cold saline to eliminate any blood. One piece of
tissue was placed in TRIzol solution for RNA isolation. The
second piece of tissue was placed in a cryotube, which was then
deep frozen in liquid nitrogen overnight and transferred to a
280uC freezer for storage prior to DNA isolation. The third piece
of tissue was placed in a 10% formalin solution overnight and
embedded in paraffin for future immunohistochemical staining.
RNA/DNA extraction and conversionRNA isolation was performed using TRIzol (Invitrogen, Cat.
No. 15596-018, Carlsbad, CA, USA) and the phenol-chloroform
method. The RNA was treated with Ambion DNA-free DNase
treatment and removal reagents (Applied Biosystems, Part
No. AM1906, Austin, TX, USA). The RNA was reverse
transcribed to cDNA using a High Capacity RNA-to-cDNA kit
(Applied Biosystems, Part No. 4387406, Austin, TX, USA). The
cDNA was stored in a 220uC freezer until use in the real-time
PCR assay.
DNA was extracted using the phenol-chloroform method.
Bisulfite conversion was achieved with an EpiTect Bisulfite Kit
(Qiagen, Cat No 59104, Valencia, CA, USA). Bisulfite-treated
DNA was stored in a 220uC freezer until use in the
pyrosequencing assay.
Zygosity identification using a capillary electrophoresisassay
Genomic DNA was amplified with PowerPlex 16 (Promega, Cat
No. DC 6531, Madison, WI, USA) in order to detect 15
autosomal short tandem repeat (STR) loci in addition to the
gender determination marker amelogenin. Multiplex PCR was
performed using 1 ml of template DNA in a 10 ml volume that
included 1 ml of 106 GeneAmp PCR Gold Buffer, 1 ml of 106Primer Pair Mix, and 0.3 ml of AmpliTaq Gold DNA polymerase
(1.5 U) (Applied Biosystems, Cat No. 4338856, Carlsbad, CA,
USA). The PCR cycling conditions were 95uC for 11 minutes;
96uC for 2 minutes; 10 cycles of 94uC for 1 minute, 60uC for
1 minute, and 70uC for 1.5 minutes; 22 cycles of 90uC for
1 minute, 60uC for 1 minute, and 70uC for 1.5 minutes; and a
final extension at 60uC for 30 minutes. The PCR products were
separated and detected by capillary electrophoresis using an ABI
3100 Genetic Analyzer (Applied Biosystem, Cat No. 4359571,
HERVWE1 Expression, Methylated Regulation in Twins
PLoS ONE | www.plosone.org 2 March 2012 | Volume 7 | Issue 3 | e33503

Carlsbad, CA, USA) according to the manufacturer’s instructions.
Allele calls were made with GeneMapper ID v3.2 software
(Applied Biosystem, Cat No. 4338856, Carlsbad, CA, USA). If all
genotypes of the 16 loci were identical, then the pair was identified
as monozygotic. If the genotypes of any loci were different, then
the pair was identified as dizygotic. Appendix Figure S1 shows the
16 STR loci in one pair of monozygotic twins.
Real-time PCRTo determine the transcriptional profile of HERVWE1,
quantitative real-time PCR was used to compare HERVWE1
mRNA levels between growth discordant twins, with three internal
reference genes, glyceraldehyde-3-phosphate dehydrogenase
(GAPDH),beta actin (b-actin), and proliferating cell nuclear antigen
(PCNA).. The HCS gene located downstream of HERVWE1 was
identified as a factor reflecting placental function. The HCS
mRNA level was measured as well. The concordant twins groups
and singleton group served as normal controls. We also explored
the transcription of three DNMTs (DNMT1, DNMT3a, and
DNMT3b) and seven DNMT3b isoforms (DNMT3b1-7) in discor-
dant twins and singleton control group using real-time PCR.
Briefly, cDNA was quantitatively analyzed by real-time PCR
using a 7900HT fast real-time PCR system (Applied Biosystems,
Part No. 4329001, Carlsbad, CA, USA). PCR was performed in
384-well plates using SYBR Green PCR Master Mix (Applied
Biosystems, Part No. 4309155, Carlsbad, CA, USA). Each
reaction contained 6 ml 26 SYBR green master mixture, 1 ml
forward primer, 1 ml reverse primer, 1 ml cDNA template, and
3 ml H2O. Every reaction was repeated in quadruplicate. The
thermal cycling conditions consisted of 50uC for 2 minutes; 95uCfor 6 minutes; and 40 cycles of 95uC for 30 seconds, 45uC for
30 seconds, and 60uC for 1 minute. The quantitative gene
expression results were analyzed with sequence detection system
software (SDS v.2.3). The details of the real-time primers for
HERVWE1, HCS, DNMTs, GAPDH, b-actin, and PCNA are shown
in Appendix Table S1.
Immunohistochemical staining (IHC)Blocks from ten pairs of discordant twins, ten pairs of
concordant twins, and ten singleton cases were available to apply
the HERVWE1 IHC staining. The same ten pairs of discordant
twins and ten singleton cases applied the 5-MC staining. The slices
were stained under the same condition in HERVWE1 IHC
staining and 5-MC staining respectively.
HERVWE1 protein expressionPlacental tissue was embedded in paraffin. Each slice was
deparaffinized using xylene and gradient ethanol. Antigen retrieval
was performed in boiling 10 mM citrate buffer for 10 minutes.
The slices were then treated with 2 N hydrochloric acid (HCl) at
37uC for 30 minutes. Endo-peroxidase blocking was accomplished
with 3% H2O2 in methanol for 20 minutes. Blocking of non-
Table 1. Clinical characteristics among the groups.
Larger twin indiscordant group(n = 21)
Smaller twin indiscordant group(n = 21)
Larger twin inconcordant group(n = 24)
Smaller twin inconcordant group(n = 24)
Singleton group(n = 10)
Maternal age (years) 27.9564.22 28.3863.98 27.6062.07
Race
Asian (n, %) 21 (100%) 24 (100%) 10 (100%)
Non-Asian (n, %) 0 (0%) 0 (0%) 0 (0%)
Maternal BMI (kg/m2) 24.663.8 24.263.6 22.163.2
Maternal parity 1.4560.6 1.2960.6 1.5660.7
Mode of delivery
Vaginal delivery (n, %) 0 (0%) 0 (0%) 0 (0%)
Cesarean section (n, %) 21 (100%) 24 (100%) 10 (100%)
Delivery GA (weeks) 32.8762.57 33.6962.08 33.4162.43
Sex distribution
Male (n, %) 16 (76.2%) 14 (58.3%) 6 (60%)
Female (n, %) 5 (23.8%) 10 (41.7%) 4 (40%)
Maternal complications
Preeclampsia (n, %) 0 (0%) 0 (0%) 0 (0%)
TTTS (n, %) 0 (0%) 0 (0%) _
IUGR (n, %) 0 (0%) 0 (0%) 0 (0%)
GDM (n, %) 0 (0%) 0 (0%) 0 (0%)
Birth weight (kg) 1.9060.43* 1.3760.36{{ 2.0660.37 1.886.0.36 2.0760.44
Birth weight difference (%) 28.565.3j 8.765.6 _
Data are shown as the means 6 standard deviations or n (%).BMI, body mass index; GA, gestational age; TTTS, twin-to-twin transfusion syndrome; IUGR, intrauterine growth restriction.*P,0.01 vs. smaller twin in discordant group.{P,0.01 vs. singleton group.{P,0.01 vs. larger or smaller twins in concordant group.jP,0.05 vs. concordant twin group.doi:10.1371/journal.pone.0033503.t001
HERVWE1 Expression, Methylated Regulation in Twins
PLoS ONE | www.plosone.org 3 March 2012 | Volume 7 | Issue 3 | e33503

specific binding was performed with 1% gelatin. The samples were
incubated at 4uC overnight with a 1:100 dilution of affinity-purified
rabbit polyclonal anti-human endogenous retrovirus IgG antibody
(GeneTex Inc. Cat No. GTX70327, Irvine, CA, USA). A goat anti-
rabbit secondary antibody conjugated to biotin (Vector Laboratories,
Cat No. BA-1000, Burlingame, CA, USA) at a dilution of 1:200 was
applied for 30 minutes. The sections were then incubated with a
Vectastain Elite ABC-peroxidase kit (Vector laboratories, Cat
No. BA-1000, Burlingame, CA, USA) for 60 minutes. Staining was
detected with a substrate solution of diaminobenzidine tetrahy-
drochloride (DAB) (Sigma Aldrich, Cat. No D5905-50, St. Louis,
MO, USA). Counterstaining was performed with hematoxylin.
Global methylation staining for 5-methyl cytosine (5-MC)Tissue slices were incubated overnight in a 1:200 dilution of
sheep anti-5-Methyl Cytosine primary antibody (Capralogics, Inc.,
Cat No. P00704, Hardwick, MA, USA) followed by a 1:200
dilution of biotinylated goat anti-sheep IgG (Vector Laboratories,
Cat No. BA-6000, Burlingame, CA, USA) as the secondary
antibody. The other steps were performed as described for the
HERVWE1 staining.
Picture acquisition and processingImages were captured using a Carl Zeiss microscope imaging
system (Carl Zeiss, Cat. No. AxioVert 200 M, Thornwood, NY,
US). Based on the proportion of positively stained cells and their
degree of intensity, three random high-power fields (10640) from
each section were analyzed using AxioVs40LE digital image
processing software (Carl Zeiss, AxioVision version 4.5.0.0,
Thornwood, NY, US). The scoring system used to assess the
trophoblast profile was as follows: negative (score = 0) = no positive
staining, weakly positive (score = 1) = weakly positive staining seen
within the structure, positive (score = 2) = positive staining seen
within the structure, and strongly positive (score = 3) = strong
staining signal within the trophoblast cell. The proportion of cells
in each staining intensity category was multiplied by the
trophoblast profile score to calculate the overall score.
Pyrosequencing assayThe pyrosequencing assay was applied in all of the discordant
twins and singleton control cases. There were 5 CG sites from
2336 bp to 2192 bp in the HERVWE1 59LTR+U3 region.
Appendix Figure S2 is a schematic diagram showing the CG sites
in the HERVWE1 promoter region. To analyze the methylation
levels of the 5 CG sites, we used a pyrosequencing assay. The
bisulfite-converted target DNA sequence was amplified using biotin-
labeled primers, as shown in Appendix Table S1. Each PCR
reaction contained 3 ml 106PCR buffer, 1.8 ml 25 mM/L MgCl2,
0.6 ml 10 mM dNTP (Fermentas, Cat No. R0191, Glen Burnie,
MD, USA), 0.15 ml Hotstar Taq DNA polymerase (Qiagen, Cat
No. 203203, Valencia, CA, USA), 0.6 ml forward primer, 0.6 ml
reverse primer, 1 ml DNA template, and 22.25 ml H2O. The
thermal cycling conditions consisted of 95uC for 15 minutes; 45
cycles of 95uC for 30 seconds, 58uC for 30 seconds, and 72uC for
30 seconds; 72uC for 10 minutes; and 4uC until completion. The
PCR products were sent to EpigenDx, Inc. (Worcester, MA, USA)
for pyrosequencing. All new data had been deposited in GenBank.
Because pyrosequencing can read only 50–100 bp for each accurate
pyrosequencing primer, we used two pyrosequencing primers to
analyze the five CpG sites. The pyrograms are shown in Appendix
Figure S3. The methylation level of each CG site was calculated as
the C/(C+T) peak height ratio. Unmethylated and in vitro
methylated DNA were mixed at specified ratios to serve as controls.
Statistical analysisAll of the data were analyzed using IBM SPSS v. 19.0 statistical
software (SPSS Inc., Chicago, IL, USA). Clinical information was
presented as the frequencies or means 6 standard deviations. The
comparisons between larger and smaller fetuses in twin pairs were
performed using an independent sample t-test. The differences
among the control groups, the smaller or larger discordant twin
groups were analyzed using one-way ANOVA. The correlations
between methylation levels and gene expression were evaluated using
Spearman’s correlation analysis. The semi-quantitative IHC data
were analyzed using ANOVA with the least significant difference
procedure (LSD) and post hoc multiple comparisons analysis. To
remove the effect of gestational age, analysis of covariance was
applied to evaluate the difference of gene expression in each group. A
P value,0.05 was considered significant for all tests.
Results
Clinical characteristicsThere were 21 pairs of monozygotic, dichorionic, discordant
twins, 24 pairs of monozygotic, dichorionic, concordant twins, and
Table 2. HERVWE1 and HCS mRNA levels among the groups (GAPDH, b-actin, and PCNA as internal reference genes respectively).
Larger twin indiscordant group(n = 21)
Smaller twin indiscordant group(n = 21)
Larger twin inconcordant group(n = 24)
Smaller twin inconcordant group(n = 24)
Singleton group(n = 10)
HERVWE1
GAPDH as control 1.0360.18 1.9160.31{ 0.9660.22 1.0460.29 1.0060.09
b-actin as control 0.9860.16 1.6260.29{ 1.0960.22 1.1360.26 1.0060.17
PCNA as control 0.9960.26 1.1160.27 1.0960.22 1.1260.27 1.0060.13
HCS
GAPDH as control 1.1260.33 2.1760.36{ 1.1360.32 1.1560.30 1.0060.25
b-actin as control 1.1860.29 1.7360.35{ 1.1260.31 1.1760.28 1.0060.24
PCNA as control 0.9760.34 1.0760.28 1.0860.31 1.0960.25 1.0060.24
The values shown indicate the relative quantitation of HERVWE1 and HCS mRNAs, which were standardized to GAPDH,b-actin,and PCNA respectively, and normalized tothe singleton control group.The data are shown as the means 6 standard deviations.{P,0.01 vs. other four groups.doi:10.1371/journal.pone.0033503.t002
HERVWE1 Expression, Methylated Regulation in Twins
PLoS ONE | www.plosone.org 4 March 2012 | Volume 7 | Issue 3 | e33503

10 singleton pregnancies enrolled in our study. The clinical
characteristics are summarized in Table 1. There were no
differences in maternal age, race distribution, maternal body mass
index (BMI), maternal parity, mode of delivery, delivery
gestational age, incidence of maternal complication, or gender
distribution among the discordant twins, concordant twins, and
singleton groups. The birth weight of smaller fetuses in discordant
group was the lightest among the five groups (P,0.01). The birth
weight difference in discordant twins was significantly larger than
that in concordant twins (P,0.05).
Figure 1. The correlation between HERVWE1 transcript levels and birth weight. The scatterplots showed the correlation between theHERVWE1 transcript profile and the fetal birth weight in all five groups. (A) Using GAPDH as internal reference gene, the HERVWE1 transcript level wassignificant negatively correlated with the fetal birth weight (spearman correlation coefficient 20.287, P,0.01). (B) Using b-actin as internal referencegene, the HERVWE1 transcript level was significant negatively correlated with the fetal birth weight (spearman correlation coefficient 20.271,P,0.01).doi:10.1371/journal.pone.0033503.g001
HERVWE1 Expression, Methylated Regulation in Twins
PLoS ONE | www.plosone.org 5 March 2012 | Volume 7 | Issue 3 | e33503

HERVWE1 and HCS transcript levelsIn order to precisely investigate the HERVWE1 transcript levels,
three internal reference genes were applied. The GAPDH and b-
actin were commonly used housekeeping genes. The PCNA was an
index of cell proliferation which was used to eliminate the impact
of cell proliferation on HERVWE1’s expression. As summarized in
Table 2, the HERVWE1 mRNA level of the smaller twin in
discordant group was greater than that of the larger twin in
discordant group (P,0.01, GAPDH and b-actin as control). The
downstream gene HCS, as an indicator of placental function, also
showed the same trend in discordant twins (P,0.05, GAPDH and
b-actin as control). The HERVWE1 and HCS transcript levels in
the larger discordant twin group were similar to that in singleton
group and two concordant twin groups (P.0.05). We observed an
association between HERVWE1 and HCS mRNA levels in the pool
of all groups, with a Spearman’s correlation coefficient (Rs) of
0.647(GAPDH as control), 0.582 (b-actin as control) and 0.624
(PCNA as control)(P,0.01). We also observed a significant negative
correlation between HERVWE1 transcript levels and birth weight
in all groups, with a correlation coefficient of 20.287 (GAPDH as
control) and 20.271 (b-actin as control) (P,0.01) (Figure 1). We
didn’t find the correlation between HERVWE1 transcript levels
and delivery gestational age in each group (P.0.05). When
gestational age was taken into account as covariate in covariance
analysis, the same increased expression was detected in smaller
fetuses in discordant twins.
HERVWE1 protein expressionHERVWE1 IHC staining images are shown in Figure 2. There
was no significant difference in pathological structure examination
among groups. All of the villous trees were misaligned and
crowded, and the stem villi were scarred. The stem villi were short
and thick. The majority of the villi were terminal villi, and they
were tiny and irregular. The terminal villus was covered with a
trophoblastic surface, which was composed of two layers. The
villous syncytiotrophoblast constituted the outer continuous thin
layer. The villous cytotrophoblast constituted the inner discontin-
uous layer. Inside the villi was the stroma, including the fetal
vessels, macrophages, and connective tissue fibers. The positive
staining of HERVWE1 was mostly concentrated in the cytoplasm
of the trophoblast cells. There was no significant difference in
syncytiotrophoblast or cytotrophoblast cell number among all
groups.
We compared the intensity of trophoblast cells among the
discordant twin group, concordant twin group, and singleton
group (Table 3). The smaller twin in discordant group had the
strongest HERVWE1 protein expression among the five groups
(P,0.01). There was no significant difference among the larger
twin in discordant group, two concordant twin groups, and the
singleton group (P.0.05).
Based on the Spearman correlation analysis, the HERVWE1
staining score was positively correlated with the HERVWE1
mRNA level (Rs = 0.229, P,0.05, GAPDH as control). Figure 3
shows the correlation between the HERVWE1 staining score and
HERVWE1mRNA level. The HERVWE1 protein expression level
was consistent with the mRNA expression level in twins. Both of
these measurements were increased in the smaller twin in
discordant group.
Figure 2. HERVWE1 staining of discordant twin, concordanttwin, and singleton placentas. A–F show placental tissues withHERVWE1 immunohistochemical staining. The paraffin-embeddedplacental tissues were sliced into 4-mm sections. The slices wereincubated in a rabbit polyclonal anti-human endogenous retrovirus IgGprimary antibody (diluted 1:100). A goat anti-rabbit secondary antibody(diluted in 1:200) was applied sequentially. The slices were developedwith an immunoperoxidase system. The HERVWE1 antigen was mainlypresent in the trophoblast cytoplasm. The positive cells were stainedbrown, and the negative cells were stained blue after counterstainingwith hematoxylin. (A) The larger infant in discordant group (magnifi-cation 10640). (B) The smaller infant in discordant group (magnification10640). (C) The larger infant in concordant group (magnification10640). (D) The smaller infant in concordant group (magnification10640). (E) A singleton infant (magnification 10640). (F) The negativecontrol (magnification 10640). This singleton tissue slice was stainedwith 1% gelatin instead of the HERVWE1 antibody. Syncytiotrophoblast,cytotrophoblast, stromal cells, and endothelial cell are marked as S, C,ST, and EN respectively.doi:10.1371/journal.pone.0033503.g002
Table 3. HERVWE1 staining scores among the groups.
Larger twin indiscordant group (n = 10)
Smaller twin indiscordant group (n = 10)
Larger twin inconcordant group (n = 10)
Smaller twin inconcordant group (n = 10)
Singletongroup (n = 10)
HERVWE1 score 1.4360.33 1.7560.33{ 1.4360.35 1.4460.36 1.3260.40
Data are shown as the means 6 standard deviations.{P,0.01 vs. other four groups.doi:10.1371/journal.pone.0033503.t003
HERVWE1 Expression, Methylated Regulation in Twins
PLoS ONE | www.plosone.org 6 March 2012 | Volume 7 | Issue 3 | e33503

The methylation profile of HERVWE1 transcriptionalregulation region
Pyrosequencing assay was applied in 21 pairs of discordant
twins and 10 singletons. The methylation levels of the 1st and 2nd
CG sites and the average methylation levels of the five CG sites
were lower in smaller discordant twin group compared with the
larger discordant twin group (P,0.01), and the singleton
group(P,0.01). However, no differences were detected at the
3rd, 4th and 5th CG sites (P.0.05), as summarized in Figure 4.
When the CG sites were sorted by methylation level, the order was
3rd, 1st, 4th, 2nd and 5th for both discordant twin groups.
Spearman correlation analysis was applied to study the
correlation between HERVWE1 transcript level and methylation
profile. While the GAPDH as internal reference gene, the
HERVWE1 transcript level was negatively correlated with the
HERVWE1 promoter region the 1st(Rs = 20.434, P,0.01),
2nd(Rs = 20.377, P,0.01),and mean(Rs = 20.510, P,0.01) meth-
ylation levels (Figure 5). While the b-actin as internal reference
Figure 3. The correlation between the HERVWE1 staining score and the HERVWE1 mRNA level. The scatterplots showed the correlationbetween the HERVWE1 transcript profile and the HERVWE1 staining score in all five groups. Using GAPDH as internal reference gene, the HERVWE1transcript level was significant positively correlated with the HERVWE1 staining score (spearman correlation coefficient 0.229, P,0.05).doi:10.1371/journal.pone.0033503.g003
Figure 4. The methylation profile of the HERVWE1 promoter region, as determined by the pyrosequencing assay. There were 5 CGsites in HERVWE1 promoter region. The pyrosequencing assay was applied to investigate the five CG sites methylation profile. The bar chart showedthe five CG sites methylation level. All of the CG sites methylation ratios were lower than 40%. The most hypermethylated site was the 3rd CG site.The most hypomethylated site was the 5th CG site. The black, darkgrey, and lightgrey bars were represented the smaller discordant twin group,larger discordant twin group, and singleton group respectively. The 1st, 2nd, and mean methlation level in smaller discordant twin group were lowerthan that in larger discordant twin group (P,0.01) and singleton group (P,0.01).doi:10.1371/journal.pone.0033503.g004
HERVWE1 Expression, Methylated Regulation in Twins
PLoS ONE | www.plosone.org 7 March 2012 | Volume 7 | Issue 3 | e33503

Figure 5. The correlation between HERVWE1 promoter region methylation level and HERVWE1 transcript levels. The scatterplotsshowed the correlation between the HERVWE1 transcript profile and the HERVWE1 promoter region methylation level in discordant twin groups andsingleton group. Using GAPDH as internal reference gene, the HERVWE1 transcript level was significant negatively correlated with the HERVWE1
HERVWE1 Expression, Methylated Regulation in Twins
PLoS ONE | www.plosone.org 8 March 2012 | Volume 7 | Issue 3 | e33503

gene, the HERVWE1 transcript level was also negatively correlated
with the HERVWE1 promoter region the 1st(Rs = 20.308,
P,0.05), 2nd(Rs = 20.517, P,0.01),and mean(Rs = 20.428,
P,0.01) methylation level (Figure 5).
Global methylation (5-MC staining)We used a semi-quantitative analysis method to score the slice
density. The staining was located in the nuclei of both of the
trophoblast and stroma cells. The positive nuclei were brown, and
the negative nuclei were blue after counterstaining with hema-
toxylin. Comparing the 5-MC staining densities of the larger twin
in discordant group, the smaller twin in discordant group and the
singleton group samples revealed no significant differences in
overall score among the three groups (P.0.05) (Table 4).
Figure 6 shows pictures of individual cases. For the smaller twins
in discordant group, we noticed the staining in the trophoblast
cells (marked as S or C in Figure 6) was lighter than that seen in
the stromal cells (marked as ST). However, the larger twin in
discorant group and singleton group had no such distinction.
Therefore, we counted only the trophoblast cells using a semi-
quantitative analysis method, and we found that the smaller twin
in discordant group had a lower 5-MC staining intensity in
trophoblast cells than the larger twin in discordant group and the
singleton group (P,0.01), but no differences between the larger
twin in discordant group and the singleton group
(P.0.05)(Table 4).
DNMT transcript levelsAs indicated above, DNA methylation was closely related with
HERVWE1 transcript level. DNMTs are essential for establishing
and maintaining the cellular methylation patterns. The alteration
of DNMTs expression may attribute to the change of methylation
pattern. It may be interesting to explore the relationship between
the DNMTs transcript level and HERVWE1methylation profile in
the placenta of discordant twins. We used real-time PCR assay to
analyze DNMTs transcriptional profiles among discordant twin
group and singleton group. Thus we calculated the correlations
between the DNMTs transcript levels and HERVWE1 methylation
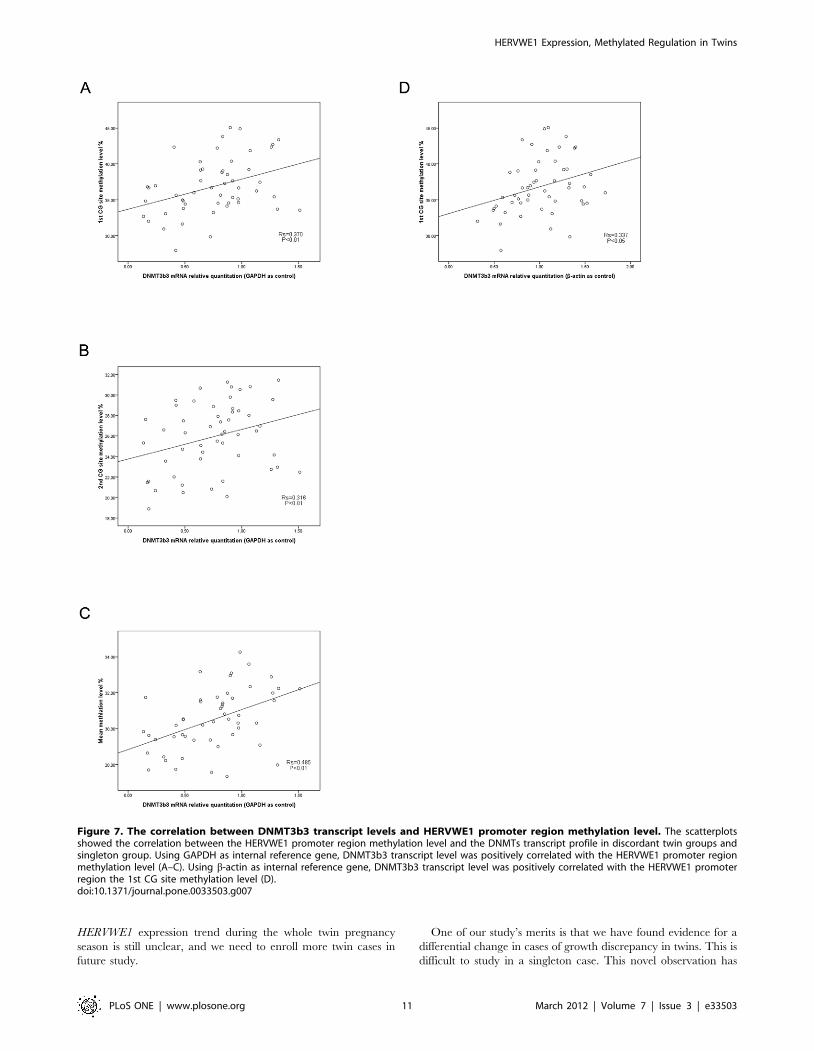
profile. While the GAPDH as internal reference gene, we only
found DNMT 3b3 transcript level was positively correlated with
the HERVWE1 promoter region the 1st(Rs = 0.370, P,0.01),
2nd(Rs = 0.316, P,0.01),and mean(Rs = 0.485, P,0.01) methyla-
tion level (Figure 7). While the b-actin as internal reference gene,
the result was also true. The DNMT3b3 transcript level was
positively correlated with the HERVWE1 promoter region the
1st(Rs = 0.337, P,0.05) methylation level (Figure 7). However,
there was no significant correlation between the other DNMTs
transcript level and the HERVWE1 promoter region methylation
profile.
We also compared the DNMTs transcriptional profiles among
discordant twin group and singleton group. The results based on
GAPDH and b-actin as internal reference gene were consistent.
There were no differences between the larger twin and the smaller
twin in discordant group for DNMT1, DNMT3a, or DNMT3b
(P.0.05). The smaller twin in discordant group expressed less
DNMT3b3 (P,0.05) and more DNMT3b7 (P,0.05) than the larger
twin in discordant group and singleton group. Figure 8 shows
DNMTs transcriptional profiles based on GAPDH and b-actin as
internal reference gene.
Discussion
Our data showed that HERVWE1 was more highly expressed in
smaller twins than larger twins in discordant group. The
HERVWE1 transcript level was negatively correlated with birth
weight. The methylation level of HERVWE1 promoter-region was
decreased in the smaller discordant twin group and increased in
the larger discordant twin group, also well correlated with
HERVWE1 transcript level. We found that DNMT3b3 transcript
level was positively correlated with the HERVWE1 promoter
region methylation profile. The DNMT3b3 mRNA level was
downregulated, and the DNMT3b7 mRNA level was upregulated
in the smaller discordant twin group.
HERVWE1 expression in discordant twinsBecause previous studies by Ruebner and coworkers have
shown that syncytin-1 is decreased in IUGR, the increase in
HERVWE1 expression in smaller discordant twin placentas is
slightly surprising [8,9]. However, it should be recognized that our
study population had unique features; the correlation between
these characteristic features and the data has led to some
intriguing hypotheses, as discussed below.
Unlike previous studies using singleton placentas conforming to
the diagnostic criteria for IUGR, our study subjects were
discordant (not IUGR) twins. All of our twins were in the normal
range for birth weight based on the twin-specific growth reference
curve [26]. In our study, the boundary point for discordancy was
20%, consistent with the majority of the literature. The average
weight discordance was 28.5%. Many researchers believe that
discordancy itself is not a risk factor for adverse neonatal outcomes
[12,27]. Twin weight discordancy and IUGR have different
pathological significance, and they cannot be treated equally.
Both the results from GAPDH and b-actin as housekeeping gene
supported the alteration of HERVWE1 transcript level in
promoter region methylation level (A–C). Using b-actin as internal reference gene, the HERVWE1 transcript level was significant negatively correlatedwith the HERVWE1 promoter region methylation level (D–F).doi:10.1371/journal.pone.0033503.g005
Table 4. 5-MC staining scores for the discordant twin and singleton group.
Larger twin in discordantgroup (n = 10)
Smaller twin in discordantgroup (n = 10) Singleton group (n = 10)
Overall 5-MC score 1.760.4 1.660.4 1.760.4
5-MC in trophoblast cells 1.760.4 1.260.3*{ 1.660.5
Data are shown as the mean scores 6 standard deviations.*P,0.01 vs. larger twin in discordant group;{P,0.01 vs. singleton group.doi:10.1371/journal.pone.0033503.t004
HERVWE1 Expression, Methylated Regulation in Twins
PLoS ONE | www.plosone.org 9 March 2012 | Volume 7 | Issue 3 | e33503

discordant twins. However, after eliminate the contribution of cell
proliferation, adjusted by PCNA, an indicator of cell proliferation,
there was no significant difference between discordant twins. We
speculated that the alteration of HERVWE1 transcript level was
related to the cell proliferation, since it has been found that one of
HERVWE1’s important function is proliferation [3,28]. Previous
study had verified that the HERVWE1 expression was synchronous
with the PCNA expression in endometrial carcinoma tissue [28].
This consistent trend between HERVWE1 and PCNA expression in
our study further verified the functional effect of HERVWE1 gene
on placenta.
Compensation to hypoxia is one of the characteristics of
placenta development. Hypoxia can induce VEGF expression and
trophoblast invasion in early trimester [29,30].Hypoxia may also
induce ROS production, which is one of features of IUGR and
preeclampsia [31], if hypoxia is not corrected. Decreased syncytin-
1 expression detected in the placenta of IUGR and the
preeclampsia cases seems to be a result of persistent hypoxia.
However, increased syncytin-1 expression detected in the smaller
discordant twin group may indicate compensatory reactions were
involved. The alteration may represent an early stage of IUGR.
Increased syncytin-1 may be part of the protective response to
hypoxia.
We also found that the larger discordant twin group’s
HERVWE1 expression was similar to that of the normal singleton
and concordant twin control group, whereas the expression in the
smaller discordant twin group was significantly higher than that of
the normal singleton group and concordant twin group. If
placental function is in the normal range, the placenta of the
smaller discordant infant will enlist more compensatory mecha-
nisms, such as release of syncytin-1, to make up for the growth
discrepancy. The larger infant’s situation is better, and as such, the
compensatory mechanism is not as distinct.
The increased HCS expression seen in the placentas of the
smaller discordant twin group supports our hypothesis. HCS, as
well as HCG, was highly expressed in the syncytium when
cytotrophoblast cells merged into syncytiotrophoblast cells. Its
expression status indicates placental function [32]. It is well known
that HCS levels significantly decrease during IUGR and
preeclampsia. Attempts have been made by some investigators
to use HCS or HCG as a marker of placental function and an
indicator of IUGR severity. The ß-HCG protein level was
significantly decreased in cytotrophoblast cells fractionated from
IUGR placentas in Ruebner’s study. In our study, the expression
level of HCS was consistent with HERVWE1 expression in each
group. Moreover, the HCS transcript levels in both the larger and
smaller discordant twin groups were greater than the normal level,
as indicated by the singleton and twin control group. This finding
indicates that not only did the placental function remain largely
intact in both of our discordant twin groups but the alteration of
HERVWE1 expression was also related to the placental compen-
sation capability. Although one of the infants was smaller than the
other, the placenta still had the capacity to promote its growth in
order for it to catch up to the larger one. This compensatory
capability was very different from the decompensated changes
seen in the placenta during IUGR.
We applied the analysis of covariance to evaluate the influence
of gestational age, since some researchers have found that
throughout the entire pregnancy period, HERVWE1 expression
increased as the gestational week increased in singleton pregnancy.
In the 3rd trimester, HERVWE1 mRNA expression reaches its
peak, then it drops since 37 wks [33,34]. This may explain the
result of ours were different from Ruebner’s study, whose average
gestational age of the IUGR group was 36+3 wks. We found that
gestational age didn’t have significant effect on HERVWE1
transcript expression in each group (P.0.05). We still observed
the increased HERVWE1 transcript level in smaller fetuses of
discordant twin when the gestational age was treated as covariate.
Furthermore, we couldn’t find the correlation between the
HERVWE1 mRNA expression and the gestational age in each
group. Thus, the differential expression of HERVWE1 observed in
the study may be an intrinsic alteration for specific mechanisms
rather than simple increased gestational age. However, the
Figure 6. 5-MC staining in placentas from discordant twins andsingletons. In eukaryotic genomes, DNA methylation always occurs ona cytosine base, the fifth carbon of which is linked to a methyl group (-CH3). IHC staining with an anti-5-MC antibody can quantitatively detectthe intra-nuclear 5-MC density and intensity. A–H show placental tissueswith anti-5-MC IHC staining. The slices were incubated in a primarysheep polyclonal anti-5-methyl cytosine IgG antibody (diluted 1:200)overnight. A goat anti-sheep secondary antibody (diluted 1:400) wasapplied sequentially. The slices were developed with an immunoper-oxidase system. 5-MC was mainly detected in the nucleus. Positive cellswere stained brown. Negative cells were stained blue after counter-staining with hematoxylin. (A) The larger infant in discordant group(magnification 10620). (B) The larger infant in discordant group(magnification 10640). (C) The smaller infant in discordant group(magnification 10620). (D) The smaller infant in discordant group(magnification 10640). (E) A singleton infant (magnification 10620). (F)A singleton infant (magnification 10640). (G) The negative control(magnification 10620). This singleton tissue slice was stained with 1%gelatin instead of the anti-5-MC antibody. (H) The negative control(magnification 10640). Syncytiotrophoblast and cytotrophoblast cellsare marked as S and C respectively. Stromal cells are marked as ST.doi:10.1371/journal.pone.0033503.g006
HERVWE1 Expression, Methylated Regulation in Twins
PLoS ONE | www.plosone.org 10 March 2012 | Volume 7 | Issue 3 | e33503
HERVWE1 expression trend during the whole twin pregnancy
season is still unclear, and we need to enroll more twin cases in
future study.
One of our study’s merits is that we have found evidence for a
differential change in cases of growth discrepancy in twins. This is
difficult to study in a singleton case. This novel observation has
Figure 7. The correlation between DNMT3b3 transcript levels and HERVWE1 promoter region methylation level. The scatterplotsshowed the correlation between the HERVWE1 promoter region methylation level and the DNMTs transcript profile in discordant twin groups andsingleton group. Using GAPDH as internal reference gene, DNMT3b3 transcript level was positively correlated with the HERVWE1 promoter regionmethylation level (A–C). Using b-actin as internal reference gene, DNMT3b3 transcript level was positively correlated with the HERVWE1 promoterregion the 1st CG site methylation level (D).doi:10.1371/journal.pone.0033503.g007
HERVWE1 Expression, Methylated Regulation in Twins
PLoS ONE | www.plosone.org 11 March 2012 | Volume 7 | Issue 3 | e33503

enriched our understanding of the molecular mechanisms involved
in the pathogenesis of fetal growth disorders.
Methylation alteration in monozygotic twinsOur next important finding is the identification of a particular
alteration in methylation in the HERVWE1 promoter region in
discordant, monozygotic twins, with methylation being decreased
in the smaller twins. Previous studies in discordant, monozygotic
twins also found epigenetic difference between the discordant
phenotypes. However, most of these studies were limited to adult
disease, such as in schizophrenia and multiple sclerosis [23].
Limited study was conducted in fetal stage. Our study used a
unique study population to explore intrauterine growth differenc-
es. Only dichorionic twins were enrolled, thereby avoiding the
effect of vascular anastomosis between placentas. We found that
methylation of the HERVWE1 promoter region was decreased in
the smaller twins but without according changes in global level. It
indicated that locus-specific methylation played an important role
in regulating gene expression in the placenta during twin
development. A meaningful methylation difference definitely
existed between the monozygotic twins during the intrauterine
stage and have critical influence on fetal or placental development.
DNMT regulation in discordant twinsDNMTs may act as key enzymes in a complicated methylation
regulation mechanism. In present study, we found that methyla-
tion profile of HERVWE1 transcriptional regulation region was
correlated with the alteration of one of the DNMT3b’s isoform,
DNMT3b3, indicating that some factors may control HERVWE1
expression through the modulation of methyltransferase enzymes.
The DNMT3b gene has 7 variants, the expression of which
depends on different post-transcription spliced patterns [35]. Due
to the lack of an intact catalytic domain, both 3b3 and 3b7 have
limited catalytic activity. Although some researchers have found
that DNMT3b variants have diverse expression profiles in cancer
tissues [36], the research on these variants and their function is
Figure 8. DNMTs transcript levels among discordant twins and singleton group. The values shown indicated the relative quantitation ofthe DNMT mRNAs, which were standardized to GAPDH (A) and b-actin (B), normalized to the singleton control group. The DNMT 3b3 mRNAdecreased and DNMT 3b7 mRNA increased in smaller discordant twin group compared with the larger discordant twin group and singleton group.doi:10.1371/journal.pone.0033503.g008
HERVWE1 Expression, Methylated Regulation in Twins
PLoS ONE | www.plosone.org 12 March 2012 | Volume 7 | Issue 3 | e33503

very limited [35,37,38]. DNMT3b3 is a more commonly expressed
variant, but its catalytic activity is controversial. We found that
DNMT3b3 transcript levels were lower in the smaller discordant
twin group. This result was consistent with the lower methylation
levels in the smaller discordant twin group. Without a complete
catalytic domain, DNMT3b7 theoretically has no enzymatic
activity. Furthermore, it can competitively bind to the enzyme’s
binding site on DNA. This mechanism might explain our finding
that DNMT3b7 levels increased in the hypomethylated smaller
discordant twin group. This result suggests that DNMT3b7 acts as
a negative regulator of methylation. Overall, the DNMT3b
variants’ tissue expression patterns and functions remain largely
unknown. Although our study showed an outline of the expression
of DNMTs in the placentas of discordant twins, and its potential
contributions to methylation regulation in HERVWE1, the
underneath mechanism is still unclear. Further experiments
should focus on normal placental tissue or trophoblast cell lines
to explore the relationship between these variants and their
functions in fetal growth and placental development.
ConclusionWe used discordant, monozygotic, dichorionic twins to study
HERVWE1 expression in the placenta and explore its potential
impact on fetal growth. We found that HERVWE1 transcript
expression was negatively correlated with infant birth weight in
discordant twins. HERVWE1 expression was increased in smaller
discordant twins to levels higher than those seen in normal-growth
twins and singletons. CG-site methylation in the HERVWE1
promoter region maybe a regulatory mechanism for suppressing
its expression in the monozygotic placenta. DNMT3b3 transcript
was positively correlated with methylation status in the HERVWE1
promoter region and its mechanism is worth to be investigated in
future study.
Supporting Information
Appendix Figure S1 Gene maps of zygosity identificationassay. There are 15 autosomal short tandem repeat loci and 1
gender locus. The name of each locus is marked above the allele.
Multiple alleles are possible at each locus. Each wave presents one
detectable allele. The serial number of each allele is labeled under
each wave. If all of the 16 loci are identical, then the two infants
are recognized as monozygotic twins. If any of the genotypes of the
16 loci are different, then the two infants are dizygotic twins. S1A
and S1B show two individual infants’ genotypes. They were
confirmed as monozygotic twins with identical genotypes at each
locus.
(TIF)
Appendix Figure S2 A schematic diagram of theHERVWE1 promoter region CG sites. The HERVWE1
gene is located at 7q21.2. This is an LTR (long terminal repeat)-
element-rich region. Each LTR includes U3 (white), R (dark grey),
and U5 (black) regions, in that order. The HERVWE1
transcriptional regulatory element is in the 59LTR U3 region
adjacent to an upstream regulatory element (URE) of composite
origin. The URE contains a trophoblast-specific enhancer (TSE,
light gray), which confers a high level of expression and placental
tropism. TSE and U3 are considered the key methylation and
transcriptional regulation control regions. These two regions
together are approximately 346 bp in length. There are 7 CG sites
in all, two of which are in the TSE; the other five are in the 59LTR
U3. The CAP transcription initiation site is located at the 59 end of
the R region. Taking the CAP transcription initiation site as the
zero point, the 7 CG sites are located at 2336 bp, 2307 bp,
2246 bp, 2208 bp, 2192 bp, 264 bp, and 243 bp. Our
methylation study was focused on the first five CG sites. The
target CpG dinucleotides are marked with vertical bars and circles.
(TIF)
Appendix Figure S3 Pyrograms. Two pyrograms of the same
sample. Because pyrosequencing can read through only 50–
100 bp for each accurate pyrosequencing primer, we used two
pyrosequencing primers to analyze the five CpG sites. The first
pyrosequencing primer was used to read the following sequence:
TTT TGG GGY GGG TTT TTT TTT TGG GAT GAG GGT
AAA AYG TTT GGA GAT ATA GTA ATT ATT TTG. The
second pyrosequencing primer was used to read the following
sequence: TAG TTG GAT TTT TTA GGT YGA TTA AGA
ATT TTT AAG TTT AGT TGG GAA GGT GAT TAY GTT
TAT TTT TAA ATA YGG GGT TTG TAA TTT AGT TTA
TAT TT. S3A shows the results using the first pyrosequencing
primer. The read out sequence was TTTTGGGGYGGGTTTT-
TTTTTTGGGATGAGGGTAAAAYGTTTGG. This was com-
pletely consistent with the targeted sequence. For the first CG site,
the C/(C+T) peak ratio was 24%. This result indicates that 24% of
CG sites were methylated overall. Similarly, for the second CG
site, the methylated cytosine fraction was 3% in total. S3B shows
the results using the second pyrosequencing primer. The read out
sequence was TAGTTGGATTTTTTAGGTYGATTAAGAAT-
TTTTAAGTTTAGTTGGGAAGGTGATTAYGTTTATTTT-
TAAATAYGGGGTTT. For the three CG sites, the methylated
cytosine levels were 28%, 22% and 18%, respectively.
(TIF)
Appendix Table S1 Primer Sequences. The detailed primer
sequences for real-time PCR and pyrosequencing assay.
(DOC)
Acknowledgments
We thank all of the laboratory staff at the Hoskins Center, Mercer
University, for their instruction and assistance.
Author Contributions
Conceived and designed the experiments: QF SWJ. Performed the
experiments: YG ZMH HYS MCL. Analyzed the data: YZ. Contributed
reagents/materials/analysis tools: ZLW YML LHH. Wrote the paper: YG
ZMH.
References
1. Guller S, Ma YY, Fu HH, Krikun G, Abrahams VM, et al. (2008) The placental
syncytium and the pathophysiology of preeclampsia and intrauterine growth
restriction: a novel assay to assess syncytial protein expression. Ann N Y Acad
Sci 1127: 129–133.
2. Dupressoir A, Heidmann T (2011) [Syncytins - Retroviral envelope genes
captured for the benefit of placental development.]. Med Sci 27: 163–169.
3. Noorali S, Rotar IC, Lewis C, Pestaner JP, Pace DG, et al. (2009) Role of
HERV-W syncytin-1 in placentation and maintenance of human pregnancy.
Appl Immunohistochem Mol Morphol 17: 319–328.
4. Potgens AJ, Drewlo S, Kokozidou M, Kaufmann P (2004) Syncytin: the major
regulator of trophoblast fusion? Recent developments and hypotheses on its
action. Hum Reprod Update 10: 487–496.
5. Cheng YH, Richardson BD, Hubert MA, Handwerger S (2004) Isolation and
characterization of the human syncytin gene promoter. Biol Reprod 70:
694–701.
6. Matouskova M, Blazkova J, Pajer P, Pavlicek A, Hejnar J (2006) CpG
methylation suppresses transcriptional activity of human syncytin-1 in non-
placental tissues. Exp Cell Res 312: 1011–1020.
HERVWE1 Expression, Methylated Regulation in Twins
PLoS ONE | www.plosone.org 13 March 2012 | Volume 7 | Issue 3 | e33503

7. Gimenez J, Montgiraud C, Oriol G, Pichon JP, Ruel K, et al. (2009)
Comparative methylation of ERVWE1/syncytin-1 and other human endoge-
nous retrovirus LTRs in placenta tissues. DNA Res 16: 195–211.
8. Ruebner M, Strissel PL, Langbein M, Fahlbusch F, Wachter DL, et al. (2010)
Impaired cell fusion and differentiation in placentae from patients with
intrauterine growth restriction correlate with reduced levels of HERV envelope
genes. J Mol Med 88: 1143–1156.
9. Langbein M, Strick R, Strissel PL, Vogt N, Parsch H, et al. (2008) Impaired
cytotrophoblast cell-cell fusion is associated with reduced Syncytin and increased
apoptosis in patients with placental dysfunction. Mol Reprod Dev 75: 175–183.
10. Hall JG (2003) Twinning. Lancet 362: 735–743.
11. Haque FN, Gottesman II, Wong AH (2009) Not really identical: epigenetic
differences in monozygotic twins and implications for twin studies in psychiatry.
Am J Med Genet C Semin Med Genet 151C: 136–141.
12. Kingdom JC, Nevo O, Murphy KE (2005) Discordant growth in twins. Prenatal
Diagn 25: 759–765.
13. Blickstein I, Kalish RB (2003) Birthweight discordance in multiple pregnancy.
Twin Res 6: 526–531.
14. Machin G (2009) Non-identical monozygotic twins, intermediate twin types,
zygosity testing, and the non-random nature of monozygotic twinning: a review.
Am J Med Genet C Semin Med Genet 151C: 110–127.
15. Benirschke K, Kaufmann P (2006) Pathology of the human placenta. New York:
Springer-Verlag. 871 p.
16. De Paepe ME, Shapiro S, Young L, Luks FI (2010) Placental characteristics of
selective birth weight discordance in diamniotic-monochorionic twin gestations.
Placenta 31: 380–386.
17. Machin G (2009) Non-identical monozygotic twins, intermediate twin types,
zygosity testing, and the non-random nature of monozygotic twinning: a review.
Am J Med Genet C Semin Med Genet 151C: 110–127.
18. Petronis A, Gottesman II, Kan P, Kennedy JL, Basile VS, et al. (2003)
Monozygotic twins exhibit numerous epigenetic differences: clues to twin
discordance? Schizophr Bull 29: 169–178.
19. Mill J, Dempster E, Caspi A, Williams B, Moffitt T, et al. (2006) Evidence for
monozygotic twin (MZ) discordance in methylation level at two CpG sites in the
promoter region of the catechol-O-methyltransferase (COMT) gene. Am J Med
Genet B Neuropsychiatr Genet 141B: 421–425.
20. Handunnetthi L, Handel AE, Ramagopalan SV (2010) Contribution of genetic,
epigenetic and transcriptomic differences to twin discordance in multiple
sclerosis. Expert Rev Neurother 10: 1379–1381.
21. Kuratomi G, Iwamoto K, Bundo M, Kusumi I, Kato N, et al. (2008) Aberrant
DNA methylation associated with bipolar disorder identified from discordant
monozygotic twins. Mol Psychiatry 13: 429–441.
22. Mastroeni D, McKee A, Grover A, Rogers J, Coleman PD (2009) Epigenetic
differences in cortical neurons from a pair of monozygotic twins discordant for
Alzheimer’s disease. PLoS One 4: e6617.
23. Baranzini SE, Mudge J, van Velkinburgh JC, Khankhanian P, Khrebtukova I, et
al. (2010) Genome, epigenome and RNA sequences of monozygotic twinsdiscordant for multiple sclerosis. Nature 464: 1351–1356.
24. Javierre BM, Fernandez AF, Richter J, Al-Shahrour F, Martin-Subero JI, et al.
(2010) Changes in the pattern of DNA methylation associate with twindiscordance in systemic lupus erythematosus. Genome Res 20: 170–179.
25. Fraga MF, Ballestar E, Paz MF, Ropero S, Setien F, et al. (2005) Epigeneticdifferences arise during the lifetime of monozygotic twins. Proc Natl Acad
Sci U S A 102: 10604–10609.
26. Alexander GR, Kogan M, Martin J, Papiernik E (1998) What are the fetalgrowth patterns of singletons, twins, and triplets in the United States? Clin
Obstet Gynecol 41: 114–125.27. Yinon Y, Mazkereth R, Rosentzweig N, Jarus-Hakak A, Schiff E, et al. (2005)
Growth restriction as a determinant of outcome in preterm discordant twins.Obstet Gynecol 105: 80–84.
28. Strick R, Ackermann S, Langbein M, Swiatek J, Schubert SW, et al. (2007)
Proliferation and cell-cell fusion of endometrial carcinoma are induced by thehuman endogenous retroviral syncytin-1 and regulated by TGF-beta. J Mol
Med 85: 23–38.29. Huppertz B, Gauster M, Orendi K, Konig J, Moser G (2009) Oxygen as
modulator of trophoblast invasion. J Anat 215: 14–20.
30. Robins JC, Heizer A, Hardiman A, Hubert M, Handwerger S (2007) Oxygentension directs the differentiation pathway of human cytotrophoblast cells.
Placenta 28: 1141–1146.31. Myatt L, Cui X (2004) Oxidative stress in the placenta. Histochem Cell Biol 122:
369–382.32. Freemark M (2010) Placental hormones and the control of fetal growth. J Clin
Endocrinol Metab 95: 2054–2057.
33. Okahara G, Matsubara S, Oda T, Sugimoto J, Jinno Y, et al. (2004) Expressionanalyses of human endogenous retroviruses (HERVs): tissue-specific and
developmental stage-dependent expression of HERVs. Genomics 84: 982–990.34. Smallwood A, Papageorghiou A, Nicolaides K, Alley MK, Jim A, et al. (2003)
Temporal regulation of the expression of syncytin (HERV-W), maternally
imprinted PEG10, and SGCE in human placenta. Biol Reprod 69: 286–293.35. Weisenberger DJ, Velicescu M, Cheng JC, Gonzales FA, Liang G, et al. (2004)
Role of the DNA methyltransferase variant DNMT3b3 in DNA methylation.Mol Cancer Res 2: 62–72.
36. Su X, Lv C, Qiao F, Qiu X, Huang W, et al. (2010) Expression pattern andclinical significance of DNA methyltransferase 3B variants in gastric carcinoma.
Oncol Rep 23: 819–826.
37. Aoki A, Suetake I, Miyagawa J, Fujio T, Chijiwa T, et al. (2001) Enzymaticproperties of de novo-type mouse DNA (cytosine-5) methyltransferases. Nucleic
Acids Res 29: 3506–3512.38. Chen T, Ueda Y, Dodge JE, Wang Z, Li E (2003) Establishment and
maintenance of genomic methylation patterns in mouse embryonic stem cells by
Dnmt3a and Dnmt3b. Mol Cell Biol 23: 5594–5605.
HERVWE1 Expression, Methylated Regulation in Twins
PLoS ONE | www.plosone.org 14 March 2012 | Volume 7 | Issue 3 | e33503


