Embed Size (px)
Citation preview

Increasing Plasma MembranePhosphatidylinositol(4,5)Bisphosphate Biosynthesis IncreasesPhosphoinositide Metabolism in Nicotiana tabacum W OA
Yang Ju Im,a Imara Y. Perera,a Irena Brglez,a Amanda J. Davis,a Jill Stevenson-Paulik,b,1 Brian Q. Phillippy,a
Eva Johannes,a Nina S. Allen,a and Wendy F. Bossa,2
a Department of Plant Biology, North Carolina State University, Raleigh, North Carolina 27695b Department of Pharmacology and Cancer Biology, Howard Hughes Medical Institute, Duke University Medical Center,
Durham, North Carolina 27710
A genetic approach was used to increase phosphatidylinositol(4,5)bisphosphate [PtdIns(4,5)P2 ] biosynthesis and test the
hypothesis that PtdInsP kinase (PIPK) is flux limiting in the plant phosphoinositide (PI) pathway. Expressing human PIPKIa in
tobacco (Nicotiana tabacum) cells increased plasma membrane PtdIns(4,5)P2 100-fold. In vivo studies revealed that the rate
of 32Pi incorporation into whole-cell PtdIns(4,5)P2 increased >12-fold, and the ratio of [3H]PtdInsP2 to [3H]PtdInsP increased
6-fold, but PtdInsP levels did not decrease, indicating that PtdInsP biosynthesis was not limiting. Both [3H]inositol
trisphosphate and [3H]inositol hexakisphosphate increased 3-and 1.5-fold, respectively, in the transgenic lines after 18 h of
labeling. The inositol(1,4,5)trisphosphate [Ins(1,4,5)P3] binding assay showed that total cellular Ins(1,4,5)P3/g fresh weight
was >40-fold higher in transgenic tobacco lines; however, even with this high steady state level of Ins(1,4,5)P3, the pathway
was not saturated. Stimulating transgenic cells with hyperosmotic stress led to another 2-fold increase, suggesting that the
transgenic cells were in a constant state of PI stimulation. Furthermore, expressing Hs PIPKIa increased sugar use and
oxygen uptake. Our results demonstrate that PIPK is flux limiting and that this high rate of PI metabolism increased the
energy demands in these cells.
INTRODUCTION
Inositol phospholipids are important for both sensing and re-
sponding to various stimuli in plants and animal cells. For
example, phosphatidylinositol(4,5)bisphosphate [PtdIns(4,5)P2]
is the source of the second messenger inositol(1,4,5)trisphos-
phate [Ins(1,4,5)P3], and it can directly affect the activity of
membrane proteins, regulate cytoskeletal structure, and affect
vesicle trafficking (for review, see Stevenson et al., 1998; Meijer
and Munnik, 2003; Van Leeuwen et al., 2004). However, a long-
standing mystery for plant scientists studying phosphoinositide
(PI) signaling has been the low relative amount of PtdIns(4,5)P2 in
all terrestrial plants studied thus far (Gross and Boss, 1993;
Munnik et al., 1998; Stevenson et al., 1998; Drøbak et al., 1999).
The ratio of [3H]inositol-labeled PtdIns(4)P to PtdIns(4,5)P2 is
usually on the order of 10:1, which is high compared with the 1:1
and 1:2 ratios characteristic of rapidly responding animal cells
(Adel-Latif et al., 1985; Cunningham et al., 1995). The relatively low
steady state level of PtdIns(4,5)P2 in plants could result from a low
rate of phosphorylation of PtdIns(4)P by PtdIns(4)P 5-kinase to
form PtdIns(4,5)P2 or from rapid hydrolysis by phospholipase C
(PLC) or dephosphorylation by a phosphatase (Drøbak et al., 1999;
Pical etal., 1999; Stevenson etal., 2000;Berdy etal., 2001; DeWald
et al., 2001; Burnette et al., 2003; Hunt et al., 2003; Ercetin and
Gillaspy, 2004; Zhong et al., 2004; Williams et al., 2005).
A clue as to the differences in plant and animal PI signaling
came from studies of lipid kinase activities in membranes
isolated from rats and plants (Sandelius and Sommarin, 1990).
These early experiments revealed that rat plasma membranes
had 20-fold higher specific activity relative to soybean (Glycine
max) hypocotyl or wheat (Triticum aestivum) shoot plasma
membranes. More recently, plant genes have been cloned and
expressed as recombinant proteins for biochemical character-
ization (Mikami et al., 1998; Elge et al., 2001; Westergren et al.,
2001; Perera et al., 2005). A kinetic analysis of two isoforms of
Arabidopsis thaliana PtdInsP kinases (At PIPK1 and At PIPK10)
indicated that the plant enzymes were significantly less active
(Vmax/Km of 20- to 200-fold less, respectively) compared with the
human enzyme, Hs PIPKIa (Perera et al., 2005).
A unique feature of plant type I PIPKs is the presence of sev-
eral MORN motifs in the N-terminal region of the protein. The
N-terminal MORN domain is critical for regulating PIPK activity,
and it affects membrane attachment in vivo (Im et al., 2007).
Furthermore, PtdInsP kinase activity is regulated by protein
phosphorylation (Westergren et al., 2001). These results clearly
indicate that PtdInsP2 synthesis in plants is under tight control.
1 Current address: BASF Plant Science, 26 Davis Dr., Research TrianglePark, NC 27709.2 To whom correspondence should be addressed. E-mail [email protected]; fax 919-515-3436.The author responsible for distribution of materials integral to thefindings presented in this article in accordance with the policy describedin the Instructions for Authors (www.plantcell.org) is: Wendy F. Boss([email protected]).W Online version contains Web-only data.OA Open Access articles can be viewed online without a subscription.www.plantcell.org/cgi/doi/10.1105/tpc.107.051367
The Plant Cell, Vol. 19: 1603–1616, May 2007, www.plantcell.org ª 2007 American Society of Plant Biologists
It is also evident that maintaining normal/adequate PtdInsP2
levels is important for different aspects of plant growth and
development. For example, a continuous supply of PtdIns(4,5)P2
mediated through PtdIns 4-kinase or lipid transfer proteins is
essential for normal root hair growth (Vincent et al., 2005; Preuss
et al., 2006). Furthermore, the PI phosphatase sac9 mutant
had 4-fold higher PtdInsP2 levels in root tissue and decreased
primary and lateral root growth (Williams et al., 2005). An
Arabidopsis PIPK mutant pip5k9-d (which has a mutation in the
39 untranslated region of the gene, resulting in increased transcript
levels) showed reduced primary root growth (Lou et al., 2007);
however, it was not reported whether these changes were a result
of changes in PtdInsP2 levels. Finally, tip growth in pollen tubes
is also dependant on PtdInsP2 turnover (Dowd et al., 2006; Helling
et al., 2006). These data suggest that the PI pathway is important
for membrane trafficking and plasma membrane biogenesis.
In previous work, we found that plant cells transformed with the
human type I InsP 5-phosphatase [which increased the rate of
turnover of Ins(1,4,5)P3] showed increased endogenous PIPK
activity. However, PLC activity was not altered (Perera et al.,
2002).These results led to the hypothesis that the phosphorylation
of PtdIns(4)P by PtdIns(4)P 5-kinase is a flux-limiting step in the
plant PI pathway. To test this hypothesis, we have taken a
synthetic biology approach. Using a well-characterized model
plant system with relatively low PtdIns(4,5)P2, tobacco (Nicotiana
tabacum) cells grown in suspension culture (Perera et al., 2002),
we expressed a human PtdIns(4)P 5-kinase gene, Hs PIPKIa. We
chose Hs PIPKIa because At PIPK1 and 10, the plant PIPKs
characterized thus far, are much less active than Hs PIPKIa
(Perera et al., 2005) and because Hs PIPKIa is a type I family PIPK
(Kunz et al., 2000, 2002), which is functionally similar to the plant
PIPKs (Mueller-Roeber and Pical, 2002). Importantly, Hs PIPKIa
lacks MORN motifs; therefore, expressing Hs PIPKIa would
increase PIPK activity without affecting MORN motif-interacting
partners of At PIPK1-9. For comparison to the human enzyme, we
have expressed At PIPK10, which does not contain MORN motifs.
In this article, we show that expressing Hs PIPKIa increases
the plasma membrane PtdIns(4,5)P2 100-fold and generates a
steady state increase in Ins(1,4,5)P3 that is similar to what is
experienced transiently upon stimulation in nontransformed
cells. These insights reveal the impact of increased PtdInsP2
biosynthesis on cellular metabolism. Because the transgenic
cells are in a constant state of PI stimulation, they provide a good
model for studying PI signaling.
RESULTS
Expression of PIPKs in Tobacco Cells
Vector constructs with either green fluorescent protein (GFP)-Hs
PIPKIa, GFP-At PIPK10, or GFP alone were used for Agro-
bacterium tumefaciens–mediated transformation of the wild-
type tobacco (NT-1) cells as previously described (Perera
et al., 2002). Three independent lines producing GFP-Hs PIPKIa
and GFP-At PIPK10 (hereafter referred to as Hs PIPKIa and At
PIPK10) along with a GFP control line were selected for further
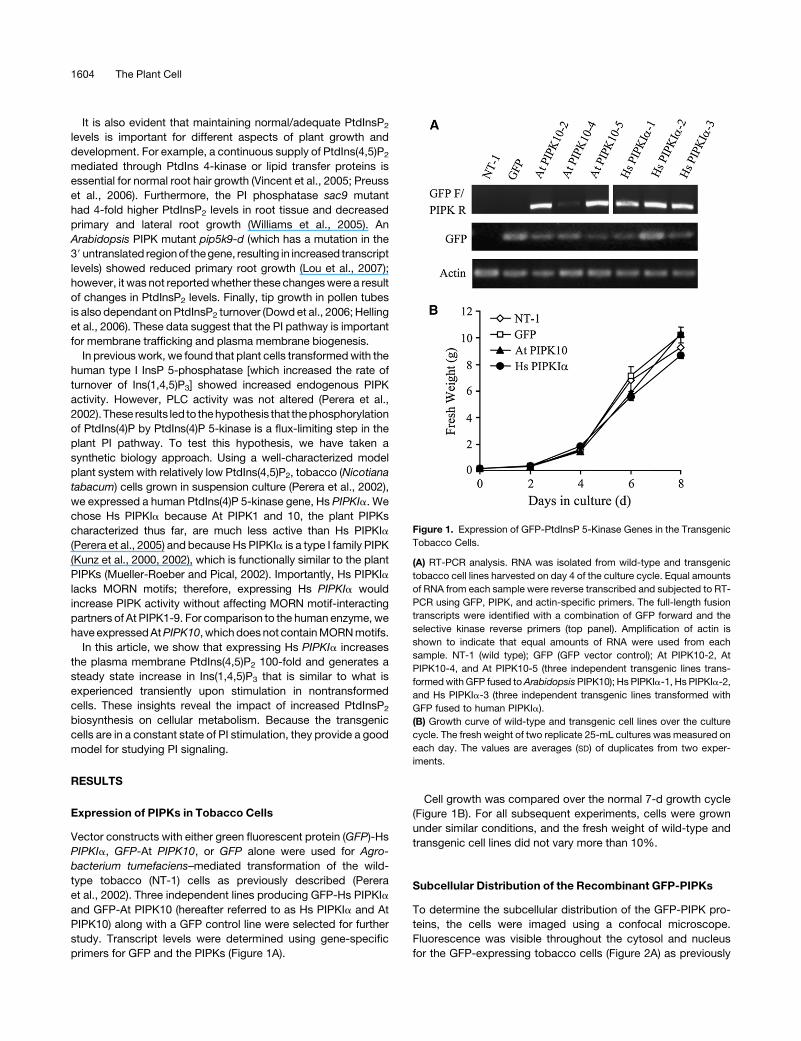
study. Transcript levels were determined using gene-specific
primers for GFP and the PIPKs (Figure 1A).
Cell growth was compared over the normal 7-d growth cycle
(Figure 1B). For all subsequent experiments, cells were grown
under similar conditions, and the fresh weight of wild-type and
transgenic cell lines did not vary more than 10%.
Subcellular Distribution of the Recombinant GFP-PIPKs
To determine the subcellular distribution of the GFP-PIPK pro-
teins, the cells were imaged using a confocal microscope.
Fluorescence was visible throughout the cytosol and nucleus
for the GFP-expressing tobacco cells (Figure 2A) as previously
Figure 1. Expression of GFP-PtdInsP 5-Kinase Genes in the Transgenic
Tobacco Cells.
(A) RT-PCR analysis. RNA was isolated from wild-type and transgenic
tobacco cell lines harvested on day 4 of the culture cycle. Equal amounts
of RNA from each sample were reverse transcribed and subjected to RT-
PCR using GFP, PIPK, and actin-specific primers. The full-length fusion
transcripts were identified with a combination of GFP forward and the
selective kinase reverse primers (top panel). Amplification of actin is
shown to indicate that equal amounts of RNA were used from each
sample. NT-1 (wild type); GFP (GFP vector control); At PIPK10-2, At
PIPK10-4, and At PIPK10-5 (three independent transgenic lines trans-
formed with GFP fused to Arabidopsis PIPK10); Hs PIPKIa-1, Hs PIPKIa-2,
and Hs PIPKIa-3 (three independent transgenic lines transformed with
GFP fused to human PIPKIa).
(B) Growth curve of wild-type and transgenic cell lines over the culture
cycle. The fresh weight of two replicate 25-mL cultures was measured on
each day. The values are averages (SD) of duplicates from two exper-
iments.
1604 The Plant Cell

described (Haseloff and Amos, 1995; Persson et al., 2002). By
contrast, At PIPK10 was detected throughout the cytoplasmic
strands but not in the nucleus (Figure 2B), and Hs PIPKIa was
associated with the plasma membrane of the tobacco cells
(Figure 2C; see Supplemental Video 1 online). To confirm plasma
membrane localization of Hs PIPKIa, tobacco cells were treated
with 0.6 osmolal sorbitol for 5 min (Figure 2D). Note the fluores-
cence remains with the plasma membrane and can be seen on
the Hechtian threads, plasma membrane extensions that remain
tightly associated with the cell wall (indicated by the arrows in
Figure 2D and in Supplemental Video 2 online).
Immunoblot analysis of proteins isolated from 4-d-old tobacco
cells visualized with antiserum recognizing the GFP tag is shown
in Figure 2E. Membranes were isolated by aqueous two-phase
partitioning and proteins separated by gel electrophoresis.
Hs PIPKIa was detected at the predicted size of the protein
(;90 kD) in the plasma membrane fraction and not in the lower
phase membrane fraction by aqueous two-phase partitioning.
These data confirmed that Hs PIPKIa was localized to the
plasma membrane. Unlike Hs PIPKIa, At PIPK10 could not be
detected by immunoblotting from a soluble, plasma membrane
or lower-phase membrane fraction probably due to the low abun-
dance of expressed protein (data not shown).
Expressing the PIPKs Increased PtdInsP 5-Kinase
Activity and PtdIns(4,5)P2
To determine whether expression of the At PIPK10 or Hs PIPKIa
increased PtdInsP 5-kinase activity in tobacco cells, we first
measured the plasma membrane lipid kinase activity in vitro.
Two- to 3-fold more [32P]PtdIns(4,5)P2 was formed by mem-
branes from two independent Hs PIPKIa lines even without
adding exogenous PtdIns(4)P (Figure 3A). These data indicate
that PtdIns(4)P was not limiting in the transgenic lines and that
the human enzyme could phosphorylate the endogenous plant
lipids. When PtdIns(4)P was added in excess, the specific activity
of the isolated plasma membranes was 100-fold greater in the Hs
PIPKIa lines and 1.5- to 2-fold greater in the At PIPK10 lines
compared with the untransformed NT-1 plasma membranes
(Figure 3B).
Plant plasma membrane PtdInsP 5-kinase activity was re-
ported previously to cosediment with the F-actin pellet isolated
from carrot (Daucus carota) plasma membranes (Tan and Boss,
1992), and At PIPK1 has been shown to bind actin directly (Davis
et al., 2007). With the wild-type tobacco cells, 66% 6 6% of the
Figure 2. Full-Length GFP-Hs PIPKIa Localized with the Plasma Mem-
brane.
(A) to (C) Transgenic tobacco cells expressing GFP (A) and GFP-At
PIPK10 (B), and GFP-Hs PIPKIa (C) were imaged using a confocal
microscope. Top panels show fluorescence, and bottom panels show
differential interference contrast images.
(D) To confirm plasma membrane localization of Hs PIPKIa, tobacco
cells were treated with 0.6 osmolal sorbitol for 5 min. Arrows indicate the
position of the cell wall.
(E) Immunoblot of plasma membrane (PM) and lower-phase (LP) proteins
using a monoclonal antibody raised against GFP. The antiserum recog-
nizes a protein of ;90 kD (the predicted molecular weight of GFP-Hs
PIPKIa) and a lower band that may be a proteolytic product in the plasma
membrane of Hs PIPKIa cells. Equal amounts of membrane proteins
were loaded from NT-1 (wild-type tobacco cells) and Hs (GFP-Hs PIPKIa
lines).
Increasing Phosphoinositide Signaling 1605

total plasma membrane PtdInsP 5-kinase activity cosedimented
with the 20,000g F-actin pellet. However, of the plasma membrane
PtdInsP 5-kinase activity from the Hs PIPKIa lines, 95% 6 8% was
recovered in the detergent-soluble fraction and only 5% 6 1%
sedimented with 20,000g F-actin pellet (Figure 3C). The fact that Hs
PIPKIa did not cosediment with large F-actin bundles results from
both the lack of the appropriate actin binding proteins necessary to
form an Hs PIPKIa-actin scaffold and the inability of Hs PIPKIa to
directly bind actin (Davis et al., 2007). The data confirm that Hs
PIPKIa is associated with the plasma membrane and suggest that
overproducing Hs PIPKIa should result in increased PtdIns(4,5)P2
in the plasma membrane, unless catabolism by PLC or a lipid
phosphatase is greater than the rate of synthesis.
To monitor endogenous levels of PtdIns(4,5)P2 in the plasma
membrane of transgenic tobacco cells in vivo, we used mass
measurement. For these analyses, lipids were extracted from
isolated plasma membranes from wild-type and Hs PIPKIa lines,
the head group was hydrolyzed, and the total Ins(1,4,5)P3 re-
leased was monitored using the Ins(1,4,5)P3 binding assay. The
plasma membrane PtdIns(4,5)P2 from the Hs PIPKIa lines in-
creased >100-fold per mg membrane protein, from ;10 to 1000
pmol�mg protein (Figure 3D).
We also monitored steady state levels of the major phospho-
lipids in the plasma membrane (Figure 4). Plasma membrane–
enriched fractions were isolated from 4-d-old wild-type and
transgenic tobacco cells and subjected to lipid extraction and
profiling as described by Welti et al. (2002). The major structural
lipids of the membrane, such as PtdGro, PtdEtn, PtdIns, PtdCho,
and PtdSer, were not significantly different between wild-type
and Hs PIPKIa cells. The most significant difference was the
Figure 3. Plasma Membrane PtdInsP 5-Kinase–Specific Activity and PtdIns(4,5)P2 Levels Increased >100-Fold in Hs PIPKIa Lines and Was Not
Associated with Actin.
(A) and (B) The plasma membrane (PM)–enriched fraction from wild-type and two different lines of transgenic tobacco cells were analyzed for PtdInsP
5-kinase activity without (A) and with (B) added substrate, PtdIns(4)P.
(C) The PtdInsP 5-kinase activity recovered with F-actin polymerized and recovered in a 20,000g pellet from the plasma membrane of NT-1 and Hs
PIPKIa lines was compared.
(D) Mass measurements of plasma membrane PtdIns(4,5)P2 levels of wild-type and Hs PIPKIa lines. The values plotted are the averages 6 SD of two to
three independent experiments assayed in duplicate. Note the data in (B) and (D) are plotted on a log scale.
1606 The Plant Cell

;1.8-fold increase in PtdOH in the Hs PIPKIa cells. In addition to
the phospholipids, the plasma membrane digalactosyldiacylgly-
cerol and monogalactosyldiacylglycerol levels were decreased
by ;30% in the Hs PIPKIa cells compared with the wild type.
Increased Turnover of PI Pathway Intermediates and
Increased Rate of PtdInsP2 Synthesis in Vivo
To monitor the levels of intermediates in the PI pathway, tobacco
cells were labeled in vivo with [3H]inositol (Table 1). Even though
20% of [3H]inositol can be incorporated into pectin and other cell
wall polysaccharides (Verma and Maclachlan, 1976), in vivo
labeling will give a relative measure of pool sizes for the major
components of the PI pathway. The ratio of PtdIns(4)P to
PtdIns(4,5)P2 in wild-type tobacco cells was $10:1. Expression
of Hs PIPKIa increased the total cellular [3H]PtdIns(4,5)P2, and
the ratio of [3H]PtdIns(4)P to [3H]PtdIns(4,5)P2 decreased to 2:1
without decreasing the total [3H]PtdIns(4)P. Analysis of the
glycerophosphoinositol head groups confirmed the presence
PtdIns4P and PtdIns(4,5)P2 (see Supplemental Figure 1 online).
These data indicate that the PtdIns(4)P pool can be maintained at
an adequate level to meet the demands of the increased
PtdIns(4,5)P2 biosynthesis. It also supports the hypothesis that
under normal conditions, PIPK activity is a flux-limiting step in the
PI pathway of the wild-type cells.
The rate of [32P]PtdIns(4,5)P2 biosynthesis in vivo was mea-
sured by adding 32Pi to 4-d-old transgenic Hs PIPKIa and wild-
type tobacco cells preequilibrated in conditioned medium. Cells
were harvested at each time point, and whole-cell lipids were
extracted and separated by thin layer chromatography (TLC)
(Figure 5A). Typically, little [32P]PtdIns(4,5)P2 was detected in
the nontransformed cells. The incorporation of 32Pi into PtdIns(4,5)
P2 in Hs PIPKIa lines was 12-fold higher than wild-type cells
(Figure 5B) and saturated by 4 min when calculated as total [32P]-
labeled lipids. The incorporation of 32Pi into PtdInsP was ;20%
less in Hs PIPKIa lines when calculated as percentage total [32P]-
labeled lipids (Figure 5C). This reflects the high percentage of
[32P]PtdIns(4,5)P2 and the rapid conversion of [32P]PtdInsP to
[32P]PtdIns(4,5)P2. Comparison of these data with long-term [3H]
labeling indicates that de novo synthesis of [3H]PtdInsP from
intracellular pools was adequate to sustain [3H] PtdIns(4,5)P2
biosynthesis.
As expected, in both cell lines, the [32P]PtdInsP decreased
with time as the total percentage of [32P]-labeled phospholipids
because of the increased incorporation of [32P] into PtdCho and
PtdEtn. The observation that similar amounts of whole-cell
[32P]PtdOH formed in all lines (Figure 5D) is a good indication
that the cells were not stressed during the labeling (Welti et al.,
2002) and that the increases in 32Pi incorporation were specific
for PtdIns(4,5)P2.
Expressing the PIPKs Increased the Steady
State Ins(1,4,5)P3
To determine whether increasing the rate of synthesis and the
total mass of PtdIns(4,5)P2 in the plasma membranes would
affect the total cellular Ins(1,4,5)P3, Ins(1,4,5)P3 levels were
measured in wild-type and PIPK transgenic lines using the
Figure 4. Polar Lipid Classes (Mol % of Total Polar Glycerolipids
Analyzed) in the Plasma Membrane of Wild-Type and Hs PIPKIa Lines.
The major phospholipid classes (phosphatidylcholine [PtdCho], phos-
phatidylethanolamine [PtdEtn], phosphatidylglycerol [PtdGro], and
phosphatidylinositol [PtdIns]), galactolipid classes (monogalactosyldia-
cylglycerol [MGDG] and digalactosyldiacylglycerol [DGDG]), and minor
phospholipid classes (phosphatidylserine [PtdSer] and phosphatidic
acid [PtdOH]) were present. Values are average 6 SE of duplicates
from three independent experiments. Open bars, wild-type lines; closed
bars, Hs PIPKIa lines.
Table 1. Analysis of the [3H] Inositol Lipids from Wild-Type (NT-1) and Transgenic Tobacco Cells Expressing PIPKs
Cell Type
[3H] Inositol–Labeled Phospholipids
(Percentage of Total [3H] Lipid Recovered) Ratio
PtdIns PtdInsP PtdInsP2 PtdInsP/PtdInsP2
NT-1 91 6 0.9 2.7 6 0.9 0.24 6 0.09 12:1
GFP 89 6 1.2 3.0 6 0.7 0.20 6 0.07 15:1
At PIPK10 88 6 1.2 3.2 6 0.5 0.27 6 0.06 12:1
Hs PIPKIa 87 6 1.5 2.4 6 0.5 1.70 6 0.90 2:1
Tobacco cells were labeled in vivo with myo-[2-3H]inositol for 24 h, and the lipids were extracted and separated by TLC. The values for [3H] labeled
PtdIns, PtdInsP, and PtdInsP2 are the percentage of total radioactivity recovered (averages 6 SD of two independent experiments assayed in
duplicate).
Increasing Phosphoinositide Signaling 1607

Ins(1,4,5)P3 binding assay (Table 2). In the Hs PIPKIa lines, the
cellular Ins(1,4,5)P3 was >40-fold higher than that of the wild-type
lines, and in the At PIPK10 lines, the total cellular Ins(1,4,5)P3 was
1.5- to 2-fold higher based on the Ins(1,4,5)P3 binding assay.
When the cells were stimulated by a hyperosmotic stress of 0.6
osmolal sorbitol, the total Ins(1,4,5)P3 was higher in all cell lines
(Table 2). Ins(1,4,5)P3 levels in the unstimulated Hs PIPKIa lines
were in a similar range to those of the stimulated nontransformed
lines. In spite of these high levels, the Ins(1,4,5)P3 increased >2.5-
fold when the Hs PIPKIa lines were stimulated. These data
indicated that the capacity to hydrolyze PtdIns(4,5)P2 by PLC was
not saturated in the Hs PIPKIa lines and indicate that the cells are
in a continuously stimulated state with regard to PI signaling.
To compare the relative levels of [3H]inositol phosphates, cells
were labeled with myo-[2-3H]inositol for 18 h, and water-soluble
inositol phosphates were extracted and separated by HPLC. In
addition to the increase in [3H]InsP3, [3H]InsP6 also was signif-
icantly higher in the Hs PIPKIa lines (Table 3).
Cells with Increased PI Turnover Require More
Calcium to Grow
The increased flux through the PI pathway and constantly high
Ins(1,4,5)P3 in the Hs PIPKIa lines should mobilize and may
deplete the intracellular calcium stores. If the calcium stores
were depleted, it might be expected that the Hs PIPKIa cells
would grow less in medium with low calcium since calcium is
essential for growth (Persson et al., 2001; Wu et al., 2002; Cheng
et al., 2005). Cell growth was compared over the growth cycle in
culture medium lacking calcium. While wild-type NT-1 cells grow
Figure 5. In Vivo Labeling with 32Pi Indicates a Rapid Rate of [32P]PtdInsP2 Biosynthesis in the Hs PIPK1a Lines.
All cells were preequilibrated in conditioned medium for 30 min; 32Pi was added, cells were harvested, and lipids were extracted at the time points
indicated. The lipids were separated by TLC, and 32P-labeled lipids were quantified with a Bioscan imaging scanner.
(A) Representative autoradiogram of the TLC plate.
(B) to (D) 32P recovered phospholipids (PtdInsP2, PtdInsP, and PtdOH, respectively) over the time course (wild type, open diamonds; Hs PIPKIa lines,
closed circles). The data are reported as percentage of total cpm recovered per lane. Each point is the average 6 SD of duplicates from three
independent experiments.
1608 The Plant Cell

less without added calcium in the medium (compared with
normal medium, Figure 1B, which contains 3 mM Ca2þ), the Hs
PIPKIa cells did not grow at all without added Ca2þ (Figure 6A).
These data suggested that the Hs PIPKIa cells lacked the
calcium reserves of the wild-type cells.
The endoplasmic reticulum (ER) chaperones and calcium
binding proteins, calreticulin (CRT) and binding protein (BiP),
will bind endogenous calcium (Lievremont et al., 1997; Michalak
et al., 1999). There was a significant increase in both CRT and BiP
in the Hs PIPKIa lines in cells grown in normal medium with 3 mM
calcium (Figure 6B). CRT increases with ER stress and when
overproduced will increase ER-Ca2þ stores (Michalak et al.,
1999; Persson et al., 2001; Akesson et al., 2005). The fact that the
Hs PIPKIa lines did not grow on low Ca2þmedium suggests that
they had low not high Ca2þ reserves (Wu et al., 2002; Cheng
et al., 2005) and that the increase in CRT reflects an effort by the
cells to bind and retain the remaining Ca2þ against the constant
stimulus.
In vitro assays indicated that both ER and mitochondrial
fractions from the Hs PIPKIa cells showed a 2-fold increase in
[45Ca2þ] uptake compared with the wild-type cells (Figure 6C;
see Supplemental Figure 2A online). The enhanced uptake in the
in vitro assays is consistent with the depletion of endogenous
stored Ca2þ (i.e., increased number of available Ca2þ binding
sites). After 20 min when [45Ca2þ] uptake reached equilibrium,
the Ca2þ/Hþ ionophore, ionomycin, was added to the mem-
branes to release the ER-accumulated Ca2þ pool. As seen in
Figure 6D, the ionomycin-released Ca2þ was ;2.5 to 3-fold
higher in Hs PIPKIa cells compared with the wild type. This
increase in ionomycin-releasable Ca2þ is similar to that observed
when CRT was overexpressed in NT-1 cells and is consistent
with Ca2þ binding to the low-affinity binding sites on CRT
(Persson et al., 2001).
An increase in Ca2þ flux also was detected in in vivo labeling
studies using whole cells. If exposed to [45Ca2þ], the Hs PIPKIa
cells took up slightly more [45Ca2þ] than wild-type cells (see
Supplemental Figure 2B online). The growth study and [45Ca2þ]
data indicate that while the Hs PIPKIa cells have increased their
capacity to store calcium, because of the constitutively high
levels of InsP3, there will be a net efflux of Ca2þ and the cells
require more exogenous calcium to survive.
We were unable to detect significant differences in cytosolic
free calcium in whole cells using Indo-1 to monitor free calcium
(see Supplemental Figure 3 online). When we measured total
cellular Ca2þ using inductively coupled plasma (ICP) emission
spectrometry, the Hs PIPKIa cells had 15.7% 6 1.1% and
15.6% 6 6.8% less Ca2þ per g dry weight at 4 and 6 d, respec-
tively, compared with the NT-1 cells (values are the average of
four numbers from two experiments). The combination of in vitro
and in vivo measurements makes a compelling argument that
the increase in PI metabolism in the Hs PIPKIa cells has in-
creased the flux of Ca2þ, resulting in a net loss of cellular Ca2þ
and depletion of intracellular stores.
Increasing the Flux through the PI Pathway Increases
Basal Metabolism
PtdIns(4,5)P2 biosynthesis from PtdIns requires two molecules
of ATP; therefore, rapid turnover of the PI pathway should in-
crease the demand for ATP (Poggioli et al., 1983; Yeung et al.,
2006). In addition, InsP6 may be synthesized in plants by multiple
routes that require ATP (Brearley and Hanke, 1996; Phillippy,
1998; Raboy, 2001; Stevenson-Paulik et al., 2002). Our in vivo
labeling data provide support for the sequential phosphorylation
of Ins(1,4,5)P3 to Ins(1,2,3,4,5,6)P6. This increased demand for
ATP and an increased demand for energy as a result of increased
Ca2þ flux should increase respiration in the transgenic tobacco
cells. To monitor respiration in vivo, we used a Clarke oxygen
electrode and measured oxygen uptake over time. As shown in
Table 4, oxygen uptake by whole cells increased 40% in the Hs
PIPKIa line. Although the trend was consistently higher, the
increase in oxygen uptake in the At PIPK10 line was not statis-
tically significant when averaged between experiments. With all
cell lines, O2 uptake was completely inhibited by iodoacetate, a
general inhibitor that also inhibits glycolysis (data not shown).
Table 2. Basal Ins(1,4,5)P3 Was >40-Fold Higher in the Hs PIPKIa Cells and Increased Further in Response to Osmotic Stress
Cell Type Control (pmol InsP3/g FW) Osmotic Stress (pmol InsP3/g FW) Fold Increase in InsP3
NT-1 139 6 57 3,099 6 366 25.5 6 11.0
GFP 138 6 47 4,336 6 327 34.6 6 6.0
At PIPK10-4 328 6 125 3,252 6 1,145 10.1 6 0.5
At PIPK10-5 239 6 4 2,442 6 229 10.2 6 3.0
Hs PIPKIa-2 6,457 6 1,692 16,679 6 4,598 2.6 6 0.1
Hs PIPKIa-3 5,260 6 106 13,427 6 4,893 3.7 6 1.4
Cells (0.25 g fresh weight [FW]) were preequilibrated in 5 mL of conditioned medium and harvested at time zero (control) and 15 min after adding 0.6
osmolal sorbitol. Ins(1,4,5)P3 was quantified using the Ins(1,4,5)P3 binding assay. Data are the averages 6 SD from three separate experiments.
Table 3. Hs PIPKIa Lines Produced More [3H]InsPxs
Cell Type
[3H] Inositol Phosphates (Percentage of Total [3H]InsPx
Recovered from Water-Soluble Fraction)
InsP2 InsP3 InsP5 InsP6
NT-1 8.1 6 0.2 0.6 6 0.1 0.7 6 0.3 6.4 6 0.2
GFP 7.3 6 0.3 0.7 6 0.2 1.2 6 0.4 6.6 6 0.3
Hs PIPKIa 6.7 6 0.7 2.0 6 0.3 1.1 6 0.7 9.4 6 1.0
To analyze the inositol phosphates from wild-type (NT-1) and transgenic
cell lines, tobacco cells were labeled in vivo with myo-[2-3H]inositol for
18 h, and the water-soluble inositol phosphates were separated by
HPLC and analyzed. [3H]InsP4 was not detected.
Increasing Phosphoinositide Signaling 1609

Figure 6. Hs PIPKIa Lines Did Not Grow in Medium with No Added Calcium and Showed Signs of Changes in Calcium Homeostasis.
(A) Cells (0.25 g/fresh weight) were transferred to 25 mL of fresh medium without added calcium, and fresh weight was monitored every 2 d (wild type,
open diamonds; Hs PIPKIa lines, closed circles). The values are averages 6 SD of duplicates from two experiments.
(B) Hs PIPKIa cells have increased CRT and BiP. Microsomal membranes (Mic) and cytosolic (Cyt) proteins were prepared from indicated cell lines, and
10 and 30 mg of protein were separated by SDS-PAGE as noted. The calcium binding proteins CRT and BiP were detected with antibodies by
immunoblotting as indicated.
(C) Increased Ca2þ uptake in ER from Hs PIPK Ia cells. ER-enriched membrane vesicles were prepared from the wild type (triangles) and Hs PIPK Ia
(circles) as previously described (Persson et al., 2001). [45Ca2þ] (2 mCi) was added, and uptake was monitored. The ATP-dependent [45Ca2þ] uptake (10
mg protein aliquot�1) was measured in the presence (closed symbols) and absence (open symbols) of 3 mM ATP. The radioactivity was measured in a
scintillation counter. Data are averages 6 SD of duplicates from two independent experiments.
(D) Hs PIPK Ia cells released more ER [45Ca2þ]. The Ca2þ ionophore ionomycin (1.5 mM) was added to [45Ca2þ]-loaded ER-enriched membrane vesicles
(23 min), and membrane vesicles were analyzed for [45Ca2þ] after 5 min. Closed bars, [45Ca2þ] released; open bars, [45Ca2þ] retained by the ER-enriched
membranes. The values are averages 6 SD of duplicates from two experiments.
1610 The Plant Cell

The mitochondria of the wild-type and transgenic cells were
visualized with Rhodamine 123 (see Supplemental Figure 4
online). There was no marked increase in the number of mito-
chondria and no difference in O2 uptake of isolated mitochondria
(data not shown). Based on these observations, we hypothe-
sized that the rate of glycolysis increased in the Hs PIPKIa line
due to the increased PtdIns(4,5)P2 biosynthesis. If this were true,
then the Hs PIPKIa line should use up the sugar from the culture
medium faster. Analysis of the sugar in the culture medium
supported this hypothesis. At day 6, there was half as much
sugar remaining in the medium of the Hs PIPKIa lines compared
with wild-type and GFP control lines (Table 5).
DISCUSSION
Our first goal was to test the hypothesis that phosphorylation of
PtdIns(4)P to form PtdIns(4,5)P2 by a PtdIns(4)P 5-kinase is a
limiting step in plant PI metabolism. We showed that even though
PtdIns(4)P is present and can be phosphorylated, the endoge-
nous plant PIPKs are not as effective as the animal enzyme and
that these differences are the main reason for the high ratio of
PtdIns(4)P to PtdIns(4,5)P2 found in terrestrial plants.
Our second goal was to increase the flux through the PI
pathway to characterize the impact of increased PI signaling in a
plant system. There were several advantages in using the human
PtdIns(4)P 5-kinase, Hs PIPKIa, for increasing PtdIns(4,5)P2 in
vivo: (1) Hs PIPKIa has a low Km for PtdIns(4)P and high Vmax
compared with the plant kinases characterized thus far (Perera
et al., 2005); (2) the preferred substrate is PtdIns(4)P, which is
similar to plant lipid kinases (Westergren et al., 1999, 2001; Kunz
et al., 2000, 2002; Perera et al., 2005); (3) Hs PIPKIa localized
primarily with the plasma membrane in the tobacco cells, which
means that it should directly affect the plasma membrane
PtdIns(4,5)P2 pools; (4) readily detectable amounts of enzyme
were produced in the transgenic cells unlike overexpression of At
PIPK10; (5) Hs PIPKIa did not bind the actin cytoskeleton
because the necessary human scaffolding proteins were not
present in plants; (6) Hs PIPKIa does not contain MORN motifs so
that additional effects of the MORN motifs found in At PIPK1-9
would not impact the interpretation of our results; and (7) by
increasing the rate of one enzymatic reaction, we could alter the
metabolic flux through the pathway.
We initially attempted to use At PIPK1 for this work; however,
constitutive expression of At PIPK1 did not result in any detect-
able increase in functional protein or enzyme activity. We sus-
pect that the inability to overproduce this enzyme in plants may
result from the presence of the N-terminal MORN motifs or the
actin binding domain in the linker region (Davis et al., 2007; Im
et al., 2007). At PIPK10, which does not contain N-terminal
MORN motifs or a linker region, can be overproduced. At PIPK10
increased PtdInsP2 biosynthesis and the flux through the path-
way as predicted; however, the At PIPK10–induced changes in
PI metabolism were marginal compared with those imparted by
the more active enzyme Hs PIPKIa.
Tobacco cells expressing Hs PIPKIa had a 100-fold increase in
their plasma membrane PtdInsP2 and a >40-fold increase in
basal InsP3 based on mass assays. A combinatorial approach
including in vitro characterization of plasma membrane enzyme
activity and in vivo short- and long-term labeling studies indi-
cated that the tobacco cells had sufficient PtdIns(4)P substrate
to sustain a high rate of PtdIns(4,5)P2 biosynthesis. Furthermore,
by increasing PtdIns(4,5)P2 biosynthesis, we increased total
cellular Ins(1,4,5)P3. These data support our thesis that PtdInsP
5-kinase activity is a flux-limiting step in the plant PI pathway.
Profiling the plasma membrane lipids using electrospray ion-
ization tandem mass spectrometry indicated that PtdOH levels
were increased in the Hs PIPKIa lines. The simplest explanation
for this increase is that diacylglycerol produced by PLC activity is
phosphorylated by diacylglycerol kinase; however, we did not
detect appreciable differences in PtdOH production with short-
term [32P] labeling of whole cells. Alternatively, the increase in
plasma membrane PtdOH in the Hs PIPKIa lines may result from
increased PLD activity. Selective plant PLDs isoforms are acti-
vated by Ca2þ and PtdInsP2 (Pappan and Wang, 1999; Wang,
2000; Wang and Wang, 2001).
The impact of increased PtdIns(4,5)P2 biosynthesis was man-
ifested in basal cellular metabolism. Previous work with animal
cells indicated that PtdIns(4,5)P2 biosynthesis was completely
inhibited by adding antimycin A and other inhibitors of mito-
chondrial respiration (Poggioli et al., 1983; Yeung et al., 2006).
Changes in cytosolic calcium can directly affect mitochondria
and stimulate respiration (McCormack et al., 1990; McCormack
and Denton, 1993). It has been estimated that mitochondria can
store up to 60% of the cellular calcium in some plant cells
(Subbaiah et al., 1998; Logan and Knight, 2003). These data
made a compelling argument that increasing PtdIns(4,5)P2 turn-
over might put a significant demand on ATP biosynthesis. The
increased use of sugar from the culture medium and increased
oxygen uptake in the Hs PIPKIa lines in conjunction with these
previous studies in animal cells suggest that the status of
Table 4. Cellular Respiration Increases in the Hs PIPKIa Lines
Cell Type nmoles O2 Taken up/min Increased O2 Uptake (%)
NT-1 8 6 3 –
GFP 8 6 3 –
At PIPK10 11 6 2 26
Hs PIPKIa 13 6 3 46
O2 uptake was monitored using a Clarke electrode in fresh medium. The
numbers are the averages 6 SD from three independent experiments.
Table 5. Hs PIPKIa Lines Deplete the Sugar from the Medium Faster
Cell Type
mg of Sugar/mL Conditioned Media
4 d 6 d
NT-1 18.2 6 0.1 6.2 6 0.1
GFP 17.9 6 0.4 6.0 6 0.1
At PIPK10 16.8 6 1.2 6.9 6 0.1
Hs PIPKIa 17.1 6 0.1 3.4 6 0.1
Sugar remaining in the culture medium was measured at the indicated
day after transfer using Anthrone reagent as described in Methods. Data
are the averages 6 SD of duplicate values from two independent
experiments.
Increasing Phosphoinositide Signaling 1611
PtdIns(4,5)P2 biosynthesis reflects the energy status of the cell.
We also consistently observed a 30% increase in the plasma
membrane vanadate-sensitive ATPase activity (data not shown).
Taken together, the data indicate that when stimuli induce an
increase in the PI pathway in plants, there will be an increased
demand for ATP as the system responds and then recovers the
PI pools to a prestimulated state.
If Ins(1,4,5)P3 increases cytosolic calcium in plants as pre-
dicted based on early microinjection experiments (Gilroy et al.,
1990; Tucker and Boss, 1996), then there must be a continuous
and rapid transport of Ca2þ out of the cells or into intracellular
stores to retain homeostasis in the Hs PIPKIa lines. We observed
an increase in ER calcium binding proteins, CRT and BiP, in the
Hs PIPKIa lines, indicating that the ER is sensing a change in
calcium homeostasis. Furthermore, the fact that the Hs PIPKIa
lines required more extracellular Ca2þ to survive and that the ICP
measurements indicated less total Ca2þ/g dry weight suggests
that the intracellular stores were depleted (Wu et al., 2002; Cheng
et al., 2005). We cannot rule out the possibility that cell wall com-
position and therefore Ca2þ binding capacity is also compromised
in the Hs PIPKIa lines. The fra3 mutants, which have increased
PtdIns(4,5)P2 resulting from a mutation in type II InsP 5-ptase,
had thinner cell walls (Zhong et al., 2004).
What is the expected consequence of increasing the plasma
membrane PtdIns(4,5)P2 100-fold? A large increase in negative
charge on the inner leaflet of the plasma membrane would be
expected to affect lipid and protein interactions and alter cell
structure and membrane biogenesis (Yeung et al., 2006). In-
creasing plasma membrane PtdIns(4,5)P2 has also been shown
to generate actin comet tails and stress fibers and disrupt
membrane trafficking in some animal cells (Rozelle et al., 2000;
Yamamoto and Kiss, 2002; Kanzaki et al., 2004). We did not
detect measurable differences in F-actin morphology based on
phalloidin staining in the tobacco cells (see Supplemental Figure
5 online). This may be because the actin binding proteins re-
quired to scaffold Hs PIPKIa to actin were not present in the plant
cells (Ridley, 2006; Davis et al., 2007). The intensity of phalloidin
staining appeared to be consistently greater in the Hs PIPKIa
lines, suggesting increased membrane permeability to phalloidin
or possibly an increase in cable thickness reminiscent of the
Arabidopsis fra3 mutant. However, even though actin filaments in
the fra3 mutant were thickened and somewhat distorted, there
was no evidence of actin comet tails (Zhong et al., 2004). Taken
together with our observations that the plasma membrane
PtdIns(4,5)P2 was increased even higher in the Hs PIPKIa lines
than in the fra3 mutants, these data suggest that PtdIns(4,5)P2-
mediated regulation of the actin cytoskeleton may be different in
plant and animal cells (Davis et al., 2007).
The impact of increasing the flux through the pathway by
increasing the rate PtdIns(4,5)P2 biosynthesis is understandably
different from mutating, silencing, or knocking out a selective
gene in the PI pathway (Burnette et al., 2003; Hunt et al., 2003;
Zhong et al., 2004; Williams et al., 2005). Manipulating PI me-
tabolism/turnover/signaling at different steps in the PI pathway
could lead to different physiological consequences. In previous
work (Perera et al., 2002, 2006), we showed that dampening the
Ins(1,4,5)P3 signal and altering the flux by pulling metabolites
through the PI pathway did not affect normal plant growth under
optimal conditions but rather delayed and reduced gravitropic
bending in Arabidopsis, which is consistent with the dampened
signal (Perera et al., 2006). The data also indicate that plants have
compensatory mechanisms for sensing environmental cues and
that InsP3-mediated signaling can contribute to ;30% of the
normal gravity signal. By overexpressing Hs PIPKIa in this work,
we have effectively pushed metabolites through the PI pathway
and created plant cells that in theory should have reached a new
steady state that is more similar to the rate of PI metabolism
found in stimulated plant cells with InsP3 providing a greater
portion of the input signal.
We show that fundamental metabolic pathways were altered in
the Hs PIPKIa cells, including sugar use, respiration, and calcium
homeostasis. These results emphasize the need to consider the
impact of the turnover of second messengers on basal metab-
olism. Both transient or prolonged increases (15 min to several
hours) in Ins(1,4,5)P3 have been documented in response to
gravistimulation and osmotic stress (Perera et al., 1999; DeWald
et al., 2001) and may have important downstream consequences
(such as different Ca2þ signatures). The generation of constitu-
tively stimulated plant cells provides a unique system for char-
acterizing the physiological impact of PI signaling in plants.
The synthetic model system presented here provides some
insights as to the consequences of PI signaling in a stimulated
plant cell. Taken together with previously published data (Perera
et al., 2002, 2005, 2006; Im et al., 2007), this work demonstrates
that in normal plant cells, PIPK activity is flux limiting. To under-
stand the system and eventually develop a predictive model, it is
important to appreciate the flux-limiting step and the conse-
quences of altering plant PI metabolism.
METHODS
Plant Material and Growth
Tobacco cells (Nicotiana tabacum NT-1 cells) were maintained in 25 mL of
liquid culture medium as described previously (Perera et al., 2002) and
subcultured weekly with a 6% (v/v) inoculum. To monitor cell growth, two
replicate 25-mL cultures grown in 125-mL Erlenmeyer flasks at 125 rpm
and 278C were harvested at 2, 4, and 6 d after transfer. The cells were
collected by low-speed centrifugation (;500g for 3 min), and the fresh
weight was measured. Cells were used 4 d after transfer unless otherwise
indicated, and the average fresh weight harvested for both the wild-type
and transgenic tobacco lines was 1.6 6 0.2 g. For growth experiments
with no added Ca2þ, the tobacco culture media was made up with
Murashige and Skoog salts except for the omission of Ca2þ salts.
Plant Transformation and Selection of Transgenic Lines
The cDNA encoding the At PIPK10 (At4g01190) and human PIPKIa
(NM_003557) were subcloned into the pENTR/SD/D-TOPO destination
vectors (Invitrogen) and then into pK7WGF2 (Functional Genomics Divi-
sion of the Department of Plant Systems Biology, Gent, Belgium) for
production of GFP fusion PIPK proteins under the control of a cauliflower
mosaic virus 35S promoter in plants by LR recombination reaction
according to the manufacturer’s instructions (Invitrogen). The orientation
of the resulting plasmids, pK7WGF2-PIPKs, was verified by PCR and
DNA sequencing.
The recombinant binary plasmids (pK7WGF2-At PIPK10, pK7WGF2-
Hs PIPKIa, and vector control pK7WGF2) were transformed into
1612 The Plant Cell

Agrobacterium tumefaciens EHA105 by the freeze-thaw method (Chen
et al., 1994). NT-1 cells were transformed using Agrobacterium-mediated
gene transfer as described (Perera et al., 2002). For each transformation,
three independent, kanamycin-resistant microcalli were selected, and
suspension cultures were established and maintained by weekly subcul-
ture in NT-1 medium containing 50 mg mL�1 kanamycin.
RNA Extraction and RT-PCR Analysis
To verify transformation and determine if the transgene was expressed,
three independent transformed NT-1 lines/constructs were harvested
after 4 d of growth and frozen in liquid N2. RNA was isolated using the
plant RNeasy kit (Qiagen), with an additional DNase treatment to remove
contaminating genomic DNA. Reverse transcription was performed using
Omniscript reverse transcriptase enzyme according to the manufac-
turer’s instructions (Qiagen). GFP-PIPK transcripts were detected by
PCR using a forward primer to GFP and PIPK-specific reverse primers.
PCR with actin-specific primers was performed to verify that an equal
amount of template was used. PCR products were analyzed by gel
electrophoresis.
Microscopy
Confocal fluorescence images were acquired with a Leica TCS SP1
confocal system using a Leica DM IRBE microscope and a 340 numerical
aperture 1.2 oil immersion objective. For GFP visualization, samples were
excited with an argon laser at 488 nm, and fluorescence emission was
collected from 500 to 560 nm. To visualize mitochondria, cells were
stained with Rhodamine 123. To visualize actin, cells were fixed and
stained with rhodamine phalloidin and visualized as described by Van
Gestel et al. (2002).
Preparation of Microsomal and Plasma Membrane Fractions
Four-day-old NT-1 cells were harvested by filtration and immediately
homogenized in 3 volumes of cold buffer as described (Perera et al.,
2002), and the crude extract was clarified by centrifugation (5000g for
10 min at 48C) to yield total cell lysate or fractionated further (40,000g, for
60 min, at 48C) to yield microsomal and soluble protein fractions. Plasma
membrane–enriched fractions were prepared from microsomes by aque-
ous two-phase partitioning as described previously (Perera et al., 1999).
For enzyme assays, membrane fractions were placed on ice and assayed
immediately. Protein concentrations were estimated using the Bio-Rad
protein assay reagent with BSA as a standard.
Isolation of F-Actin from Plasma Membrane
F-actin was isolated from equal amounts of plasma membrane protein as
described previously using a 20,000g centrifugation to recover large actin
filaments and bundles (Stevenson-Paulik et al., 2003). After two rounds of
polymerization, the 20,000g F-actin pellet was resuspended to a volume
equal to the supernatant, and 20 mL of supernatant and pellet were
assayed for PtdInsP 5-kinase activity as described below.
Immunoblotting
Immunoblotting was performed by SDS-PAGE of isolated proteins and
transfered to a polyvinylidene difluoride membrane by electroblotting.
Membranes were blocked with 3% (w/v) BSA, incubated with antibodies
(anti-mouse GFP [Clontech] or anti-rabbit BiP and CRT), and incubated
with horseradish peroxidase–conjugated anti-mouse or anti-rabbit. Im-
munoreactivity was visualized by incubating the blot in SuperSignal West
Pico Chemiluminescent substrate (Pierce) and exposure to x-ray film.
After chemiluminescence detection, total protein was visualized by
staining the blots with Amido black (Sigma-Aldrich).
PtdInsP 5-Kinase Assays
In vitro lipid kinase assays were performed using 2 mg of plasma mem-
brane protein. The standard assay was as previously described (Perera
et al., 2002) with the following modifications. Reactions were performed
either in the absence or presence of substrate [125 mM PtdIns(4)P from
porcine brain; Avanti Polar Lipids) at room temperature for 10 min in a total
volume of 50 mL. After incubation, phospholipids were extracted and
separated by TLC as described (Perera et al., 2002).
Ins(1,4,5)P3 Assays and PtdIns(4,5)P2 Mass Measurements
Cells were harvested by filtration and immediately frozen in liquid N2,
ground to a fine powder, and precipitated with cold 10% (v/v) perchloric
acid (PCA). Ins(1,4,5)P3 assays were performed using the TRK1000
Ins(1,4,5)P3 assay kit (Amersham Pharmacia Biotech) as previously
described (Perera et al., 1999, 2002), and PtdIns(4,5)P2 mass measure-
ments were performed as described (Heilmann et al., 2001).
Lipid Profiling
To determine the effects of Hs PIPKIa expression on the plasma mem-
brane lipid profile, we isolated plasma membrane–enriched fractions
from 4-d-old wild-type and tobacco cells as described above. Lipid
extraction, lipid analysis, and lipid quantification were performed as
described (Welti et al., 2002) at the Kansas Lipidomics Facility.
In Vivo Labeling of Cells
In vivo labeling was performed with cells growing at the same rate and
that had equivalent fresh weights. For 24-h labeling studies, 5 mL of
cultures of 3-d-old wild-type and transgenic cells (;0.1 g cells mL�1)
were labeled with 25 mCi myo-[2-3H] inositol (25 Ci mmol�1). After 24 h,
cells were harvested by filtration, ground in liquid N2, and incubated with
cold 5% (v/v) PCA for 15 min on ice. The pellet and supernatant were
separated by centrifugation, the pellet was washed with cold water twice,
and the lipids were extracted as described previously (Perera et al., 2002).
Extracted lipids were separated by TLC and quantified using a Bioscan
imaging scanner or further processed for head group analysis. The
phospholipids were deacylated for HPLC analysis as previously de-
scribed (Hama et al., 2004). For soluble inositol phosphate analysis, cells
were labeled as described above for 18 h and precipitated with PCA. The
supernatant was analyzed by HPLC for soluble inositol phosphates using
a Partisphere SAX strong anion exchange column as described by
Stevenson-Paulik et al. (2006).
For short-term labeling, 4-d-old cells were harvested by filtration,
weighed, preequilibrated in conditioned medium (0.2 g mL�1), and
maintained by shaking. Conditioned medium was pooled from all the
cell lines. After a 30-min recovery period, cells were labeled with carrier-
free [32P] Pi (100 mCi mL�1). Equal aliquots (500 mL) of cells were removed
at the indicated time points and added immediately to 500 mL of cold
20% (v/v) PCA and incubated on ice for ;20 min. The pellet was washed
with cold water twice, and lipids were extracted, separated by TLC, and
quantified as described above.
O2 Uptake
Tobacco cells (4 d after transfer) were collected by filtration and pre-
equilibrated in fresh medium at 0.1 g fresh weight mL�1 for 2 h on a rotary
shaker (125 rpm, 258C). Two-milliliter aliquots were used for measuring
the rate of O2 uptake in a Clarke-type oxygen electrode system from
Hansatech Instrument. The O2 concentration in the solution was mea-
sured over time at 258C and recorded by an Omnitracer recorder
(Houston Instruments).
Increasing Phosphoinositide Signaling 1613

ATPase Activity
Plasma membrane ATPase activity was determined as previously de-
scribed (Wheeler and Boss, 1987) with and without the addition of V2O2.
The vanadate-sensitive ATP hydrolysis is reported.
Calcium Uptake and Release Measurements
Ca2þ uptake and release were measured with ER-enriched microsomal
membrane fraction as previously described (Persson et al., 2001). Ca2þ
transport was measured with and without the addition of 3 mM ATP. Ca2þ
release was determined from [45Ca2þ]-loaded (23 min) vesicles by adding
1.5 mM ionomycin ionophore, and membrane vesicles were analyzed for
[45Ca2þ] after 5 min. The net release was determined as difference of
[45Ca2þ] recovered after the addition of ionomycin versus addition of
dimethyl sulfoxide (same concentration as in the ionomycin stock) alone.
Whole-Cell Calcium Measurements
Cells (4 and 6 d old) were collected by filtration, washed twice with 5 mL of
deionized water, and freeze-dried. The samples were dry ashed at 5008C
overnight and digested in 6 N HCl according to Gorsuch (1970), and total
calcium was determined using ICP emission spectrometry at the North
Carolina State University Analytical Services Laboratory under the direc-
tion of Wayne Robarge.
Sugar Analysis
The sugar remaining in the culture medium was measured at the indicated
day after transfer using Anthrone reagentas described by Van Handel (1985).
Accession Numbers
Sequence data from this article can be found in the GenBank/EMBL data
libraries under accession numbers At4g01190 (Arabidopsis PIPK10) and
NM_003557 (human PIPKIa).
Supplemental Data
The following materials are available in the online version of this article.
Supplemental Video 1. A Movie Showing the Localization of GFP-Hs
PIPKIa with the Plasma Membranes of Tobacco Cells in Normal
Medium.
Supplemental Video 2. A Movie Showing the Localization of GFP-Hs
PIPKIa with the Plasma Membranes of Tobacco Cells after the
Addition of 0.6 Osmolal Sorbitol.
Supplemental Figure 1. Head Group Analysis of PtdIns(4)P and
PtdIns(4,5)P2 from the GFP and Hs PIPKIa Cell Lines.
Supplemental Figure 2. Calcium Uptake into the Mitochondria and
Whole Cells.
Supplemental Figure 3. Ratiometric Imaging of Intracellular Calcium
Using the Ca2þ Indicator, Indo-1.
Supplemental Figure 4. Visualization of Mitochondria with Rhoda-
mine 123.
Supplemental Figure 5. Visualization of Actin with Rhodamine-
Phalloidin.
ACKNOWLEDGMENTS
We thank Richard Anderson (University of Wisconsin) for the gift of the
human type Ia PIPK, Rebecca S. Boston (North Carolina State Univer-
sity) for the antibodies to CRT and BiP, and Wayne P. Robarge (North
Carolina State University) for ICP analysis of calcium. This work was
supported in part by funding from the North Carolina Agricultural
Research Service (W.F.B. and N.S.A.), the National Science Foundation
(W.F.B.), and by the Binational Science Foundation (W.F.B. and Nava
Moran). The Kansas Lipidomics Research Center was supported by
National Science Foundation Grants MCB0455318 and DBI 0521587,
and National Science Foundation EPSCoR Grant EPS-0236913 with
matching support from the State of Kansas through Kansas Technology
Enterprise Corporation and Kansas State University. The Kansas
Lipidomics Research Center is also supported by K-INBRE (National
Institutes of Health Grant P20 RR16475 from the INBRE program of the
National Center for Research Resources).
Received February 24, 2007; revised April 18, 2007; accepted April 23,
2007; published May 11, 2007.
REFERENCES
Adel-Latif, A.A., Smith, J.P., and Akhtar, R.A. (1985). Polyphosphoi-
nositides and muscarinic chloinergic and b-adrenergic receptors in
iris smooth muscle. In Inositol and Phosphoinositides: Metabolism
and Regulation, J.E. Bleasdale, J. Eichberg, and G. Hauser, eds
(Clifton, NJ: Humana Press), pp. 275–298.
Akesson, A., Persson, S., Love, J., Boss, W.F., Widell, S., and
Sommarin, M. (2005). Overexpression of the Ca2þ-binding protein
calreticulin in the endoplasmic reticulum improves growth of tobacco
cell suspensions (Nicotiana tabacum) in high-Ca2þ medium. Physiol.
Plant 123: 92–99.
Berdy, S.E., Kudla, J., Gruissem, W., and Gillaspy, G.E. (2001). Molec-
ular characterization of At5PTase1, an inositol phosphatase capable of
terminating inositol trisphosphate signaling. Plant Physiol. 126: 801–810.
Brearley, C.A., and Hanke, D.E. (1996). Metabolic evidence for the
order of addition of individual phosphate esters to the myo-inositol
moiety of inositol hexakisphosphate in the duckweed Spirodela
polyrhiza L. Biochem. J. 314: 227–233.
Burnette, R.N., Gunesekera, B.M., and Gillaspy, G.E. (2003). An
Arabidopsis inositol 5-phosphatase gain-of-function alters abscisic
acid signaling. Plant Physiol. 132: 1011–1019.
Chen, H., Nelson, R.S., and Sherwood, J.L. (1994). Enhanced recov-
ery of transformants of Agrobacterium tumefaciens after freeze-thaw
transformation and drug selection. Biotechniques 16: 664–668, 670.
Cheng, N.-H., Pittman, J.K., Shigaki, T., Lachmansingh, J., LeClere,
S., Lahner, B., Salt, D.E., and Hirschi, K.D. (2005). Functional
association of Arabidopsis CAX1 and CAX3 is required for normal
growth and ion homeostasis. Plant Physiol. 138: 2048–2060.
Cunningham, E., Thomas, G.M., Ball, A., Hiles, I., and Cockcroft, S.
(1995). Phosphatidylinositol transfer protein dictates the rate of ino-
sitol trisphosphate production by promoting the synthesis of PIP2.
Curr. Biol. 5: 775–783.
Davis, A.J., Im, Y.J., Dubin, J.S., Tomer, K.B., and Boss, W.F. (2007).
Arabidopsis phosphatidylinositol phosphate kinase 1 binds F-actin
and recruits phosphatidylinositol 4-kinase beta 1 to the actin cyto-
skeleton. J. Biol. Chem. 282: 14121–14131.
DeWald, D.B., Torabinejad, J., Jones, C.A., Shope, J.C., Cangelosi,
A.R., Thompson, J.E., Prestwich, G.D., and Hama, H. (2001). Rapid
accumulation of phosphatidylinositol 4,5-bisphosphate and inositol
1,4,5-trisphosphate correlates with calcium mobilization in salt-
stressed Arabidopsis. Plant Physiol. 126: 759–769.
Dowd, P.E., Coursol, S., Skirpan, A.L., Kao, T.H., and Gilroy, S.
(2006). Petunia phospholipase C1 is involved in pollen tube growth.
Plant Cell 18: 1438–1453.
1614 The Plant Cell

Drøbak, B.K., Dewey, R.E., and Boss, W.F. (1999). Phosphoinositide
kinases and the synthesis of polyphosphoinositides in higher plant
cells. In International Review of Cytology, K.W. Jeon, ed (New York:
Academic Press), pp. 95–130.
Elge, S., Brearley, C., Xia, H.J., Kehr, J., Xue, H.W., and Mueller-Roeber,
B. (2001). An Arabidopsis inositol phospholipid kinase stronglyexpressed
in procambial cells: Synthesis of Ptdlns(4,5)P2 and Ptdlns(3,4,5)P3 in
insect cells by 5-phosphorylation of precursors. Plant J. 26: 561–571.
Ercetin, M.E., and Gillaspy, G.E. (2004). Molecular characterization of
an Arabidopsis gene encoding a phospholipid-specific inositol poly-
phosphate 5-phosphatase. Plant Physiol. 135: 938–946.
Gilroy, S., Read, N.D., and Trewavas, A.J. (1990). Elevation of cyto-
plasmic calcium by caged calcium or caged inositol triphosphate
initiates stomatal closure. Nature 346: 769–771.
Gorsuch, T.T. (1970). The Destruction of Organic Matter. (Elmsford, NY:
Pergamon Press).
Gross, W., and Boss, W.F. (1993). Inositol phospholipids and signal
transduction. In Control of Plant Gene Expression, D.P.S. Verma, ed
(Boca Raton, FL: CRC Press), pp. 17–32.
Hama, H., Torebinejad, J., Prestwich, G., and DeWald, D. (2004).
Measurement and immunofluorescence of cellular phosphoinositides.
In Methods in Molecular Biology: Signal Transduction Protocols, R.
Dickson, ed (Clifton, NJ: Humana Press), pp. 243–258.
Haseloff, J., and Amos, B. (1995). GFP in plants. Trends Genet. 11:
328–329.
Heilmann, I., Perera, I.Y., Gross, W., and Boss, W.F. (2001). Plasma
membrane phosphatidylinositol 4,5-bisphosphate decreases with
time in culture. Plant Physiol. 126: 1507–1518.
Helling, D., Possart, A., Cottier, S., Klahre, U., and Kost, B. (2006).
Pollen tube tip growth depends on plasma membrane polarization
mediated by tobacco PLC3 activity and endocytic membrane recy-
cling. Plant Cell 18: 3519–3534.
Hunt, L., Mills, L.N., Pical, C., Leckie, C.P., Aitken, F.L., Kopka, J.,
Mueller-Roeber, B., McAinsh, M.R., Hetherington, A.M., and Gray,
J.E. (2003). Phospholipase C is required for the control of stomatal
aperture by ABA. Plant J. 34: 47–55.
Im, Y.J., Davis, A.J., Perera, I.Y., Johannes, E., Allen, N.S., and Boss,
W.F. (2007). The N-terminal membrane occupation and recognition
nexus domain of Arabidopsis phosphatidylinositol phosphate kinase
1 regulates enzyme activity. J. Biol. Chem. 282: 5443–5452.
Kanzaki, M., Furukawa, M., Raab, W., and Pessin, J.E. (2004). Phos-
phatidylinositol 4,5-bisphosphate regulates adipocyte actin dynamics
and GLUT4 vesicle recycling. J. Biol. Chem. 279: 30622–30633.
Kunz, J., Fuelling, A., Kolbe, L., and Anderson, R.A. (2002). Stereo-
specific substrate recognition by phosphatidylinositol phosphate ki-
nases is swapped by changing a single amino acid residue. J. Biol.
Chem. 277: 5611–5619.
Kunz, J., Wilson, M.P., Kisseleva, M., Hurley, J.H., Majerus, P.W., and
Anderson, R.A. (2000). The activation loop of phosphatidylinositol
phosphate kinases determines signaling specificity. Mol. Cell 5: 1–11.
Lievremont, J.P., Rizzuto, R., Hendershot, L., and Meldolesi, J.
(1997). BiP, a major chaperone protein of the endoplasmic reticulum
lumen, plays a direct and important role in the storage of the rapidly
exchanging pool of Ca2þ. J. Biol. Chem. 272: 30873–30879.
Logan, D.C., and Knight, M.R. (2003). Mitochondrial and cytosolic calcium
dynamics are differentially regulated in plants. Plant Physiol. 133: 21–24.
Lou, Y., Gou, J.-Y., and Xue, H.-W. (2007). PIP5K9, an Arabidopsis
phosphatidylinositol monophosphate kinase, interacts with a cyto-
solic invertase to negatively regulate sugar-mediated root growth.
Plant Cell 19: 163–181.
McCormack, J.G., and Denton, R.M. (1993). Mitochondrial Ca2þ
transport and the role of intramitochondrial Ca2þ in the regulation of
energy metabolism. Dev. Neurosci. 15: 165–173.
McCormack, J.G., Halestrap, A.P., and Denton, R.M. (1990). Role of
calcium ions in regulation of mammalian intramitochondrial metabo-
lism. Physiol. Rev. 70: 391–425.
Meijer, H.J.G., and Munnik, T. (2003). Phospholipid-based signaling in
plants. Annu. Rev. Plant Biol. 54: 265–306.
Michalak, M., Corbet, E.F., Mesaeli, N., Nakamura, K., and Opas, M.
(1999). Calreticulin: One protein, one gene, many functions. Biochem.
J. 344: 281–292.
Mikami, K., Katagiri, T., Iuchi, S., Yamaguchi-Shinozaki, K., and
Shinozaki, K. (1998). A gene encoding phosphatidylinositol-4-phos-
phate 5-kinase is induced by water stress and abscisic acid in
Arabidopsis thaliana. Plant J. 15: 563–568.
Mueller-Roeber, B., and Pical, C. (2002). Inositol phospholipid metab-
olism in Arabidopsis. Characterized and putative isoforms of inositol
phospholipid kinase and phosphoinositide-specific phospholipase C.
Plant Physiol. 130: 22–46.
Munnik, T., Irvine, R.F., and Musgrave, A. (1998). Phospholipid
signalling in plants. Biochim. Biophys. Acta 1389: 222–272.
Pappan, K., and Wang, X. (1999). Plant phospholipase Da is an acidic
phospholipase active at near-physiological Ca(2þ) concentrations.
Arch. Biochem. Biophys. 368: 347–353.
Perera, I.Y., Davis, A.J., Galanopoulou, D., Im, Y.J., and Boss, W.F.
(2005). Characterization and comparative analysis of Arabidopsis
phosphatidylinositol phosphate 5-kinase 10 reveals differences in
Arabidopsis and human phosphatidylinositol phosphate kinases.
FEBS Lett. 579: 3427–3432.
Perera, I.Y., Heilmann, I., and Boss, W.F. (1999). Transient and
sustained increases in inositol 1,4,5-trisphosphate precede the dif-
ferential growth response in gravistimulated maize pulvini. Proc. Natl.
Acad. Sci. USA 96: 5838–5843.
Perera, I.Y., Hung, C.Y., Brady, S., Muday, G.K., and Boss, W.F.
(2006). A universal role for inositol 1,4,5-trisphosphate-mediated
signaling in plant gravitropism. Plant Physiol. 140: 746–760.
Perera, I.Y., Love, J., Heilmann, I., Thompson, W.F., and Boss, W.F.
(2002). Up-regulation of phosphoinositide metabolism in tobacco cells
constitutively expressing the human type I inositol polyphosphate
5-phosphatase. Plant Physiol. 129: 1795–1806.
Persson, S., Love, J., Tsou, P.-L., Robertson, D., Thompson, W.F., and
Boss, W.F. (2002). When a day makes a difference. Interpreting data
from endoplasmic reticulum-targeted green fluorescent protein fusions
in cells grown in suspension culture. Plant Physiol. 128: 341–344.
Persson, S., Wyatt, S.E., Love, J., Thompson, W.F., Robertson, D.,
and Boss, W.F. (2001). The Ca2þ status of the endoplasmic reticulum
is altered by induction of calreticulin expression in transgenic plants.
Plant Physiol. 126: 1092–1104.
Phillippy, B.Q. (1998). Identification of inositol 1,3,4-trisphosphate
5-kinase and inositol 1,3,4,5-tetrakisphosphate 6-kinase in immature
soybean seeds. Plant Physiol. 116: 291–297.
Pical, C., Westergren, T., Dove, S.K., Larsson, C., and Sommarin, M.
(1999). Salinity and hyperosmotic stress induce rapid increases in
phosphatidylinositol 4,5-bisphosphate, diacylglycerol pyrophosphate,
and phosphatidylcholine in Arabidopsis thaliana cells. J. Biol. Chem.
274: 38232–38240.
Poggioli, J., Weiss, S.J., McKinney, J.S., and Putney, J.W., Jr. (1983).
Effects of antimycin A on receptor-activated calcium mobilization and
phosphoinositide metabolism in rat parotid gland. Mol. Pharmacol.
23: 71–77.
Preuss, M.L., Schmitz, A.J., Thole, J.M., Bonner, H.K., Otegui, M.S.,
and Nielsen, E. (2006). A role for the RabA4b effector protein PI-
4Kbeta1 in polarized expansion of root hair cells in Arabidopsis
thaliana. J. Cell Biol. 172: 991–998.
Raboy, V. (2001). Seeds for a better future: ‘Low phytate’ grains help to
overcome malnutrition and reduce pollution. Trends Plant Sci. 6: 458–462.
Increasing Phosphoinositide Signaling 1615

Ridley, A.J. (2006). Rho GTPases and actin dynamics in membrane
protrusions and vesicle trafficking. Trends Cell Biol. 16: 522–529.
Rozelle, A.L., Machesky, L.M., Yamamoto, M., Driessens, M.H.,
Insall, R.H., Roth, M.G., Luby-Phelps, K., Marriott, G., Hall, A., and
Yin, H.L. (2000). Phosphatidylinositol 4,5-bisphosphate induces actin-
based movement of raft-enriched vesicles through WASP-Arp2/3.
Curr. Biol. 10: 311–320.
Sandelius, A.S., and Sommarin, M. (1990). Membrane-localized reac-
tions involved in polyphosphoinositide turnover in plants. In Inositol
Metabolism in Plants, D.J. Morre, W.F. Boss, and F.A. Loewus, eds
(New York: Wiley-Liss), pp. 139–161.
Stevenson-Paulik, J., Chiou, S.T., Frederick, J.P., Cruz, J.D., Seeds,
A.M., Otto, J.C., and York, J.D. (2006). Inositol phosphate metab-
olomics: Merging genetic perturbation with modernized radiolabeling
methods. Methods 39: 112–121.
Stevenson-Paulik, J., Love, J., and Boss, W.F. (2003). Differential
regulation of two Arabidopsis type III phosphatidylinositol 4-kinase
isoforms. A regulatory role for the pleckstrin homology domain. Plant
Physiol. 132: 1053–1064.
Stevenson-Paulik, J., Odom, A.R., and York, J.D. (2002). Molecular
and biochemical characterization of two plant inositol polyphosphate
6-/3-/5-kinases. J. Biol. Chem. 277: 42711–42718.
Stevenson, J.M., Perera, I.Y., and Boss, W.F. (1998). A phosphatidyl-
inositol 4-kinase pleckstrin homology domain that binds phosphati-
dylinositol 4-monophosphate. J. Biol. Chem. 273: 22761–22767.
Stevenson, J.M., Perera, I.Y., Heilmann, I., Persson, S., and Boss,
W.F. (2000). Inositol signaling and plant growth. Trends Plant Sci. 5:
252–258.
Subbaiah, C.C., Bush, D.S., and Sachs, M.M. (1998). Mitochondrial
contribution to the anoxic Ca2þ signal in maize suspension-cultured
cells. Plant Physiol. 118: 759–771.
Tan, Z., and Boss, W.F. (1992). Association of phosphatidylinositol
kinase, phosphatidylinositol monophosphate kinase, and diacylglyc-
erol kinase with the cytoskeleton and F-actin fractions of carrot
(Daucus carota L.) cells grown in suspension culture. Plant Physiol.
100: 2116–2120.
Tucker, E.B., and Boss, W.F. (1996). Mastoparan-induced intracellular
Ca2þ fluxes may regulate cell-to-cell communication in plants. Plant
Physiol. 111: 459–467.
Van Gestel, K., Kohler, R.H., and Verbelen, J.P. (2002). Plant mito-
chondria move on F-actin, but their positioning in the cortical cyto-
plasm depends on both F-actin and microtubules. J. Exp. Bot. 53:
659–667.
Van Handel, E. (1985). Rapid determination of glycogen and sugars in
mosquitoes. J. Am. Mosq. Control Assoc. 1: 299–301.
Van Leeuwen, W., Okresz, L., Bogre, L., and Munnik, T. (2004).
Learning the lipid language of plant signalling. Trends Plant Sci. 9:
378–384.
Verma, D.P.S., and Maclachlan, G.A. (1976). Metabolism of poly(A) in
plant cells: Discrete classes associated with free and membrane-
bound polysomes. Plant Physiol. 58: 405–410.
Vincent, P., Chua, M., Nogue, F., Fairbrother, A., Mekeel, H., Xu, Y.,
Allen, N., Bibikova, T.N., Gilroy, S., and Bankaitis, V.A. (2005). A
Sec14p-nodulin domain phosphatidylinositol transfer protein polar-
izes membrane growth of Arabidopsis thaliana root hairs. J. Cell Biol.
168: 801–812.
Wang, C., and Wang, X. (2001). A novel phospholipase D of Arabi-
dopsis that is activated by oleic acid and associated with the plasma
membrane. Plant Physiol. 127: 1102–1112.
Wang, X. (2000). Multiple forms of phospholipase D in plants: The gene
family, catalytic and regulatory properties, and cellular functions.
Prog. Lipid Res. 39: 109–149.
Welti, R., Li, W., Li, M., Sang, Y., Biesiada, H., Zhou, H.-E.,
Rajashekar, C.B., Williams, T.D., and Wang, X. (2002). Profiling mem-
brane lipids in plant stress responses. Role of phospholipase Da in
freezing-induced lipid changes in Arabidopsis. J. Biol. Chem. 277:
31994–32002.
Westergren, T., Dove, S.K., Sommarin, M., and Pical, C. (2001).
AtPIP5K1, an Arabidopsis thaliana phosphatidylinositol phosphate
kinase, synthesizes PtdIns(3,4)P2 and PtdIns(4,5)P2 in vitro and is
inhibited by phosphorylation. Biochem. J. 359: 583–589.
Westergren, T., Ekblad, L., Jergil, B., and Sommarin, M. (1999).
Phosphatidylinositol 4-kinase associated with spinach plasma mem-
branes. Isolation and characterization of two distinct forms. Plant
Physiol. 121: 507–516.
Wheeler, J.J., and Boss, W.F. (1987). Polyphosphoinositides are
present in plasma membranes isolated from fusogenic carrot cells.
Plant Physiol. 85: 389–392.
Williams, M.E., Torabinejad, J., Cohick, E., Parker, K., Drake, E.J.,
Thompson, J.E., Hortter, M., and Dewald, D.B. (2005). Mutations in
the Arabidopsis phosphoinositide phosphatase gene SAC9 lead to
overaccumulation of PtdIns(4,5)P2 and constitutive expression of the
stress-response pathway. Plant Physiol. 138: 686–700.
Wu, Z., Liang, F., Hong, B., Young, J.C., Sussman, M.R., Harper,
J.F., and Sze, H. (2002). An endoplasmic reticulum-bound Ca2þ/
Mn2þ pump, ECA1, supports plant growth and confers tolerance to
Mn2þ stress. Plant Physiol. 130: 128–137.
Yamamoto, K., and Kiss, J.Z. (2002). Disruption of the actin cytoskel-
eton results in the promotion of gravitropism in inflorescence stems
and hypocotyls of Arabidopsis. Plant Physiol. 128: 669–681.
Yeung, T., Terebiznik, M., Yu, L., Silvius, J., Abidi, W.M., Philips, M.,
Levine, T., Kapus, A., and Grinstein, S. (2006). Receptor activation
alters inner surface potential during phagocytosis. Science 313:
347–351.
Zhong, R., Burk, D.H., Morrison III, W.H., and Ye, Z.H. (2004).
FRAGILE FIBER3, an Arabidopsis gene encoding a type II inositol
polyphosphate 5-phosphatase, is required for secondary wall syn-
thesis and actin organization in fiber cells. Plant Cell 16: 3242–3259.
1616 The Plant Cell


