Embed Size (px)
Citation preview
Increasing sustainability in Cebu
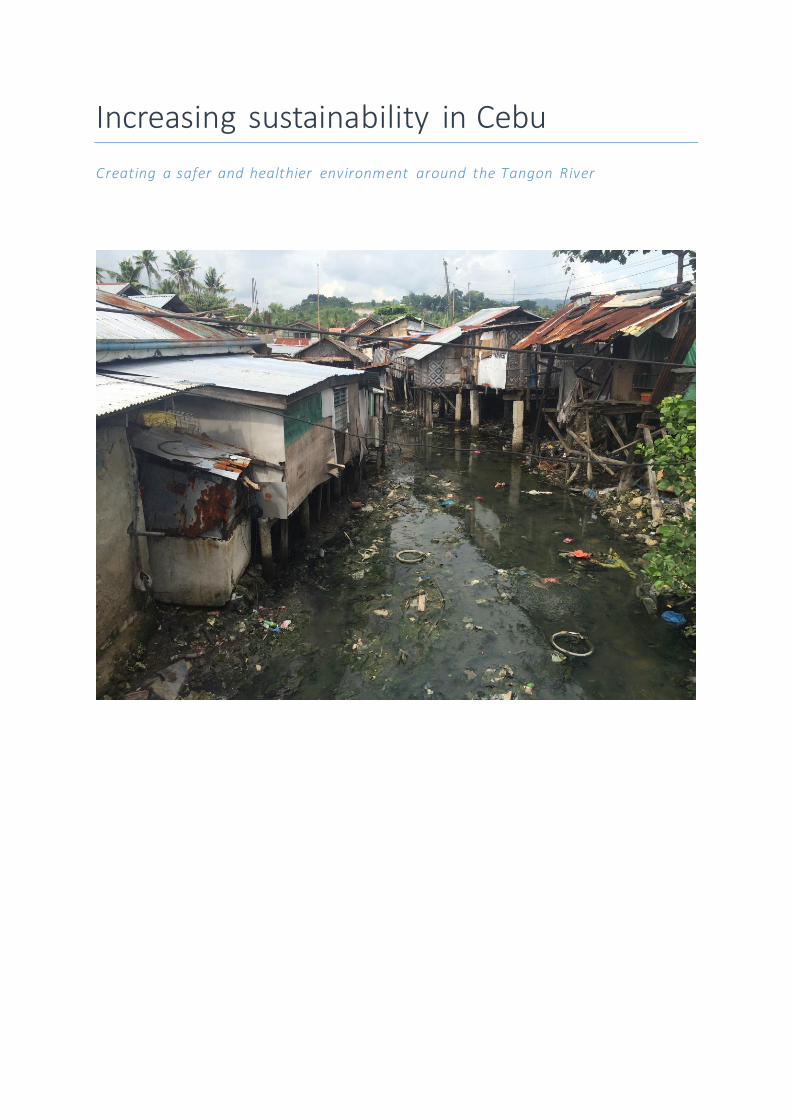
Creating a safer and healthier environment around the Tangon River
II
Increasing sustainability in Cebu
Creating a safer and healthier environment around the Tangon River
Niels Boer
Ide Benjamin Maria Opdam Presidential Commission for the Urban Poor
Rotterdam University of Applied Science Supervisors: Mr. T.H. Heikoop, Mrs. C.T. Manlosa - Osano The Philippines, Cebu City, November 18th 2016
III
Preface N. Boer I.B.M. Opdam
Cebu City, 18th November
This report it the final product of the internship which is part of the third year of the study Water Management of the Rotterdam University for Applied Sciences. During this internship, a research is
executed regarding the water quality in three main rivers in the Philippine province Cebu. There has been focused on an integral solution for the pollution problems in the secluded river branches of the Tangon River. Therefore, a solution is designed that tackles both problems of water quality and
water safety. This report is a contribution for all people who will be involved with water quality and water
safety problems in the future within the Philippines. In special this report should help the Philippine
government creating appropriate solutions. This report is established in collaboration with Presidential Commission for the Urban
Poor and the Rotterdam University of Applied Sciences. Special thanks to Regional Director of the Presidential Commission for the Urban Poor, Chloe T. Manlosa-Osano and attorney Edmund Lao of the Danao City council.
Contact information:
Niels Boer: [email protected] +31 6 14 164 430
Ide Opdam: [email protected] +31 6 17 562 690
IV
Summary After thorough research in three main rivers in Cebu, the Guadalupe River, the Butuanon River, and the Tangon River, there is eventually focused on the Tangon River in Danao.
During the research of the Tangon River, the spatial problems have been extensively examined. After several field studies and literature study, the analyses indicate several important issues. In particular, the water quality due to the serious pollution. Additionally, there is a high flood hazard in the area,
caused by intense rainfall and high tide of the sea. This increases the danger of flooding’s within the river banks for the residents that live hire.
The highest risks occur in the secluded river branches in the barangays Tay-tay and Lo-oc. The high gradient is used through clever use of these heights to create a system that will decrease pollution and store water.
To ensure the quality and validity of the research we included the interested stakeholders. The project has been extensively discussed with these various stakeholders. This is to ensure that the
future solution/procedure is as close as possible to the desires and requirements of the stakeholders.
During the design process, a Mind Map sorted the ideas for the area. From here the design is crafted. To create an suitable solution a connection seems inevitable in order to create flow in the
secluded river branches. Through the flushing of the new connected river branch, the inconvenience will be greatly reduced by the polluted water. By creating a small inflow rate from the main river the
Tangon River, a constant current appears that is sufficient for flushing. In the debouchments within the canal a triangle raster is designed that collects all solid waste to prevent loss of marine life near the coast. To prevent the high tide from entering the new water system valves are installed to keep
the water outside. Next to these improvements the design is also dimensioned to withstand extreme weather
showers that occur once in four years, this creates a reduce in flood hazards. The combination of
these solutions will create an environment for a healthy and sustainable water system in Danao City.
V
Table of content Preface ....................................................................................................................................... III
Summary .................................................................................................................................... IV
Introduction ................................................................................................................................. 7
Motivation................................................................................................................................ 7
Problem ................................................................................................................................... 8
Objective .................................................................................................................................. 8
Research questions ................................................................................................................... 8
Structure .................................................................................................................................. 8
1 Methodology ............................................................................................................................. 9
1.1 Sub question: River selection................................................................................................ 9
1.2 Sub question: Characteristics ............................................................................................. 12
1.3 Sub question: Stakeholder analysis ..................................................................................... 13
1.4 Sub question: Design ......................................................................................................... 14
2 River Selection ......................................................................................................................... 16
3 Characteristics ......................................................................................................................... 19
3.1 Water characteristics ......................................................................................................... 19
Flooding’s ........................................................................................................................... 19
Water quality ...................................................................................................................... 22
3.1 Social characteristics.......................................................................................................... 27
Densely populated .............................................................................................................. 27
3.3 Spatial opportunities ......................................................................................................... 28
Height characteristics .......................................................................................................... 28
Urban characteristics........................................................................................................... 30
3.4 Field research .................................................................................................................... 31
3.5 conclusion......................................................................................................................... 32
4 Stakeholders analysis ............................................................................................................... 33
Introduction ........................................................................................................................... 33
4.1 Stakeholder selection ........................................................................................................ 34
4.2 Interest vs influence .......................................................................................................... 34
4.3 Interviews ......................................................................................................................... 37
5 Design ..................................................................................................................................... 40
Introduction ........................................................................................................................... 40
5.1 Water system .................................................................................................................... 40
5.2 Water Balance South river branch ...................................................................................... 42
Dimensions South Design..................................................................................................... 44
5.3 Water Balance North river branch ...................................................................................... 51
VI
Dimensions North Design .................................................................................................... 53
5.4 Material/costs ................................................................................................................... 60
5.5 SWOT – Analysis ................................................................................................................ 62
5.6 Result & discussion Confrontation Matrix ........................................................................... 66
5.7 Conclusion ........................................................................................................................ 67
6 Conclusion............................................................................................................................... 68
Recommendation ................................................................................................................... 69
Bibliography ............................................................................................................................... 70
Appendix I River selection ........................................................................................................... 71
Appendix II Characteristics .......................................................................................................... 90
Appendix III Stakeholder analysis ............................................................................................... 109
Appendix IV Design report......................................................................................................... 120
7
Introduction
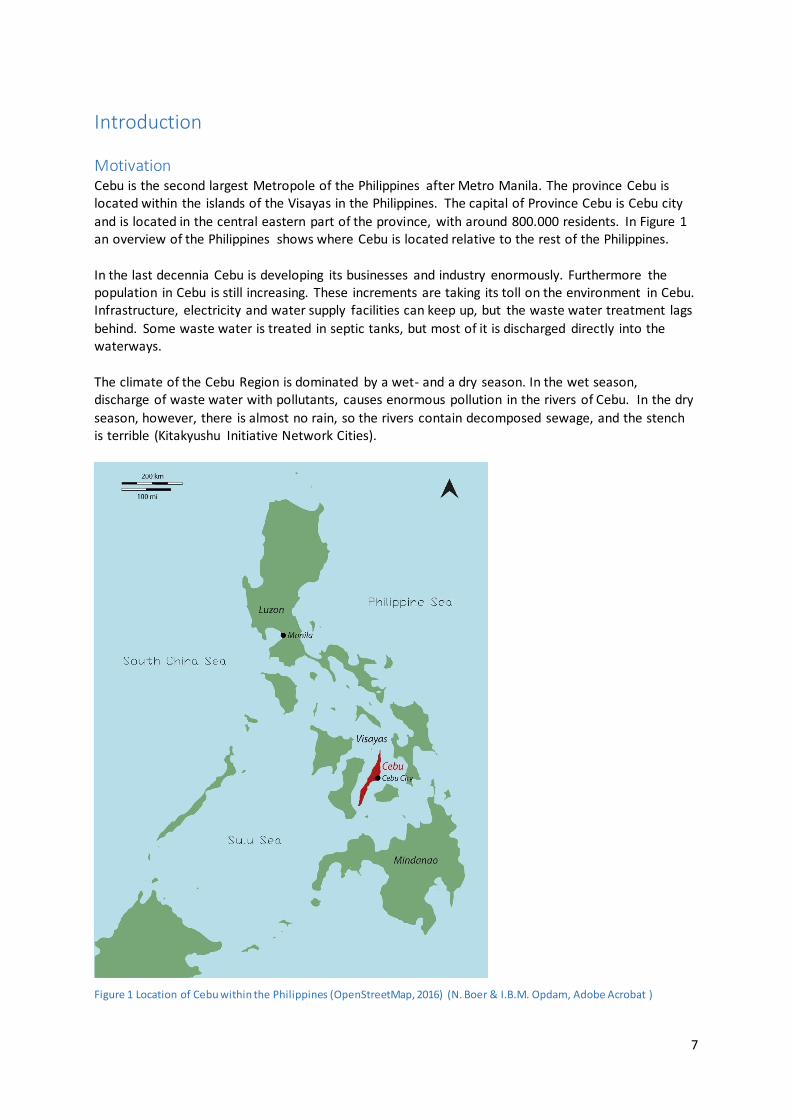
Motivation Cebu is the second largest Metropole of the Philippines after Metro Manila. The province Cebu is located within the islands of the Visayas in the Philippines. The capital of Province Cebu is Cebu city
and is located in the central eastern part of the province, with around 800.000 residents. In Figure 1 an overview of the Philippines shows where Cebu is located relative to the rest of the Philippines.
In the last decennia Cebu is developing its businesses and industry enormously. Furthermore the population in Cebu is still increasing. These increments are taking its toll on the environment in Cebu. Infrastructure, electricity and water supply facilities can keep up, but the waste water treatment lags
behind. Some waste water is treated in septic tanks, but most of it is discharged directly into the waterways.
The climate of the Cebu Region is dominated by a wet- and a dry season. In the wet season, discharge of waste water with pollutants, causes enormous pollution in the rivers of Cebu. In the dry
season, however, there is almost no rain, so the rivers contain decomposed sewage, and the stench is terrible (Kitakyushu Initiative Network Cities).
Figure 1 Location of Cebu within the Philippines (OpenStreetMap, 2016) (N. Boer & I.B.M. Opdam, Adobe Acrobat )
8
Problem The enormous pollution because of the lag of the waste water treatment in Cebu caused the interest in the waterways of Cebu. The first few weeks of field research have shown highly contaminated water bodies in Cebu, depriving the residents from their quality of life significantly. News bureau
Sunstar and an interview with City Counsellor Edmund Lao confirm these as major issues (Sunstar, 2015) (Lao, City Counselor of Danao, 2016). Furthermore, flood hazard maps shown the waterways in Cebu are under threat of floods because of storm water runoff (Nationwide Operational Assessment
of Hazards, 2016). Multiple news articles from Cebu Daily News show the major impact these floods have on its surroundings, because of a shortage in water storage (Cebu Daily News, 2013).
Objective The goal of this research is to increase the water storage and find a solution for the water quality problems in a river in Cebu. This is done with a design that can store water and influence the water flow. By increasing the water storage the impact of heavy rainfall will be reduced and the discharge
of waste will be constant. It is the intension that the stakeholders create awareness of this life improving opportunity.
Research questions In order to find out how the design can contribute solving these problems the following research questions are created. The main research question is: “Which recommendations can be given to
increase the water storage and to improve the river’s water quality of a river in Cebu?”. This research question can be divided into multiple sub questions.
I. Which river is most interesting and usable to explore?
This question determines what river to choose in Cebu to have the most success.
II. What are the (spatial) characteristics of the Tangon River’s catchment area that enhance the
risks for floods and pollution?
This question will result in different maps showing the specific critical problems and
opportunities.
III. Which stakeholders to take in account looking for possible measures?
Stakeholders will be identified and researched for advice and possible contribution.
IV. What design contributes in increasing water storage and improving of the river’s water
quality?
In this question the design will be created connecting it to one of the locations chosen
before.
Structure First the used methodology is discussed in chapter 1. Secondly, research question I. called “River Selection” is answered in chapter 2. Chapter 3 is called “Characteristics”, this chapter answers research question II. Research question III, called “stakeholders analysis” is answered in chapter 4.
Afterwards, research question IV is answered in chapter 5, called “Design”. Chapter 6 gives a conclusion with a recommendation of the research.
9
1 Methodology This chapter describes the method used to answer each sub question. These methods can be data collection, surveys, field studies, MCA’s etc.
1.1 Sub question: River selection The first sub question is: “Which river is most interesting and usable to explore?”. The answer to this
question will tell which river has the problems we want to tackle and has the most opportunities
within its region.
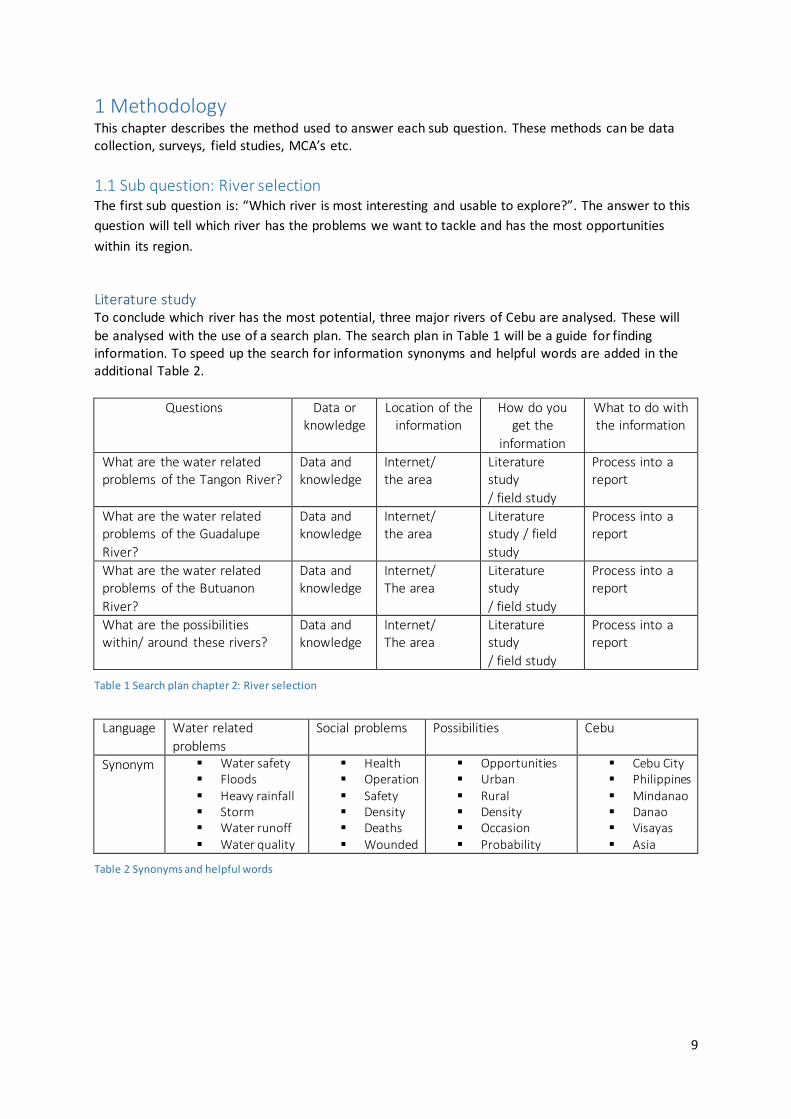
Literature study To conclude which river has the most potential, three major rivers of Cebu are analysed. These will
be analysed with the use of a search plan. The search plan in Table 1 will be a guide for finding information. To speed up the search for information synonyms and helpful words are added in the additional Table 2.
Questions Data or knowledge
Location of the information
How do you get the
information
What to do with the information
What are the water related problems of the Tangon River?
Data and knowledge
Internet/ the area
Literature study
/ field study
Process into a report
What are the water related problems of the Guadalupe
River?
Data and knowledge
Internet/ the area
Literature study / field
study
Process into a report
What are the water related problems of the Butuanon
River?
Data and knowledge
Internet/ The area
Literature study
/ field study
Process into a report
What are the possibilities within/ around these rivers?
Data and knowledge
Internet/ The area
Literature study
/ field study
Process into a report
Table 1 Search plan chapter 2: River selection
Language Water related
problems
Social problems Possibilities Cebu
Synonym
Water safety Floods Heavy rainfall Storm Water runoff Water quality
Health Operation Safety Density Deaths Wounded
Opportunities Urban Rural Density Occasion Probability
Cebu City Philippines Mindanao Danao Visayas Asia
Table 2 Synonyms and helpful words
10
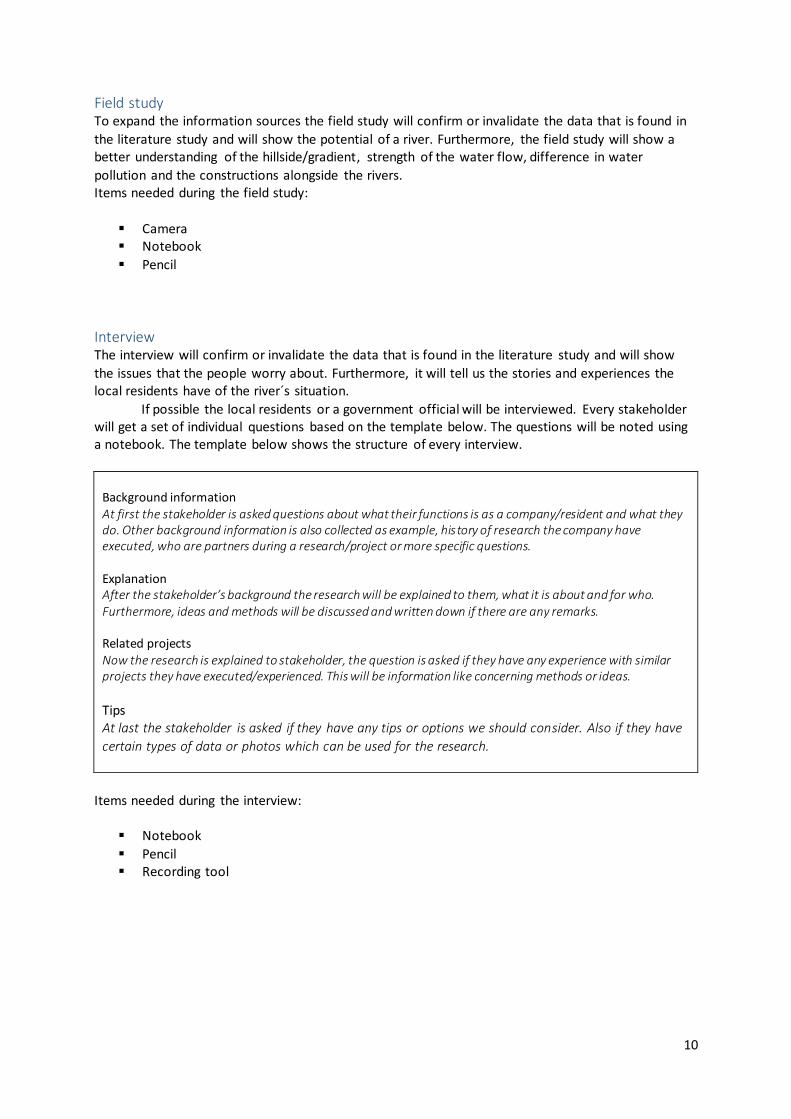
Field study To expand the information sources the field study will confirm or invalidate the data that is found in
the literature study and will show the potential of a river. Furthermore, the field study will show a better understanding of the hillside/gradient, strength of the water flow, difference in water
pollution and the constructions alongside the rivers. Items needed during the field study:
Camera Notebook
Pencil
Interview The interview will confirm or invalidate the data that is found in the literature study and will show
the issues that the people worry about. Furthermore, it will tell us the stories and experiences the local residents have of the river´s situation.
If possible the local residents or a government official will be interviewed. Every stakeholder will get a set of individual questions based on the template below. The questions will be noted using a notebook. The template below shows the structure of every interview.
Background information At first the stakeholder is asked questions about what their functions is as a company/resident and what they do. Other background information is also collected as example, history of research the company have executed, who are partners during a research/project or more specific questions. Explanation After the stakeholder’s background the research will be explained to them, what it is about and for who. Furthermore, ideas and methods will be discussed and written down if there are any remarks. Related projects Now the research is explained to stakeholder, the question is asked if they have any experience with similar projects they have executed/experienced. This will be information like concerning methods or ideas.
Tips At last the stakeholder is asked if they have any tips or options we should consider. Also if they have
certain types of data or photos which can be used for the research.
Items needed during the interview:
Notebook
Pencil Recording tool
11
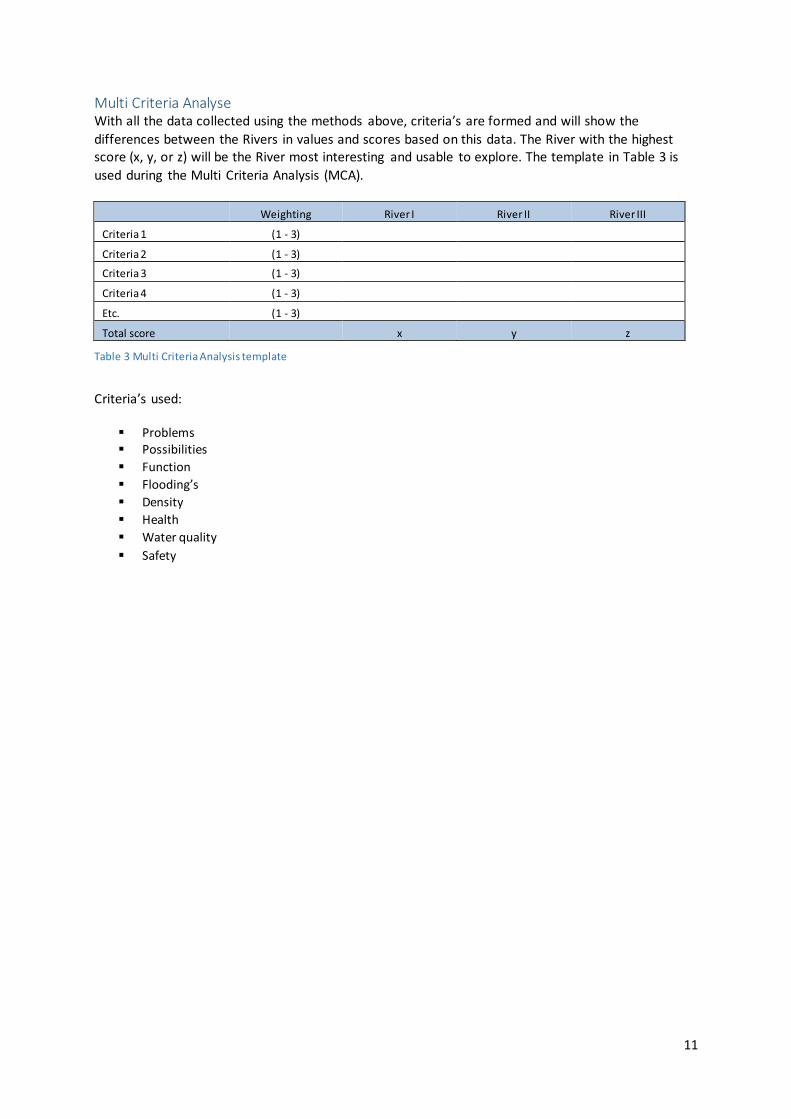
Multi Criteria Analyse With all the data collected using the methods above, criteria’s are formed and will show the
differences between the Rivers in values and scores based on this data. The River with the highest score (x, y, or z) will be the River most interesting and usable to explore. The template in Table 3 is
used during the Multi Criteria Analysis (MCA).
Weighting River I River II River III
Criteria 1 (1 - 3)
Criteria 2 (1 - 3)
Criteria 3 (1 - 3)
Criteria 4 (1 - 3)
Etc. (1 - 3)
Total score x y z
Table 3 Multi Criteria Analysis template
Criteria’s used:
Problems Possibilities
Function
Flooding’s
Density
Health
Water quality
Safety
12
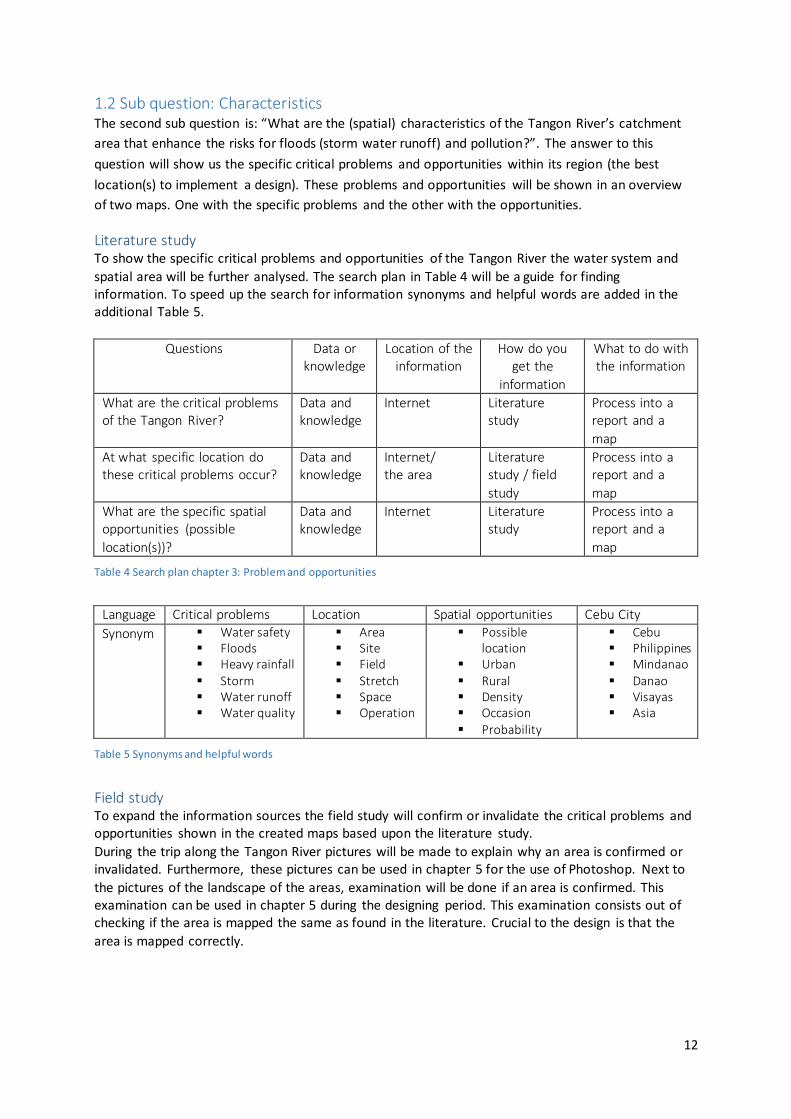
1.2 Sub question: Characteristics The second sub question is: “What are the (spatial) characteristics of the Tangon River’s catchment
area that enhance the risks for floods (storm water runoff) and pollution?”. The answer to this
question will show us the specific critical problems and opportunities within its region (the best
location(s) to implement a design). These problems and opportunities will be shown in an overview
of two maps. One with the specific problems and the other with the opportunities.
Literature study To show the specific critical problems and opportunities of the Tangon River the water system and
spatial area will be further analysed. The search plan in Table 4 will be a guide for finding information. To speed up the search for information synonyms and helpful words are added in the additional Table 5.
Questions Data or knowledge
Location of the information
How do you get the
information
What to do with the information
What are the critical problems of the Tangon River?
Data and knowledge
Internet Literature study
Process into a report and a
map
At what specific location do these critical problems occur?
Data and knowledge
Internet/ the area
Literature study / field
study
Process into a report and a
map
What are the specific spatial opportunities (possible
location(s))?
Data and knowledge
Internet Literature study
Process into a report and a
map
Table 4 Search plan chapter 3: Problem and opportunities
Language Critical problems Location Spatial opportunities Cebu City
Synonym
Water safety Floods Heavy rainfall Storm Water runoff Water quality
Area Site Field Stretch Space Operation
Possible location
Urban Rural Density Occasion Probability
Cebu Philippines Mindanao Danao Visayas Asia
Table 5 Synonyms and helpful words
Field study To expand the information sources the field study will confirm or invalidate the critical problems and opportunities shown in the created maps based upon the literature study.
During the trip along the Tangon River pictures will be made to explain why an area is confirmed or invalidated. Furthermore, these pictures can be used in chapter 5 for the use of Photoshop. Next to
the pictures of the landscape of the areas, examination will be done if an area is confirmed. This examination can be used in chapter 5 during the designing period. This examination consists out of checking if the area is mapped the same as found in the literature. Crucial to the design is that the
area is mapped correctly.
13
Items needed during the field study:
Camera Notebook
Pencil Measurement tool
1.3 Sub question: Stakeholder analysis The third sub question is: “Which stakeholders to take in account looking for possible measures?”. It is important to know which stakeholders are involved when working towards a design. In this sub
question stakeholders will be interviewed and will be asked if they have any advice for the development of the design.
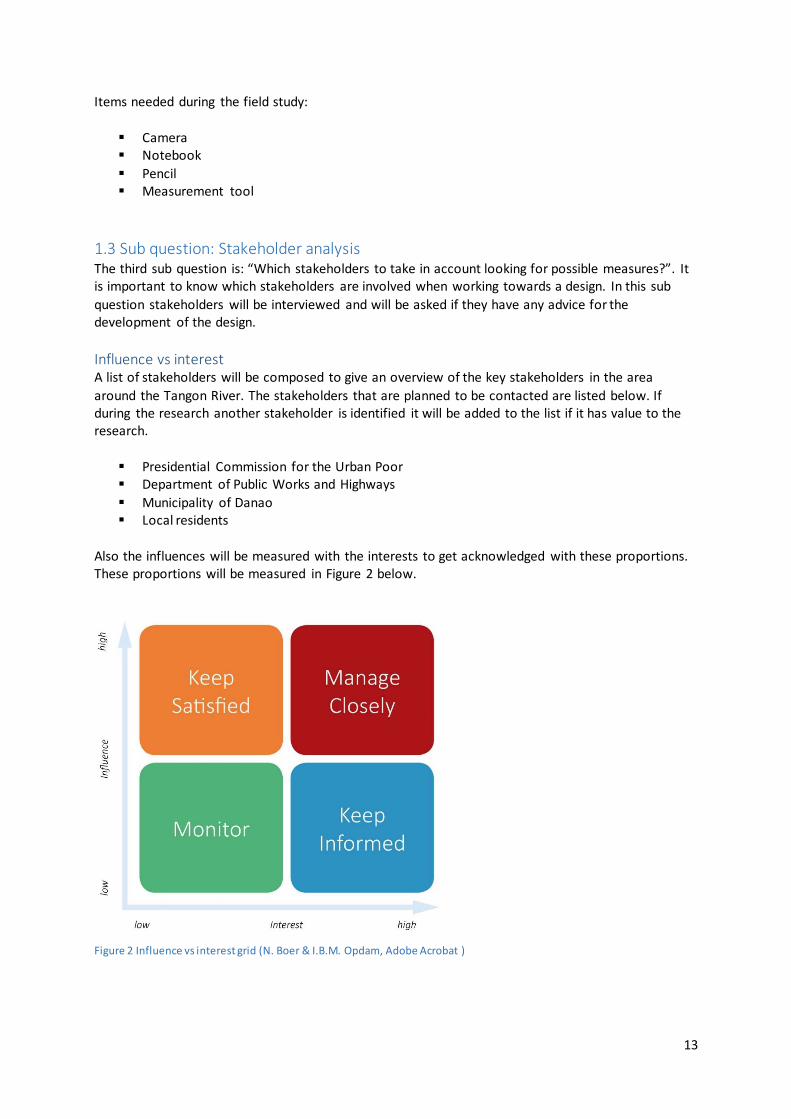
Influence vs interest A list of stakeholders will be composed to give an overview of the key stakeholders in the area
around the Tangon River. The stakeholders that are planned to be contacted are listed below. If during the research another stakeholder is identified it will be added to the list if it has value to the research.
Presidential Commission for the Urban Poor Department of Public Works and Highways
Municipality of Danao Local residents
Also the influences will be measured with the interests to get acknowledged with these proportions. These proportions will be measured in Figure 2 below.
Figure 2 Influence vs interest grid (N. Boer & I.B.M. Opdam, Adobe Acrobat )
14
Interview The interview will confirm or invalidate the data that is put into the two maps and will tell if
adjustments are needed. Furthermore, sketches of possible solutions are shown to the stakeholders. The thoughts and possible advice the stakeholders have will be noted. This will eventually contribute
in designing in chapter 5. If possible the local residents or a government official will be interviewed. Every stakeholder
will get a set of individual questions based on the template below. The questions will be noted using
a notebook. The template below shows the structure of every interview.
Background information At first the stakeholder is asked questions about what their functions is as a company/resident and what they do. Other background information is also collected as example, history of research the company have executed, who are partners during a research/project or more specific questions. Explanation After the stakeholder’s background the research will be explained to them, what it is about and for who. Furthermore, ideas and methods will be discussed and written down if there are any remarks. Related projects Now the research is explained to stakeholder, the question is asked if they have any experience with similar projects they have executed/experienced. This will be information like concerning methods or ideas.
Tips
At last the stakeholder is asked if they have any tips or options we should consider. Also if they have certain types of data or photos which can be used for the research.
Items needed during the interview:
Notebook Pencil Sketches
Recording tool
1.4 Sub question: Design The fourth sub question is: “What design is possible on which location(s)?”. The answer to this
question will result into a design that will show the opportunities for the Tangon River to reduce the storm water runoff, increase the water storage and to improve the river quality.
Program of requirements To ensure the quality of the design a program of requirement has been setup. The design needs to
meet these requirement to be successful. The design functions are divided into soft- and hard design functions. Hard design functions are required for the design and soft design functions are optional.
Furthermore, the boundary conditions are set to ensure the mind map has enough focus to the main goal.
15
Mind Map To organise al the possible ideas during the brainstorms the Mind Map is used. The Mind Map will
help to find as many ideas as possible and organize them. It is of importance to set the main goal and to divide the main points from the sub points. This will create the overview of all the ideas and gives
the chance to discuss them.
Design To ensure the design is from high quality, multiple designs will be made. Each design its positive and negative side will be discussed to see if it is an option.
The following material and software is used creating the design:
Adobe Illustrator
Adobe Photoshop Adobe InDesign Sketch Up
Pencil Ruler
Eraser
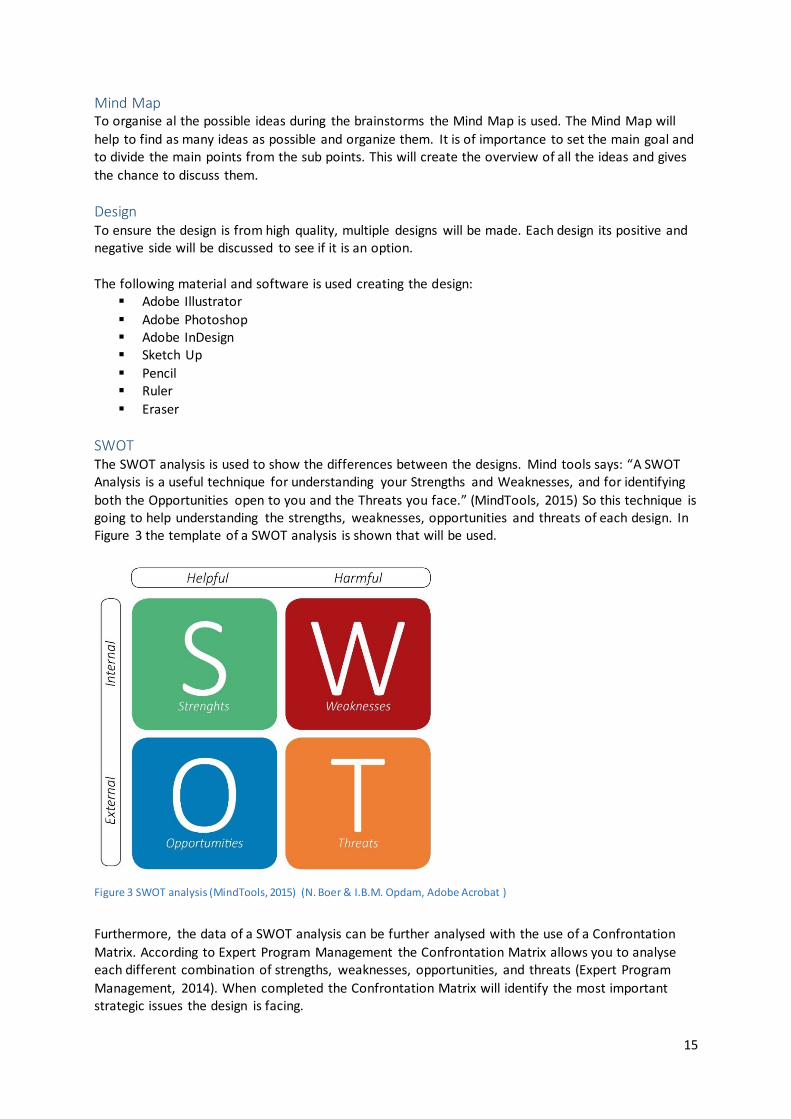
SWOT The SWOT analysis is used to show the differences between the designs. Mind tools says: “A SWOT Analysis is a useful technique for understanding your Strengths and Weaknesses, and for identifying
both the Opportunities open to you and the Threats you face.” (MindTools, 2015) So this technique is going to help understanding the strengths, weaknesses, opportunities and threats of each design. In Figure 3 the template of a SWOT analysis is shown that will be used.
Figure 3 SWOT analysis (MindTools, 2015) (N. Boer & I.B.M. Opdam, Adobe Acrobat )
Furthermore, the data of a SWOT analysis can be further analysed with the use of a Confrontation
Matrix. According to Expert Program Management the Confrontation Matrix allows you to analyse each different combination of strengths, weaknesses, opportunities, and threats (Expert Program
Management, 2014). When completed the Confrontation Matrix will identify the most important strategic issues the design is facing.
16
2 River Selection This chapter will give a clear picture about de current situation of three main rivers on Cebu. The three main rivers in Cebu are; Guadalupe River, Batuanon River and the Tangon River. With a water system analysis and a Multi Criteria Analysis it will be possible to choose the river with the biggest
problems and opportunities and so to answer the sub question: Which river is most interesting and usable to explore?
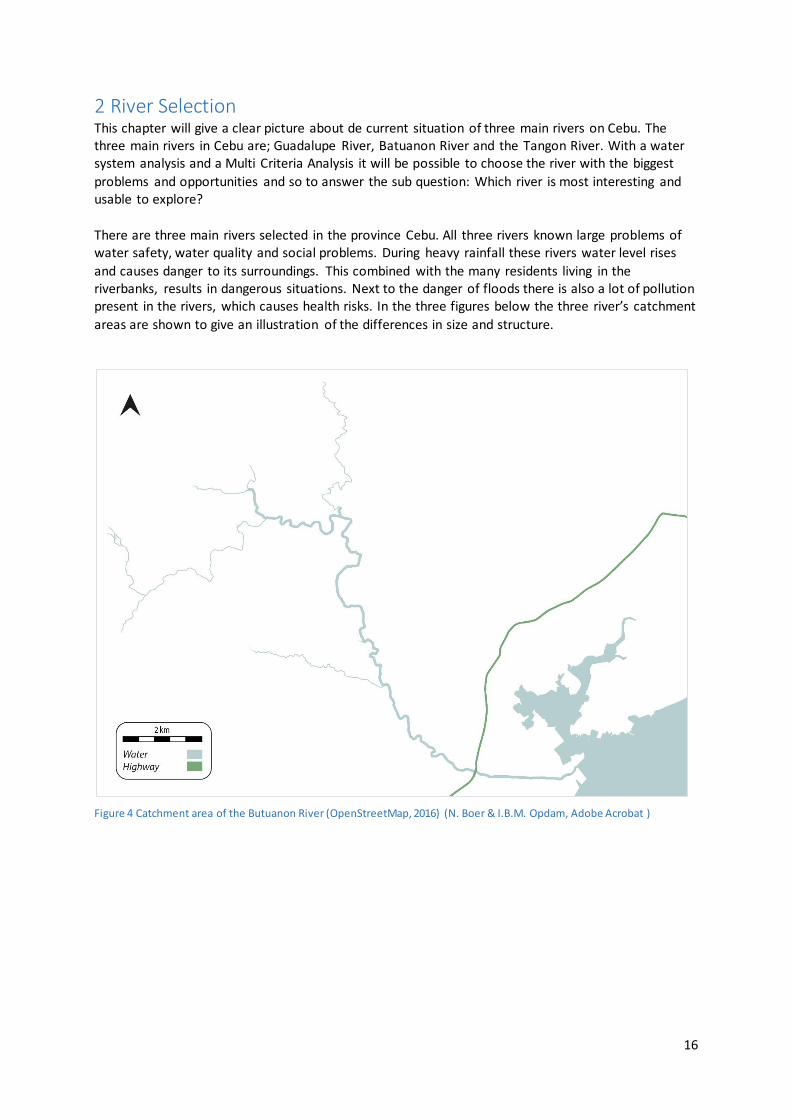
There are three main rivers selected in the province Cebu. All three rivers known large problems of water safety, water quality and social problems. During heavy rainfall these rivers water level rises
and causes danger to its surroundings. This combined with the many residents living in the riverbanks, results in dangerous situations. Next to the danger of floods there is also a lot of pollution present in the rivers, which causes health risks. In the three figures below the three river’s catchment
areas are shown to give an illustration of the differences in size and structure.
Figure 4 Catchment area of the Butuanon River (OpenStreetMap, 2016) (N. Boer & I.B.M. Opdam, Adobe Acrobat )
17
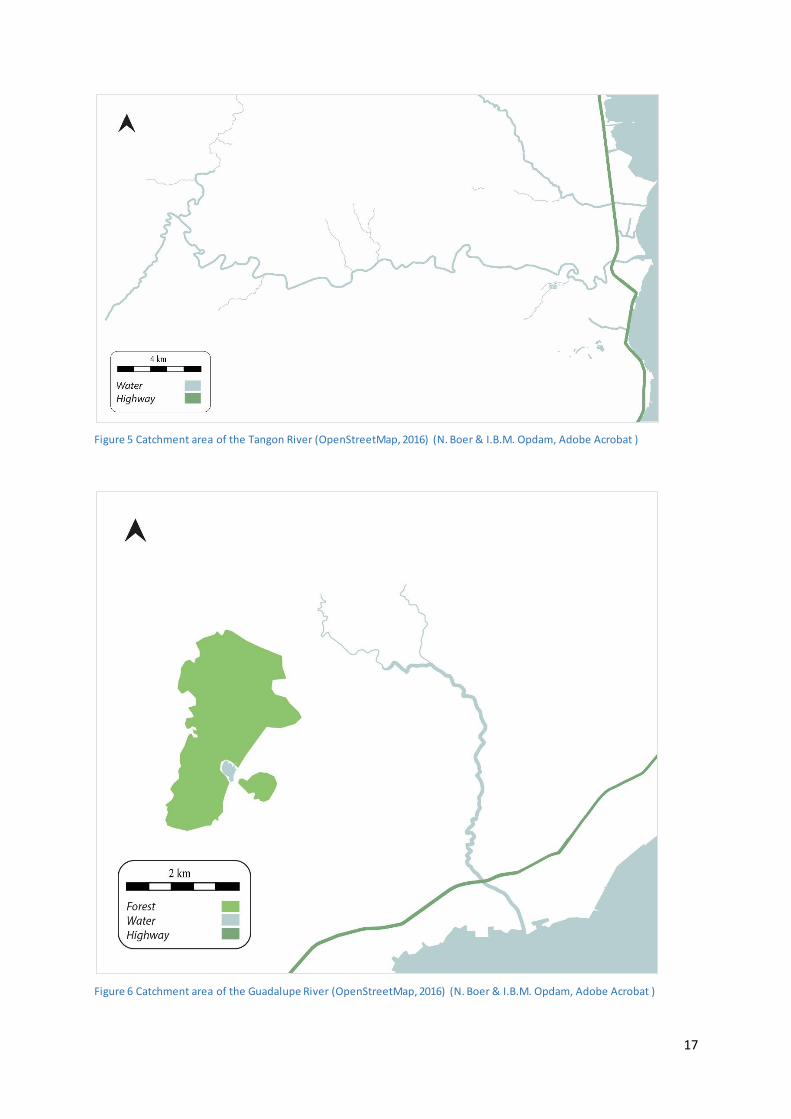
Figure 5 Catchment area of the Tangon River (OpenStreetMap, 2016) (N. Boer & I.B.M. Opdam, Adobe Acrobat )
Figure 6 Catchment area of the Guadalupe River (OpenStreetMap, 2016) (N. Boer & I.B.M. Opdam, Adobe Acrobat )
18
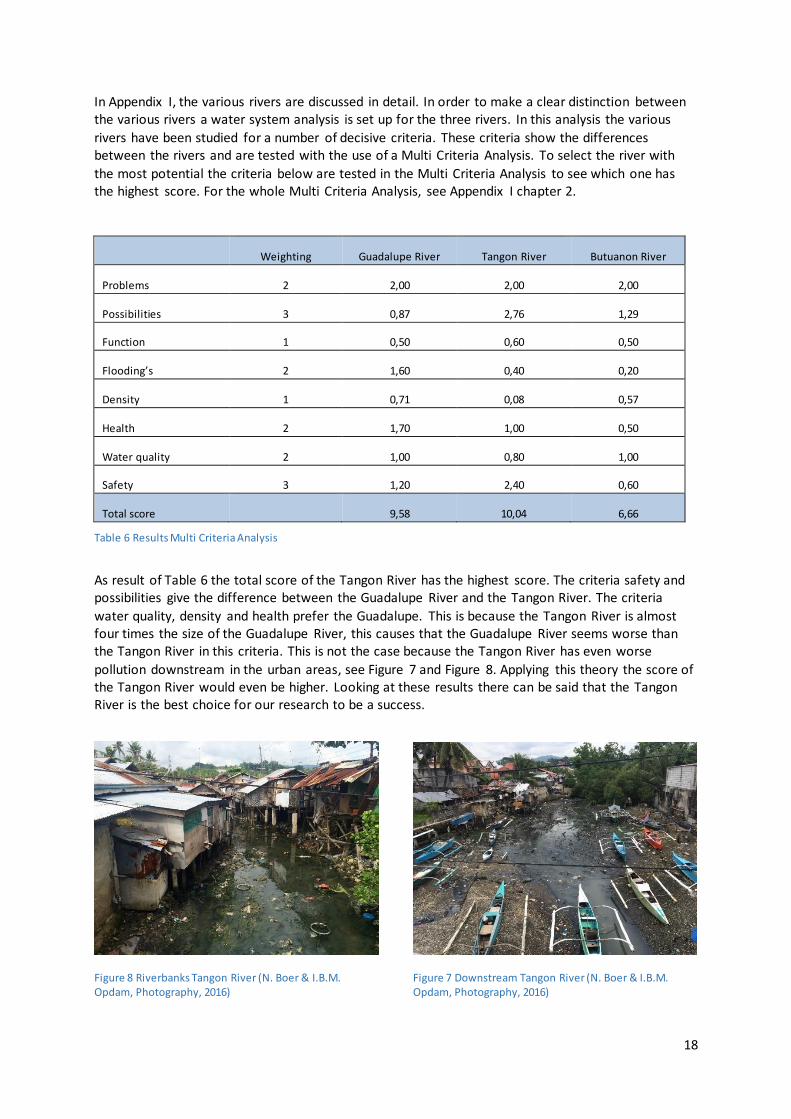
In Appendix I, the various rivers are discussed in detail. In order to make a clear distinction between the various rivers a water system analysis is set up for the three rivers. In this analysis the various
rivers have been studied for a number of decisive criteria. These criteria show the differences between the rivers and are tested with the use of a Multi Criteria Analysis. To select the river with
the most potential the criteria below are tested in the Multi Criteria Analysis to see which one has the highest score. For the whole Multi Criteria Analysis, see Appendix I chapter 2.
Weighting Guadalupe River Tangon River Butuanon River
Problems 2 2,00 2,00 2,00
Possibilities 3 0,87 2,76 1,29
Function 1 0,50 0,60 0,50
Flooding’s 2 1,60 0,40 0,20
Density 1 0,71 0,08 0,57
Health 2 1,70 1,00 0,50
Water quality 2 1,00 0,80 1,00
Safety 3 1,20 2,40 0,60
Total score 9,58 10,04 6,66
Table 6 Results Multi Criteria Analysis
As result of Table 6 the total score of the Tangon River has the highest score. The criteria safety and possibilities give the difference between the Guadalupe River and the Tangon River. The criteria
water quality, density and health prefer the Guadalupe. This is because the Tangon River is almost four times the size of the Guadalupe River, this causes that the Guadalupe River seems worse than the Tangon River in this criteria. This is not the case because the Tangon River has even worse
pollution downstream in the urban areas, see Figure 7 and Figure 8. Applying this theory the score of the Tangon River would even be higher. Looking at these results there can be said that the Tangon River is the best choice for our research to be a success.
Figure 8 Riverbanks Tangon River (N. Boer & I.B.M. Opdam, Photography, 2016)
Figure 7 Downstream Tangon River (N. Boer & I.B.M. Opdam, Photography, 2016)
19
3 Characteristics This chapter answers the second sub question: “What are the (spatial) characteristics of the Tangon River’s catchment area that enhance the risks for floods (storm water runoff) and pollution?”. The answer to this question will show us the specific critical problems and opportunities within its region
(the best location(s) to implement a design). These problems are discussed in chapter 3.1 and the opportunities are discussed in chapter 3.2. The findings of the field research are discussed in chapter
3. In the conclusion the critical problems and spatial opportunities are discussed and the sub question will be answered.
3.1 Water characteristics This paragraph reports the difficulties in the water system of the Tangon River, including water
pollution and water safety.
Flooding’s
In the recent decades a flooding of the Tangon River is very common. Especially during extreme weather conditions (such as typhoons). Cebu Daily news and Philstar confirm these flooding’s during extreme weather in multiple articles (Cebu Daily News, 2013) (Philstar, 2013). These articles can be
found in appendix II chapter 1.1.1. These flooding’s cause a serious danger to residents in the riverbanks. Especially, during and
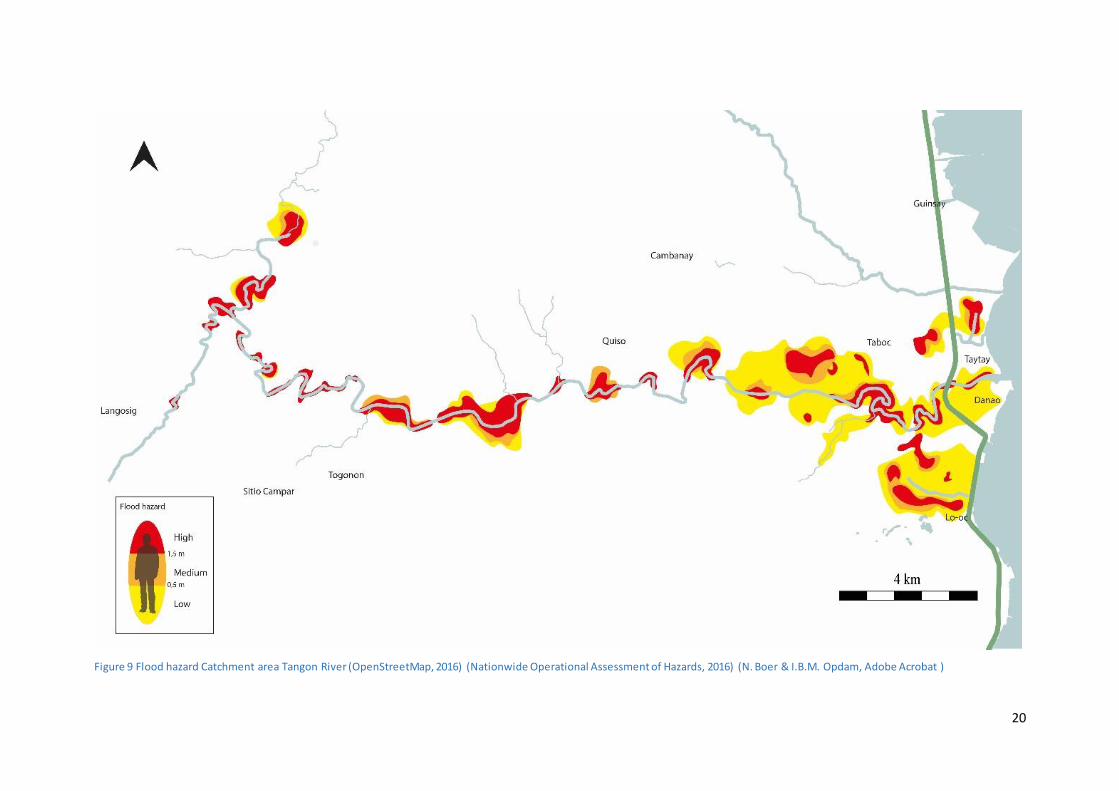
after extreme weather, the water level rises in the Tangon River, what causes in increase of the water current. This leads to dangerous situations for the residents who live close to the river. Figure 65 on the next page shows the flood hazard of the catchment area of the Tangon River
during extreme weather. The flood hazard is shown in three different gradations. The most common flood hazard is the yellow one, these are around the 0,5 metres. The orange one is a medium flood
hazard around 1 metres. And the highest flood hazard is shown in the red colour. This is a rarely situation (once every 10 years) but then creates dangerous situations.
20
Figure 9 Flood hazard Catchment area Tangon River (OpenStreetMap, 2016) (Nationwide Operational Assessment of Hazards, 2016) (N. Boer & I.B.M. Opdam, Adobe Acrobat )
21
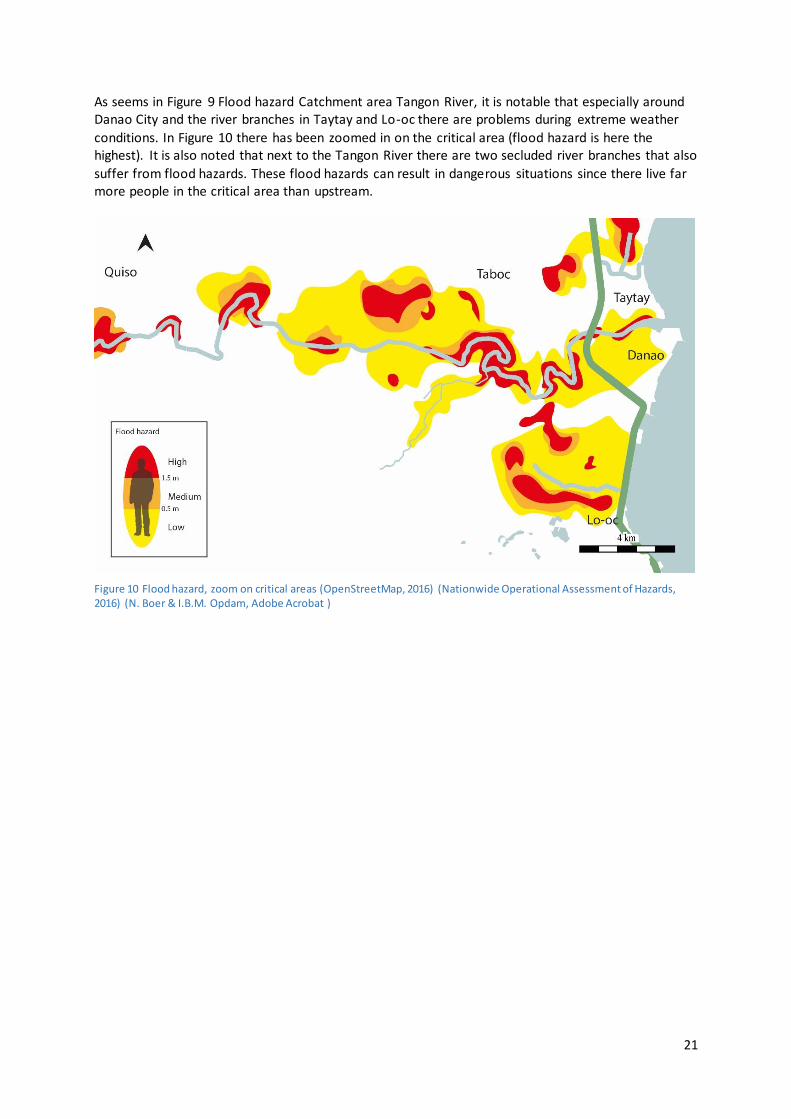
As seems in Figure 9 Flood hazard Catchment area Tangon River, it is notable that especially around Danao City and the river branches in Taytay and Lo-oc there are problems during extreme weather
conditions. In Figure 10 there has been zoomed in on the critical area (flood hazard is here the highest). It is also noted that next to the Tangon River there are two secluded river branches that also
suffer from flood hazards. These flood hazards can result in dangerous situations since there live far more people in the critical area than upstream.
Figure 10 Flood hazard, zoom on critical areas (OpenStreetMap, 2016) (Nationwide Operational Assessment of Hazards, 2016) (N. Boer & I.B.M. Opdam, Adobe Acrobat )
22
Water quality Another water related problem is the water quality. When a drop of water starts flowing though the
Tangon River it encounters multiple obstacles. The water starts relatively clean and ends up polluted. In this paragraph the obstacles for a clean water system are described.
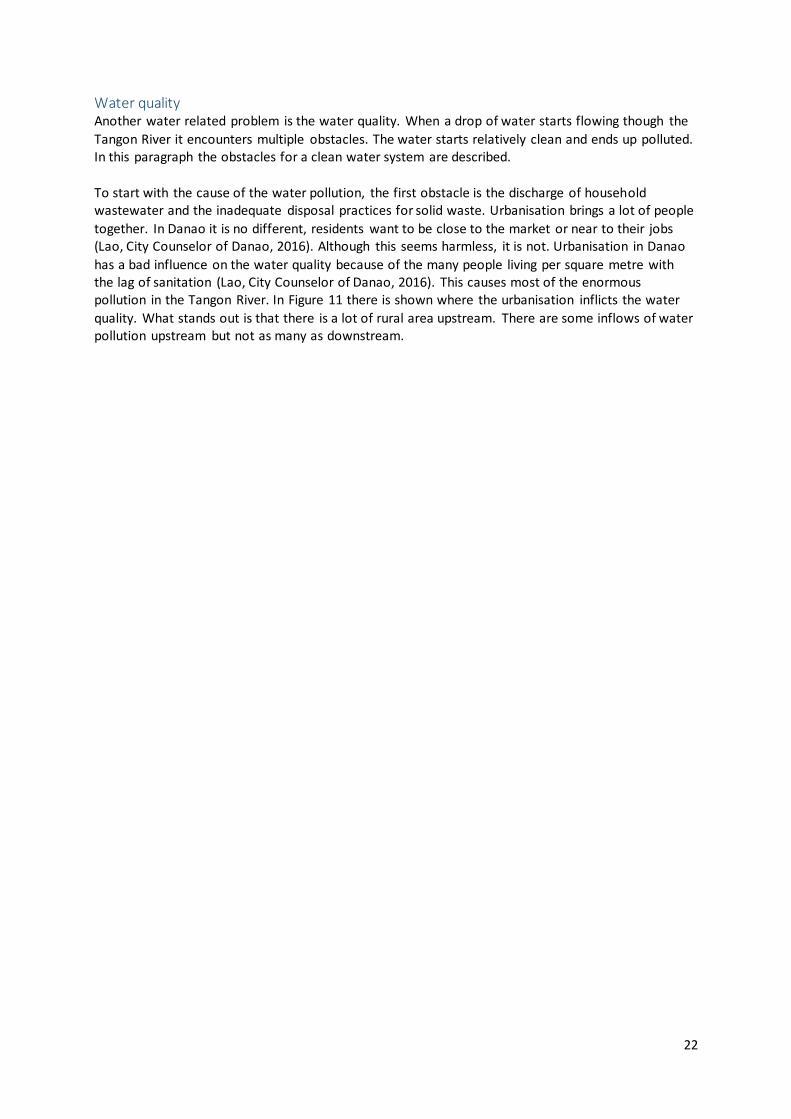
To start with the cause of the water pollution, the first obstacle is the discharge of household wastewater and the inadequate disposal practices for solid waste. Urbanisation brings a lot of people
together. In Danao it is no different, residents want to be close to the market or near to their jobs (Lao, City Counselor of Danao, 2016). Although this seems harmless, it is not. Urbanisation in Danao
has a bad influence on the water quality because of the many people living per square metre with the lag of sanitation (Lao, City Counselor of Danao, 2016). This causes most of the enormous pollution in the Tangon River. In Figure 11 there is shown where the urbanisation inflicts the water
quality. What stands out is that there is a lot of rural area upstream. There are some inflows of water pollution upstream but not as many as downstream.
23
Figure 11 Overview Inflow pollution (OpenStreetMap, 2016) (Google, 2016) (N. Boer & I.B.M. Opdam, Adobe Acrobat )
24
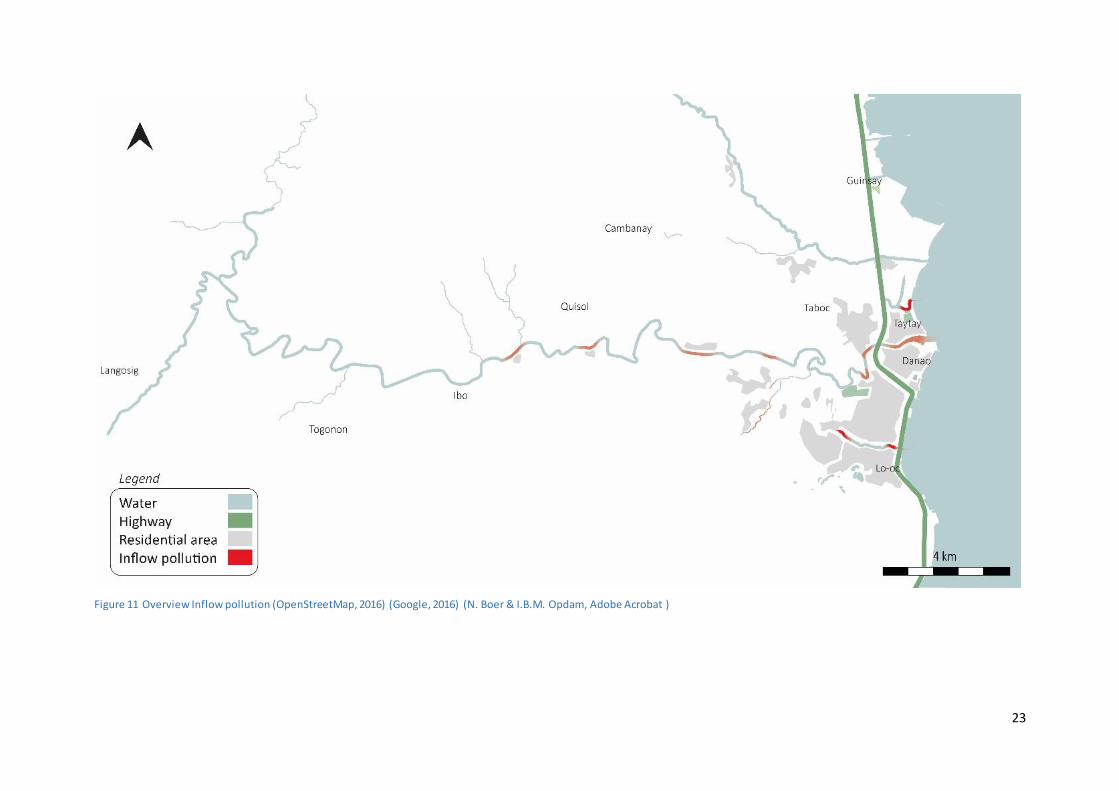
Secluded river branches downstream near Lo-oc and Tay Tay have the most nuisance with pollution. These river branches are secluded from the Tangon River which results into polluted waterways. This
is because these secluded river branches do not have a constant current that otherwise would have washed some solid- and liquid waste away. This is the second obstacle, the missing link between the
Tangon River and the secluded river branches. The secluded river branch near Lo-oc has the most nuisance since there live much more people along the river than in Tay Tay. In the Figure 12 the missing links are shown and a zoomed overview of the inflow of the pollution in the urban areas.
Figure 12 Missing connection from the Tangon River to the secluded river branches (OpenStreetMap, 2016) (N. Boer & I.B.M. Opdam, Field research, 2016) (N. Boer & I.B.M. Opdam, Adobe Acrobat )
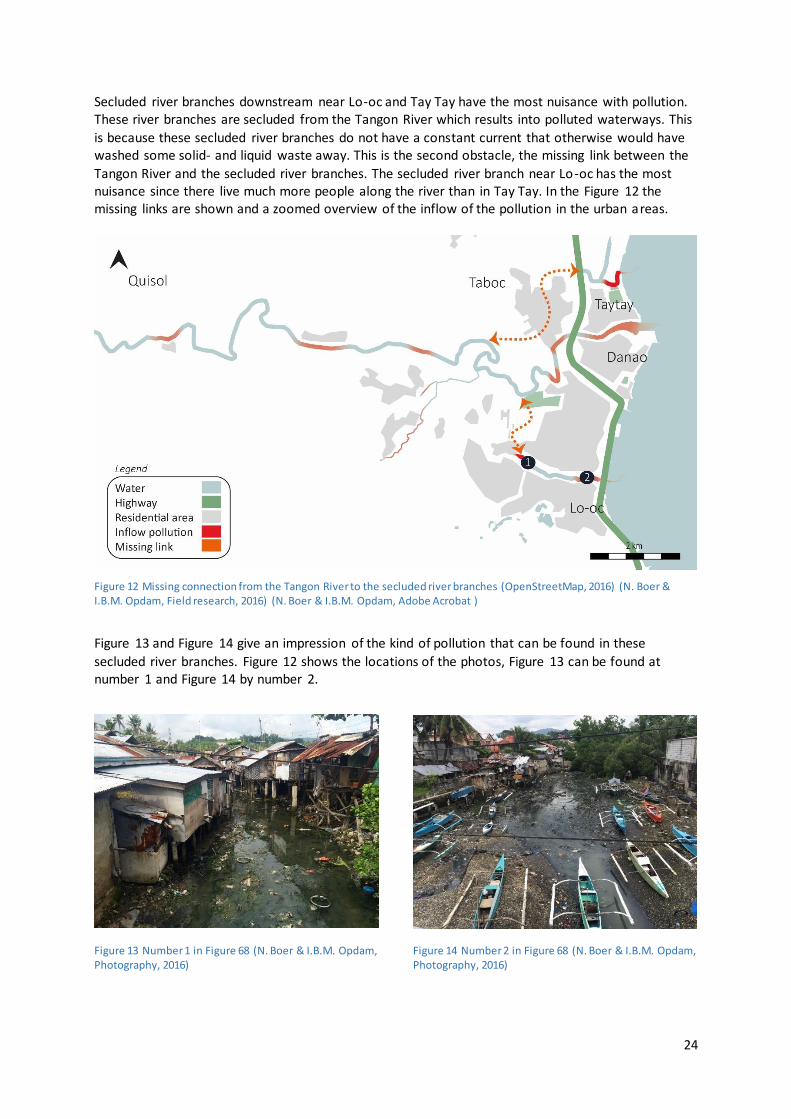
Figure 13 and Figure 14 give an impression of the kind of pollution that can be found in these
secluded river branches. Figure 12 shows the locations of the photos, Figure 13 can be found at number 1 and Figure 14 by number 2.
Figure 13 Number 1 in Figure 68 (N. Boer & I.B.M. Opdam, Photography, 2016)
Figure 14 Number 2 in Figure 68 (N. Boer & I.B.M. Opdam, Photography, 2016)
25
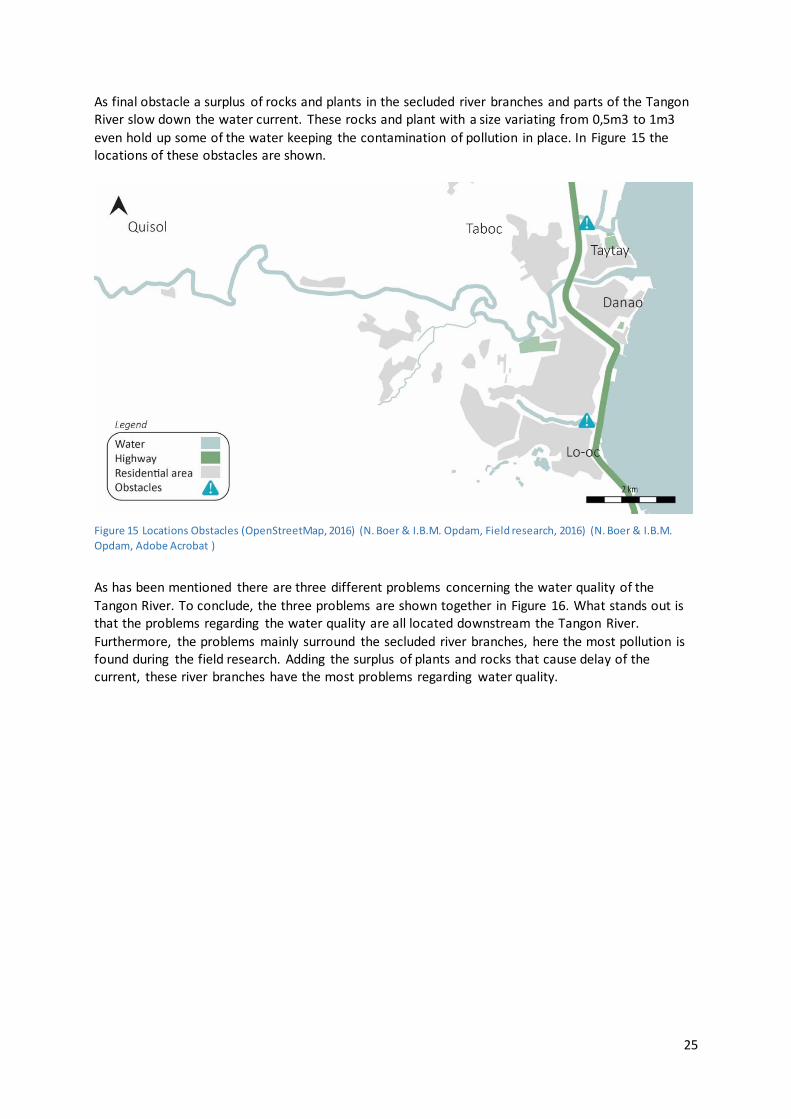
As final obstacle a surplus of rocks and plants in the secluded river branches and parts of the Tangon River slow down the water current. These rocks and plant with a size variating from 0,5m3 to 1m3
even hold up some of the water keeping the contamination of pollution in place. In Figure 15 the locations of these obstacles are shown.
Figure 15 Locations Obstacles (OpenStreetMap, 2016) (N. Boer & I.B.M. Opdam, Field research, 2016) (N. Boer & I.B.M.
Opdam, Adobe Acrobat )
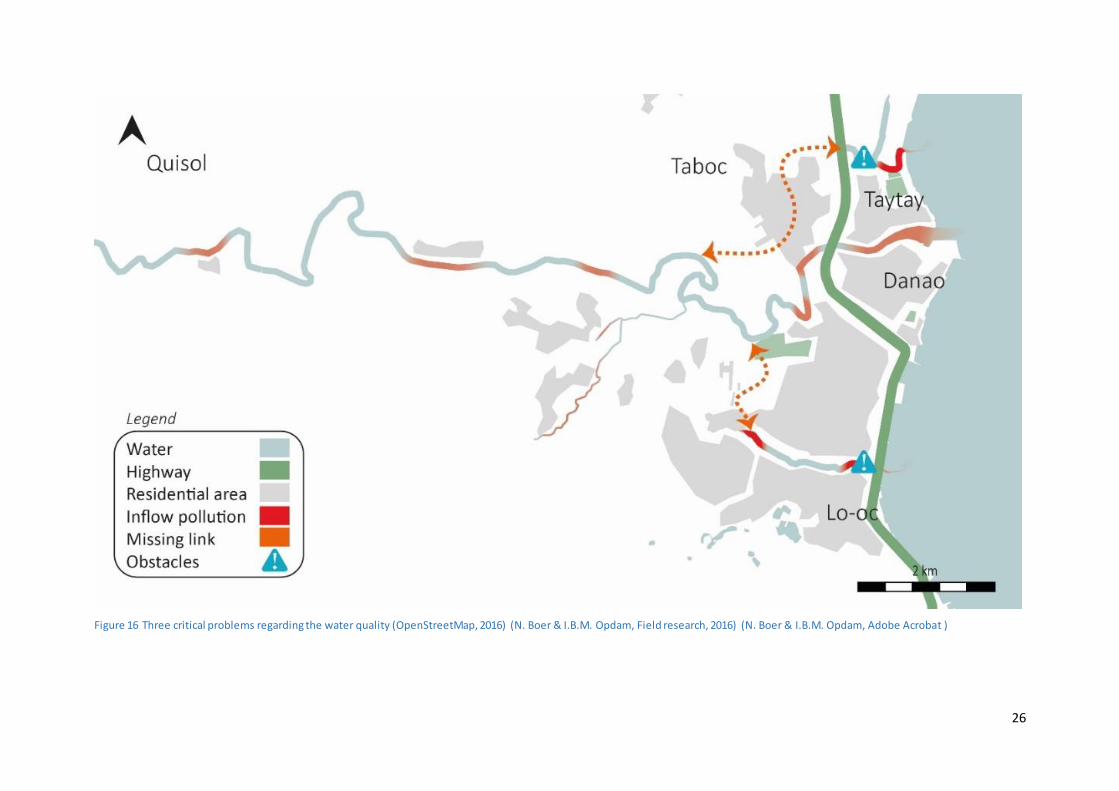
As has been mentioned there are three different problems concerning the water quality of the
Tangon River. To conclude, the three problems are shown together in Figure 16. What stands out is that the problems regarding the water quality are all located downstream the Tangon River.
Furthermore, the problems mainly surround the secluded river branches, here the most pollution is found during the field research. Adding the surplus of plants and rocks that cause delay of the current, these river branches have the most problems regarding water quality.
26
Figure 16 Three critical problems regarding the water quality (OpenStreetMap, 2016) (N. Boer & I.B.M. Opdam, Field research, 2016) (N. Boer & I.B.M. Opdam, Adobe Acrobat )
27
3.1 Social characteristics This paragraph reports the social problems belonging to the residents near the Tangon River. Especially the residents in the riverbanks of the Tangon River
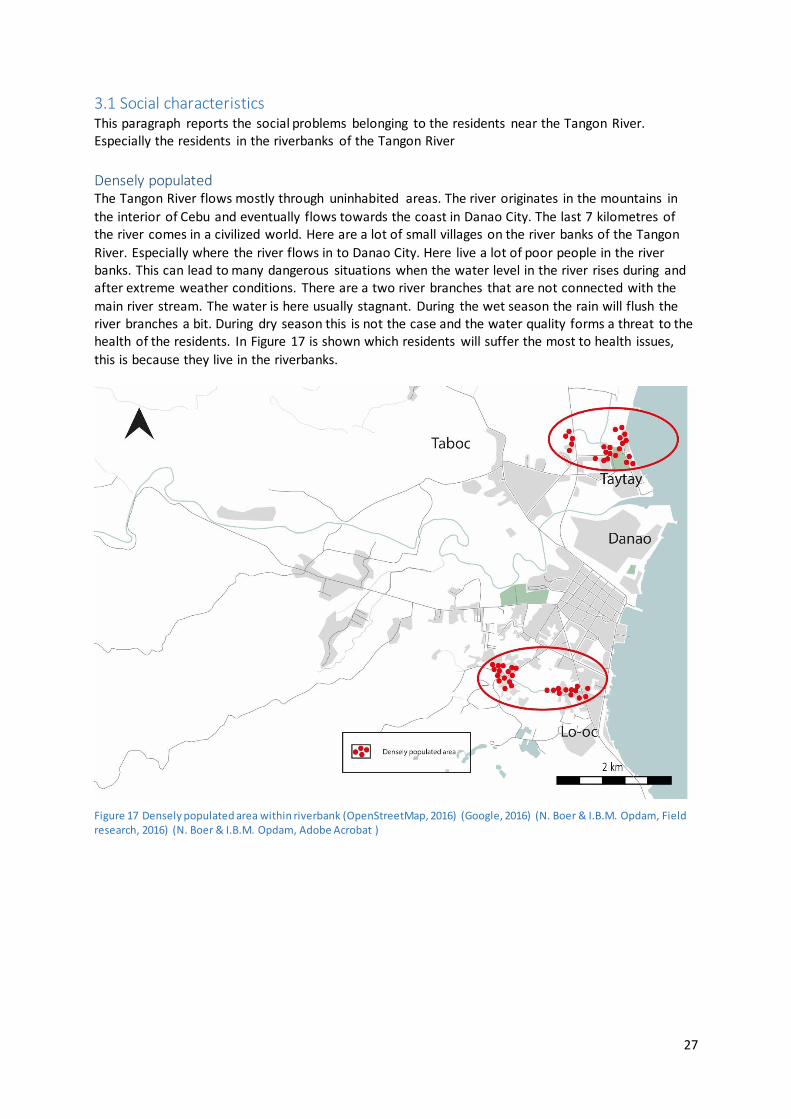
Densely populated The Tangon River flows mostly through uninhabited areas. The river originates in the mountains in
the interior of Cebu and eventually flows towards the coast in Danao City. The last 7 kilometres of the river comes in a civilized world. Here are a lot of small villages on the river banks of the Tangon
River. Especially where the river flows in to Danao City. Here live a lot of poor people in the river banks. This can lead to many dangerous situations when the water level in the river rises during and after extreme weather conditions. There are a two river branches that are not connected with the
main river stream. The water is here usually stagnant. During the wet season the rain will flush the river branches a bit. During dry season this is not the case and the water quality forms a threat to the health of the residents. In Figure 17 is shown which residents will suffer the most to health issues,
this is because they live in the riverbanks.
Figure 17 Densely populated area within riverbank (OpenStreetMap, 2016) (Google, 2016) (N. Boer & I.B.M. Opdam, Field research, 2016) (N. Boer & I.B.M. Opdam, Adobe Acrobat )
28
3.3 Spatial opportunities This paragraph discusses the spatial opportunities along the Tangon River. Since most problems are in the east of the Danao (Downstream), the opportunities will focus on that area. In the text below height differences and urbanisation are discussed looking for suitable areas where designs could be
constructed.
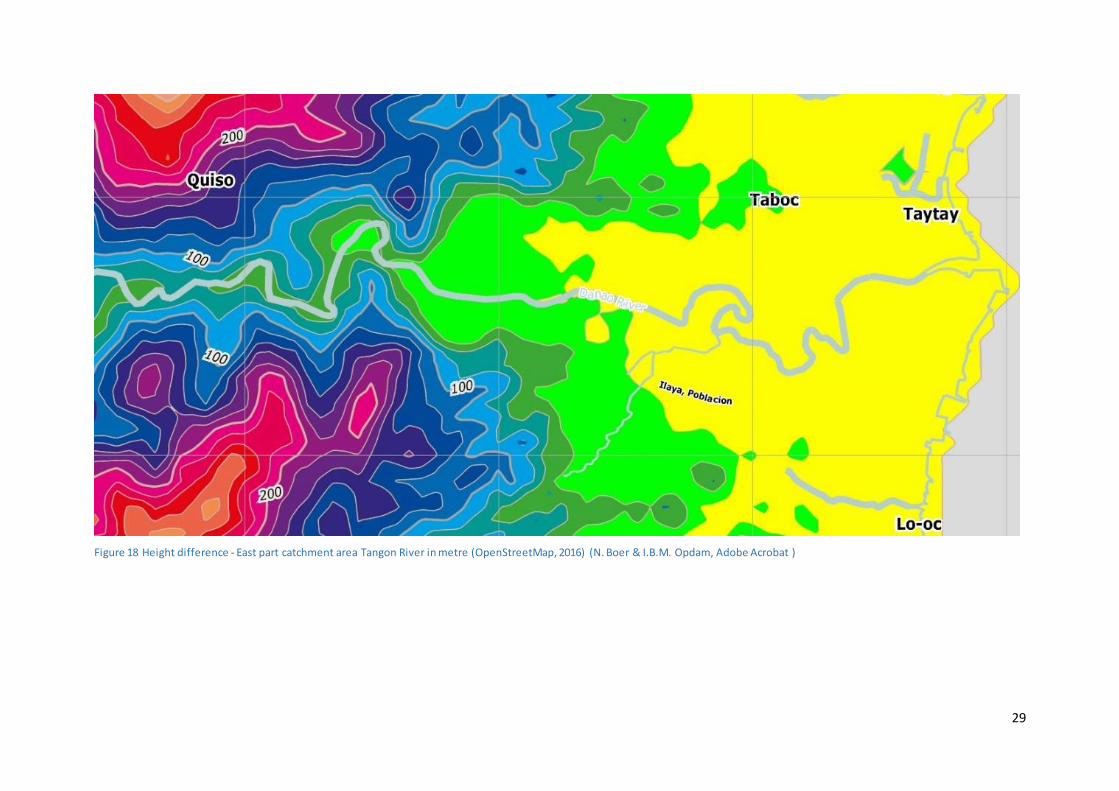
Height characteristics When designing, there should be considered that there are height differences in the catchment area
of the Tangon River, because these heights can cause an obstacle. What stands out is that near the secluded river branches are some hills that could form an obstacle for a design. In Figure 18 the gradient of the eastern part of the catchment area of the Tangon River is shown to give an overview
of the height differences. Furthermore, Ilaya, Poblacion will most likely be the area of interest for the Southern design.
Also it is because of green (higher) areas further south, these areas are to high to implement a design
that will affect the secluded river branch. For the northern area there are more possibilities since this area has less height differences
as seen in Figure 18. For this area there especially needs to be looked at the urban characteristics which is described in the next paragraph.
Geoscience Technologies Inc. explains that the top soil for the lower elevation in Danao is primarily clay loam (Geoscience Technologies Inc., 2013). Furthermore, Geoscience Technologies Inc. tells that it is fertile since it is organic in nature, and it can also retain a portion of water (Geoscience
Technologies Inc., 2013).
29
Figure 18 Height difference - East part catchment area Tangon River in metre (OpenStreetMap, 2016) (N. Boer & I.B.M. Opdam, Adobe Acrobat )
30
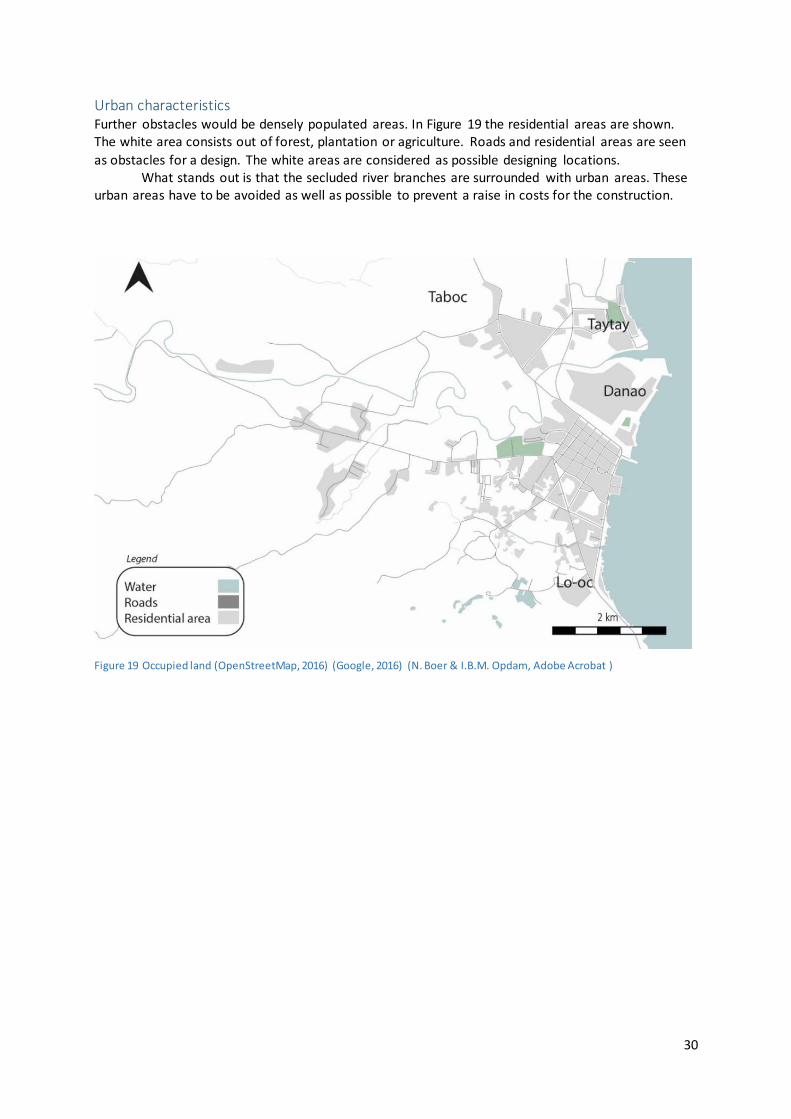
Urban characteristics Further obstacles would be densely populated areas. In Figure 19 the residential areas are shown. The white area consists out of forest, plantation or agriculture. Roads and residential areas are seen
as obstacles for a design. The white areas are considered as possible designing locations. What stands out is that the secluded river branches are surrounded with urban areas. These urban areas have to be avoided as well as possible to prevent a raise in costs for the construction.
Figure 19 Occupied land (OpenStreetMap, 2016) (Google, 2016) (N. Boer & I.B.M. Opdam, Adobe Acrobat )
31
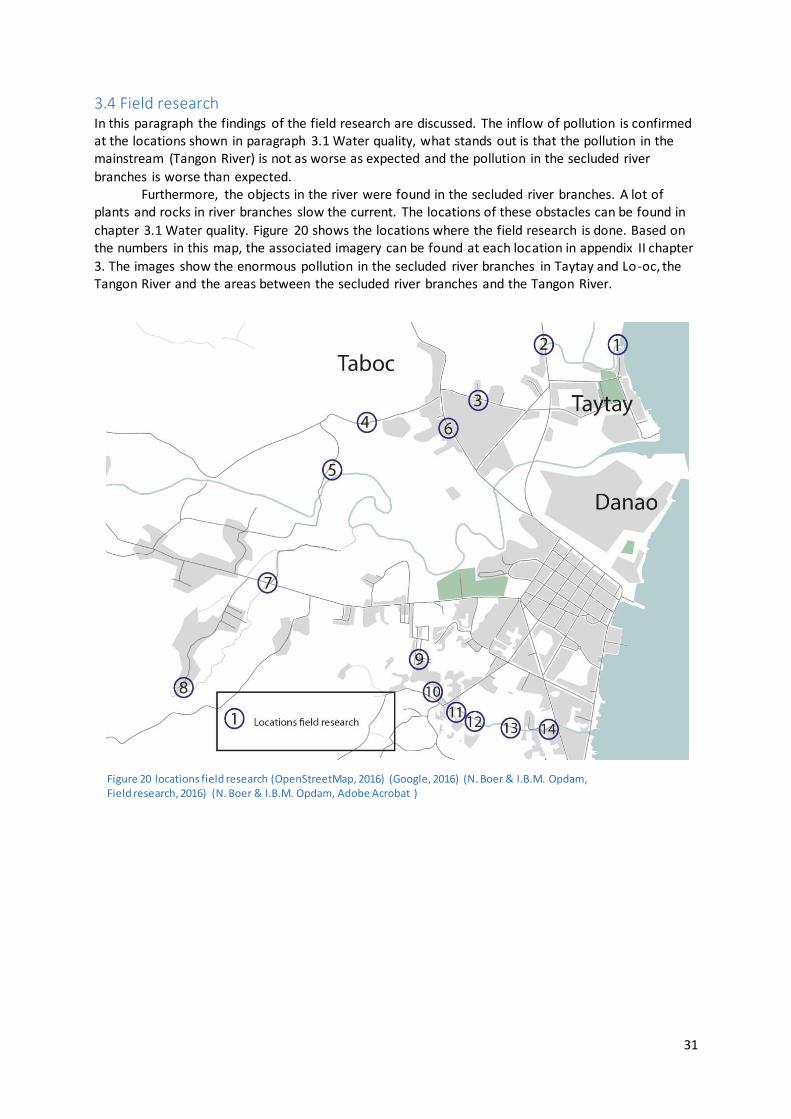
3.4 Field research In this paragraph the findings of the field research are discussed. The inflow of pollution is confirmed at the locations shown in paragraph 3.1 Water quality, what stands out is that the pollution in the mainstream (Tangon River) is not as worse as expected and the pollution in the secluded river
branches is worse than expected. Furthermore, the objects in the river were found in the secluded river branches. A lot of
plants and rocks in river branches slow the current. The locations of these obstacles can be found in
chapter 3.1 Water quality. Figure 20 shows the locations where the field research is done. Based on the numbers in this map, the associated imagery can be found at each location in appendix II chapter
3. The images show the enormous pollution in the secluded river branches in Taytay and Lo-oc, the Tangon River and the areas between the secluded river branches and the Tangon River.
Figure 20 locations field research (OpenStreetMap, 2016) (Google, 2016) (N. Boer & I.B.M. Opdam, Field research, 2016) (N. Boer & I.B.M. Opdam, Adobe Acrobat )
32
3.5 conclusion It is also noted that next to the Tangon River there are two secluded river branches that also suffer from flood hazards. These flood hazards can result in dangerous situations since there live far more people in the critical area than upstream.
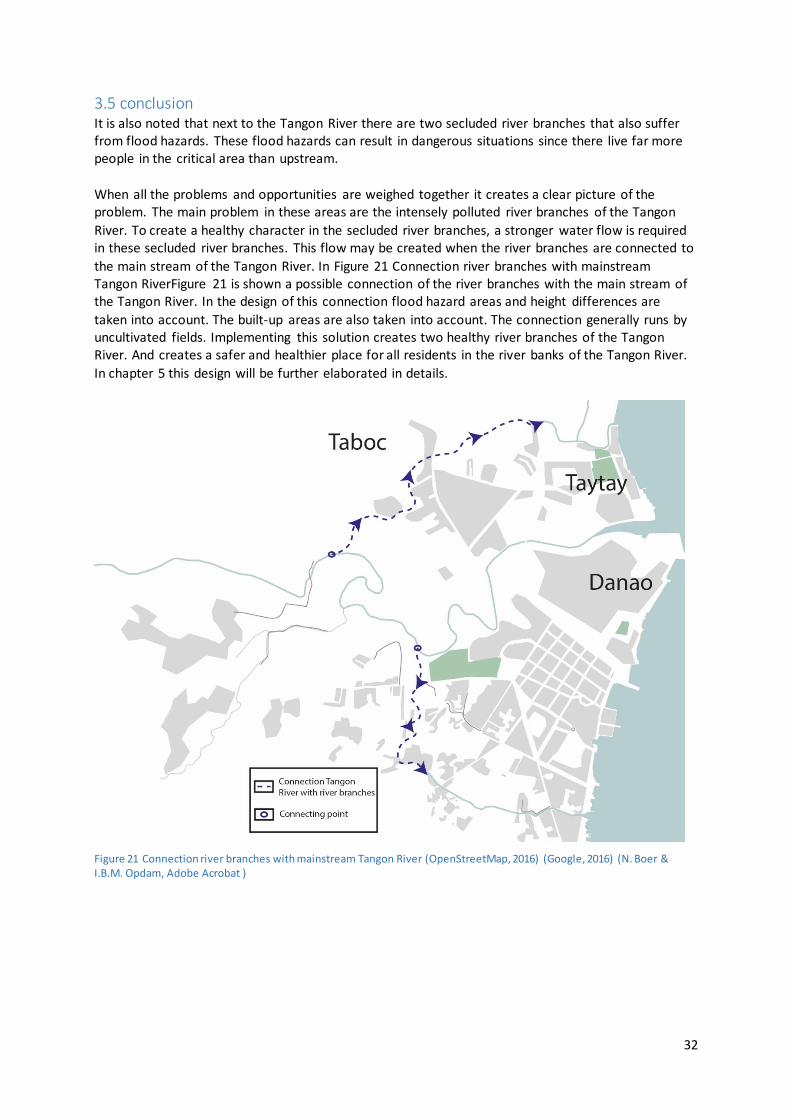
When all the problems and opportunities are weighed together it creates a clear picture of the problem. The main problem in these areas are the intensely polluted river branches of the Tangon
River. To create a healthy character in the secluded river branches, a stronger water flow is required in these secluded river branches. This flow may be created when the river branches are connected to
the main stream of the Tangon River. In Figure 21 Connection river branches with mainstream Tangon RiverFigure 21 is shown a possible connection of the river branches with the main stream of the Tangon River. In the design of this connection flood hazard areas and height differences are
taken into account. The built-up areas are also taken into account. The connection generally runs by uncultivated fields. Implementing this solution creates two healthy river branches of the Tangon River. And creates a safer and healthier place for all residents in the river banks of the Tangon River.
In chapter 5 this design will be further elaborated in details.
Figure 21 Connection river branches with mainstream Tangon River (OpenStreetMap, 2016) (Google, 2016) (N. Boer & I.B.M. Opdam, Adobe Acrobat )
33
4 Stakeholders analysis
Introduction In this chapter the stakeholders within the research are discussed. The third sub question is: “Which stakeholders to take in account looking for possible measures?”. In this chapter stakeholders are
interviewed and are asked if they have any advice for the development of the design. First the selection of stakeholders is discussed in chapter 1. The interest vs influence is shown and explained in chapter 2. In chapter 3 the interviews are shown with their documentation.
34
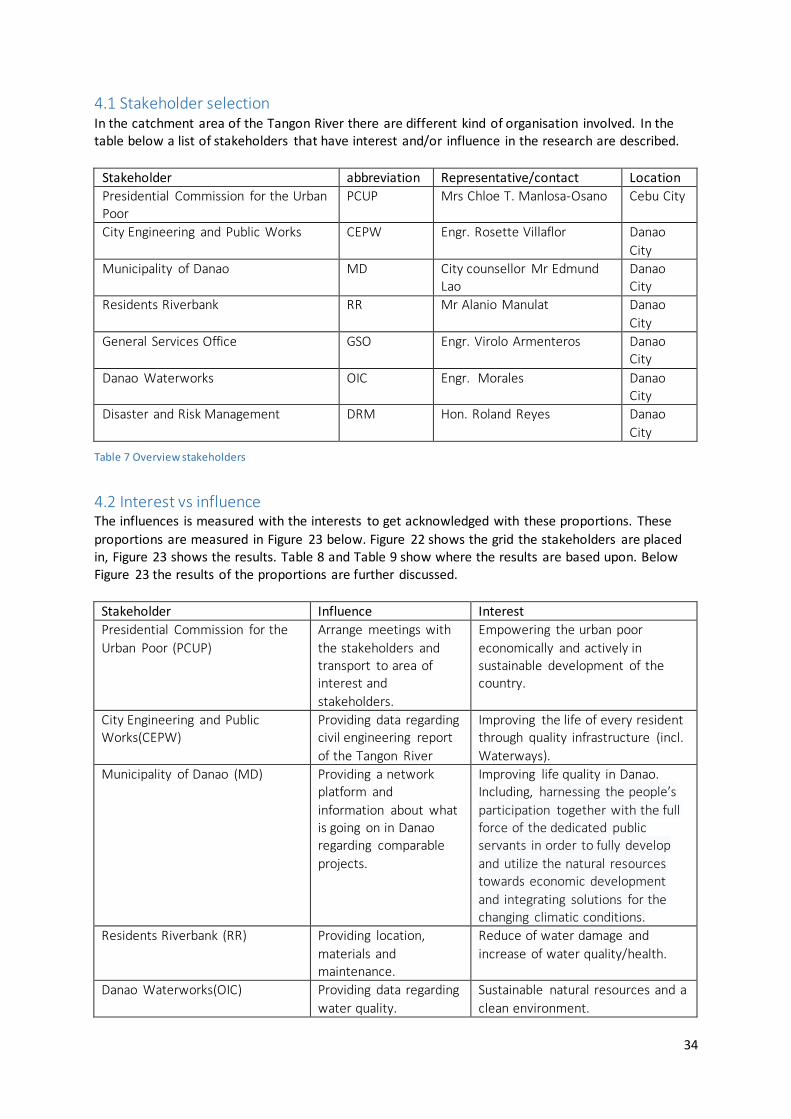
4.1 Stakeholder selection In the catchment area of the Tangon River there are different kind of organisation involved. In the table below a list of stakeholders that have interest and/or influence in the research are described.
Stakeholder abbreviation Representative/contact Location
Presidential Commission for the Urban Poor
PCUP Mrs Chloe T. Manlosa-Osano Cebu City
City Engineering and Public Works CEPW Engr. Rosette Villaflor Danao
City
Municipality of Danao MD City counsellor Mr Edmund Lao
Danao City
Residents Riverbank RR Mr Alanio Manulat Danao
City
General Services Office GSO Engr. Virolo Armenteros Danao City
Danao Waterworks OIC Engr. Morales Danao City
Disaster and Risk Management DRM Hon. Roland Reyes Danao
City
Table 7 Overview stakeholders
4.2 Interest vs influence The influences is measured with the interests to get acknowledged with these proportions. These
proportions are measured in Figure 23 below. Figure 22 shows the grid the stakeholders are placed in, Figure 23 shows the results. Table 8 and Table 9 show where the results are based upon. Below Figure 23 the results of the proportions are further discussed.
Stakeholder Influence Interest
Presidential Commission for the
Urban Poor (PCUP)
Arrange meetings with
the stakeholders and transport to area of interest and
stakeholders.
Empowering the urban poor
economically and actively in sustainable development of the country.
City Engineering and Public Works(CEPW)
Providing data regarding civil engineering report
of the Tangon River
Improving the life of every resident through quality infrastructure (incl.
Waterways).
Municipality of Danao (MD) Providing a network platform and
information about what is going on in Danao regarding comparable
projects.
Improving life quality in Danao. Including, harnessing the people’s
participation together with the full force of the dedicated public servants in order to fully develop
and utilize the natural resources towards economic development
and integrating solutions for the changing climatic conditions.
Residents Riverbank (RR) Providing location,
materials and maintenance.
Reduce of water damage and
increase of water quality/health.
Danao Waterworks(OIC) Providing data regarding
water quality.
Sustainable natural resources and a
clean environment.

35
General Services Office(GSO) Providing data regarding maps and specifics of
comparable projects in the area.
A coherent urban environment that improves life quality.
Disaster and Risk
Management(DRM)
Providing data regarding
health care in the riverbanks.
Manage the disasters and risks in
de Danao area
Table 8 Overview stakeholders’ influence and interest
Stakeholder Degree of influence Degree of interest
Presidential Commission for the
Urban Poor (PCUP)
4 5
City Engineering and Public Works(CEPW)
1 2
Municipality of Danao (MD) 2 3
Residents Riverbank (RR) 1 5
Danao Waterworks(OIC) 1 2
General Services Office(GSO) 1 2
Disaster and Risk
Management(DRM)
1 2
Table 9 Overview stakeholders’ degree of influence and interest
Figure 22 Influence vs interest grid (N. Boer & I.B.M. Opdam, Adobe Acrobat )
36
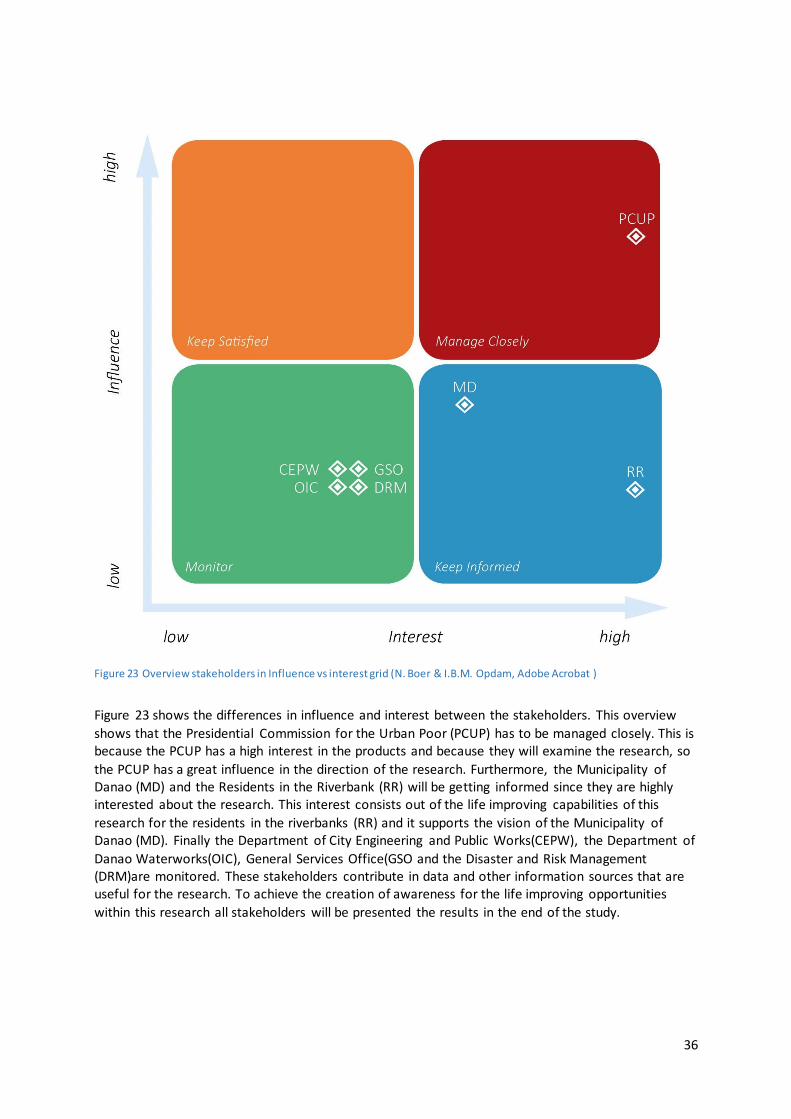
Figure 23 Overview stakeholders in Influence vs interest grid (N. Boer & I.B.M. Opdam, Adobe Acrobat )
Figure 23 shows the differences in influence and interest between the stakeholders. This overview
shows that the Presidential Commission for the Urban Poor (PCUP) has to be managed closely. This is because the PCUP has a high interest in the products and because they will examine the research, so
the PCUP has a great influence in the direction of the research. Furthermore, the Municipality of Danao (MD) and the Residents in the Riverbank (RR) will be getting informed since they are highly interested about the research. This interest consists out of the life improving capabilities of this
research for the residents in the riverbanks (RR) and it supports the vision of the Municipality of Danao (MD). Finally the Department of City Engineering and Public Works(CEPW), the Department of
Danao Waterworks(OIC), General Services Office(GSO and the Disaster and Risk Management (DRM)are monitored. These stakeholders contribute in data and other information sources that are useful for the research. To achieve the creation of awareness for the life improving opportunities
within this research all stakeholders will be presented the results in the end of the study.
37
4.3 Interviews Knowing the points of views of the stakeholders, they can be involved in the research. In the interviews underneath the research is explained to the stakeholders. Furthermore, data, network, ideas and methods that can contribute to the research are discussed during these interviews. In the
paragraphs below each´s stakeholders interview is discussed and conclusions are formed for each piece of information. For each interview the grid of the interview is shown and the conclusion, documentation of the interview.
Presidential Commission for the Urban Poor
Documentation of the interview with Mrs Chloe Manlosa-Osano, October 26 2016.
In our research regarding selecting a river the Tangon River came out as most promising. Submitting this with Chloe Manlosa-Osano she agrees that the focus of the research will go the Tangon River and
its area. She tells that Mrs Eppie Alcoseba is appointed to Danao from the PCUP. Furthermore, that we can contact her about any network/contacts in Danao. The PCUP will help with the use of vehicles
for field research and the office can be used contributing in your research. The products she expects are the research report and a final presentation with the stakeholders.
Municipality of Danao
Documentation of the interview with City counsellor Mr Edmund Lao, 20 October 2016.
Mr Edmund Lao is a city counsellor who has a lot of contacts and information in/about Danao. During the explanation of the research in the area he got really enthusiastic about the idea.
He said he never heard that the Tangon River had secluded river branches, and he says from the
looks of it the idea you have it looks great. What Mr Edmund Lao is trying to accomplish is create more awareness for important problems is Danao. This is one of those problems he says. Furthermore, he told us that there are not a lot of maps from Danao available so your contribution of
maps will be much appreciated. When asked about the local residents living in the river branches he tells that they are
struggling with the relocation of them because there is not enough budget. According to the law, resident may not live in the 3 metre zone near the river, they want to change this to 6 metre. Mr Edmund Lao tells that they first have to look at how to relocate them else it is not possible to
maintain this law. When asked for any data regarding the residents and river system he redirects us to multiple
organisations that can help providing the data that is needed. City health department, regarding data about diseases. Department of Environment, regarding data about vegetation. Department of Planning, regarding data for maps and urban areas.
38
Residents riverbank
Documentation of the interview with house owner within the riverbanks Mr Alanio Manulat, 20 October 2016.
Mr Alanio Manulat, 38 years old is a local resident living within the riverbanks of the secluded river branches of the Tangon River. Furthermore, he is a family man who has to take care of his children
and has a job in the Danao City. During the explanation of the research in the area he got really enthusiastic about the idea.
He told that the government keeps telling the residents in the area that there is a plan to resolve the
pollution issue. When there is asked when he last heard from the government about this plan he says, three years ago.
Mr Manulat explains that it is no pleasure living next to these polluted river branches, but is it necessary. The reason it is necessary he says is because he has a job in Danao City and the land in the city is too expensive, that is why his family lives in the riverbanks because they do not have to
pay any rent. The kind of disturbance he experiences varies between stench, flooding’s and diseases. He
also tells that there is the most disturbance when there are flooding’s, during heavy rainfall and high tide. Furthermore, he tells that when there are floods, it spreads all of the pollution through the area even in their houses.
As of right now Mr Manulat tells us that the majority of local residents in the river banks throw their waste into the river. He also says that if he tries to collect it and put it in a garbage container the government will not collect it 8 times out of 10. When the government does not
collect, the waste still ends up in the river he says. When asked for a solution, Mr Manulat says the government has to take action and clean up
the river branches.
39
City Engineering and Public Works Documentation of the interview with Engr. Rosette Villaflor, October 26 2016.
Engr. Rosette Villaflor has experience in the technical conditions of the Tangon River. Engr. Rosette
Villaflor indicates to find the research and design very interesting and sees many possibilities. Like they actively think about the technical structure and the budget that brings the design along with it. She also points to the fact that a spring is stationed in the area where one should be placed any
connection. The leaking water from this spring provides the small amount of water in the river branches. Incidentally, this spring the design of the connections between the Tangon River with the
river will not interfere with classes. In addition, was raised whether there is thought about the capture of all the floating trash in the river branches. Must be prevented in creating flow in the river branches very much floating debris is
pushed into the sea. Even designing construction in the river branches should ensure the capture of the floating waste and prevent pollution of the coast and sea.
Danao Waterworks
Documentation of the interview with Engr. Morales, October 26 2016.
Engr. Morales is engineer by profession and active in the organization of water management. Engr. Morales thinks the study is a major contribution to the improvement of the water system in Danao.
Engr. Morales has been closely involved in the construction of a large dam on the River Tangon. This project is still in the planning phase but should be carried out in due. Engr. Morales wondered whether the regulation of water in the river upstream is a problem for the interception of a small
portion of the flow of the Tangon River. Expected this should not be a problem. Engr. Morales is also wondered whether the water in the connections to create freely into the river branches is headed, or that this pumps are needed. Probably the budget will not be adequate to
build sophisticated installations. There is therefore need to be as inexpensive as possible the design and keep it as natural as possible and self-sufficient.
In addition, there must be a good look at the maintenance, also in this case it should be looked closely at the budget.
Disaster and Risk Management Office
Documentation of the interview with Hon. Roland Reyes, October 26 2016.
Hon. Roland Reyes was very enthusiastic about the research and the possible solutions. Hon. Roland Reyes sees the study as a great addition to ongoing projects or projects that may be initiated in the future.
In addition, Hon. Roland Reyes thinks the final design can be a solution for a number of critical issues that entails the Tangon River with them. In particular, the amount of flooding that occurred after heavy rainfall is a major problem. By creating using additional waterways and connections with the
Tangon River flooding would be dramatically reduced in this area. Hon. Roland Reyes also said that in the past there have been indeed problems of pollution and the
spread of diseases. There is 5 years ago (2011) have been a major diarrhea outbreak due to the poor water quality in the river branches of the River Tangon Hon. Roland Reyes thinks that it is of great importance for the safety of the people around the
Tangon River and the river branches that must be resolved as soon as possible.
40
5 Design
Introduction In this chapter a design is made based on the hard and soft requirements which are arranged by the
desires of the stakeholders. This chapter will answer the sub question: ”What design contributes in
increasing water storage and improving of the river’s water quality?” This chapter shows several
visualizations that show the connection between the main stream and the river branches of the
Tangon River. The details and equation are provided in Appendix IV Design report. Finally, a
conclusion containing a comprehensive picture of all the contributions that this solution brings is
given.
5.1 Water system The new water system consists out of one mainstream, the Tangon River with two river branches, divided into North and South in the paragraphs below. In Figure 25 an overview of this water system
is given. In this figure the two catchment areas (North and South) are displayed compared to the Tangon River. The old water system missed the connection between these river branches and the
Tangon River. This new water system will create a natural flow of streaming water between the Tangon River and the river branches.
This natural water flow will be controlled with the use of a dam with a release on each
entrance of the river branches the two blue circles on the left in Figure 87 indicate the locations of these dams. The dimensions, equations and working of these dams are discussed in paragraphs ‘Dimensions Qinflow’. This water flow will flush the solid waste to the debouchments in the east.
In these debouchments a dam is placed that will catch the solid waste that is flushed towards the sea. In Figure 87 the two right blue circles indicate these dams. These dams not only filter the
solid waste before in flows to sea, it also blocks the sea from entering the river branches during high tide. This prevents flooding’s that origin from sea. The dimensions, equations and operation of these dams are discussed in paragraphs ‘Dimensions Qdischarge’.
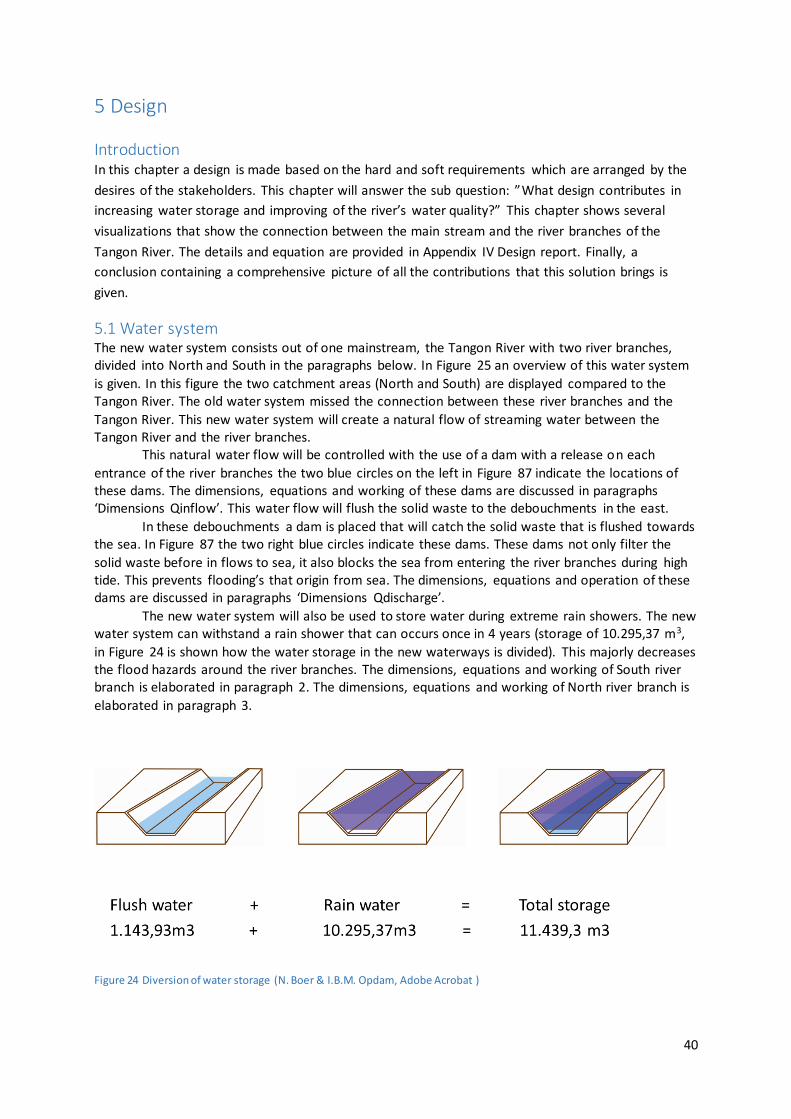
The new water system will also be used to store water during extreme rain showers. The new water system can withstand a rain shower that can occurs once in 4 years (storage of 10.295,37 m3,
in Figure 24 is shown how the water storage in the new waterways is divided). This majorly decreases the flood hazards around the river branches. The dimensions, equations and working of South river branch is elaborated in paragraph 2. The dimensions, equations and working of North river branch is
elaborated in paragraph 3.
Figure 24 Diversion of water storage (N. Boer & I.B.M. Opdam, Adobe Acrobat )

41
Figure 25 Tangon River's water system including the North and South river branches’ catchments area (N. Boer & I.B.M. Opdam, Adobe Acrobat )
42
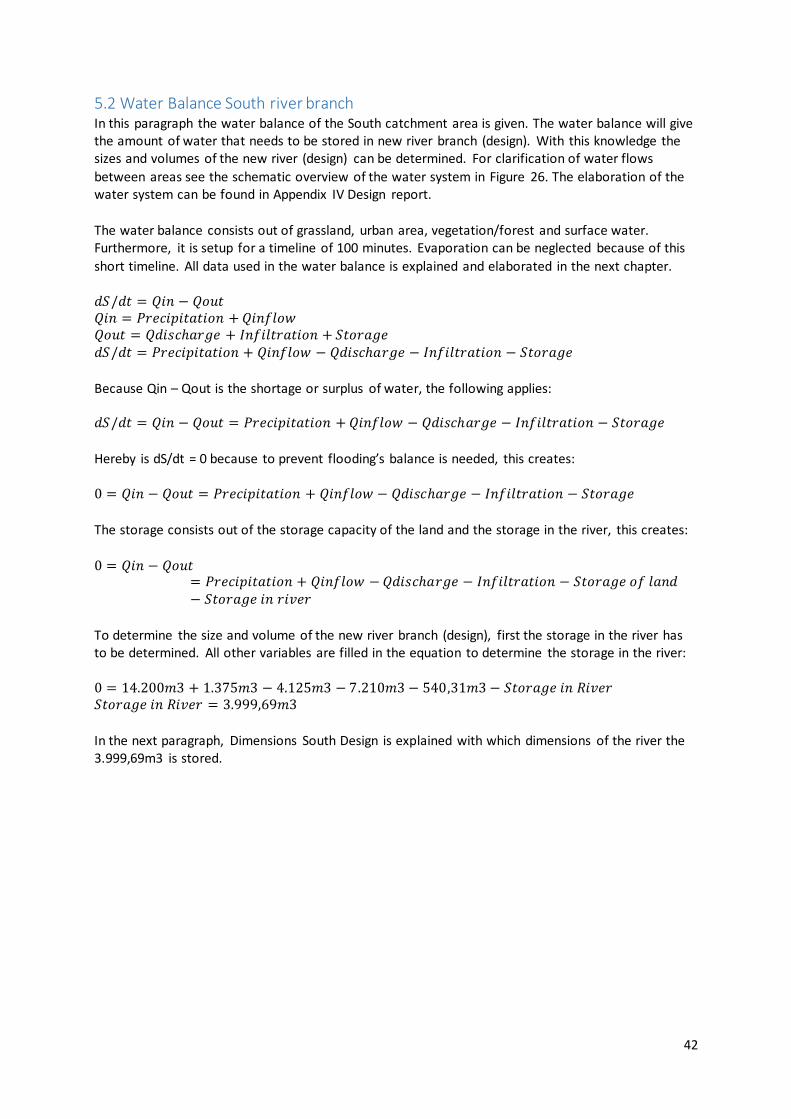
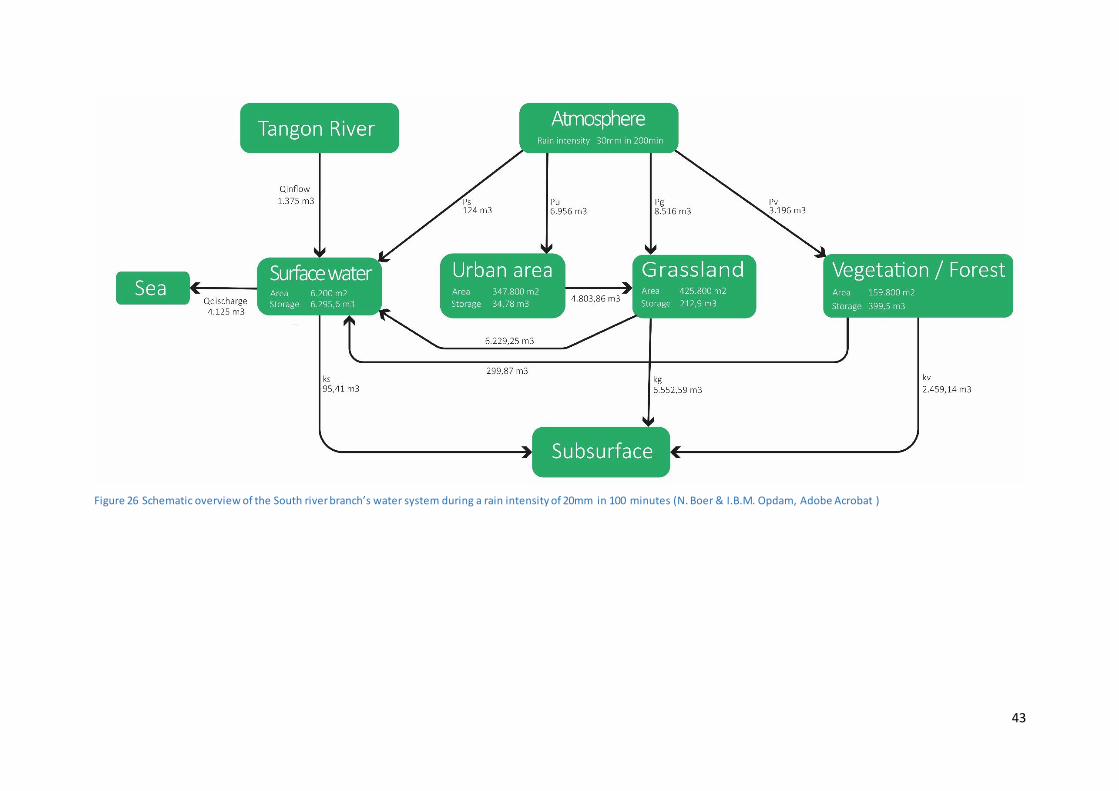
5.2 Water Balance South river branch In this paragraph the water balance of the South catchment area is given. The water balance will give the amount of water that needs to be stored in new river branch (design). With this knowledge the sizes and volumes of the new river (design) can be determined. For clarification of water flows
between areas see the schematic overview of the water system in Figure 26. The elaboration of the water system can be found in Appendix IV Design report.
The water balance consists out of grassland, urban area, vegetation/forest and surface water. Furthermore, it is setup for a timeline of 100 minutes. Evaporation can be neglected because of this
short timeline. All data used in the water balance is explained and elaborated in the next chapter. 𝑑𝑆/𝑑𝑡 = 𝑄𝑖𝑛 − 𝑄𝑜𝑢𝑡 𝑄𝑖𝑛 = 𝑃𝑟𝑒𝑐𝑖𝑝𝑖𝑡𝑎𝑡𝑖𝑜𝑛 + 𝑄𝑖𝑛𝑓𝑙𝑜𝑤 𝑄𝑜𝑢𝑡 = 𝑄𝑑𝑖𝑠𝑐ℎ𝑎𝑟𝑔𝑒 + 𝐼𝑛𝑓𝑖𝑙𝑡𝑟𝑎𝑡𝑖𝑜𝑛 + 𝑆𝑡𝑜𝑟𝑎𝑔𝑒 𝑑𝑆/𝑑𝑡 = 𝑃𝑟𝑒𝑐𝑖𝑝𝑖𝑡𝑎𝑡𝑖𝑜𝑛 + 𝑄𝑖𝑛𝑓𝑙𝑜𝑤 − 𝑄𝑑𝑖𝑠𝑐ℎ𝑎𝑟𝑔𝑒 − 𝐼𝑛𝑓𝑖𝑙𝑡𝑟𝑎𝑡𝑖𝑜𝑛 − 𝑆𝑡𝑜𝑟𝑎𝑔𝑒
Because Qin – Qout is the shortage or surplus of water, the following applies: 𝑑𝑆/𝑑𝑡 = 𝑄𝑖𝑛 − 𝑄𝑜𝑢𝑡 = 𝑃𝑟𝑒𝑐𝑖𝑝𝑖𝑡𝑎𝑡𝑖𝑜𝑛 + 𝑄𝑖𝑛𝑓𝑙𝑜𝑤 − 𝑄𝑑𝑖𝑠𝑐ℎ𝑎𝑟𝑔𝑒 − 𝐼𝑛𝑓𝑖𝑙𝑡𝑟𝑎𝑡𝑖𝑜𝑛 − 𝑆𝑡𝑜𝑟𝑎𝑔𝑒
Hereby is dS/dt = 0 because to prevent flooding’s balance is needed, this creates:
0 = 𝑄𝑖𝑛 − 𝑄𝑜𝑢𝑡 = 𝑃𝑟𝑒𝑐𝑖𝑝𝑖𝑡𝑎𝑡𝑖𝑜𝑛 + 𝑄𝑖𝑛𝑓𝑙𝑜𝑤 − 𝑄𝑑𝑖𝑠𝑐ℎ𝑎𝑟𝑔𝑒 − 𝐼𝑛𝑓𝑖𝑙𝑡𝑟𝑎𝑡𝑖𝑜𝑛 − 𝑆𝑡𝑜𝑟𝑎𝑔𝑒
The storage consists out of the storage capacity of the land and the storage in the river, this creates:
0 = 𝑄𝑖𝑛 − 𝑄𝑜𝑢𝑡= 𝑃𝑟𝑒𝑐𝑖𝑝𝑖𝑡𝑎𝑡𝑖𝑜𝑛 + 𝑄𝑖𝑛𝑓𝑙𝑜𝑤 − 𝑄𝑑𝑖𝑠𝑐ℎ𝑎𝑟𝑔𝑒 − 𝐼𝑛𝑓𝑖𝑙𝑡𝑟𝑎𝑡𝑖𝑜𝑛 − 𝑆𝑡𝑜𝑟𝑎𝑔𝑒 𝑜𝑓 𝑙𝑎𝑛𝑑− 𝑆𝑡𝑜𝑟𝑎𝑔𝑒 𝑖𝑛 𝑟𝑖𝑣𝑒𝑟
To determine the size and volume of the new river branch (design), first the storage in the river has to be determined. All other variables are filled in the equation to determine the storage in the river: 0 = 14.200𝑚3 + 1.375𝑚3 − 4.125𝑚3 − 7.210𝑚3 − 540,31𝑚3 − 𝑆𝑡𝑜𝑟𝑎𝑔𝑒 𝑖𝑛 𝑅𝑖𝑣𝑒𝑟 𝑆𝑡𝑜𝑟𝑎𝑔𝑒 𝑖𝑛 𝑅𝑖𝑣𝑒𝑟 = 3.999,69𝑚3
In the next paragraph, Dimensions South Design is explained with which dimensions of the river the 3.999,69m3 is stored.
43
Figure 26 Schematic overview of the South river branch’s water system during a rain intensity of 20mm in 100 minutes (N. Boer & I.B.M. Opdam, Adobe Acrobat )
44
Dimensions South Design
Dimensions waterway
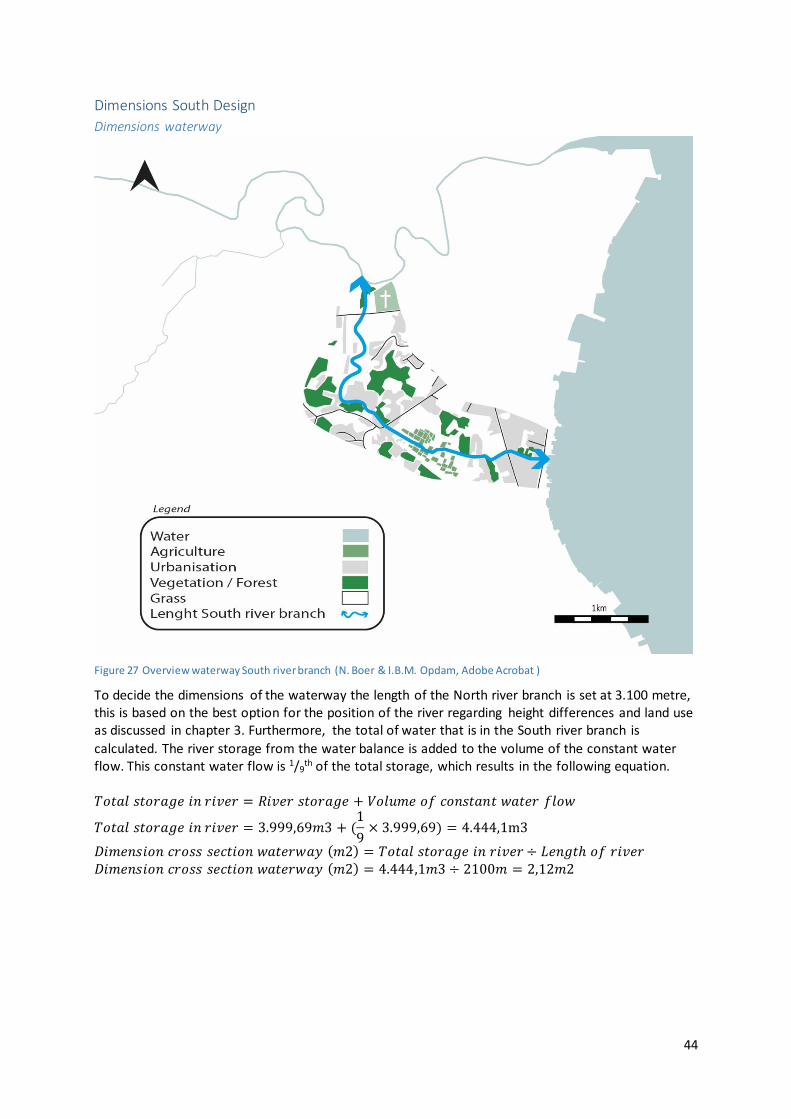
Figure 27 Overview waterway South river branch (N. Boer & I.B.M. Opdam, Adobe Acrobat )
To decide the dimensions of the waterway the length of the North river branch is set at 3.100 metre, this is based on the best option for the position of the river regarding height differences and land use as discussed in chapter 3. Furthermore, the total of water that is in the South river branch is
calculated. The river storage from the water balance is added to the volume of the constant water flow. This constant water flow is 1/9
th of the total storage, which results in the following equation.
𝑇𝑜𝑡𝑎𝑙 𝑠𝑡𝑜𝑟𝑎𝑔𝑒 𝑖𝑛 𝑟𝑖𝑣𝑒𝑟 = 𝑅𝑖𝑣𝑒𝑟 𝑠𝑡𝑜𝑟𝑎𝑔𝑒 + 𝑉𝑜𝑙𝑢𝑚𝑒 𝑜𝑓 𝑐𝑜𝑛𝑠𝑡𝑎𝑛𝑡 𝑤𝑎𝑡𝑒𝑟 𝑓𝑙𝑜𝑤
𝑇𝑜𝑡𝑎𝑙 𝑠𝑡𝑜𝑟𝑎𝑔𝑒 𝑖𝑛 𝑟𝑖𝑣𝑒𝑟 = 3.999,69𝑚3 + (1
9× 3.999,69) = 4.444,1m3
𝐷𝑖𝑚𝑒𝑛𝑠𝑖𝑜𝑛 𝑐𝑟𝑜𝑠𝑠 𝑠𝑒𝑐𝑡𝑖𝑜𝑛 𝑤𝑎𝑡𝑒𝑟𝑤𝑎𝑦 (𝑚2) = 𝑇𝑜𝑡𝑎𝑙 𝑠𝑡𝑜𝑟𝑎𝑔𝑒 𝑖𝑛 𝑟𝑖𝑣𝑒𝑟 ÷ 𝐿𝑒𝑛𝑔𝑡ℎ 𝑜𝑓 𝑟𝑖𝑣𝑒𝑟 𝐷𝑖𝑚𝑒𝑛𝑠𝑖𝑜𝑛 𝑐𝑟𝑜𝑠𝑠 𝑠𝑒𝑐𝑡𝑖𝑜𝑛 𝑤𝑎𝑡𝑒𝑟𝑤𝑎𝑦 (𝑚2) = 4.444,1𝑚3 ÷ 2100𝑚 = 2,12𝑚2
45
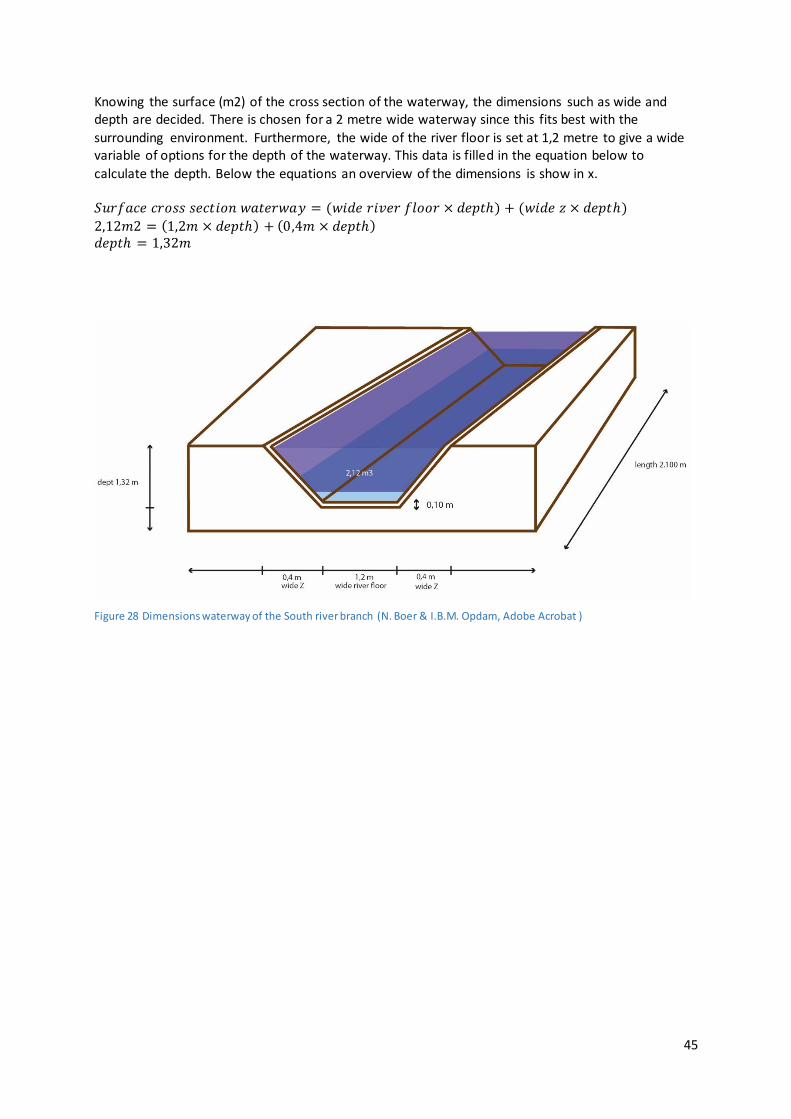
Knowing the surface (m2) of the cross section of the waterway, the dimensions such as wide and depth are decided. There is chosen for a 2 metre wide waterway since this fits best with the
surrounding environment. Furthermore, the wide of the river floor is set at 1,2 metre to give a wide variable of options for the depth of the waterway. This data is filled in the equation below to
calculate the depth. Below the equations an overview of the dimensions is show in x. 𝑆𝑢𝑟𝑓𝑎𝑐𝑒 𝑐𝑟𝑜𝑠𝑠 𝑠𝑒𝑐𝑡𝑖𝑜𝑛 𝑤𝑎𝑡𝑒𝑟𝑤𝑎𝑦 = (𝑤𝑖𝑑𝑒 𝑟𝑖𝑣𝑒𝑟 𝑓𝑙𝑜𝑜𝑟 × 𝑑𝑒𝑝𝑡ℎ) + (𝑤𝑖𝑑𝑒 𝑧 × 𝑑𝑒𝑝𝑡ℎ)
2,12𝑚2 = (1,2𝑚 × 𝑑𝑒𝑝𝑡ℎ) + (0,4𝑚 × 𝑑𝑒𝑝𝑡ℎ) 𝑑𝑒𝑝𝑡ℎ = 1,32𝑚
Figure 28 Dimensions waterway of the South river branch (N. Boer & I.B.M. Opdam, Adobe Acrobat )
46
Dimensions Inflow
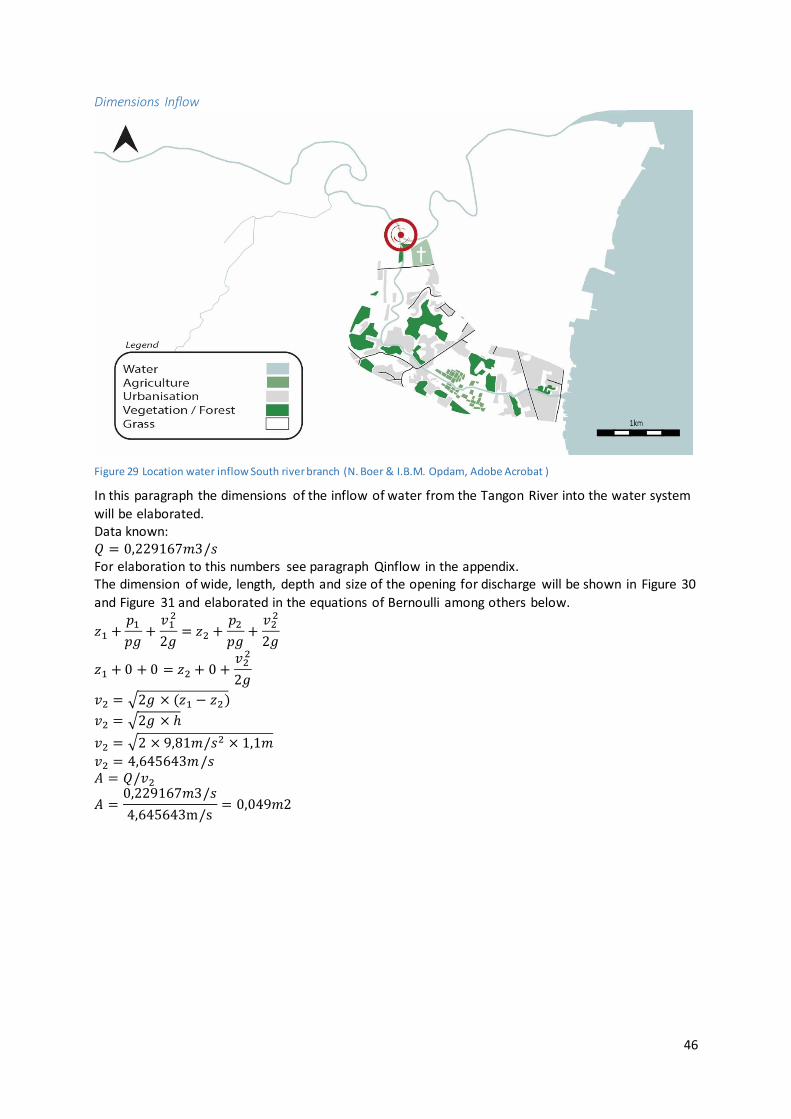
Figure 29 Location water inflow South river branch (N. Boer & I.B.M. Opdam, Adobe Acrobat )
In this paragraph the dimensions of the inflow of water from the Tangon River into the water system
will be elaborated. Data known: 𝑄 = 0,229167𝑚3/𝑠 For elaboration to this numbers see paragraph Qinflow in the appendix. The dimension of wide, length, depth and size of the opening for discharge will be shown in Figure 30
and Figure 31 and elaborated in the equations of Bernoulli among others below.
𝑧1 +𝑝1
𝑝𝑔+
𝑣12
2𝑔= 𝑧2 +
𝑝2
𝑝𝑔+
𝑣22
2𝑔
𝑧1 + 0 + 0 = 𝑧2 + 0 +𝑣2
2
2𝑔
𝑣2 = √2𝑔 × (𝑧1 − 𝑧2)
𝑣2 = √2𝑔 × ℎ
𝑣2 = √2 × 9,81𝑚/𝑠2 × 1,1𝑚
𝑣2 = 4,645643𝑚/𝑠 𝐴 = 𝑄/𝑣2
𝐴 =0,229167𝑚3/𝑠
4,645643m/s= 0,049𝑚2

47
This is the area needed to create the wanted water inflow. The most practical way to apply this area is to create a circle that will be drilled into the dam that divides the Tangon River and the South river
branch.
𝐴 =1
4𝜋𝑑2
𝑑 = 0,28184𝑚 = 28,2𝑐𝑚 This means that the Inflow release gab will have a diameter of 28,2cm with a thickness of 3,5cm and is 1,1m lower relative to the Tangon River level. The wide of the dam will consist out of 0,2m
concrete.
Figure 30 Cross section dimensions Inflow (N. Boer & I.B.M. Opdam, Adobe Acrobat )
Figure 31 Cross section dimensions Inflow release gab (N. Boer & I.B.M. Opdam, Adobe Acrobat )
48
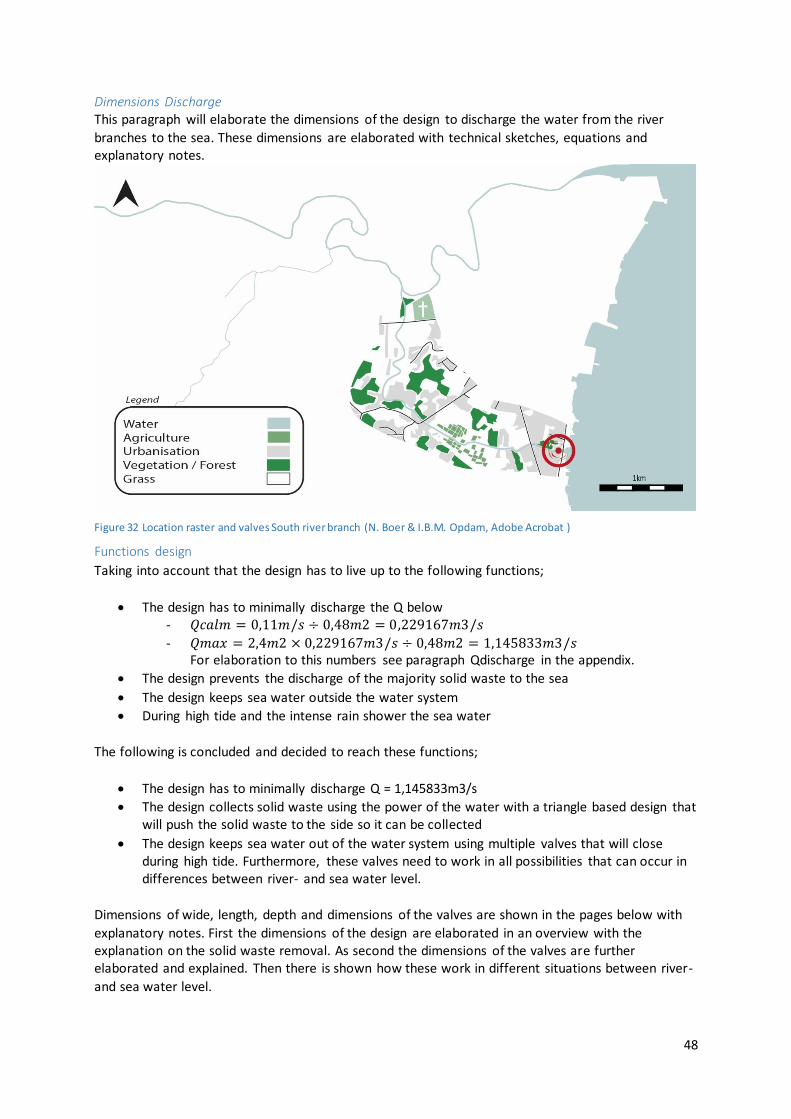
Dimensions Discharge This paragraph will elaborate the dimensions of the design to discharge the water from the river
branches to the sea. These dimensions are elaborated with technical sketches, equations and explanatory notes.
Figure 32 Location raster and valves South river branch (N. Boer & I.B.M. Opdam, Adobe Acrobat )
Functions design
Taking into account that the design has to live up to the following functions;
The design has to minimally discharge the Q below - 𝑄𝑐𝑎𝑙𝑚 = 0,11𝑚/𝑠 ÷ 0,48𝑚2 = 0,229167𝑚3/𝑠
- 𝑄𝑚𝑎𝑥 = 2,4𝑚2 × 0,229167𝑚3/𝑠 ÷ 0,48𝑚2 = 1,145833𝑚3/𝑠 For elaboration to this numbers see paragraph Qdischarge in the appendix.
The design prevents the discharge of the majority solid waste to the sea
The design keeps sea water outside the water system
During high tide and the intense rain shower the sea water
The following is concluded and decided to reach these functions;
The design has to minimally discharge Q = 1,145833m3/s
The design collects solid waste using the power of the water with a triangle based design that will push the solid waste to the side so it can be collected
The design keeps sea water out of the water system using multiple valves that will close during high tide. Furthermore, these valves need to work in all possibilities that can occur in differences between river- and sea water level.
Dimensions of wide, length, depth and dimensions of the valves are shown in the pages below with
explanatory notes. First the dimensions of the design are elaborated in an overview with the explanation on the solid waste removal. As second the dimensions of the valves are further elaborated and explained. Then there is shown how these work in different situations between river-
and sea water level.
49
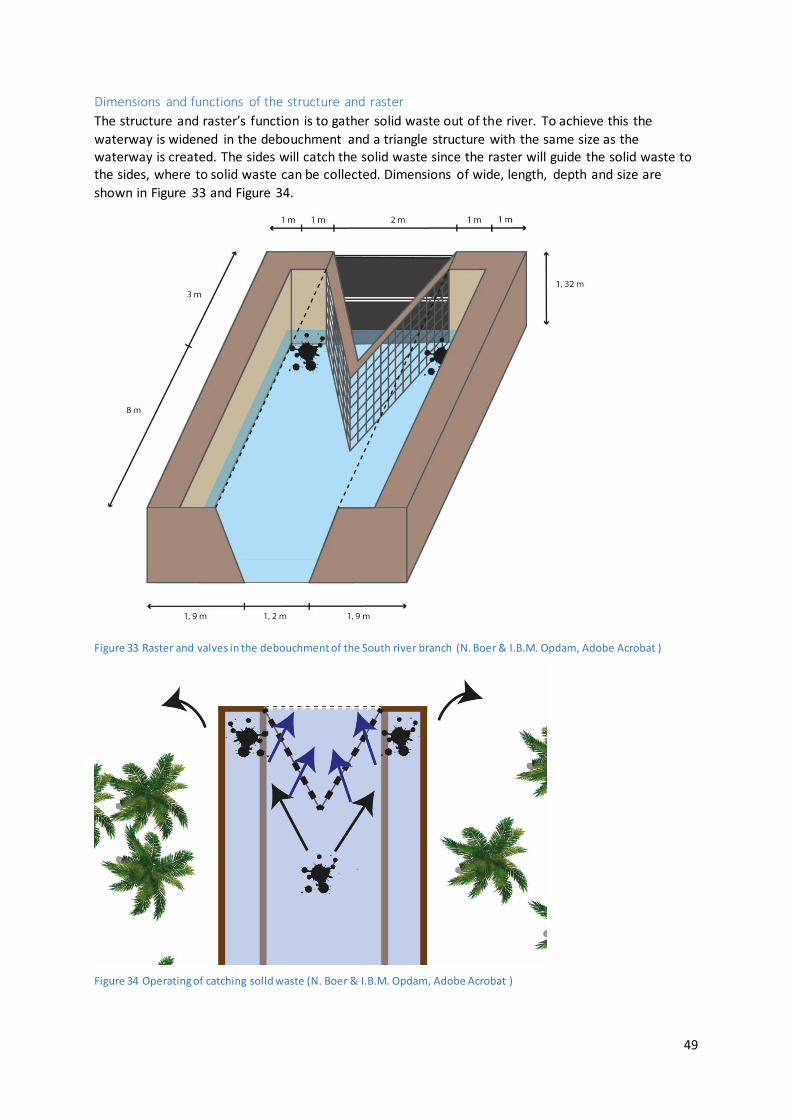
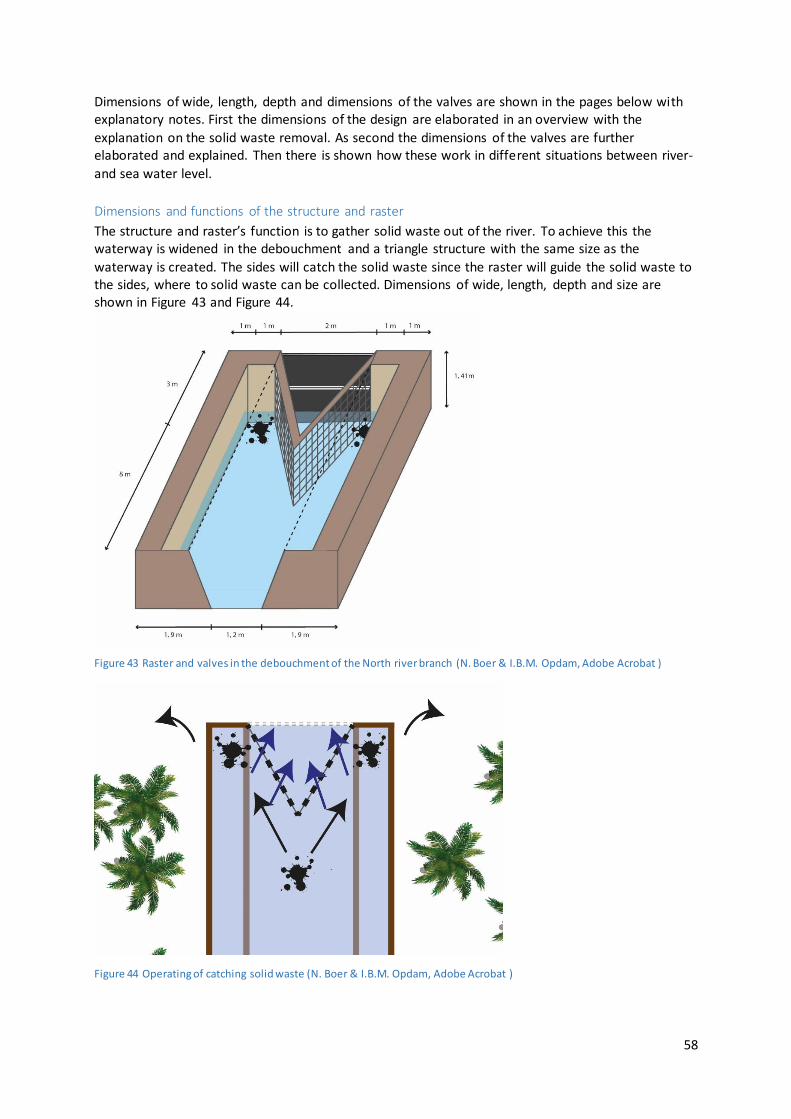
Dimensions and functions of the structure and raster
The structure and raster’s function is to gather solid waste out of the river. To achieve this the
waterway is widened in the debouchment and a triangle structure with the same size as the waterway is created. The sides will catch the solid waste since the raster will guide the solid waste to the sides, where to solid waste can be collected. Dimensions of wide, length, depth and size are
shown in Figure 33 and Figure 34.
Figure 33 Raster and valves in the debouchment of the South river branch (N. Boer & I.B.M. Opdam, Adobe Acrobat )
Figure 34 Operating of catching solid waste (N. Boer & I.B.M. Opdam, Adobe Acrobat )
50
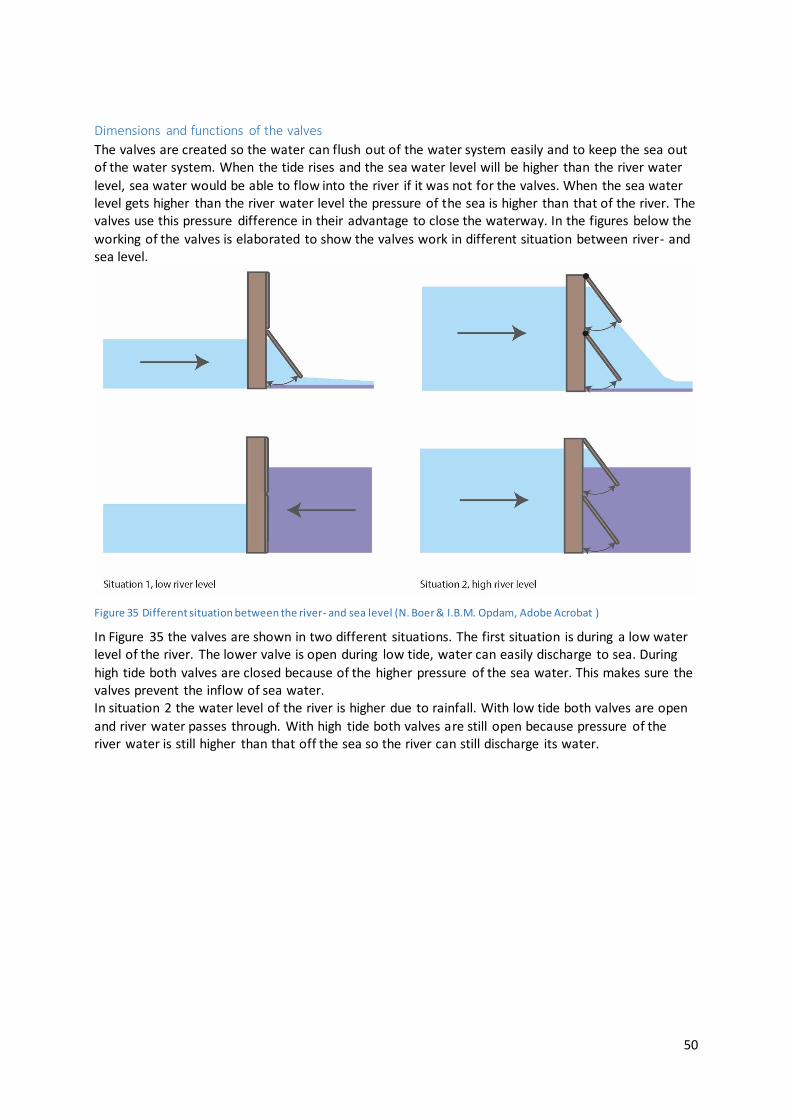
Dimensions and functions of the valves
The valves are created so the water can flush out of the water system easily and to keep the sea out of the water system. When the tide rises and the sea water level will be higher than the river water
level, sea water would be able to flow into the river if it was not for the valves. When the sea water level gets higher than the river water level the pressure of the sea is higher than that of the river. The valves use this pressure difference in their advantage to close the waterway. In the figures below the
working of the valves is elaborated to show the valves work in different situation between river- and sea level.
Figure 35 Different situation between the river- and sea level (N. Boer & I.B.M. Opdam, Adobe Acrobat )
In Figure 35 the valves are shown in two different situations. The first situation is during a low water level of the river. The lower valve is open during low tide, water can easily discharge to sea. During
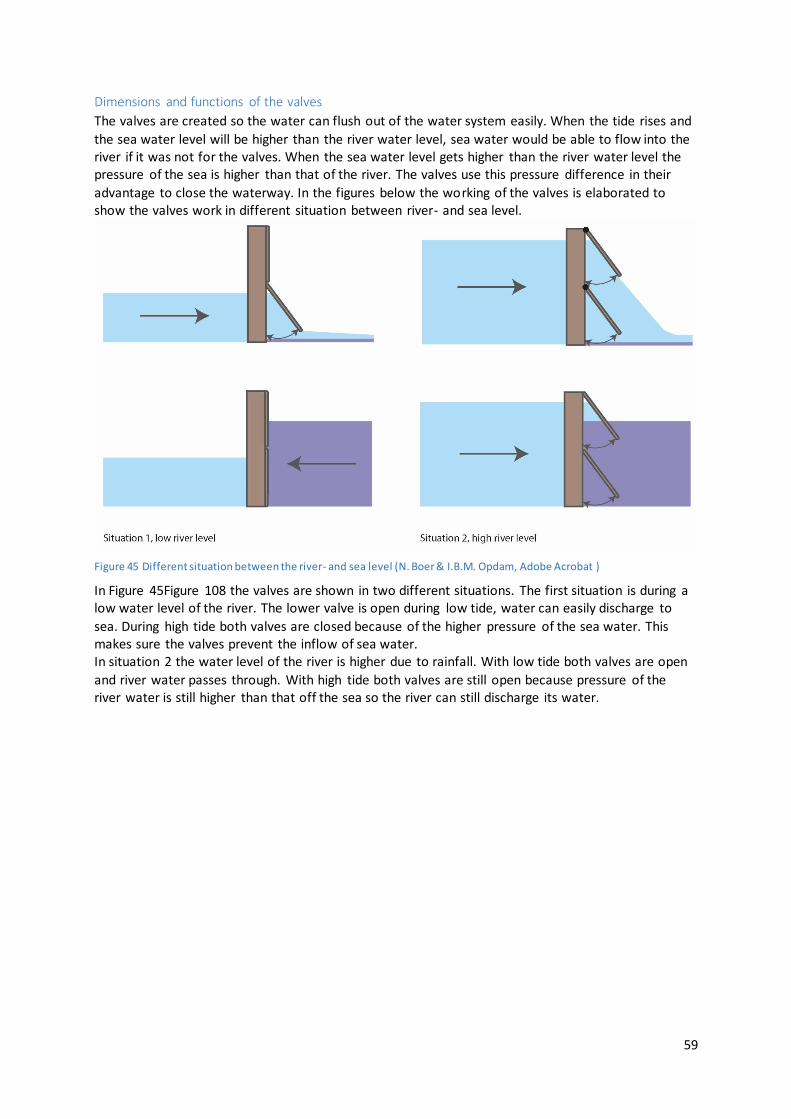
high tide both valves are closed because of the higher pressure of the sea water. This makes sure the valves prevent the inflow of sea water. In situation 2 the water level of the river is higher due to rainfall. With low tide both valves are open
and river water passes through. With high tide both valves are still open because pressure of the river water is still higher than that off the sea so the river can still discharge its water.

51
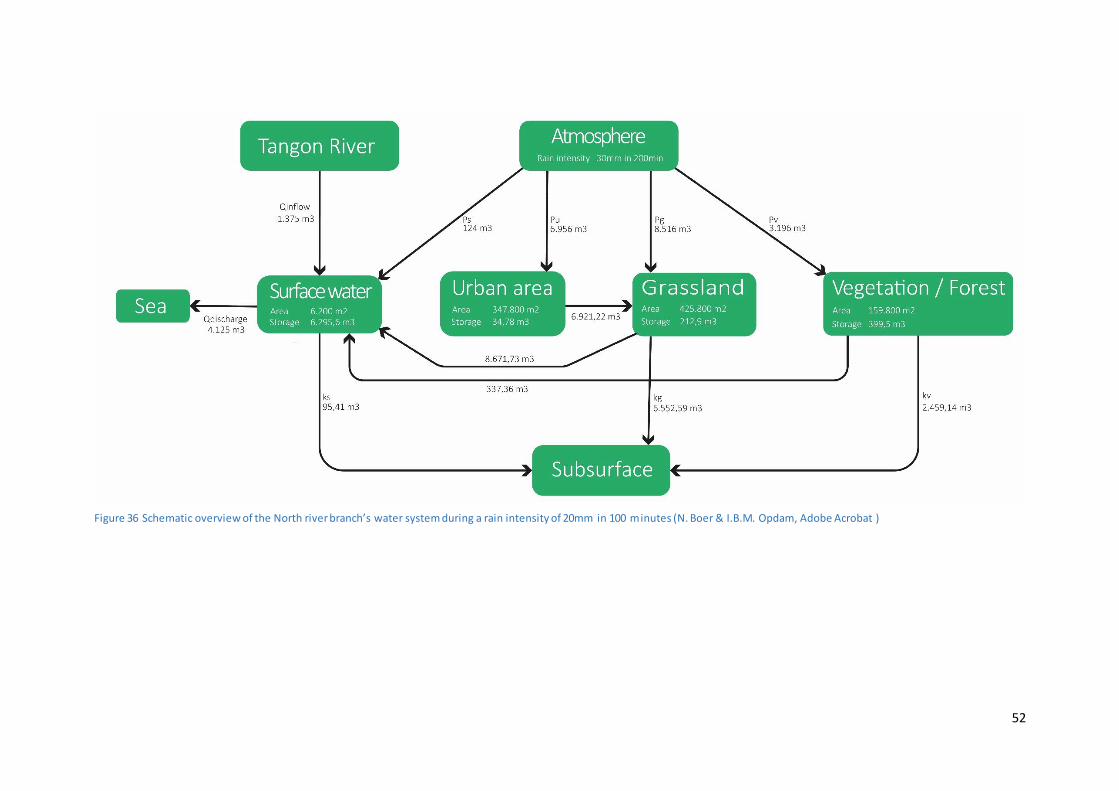
5.3 Water Balance North river branch In this paragraph the water balance of the South catchment area is given. The water balance will give the amount of water there needs to be stored in new river branch (design). With this knowledge the sizes and volumes of the new river (design) can be determined. For clarification of water flows
between areas see the schematic overview of the water system in Figure 36. The elaboration of the water system can be found in Appendix IV Design report.
The water balance consists out of grassland, urban area, vegetation/forest and surface water. Furthermore, it is setup for a timeline of 100 minutes. Evaporation can be neglected because of this
short timeline. All data used in the water balance is explained and elaborated in the next chapter. 𝑑𝑆/𝑑𝑡 = 𝑄𝑖𝑛 − 𝑄𝑜𝑢𝑡 𝑄𝑖𝑛 = 𝑃𝑟𝑒𝑐𝑖𝑝𝑖𝑡𝑎𝑡𝑖𝑜𝑛 + 𝑄𝑖𝑛𝑓𝑙𝑜𝑤 𝑄𝑜𝑢𝑡 = 𝑄𝑑𝑖𝑠𝑐ℎ𝑎𝑟𝑔𝑒 + 𝐼𝑛𝑓𝑖𝑙𝑡𝑟𝑎𝑡𝑖𝑜𝑛 + 𝑆𝑡𝑜𝑟𝑎𝑔𝑒 𝑑𝑆/𝑑𝑡 = 𝑃𝑟𝑒𝑐𝑖𝑝𝑖𝑡𝑎𝑡𝑖𝑜𝑛 + 𝑄𝑖𝑛𝑓𝑙𝑜𝑤 − 𝑄𝑑𝑖𝑠𝑐ℎ𝑎𝑟𝑔𝑒 − 𝐼𝑛𝑓𝑖𝑙𝑡𝑟𝑎𝑡𝑖𝑜𝑛 − 𝑆𝑡𝑜𝑟𝑎𝑔𝑒
Because Qin – Qout is the shortage or surplus of water, the following applies: 𝑑𝑆/𝑑𝑡 = 𝑄𝑖𝑛 − 𝑄𝑜𝑢𝑡 = 𝑃𝑟𝑒𝑐𝑖𝑝𝑖𝑡𝑎𝑡𝑖𝑜𝑛 + 𝑄𝑖𝑛𝑓𝑙𝑜𝑤 − 𝑄𝑑𝑖𝑠𝑐ℎ𝑎𝑟𝑔𝑒 − 𝐼𝑛𝑓𝑖𝑙𝑡𝑟𝑎𝑡𝑖𝑜𝑛 − 𝑆𝑡𝑜𝑟𝑎𝑔𝑒
Hereby is dS/dt = 0 because to prevent flooding’s balance is needed, this creates:
0 = 𝑄𝑖𝑛 − 𝑄𝑜𝑢𝑡 = 𝑃𝑟𝑒𝑐𝑖𝑝𝑖𝑡𝑎𝑡𝑖𝑜𝑛 + 𝑄𝑖𝑛𝑓𝑙𝑜𝑤 − 𝑄𝑑𝑖𝑠𝑐ℎ𝑎𝑟𝑔𝑒 − 𝐼𝑛𝑓𝑖𝑙𝑡𝑟𝑎𝑡𝑖𝑜𝑛 − 𝑆𝑡𝑜𝑟𝑎𝑔𝑒
The storage consists out of the storage capacity of the land and the storage in the river, this creates:
0 = 𝑄𝑖𝑛 − 𝑄𝑜𝑢𝑡= 𝑃𝑟𝑒𝑐𝑖𝑝𝑖𝑡𝑎𝑡𝑖𝑜𝑛 + 𝑄𝑖𝑛𝑓𝑙𝑜𝑤 − 𝑄𝑑𝑖𝑠𝑐ℎ𝑎𝑟𝑔𝑒 − 𝐼𝑛𝑓𝑖𝑙𝑡𝑟𝑎𝑡𝑖𝑜𝑛 − 𝑆𝑡𝑜𝑟𝑎𝑔𝑒 𝑜𝑓 𝑙𝑎𝑛𝑑− 𝑆𝑡𝑜𝑟𝑎𝑔𝑒 𝑖𝑛 𝑟𝑖𝑣𝑒𝑟
To determine the size and volume of the new river branch (design), first the storage in the river has to be determined. All other variables are filled in the equation to determine the storage in the river: 0 = 18.800𝑚3 + 1.375𝑚3 − 4.125𝑚3 − 9.107,14𝑚3 − 647,18𝑚3 − 𝑆𝑡𝑜𝑟𝑎𝑔𝑒 𝑖𝑛 𝑅𝑖𝑣𝑒𝑟 𝑆𝑡𝑜𝑟𝑎𝑔𝑒 𝑖𝑛 𝑅𝑖𝑣𝑒𝑟 = 6.295,68𝑚3
In the next paragraph, Dimensions South Design is explained with which dimensions of the river the 6.295,68m3 is stored.
52
Figure 36 Schematic overview of the North river branch’s water system during a rain intensity of 20mm in 100 m inutes (N. Boer & I.B.M. Opdam, Adobe Acrobat )
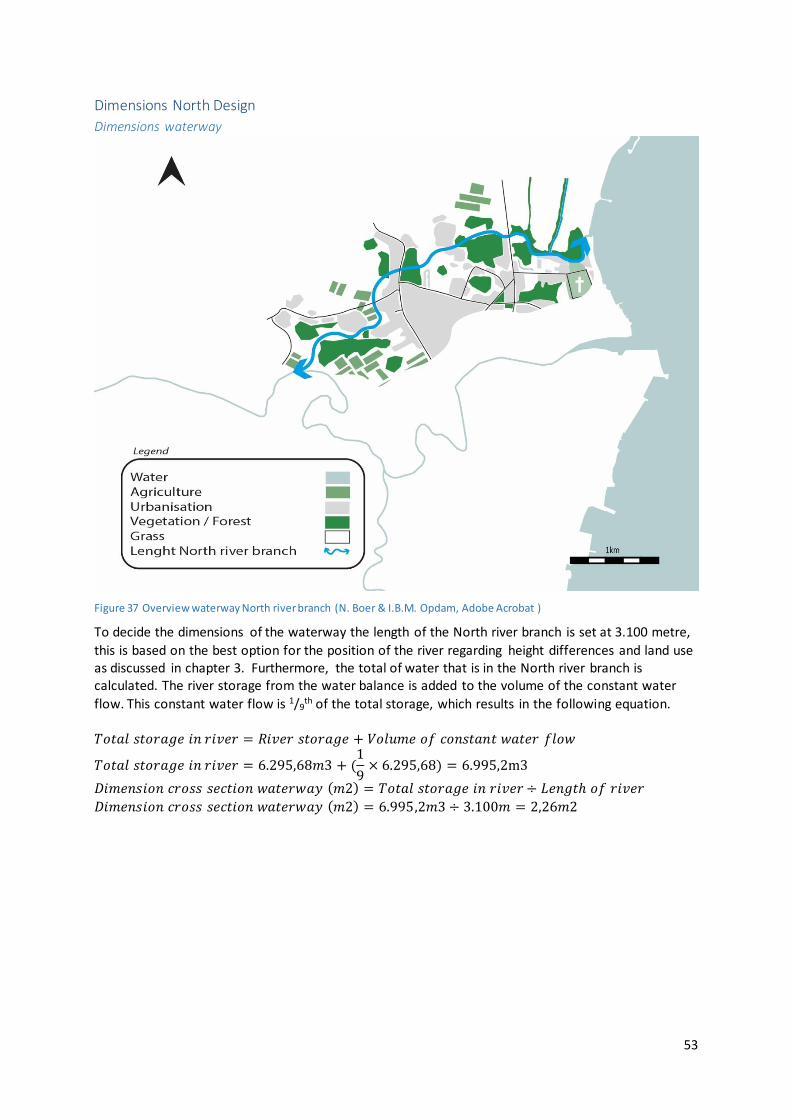
53
Dimensions North Design
Dimensions waterway
Figure 37 Overview waterway North river branch (N. Boer & I.B.M. Opdam, Adobe Acrobat )
To decide the dimensions of the waterway the length of the North river branch is set at 3.100 metre,
this is based on the best option for the position of the river regarding height differences and land use as discussed in chapter 3. Furthermore, the total of water that is in the North river branch is calculated. The river storage from the water balance is added to the volume of the constant water
flow. This constant water flow is 1/9th of the total storage, which results in the following equation.
𝑇𝑜𝑡𝑎𝑙 𝑠𝑡𝑜𝑟𝑎𝑔𝑒 𝑖𝑛 𝑟𝑖𝑣𝑒𝑟 = 𝑅𝑖𝑣𝑒𝑟 𝑠𝑡𝑜𝑟𝑎𝑔𝑒 + 𝑉𝑜𝑙𝑢𝑚𝑒 𝑜𝑓 𝑐𝑜𝑛𝑠𝑡𝑎𝑛𝑡 𝑤𝑎𝑡𝑒𝑟 𝑓𝑙𝑜𝑤
𝑇𝑜𝑡𝑎𝑙 𝑠𝑡𝑜𝑟𝑎𝑔𝑒 𝑖𝑛 𝑟𝑖𝑣𝑒𝑟 = 6.295,68𝑚3 + (1
9× 6.295,68) = 6.995,2m3
𝐷𝑖𝑚𝑒𝑛𝑠𝑖𝑜𝑛 𝑐𝑟𝑜𝑠𝑠 𝑠𝑒𝑐𝑡𝑖𝑜𝑛 𝑤𝑎𝑡𝑒𝑟𝑤𝑎𝑦 (𝑚2) = 𝑇𝑜𝑡𝑎𝑙 𝑠𝑡𝑜𝑟𝑎𝑔𝑒 𝑖𝑛 𝑟𝑖𝑣𝑒𝑟 ÷ 𝐿𝑒𝑛𝑔𝑡ℎ 𝑜𝑓 𝑟𝑖𝑣𝑒𝑟
𝐷𝑖𝑚𝑒𝑛𝑠𝑖𝑜𝑛 𝑐𝑟𝑜𝑠𝑠 𝑠𝑒𝑐𝑡𝑖𝑜𝑛 𝑤𝑎𝑡𝑒𝑟𝑤𝑎𝑦 (𝑚2) = 6.995,2𝑚3 ÷ 3.100𝑚 = 2,26𝑚2
54
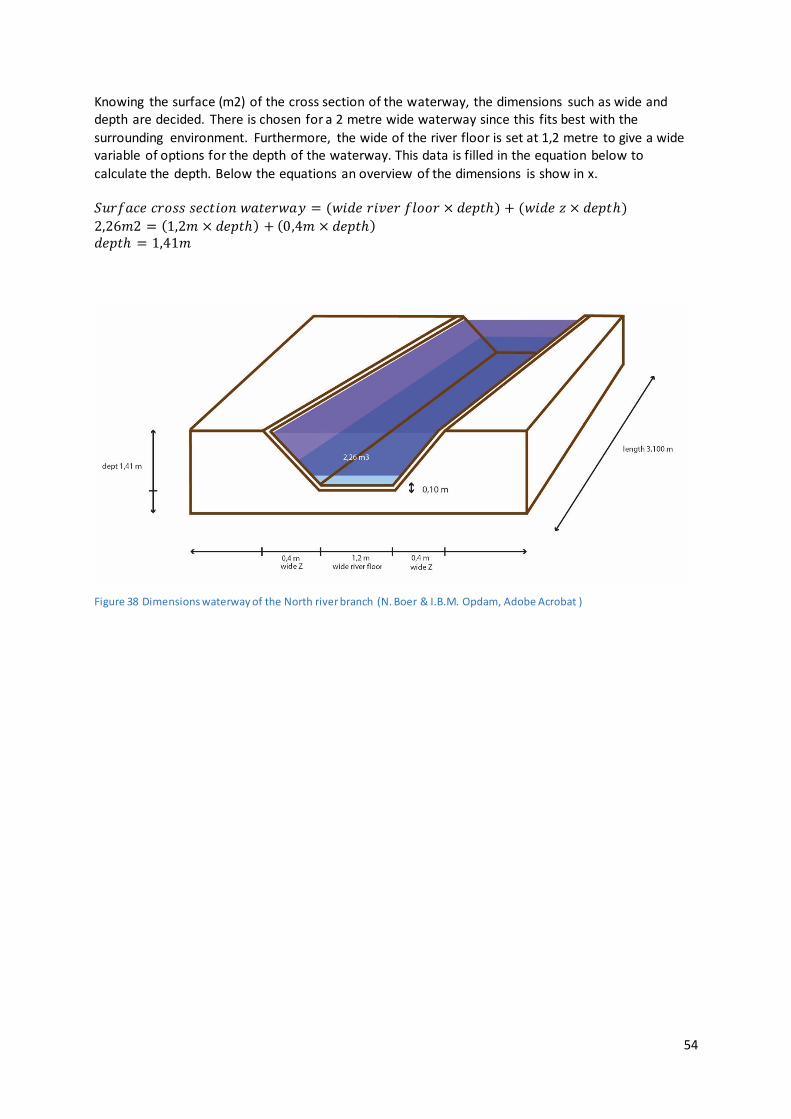
Knowing the surface (m2) of the cross section of the waterway, the dimensions such as wide and depth are decided. There is chosen for a 2 metre wide waterway since this fits best with the
surrounding environment. Furthermore, the wide of the river floor is set at 1,2 metre to give a wide variable of options for the depth of the waterway. This data is filled in the equation below to
calculate the depth. Below the equations an overview of the dimensions is show in x. 𝑆𝑢𝑟𝑓𝑎𝑐𝑒 𝑐𝑟𝑜𝑠𝑠 𝑠𝑒𝑐𝑡𝑖𝑜𝑛 𝑤𝑎𝑡𝑒𝑟𝑤𝑎𝑦 = (𝑤𝑖𝑑𝑒 𝑟𝑖𝑣𝑒𝑟 𝑓𝑙𝑜𝑜𝑟 × 𝑑𝑒𝑝𝑡ℎ) + (𝑤𝑖𝑑𝑒 𝑧 × 𝑑𝑒𝑝𝑡ℎ)
2,26𝑚2 = (1,2𝑚 × 𝑑𝑒𝑝𝑡ℎ) + (0,4𝑚 × 𝑑𝑒𝑝𝑡ℎ) 𝑑𝑒𝑝𝑡ℎ = 1,41𝑚
Figure 38 Dimensions waterway of the North river branch (N. Boer & I.B.M. Opdam, Adobe Acrobat )
55
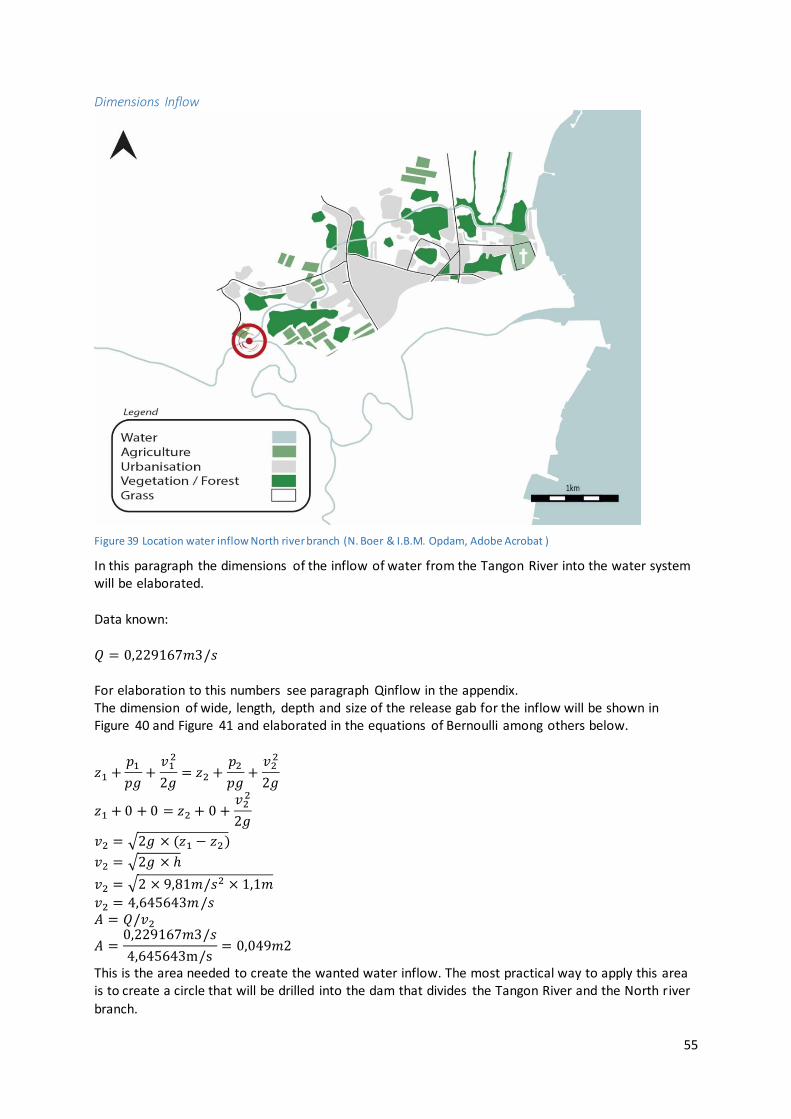
Dimensions Inflow
Figure 39 Location water inflow North river branch (N. Boer & I.B.M. Opdam, Adobe Acrobat )
In this paragraph the dimensions of the inflow of water from the Tangon River into the water system will be elaborated.
Data known:
𝑄 = 0,229167𝑚3/𝑠
For elaboration to this numbers see paragraph Qinflow in the appendix. The dimension of wide, length, depth and size of the release gab for the inflow will be shown in Figure 40 and Figure 41 and elaborated in the equations of Bernoulli among others below.
𝑧1 +𝑝1
𝑝𝑔+
𝑣12
2𝑔= 𝑧2 +
𝑝2
𝑝𝑔+
𝑣22
2𝑔
𝑧1 + 0 + 0 = 𝑧2 + 0 +𝑣2
2
2𝑔
𝑣2 = √2𝑔 × (𝑧1 − 𝑧2)
𝑣2 = √2𝑔 × ℎ
𝑣2 = √2 × 9,81𝑚/𝑠2 × 1,1𝑚
𝑣2 = 4,645643𝑚/𝑠 𝐴 = 𝑄/𝑣2
𝐴 =0,229167𝑚3/𝑠
4,645643m/s= 0,049𝑚2
This is the area needed to create the wanted water inflow. The most practical way to apply this area is to create a circle that will be drilled into the dam that divides the Tangon River and the North river
branch.

56
𝐴 =1
4𝜋𝑑2
𝑑 = 0,28184𝑚 = 28,2𝑐𝑚 This means that the Inflow release gab will have a diameter of 28,2cm with a thickness of 3,5cm and is 1,1m lower relative to the Tangon River level. The wide of the dam will consist out of 0,2m
concrete.
Figure 40 Cross section dimensions Inflow (N. Boer & I.B.M. Opdam, Adobe Acrobat )
Figure 41 Cross section dimensions Inflow release gab (N. Boer & I.B.M. Opdam, Adobe Acrobat )
57
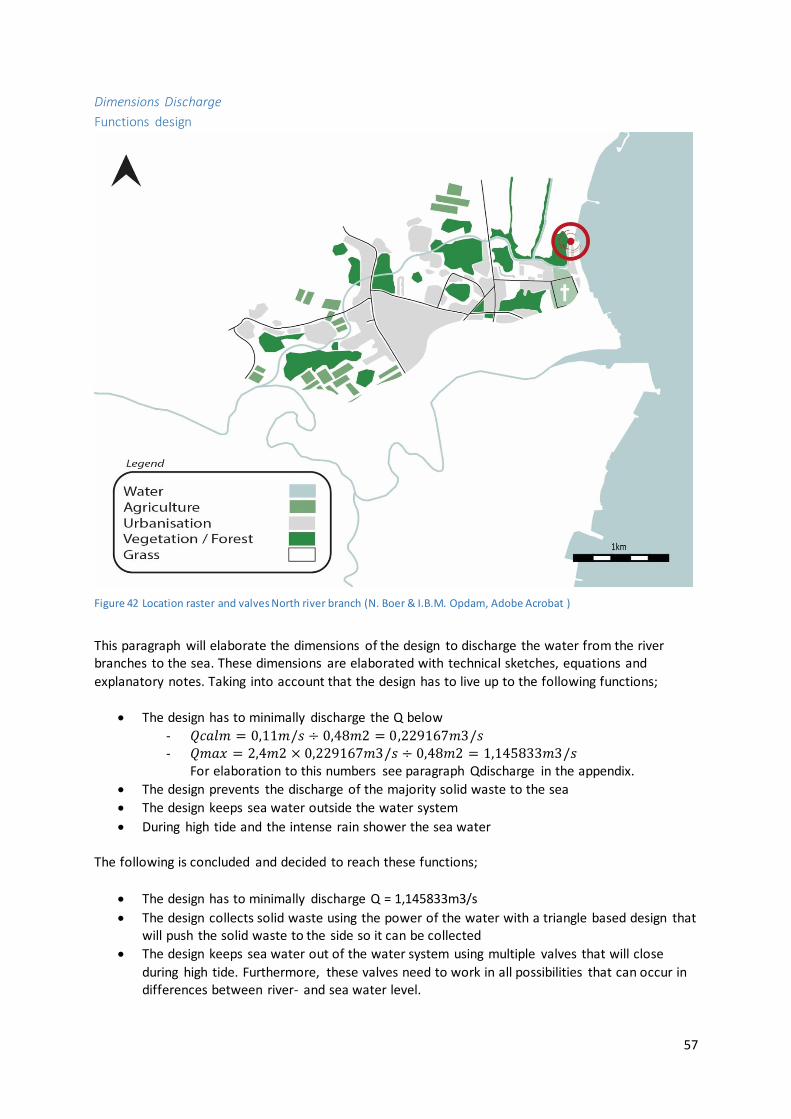
Dimensions Discharge
Functions design
Figure 42 Location raster and valves North river branch (N. Boer & I.B.M. Opdam, Adobe Acrobat )
This paragraph will elaborate the dimensions of the design to discharge the water from the river branches to the sea. These dimensions are elaborated with technical sketches, equations and
explanatory notes. Taking into account that the design has to live up to the following functions;
The design has to minimally discharge the Q below
- 𝑄𝑐𝑎𝑙𝑚 = 0,11𝑚/𝑠 ÷ 0,48𝑚2 = 0,229167𝑚3/𝑠 - 𝑄𝑚𝑎𝑥 = 2,4𝑚2 × 0,229167𝑚3/𝑠 ÷ 0,48𝑚2 = 1,145833𝑚3/𝑠
For elaboration to this numbers see paragraph Qdischarge in the appendix.
The design prevents the discharge of the majority solid waste to the sea
The design keeps sea water outside the water system
During high tide and the intense rain shower the sea water The following is concluded and decided to reach these functions;
The design has to minimally discharge Q = 1,145833m3/s
The design collects solid waste using the power of the water with a triangle based design that will push the solid waste to the side so it can be collected
The design keeps sea water out of the water system using multiple valves that will close
during high tide. Furthermore, these valves need to work in all possibilities that can occur in differences between river- and sea water level.
58
Dimensions of wide, length, depth and dimensions of the valves are shown in the pages below with explanatory notes. First the dimensions of the design are elaborated in an overview with the
explanation on the solid waste removal. As second the dimensions of the valves are further elaborated and explained. Then there is shown how these work in different situations between river-
and sea water level.
Dimensions and functions of the structure and raster
The structure and raster’s function is to gather solid waste out of the river. To achieve this the waterway is widened in the debouchment and a triangle structure with the same size as the
waterway is created. The sides will catch the solid waste since the raster will guide the solid waste to the sides, where to solid waste can be collected. Dimensions of wide, length, depth and size are shown in Figure 43 and Figure 44.
Figure 43 Raster and valves in the debouchment of the North river branch (N. Boer & I.B.M. Opdam, Adobe Acrobat )
Figure 44 Operating of catching solid waste (N. Boer & I.B.M. Opdam, Adobe Acrobat )
59
Dimensions and functions of the valves
The valves are created so the water can flush out of the water system easily. When the tide rises and
the sea water level will be higher than the river water level, sea water would be able to flow into the river if it was not for the valves. When the sea water level gets higher than the river water level the pressure of the sea is higher than that of the river. The valves use this pressure difference in their
advantage to close the waterway. In the figures below the working of the valves is elaborated to show the valves work in different situation between river- and sea level.
Figure 45 Different situation between the river- and sea level (N. Boer & I.B.M. Opdam, Adobe Acrobat )
In Figure 45Figure 108 the valves are shown in two different situations. The first situation is during a low water level of the river. The lower valve is open during low tide, water can easily discharge to
sea. During high tide both valves are closed because of the higher pressure of the sea water. This makes sure the valves prevent the inflow of sea water. In situation 2 the water level of the river is higher due to rainfall. With low tide both valves are open
and river water passes through. With high tide both valves are still open because pressure of the river water is still higher than that off the sea so the river can still discharge its water.
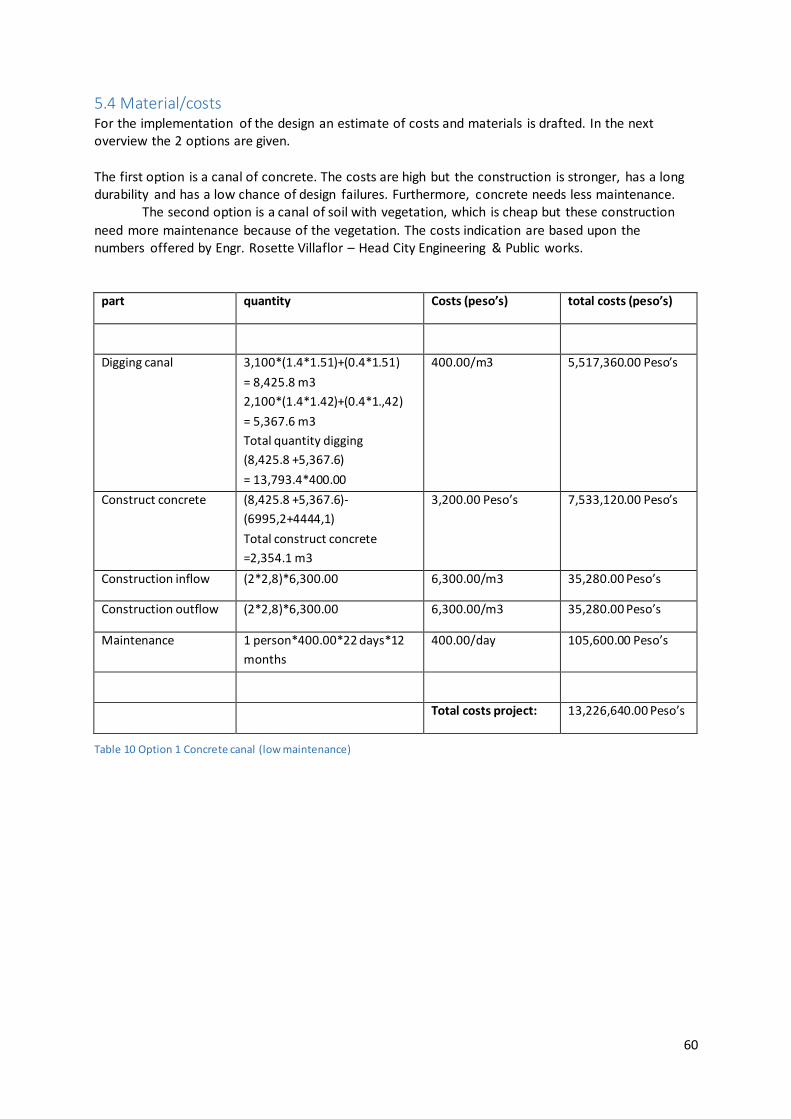
60
5.4 Material/costs For the implementation of the design an estimate of costs and materials is drafted. In the next overview the 2 options are given.
The first option is a canal of concrete. The costs are high but the construction is stronger, has a long durability and has a low chance of design failures. Furthermore, concrete needs less maintenance.
The second option is a canal of soil with vegetation, which is cheap but these construction
need more maintenance because of the vegetation. The costs indication are based upon the numbers offered by Engr. Rosette Villaflor – Head City Engineering & Public works.
part quantity Costs (peso’s) total costs (peso’s)
Digging canal 3,100*(1.4*1.51)+(0.4*1.51)
= 8,425.8 m3
2,100*(1.4*1.42)+(0.4*1.,42)
= 5,367.6 m3
Total quantity digging
(8,425.8 +5,367.6)
= 13,793.4*400.00
400.00/m3 5,517,360.00 Peso’s
Construct concrete (8,425.8 +5,367.6)-
(6995,2+4444,1)
Total construct concrete
=2,354.1 m3
3,200.00 Peso’s 7,533,120.00 Peso’s
Construction inflow (2*2,8)*6,300.00 6,300.00/m3 35,280.00 Peso’s
Construction outflow (2*2,8)*6,300.00 6,300.00/m3 35,280.00 Peso’s
Maintenance 1 person*400.00*22 days*12
months
400.00/day 105,600.00 Peso’s
Total costs project: 13,226,640.00 Peso’s
Table 10 Option 1 Concrete canal (low maintenance)
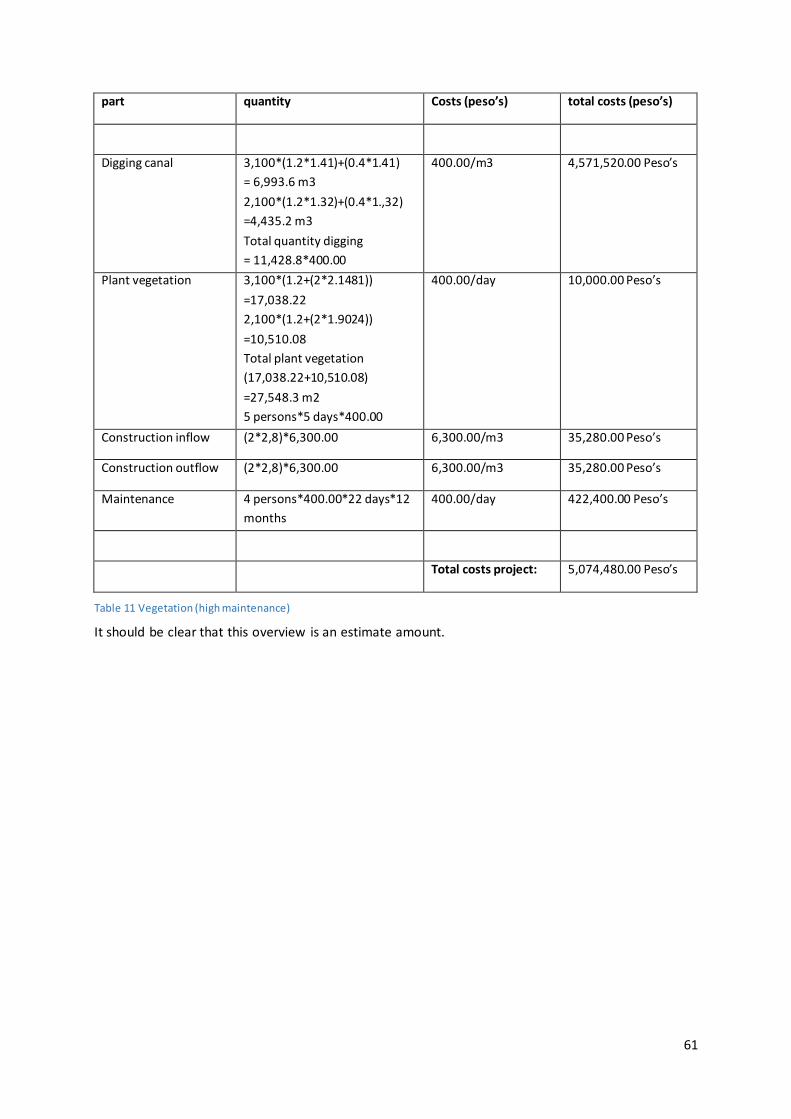
61
part quantity Costs (peso’s) total costs (peso’s)
Digging canal 3,100*(1.2*1.41)+(0.4*1.41)
= 6,993.6 m3
2,100*(1.2*1.32)+(0.4*1.,32)
=4,435.2 m3
Total quantity digging
= 11,428.8*400.00
400.00/m3 4,571,520.00 Peso’s
Plant vegetation 3,100*(1.2+(2*2.1481))
=17,038.22
2,100*(1.2+(2*1.9024))
=10,510.08
Total plant vegetation
(17,038.22+10,510.08)
=27,548.3 m2
5 persons*5 days*400.00
400.00/day 10,000.00 Peso’s
Construction inflow (2*2,8)*6,300.00 6,300.00/m3 35,280.00 Peso’s
Construction outflow (2*2,8)*6,300.00 6,300.00/m3 35,280.00 Peso’s
Maintenance 4 persons*400.00*22 days*12
months
400.00/day 422,400.00 Peso’s
Total costs project: 5,074,480.00 Peso’s
Table 11 Vegetation (high maintenance)
It should be clear that this overview is an estimate amount.

62
5.5 SWOT – Analysis To ensure the design is from high quality, the design its positive and negative side will be discussed in the SWOT - Analyses. Mind tools says: “A SWOT Analysis is a useful technique for understanding your Strengths and Weaknesses, and for identifying both the Opportunities open to you and the Threats
you face.” (MindTools, 2015) So this technique is going to identify the strengths, weaknesses, opportunities and threats of the two designs. In Figure 46 the template of a SWOT analysis is shown that is used. In Figure 47 and Figure 48 this template is filled in.
Figure 46 SWOT - Analysis (MindTools, 2015) (N. Boer & I.B.M. Opdam, Adobe Acrobat )
Furthermore, the data of the SWOT - Analysis is further analysed with the use of a Confrontation
Matrix. According to Expert Program Management the Confrontation Matrix allows you to analyse each different combination of strengths, weaknesses, opportunities, and threats (Expert Program
Management, 2014). The completed Confrontation Matrix identifies the most important strategic issues the design is facing. This issues will be discussed in the conclusion of the study. The two Confrontation Matrix’s are shown in Table 12 and Table 13.

63
Figure 47 Concrete design - Strengths, Weaknesses, Opportunities, Threats
Figure 48 Vegetation design - Strengths, Weaknesses, Opportunities, Threats

64
Opportunities Threats
R
esid
ents
of
Ceb
u
will
cre
ate
aw
aren
ess
reg
ardi
ng d
e
chal
len
ges
of
Wat
er
Man
age
me
nt
Life
tim
e
Res
iden
ts h
ealt
h w
ill
incr
ease
Cre
ati
ng t
he
envi
ronm
ent
for
a
caus
e re
late
d
solu
tio
n
Rai
n w
ater
flo
od
whe
n e
xtre
me
wea
ther
co
ndit
ions
No
co
llect
ion
of
solid
was
te
Des
ign
failu
res
Stre
ngt
hs
Durable + ++ 0 + - - - -1 Increase water storage ++ 0 0 0 - 0 - 0 Improved water
quality ++ 0 ++ + 0 -- - 2 Cleaner
environment ++ 0 + + - -- - 0 Natural inflow and discharge 0 0 0 ++ - 0 + 2 Prevents flooding's originating from
rain and high tide
++ 0 0 + - 0 -- 0
Wea
knes
ses
Quite expensive - 0 0 + 0 0 ++ 2 Obstruction of
roads - 0 0 0 0 0 0 -1 Maintenance ++ 0 0 0 0 - - 0 Land surrenders - 0 0 + 0 0 0 0 It is an aftereffect solution
+ 0 0 + - - - -1
7 2 3 6 -6 -7 -4 Table 12 Confrontation Matrix - Concrete design

65
Opportunities Threats
R
esid
ents
of
Ceb
u
will
cre
ate
aw
aren
ess
reg
ardi
ng d
e
chal
len
ges
of
Wat
er
Man
age
me
nt
Life
tim
e
Res
iden
ts h
ealt
h w
ill
incr
ease
Cre
ati
ng t
he
envi
ronm
ent
for
a
caus
e re
late
d
solu
tio
n
Rai
n w
ater
flo
od
whe
n e
xtre
me
wea
ther
co
ndit
ions
No
co
llect
ion
of
solid
was
te
Des
ign
failu
res
Stre
ngt
hs
Durable + + 0 + 0 - - -1 Cheap + 0 0 0 0 0 - 0 Increase water
storage ++ 0 0 0 + 0 - 1 Improved water
quality ++ 0 ++ + 0 -- - 2 Cleaner environment ++ 0 + + - -- - 0 Natural inflow and discharge 0 0 0 ++ - 0 + 2 Prevents
flooding's originating from
rain and high tide
++ 0 0 + - 0 -- 0
Wea
knes
ses
Obstruction of
roads - 0 0 0 0 0 0 -1 Maintenance ++ 0 0 0 0 - -- -1 Land surrenders - 0 0 + 0 0 0 0 It is an aftereffect solution
+ 0 0 + - - - -1
10 1 3 7 -6 -5 -5 Table 13 Confrontation Matrix - Vegetation design
66
5.6 Result & discussion Confrontation Matrix In the Confrontation Matrix’s the vegetation design reaches the residents of Cebu and creates more awareness regarding de challenges of Water Management because it is cheap it will address more residents. Furthermore, since soil is uses there is a higher danger for design failures than a concrete
waterway. This design also needs a lot more maintenance which brings along new risks. In the Confrontation Matrix’s the concrete design is more expensive but is very strong and that is
why there is less chance of design failures. Furthermore, the concrete design will create an environment for a cause related solution. Also this design has a longer lifetime since vegetation is
easier damaged. Eventually the expensive concrete has a higher result in combination than the cheap vegetation.
The following combinations have to be reckoned with for a success of both designs: When implementing this design the water storage will increase, this causes the reduce of the
consequences of heavy rainfall.
When people see the design residents will create more awareness regarding water quality and preventing floods, alluring them to create a mind-set for a cleaner environment.
The people do not have to regulate the water flow since the dam will create the right amount of flow. The only maintenance that is needed is the collection of solid waste and maintaining the
waterway. The biggest opportunity is the creation of a much healthier environment. Diseases will be less likely
to occur since the water quality is majorly improved. The biggest weakness is the obstruction of roads. There are a few intersections in the design
between rivers and roads that need construction for the waterways to be connected that the residents will experience as annoying.
Another weakness is that the design is an aftereffect solution, this means that the solution solves the symptoms of the problem.
One of the best strengths on the other hand is that the concrete design will create an environment for a cause related solution. A cause related solution would be a place where waste no longer ends
up in the waterways.

67
5.7 Conclusion This chapter will answer the sub question: ”What design contributes in increasing the water storage and improving of the river’s water quality?” By using the wishes and requirements shown in the stakeholder analysis a program of requirements
is drafted. In combination with the water system analysis a final solution is designed. By creating a canal with the next dimensions; a wide of 2 metres and a dept. of 1,41 or 1,32, a water storage of 11.439,3 m3 can be realized. This will be enough to flush the water system to protect the
residents of pollution. By flushing the water system stench and diseases of the river water are no longer a problem. To discharge a small amount of river water out of the main stream of the Tangon
River, a flow with enough strengths to flush the system will be created. Beside that there is enough storage in the canal to store 10.295,37m3 rainwater during extreme rainfall. Flooding’s during extreme weather are no longer possible.
To collect all floating garbage in the river system a garbage collector is designed at the end of the river branches. Cleaner water will discharged to the sea. To prevent the river area of the incoming sea during high tide, two valves are designed. These valves will close if the pressure of the sea is
bigger than the pressure of the river. For this project two different options are made. Option one is a solution with a concrete canal. This
option is needs an estimate budget of 13,226,640.00 Peso’s. this option needs a high budget but it is more powerful and has a longer durability. Beside that there is barely maintenance needed. The other option is a cheaper one, this solution is a canal of soil with vegetation. This option is much
cheaper but needs more maintenance because of the vegetation. This option needs an estimate budget of 5,074,470.00 Peso’s. This option can be a good alternative by a lower available budget.
68
6 Conclusion To answer the main question “Which recommendations can be given to increase the water storage and to improve the river’s water quality of a river in Cebu?”, first the sub questions are answered.
V. Which river is most interesting and usable to explore?
The Tangon River in Danao is chosen as research area since this river has the most interesting
problems and opportunities. The Tangon River is the highest score in the Multi Criteria Analysis
discussed in chapter 2 what supports this statement.
VI. What are the (spatial) characteristics of the Tangon River’s catchment area that enhance the
risks for floods (storm water runoff) and pollution?
This question will result in different maps showing the specific critical problems and
opportunities.
When all findings from the different analyses, water system analysis, spatial analysis and the stakeholder analysis are combined a clear picture of the problems and desiderates appears. An
increase in water storage and an improvement of the water quality of the secluded river branches is needed to improve the health environment and to prevent flooding’s originating from rain shower
and high tide. According to these desiderates a program of requirements is created. VII. Which stakeholders to take in account looking for possible measures?
Stakeholders will be identified and researched for advice and possible contribution.
For the implementation of a design for these desiderates, multiple stakeholders play a part for a
success. The Danao City Counsel and its residents play the biggest part and are included in the
research. The stakeholders below will play a part within this research and are included within the
research:
- Presidential Commission for the Urban Poor - City Engineering and Public Works
- Municipality of Danao - General Services Office - Danao Waterworks
- Disaster and Risk Management - Residents river bank
VIII. What design contributes increasing water storage and improving of the river’s water quality?
By connecting the Tangon River to the secluded river branches, North and South of Danao City a
water flow appears that will flush out the pollution in the new connected river branches. This water flow will flush the pollution to the debouchments in the east. This will ensure the disappearance of bad smell and bacteria that could have caused diseases.
In combination with the added water flow the solid waste will be collected using a triangle raster in the debouchments to prevent loss of marine life near the coast. To prevent the high tide from entering the new water system valves are installed to keep the water outside.
Next to these improvements the design is also dimensioned to withstand extreme weather showers that occur once in four years, this creates a reduce in flood hazards. The combination of
these solutions will create an environment for a healthy and sustainable water system in Danao City.
69
Recommendation There are two designs that can be implemented, a concrete design and a vegetation design. After comparing the strengths, opportunities, weaknesses and threats in a Confrontation Matrix there is chosen for the concrete design since this design has a higher score. In the remaining texts the
recommended points of interest are described. When implementing this design the water storage will increase, this causes the reduce of the
consequences of heavy rainfall.
When people see the design residents will create more awareness regarding water quality and preventing floods, alluring them to create a mind-set for a cleaner environment.
The people do not have to regulate the water flow since the dam will create the right amount of flow. The only maintenance that is needed is the collection of solid waste and maintaining the waterway.
The biggest opportunity is the creation of a much healthier environment. Diseases will be less likely
to occur since the water quality is majorly improved. The biggest weakness is the obstruction of roads. There are a few intersections in the design
between rivers and roads that need construction for the waterways to be connected that the residents will experience as annoying.
Another weakness is that the design is an aftereffect solution, this means that the solution solves the symptoms of the problem.
One of the best strengths on the other hand is that the concrete design will create an environment for a cause related solution. A cause related solution would be a place where waste no longer ends
up in the waterways. This is the social aspect of the problem. This design gives Danao City a solution for its waste
problems and a platform to improve the water quality even further. Recommend is a follow-up social study to research a way where waste is rightly disposed of.
70
Bibliography
Alterra, University of Wageningen. (2005). De doorlatendheid van de bodem voor infiltratiedoeleinden. Retrieved from Library.wur: http://library.wur.nl/WebQuery/wurpubs/fulltext/29252
Cebu Daily News. (2013, July 17). Flood sweep Danao City Brgys, displace 30 families. Cebu Daily News. Retrieved from newsinfo.inquire.net/446629/floods-danao-brgys-displace-30-families
Department of Environment & Natural Resources. (2014). The Philippine Clean Water Act. Department of Environment & Natural Resources, Environment Management Bureau Region 7, Cebu City. Retrieved 9 2, 2016, from http://119.92.161.2/embgovph/r07/WQMA.aspx
Esri. (2016). ArcGIS. Retrieved from GIS online map making: https://www.arcgis.com/home/webmap/viewer.html
Expert Program Management. (2014, December 4). The Confrontation Matrix. Retrieved from Expert
Program Management: http://www.expertprogrammanagement.com/2011/08/the-confrontation-matrix/
Geoscience Technologies Inc. (2013, March 24). Soil Mechanics. Retrieved from Copy of Soil: https://prezi.com/dtksnk51dajl/copy-of-soil/
geoview. (2016, 9 2). geoview. Retrieved from geoview:
http://ph.geoview.info/kinalumsan_river,1708717 Google. (2016). Google Earth. Retrieved from Google Maps: https://www.google.com/maps greedypeg. (2015, June 15). Greedypeg. Retrieved from Greedypeg:
http://greedypeg.org/cebu/Guadalupe-River.html inquirernews. (2011). 18 firms to clean up Butuanon River. inquirernews, Mandaue city, Cebu, Cebu,
Philippines. Kitakyushu Initiative Network Cities. (n.d.). River Improvement Project in Cebu City . Retrieved from
http://kitakyushu.iges.or.jp/docs/demo/cebu_philippines/report.pdf
Lao, E. (2016, September 6). City Counselor of Danao. (I. I. Opdam, & N. N. Boer, Interviewers) Lao, E. (2016, September 6). City Counselor of Danao. (I. Opdam, & N. Boer, Interviewers)
MindTools. (2015, December 31). SWOT analysis. Retrieved from MindTools: https://www.mindtools.com/pages/article/newTMC_05.htm
N. Boer, N., & I.B.M. Opdam, I. (2016, October 20). Field research. Surroundings Danao City, Cebu,
Philippines. N. Boer, N., & I.B.M. Opdam, I. (2016). Photography. Photographs. Presidential Commision for the
Urban Poor, Cebu.
N. Boer, N., & I.B.M. Opdam, I. (n.d.). Adobe Acrobat . Adobe InDesign & Illustrator. Presidential Commission for the Urban Poor, Cebu City.
Nationwide Operational Assessment of Hazards. (2016). Flood Hazard Danao. Danao, Cebu, Philippines. Retrieved from http://noah.dost.gov.ph/#/section/geoserver/flood100
newsinfo. (2010). newsinfo.inquirer. Retrieved from
http://newsinfo.inquirer.net/breakingnews/nation/view/20100925-294232/Sewerage-system-for-Met
OpenStreetMap. (2016). OpenStreetMap. Retrieved from OpenStreetMap:
https://www.openstreetmap.org/ Philstar. (2013). Philstar. Retrieved from http://www.philstar.com:8080/cebu-
news/2013/07/17/980341/heavy-rains-not-waterspout-hit-danao Sunstar. (2015, June 04). Butuanon ‘worst river in the Philippines'. Sunstar, p. 1. Retrieved from
http://www.sunstar.com.ph/cebu/local-news/2015/06/04/butuanon-worst-river-phils-
411231

71
Appendix I River selection
Niels Boer Ide Benjamin Maria Opdam
Presidential Commission for the Urban Poor Rotterdam University of Applied Science Supervisors: Mr. T.H. Heikoop, Mrs. C.T. Manlosa - Osano
The Philippines, Cebu City, September 23th 2016
72
Table of content
Appendix I River selection.............................................................................................................71
Introduction .............................................................................................................................73
1 River selection .......................................................................................................................73
1.1 Guadalupe River, Cebu city ..................................................................................................74
Current structure: .................................................................................................................74
Catchment area: ...................................................................................................................74
Altitude:...............................................................................................................................75
Pollution: .............................................................................................................................75
Problems:.............................................................................................................................75
Resent projects:....................................................................................................................75
Interview .............................................................................................................................75
Pictures Guadalupe River ......................................................................................................76
1.2 Butuanon River, Mandaue City ............................................................................................77
Current structure: .................................................................................................................77
Catchment area: ...................................................................................................................77
Altitude:...............................................................................................................................78
Pollution: .............................................................................................................................78
Problems:.............................................................................................................................78
Resent projects:....................................................................................................................78
Interview .............................................................................................................................79
Pictures Butuanon River ........................................................................................................80
1.3 Tangon River, Danao City.....................................................................................................81
Current structure: .................................................................................................................81
Catchment area: ...................................................................................................................81
Altitude:...............................................................................................................................81
Pollution: .............................................................................................................................82
Problems:.............................................................................................................................82
Resent projects:....................................................................................................................82
Interview .............................................................................................................................82
Conclusion interview ............................................................................................................83
Pictures Tangon River ...........................................................................................................84
2 Multi criteria analyse .............................................................................................................85
Conclusion ...............................................................................................................................88
Bibliography .............................................................................................................................89
73
Introduction This water system analysis will give a clear picture about de current situation of three main rivers in Cebu. The three main rivers in Cebu are; Guadalupe River, Batuanon River and the Tangon River.
With these analysis it will be possible to select the river with the biggest problems and opportunities and so to answer the sub question: Which river is most interesting and usable to explore? The rivers are separately discussed in the chapters below ending with a multi criteria analysis and the
conclusion.
1 River selection For the water system analysis three rivers are selected to have the ability to choose the one that fits with the research. All three rivers are important rivers flowing through Metro Cebu, from the inland
to the coast. With heavy rainfall these rivers water level rises and causes danger to its surroundings. This combined with the many residents living in the riverbanks, results in dangerous situations. Next
to the danger of floods there is also a lot of pollution present in the rivers, which causes a health risk. These three rivers know water safety, water quality and social problems. This asks for a solution with the use of a spatial integration. In the chapters below the three rivers are discussed.
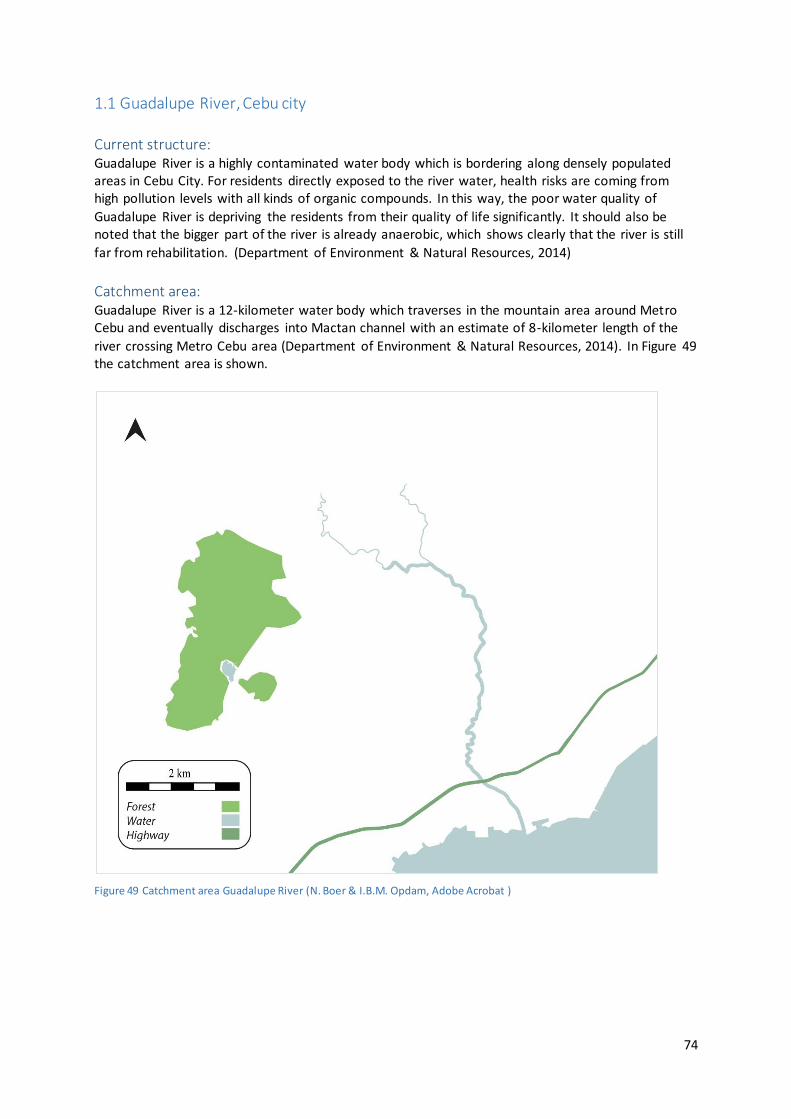
74
1.1 Guadalupe River, Cebu city
Current structure: Guadalupe River is a highly contaminated water body which is bordering along densely populated areas in Cebu City. For residents directly exposed to the river water, health risks are coming from high pollution levels with all kinds of organic compounds. In this way, the poor water quality of
Guadalupe River is depriving the residents from their quality of life significantly. It should also be noted that the bigger part of the river is already anaerobic, which shows clearly that the river is still
far from rehabilitation. (Department of Environment & Natural Resources, 2014)
Catchment area: Guadalupe River is a 12-kilometer water body which traverses in the mountain area around Metro Cebu and eventually discharges into Mactan channel with an estimate of 8-kilometer length of the
river crossing Metro Cebu area (Department of Environment & Natural Resources, 2014). In Figure 49 the catchment area is shown.
Figure 49 Catchment area Guadalupe River (N. Boer & I.B.M. Opdam, Adobe Acrobat )
75
Altitude: The flow of the Guadalupe River differs per area. Upstream the Guadalupe River’s water flow is a bit
stronger than downstream, this is because of the altitude. Upstream the river is ca. 7m wide and the depth variates from 0,5m to 2m. Downstream the river is ca. 16m wide with a depth variating from
0,25m to 6m.
Pollution: Since the area around the Guadalupe River is densely populated, the River is contaminated with
domestic waste water. There are two main reasons for these pollution. The abundant discharge of household wastewater and the inadequate disposal practices for solid waste. (Department of Environment & Natural Resources, 2014)
Problems: The expectation is that in it the future more people will be living in the riverbanks. Because of the Guadalupe River is near the overcrowded Cebu City, more poor people will look for a free place to
stay. This will make it increasingly dangerous in the riverbanks along the river Guadalupe.
Resent projects: In the past the government has carried out a couple of relocation projects. These projects were successful but by far not enough for all people in the river banks that needs help.
Interview September 16, 2016
Mary Grace
OCCUPANT RESILIENCE URBAN POOR RIVER BANKS GUADALUPE RIVER.
Can you tell me something about yourself?
My name is Mary Grace. I have 3 children and I am pregnant with another child. We sleep on the
ground of our house, we have no bed.
Does the Guadalupe River causes flooding’s often?
The last flooding occurred during the typhoon Yolanda in 2013. Since this event some small measures have been taken to prevent the resilience in the riverbanks in the future.
What kind of measures are taken? In the heavily damaged areas resilience were relocated to safe zones. And some parts of the
riverbanks were strengthened by concrete. What is being done at this time to improve the water quality?
At the moment, almost nothing. Water quality is not yet the priority. Some reliance were taught to collect and separate the waste. But there are a lot of problems by the government to collect al
garbage in the city. There also are relocations projects to relocate resilience of the riverbanks to safe zones to improve de water quality in the river banks.
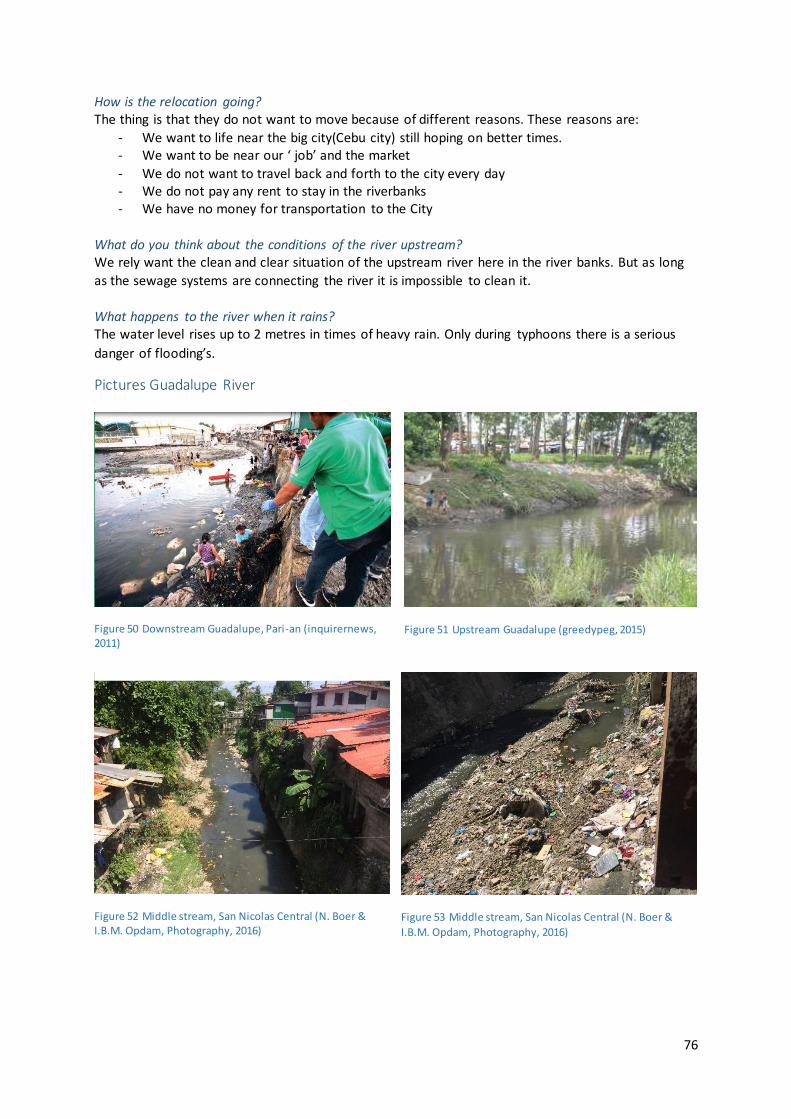
76
Figure 51 Upstream Guadalupe (greedypeg, 2015)
Figure 52 Middle stream, San Nicolas Central (N. Boer & I.B.M. Opdam, Photography, 2016)
Figure 53 Middle stream, San Nicolas Central (N. Boer &
I.B.M. Opdam, Photography, 2016)
Figure 50 Downstream Guadalupe, Pari-an (inquirernews, 2011)
How is the relocation going? The thing is that they do not want to move because of different reasons. These reasons are:
- We want to life near the big city(Cebu city) still hoping on better times. - We want to be near our ‘ job’ and the market
- We do not want to travel back and forth to the city every day - We do not pay any rent to stay in the riverbanks - We have no money for transportation to the City
What do you think about the conditions of the river upstream? We rely want the clean and clear situation of the upstream river here in the river banks. But as long
as the sewage systems are connecting the river it is impossible to clean it.
What happens to the river when it rains? The water level rises up to 2 metres in times of heavy rain. Only during typhoons there is a serious
danger of flooding’s.
Pictures Guadalupe River
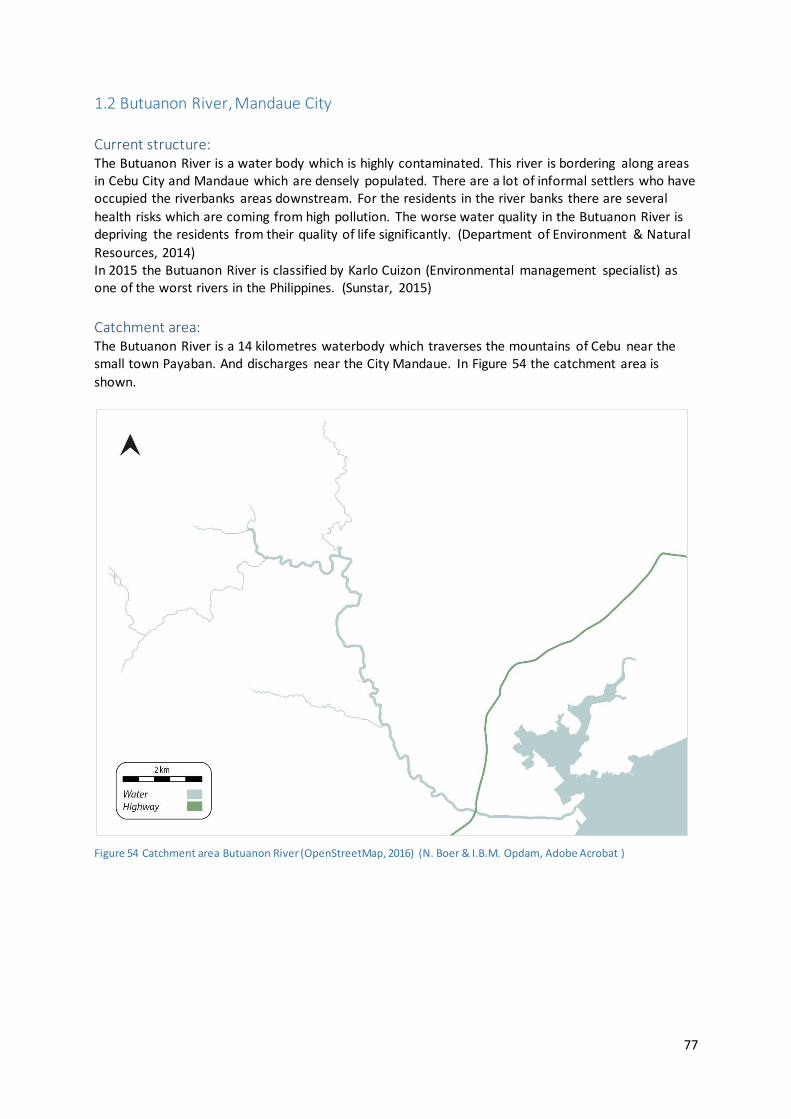
77
1.2 Butuanon River, Mandaue City
Current structure: The Butuanon River is a water body which is highly contaminated. This river is bordering along areas in Cebu City and Mandaue which are densely populated. There are a lot of informal settlers who have occupied the riverbanks areas downstream. For the residents in the river banks there are several
health risks which are coming from high pollution. The worse water quality in the Butuanon River is depriving the residents from their quality of life significantly. (Department of Environment & Natural
Resources, 2014) In 2015 the Butuanon River is classified by Karlo Cuizon (Environmental management specialist) as one of the worst rivers in the Philippines. (Sunstar, 2015)
Catchment area: The Butuanon River is a 14 kilometres waterbody which traverses the mountains of Cebu near the small town Payaban. And discharges near the City Mandaue. In Figure 54 the catchment area is
shown.
Figure 54 Catchment area Butuanon River (OpenStreetMap, 2016) (N. Boer & I.B.M. Opdam, Adobe Acrobat )
78
Altitude: The flow of the Butuanon River depends of the altitude of the area. Upstream in the Butuanon River
the water flow stronger than downstream. Upstream the river is ca. 24m wide and the depth variates from 0,5m to 4m. Downstream the river is ca. 19m wide with a depth variating from 2m to 12m.
Pollution: The Butuanon River is a highly polluted river. Especially in the dry seasons when the water streams slow, there is a bad smell. All kinds of garbage are mixed in the water and flows to the end of the
river through Mandaue City. A lot of houses in the river banks don’t have sceptic tanks and just dump every households waste in to the river. Some companies in the surrounding of the catchment area of the Butuanon River also throw a lot of
untreated waste into the river. (Cebu Daily News, 2013)
Problems: The Butuanon River has been a lot of negative press, in recent years there has been a lot of attention
to. Therefore, there are already devised several plans and partly implemented to significantly improve the quality and riverside.
Resent projects: In 2013 companies and business near the 23 kilometres length of the Butuanon River, have signed an
agreement with the city government and a couple of schools to clean up the river and report who dropped garbage in to the river. The agreement is part of the program; “Adopt a River or Estero”
which is in association with the Department of Environment and Natural Resources. (Cebu Daily News, 2013)
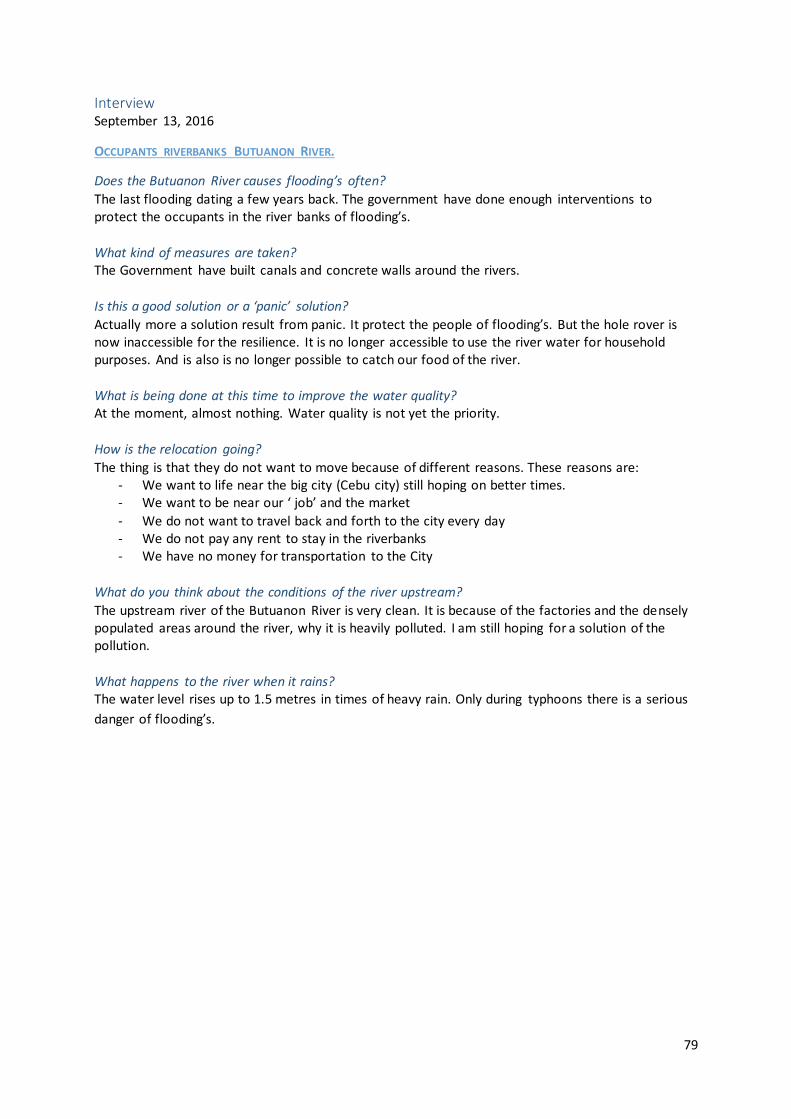
79
Interview September 13, 2016
OCCUPANTS RIVERBANKS BUTUANON RIVER.
Does the Butuanon River causes flooding’s often?
The last flooding dating a few years back. The government have done enough interventions to protect the occupants in the river banks of flooding’s.
What kind of measures are taken? The Government have built canals and concrete walls around the rivers.
Is this a good solution or a ‘panic’ solution?
Actually more a solution result from panic. It protect the people of flooding’s. But the hole rover is now inaccessible for the resilience. It is no longer accessible to use the river water for household purposes. And is also is no longer possible to catch our food of the river.
What is being done at this time to improve the water quality? At the moment, almost nothing. Water quality is not yet the priority.
How is the relocation going?
The thing is that they do not want to move because of different reasons. These reasons are: - We want to life near the big city (Cebu city) still hoping on better times. - We want to be near our ‘ job’ and the market
- We do not want to travel back and forth to the city every day - We do not pay any rent to stay in the riverbanks - We have no money for transportation to the City
What do you think about the conditions of the river upstream?
The upstream river of the Butuanon River is very clean. It is because of the factories and the densely populated areas around the river, why it is heavily polluted. I am still hoping for a solution of the pollution.
What happens to the river when it rains? The water level rises up to 1.5 metres in times of heavy rain. Only during typhoons there is a serious
danger of flooding’s.
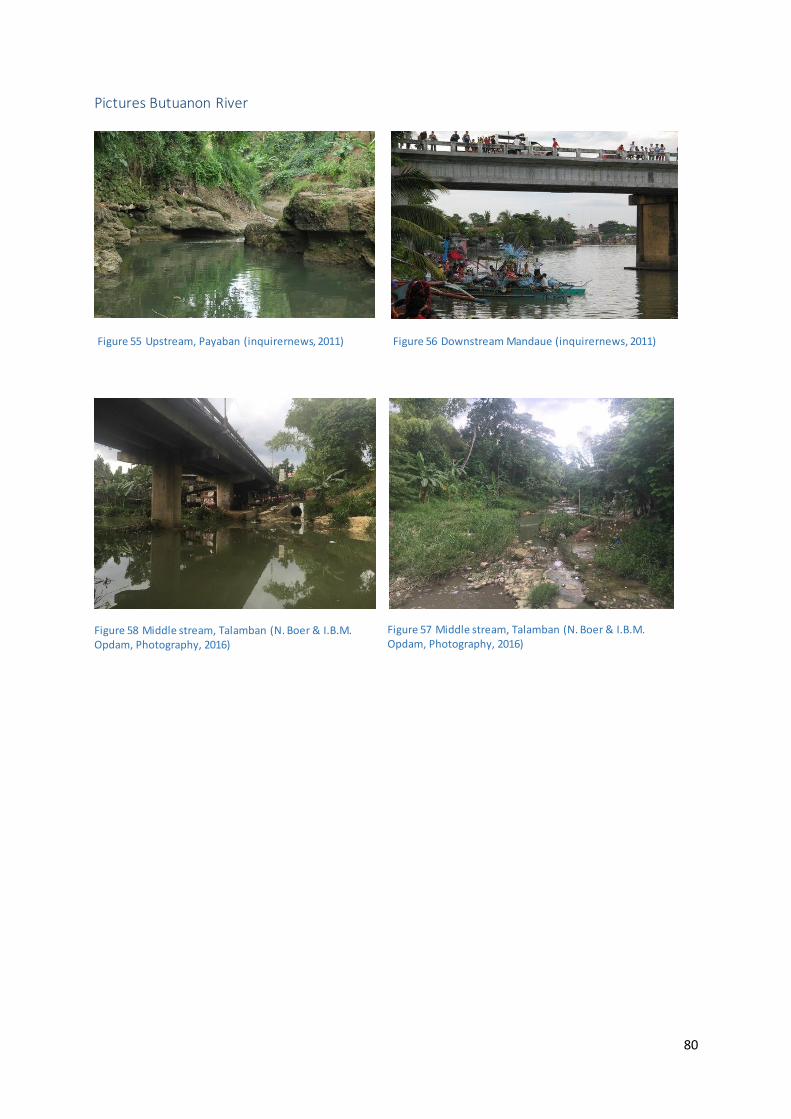
80
Figure 56 Downstream Mandaue (inquirernews, 2011)
Pictures Butuanon River
Figure 55 Upstream, Payaban (inquirernews, 2011)
Figure 57 Middle stream, Talamban (N. Boer & I.B.M. Opdam, Photography, 2016)
Figure 58 Middle stream, Talamban (N. Boer & I.B.M. Opdam, Photography, 2016)
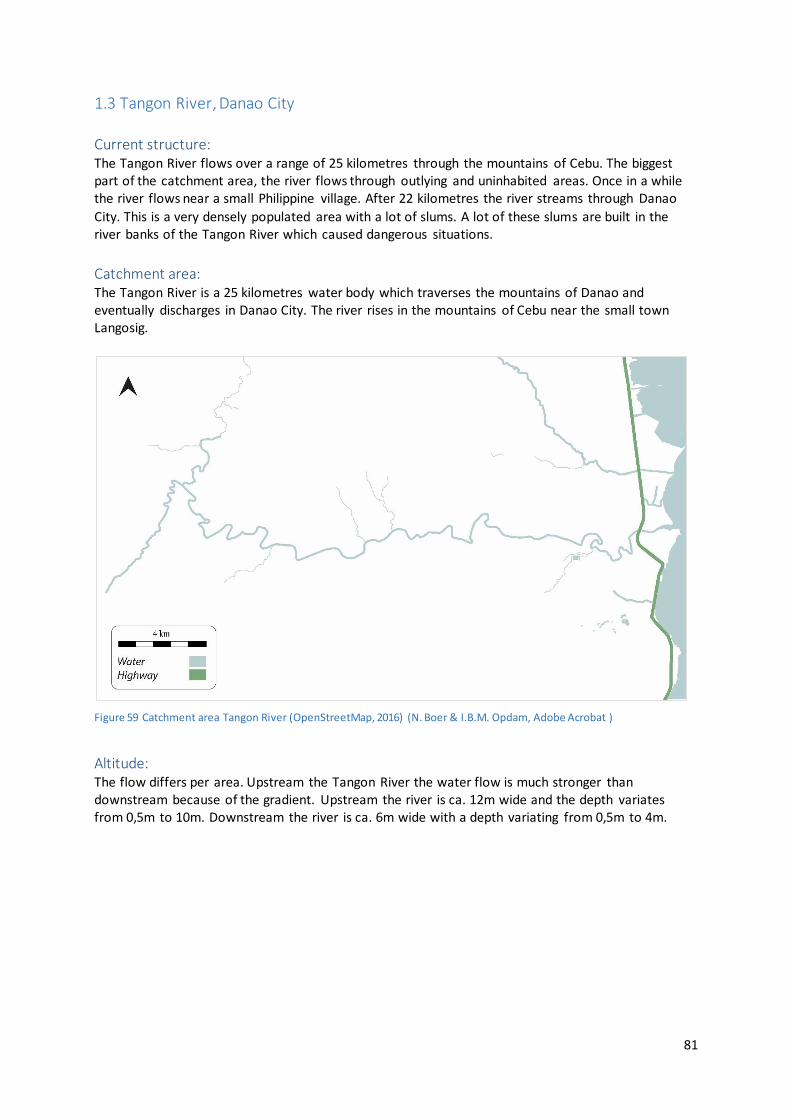
81
1.3 Tangon River, Danao City
Current structure: The Tangon River flows over a range of 25 kilometres through the mountains of Cebu. The biggest part of the catchment area, the river flows through outlying and uninhabited areas. Once in a while the river flows near a small Philippine village. After 22 kilometres the river streams through Danao
City. This is a very densely populated area with a lot of slums. A lot of these slums are built in the river banks of the Tangon River which caused dangerous situations.
Catchment area: The Tangon River is a 25 kilometres water body which traverses the mountains of Danao and eventually discharges in Danao City. The river rises in the mountains of Cebu near the small town Langosig.
Figure 59 Catchment area Tangon River (OpenStreetMap, 2016) (N. Boer & I.B.M. Opdam, Adobe Acrobat )
Altitude: The flow differs per area. Upstream the Tangon River the water flow is much stronger than downstream because of the gradient. Upstream the river is ca. 12m wide and the depth variates from 0,5m to 10m. Downstream the river is ca. 6m wide with a depth variating from 0,5m to 4m.
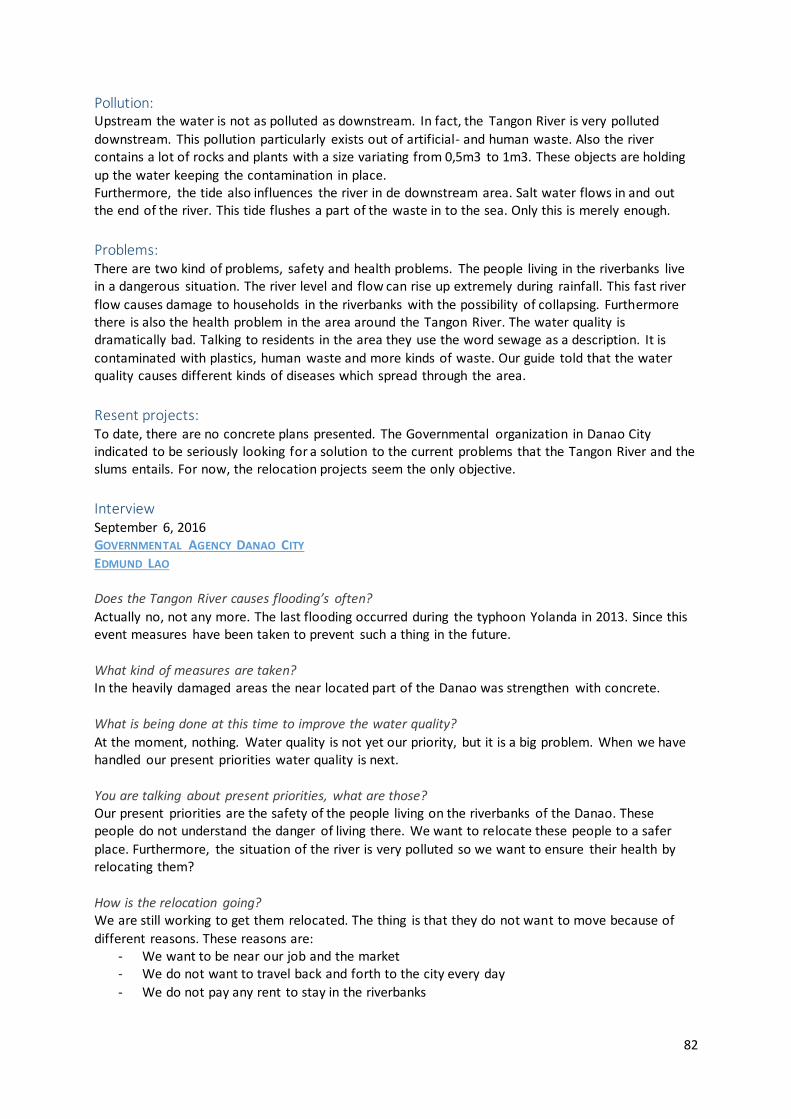
82
Pollution: Upstream the water is not as polluted as downstream. In fact, the Tangon River is very polluted
downstream. This pollution particularly exists out of artificial- and human waste. Also the river contains a lot of rocks and plants with a size variating from 0,5m3 to 1m3. These objects are holding
up the water keeping the contamination in place. Furthermore, the tide also influences the river in de downstream area. Salt water flows in and out the end of the river. This tide flushes a part of the waste in to the sea. Only this is merely enough.
Problems: There are two kind of problems, safety and health problems. The people living in the riverbanks live in a dangerous situation. The river level and flow can rise up extremely during rainfall. This fast river
flow causes damage to households in the riverbanks with the possibility of collapsing. Furthermore there is also the health problem in the area around the Tangon River. The water quality is dramatically bad. Talking to residents in the area they use the word sewage as a description. It is
contaminated with plastics, human waste and more kinds of waste. Our guide told that the water quality causes different kinds of diseases which spread through the area.
Resent projects: To date, there are no concrete plans presented. The Governmental organization in Danao City indicated to be seriously looking for a solution to the current problems that the Tangon River and the slums entails. For now, the relocation projects seem the only objective.
Interview September 6, 2016 GOVERNMENTAL AGENCY DANAO CITY
EDMUND LAO Does the Tangon River causes flooding’s often?
Actually no, not any more. The last flooding occurred during the typhoon Yolanda in 2013. Since this event measures have been taken to prevent such a thing in the future.
What kind of measures are taken? In the heavily damaged areas the near located part of the Danao was strengthen with concrete.
What is being done at this time to improve the water quality?
At the moment, nothing. Water quality is not yet our priority, but it is a big problem. When we have handled our present priorities water quality is next.
You are talking about present priorities, what are those? Our present priorities are the safety of the people living on the riverbanks of the Danao. These people do not understand the danger of living there. We want to relocate these people to a safer
place. Furthermore, the situation of the river is very polluted so we want to ensure their health by relocating them?
How is the relocation going? We are still working to get them relocated. The thing is that they do not want to move because of
different reasons. These reasons are: - We want to be near our job and the market - We do not want to travel back and forth to the city every day
- We do not pay any rent to stay in the riverbanks
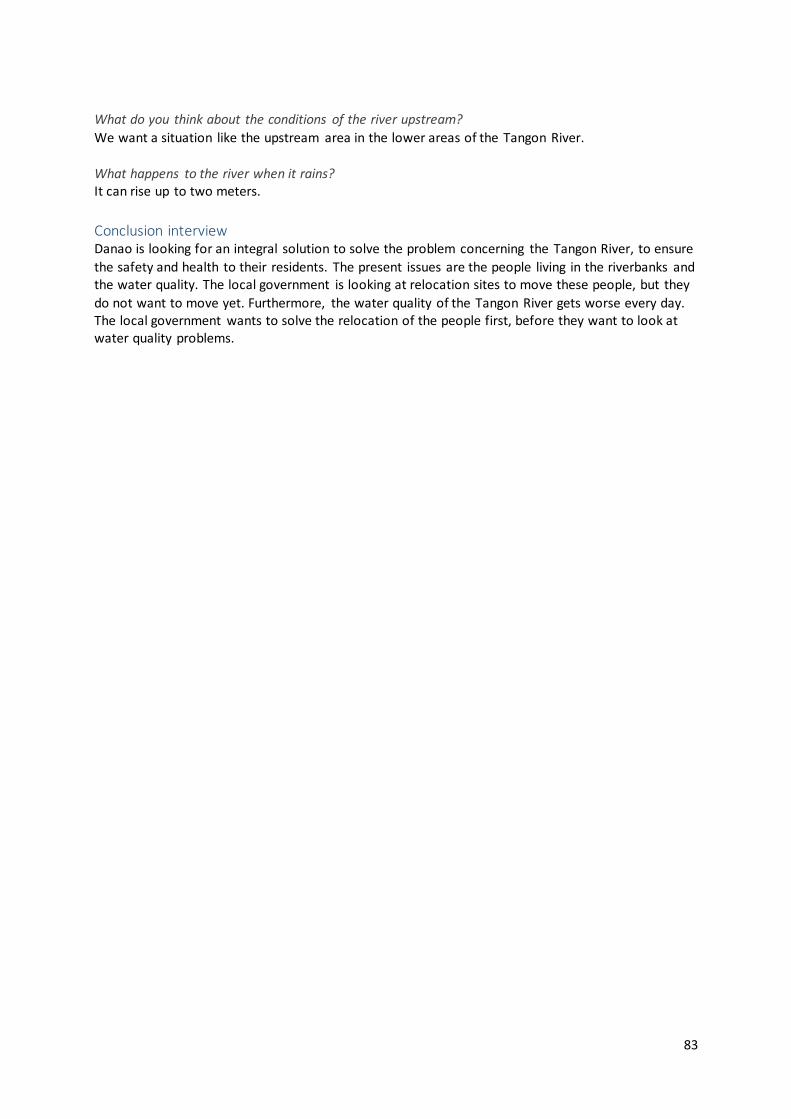
83
What do you think about the conditions of the river upstream?
We want a situation like the upstream area in the lower areas of the Tangon River.
What happens to the river when it rains? It can rise up to two meters.
Conclusion interview Danao is looking for an integral solution to solve the problem concerning the Tangon River, to ensure
the safety and health to their residents. The present issues are the people living in the riverbanks and the water quality. The local government is looking at relocation sites to move these people, but they
do not want to move yet. Furthermore, the water quality of the Tangon River gets worse every day. The local government wants to solve the relocation of the people first, before they want to look at water quality problems.
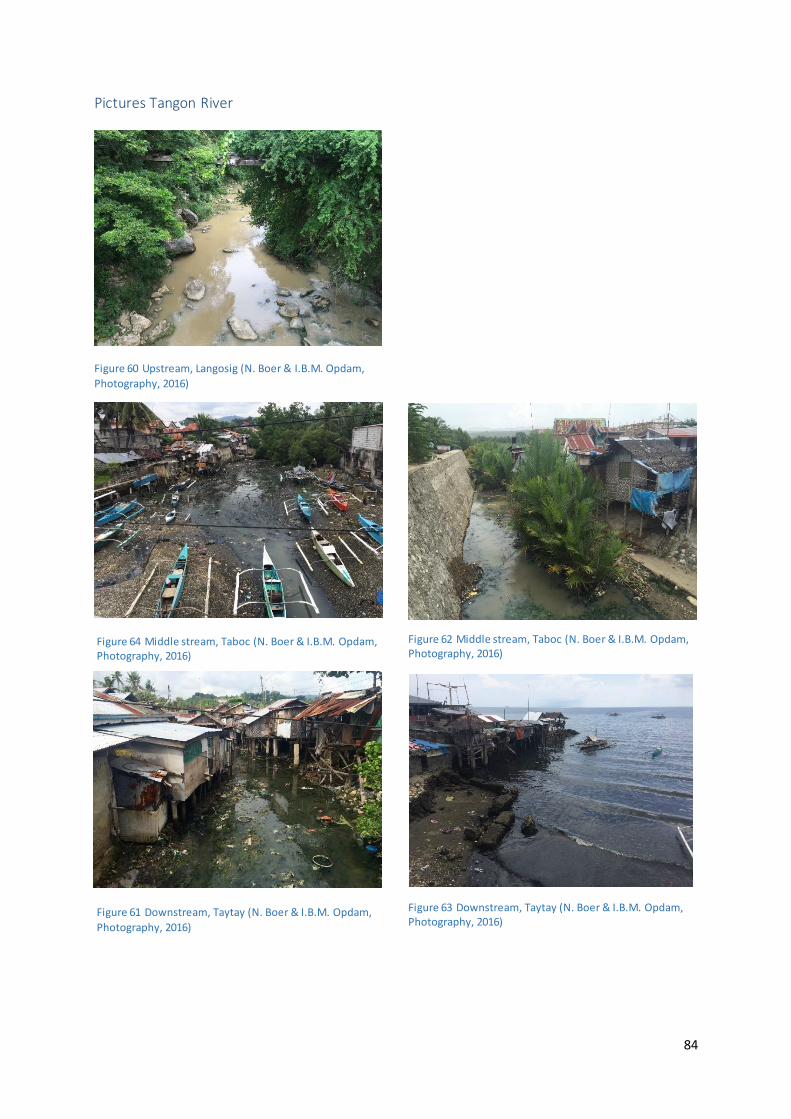
84
Pictures Tangon River
Figure 60 Upstream, Langosig (N. Boer & I.B.M. Opdam,
Photography, 2016)
Figure 64 Middle stream, Taboc (N. Boer & I.B.M. Opdam, Photography, 2016)
Figure 62 Middle stream, Taboc (N. Boer & I.B.M. Opdam, Photography, 2016)
Figure 63 Downstream, Taytay (N. Boer & I.B.M. Opdam, Photography, 2016)
Figure 61 Downstream, Taytay (N. Boer & I.B.M. Opdam,
Photography, 2016)
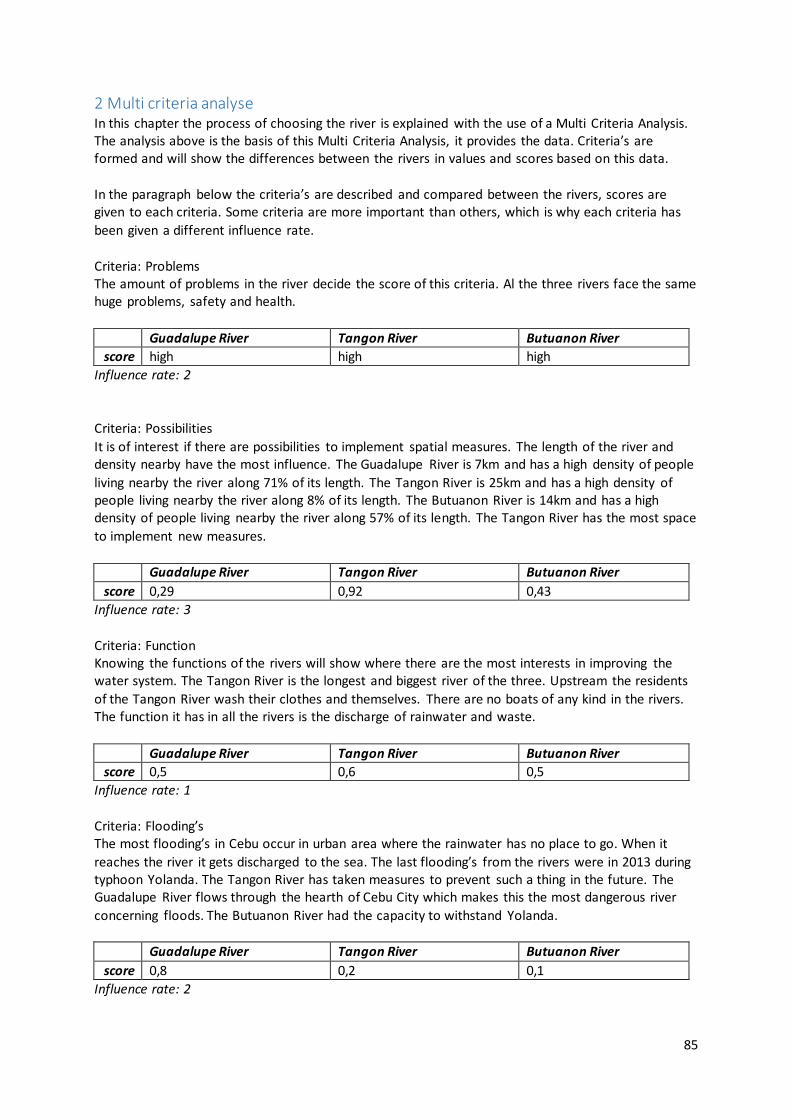
85
2 Multi criteria analyse In this chapter the process of choosing the river is explained with the use of a Multi Criteria Analysis. The analysis above is the basis of this Multi Criteria Analysis, it provides the data. Criteria’s are formed and will show the differences between the rivers in values and scores based on this data.
In the paragraph below the criteria’s are described and compared between the rivers, scores are given to each criteria. Some criteria are more important than others, which is why each criteria has
been given a different influence rate.
Criteria: Problems The amount of problems in the river decide the score of this criteria. Al the three rivers face the same huge problems, safety and health.
Guadalupe River Tangon River Butuanon River
score high high high
Influence rate: 2
Criteria: Possibilities
It is of interest if there are possibilities to implement spatial measures. The length of the river and density nearby have the most influence. The Guadalupe River is 7km and has a high density of people
living nearby the river along 71% of its length. The Tangon River is 25km and has a high density of people living nearby the river along 8% of its length. The Butuanon River is 14km and has a high density of people living nearby the river along 57% of its length. The Tangon River has the most space
to implement new measures.
Guadalupe River Tangon River Butuanon River
score 0,29 0,92 0,43
Influence rate: 3
Criteria: Function Knowing the functions of the rivers will show where there are the most interests in improving the water system. The Tangon River is the longest and biggest river of the three. Upstream the residents
of the Tangon River wash their clothes and themselves. There are no boats of any kind in the rivers. The function it has in all the rivers is the discharge of rainwater and waste.
Guadalupe River Tangon River Butuanon River
score 0,5 0,6 0,5
Influence rate: 1
Criteria: Flooding’s The most flooding’s in Cebu occur in urban area where the rainwater has no place to go. When it
reaches the river it gets discharged to the sea. The last flooding’s from the rivers were in 2013 during typhoon Yolanda. The Tangon River has taken measures to prevent such a thing in the future. The Guadalupe River flows through the hearth of Cebu City which makes this the most dangerous river
concerning floods. The Butuanon River had the capacity to withstand Yolanda.
Guadalupe River Tangon River Butuanon River
score 0,8 0,2 0,1
Influence rate: 2
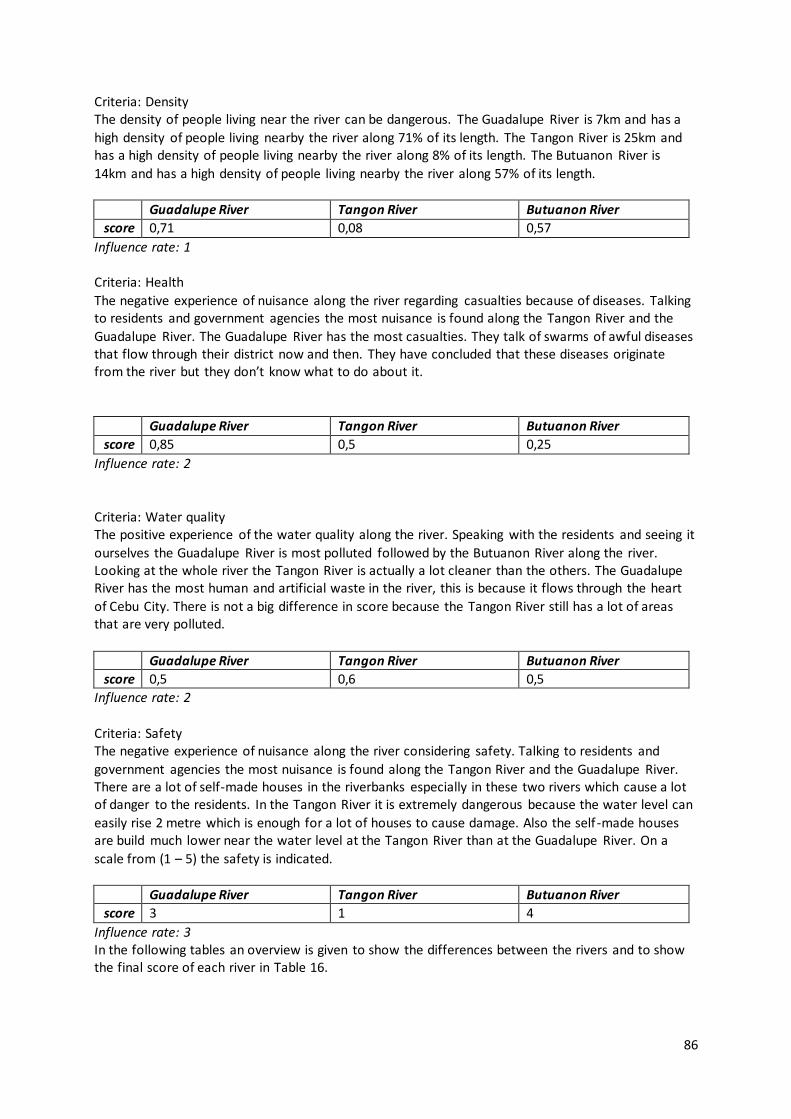
86
Criteria: Density The density of people living near the river can be dangerous. The Guadalupe River is 7km and has a
high density of people living nearby the river along 71% of its length. The Tangon River is 25km and has a high density of people living nearby the river along 8% of its length. The Butuanon River is
14km and has a high density of people living nearby the river along 57% of its length.
Guadalupe River Tangon River Butuanon River
score 0,71 0,08 0,57
Influence rate: 1 Criteria: Health
The negative experience of nuisance along the river regarding casualties because of diseases. Talking to residents and government agencies the most nuisance is found along the Tangon River and the
Guadalupe River. The Guadalupe River has the most casualties. They talk of swarms of awful diseases that flow through their district now and then. They have concluded that these diseases originate from the river but they don’t know what to do about it.
Guadalupe River Tangon River Butuanon River
score 0,85 0,5 0,25
Influence rate: 2
Criteria: Water quality The positive experience of the water quality along the river. Speaking with the residents and seeing it
ourselves the Guadalupe River is most polluted followed by the Butuanon River along the river. Looking at the whole river the Tangon River is actually a lot cleaner than the others. The Guadalupe River has the most human and artificial waste in the river, this is because it flows through the heart
of Cebu City. There is not a big difference in score because the Tangon River still has a lot of areas that are very polluted.
Guadalupe River Tangon River Butuanon River
score 0,5 0,6 0,5
Influence rate: 2
Criteria: Safety The negative experience of nuisance along the river considering safety. Talking to residents and
government agencies the most nuisance is found along the Tangon River and the Guadalupe River. There are a lot of self-made houses in the riverbanks especially in these two rivers which cause a lot of danger to the residents. In the Tangon River it is extremely dangerous because the water level can
easily rise 2 metre which is enough for a lot of houses to cause damage. Also the self -made houses are build much lower near the water level at the Tangon River than at the Guadalupe River. On a
scale from (1 – 5) the safety is indicated.
Guadalupe River Tangon River Butuanon River
score 3 1 4
Influence rate: 3 In the following tables an overview is given to show the differences between the rivers and to show the final score of each river in Table 16.
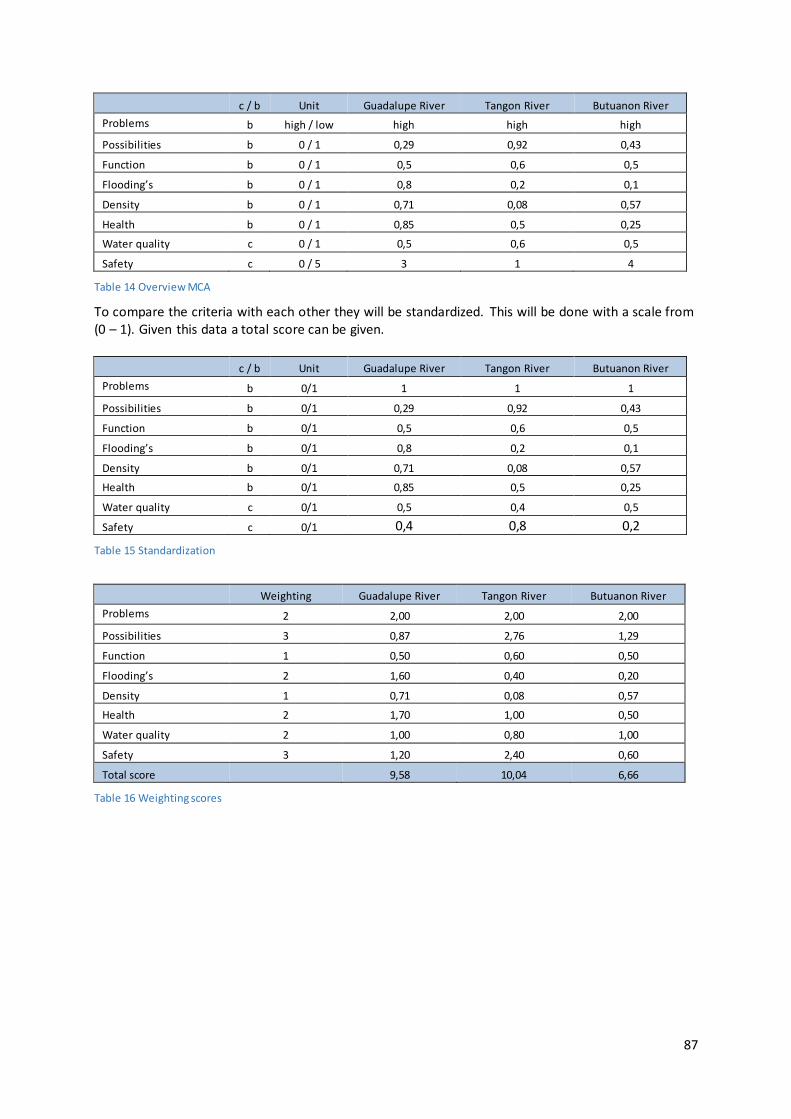
87
c / b Unit Guadalupe River Tangon River Butuanon River
Problems b high / low high high high
Possibilities b 0 / 1 0,29 0,92 0,43
Function b 0 / 1 0,5 0,6 0,5
Flooding’s b 0 / 1 0,8 0,2 0,1
Density b 0 / 1 0,71 0,08 0,57
Health b 0 / 1 0,85 0,5 0,25
Water quality c 0 / 1 0,5 0,6 0,5
Safety c 0 / 5 3 1 4
Table 14 Overview MCA
To compare the criteria with each other they will be standardized. This will be done with a scale from (0 – 1). Given this data a total score can be given.
c / b Unit Guadalupe River Tangon River Butuanon River
Problems b 0/1 1 1 1
Possibilities b 0/1 0,29 0,92 0,43
Function b 0/1 0,5 0,6 0,5
Flooding’s b 0/1 0,8 0,2 0,1
Density b 0/1 0,71 0,08 0,57
Health b 0/1 0,85 0,5 0,25
Water quality c 0/1 0,5 0,4 0,5
Safety c 0/1 0,4 0,8 0,2
Table 15 Standardization
Weighting Guadalupe River Tangon River Butuanon River
Problems 2 2,00 2,00 2,00
Possibilities 3 0,87 2,76 1,29
Function 1 0,50 0,60 0,50
Flooding’s 2 1,60 0,40 0,20
Density 1 0,71 0,08 0,57
Health 2 1,70 1,00 0,50
Water quality 2 1,00 0,80 1,00
Safety 3 1,20 2,40 0,60
Total score 9,58 10,04 6,66
Table 16 Weighting scores
88
Conclusion As shown in the total score the Tangon River has the highest score. The criteria safety and possibilities give the difference between the Guadalupe River and the Tangon River. The criteria water quality, density and health prefer the Guadalupe. This is because the Tangon River is almost
four times the size of the Guadalupe River, this causes that the Guadalupe River seems worse than the Tangon River in this criteria. Only this is not the case because the Tangon River has the same pollution and sometimes even worse downstream in the urban areas. Applying this theory the score
of the Tangon River would even be higher. Looking at these results there can be said that the Tangon River is the best choice for our research to be a success.
89
Bibliography Alterra, University of Wageningen. (2005). De doorlatendheid van de bodem voor
infiltratiedoeleinden. Retrieved from Library.wur:
http://library.wur.nl/WebQuery/wurpubs/fulltext/29252 Cebu Daily News. (2013, July 17). Flood sweep Danao City Brgys, displace 30 families. Cebu Daily
News. Retrieved from newsinfo.inquire.net/446629/floods-danao-brgys-displace-30-families
Department of Environment & Natural Resources. (2014). The Philippine Clean Water Act. Department of Environment & Natural Resources, Environment Management Bureau Region
7, Cebu City. Retrieved 9 2, 2016, from http://119.92.161.2/embgovph/r07/WQMA.aspx Esri. (2016). ArcGIS. Retrieved from GIS online map making:
https://www.arcgis.com/home/webmap/viewer.html
Expert Program Management. (2014, December 4). The Confrontation Matrix. Retrieved from Expert Program Management: http://www.expertprogrammanagement.com/2011/08/the-confrontation-matrix/
Geoscience Technologies Inc. (2013, March 24). Soil Mechanics. Retrieved from Copy of Soil: https://prezi.com/dtksnk51dajl/copy-of-soil/
geoview. (2016, 9 2). geoview. Retrieved from geoview: http://ph.geoview.info/kinalumsan_river,1708717
Google. (2016). Google Earth. Retrieved from Google Maps: https://www.google.com/maps
greedypeg. (2015, June 15). Greedypeg. Retrieved from Greedypeg: http://greedypeg.org/cebu/Guadalupe-River.html
inquirernews. (2011). 18 firms to clean up Butuanon River. inquirernews, Mandaue city, Cebu, Cebu, Philippines.
Kitakyushu Initiative Network Cities. (n.d.). River Improvement Project in Cebu City . Retrieved from
http://kitakyushu.iges.or.jp/docs/demo/cebu_philippines/report.pdf Lao, E. (2016, September 6). City Counselor of Danao. (I. I. Opdam, & N. N. Boer, Interviewers) Lao, E. (2016, September 6). City Counselor of Danao. (I. Opdam, & N. Boer, Interviewers)
MindTools. (2015, December 31). SWOT analysis. Retrieved from MindTools: https://www.mindtools.com/pages/article/newTMC_05.htm
N. Boer, N., & I.B.M. Opdam, I. (2016, October 20). Field research. Surroundings Danao City, Cebu, Philippines.
N. Boer, N., & I.B.M. Opdam, I. (2016). Photography. Photographs. Presidential Commision for the
Urban Poor, Cebu. N. Boer, N., & I.B.M. Opdam, I. (n.d.). Adobe Acrobat . Adobe InDesign & Illustrator. Presidential
Commission for the Urban Poor, Cebu City.
Nationwide Operational Assessment of Hazards. (2016). Flood Hazard Danao. Danao, Cebu, Philippines. Retrieved from http://noah.dost.gov.ph/#/section/geoserver/flood100
newsinfo. (2010). newsinfo.inquirer. Retrieved from http://newsinfo.inquirer.net/breakingnews/nation/view/20100925-294232/Sewerage-system-for-Met
OpenStreetMap. (2016). OpenStreetMap. Retrieved from OpenStreetMap: https://www.openstreetmap.org/
Philstar. (2013). Philstar. Retrieved from http://www.philstar.com:8080/cebu-
news/2013/07/17/980341/heavy-rains-not-waterspout-hit-danao Sunstar. (2015, June 04). Butuanon ‘worst river in the Philippines'. Sunstar, p. 1. Retrieved from
http://www.sunstar.com.ph/cebu/local-news/2015/06/04/butuanon-worst-river-phils-411231
90
Appendix II Characteristics
Niels Boer Ide Benjamin Maria Opdam
Presidential Commission for the Urban Poor Rotterdam University of Applied Science
Supervisors: Mr. T.H. Heikoop, Mrs. C.T. Manlosa - Osano The Philippines, Cebu City, October 26th 2016
91
Introduction This report will answer the second sub question: “What are the (spatial) characteristics of the Tangon
River’s catchment area that enhance the risks for floods (storm water runoff) and pollution?”. The
answer to this question will show us the specific critical problems and opportunities within its region
(the best location(s) to implement a design). These problems are discussed in chapter 1 and the
opportunities are discussed in chapter 2. The findings of the field research are shown in chapter 3. In
the conclusion the critical problems and spatial opportunities are discussed and the sub question will
be answered.
Table of content
Appendix II Characteristics............................................................................................................90
Introduction .............................................................................................................................90
1 Critical problems....................................................................................................................92
1.1 Water characteristics ......................................................................................................92
1.2 Social characteristics .......................................................................................................98
2 Spatial opportunities..............................................................................................................99
2.1 Height characteristics ......................................................................................................99
2.2 Urban characteristics..................................................................................................... 100
3 Field research ...................................................................................................................... 101
4 conclusion ........................................................................................................................... 107
Bibliography ........................................................................................................................... 108
2 Water Balance South river branch..................................................................................... 126
3 Elaboration Water Balance South river branch................................................................... 135
4 Water Balance North river branch..................................................................................... 140
5 Elaboration Water Balance North river branch................................................................... 149
Impressions Design................................................................................................................. 153
Material/costs ........................................................................................................................ 155
SWOT – Analysis ..................................................................................................................... 157
Result & discussion Confrontation Matrix ............................................................................ 161
Conclusion ............................................................................................................................. 162
Bibliography ........................................................................................................................... 162
92
1 Critical problems
1.1 Water characteristics This chapter reports the difficulties in the water system of the Tangon River. Include water pollution
and water safety are discussed. In this chapter the results of literature study and field study are described.
1.1.1 Flooding’s
In the case of flood the Tangon River scored not very high. Great floods are rarely common. Especially during extreme weather conditions (such as typhoons).
The following news items confirm the flooding during and extreme weather:
- July 17, 2013
Heavy rains and strong winds, not a waterspout, hit Danao City Monday afternoon brought about
by tropical depression “Insang”, police said yesterday. Insp. Romeo Caacoy, Danao City Deputy Police Chief said they inspected the area and found out that three barangays were affected, namely Sandayong Sur, Tuburan Sur and Ilaya
Neil Sanchez, head of the Provincial Disaster Risk Reduction and Management Council (PDRRMC), said that in Barangay Tuburan Sur, flood water reached chest level that prompted local disaster risk reduction units to evacuate residents to safer areas.
Fortunately, there was no casualty and no serious damage caused by the strong winds and heavy rains except for one house that was partially destroyed in Barangay Sandayong Sur.
Heavy rains not waterspout hit Danao (Philstar, 2013)
However, there is serious danger to residents in the riverbanks. Especially, during and after extreme weather, the water level rises in the Tangon River, what causes in an increase of the speed. This can lead to dangerous situations for the residents who live close to the river.
- July 17, 2013
About 30 families were affected when floodwaters swept through three barangays in Danao City
due to heavy rains last Monday evening. Oscar Tabada, acting Mactan chief of the state weather bureau Pagasa, refuted earlier reports that the three barangays were hit by a waterspout or “buhawi.” He said the rains were caused by
tropical depression “Isang.” Supt. Elmer Lim, Danao police chief, said floodwaters reached knee level in sitio Ilaya in barangay
Poblacion, barangay Tuburan Sur and parts of barangay Sandayong Sur. Neil Sanchez, Provincial Disaster and Risk Reduction Management Office (PDRRMO) chief, said damages in the three barangays were pegged at less than P100,000. No one was hurt.
Flood sweep Danao City Brgys, displace 30 families (Cebu Daily News, 2013)
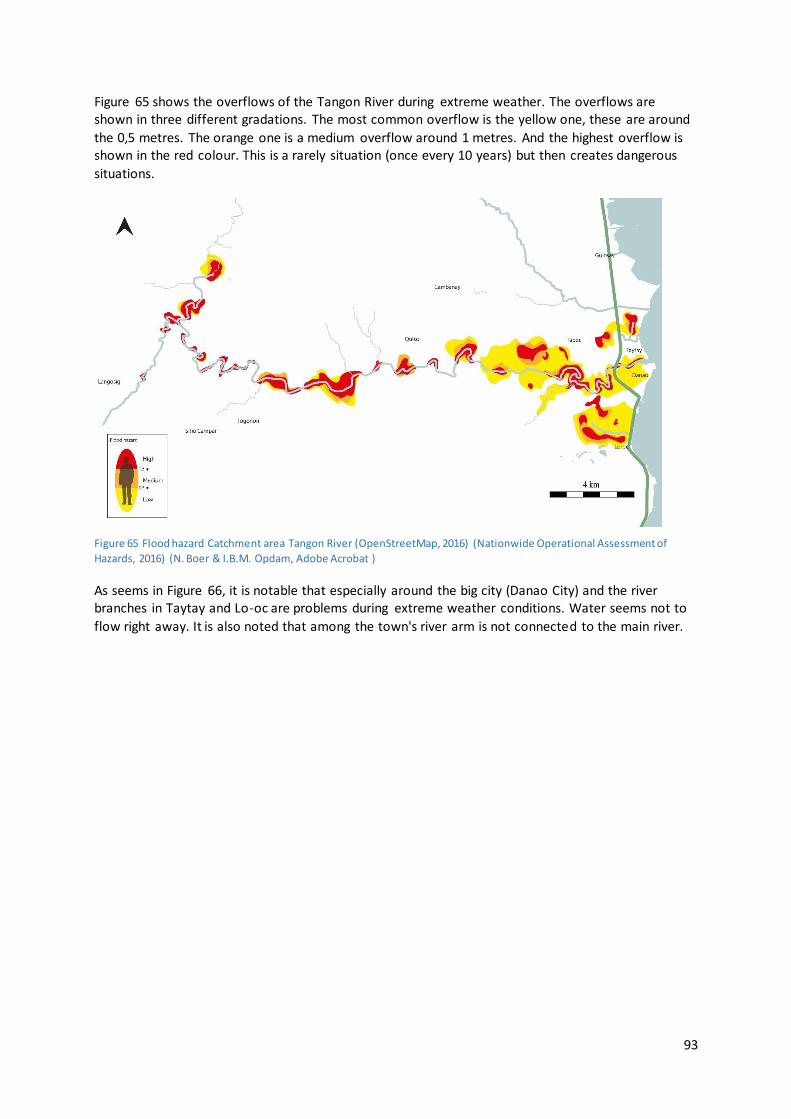
93
Figure 65 shows the overflows of the Tangon River during extreme weather. The overflows are shown in three different gradations. The most common overflow is the yellow one, these are around
the 0,5 metres. The orange one is a medium overflow around 1 metres. And the highest overflow is shown in the red colour. This is a rarely situation (once every 10 years) but then creates dangerous
situations.
Figure 65 Flood hazard Catchment area Tangon River (OpenStreetMap, 2016) (Nationwide Operational Assessment of
Hazards, 2016) (N. Boer & I.B.M. Opdam, Adobe Acrobat )
As seems in Figure 66, it is notable that especially around the big city (Danao City) and the river branches in Taytay and Lo-oc are problems during extreme weather conditions. Water seems not to
flow right away. It is also noted that among the town's river arm is not connected to the main river.
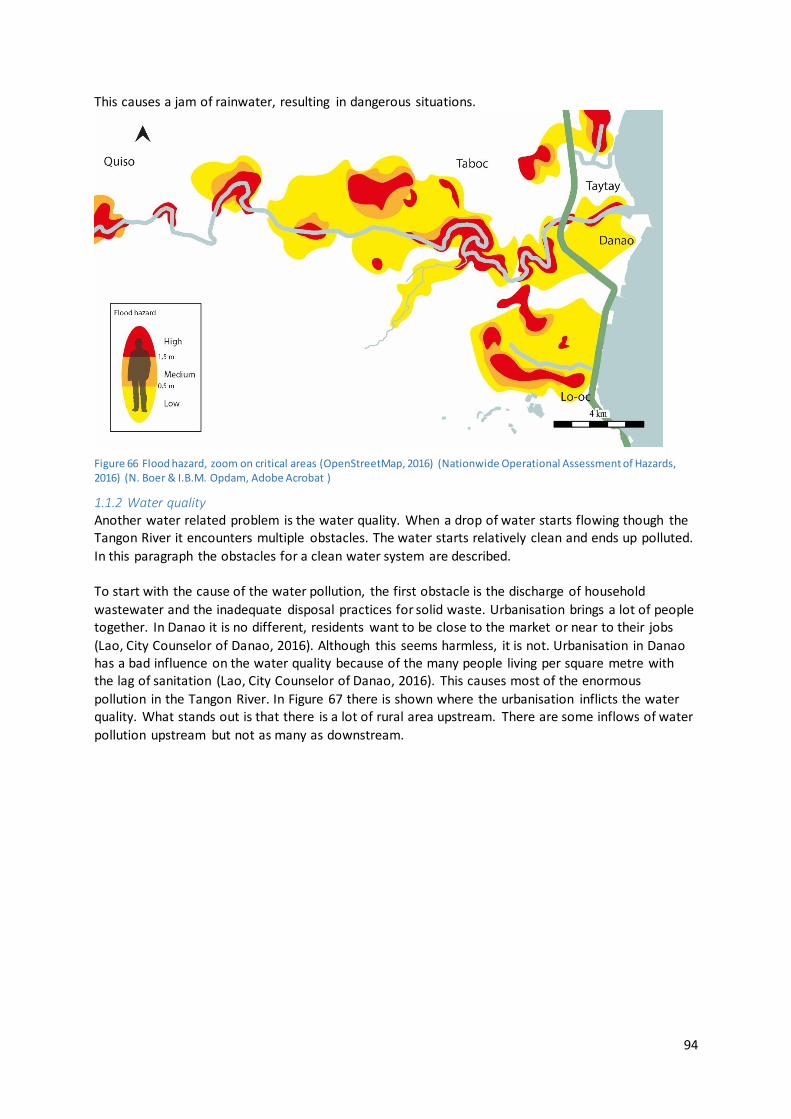
94
This causes a jam of rainwater, resulting in dangerous situations.
Figure 66 Flood hazard, zoom on critical areas (OpenStreetMap, 2016) (Nationwide Operational Assessment of Hazards, 2016) (N. Boer & I.B.M. Opdam, Adobe Acrobat )
1.1.2 Water quality Another water related problem is the water quality. When a drop of water starts flowing though the Tangon River it encounters multiple obstacles. The water starts relatively clean and ends up polluted.
In this paragraph the obstacles for a clean water system are described. To start with the cause of the water pollution, the first obstacle is the discharge of household
wastewater and the inadequate disposal practices for solid waste. Urbanisation brings a lot of people together. In Danao it is no different, residents want to be close to the market or near to their jobs
(Lao, City Counselor of Danao, 2016). Although this seems harmless, it is not. Urbanisation in Danao has a bad influence on the water quality because of the many people living per square metre with the lag of sanitation (Lao, City Counselor of Danao, 2016). This causes most of the enormous
pollution in the Tangon River. In Figure 67 there is shown where the urbanisation inflicts the water quality. What stands out is that there is a lot of rural area upstream. There are some inflows of water
pollution upstream but not as many as downstream.
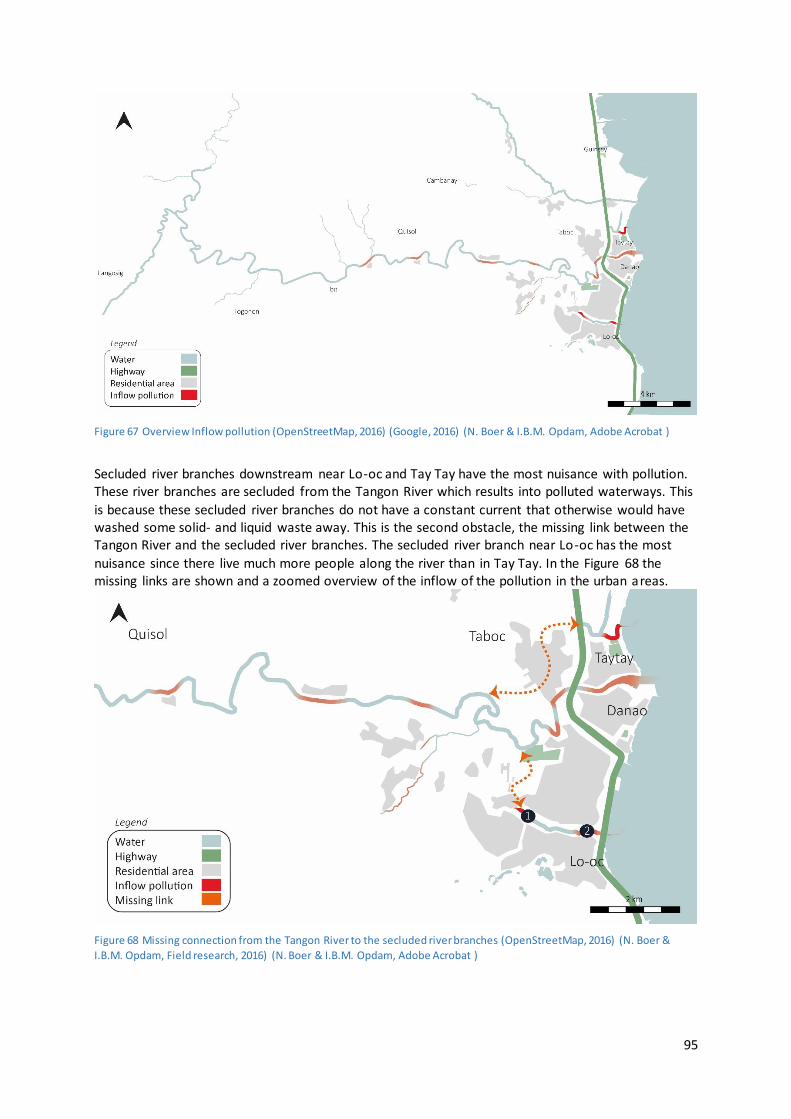
95
Figure 67 Overview Inflow pollution (OpenStreetMap, 2016) (Google, 2016) (N. Boer & I.B.M. Opdam, Adobe Acrobat )
Secluded river branches downstream near Lo-oc and Tay Tay have the most nuisance with pollution. These river branches are secluded from the Tangon River which results into polluted waterways. This
is because these secluded river branches do not have a constant current that otherwise would have washed some solid- and liquid waste away. This is the second obstacle, the missing link between the Tangon River and the secluded river branches. The secluded river branch near Lo-oc has the most
nuisance since there live much more people along the river than in Tay Tay. In the Figure 68 the missing links are shown and a zoomed overview of the inflow of the pollution in the urban areas.
Figure 68 Missing connection from the Tangon River to the secluded river branches (OpenStreetMap, 2016) (N. Boer &
I.B.M. Opdam, Field research, 2016) (N. Boer & I.B.M. Opdam, Adobe Acrobat )
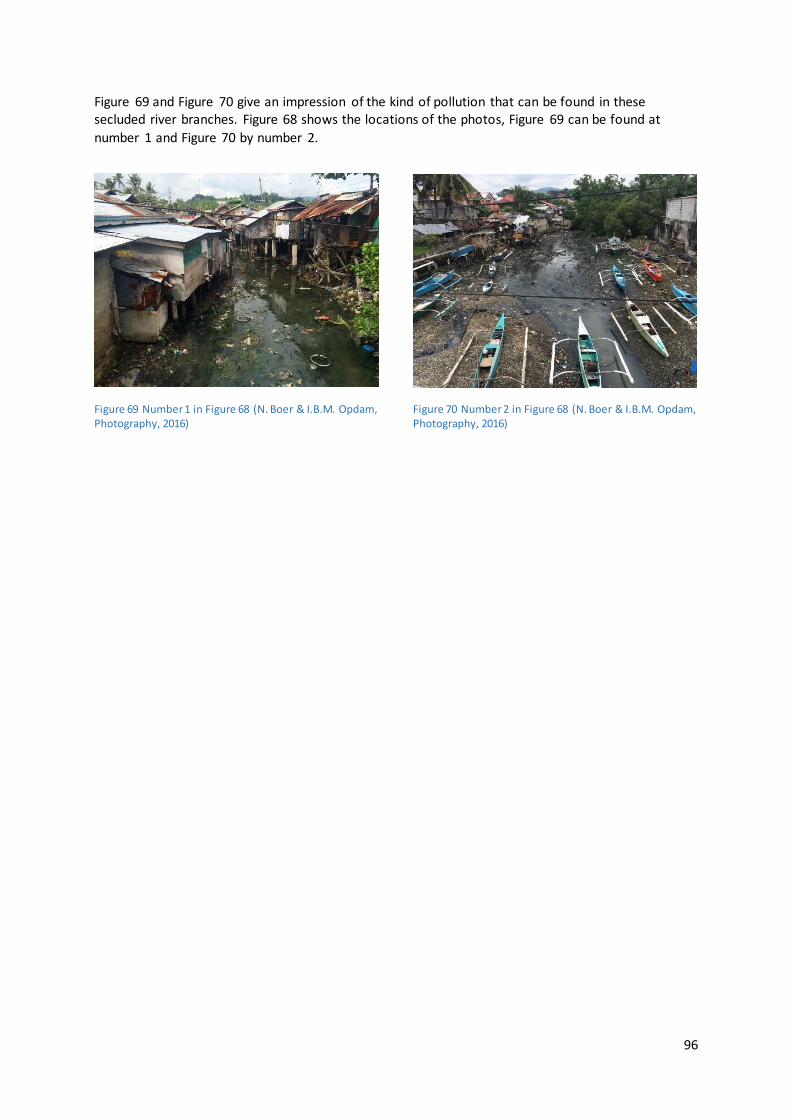
96
Figure 69 and Figure 70 give an impression of the kind of pollution that can be found in these secluded river branches. Figure 68 shows the locations of the photos, Figure 69 can be found at
number 1 and Figure 70 by number 2.
Figure 69 Number 1 in Figure 68 (N. Boer & I.B.M. Opdam, Photography, 2016)
Figure 70 Number 2 in Figure 68 (N. Boer & I.B.M. Opdam, Photography, 2016)
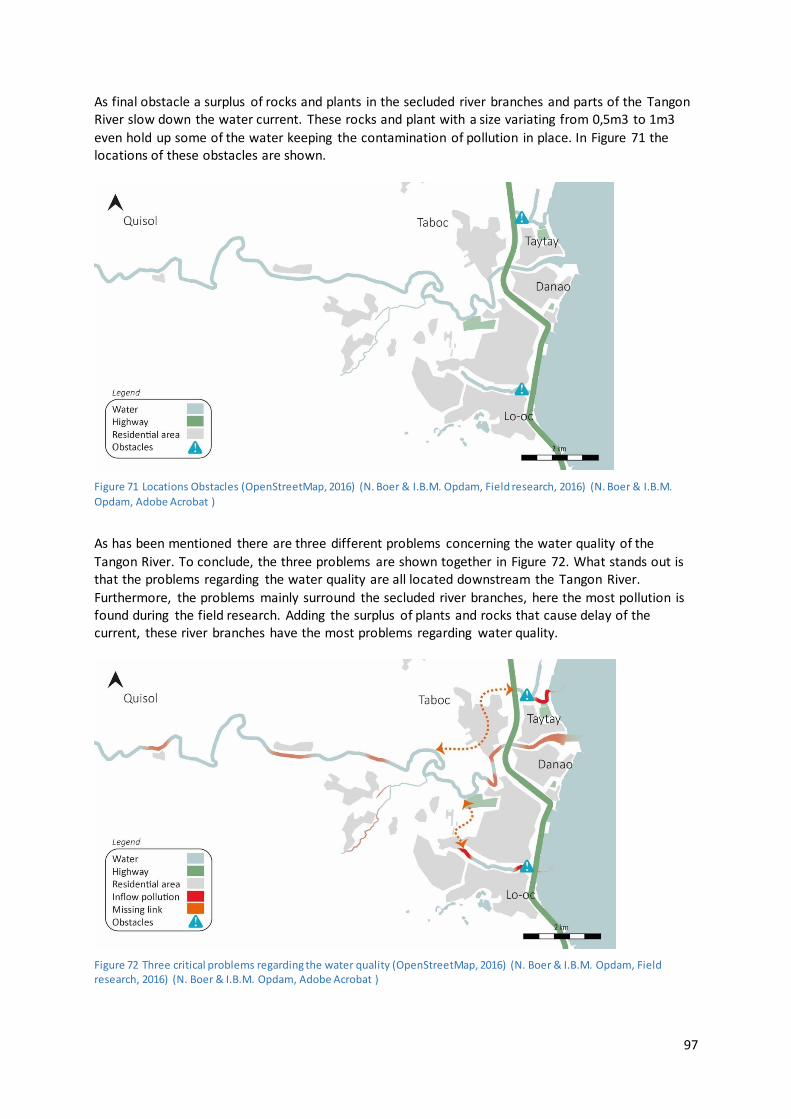
97
As final obstacle a surplus of rocks and plants in the secluded river branches and parts of the Tangon River slow down the water current. These rocks and plant with a size variating from 0,5m3 to 1m3
even hold up some of the water keeping the contamination of pollution in place. In Figure 71 the locations of these obstacles are shown.
Figure 71 Locations Obstacles (OpenStreetMap, 2016) (N. Boer & I.B.M. Opdam, Field research, 2016) (N. Boer & I.B.M.
Opdam, Adobe Acrobat )
As has been mentioned there are three different problems concerning the water quality of the
Tangon River. To conclude, the three problems are shown together in Figure 72. What stands out is that the problems regarding the water quality are all located downstream the Tangon River.
Furthermore, the problems mainly surround the secluded river branches, here the most pollution is found during the field research. Adding the surplus of plants and rocks that cause delay of the current, these river branches have the most problems regarding water quality.
Figure 72 Three critical problems regarding the water quality (OpenStreetMap, 2016) (N. Boer & I.B.M. Opdam, Field research, 2016) (N. Boer & I.B.M. Opdam, Adobe Acrobat )
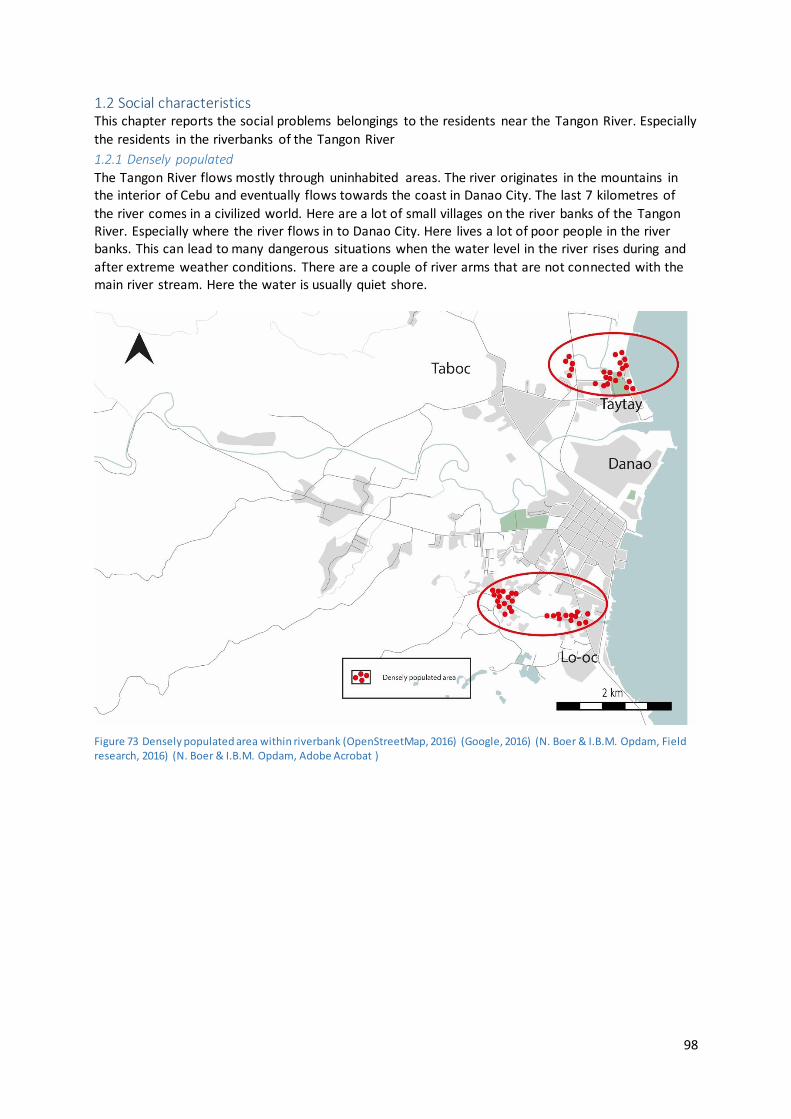
98
1.2 Social characteristics This chapter reports the social problems belongings to the residents near the Tangon River. Especially
the residents in the riverbanks of the Tangon River
1.2.1 Densely populated
The Tangon River flows mostly through uninhabited areas. The river originates in the mountains in the interior of Cebu and eventually flows towards the coast in Danao City. The last 7 kilometres of
the river comes in a civilized world. Here are a lot of small villages on the river banks of the Tangon River. Especially where the river flows in to Danao City. Here lives a lot of poor people in the river banks. This can lead to many dangerous situations when the water level in the river rises during and
after extreme weather conditions. There are a couple of river arms that are not connected with the main river stream. Here the water is usually quiet shore.
Figure 73 Densely populated area within riverbank (OpenStreetMap, 2016) (Google, 2016) (N. Boer & I.B.M. Opdam, Field research, 2016) (N. Boer & I.B.M. Opdam, Adobe Acrobat )
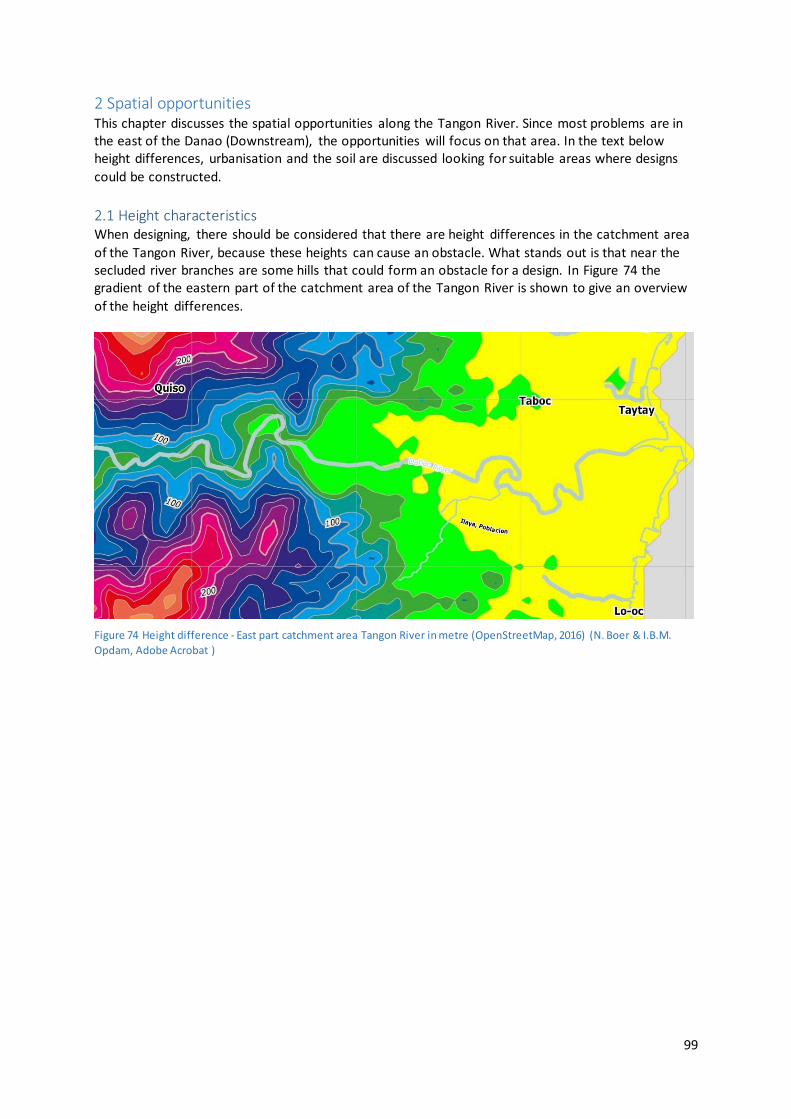
99
2 Spatial opportunities This chapter discusses the spatial opportunities along the Tangon River. Since most problems are in the east of the Danao (Downstream), the opportunities will focus on that area. In the text below height differences, urbanisation and the soil are discussed looking for suitable areas where designs
could be constructed.
2.1 Height characteristics When designing, there should be considered that there are height differences in the catchment area
of the Tangon River, because these heights can cause an obstacle. What stands out is that near the secluded river branches are some hills that could form an obstacle for a design. In Figure 74 the gradient of the eastern part of the catchment area of the Tangon River is shown to give an overview
of the height differences.
Figure 74 Height difference - East part catchment area Tangon River in metre (OpenStreetMap, 2016) (N. Boer & I.B.M.
Opdam, Adobe Acrobat )
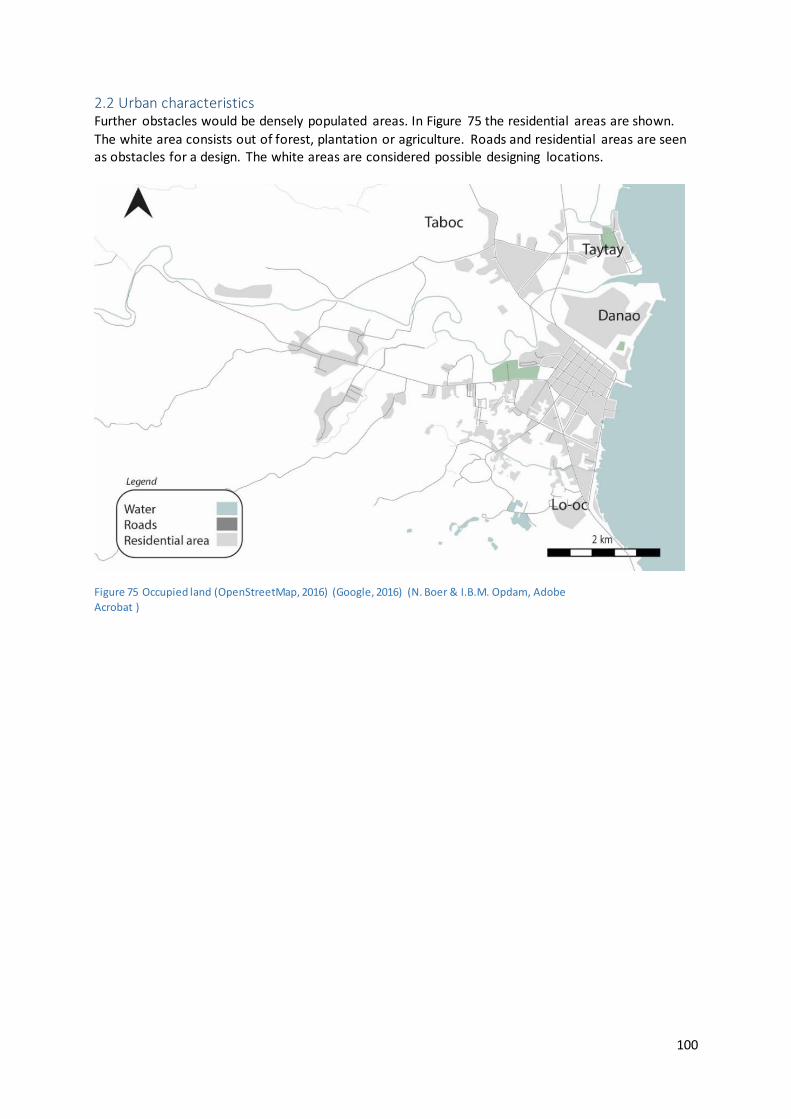
100
2.2 Urban characteristics Further obstacles would be densely populated areas. In Figure 75 the residential areas are shown.
The white area consists out of forest, plantation or agriculture. Roads and residential areas are seen as obstacles for a design. The white areas are considered possible designing locations.
Figure 75 Occupied land (OpenStreetMap, 2016) (Google, 2016) (N. Boer & I.B.M. Opdam, Adobe
Acrobat )
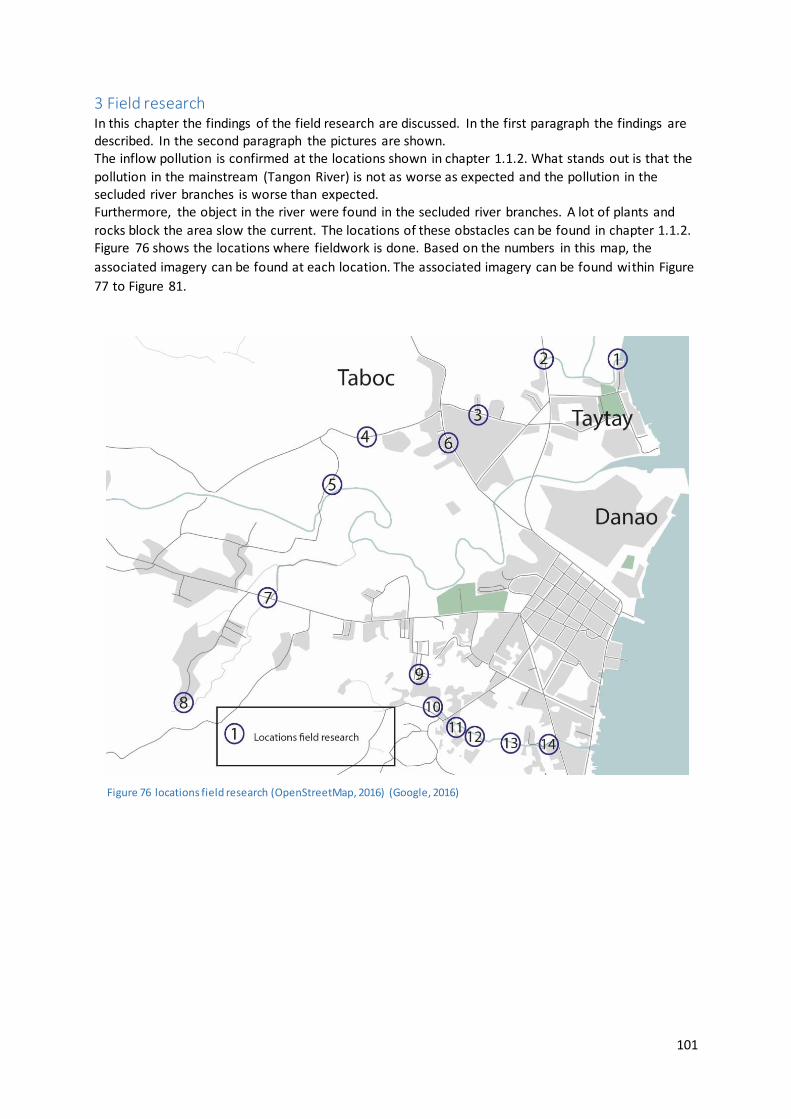
101
3 Field research In this chapter the findings of the field research are discussed. In the first paragraph the findings are described. In the second paragraph the pictures are shown. The inflow pollution is confirmed at the locations shown in chapter 1.1.2. What stands out is that the
pollution in the mainstream (Tangon River) is not as worse as expected and the pollution in the secluded river branches is worse than expected. Furthermore, the object in the river were found in the secluded river branches. A lot of plants and
rocks block the area slow the current. The locations of these obstacles can be found in chapter 1.1.2. Figure 76 shows the locations where fieldwork is done. Based on the numbers in this map, the
associated imagery can be found at each location. The associated imagery can be found within Figure
77 to Figure 81.
Figure 76 locations field research (OpenStreetMap, 2016) (Google, 2016)
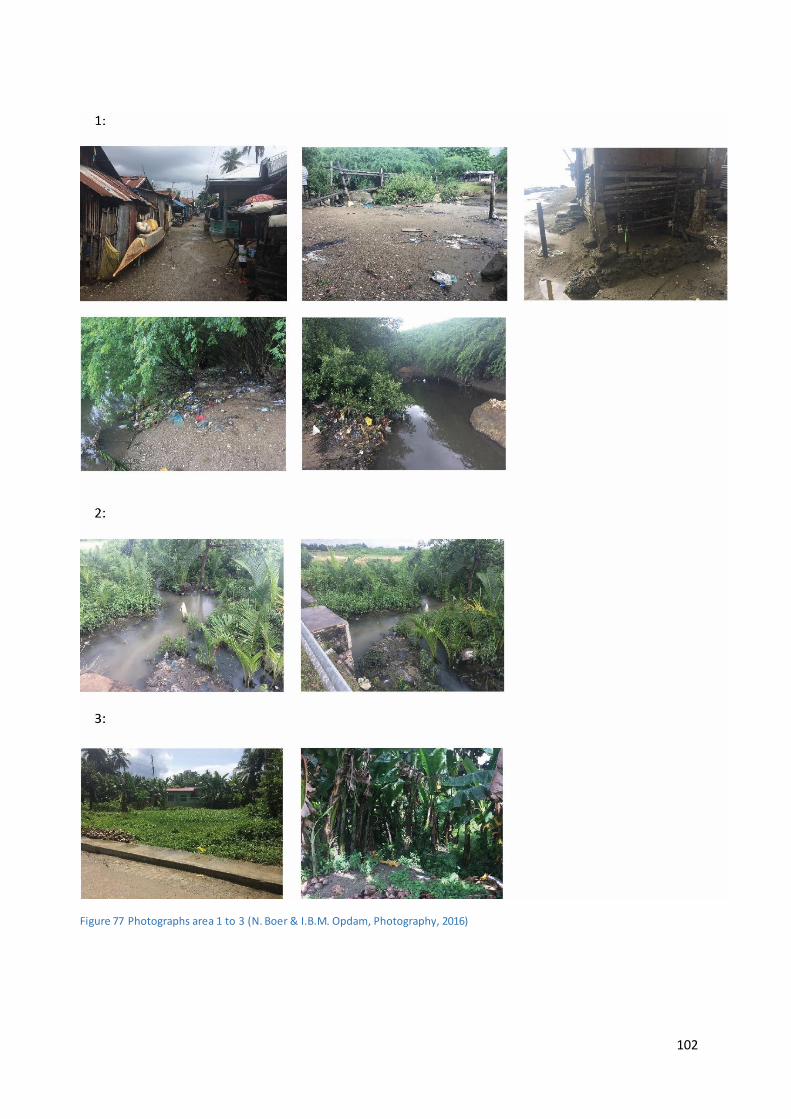
102
Figure 77 Photographs area 1 to 3 (N. Boer & I.B.M. Opdam, Photography, 2016)
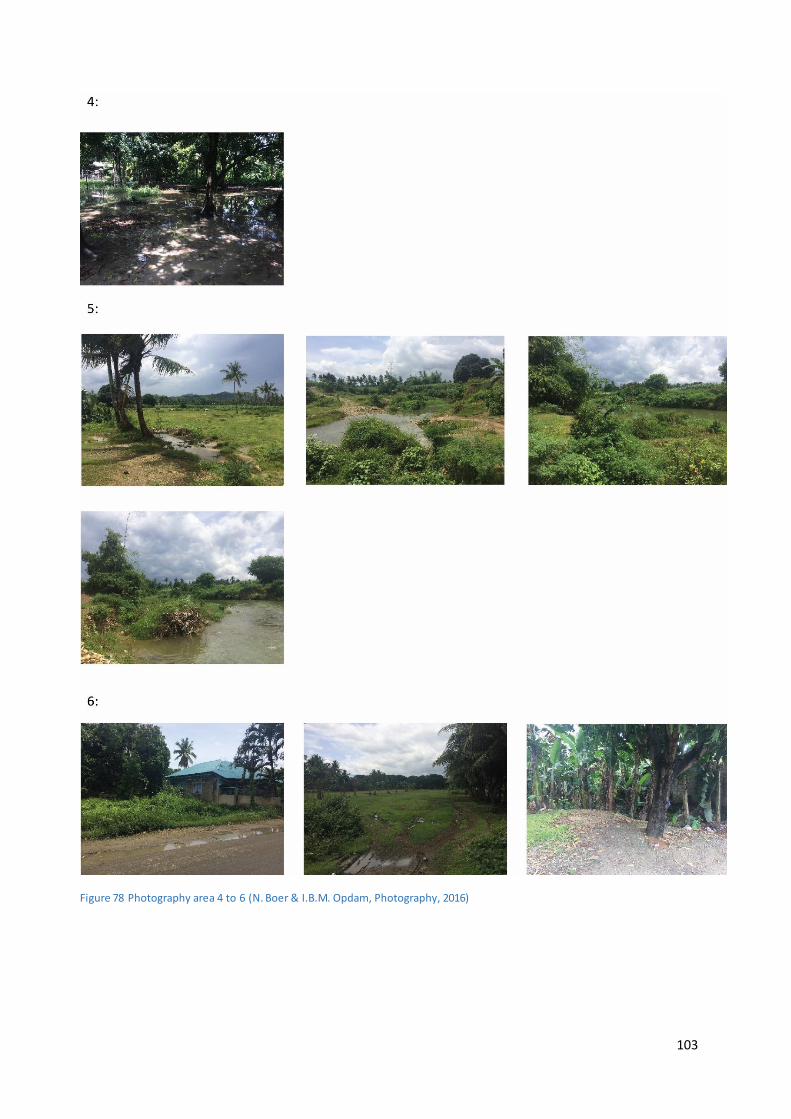
103
Figure 78 Photography area 4 to 6 (N. Boer & I.B.M. Opdam, Photography, 2016)
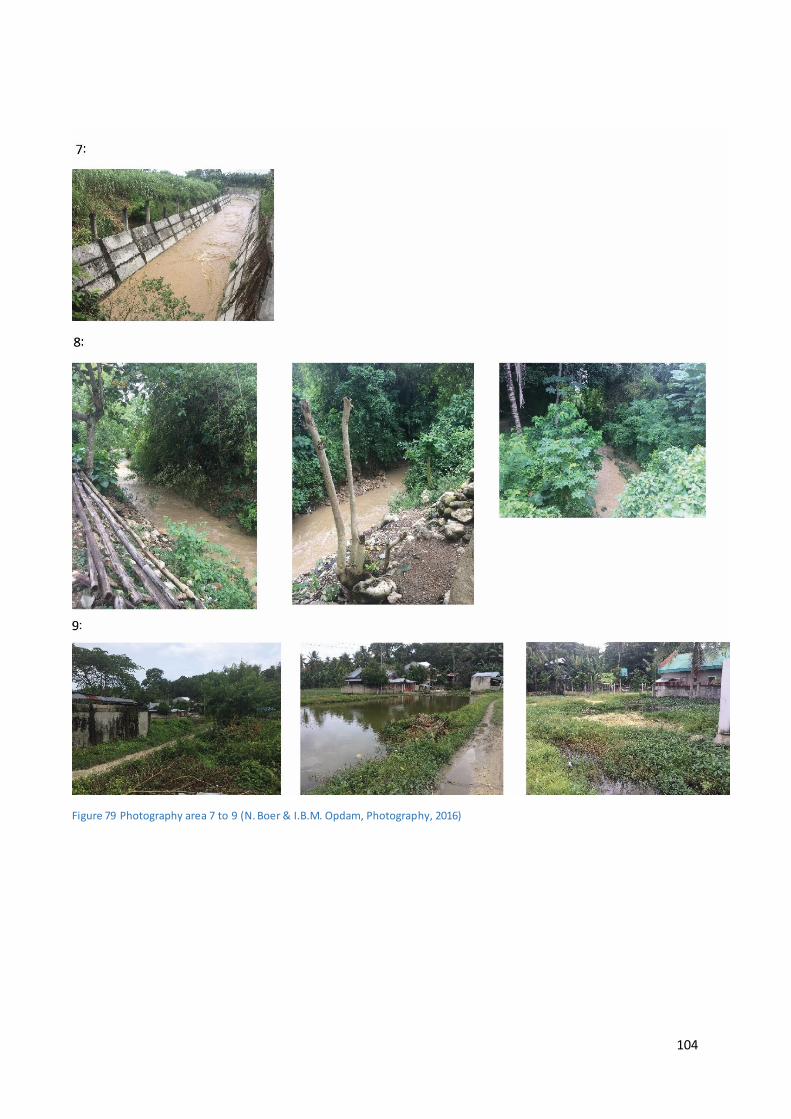
104
Figure 79 Photography area 7 to 9 (N. Boer & I.B.M. Opdam, Photography, 2016)
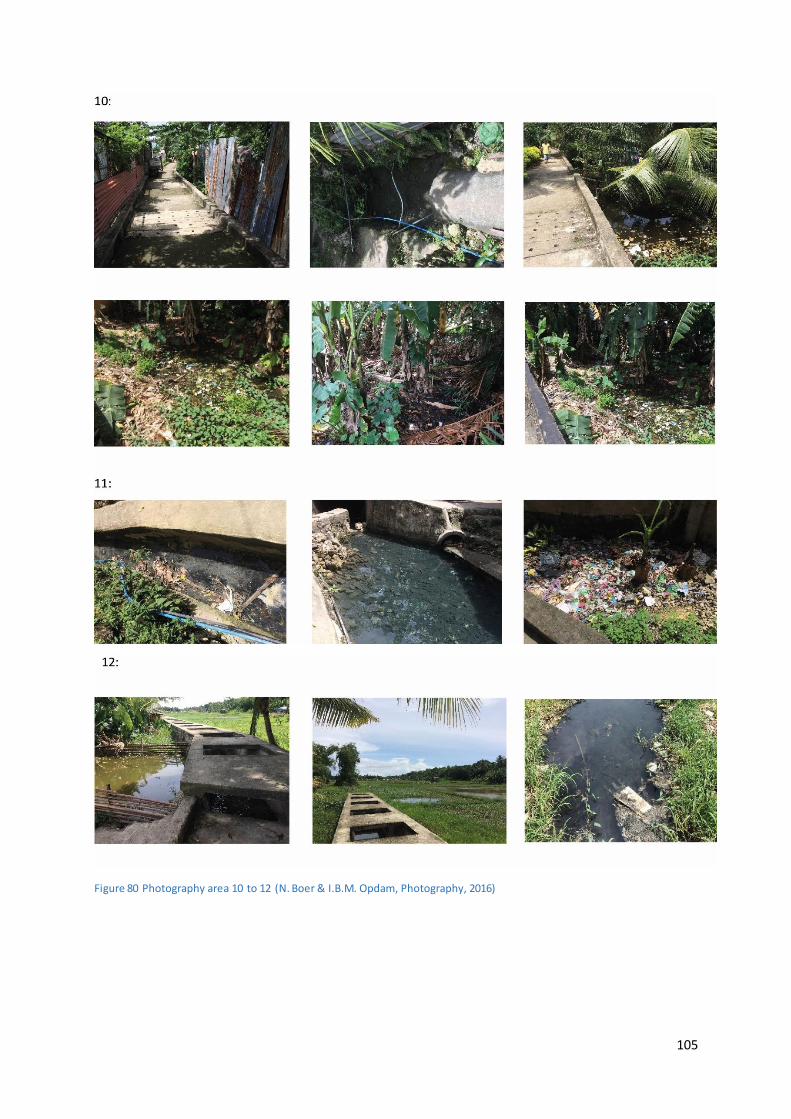
105
Figure 80 Photography area 10 to 12 (N. Boer & I.B.M. Opdam, Photography, 2016)
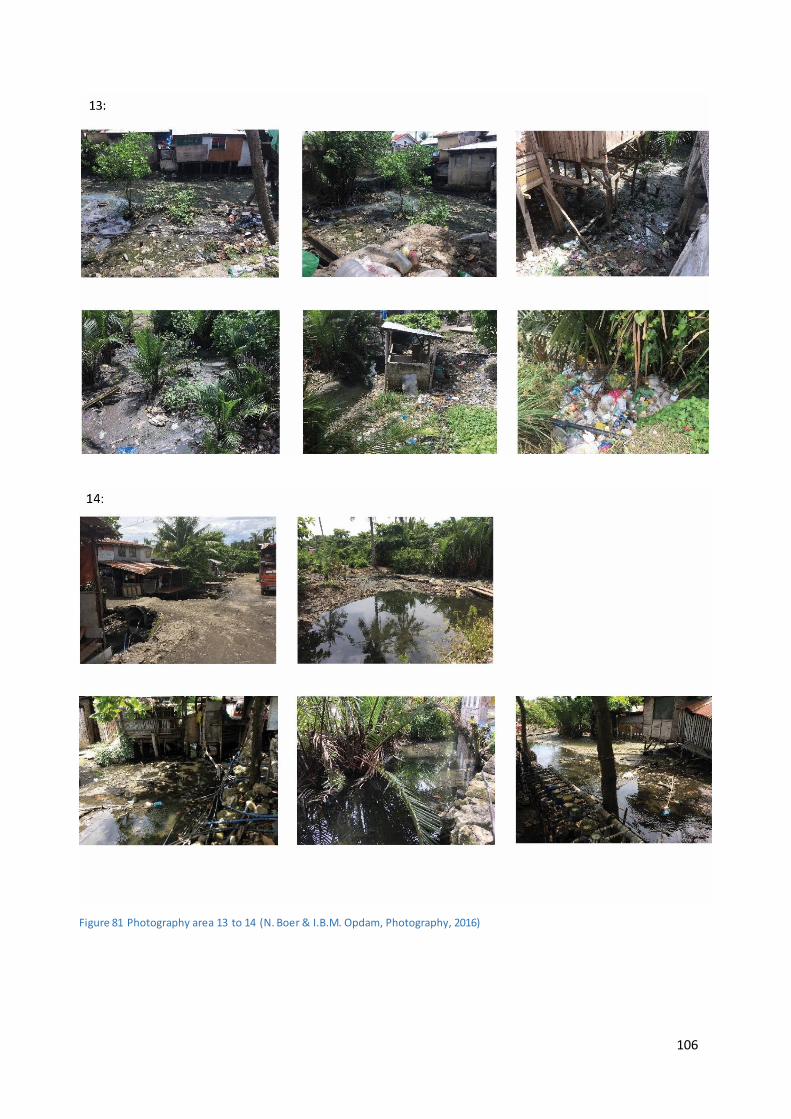
106
Figure 81 Photography area 13 to 14 (N. Boer & I.B.M. Opdam, Photography, 2016)
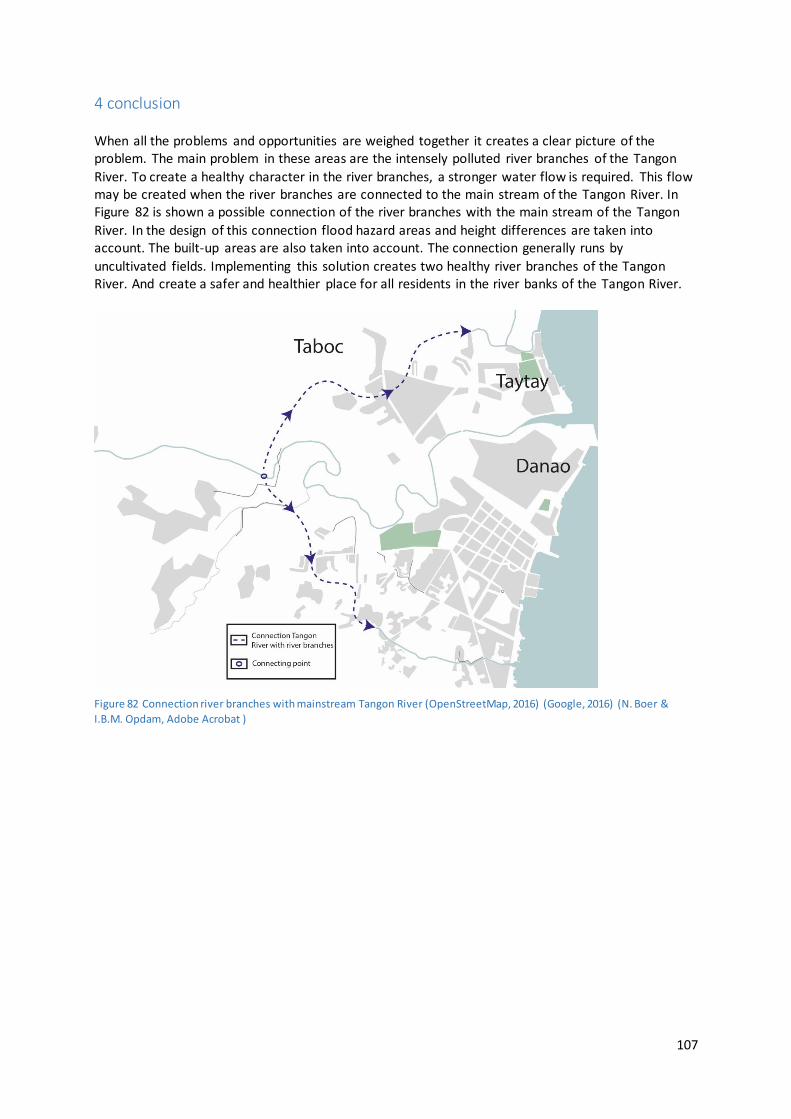
107
4 conclusion When all the problems and opportunities are weighed together it creates a clear picture of the problem. The main problem in these areas are the intensely polluted river branches of the Tangon
River. To create a healthy character in the river branches, a stronger water flow is required. This flow may be created when the river branches are connected to the main stream of the Tangon River. In Figure 82 is shown a possible connection of the river branches with the main stream of the Tangon
River. In the design of this connection flood hazard areas and height differences are taken into account. The built-up areas are also taken into account. The connection generally runs by
uncultivated fields. Implementing this solution creates two healthy river branches of the Tangon River. And create a safer and healthier place for all residents in the river banks of the Tangon River.
Figure 82 Connection river branches with mainstream Tangon River (OpenStreetMap, 2016) (Google, 2016) (N. Boer &
I.B.M. Opdam, Adobe Acrobat )

108
Bibliography Alterra, University of Wageningen. (2005). De doorlatendheid van de bodem voor
infiltratiedoeleinden. Retrieved from Library.wur: http://library.wur.nl/WebQuery/wurpubs/fulltext/29252
Cebu Daily News. (2013, July 17). Flood sweep Danao City Brgys, displace 30 families. Cebu Daily News. Retrieved from newsinfo.inquire.net/446629/floods-danao-brgys-displace-30-families
Department of Environment & Natural Resources. (2014). The Philippine Clean Water Act.
Department of Environment & Natural Resources, Environment Management Bureau Region 7, Cebu City. Retrieved 9 2, 2016, from http://119.92.161.2/embgovph/r07/WQMA.aspx
Esri. (2016). ArcGIS. Retrieved from GIS online map making: https://www.arcgis.com/home/webmap/viewer.html
Expert Program Management. (2014, December 4). The Confrontation Matrix. Retrieved from Expert
Program Management: http://www.expertprogrammanagement.com/2011/08/the-confrontation-matrix/
Geoscience Technologies Inc. (2013, March 24). Soil Mechanics. Retrieved from Copy of Soil:
https://prezi.com/dtksnk51dajl/copy-of-soil/ geoview. (2016, 9 2). geoview. Retrieved from geoview:
http://ph.geoview.info/kinalumsan_river,1708717 Google. (2016). Google Earth. Retrieved from Google Maps: https://www.google.com/maps greedypeg. (2015, June 15). Greedypeg. Retrieved from Greedypeg:
http://greedypeg.org/cebu/Guadalupe-River.html inquirernews. (2011). 18 firms to clean up Butuanon River. inquirernews, Mandaue city, Cebu, Cebu,
Philippines. Kitakyushu Initiative Network Cities. (n.d.). River Improvement Project in Cebu City . Retrieved from
http://kitakyushu.iges.or.jp/docs/demo/cebu_philippines/report.pdf
Lao, E. (2016, September 6). City Counselor of Danao. (I. I. Opdam, & N. N. Boer, Interviewers) Lao, E. (2016, September 6). City Counselor of Danao. (I. Opdam, & N. Boer, Interviewers) MindTools. (2015, December 31). SWOT analysis. Retrieved from MindTools:
https://www.mindtools.com/pages/article/newTMC_05.htm N. Boer, N., & I.B.M. Opdam, I. (2016, October 20). Field research. Surroundings Danao City, Cebu,
Philippines. N. Boer, N., & I.B.M. Opdam, I. (2016). Photography. Photographs. Presidential Commision for the
Urban Poor, Cebu.
N. Boer, N., & I.B.M. Opdam, I. (n.d.). Adobe Acrobat . Adobe InDesign & Illustrator. Presidential Commission for the Urban Poor, Cebu City.
Nationwide Operational Assessment of Hazards. (2016). Flood Hazard Danao. Danao, Cebu,
Philippines. Retrieved from http://noah.dost.gov.ph/#/section/geoserver/flood100 newsinfo. (2010). newsinfo.inquirer. Retrieved from
http://newsinfo.inquirer.net/breakingnews/nation/view/20100925-294232/Sewerage-system-for-Met
OpenStreetMap. (2016). OpenStreetMap. Retrieved from OpenStreetMap:
https://www.openstreetmap.org/ Philstar. (2013). Philstar. Retrieved from http://www.philstar.com:8080/cebu-
news/2013/07/17/980341/heavy-rains-not-waterspout-hit-danao
Sunstar. (2015, June 04). Butuanon ‘worst river in the Philippines'. Sunstar, p. 1. Retrieved from http://www.sunstar.com.ph/cebu/local-news/2015/06/04/butuanon-worst-river-phils-
411231

109
Appendix III Stakeholder analysis
Niels Boer Ide Benjamin Maria Opdam
Presidential Commission for the Urban Poor Rotterdam University of Applied Science
Supervisors: Mr. T.H. Heikoop, Mrs. C.T. Manlosa - Osano The Philippines, Cebu City, October 26th 2016
110
Introduction In this chapter the stakeholders within the research are discussed. The third sub question is: “Which stakeholders to take in account looking for possible measures?”. In this chapter stakeholders are interviewed and are asked if they have any advice for the development of the design. First the
selection of stakeholders is discussed in chapter 1. The interest vs influence is shown and explained in chapter 2. In chapter 3 the interviews are shown with their documentation.
Content Appendix III Stakeholder analysis ................................................................................................ 109
Introduction ........................................................................................................................... 110
1 Stakeholder selection........................................................................................................... 111
2 Interest vs influence............................................................................................................. 111
3 Interviews ........................................................................................................................... 114
Presidential Commission for the Urban Poor ........................................................................ 114
Municipality of Danao ......................................................................................................... 115
Residents riverbank ............................................................................................................ 116
City Engineering and Public Works ....................................................................................... 117
Danao Waterworks ............................................................................................................. 118
Disaster and Risk Management Office .................................................................................. 119
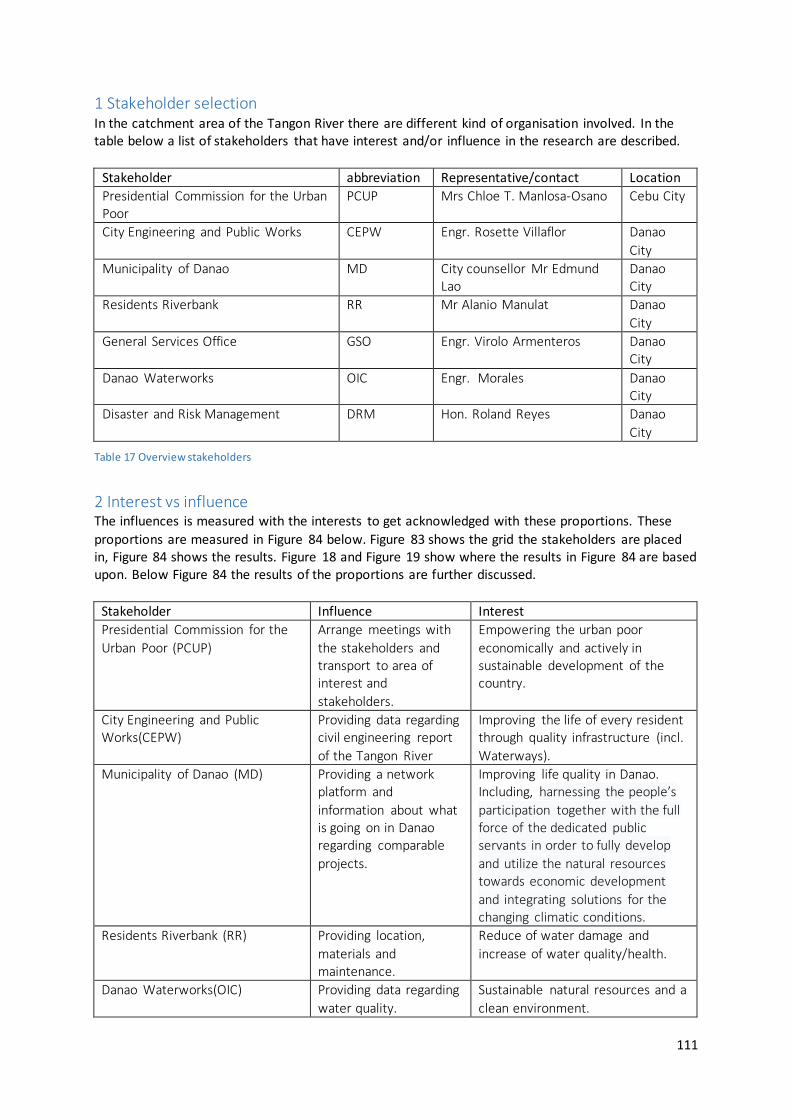
111
1 Stakeholder selection In the catchment area of the Tangon River there are different kind of organisation involved. In the table below a list of stakeholders that have interest and/or influence in the research are described.
Stakeholder abbreviation Representative/contact Location
Presidential Commission for the Urban Poor
PCUP Mrs Chloe T. Manlosa-Osano Cebu City
City Engineering and Public Works CEPW Engr. Rosette Villaflor Danao
City
Municipality of Danao MD City counsellor Mr Edmund Lao
Danao City
Residents Riverbank RR Mr Alanio Manulat Danao
City
General Services Office GSO Engr. Virolo Armenteros Danao City
Danao Waterworks OIC Engr. Morales Danao City
Disaster and Risk Management DRM Hon. Roland Reyes Danao
City
Table 17 Overview stakeholders
2 Interest vs influence The influences is measured with the interests to get acknowledged with these proportions. These
proportions are measured in Figure 84 below. Figure 83 shows the grid the stakeholders are placed in, Figure 84 shows the results. Figure 18 and Figure 19 show where the results in Figure 84 are based upon. Below Figure 84 the results of the proportions are further discussed.
Stakeholder Influence Interest
Presidential Commission for the
Urban Poor (PCUP)
Arrange meetings with
the stakeholders and transport to area of interest and
stakeholders.
Empowering the urban poor
economically and actively in sustainable development of the country.
City Engineering and Public Works(CEPW)
Providing data regarding civil engineering report
of the Tangon River
Improving the life of every resident through quality infrastructure (incl.
Waterways).
Municipality of Danao (MD) Providing a network platform and
information about what is going on in Danao regarding comparable
projects.
Improving life quality in Danao. Including, harnessing the people’s
participation together with the full force of the dedicated public servants in order to fully develop
and utilize the natural resources towards economic development
and integrating solutions for the changing climatic conditions.
Residents Riverbank (RR) Providing location,
materials and maintenance.
Reduce of water damage and
increase of water quality/health.
Danao Waterworks(OIC) Providing data regarding
water quality.
Sustainable natural resources and a
clean environment.
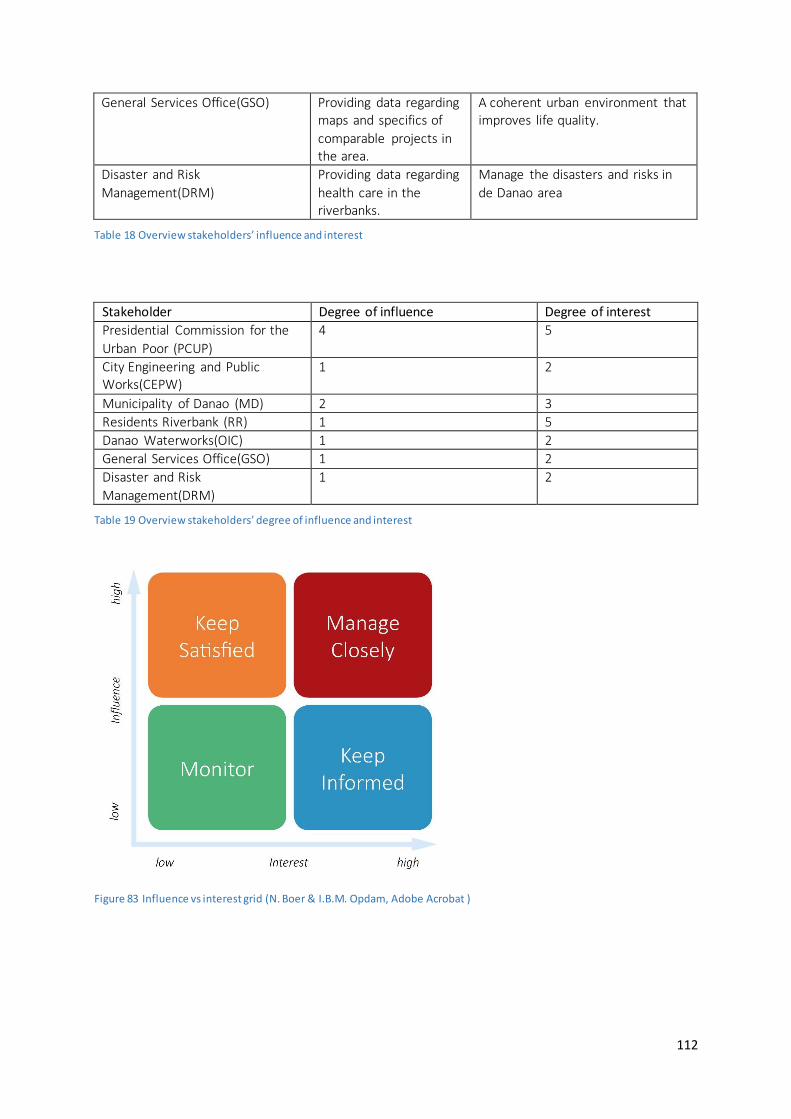
112
General Services Office(GSO) Providing data regarding maps and specifics of
comparable projects in the area.
A coherent urban environment that improves life quality.
Disaster and Risk
Management(DRM)
Providing data regarding
health care in the riverbanks.
Manage the disasters and risks in
de Danao area
Table 18 Overview stakeholders’ influence and interest
Stakeholder Degree of influence Degree of interest
Presidential Commission for the
Urban Poor (PCUP)
4 5
City Engineering and Public Works(CEPW)
1 2
Municipality of Danao (MD) 2 3
Residents Riverbank (RR) 1 5
Danao Waterworks(OIC) 1 2
General Services Office(GSO) 1 2
Disaster and Risk
Management(DRM)
1 2
Table 19 Overview stakeholders’ degree of influence and interest
Figure 83 Influence vs interest grid (N. Boer & I.B.M. Opdam, Adobe Acrobat )
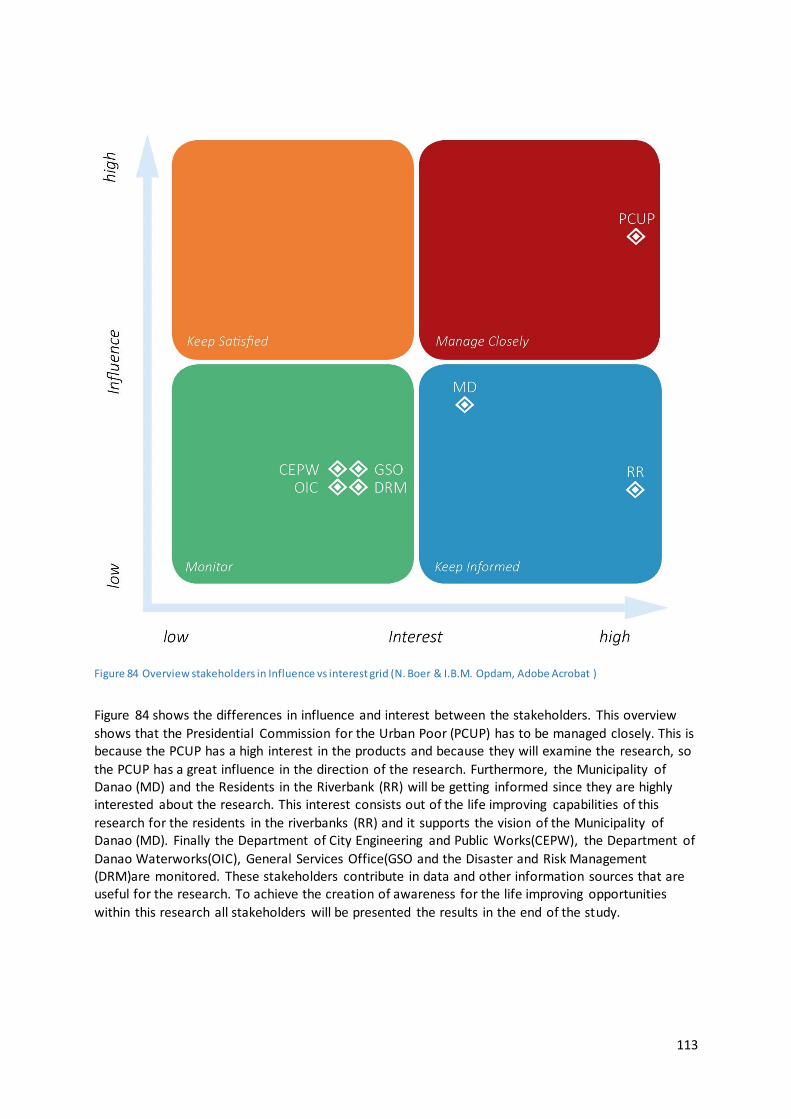
113
Figure 84 Overview stakeholders in Influence vs interest grid (N. Boer & I.B.M. Opdam, Adobe Acrobat )
Figure 84 shows the differences in influence and interest between the stakeholders. This overview
shows that the Presidential Commission for the Urban Poor (PCUP) has to be managed closely. This is because the PCUP has a high interest in the products and because they will examine the research, so
the PCUP has a great influence in the direction of the research. Furthermore, the Municipality of Danao (MD) and the Residents in the Riverbank (RR) will be getting informed since they are highly interested about the research. This interest consists out of the life improving capabilities of this
research for the residents in the riverbanks (RR) and it supports the vision of the Municipality of Danao (MD). Finally the Department of City Engineering and Public Works(CEPW), the Department of
Danao Waterworks(OIC), General Services Office(GSO and the Disaster and Risk Management (DRM)are monitored. These stakeholders contribute in data and other information sources that are useful for the research. To achieve the creation of awareness for the life improving opportunities
within this research all stakeholders will be presented the results in the end of the study.
114
3 Interviews Knowing the points of views of the stakeholders, they can be involved in the research. In the interviews underneath the research is explained to the stakeholders. Furthermore, data, network, ideas and methods that can contribute to the research are discussed during these interviews. In the
paragraphs below each´s stakeholders interview is discussed and conclusions are formed for each piece of information. For each interview the grid of the interview is shown and the conclusion, documentation of the interview.
Presidential Commission for the Urban Poor
Background information At first the stakeholder is asked questions about what their functions is as a company/resident and what they do. Other background information is also collected as example, history of research the company have executed, who are partners during a research/project or more specific questions. Explanation After the stakeholder’s background the research will be explained to them, what it is about and for who. Furthermore, ideas and methods will be discussed and written down if there are any remarks. (The created maps will be shown and explained) Questions Presidential Commission for the Urban Poor
What are the experiences with the Tangon River? Who is appointed to Danao from the PCUP? Who can be approached within Danao? What can the PCUP contribute in the research?
What products are expected to be delivered? The date of the final presentation?
Tips
At last the stakeholder is asked if they have any tips or options we should consider. Also if they have certain types of data or photos which can be used for the research.
Documentation of the interview with Mrs Chloe Manlosa-Osano, October 26 2016.
In our research regarding selecting a river the Tangon River came out as most promising. Submitting this with Chloe Manlosa-Osano she agrees that the focus of the research will go the Tangon River and
its area. She tells that Mrs Eppie Alcoseba is appointed to Danao from the PCUP. Furthermore, that we can contact her about any network/contacts in Danao. The PCUP will help with the use of vehicles for field research and the office can be used contributing in your research. The products she expects
are the research report and a final presentation with the stakeholders.
115
Municipality of Danao
Background information At first the stakeholder is asked questions about what their functions is as a company/resident and what they do. Other background information is also collected as example, history of research the company have executed, who are partners during a research/project or more specific questions. Explanation After the stakeholder’s background the research will be explained to them, what it is about and for who. Furthermore, ideas and methods will be discussed and written down if there are any remarks. (The created maps will be shown and explained) Related projects Now the research is explained to stakeholder, the question is asked if they have any experience with similar projects they have executed/experienced. This will be information like concerning methods or ideas. Questions Government Agency
How big are the families living in the houses in the riverbanks of the side arm, how many people? Are there any records of diseases that came from the river?
Have there ever been done any projects regarding the increased of water storage? Have there ever been done any projects regarding the improvement of the water quality? Have there ever been done any projects regarding the reduce of storm water runoff? What do you think about the sketch of the problems? Do you agree?
Looking at this possible solution, do you think we would encounter any obstacles if we would want to implement this design?
If you could add something to this possible design, what would it be? Do you have further tips and/or data that could be used during our final designing period?
Tips At last the stakeholder is asked if they have any tips or options we should consider. Also if they have
certain types of data or photos which can be used for the research.
Documentation of the interview with City counsellor Mr Edmund Lao, 20 October 2016.
Mr Edmund Lao is a city counsellor who has a lot of contacts and information in/about Danao. During the explanation of the research in the area he got really enthusiastic about the idea.
He said he never heard that the Tangon River had secluded river branches, and he says from the
looks of it the idea you have it looks great. What Mr Edmund Lao is trying to accomplish is create more awareness for important problems is Danao. This is one of those problems he says. Furthermore, he told us that there are not a lot of maps from Danao available so your contribution of
maps will be much appreciated. When asked about the local residents living in the river branches he tells that they are
struggling with the relocation of them because there is not enough budget. According to the law, resident may not live in the 3 metre zone near the river, they want to change this to 6 metre. Mr Edmund Lao tells that they first have to look at how to relocate them else it is not possible to
maintain this law. When asked for any data regarding the residents and river system he redirects us to multiple
organisations that can help providing the data that is needed. City health department, regarding data
about diseases. Department of Environment, regarding data about vegetation. Department of Planning, regarding data for maps and urban areas.
116
Residents riverbank
Background information At first the stakeholder is asked questions about what their functions is as a company/resident and what they do. Other background information is also collected as example, history of research the company have executed, who are partners during a research/project or more specific questions. Explanation After the stakeholder’s background the research will be explained to them, what it is about and for who. Furthermore, ideas and methods will be discussed and written down if there are any remarks. (The created maps will be shown and explained) Related projects Now the research is explained to stakeholder, the question is asked if they have any experience with similar projects they have executed/experienced. This will be information like concerning methods or ideas. Questions local residents
How do you experience living next to this river in the river banks? What is your opinion about our solution?
Do you experience disturbance of the river? In case of pollution, flooding’s, or stench? In which extent are you contributing of a cleaner and sustainable Tangon River? What kind of solution do you think is necessary, whit what results?
Tips At last the stakeholder is asked if they have any tips or options we should consider. Also if they have
certain types of data or photos which can be used for the research.
Documentation of the interview with house owner within the riverbanks Mr Alanio Manulat, 20 October 2016.
Mr Alanio Manulat, 38 years old is a local resident living within the riverbanks of the secluded river branches of the Tangon River. Furthermore, he is a family man who has to take care of his children and has a job in the Danao City.
During the explanation of the research in the area he got really enthusiastic about the idea. He told that the government keeps telling the residents in the area that there is a plan to resolve the
pollution issue. When there is asked when he last heard from the government about this plan he says, three years ago. Mr Manulat explains that it is no pleasure living next to these polluted river branches, but is
it necessary. The reason it is necessary he says is because he has a job in Danao City and the land in the city is too expensive, that is why his family lives in the riverbanks because they do not have to pay any rent.
The kind of disturbance he experiences varies between stench, flooding’s and diseases. He also tells that there is the most disturbance when there are flooding’s, during heavy rainfall and high
tide. Furthermore, he tells that when there are floods, it spreads all of the pollution through the area even in their houses. As of right now Mr Manulat tells us that the majority of local residents in the river banks
throw their waste into the river. He also says that if he tries to collect it and put it in a garbage container the government will not collect it 8 times out of 10. When the government does not collect, the waste still ends up in the river he says.
When asked for a solution, Mr Manulat says the government has to take action and clean up the river branches.
117
City Engineering and Public Works
Background information At first the stakeholder is asked questions about what their functions is as a company/resident and what they do. Other background information is also collected as example, history of research the company have executed, who are partners during a research/project or more specific questions. Explanation After the stakeholder’s background the research will be explained to them, what it is about and for who. Furthermore, ideas and methods will be discussed and written down if there are any remarks. (The created maps will be shown and explained) Related projects Now the research is explained to stakeholder, the question is asked if they have any experience with similar projects they have executed/experienced. This will be information like concerning methods or ideas. This is our idea and we would like your input to create the best possible design that will involve your expertise. This way we want to drag in your possible wishes. Questions local residents
Could you please tell us in a small summary what is it theCity Engineering and Public Works is and what its main goal is?
What do you think about our idea, do you maybe have any suggestions we should consider with the design?
Do you maybe have data regarding the Tangon River’s environment that could benefit this research?
Documentation of the interview with Engr. Rosette Villaflor, October 26 2016.
Engr. Rosette Villaflor has experience in the technical conditions of the Tangon River. Engr. Rosette
Villaflor indicates to find the research and design very interesting and sees many possibilities. Like they actively think about the technical structure and the budget that brings the design along with it.
She also points to the fact that a spring is stationed in the area where one should be placed any connection. The leaking water from this spring provides the small amount of water in the river branches. Incidentally, this spring the design of the connections between the Tangon River with the
river will not interfere with classes. In addition, was raised whether there is thought about the capture of all the floating trash in the river branches. Must be prevented in creating flow in the river branches very much floating debris is
pushed into the sea. Even designing construction in the river branches should ensure the capture of the floating waste and prevent pollution of the coast and sea.
118
Danao Waterworks
Background information At first the stakeholder is asked questions about what their functions is as a company/resident and what they do. Other background information is also collected as example, history of research the company have executed, who are partners during a research/project or more specific questions. Explanation After the stakeholder’s background the research will be explained to them, what it is about and for who. Furthermore, ideas and methods will be discussed and written down if there are any remarks. (The created maps will be shown and explained) Related projects Now the research is explained to stakeholder, the question is asked if they have any experience with similar projects they have executed/experienced. This will be information like concerning methods or ideas. This is our idea and we would like your input to create the best possible design that will involve your expertise. This way we want to drag in your possible wishes. Questions City Planning and Development Office
Could you please tell us in a small summary what is it the City Planning and Development Office is and what its main goal is?
What do you think about our idea, do you maybe have any suggestions we should consider with the design?
Do you maybe have data regarding the Tangon River’s area that could benefit this research?
Documentation of the interview with Engr. Morales, October 26 2016.
Engr. Morales is engineer by profession and active in the organization of water management. Engr. Morales thinks the study is a major contribution to the improvement of the water system in Danao.
Engr. Morales has been closely involved in the construction of a large dam on the River Tangon. This project is still in the planning phase but should be carried out in due. Engr. Morales wondered
whether the regulation of water in the river upstream is a problem for the interception of a small portion of the flow of the Tangon River. Expected this should not be a problem. Engr. Morales is also wondered whether the water in the connections to create freely into the river
branches is headed, or that this pumps are needed. Probably the budget will not be adequate to build sophisticated installations. There is therefore need to be as inexpensive as possible the design and keep it as natural as possible and self-sufficient.
In addition, there must be a good look at the maintenance, also in this case it should be looked closely at the budget.
119
Disaster and Risk Management Office
Background information At first the stakeholder is asked questions about what their functions is as a company/resident and what they do. Other background information is also collected as example, history of research the company have executed, who are partners during a research/project or more specific questions. Explanation After the stakeholder’s background the research will be explained to them, what it is about and for who. Furthermore, ideas and methods will be discussed and written down if there are any remarks. (The created maps will be shown and explained) Related projects Now the research is explained to stakeholder, the question is asked if they have any experience with similar projects they have executed/experienced. This will be information like concerning methods or ideas. This is our idea and we would like your input to create the best possible design that will involve your expertise. This way we want to drag in your possible wishes. Questions City Health Office
Are the diseases in the area around these secluded river arms as bad as the local residents have told us?
Do you have any numbers or data regarding these areas? Or maybe an indication? What do you think about our idea for reducing the diseases in these area, do you maybe have any
suggestions we should consider with the design?
Documentation of the interview with Hon. Roland Reyes, October 26 2016.
Hon. Roland Reyes was very enthusiastic about the research and the possible solutions. Hon. Roland Reyes sees the study as a great addition to ongoing projects or projects that may be initiated in the
future. In addition, Hon. Roland Reyes thinks the final design can be a solution for a number of critical issues that entails the Tangon River with them. In particular, the amount of flooding that occurred af ter
heavy rainfall is a major problem. By creating using additional waterways and connections with the Tangon River flooding would be dramatically reduced in this area. Hon. Roland Reyes also said that in the past there have been indeed problems of pollution and the
spread of diseases. There is 5 years ago (2011) have been a major diarrhea outbreak due to the poor water quality in the river branches of the River Tangon
Hon. Roland Reyes thinks that it is of great importance for the safety of the people around the Tangon River and the river branches that must be resolved as soon as possible.
120
Appendix IV Design report
Niels Boer
Ide Benjamin Maria Opdam
Presidential Commission for the Urban Poor Rotterdam University of Applied Science Supervisors: Mr. T.H. Heikoop, Mrs. C.T. Manlosa - Osano
The Philippines, Cebu City, November 11th 2016
121
Introduction In this report a design is made based on the hard and soft requirements which are arranged by the
desires of the stakeholders. This chapter will answer the sub question: ”What design contributes in
reducing storm water runoff, increasing water storage and improving of the river’s water quality?”
This design should provide a solution to the various problems that have been found in the catchment
area of the Tangon River. In particular, the part of the river which flows through densely populated
parts of Danao City. In these areas, there are great risks from flooding’s and pollution in the river.
This report shows several visualizations that show the connection between the main stream and the
river branches of the Tangon River. Also, there will be explained in greater detail by technical
visualizations how there is a constant flow is drained. Finally, a conclusion containing a
comprehensive picture of all the contributions that this solution brings with it is given.
Table of content
Appendix IV Design report .......................................................................................................... 120
Introduction ........................................................................................................................... 121
Program of requirements........................................................................................................ 122
Mind Map .............................................................................................................................. 123
Water system ......................................................................................................................... 124
1 Overview water system .................................................................................................... 124
2 Water Balance South river branch..................................................................................... 126
3 Elaboration Water Balance South river branch................................................................... 135
4 Water Balance North river branch..................................................................................... 140
5 Elaboration Water Balance North river branch................................................................... 149
Impressions Design................................................................................................................. 153
Material/costs ........................................................................................................................ 155
SWOT – Analysis ..................................................................................................................... 157
Result & discussion Confrontation Matrix ............................................................................ 161
Conclusion ............................................................................................................................. 162
Bibliography ........................................................................................................................... 162
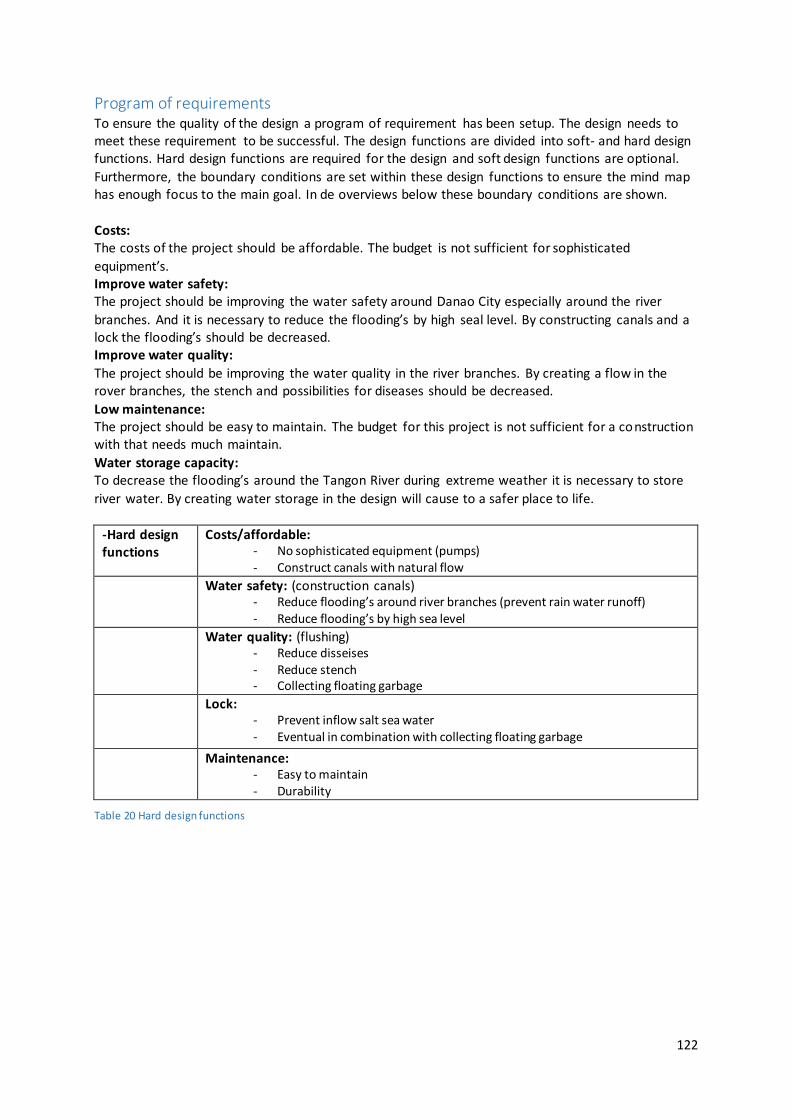
122
Program of requirements To ensure the quality of the design a program of requirement has been setup. The design needs to meet these requirement to be successful. The design functions are divided into soft- and hard design functions. Hard design functions are required for the design and soft design functions are optional.
Furthermore, the boundary conditions are set within these design functions to ensure the mind map has enough focus to the main goal. In de overviews below these boundary conditions are shown.
Costs: The costs of the project should be affordable. The budget is not sufficient for sophisticated
equipment’s. Improve water safety: The project should be improving the water safety around Danao City especially around the river
branches. And it is necessary to reduce the flooding’s by high seal level. By constructing canals and a lock the flooding’s should be decreased. Improve water quality:
The project should be improving the water quality in the river branches. By creating a flow in the rover branches, the stench and possibilities for diseases should be decreased.
Low maintenance: The project should be easy to maintain. The budget for this project is not sufficient for a construction with that needs much maintain.
Water storage capacity: To decrease the flooding’s around the Tangon River during extreme weather it is necessary to store
river water. By creating water storage in the design will cause to a safer place to life.
-Hard design functions
Costs/affordable: - No sophisticated equipment (pumps) - Construct canals with natural flow
Water safety: (construction canals) - Reduce flooding’s around river branches (prevent rain water runoff) - Reduce flooding’s by high sea level
Water quality: (flushing) - Reduce disseises - Reduce stench - Collecting floating garbage
Lock: - Prevent inflow salt sea water - Eventual in combination with collecting floating garbage
Maintenance: - Easy to maintain - Durability
Table 20 Hard design functions
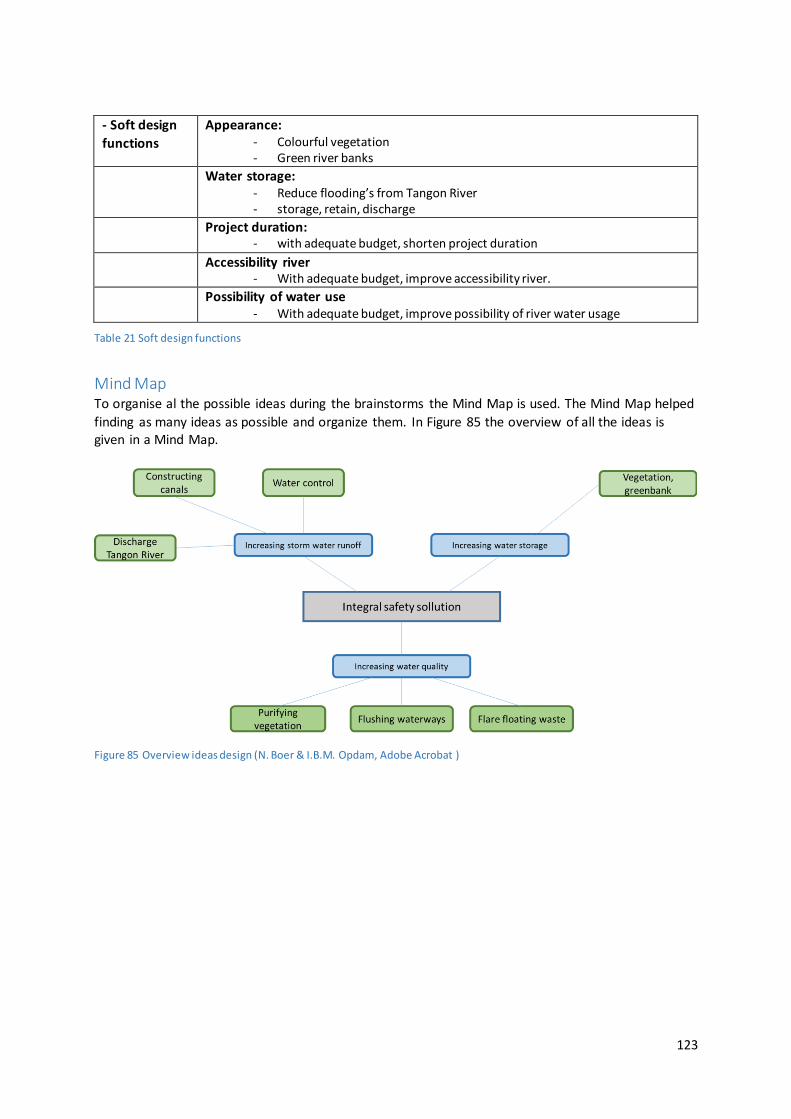
123
- Soft design
functions
Appearance: - Colourful vegetation - Green river banks
Water storage: - Reduce flooding’s from Tangon River - storage, retain, discharge
Project duration: - with adequate budget, shorten project duration
Accessibility river - With adequate budget, improve accessibility river.
Possibility of water use - With adequate budget, improve possibility of river water usage
Table 21 Soft design functions
Mind Map To organise al the possible ideas during the brainstorms the Mind Map is used. The Mind Map helped
finding as many ideas as possible and organize them. In Figure 85 the overview of all the ideas is given in a Mind Map.
Figure 85 Overview ideas design (N. Boer & I.B.M. Opdam, Adobe Acrobat )
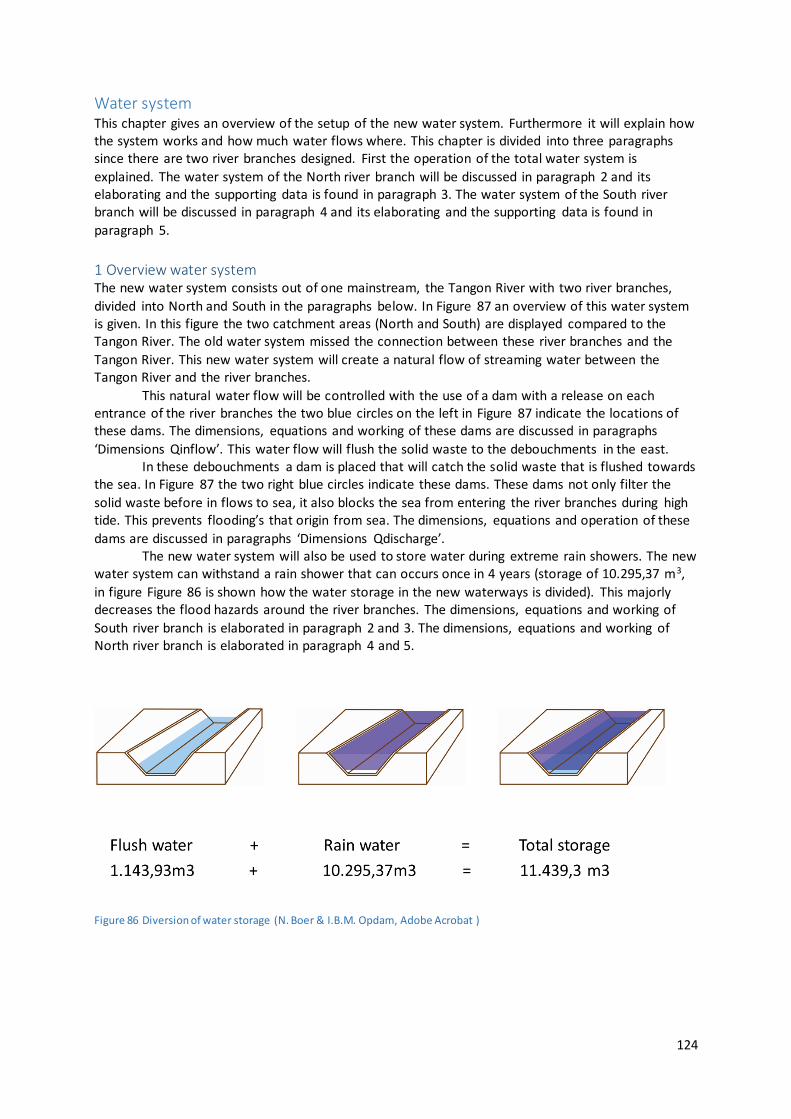
124
Water system This chapter gives an overview of the setup of the new water system. Furthermore it will explain how the system works and how much water flows where. This chapter is divided into three paragraphs since there are two river branches designed. First the operation of the total water system is
explained. The water system of the North river branch will be discussed in paragraph 2 and its elaborating and the supporting data is found in paragraph 3. The water system of the South river branch will be discussed in paragraph 4 and its elaborating and the supporting data is found in
paragraph 5.
1 Overview water system The new water system consists out of one mainstream, the Tangon River with two river branches,
divided into North and South in the paragraphs below. In Figure 87 an overview of this water system is given. In this figure the two catchment areas (North and South) are displayed compared to the Tangon River. The old water system missed the connection between these river branches and the
Tangon River. This new water system will create a natural flow of streaming water between the Tangon River and the river branches.
This natural water flow will be controlled with the use of a dam with a release on each entrance of the river branches the two blue circles on the left in Figure 87 indicate the locations of these dams. The dimensions, equations and working of these dams are discussed in paragraphs
‘Dimensions Qinflow’. This water flow will flush the solid waste to the debouchments in the east. In these debouchments a dam is placed that will catch the solid waste that is flushed towards
the sea. In Figure 87 the two right blue circles indicate these dams. These dams not only filter the
solid waste before in flows to sea, it also blocks the sea from entering the river branches during high tide. This prevents flooding’s that origin from sea. The dimensions, equations and operation of these
dams are discussed in paragraphs ‘Dimensions Qdischarge’. The new water system will also be used to store water during extreme rain showers. The new
water system can withstand a rain shower that can occurs once in 4 years (storage of 10.295,37 m3,
in figure Figure 86 is shown how the water storage in the new waterways is divided). This majorly decreases the flood hazards around the river branches. The dimensions, equations and working of
South river branch is elaborated in paragraph 2 and 3. The dimensions, equations and working of North river branch is elaborated in paragraph 4 and 5.
Figure 86 Diversion of water storage (N. Boer & I.B.M. Opdam, Adobe Acrobat )
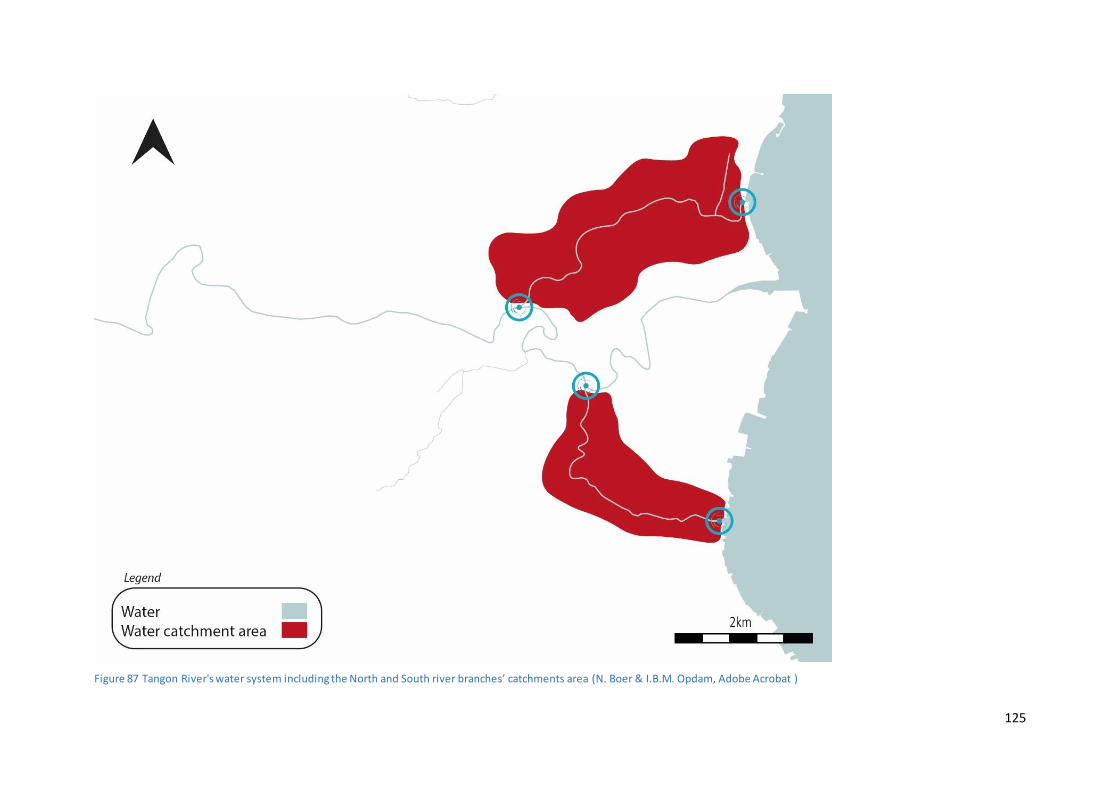
125
Figure 87 Tangon River's water system including the North and South river branches’ catchments area (N. Boer & I.B.M. Opdam, Adobe Acrobat )
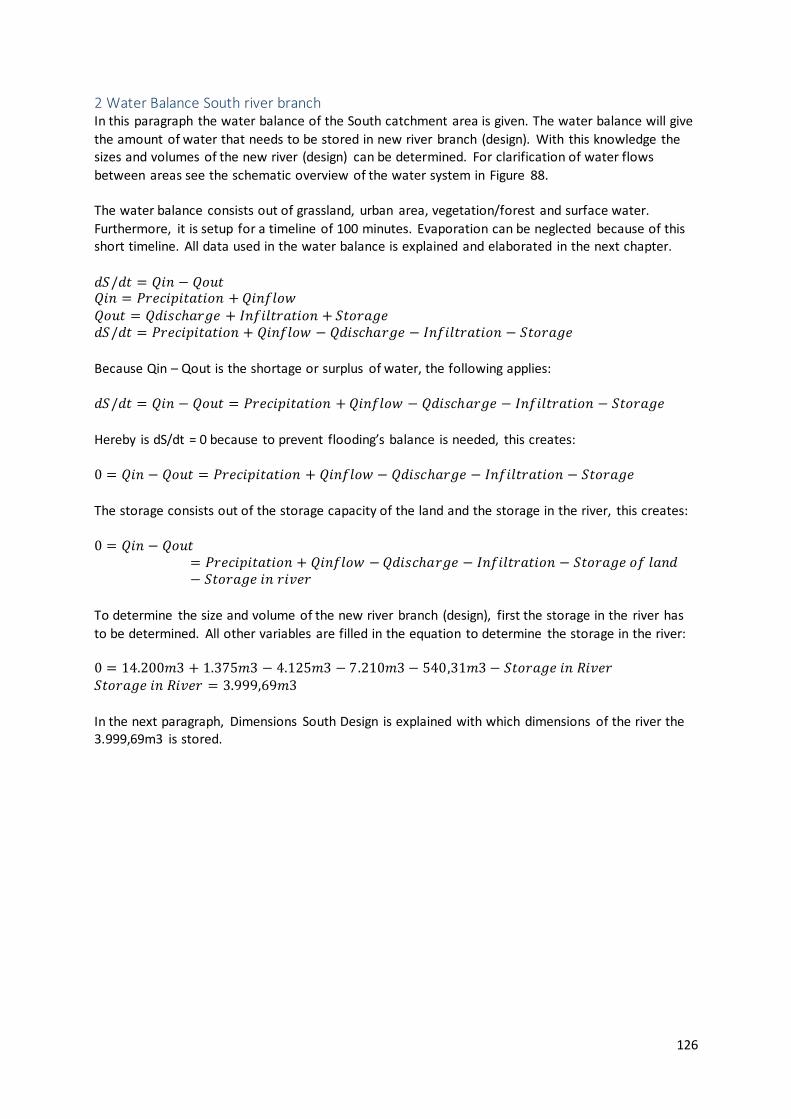
126
2 Water Balance South river branch In this paragraph the water balance of the South catchment area is given. The water balance will give
the amount of water that needs to be stored in new river branch (design). With this knowledge the sizes and volumes of the new river (design) can be determined. For clarification of water flows
between areas see the schematic overview of the water system in Figure 88. The water balance consists out of grassland, urban area, vegetation/forest and surface water.
Furthermore, it is setup for a timeline of 100 minutes. Evaporation can be neglected because of this short timeline. All data used in the water balance is explained and elaborated in the next chapter.
𝑑𝑆/𝑑𝑡 = 𝑄𝑖𝑛 − 𝑄𝑜𝑢𝑡 𝑄𝑖𝑛 = 𝑃𝑟𝑒𝑐𝑖𝑝𝑖𝑡𝑎𝑡𝑖𝑜𝑛 + 𝑄𝑖𝑛𝑓𝑙𝑜𝑤 𝑄𝑜𝑢𝑡 = 𝑄𝑑𝑖𝑠𝑐ℎ𝑎𝑟𝑔𝑒 + 𝐼𝑛𝑓𝑖𝑙𝑡𝑟𝑎𝑡𝑖𝑜𝑛 + 𝑆𝑡𝑜𝑟𝑎𝑔𝑒 𝑑𝑆/𝑑𝑡 = 𝑃𝑟𝑒𝑐𝑖𝑝𝑖𝑡𝑎𝑡𝑖𝑜𝑛 + 𝑄𝑖𝑛𝑓𝑙𝑜𝑤 − 𝑄𝑑𝑖𝑠𝑐ℎ𝑎𝑟𝑔𝑒 − 𝐼𝑛𝑓𝑖𝑙𝑡𝑟𝑎𝑡𝑖𝑜𝑛 − 𝑆𝑡𝑜𝑟𝑎𝑔𝑒
Because Qin – Qout is the shortage or surplus of water, the following applies:
𝑑𝑆/𝑑𝑡 = 𝑄𝑖𝑛 − 𝑄𝑜𝑢𝑡 = 𝑃𝑟𝑒𝑐𝑖𝑝𝑖𝑡𝑎𝑡𝑖𝑜𝑛 + 𝑄𝑖𝑛𝑓𝑙𝑜𝑤 − 𝑄𝑑𝑖𝑠𝑐ℎ𝑎𝑟𝑔𝑒 − 𝐼𝑛𝑓𝑖𝑙𝑡𝑟𝑎𝑡𝑖𝑜𝑛 − 𝑆𝑡𝑜𝑟𝑎𝑔𝑒
Hereby is dS/dt = 0 because to prevent flooding’s balance is needed, this creates: 0 = 𝑄𝑖𝑛 − 𝑄𝑜𝑢𝑡 = 𝑃𝑟𝑒𝑐𝑖𝑝𝑖𝑡𝑎𝑡𝑖𝑜𝑛 + 𝑄𝑖𝑛𝑓𝑙𝑜𝑤 − 𝑄𝑑𝑖𝑠𝑐ℎ𝑎𝑟𝑔𝑒 − 𝐼𝑛𝑓𝑖𝑙𝑡𝑟𝑎𝑡𝑖𝑜𝑛 − 𝑆𝑡𝑜𝑟𝑎𝑔𝑒
The storage consists out of the storage capacity of the land and the storage in the river, this creates: 0 = 𝑄𝑖𝑛 − 𝑄𝑜𝑢𝑡
= 𝑃𝑟𝑒𝑐𝑖𝑝𝑖𝑡𝑎𝑡𝑖𝑜𝑛 + 𝑄𝑖𝑛𝑓𝑙𝑜𝑤 − 𝑄𝑑𝑖𝑠𝑐ℎ𝑎𝑟𝑔𝑒 − 𝐼𝑛𝑓𝑖𝑙𝑡𝑟𝑎𝑡𝑖𝑜𝑛 − 𝑆𝑡𝑜𝑟𝑎𝑔𝑒 𝑜𝑓 𝑙𝑎𝑛𝑑− 𝑆𝑡𝑜𝑟𝑎𝑔𝑒 𝑖𝑛 𝑟𝑖𝑣𝑒𝑟
To determine the size and volume of the new river branch (design), first the storage in the river has
to be determined. All other variables are filled in the equation to determine the storage in the river: 0 = 14.200𝑚3 + 1.375𝑚3 − 4.125𝑚3 − 7.210𝑚3 − 540,31𝑚3 − 𝑆𝑡𝑜𝑟𝑎𝑔𝑒 𝑖𝑛 𝑅𝑖𝑣𝑒𝑟 𝑆𝑡𝑜𝑟𝑎𝑔𝑒 𝑖𝑛 𝑅𝑖𝑣𝑒𝑟 = 3.999,69𝑚3
In the next paragraph, Dimensions South Design is explained with which dimensions of the river the 3.999,69m3 is stored.
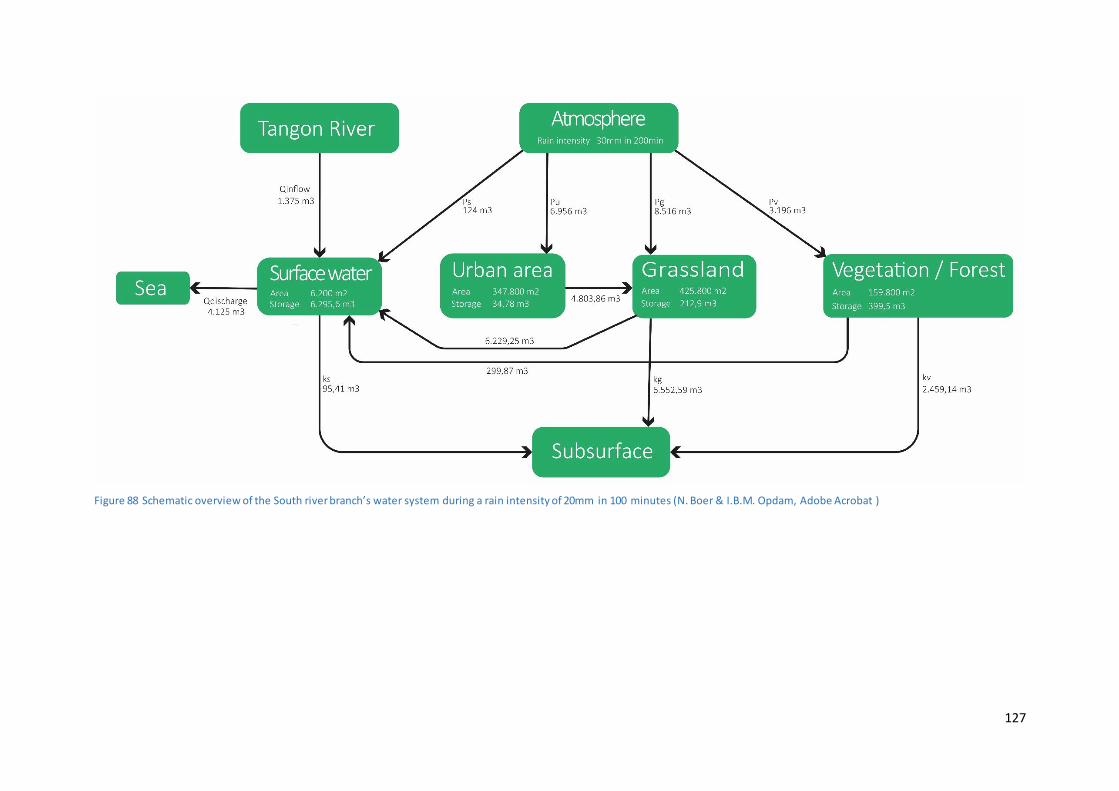
127
Figure 88 Schematic overview of the South river branch’s water system during a rain intensity of 20mm in 100 minutes (N. Boer & I.B.M. Opdam, Adobe Acrobat )

128
Dimensions South Design
Dimensions waterway
Figure 89 Overview waterway South river branch (N. Boer & I.B.M. Opdam, Adobe Acrobat )
To decide the dimensions of the waterway the length of the North river branch is set at 3.100 metre,
this is based on the best option for the position of the river regarding height differences and land use as discussed in chapter 3. Furthermore, the total of water that is in the South river branch is
calculated. The river storage from the water balance is added to the volume of the constant water flow. This constant water flow is 1/9
th of the total storage, which results in the following equation. 𝑇𝑜𝑡𝑎𝑙 𝑠𝑡𝑜𝑟𝑎𝑔𝑒 𝑖𝑛 𝑟𝑖𝑣𝑒𝑟 = 𝑅𝑖𝑣𝑒𝑟 𝑠𝑡𝑜𝑟𝑎𝑔𝑒 + 𝑉𝑜𝑙𝑢𝑚𝑒 𝑜𝑓 𝑐𝑜𝑛𝑠𝑡𝑎𝑛𝑡 𝑤𝑎𝑡𝑒𝑟 𝑓𝑙𝑜𝑤
𝑇𝑜𝑡𝑎𝑙 𝑠𝑡𝑜𝑟𝑎𝑔𝑒 𝑖𝑛 𝑟𝑖𝑣𝑒𝑟 = 3.999,69𝑚3 + (1
9× 3.999,69) = 4.444,1m3
𝐷𝑖𝑚𝑒𝑛𝑠𝑖𝑜𝑛 𝑐𝑟𝑜𝑠𝑠 𝑠𝑒𝑐𝑡𝑖𝑜𝑛 𝑤𝑎𝑡𝑒𝑟𝑤𝑎𝑦 (𝑚2) = 𝑇𝑜𝑡𝑎𝑙 𝑠𝑡𝑜𝑟𝑎𝑔𝑒 𝑖𝑛 𝑟𝑖𝑣𝑒𝑟 ÷ 𝐿𝑒𝑛𝑔𝑡ℎ 𝑜𝑓 𝑟𝑖𝑣𝑒𝑟 𝐷𝑖𝑚𝑒𝑛𝑠𝑖𝑜𝑛 𝑐𝑟𝑜𝑠𝑠 𝑠𝑒𝑐𝑡𝑖𝑜𝑛 𝑤𝑎𝑡𝑒𝑟𝑤𝑎𝑦 (𝑚2) = 4.444,1𝑚3 ÷ 2100𝑚 = 2,12𝑚2

129
Knowing the surface (m2) of the cross section of the waterway, the dimensions such as wide and depth are decided. There is chosen for a 2 metre wide waterway since this fits best with the
surrounding environment. Furthermore, the wide of the river floor is set at 1,2 metre to give a wide variable of options for the depth of the waterway. This data is filled in the equation below to
calculate the depth. Below the equations an overview of the dimensions is show in x. 𝑆𝑢𝑟𝑓𝑎𝑐𝑒 𝑐𝑟𝑜𝑠𝑠 𝑠𝑒𝑐𝑡𝑖𝑜𝑛 𝑤𝑎𝑡𝑒𝑟𝑤𝑎𝑦 = (𝑤𝑖𝑑𝑒 𝑟𝑖𝑣𝑒𝑟 𝑓𝑙𝑜𝑜𝑟 × 𝑑𝑒𝑝𝑡ℎ) + (𝑤𝑖𝑑𝑒 𝑧 × 𝑑𝑒𝑝𝑡ℎ)
2,12𝑚2 = (1,2𝑚 × 𝑑𝑒𝑝𝑡ℎ) + (0,4𝑚 × 𝑑𝑒𝑝𝑡ℎ) 𝑑𝑒𝑝𝑡ℎ = 1,32𝑚
Figure 90 Dimensions waterway of the South river branch (N. Boer & I.B.M. Opdam, Adobe Acrobat )
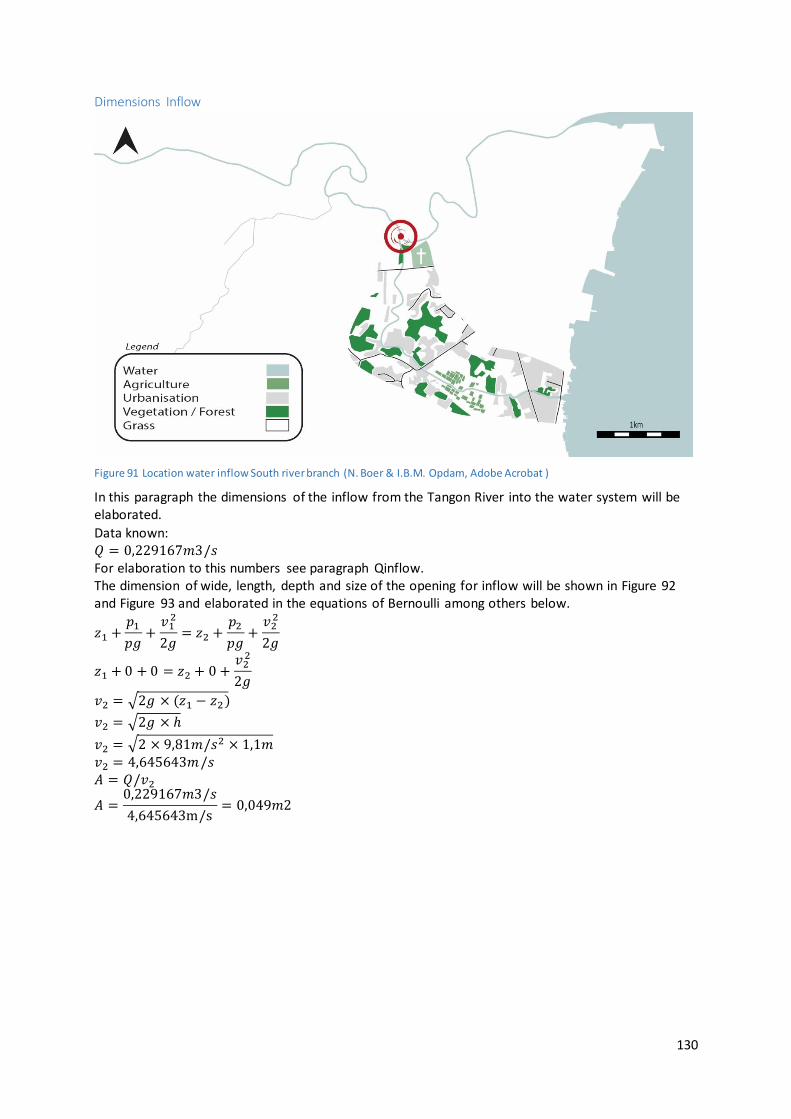
130
Dimensions Inflow
Figure 91 Location water inflow South river branch (N. Boer & I.B.M. Opdam, Adobe Acrobat )
In this paragraph the dimensions of the inflow from the Tangon River into the water system will be elaborated.
Data known: 𝑄 = 0,229167𝑚3/𝑠 For elaboration to this numbers see paragraph Qinflow. The dimension of wide, length, depth and size of the opening for inflow will be shown in Figure 92 and Figure 93 and elaborated in the equations of Bernoulli among others below.
𝑧1 +𝑝1
𝑝𝑔+
𝑣12
2𝑔= 𝑧2 +
𝑝2
𝑝𝑔+
𝑣22
2𝑔
𝑧1 + 0 + 0 = 𝑧2 + 0 +𝑣2
2
2𝑔
𝑣2 = √2𝑔 × (𝑧1 − 𝑧2)
𝑣2 = √2𝑔 × ℎ
𝑣2 = √2 × 9,81𝑚/𝑠2 × 1,1𝑚 𝑣2 = 4,645643𝑚/𝑠 𝐴 = 𝑄/𝑣2
𝐴 =0,229167𝑚3/𝑠
4,645643m/s= 0,049𝑚2
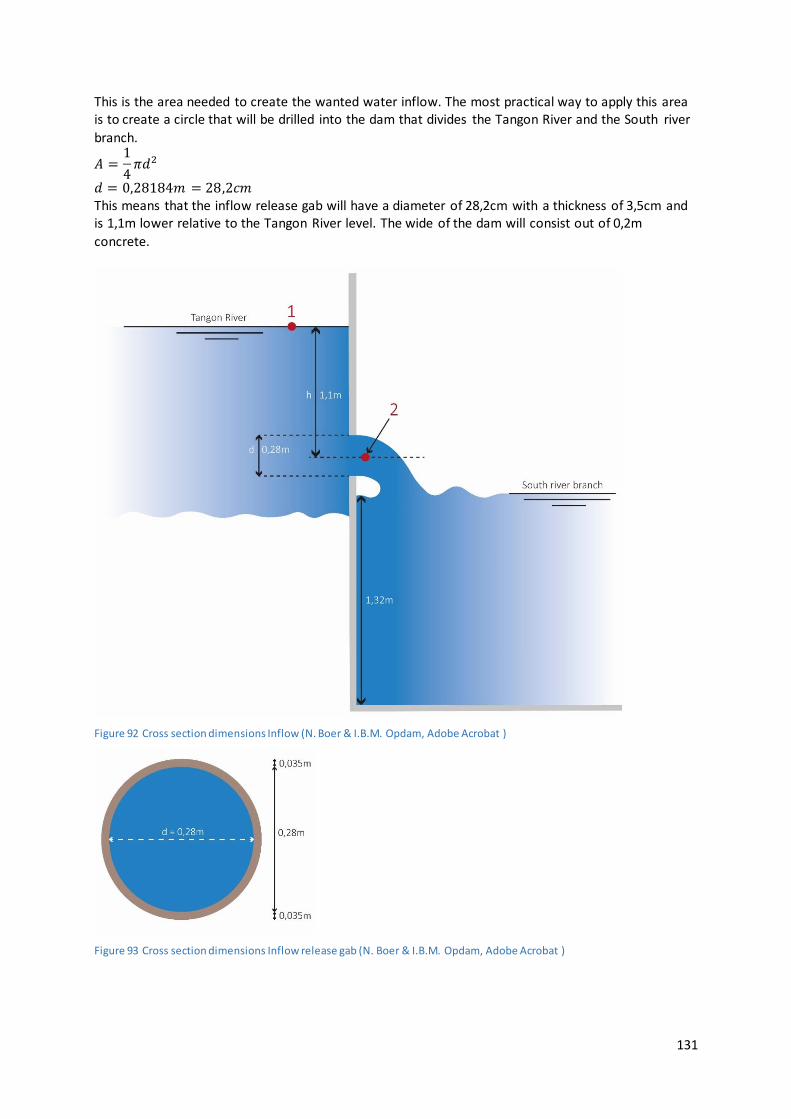
131
This is the area needed to create the wanted water inflow. The most practical way to apply this area is to create a circle that will be drilled into the dam that divides the Tangon River and the South river
branch.
𝐴 =1
4𝜋𝑑2
𝑑 = 0,28184𝑚 = 28,2𝑐𝑚 This means that the inflow release gab will have a diameter of 28,2cm with a thickness of 3,5cm and is 1,1m lower relative to the Tangon River level. The wide of the dam will consist out of 0,2m
concrete.
Figure 92 Cross section dimensions Inflow (N. Boer & I.B.M. Opdam, Adobe Acrobat )
Figure 93 Cross section dimensions Inflow release gab (N. Boer & I.B.M. Opdam, Adobe Acrobat )

132
Dimensions Discharge
This paragraph will elaborate the dimensions of the design to discharge the water from the river
branches to the sea. These dimensions are elaborated with technical sketches, equations and explanatory notes.
Figure 94 Location raster and valves South river branch
Functions design Taking into account that the design has to live up to the following functions;
The design has to minimally discharge the Q below - 𝑄𝑐𝑎𝑙𝑚 = 0,11𝑚/𝑠 ÷ 0,48𝑚2 = 0,229167𝑚3/𝑠
- 𝑄𝑚𝑎𝑥 = 2,4𝑚2 × 0,229167𝑚3/𝑠 ÷ 0,48𝑚2 = 1,145833𝑚3/𝑠 For elaboration to this numbers see paragraph Qdischarge
The design prevents the discharge of the majority solid waste to the sea
The design keeps sea water outside the water system
During high tide and the intense rain shower the sea water
The following is concluded and decided to reach these functions;
The design has to minimally discharge Q = 1,145833m3/s
The design collects solid waste using the power of the water with a triangle based design that will push the solid waste to the side so it can be collected
The design keeps sea water out of the water system using multiple valves that will close during high tide. Furthermore, these valves need to work in all possibilities that can occur in differences between river- and sea water level.
Dimensions of wide, length, depth and dimensions of the valves are shown in the pages below with
explanatory notes. First the dimensions of the design are elaborated in an overview with the explanation on the solid waste removal. As second the dimensions of the valves are further elaborated and explained. Then there is shown how these work in different situations between river-
and sea water level.
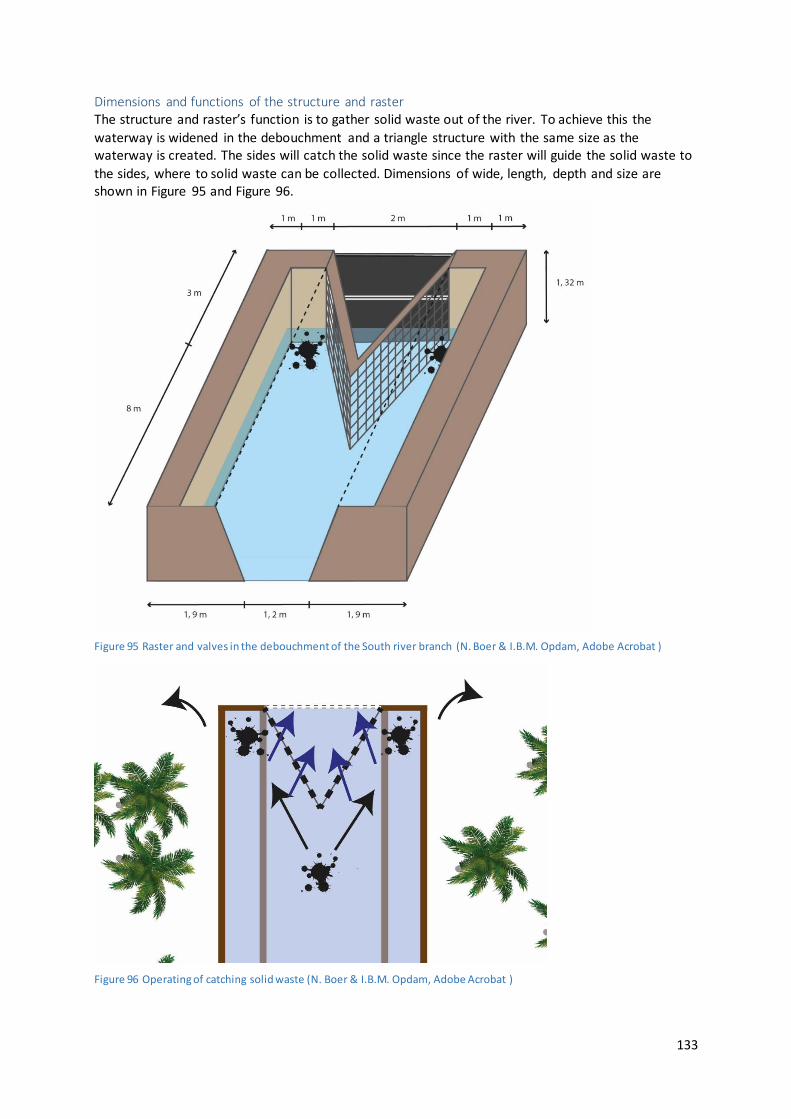
133
Dimensions and functions of the structure and raster The structure and raster’s function is to gather solid waste out of the river. To achieve this the
waterway is widened in the debouchment and a triangle structure with the same size as the waterway is created. The sides will catch the solid waste since the raster will guide the solid waste to
the sides, where to solid waste can be collected. Dimensions of wide, length, depth and size are shown in Figure 95 and Figure 96.
Figure 95 Raster and valves in the debouchment of the South river branch (N. Boer & I.B.M. Opdam, Adobe Acrobat )
Figure 96 Operating of catching solid waste (N. Boer & I.B.M. Opdam, Adobe Acrobat )

134
Dimensions and functions of the valves The valves are created so the water can flush out of the water system easily and to keep the sea out
of the water system. When the tide rises and the sea water level will be higher than the river water level, sea water would be able to flow into the river if it was not for the valves. When the sea water level gets higher than the river water level the pressure of the sea is higher than that of the river. The
valves use this pressure difference in their advantage to close the waterway. In the figures below the working of the valves is elaborated to show the valves work in different situation between river- and sea level.
Figure 97 Different situation between the river- and sea level (N. Boer & I.B.M. Opdam, Adobe Acrobat )
In Figure 97 the valves are shown in two different situations. The first situation is during a low water
level of the river. The lower valve is open during low tide, water can easily discharge to sea. During high tide both valves are closed because of the higher pressure of the sea water. This makes sure the valves prevent the inflow of sea water.
In situation 2 the water level of the river is higher due to rainfall. With low tide both valves are open and river water passes through. With high tide both valves are still open because pressure of the river water is still higher than that off the sea so the river can still discharge its water.
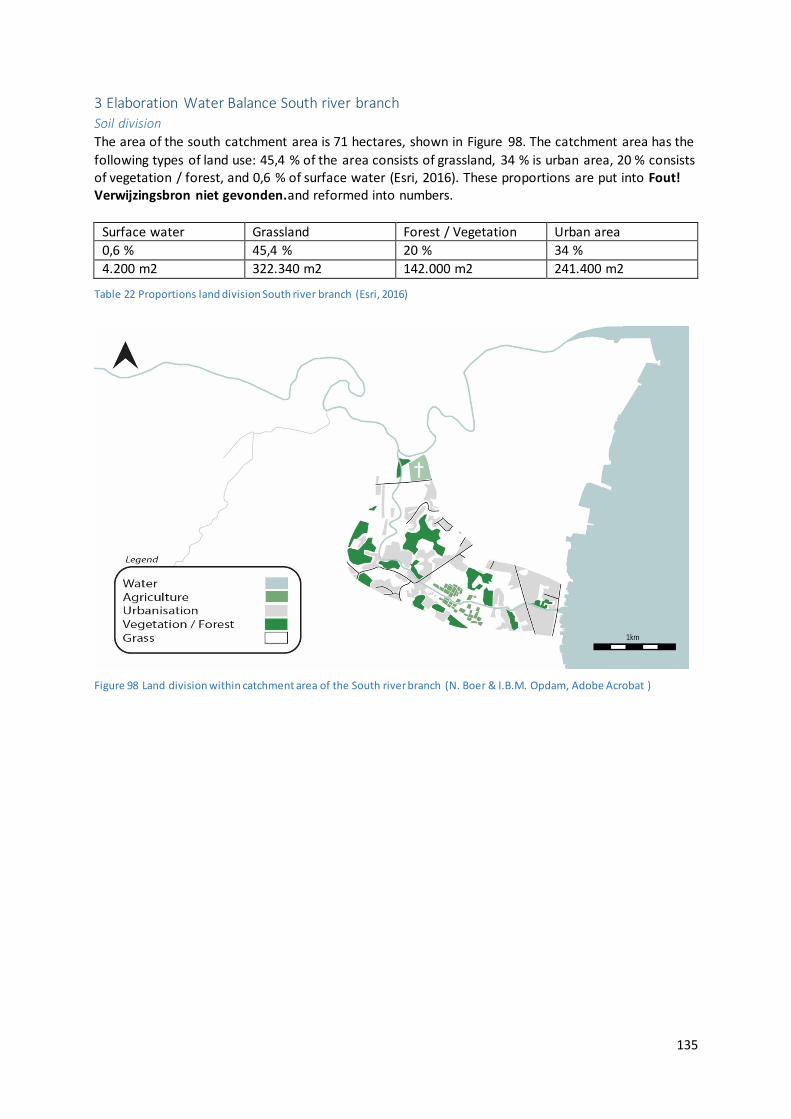
135
3 Elaboration Water Balance South river branch
Soil division
The area of the south catchment area is 71 hectares, shown in Figure 98. The catchment area has the
following types of land use: 45,4 % of the area consists of grassland, 34 % is urban area, 20 % consists of vegetation / forest, and 0,6 % of surface water (Esri, 2016). These proportions are put into Fout! Verwijzingsbron niet gevonden.and reformed into numbers.
Surface water Grassland Forest / Vegetation Urban area
0,6 % 45,4 % 20 % 34 %
4.200 m2 322.340 m2 142.000 m2 241.400 m2
Table 22 Proportions land division South river branch (Esri, 2016)
Figure 98 Land division within catchment area of the South river branch (N. Boer & I.B.M. Opdam, Adobe Acrobat )
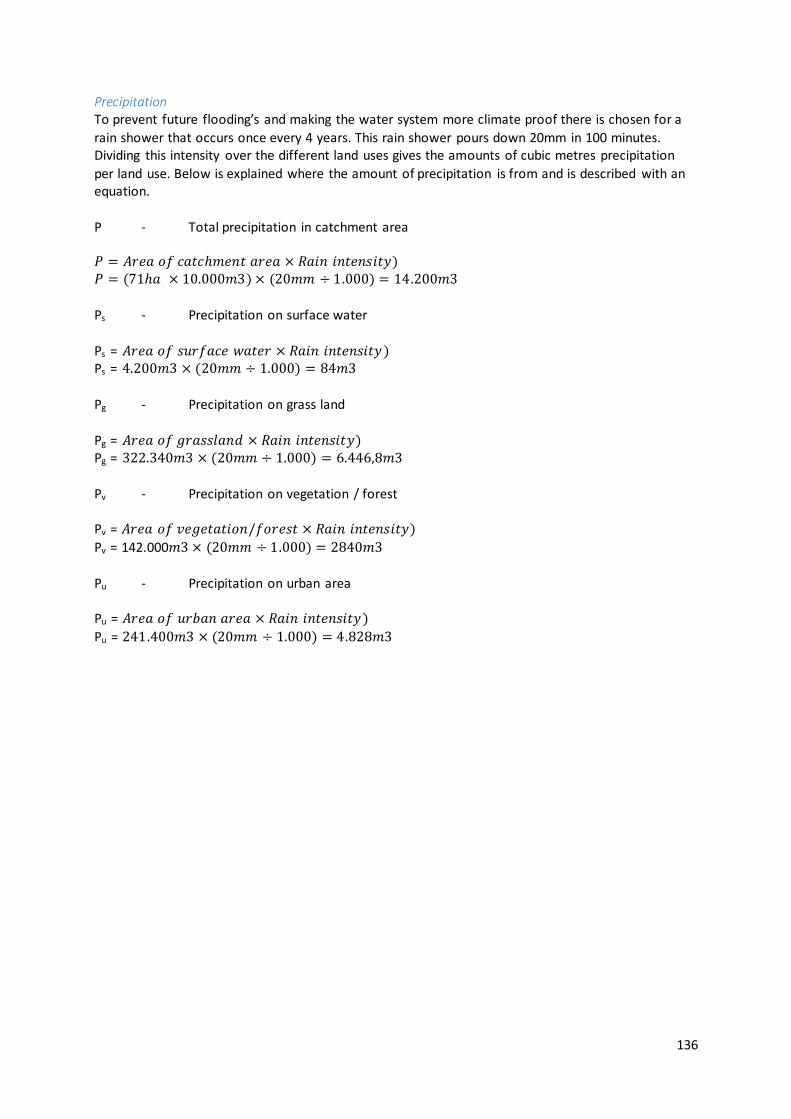
136
Precipitation To prevent future flooding’s and making the water system more climate proof there is chosen for a
rain shower that occurs once every 4 years. This rain shower pours down 20mm in 100 minutes. Dividing this intensity over the different land uses gives the amounts of cubic metres precipitation
per land use. Below is explained where the amount of precipitation is from and is described with an equation.
P - Total precipitation in catchment area 𝑃 = 𝐴𝑟𝑒𝑎 𝑜𝑓 𝑐𝑎𝑡𝑐ℎ𝑚𝑒𝑛𝑡 𝑎𝑟𝑒𝑎 × 𝑅𝑎𝑖𝑛 𝑖𝑛𝑡𝑒𝑛𝑠𝑖𝑡𝑦) 𝑃 = (71ℎ𝑎 × 10.000𝑚3) × (20𝑚𝑚 ÷ 1.000) = 14.200𝑚3
Ps - Precipitation on surface water
Ps = 𝐴𝑟𝑒𝑎 𝑜𝑓 𝑠𝑢𝑟𝑓𝑎𝑐𝑒 𝑤𝑎𝑡𝑒𝑟 × 𝑅𝑎𝑖𝑛 𝑖𝑛𝑡𝑒𝑛𝑠𝑖𝑡𝑦 ) Ps = 4.200𝑚3 × (20𝑚𝑚 ÷ 1.000) = 84𝑚3
Pg - Precipitation on grass land
Pg = 𝐴𝑟𝑒𝑎 𝑜𝑓 𝑔𝑟𝑎𝑠𝑠𝑙𝑎𝑛𝑑 × 𝑅𝑎𝑖𝑛 𝑖𝑛𝑡𝑒𝑛𝑠𝑖𝑡𝑦) Pg = 322.340𝑚3 × (20𝑚𝑚 ÷ 1.000) = 6.446,8𝑚3
Pv - Precipitation on vegetation / forest Pv = 𝐴𝑟𝑒𝑎 𝑜𝑓 𝑣𝑒𝑔𝑒𝑡𝑎𝑡𝑖𝑜𝑛/𝑓𝑜𝑟𝑒𝑠𝑡 × 𝑅𝑎𝑖𝑛 𝑖𝑛𝑡𝑒𝑛𝑠𝑖𝑡𝑦)
Pv = 142.000𝑚3 × (20𝑚𝑚 ÷ 1.000) = 2840𝑚3
Pu - Precipitation on urban area Pu = 𝐴𝑟𝑒𝑎 𝑜𝑓 𝑢𝑟𝑏𝑎𝑛 𝑎𝑟𝑒𝑎 × 𝑅𝑎𝑖𝑛 𝑖𝑛𝑡𝑒𝑛𝑠𝑖𝑡𝑦 )
Pu = 241.400𝑚3 × (20𝑚𝑚 ÷ 1.000) = 4.828𝑚3

137
Infiltration Each land use has a different infiltration, in the overview below the amounts of each land use are
given and described with an equation. Geoscience Technologies Inc. explains that the top soil for the lower elevation in Danao is primarily clay loam (Geoscience Technologies Inc., 2013). Furthermore,
Geoscience Technologies Inc. tells that it is fertile since it is organic in nature, and it can also retain a portion of water (Geoscience Technologies Inc., 2013). Literature studies from the University of Wageningen tell that Clay loam has a permeability (k) of 0,2216 metre a day (Alterra, University of
Wageningen, 2005). In the descriptions below the amount of permeability for each land use is described and elaborated with an equation.
ks - Permeability of the surface water
ks = 𝐴𝑟𝑒𝑎 𝑜𝑓 𝑠𝑢𝑟𝑓𝑎𝑐𝑒 𝑤𝑎𝑡𝑒𝑟 × (𝑘 ÷ 𝑛𝑎𝑡𝑢𝑟𝑎𝑙 𝑑𝑎𝑦 × 𝑟𝑎𝑖𝑛 𝑑𝑢𝑟𝑎𝑡𝑖𝑜𝑛) ks = 4.200𝑚3 × (0,2216𝑚/𝑑 ÷ 1440𝑚𝑖𝑛 × 100𝑚𝑖𝑛) = 64,63𝑚3
kg - Permeability of the grassland
kg = 𝐴𝑟𝑒𝑎 𝑜𝑓 𝑔𝑟𝑎𝑠𝑠𝑙𝑎𝑛𝑑 × (𝑘 ÷ 𝑛𝑎𝑡𝑢𝑟𝑎𝑙 𝑑𝑎𝑦 × 𝑟𝑎𝑖𝑛 𝑑𝑢𝑟𝑎𝑡𝑖𝑜𝑛) kg = 322.340𝑚3 × (0,2216𝑚/𝑑 ÷ 1440𝑚𝑖𝑛 × 100𝑚𝑖𝑛) = 4960,24𝑚3
kv - Permeability of the vegetation / forest kv = 𝐴𝑟𝑒𝑎 𝑜𝑓 𝑣𝑒𝑔𝑒𝑡𝑎𝑡𝑖𝑜𝑛/𝑓𝑜𝑟𝑒𝑠𝑡 × (𝑘 ÷ 𝑛𝑎𝑡𝑢𝑟𝑎𝑙 𝑑𝑎𝑦 × 𝑟𝑎𝑖𝑛 𝑑𝑢𝑟𝑎𝑡𝑖𝑜𝑛)
kv = 142.000𝑚3 × (0,2216𝑚/𝑑 ÷ 1440𝑚𝑖𝑛 × 100𝑚𝑖𝑛) = 2185,13𝑚3 𝑇𝑜𝑡𝑎𝑙 𝐼𝑛𝑓𝑖𝑙𝑡𝑟𝑎𝑡𝑖𝑜𝑛 = 64,63𝑚3 + 4960,24𝑚2 + 21,85,13𝑚3 = 7.210𝑚3
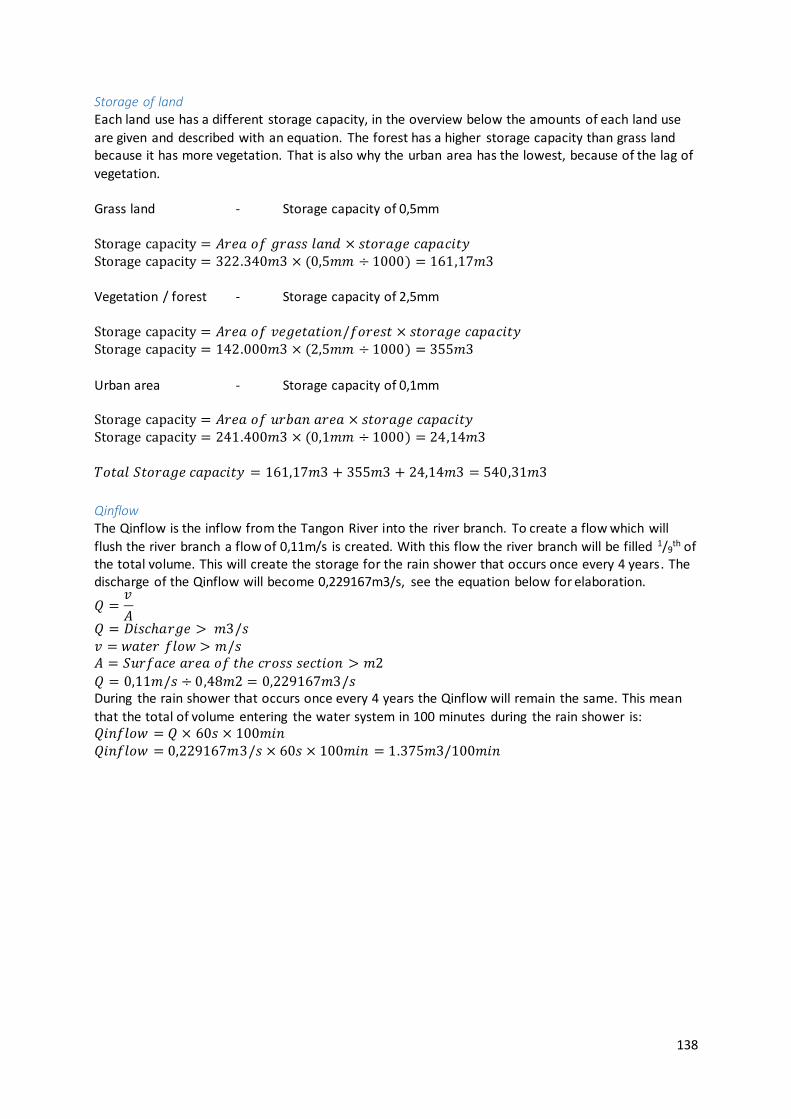
138
Storage of land Each land use has a different storage capacity, in the overview below the amounts of each land use
are given and described with an equation. The forest has a higher storage capacity than grass land because it has more vegetation. That is also why the urban area has the lowest, because of the lag of
vegetation. Grass land - Storage capacity of 0,5mm
Storage capacity = 𝐴𝑟𝑒𝑎 𝑜𝑓 𝑔𝑟𝑎𝑠𝑠 𝑙𝑎𝑛𝑑 × 𝑠𝑡𝑜𝑟𝑎𝑔𝑒 𝑐𝑎𝑝𝑎𝑐𝑖𝑡𝑦 Storage capacity = 322.340𝑚3 × (0,5𝑚𝑚 ÷ 1000) = 161,17𝑚3 Vegetation / forest - Storage capacity of 2,5mm
Storage capacity = 𝐴𝑟𝑒𝑎 𝑜𝑓 𝑣𝑒𝑔𝑒𝑡𝑎𝑡𝑖𝑜𝑛/𝑓𝑜𝑟𝑒𝑠𝑡 × 𝑠𝑡𝑜𝑟𝑎𝑔𝑒 𝑐𝑎𝑝𝑎𝑐𝑖𝑡𝑦 Storage capacity = 142.000𝑚3 × (2,5𝑚𝑚 ÷ 1000) = 355𝑚3
Urban area - Storage capacity of 0,1mm Storage capacity = 𝐴𝑟𝑒𝑎 𝑜𝑓 𝑢𝑟𝑏𝑎𝑛 𝑎𝑟𝑒𝑎 × 𝑠𝑡𝑜𝑟𝑎𝑔𝑒 𝑐𝑎𝑝𝑎𝑐𝑖𝑡𝑦 Storage capacity = 241.400𝑚3 × (0,1𝑚𝑚 ÷ 1000) = 24,14𝑚3 𝑇𝑜𝑡𝑎𝑙 𝑆𝑡𝑜𝑟𝑎𝑔𝑒 𝑐𝑎𝑝𝑎𝑐𝑖𝑡𝑦 = 161,17𝑚3 + 355𝑚3 + 24,14𝑚3 = 540,31𝑚3
Qinflow The Qinflow is the inflow from the Tangon River into the river branch. To create a flow which will
flush the river branch a flow of 0,11m/s is created. With this flow the river branch will be filled 1/9th of
the total volume. This will create the storage for the rain shower that occurs once every 4 years. The discharge of the Qinflow will become 0,229167m3/s, see the equation below for elaboration.
𝑄 =𝑣
𝐴
𝑄 = 𝐷𝑖𝑠𝑐ℎ𝑎𝑟𝑔𝑒 > 𝑚3/𝑠 𝑣 = 𝑤𝑎𝑡𝑒𝑟 𝑓𝑙𝑜𝑤 > 𝑚/𝑠 𝐴 = 𝑆𝑢𝑟𝑓𝑎𝑐𝑒 𝑎𝑟𝑒𝑎 𝑜𝑓 𝑡ℎ𝑒 𝑐𝑟𝑜𝑠𝑠 𝑠𝑒𝑐𝑡𝑖𝑜𝑛 > 𝑚2
𝑄 = 0,11𝑚/𝑠 ÷ 0,48𝑚2 = 0,229167𝑚3/𝑠 During the rain shower that occurs once every 4 years the Qinflow will remain the same. This mean
that the total of volume entering the water system in 100 minutes during the rain shower is: 𝑄𝑖𝑛𝑓𝑙𝑜𝑤 = 𝑄 × 60𝑠 × 100𝑚𝑖𝑛 𝑄𝑖𝑛𝑓𝑙𝑜𝑤 = 0,229167𝑚3/𝑠 × 60𝑠 × 100𝑚𝑖𝑛 = 1.375𝑚3/100𝑚𝑖𝑛
139
Qdischarge The Qdischarge is the discharge of water into the sea. As said before to create a flow which will flush
the river branches a discharge of 0,229167m3/s is created. In a calm situation the Qdischarge will be the same as the Qinflow, 1375m3/100min. During the rain shower of 20mm in 100 minutes more
water will discharges into sea, since there is more water in the river branch. For knowing how much more water will be discharged into the sea, the average is taken of the Qdischarge in a calm situation and the maximum Qdischarge during the rain shower. This will give
how much cubic metres will be discharged during the rain shower. 𝑄𝑚𝑎𝑥 = 𝐴𝑚𝑎𝑥 × 𝑄𝑐𝑎𝑙𝑚 ÷ 𝐴𝑐𝑎𝑙𝑚 𝑄𝑚𝑎𝑥 = 2,4𝑚2 × 0,229167𝑚3/𝑠 ÷ 0,48𝑚2 = 1,145833𝑚3/𝑠 𝑄𝑎𝑣𝑒𝑟𝑎𝑔𝑒 = ((𝑄𝑚𝑎𝑥 − 𝑄𝑐𝑎𝑙𝑚) ÷ 2) + 𝑄𝑐𝑎𝑙𝑚
𝑄𝑎𝑣𝑒𝑟𝑎𝑔𝑒 = ((1,145833𝑚3/𝑠 − 0,229167𝑚3/𝑠) ÷ 2) + 0,229167𝑚3/𝑠 = 0,6875𝑚3/𝑠 So during the rain shower of 20mm in 100 minutes the average discharge is 0,6875m3/s. The total,
Qdischarge in 100 minutes is: 𝑄𝑑𝑖𝑠𝑐ℎ𝑎𝑟𝑔𝑒 = 𝑄𝑎𝑣𝑒𝑟𝑎𝑔𝑒 × 60𝑠 × 100𝑚𝑖𝑛 𝑄𝑑𝑖𝑠𝑐ℎ𝑎𝑟𝑔𝑒 = 0,6875𝑚3/𝑠 × 60𝑠 × 100𝑚𝑖𝑛 = 4.125𝑚3
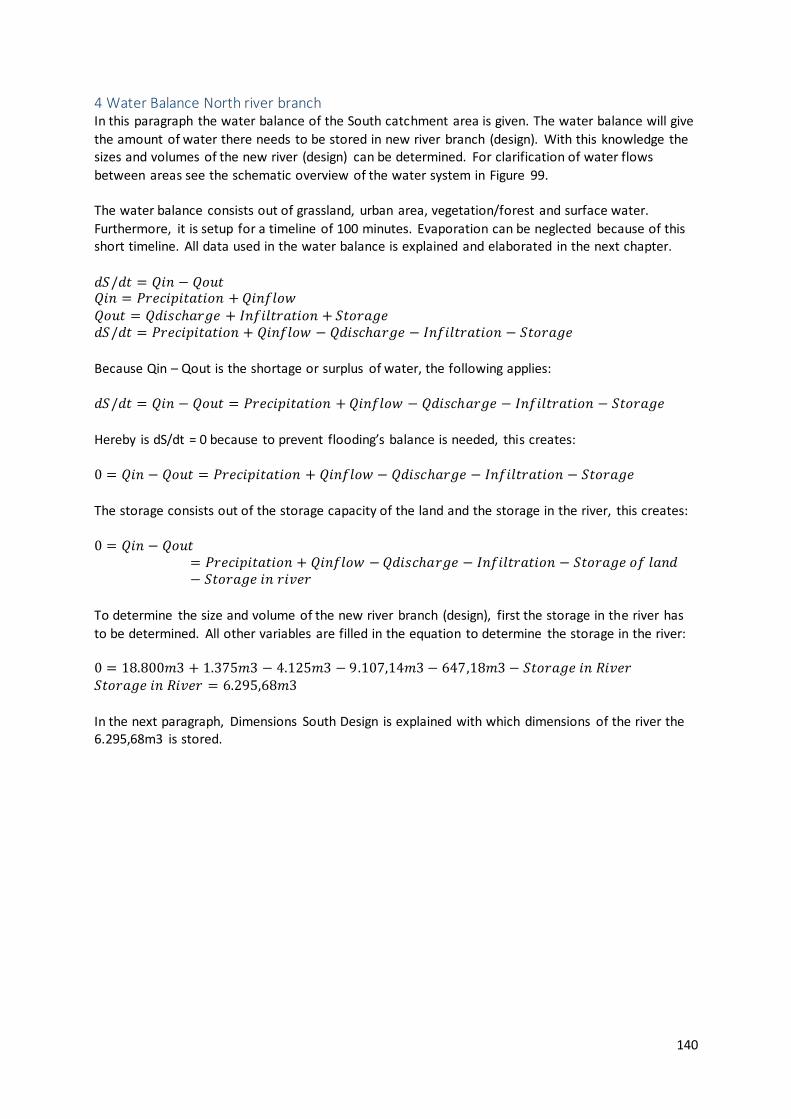
140
4 Water Balance North river branch In this paragraph the water balance of the South catchment area is given. The water balance will give
the amount of water there needs to be stored in new river branch (design). With this knowledge the sizes and volumes of the new river (design) can be determined. For clarification of water flows
between areas see the schematic overview of the water system in Figure 99. The water balance consists out of grassland, urban area, vegetation/forest and surface water.
Furthermore, it is setup for a timeline of 100 minutes. Evaporation can be neglected because of this short timeline. All data used in the water balance is explained and elaborated in the next chapter.
𝑑𝑆/𝑑𝑡 = 𝑄𝑖𝑛 − 𝑄𝑜𝑢𝑡 𝑄𝑖𝑛 = 𝑃𝑟𝑒𝑐𝑖𝑝𝑖𝑡𝑎𝑡𝑖𝑜𝑛 + 𝑄𝑖𝑛𝑓𝑙𝑜𝑤 𝑄𝑜𝑢𝑡 = 𝑄𝑑𝑖𝑠𝑐ℎ𝑎𝑟𝑔𝑒 + 𝐼𝑛𝑓𝑖𝑙𝑡𝑟𝑎𝑡𝑖𝑜𝑛 + 𝑆𝑡𝑜𝑟𝑎𝑔𝑒 𝑑𝑆/𝑑𝑡 = 𝑃𝑟𝑒𝑐𝑖𝑝𝑖𝑡𝑎𝑡𝑖𝑜𝑛 + 𝑄𝑖𝑛𝑓𝑙𝑜𝑤 − 𝑄𝑑𝑖𝑠𝑐ℎ𝑎𝑟𝑔𝑒 − 𝐼𝑛𝑓𝑖𝑙𝑡𝑟𝑎𝑡𝑖𝑜𝑛 − 𝑆𝑡𝑜𝑟𝑎𝑔𝑒
Because Qin – Qout is the shortage or surplus of water, the following applies:
𝑑𝑆/𝑑𝑡 = 𝑄𝑖𝑛 − 𝑄𝑜𝑢𝑡 = 𝑃𝑟𝑒𝑐𝑖𝑝𝑖𝑡𝑎𝑡𝑖𝑜𝑛 + 𝑄𝑖𝑛𝑓𝑙𝑜𝑤 − 𝑄𝑑𝑖𝑠𝑐ℎ𝑎𝑟𝑔𝑒 − 𝐼𝑛𝑓𝑖𝑙𝑡𝑟𝑎𝑡𝑖𝑜𝑛 − 𝑆𝑡𝑜𝑟𝑎𝑔𝑒
Hereby is dS/dt = 0 because to prevent flooding’s balance is needed, this creates: 0 = 𝑄𝑖𝑛 − 𝑄𝑜𝑢𝑡 = 𝑃𝑟𝑒𝑐𝑖𝑝𝑖𝑡𝑎𝑡𝑖𝑜𝑛 + 𝑄𝑖𝑛𝑓𝑙𝑜𝑤 − 𝑄𝑑𝑖𝑠𝑐ℎ𝑎𝑟𝑔𝑒 − 𝐼𝑛𝑓𝑖𝑙𝑡𝑟𝑎𝑡𝑖𝑜𝑛 − 𝑆𝑡𝑜𝑟𝑎𝑔𝑒
The storage consists out of the storage capacity of the land and the storage in the river, this creates: 0 = 𝑄𝑖𝑛 − 𝑄𝑜𝑢𝑡
= 𝑃𝑟𝑒𝑐𝑖𝑝𝑖𝑡𝑎𝑡𝑖𝑜𝑛 + 𝑄𝑖𝑛𝑓𝑙𝑜𝑤 − 𝑄𝑑𝑖𝑠𝑐ℎ𝑎𝑟𝑔𝑒 − 𝐼𝑛𝑓𝑖𝑙𝑡𝑟𝑎𝑡𝑖𝑜𝑛 − 𝑆𝑡𝑜𝑟𝑎𝑔𝑒 𝑜𝑓 𝑙𝑎𝑛𝑑− 𝑆𝑡𝑜𝑟𝑎𝑔𝑒 𝑖𝑛 𝑟𝑖𝑣𝑒𝑟
To determine the size and volume of the new river branch (design), first the storage in the river has
to be determined. All other variables are filled in the equation to determine the storage in the river: 0 = 18.800𝑚3 + 1.375𝑚3 − 4.125𝑚3 − 9.107,14𝑚3 − 647,18𝑚3 − 𝑆𝑡𝑜𝑟𝑎𝑔𝑒 𝑖𝑛 𝑅𝑖𝑣𝑒𝑟 𝑆𝑡𝑜𝑟𝑎𝑔𝑒 𝑖𝑛 𝑅𝑖𝑣𝑒𝑟 = 6.295,68𝑚3
In the next paragraph, Dimensions South Design is explained with which dimensions of the river the 6.295,68m3 is stored.

141
Figure 99 Schematic overview of the North river branch’s water system during a rain intensity of 20mm in 100 m inutes (N. Boer & I.B.M. Opdam, Adobe Acrobat )
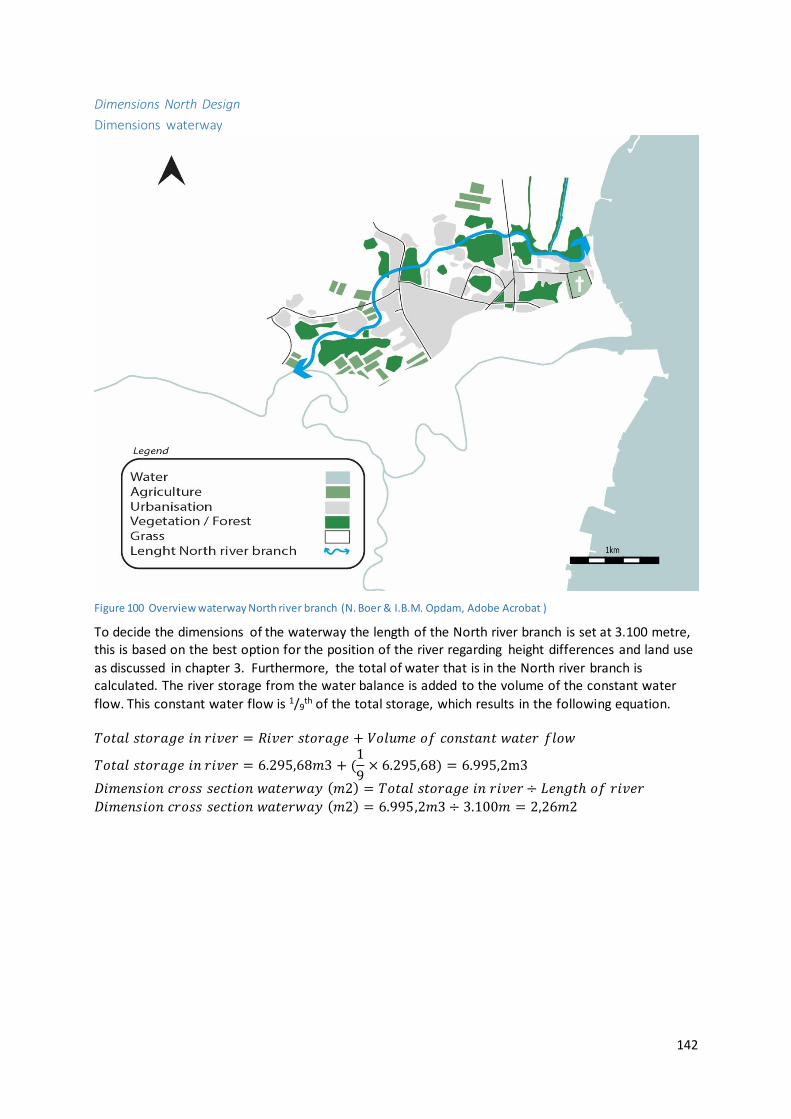
142
Dimensions North Design
Dimensions waterway
Figure 100 Overview waterway North river branch (N. Boer & I.B.M. Opdam, Adobe Acrobat )
To decide the dimensions of the waterway the length of the North river branch is set at 3.100 metre, this is based on the best option for the position of the river regarding height differences and land use
as discussed in chapter 3. Furthermore, the total of water that is in the North river branch is calculated. The river storage from the water balance is added to the volume of the constant water
flow. This constant water flow is 1/9th of the total storage, which results in the following equation.
𝑇𝑜𝑡𝑎𝑙 𝑠𝑡𝑜𝑟𝑎𝑔𝑒 𝑖𝑛 𝑟𝑖𝑣𝑒𝑟 = 𝑅𝑖𝑣𝑒𝑟 𝑠𝑡𝑜𝑟𝑎𝑔𝑒 + 𝑉𝑜𝑙𝑢𝑚𝑒 𝑜𝑓 𝑐𝑜𝑛𝑠𝑡𝑎𝑛𝑡 𝑤𝑎𝑡𝑒𝑟 𝑓𝑙𝑜𝑤
𝑇𝑜𝑡𝑎𝑙 𝑠𝑡𝑜𝑟𝑎𝑔𝑒 𝑖𝑛 𝑟𝑖𝑣𝑒𝑟 = 6.295,68𝑚3 + (1
9× 6.295,68) = 6.995,2m3
𝐷𝑖𝑚𝑒𝑛𝑠𝑖𝑜𝑛 𝑐𝑟𝑜𝑠𝑠 𝑠𝑒𝑐𝑡𝑖𝑜𝑛 𝑤𝑎𝑡𝑒𝑟𝑤𝑎𝑦 (𝑚2) = 𝑇𝑜𝑡𝑎𝑙 𝑠𝑡𝑜𝑟𝑎𝑔𝑒 𝑖𝑛 𝑟𝑖𝑣𝑒𝑟 ÷ 𝐿𝑒𝑛𝑔𝑡ℎ 𝑜𝑓 𝑟𝑖𝑣𝑒𝑟
𝐷𝑖𝑚𝑒𝑛𝑠𝑖𝑜𝑛 𝑐𝑟𝑜𝑠𝑠 𝑠𝑒𝑐𝑡𝑖𝑜𝑛 𝑤𝑎𝑡𝑒𝑟𝑤𝑎𝑦 (𝑚2) = 6.995,2𝑚3 ÷ 3.100𝑚 = 2,26𝑚2
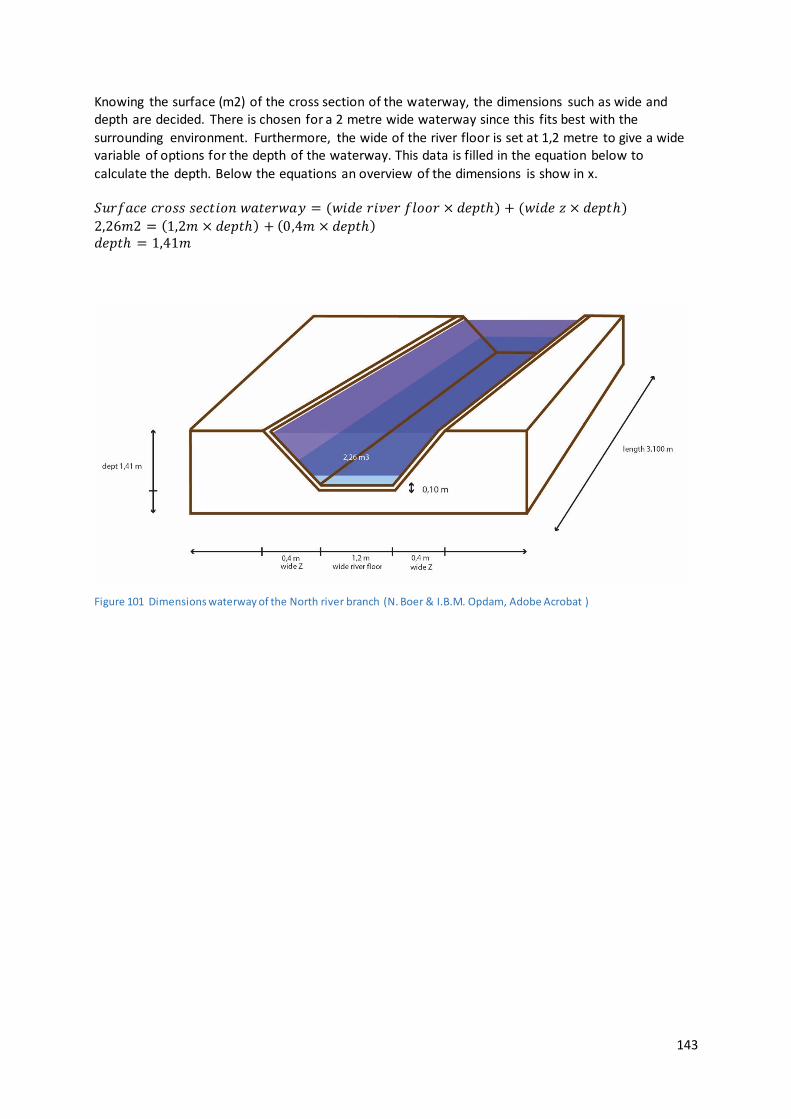
143
Knowing the surface (m2) of the cross section of the waterway, the dimensions such as wide and depth are decided. There is chosen for a 2 metre wide waterway since this fits best with the
surrounding environment. Furthermore, the wide of the river floor is set at 1,2 metre to give a wide variable of options for the depth of the waterway. This data is filled in the equation below to
calculate the depth. Below the equations an overview of the dimensions is show in x. 𝑆𝑢𝑟𝑓𝑎𝑐𝑒 𝑐𝑟𝑜𝑠𝑠 𝑠𝑒𝑐𝑡𝑖𝑜𝑛 𝑤𝑎𝑡𝑒𝑟𝑤𝑎𝑦 = (𝑤𝑖𝑑𝑒 𝑟𝑖𝑣𝑒𝑟 𝑓𝑙𝑜𝑜𝑟 × 𝑑𝑒𝑝𝑡ℎ) + (𝑤𝑖𝑑𝑒 𝑧 × 𝑑𝑒𝑝𝑡ℎ)
2,26𝑚2 = (1,2𝑚 × 𝑑𝑒𝑝𝑡ℎ) + (0,4𝑚 × 𝑑𝑒𝑝𝑡ℎ) 𝑑𝑒𝑝𝑡ℎ = 1,41𝑚
Figure 101 Dimensions waterway of the North river branch (N. Boer & I.B.M. Opdam, Adobe Acrobat )
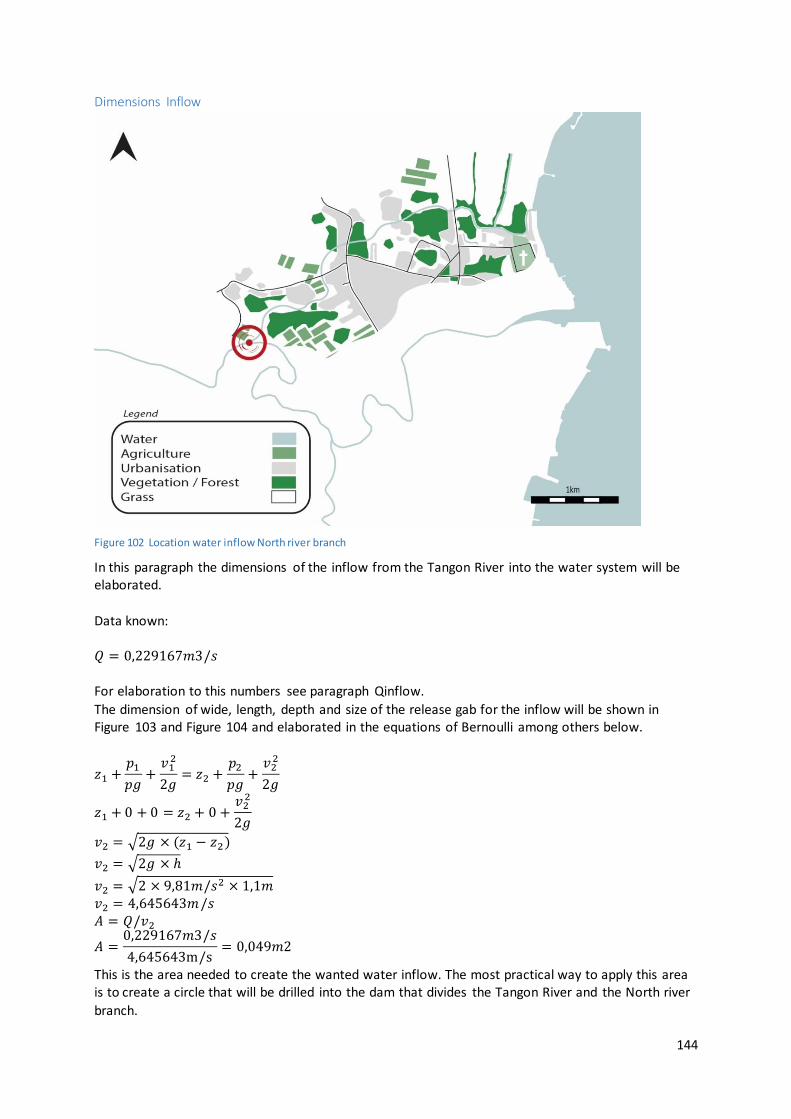
144
Dimensions Inflow
Figure 102 Location water inflow North river branch
In this paragraph the dimensions of the inflow from the Tangon River into the water system will be elaborated.
Data known: 𝑄 = 0,229167𝑚3/𝑠 For elaboration to this numbers see paragraph Qinflow.
The dimension of wide, length, depth and size of the release gab for the inflow will be shown in Figure 103 and Figure 104 and elaborated in the equations of Bernoulli among others below.
𝑧1 +𝑝1
𝑝𝑔+
𝑣12
2𝑔= 𝑧2 +
𝑝2
𝑝𝑔+
𝑣22
2𝑔
𝑧1 + 0 + 0 = 𝑧2 + 0 +𝑣2
2
2𝑔
𝑣2 = √2𝑔 × (𝑧1 − 𝑧2)
𝑣2 = √2𝑔 × ℎ
𝑣2 = √2 × 9,81𝑚/𝑠2 × 1,1𝑚 𝑣2 = 4,645643𝑚/𝑠 𝐴 = 𝑄/𝑣2
𝐴 =0,229167𝑚3/𝑠
4,645643m/s= 0,049𝑚2
This is the area needed to create the wanted water inflow. The most practical way to apply this area is to create a circle that will be drilled into the dam that divides the Tangon River and the North river
branch.
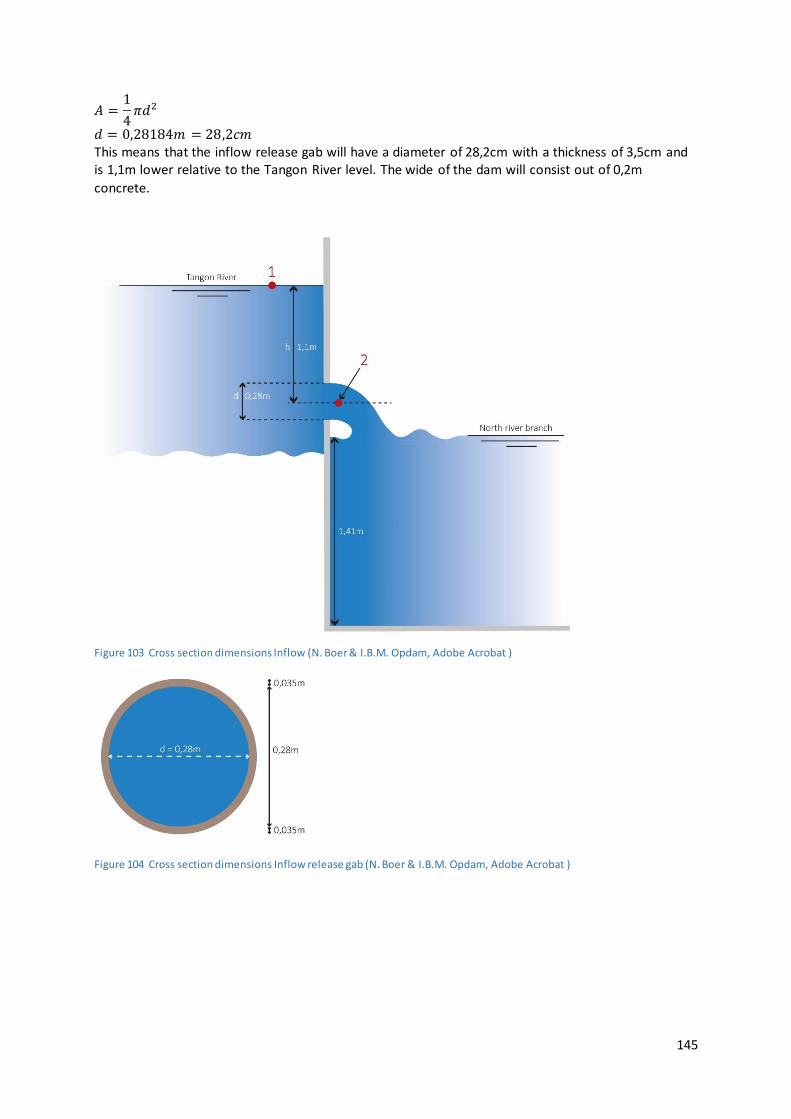
145
𝐴 =1
4𝜋𝑑2
𝑑 = 0,28184𝑚 = 28,2𝑐𝑚 This means that the inflow release gab will have a diameter of 28,2cm with a thickness of 3,5cm and is 1,1m lower relative to the Tangon River level. The wide of the dam will consist out of 0,2m
concrete.
Figure 103 Cross section dimensions Inflow (N. Boer & I.B.M. Opdam, Adobe Acrobat )
Figure 104 Cross section dimensions Inflow release gab (N. Boer & I.B.M. Opdam, Adobe Acrobat )
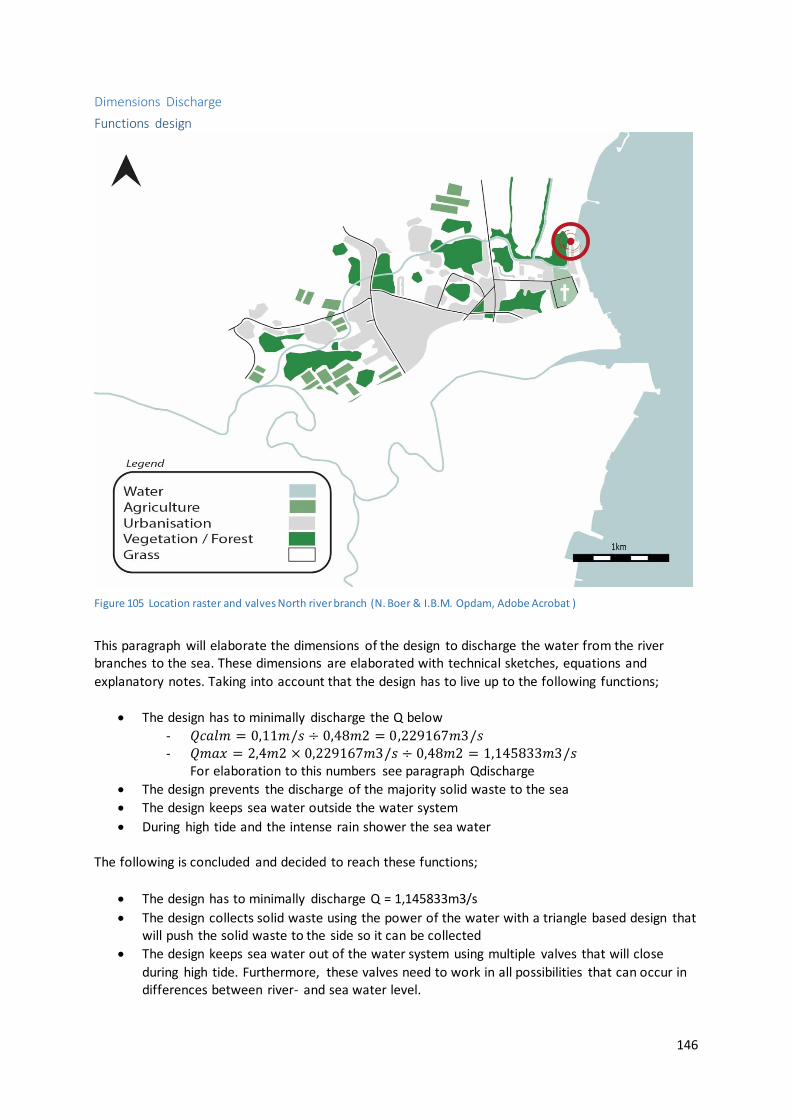
146
Dimensions Discharge
Functions design
Figure 105 Location raster and valves North river branch (N. Boer & I.B.M. Opdam, Adobe Acrobat )
This paragraph will elaborate the dimensions of the design to discharge the water from the river branches to the sea. These dimensions are elaborated with technical sketches, equations and
explanatory notes. Taking into account that the design has to live up to the following functions;
The design has to minimally discharge the Q below
- 𝑄𝑐𝑎𝑙𝑚 = 0,11𝑚/𝑠 ÷ 0,48𝑚2 = 0,229167𝑚3/𝑠 - 𝑄𝑚𝑎𝑥 = 2,4𝑚2 × 0,229167𝑚3/𝑠 ÷ 0,48𝑚2 = 1,145833𝑚3/𝑠
For elaboration to this numbers see paragraph Qdischarge
The design prevents the discharge of the majority solid waste to the sea
The design keeps sea water outside the water system
During high tide and the intense rain shower the sea water The following is concluded and decided to reach these functions;
The design has to minimally discharge Q = 1,145833m3/s
The design collects solid waste using the power of the water with a triangle based design that will push the solid waste to the side so it can be collected
The design keeps sea water out of the water system using multiple valves that will close
during high tide. Furthermore, these valves need to work in all possibilities that can occur in differences between river- and sea water level.

147
Dimensions of wide, length, depth and dimensions of the valves are shown in the pages below with explanatory notes. First the dimensions of the design are elaborated in an overview with the
explanation on the solid waste removal. As second the dimensions of the valves are further elaborated and explained. Then there is shown how these work in different situations between river-
and sea water level.
Dimensions and functions of the structure and raster
The structure and raster’s function is to gather solid waste out of the river. To achieve this the waterway is widened in the debouchment and a triangle structure with the same size as the
waterway is created. The sides will catch the solid waste since the raster will guide the solid waste to the sides, where to solid waste can be collected. Dimensions of wide, length, depth and size are
shown in Figure 106.
Figure 106 Raster and valves in the debouchment of the North river branch (N. Boer & I.B.M. Opdam, Adobe Acrobat )
Figure 107 Operating of catching solid waste (N. Boer & I.B.M. Opdam, Adobe Acrobat )
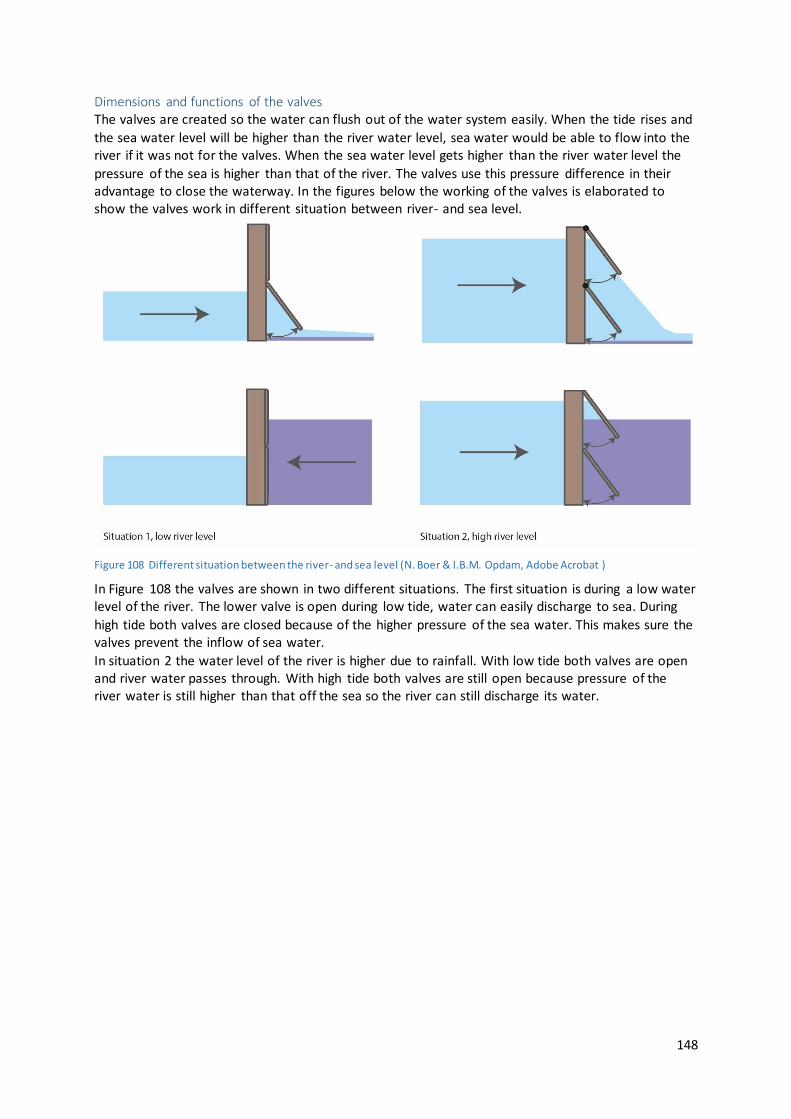
148
Dimensions and functions of the valves The valves are created so the water can flush out of the water system easily. When the tide rises and
the sea water level will be higher than the river water level, sea water would be able to flow into the river if it was not for the valves. When the sea water level gets higher than the river water level the
pressure of the sea is higher than that of the river. The valves use this pressure difference in their advantage to close the waterway. In the figures below the working of the valves is elaborated to show the valves work in different situation between river- and sea level.
Figure 108 Different situation between the river- and sea level (N. Boer & I.B.M. Opdam, Adobe Acrobat )
In Figure 108 the valves are shown in two different situations. The first situation is during a low water level of the river. The lower valve is open during low tide, water can easily discharge to sea. During
high tide both valves are closed because of the higher pressure of the sea water. This makes sure the valves prevent the inflow of sea water.
In situation 2 the water level of the river is higher due to rainfall. With low tide both valves are open and river water passes through. With high tide both valves are still open because pressure of the river water is still higher than that off the sea so the river can still discharge its water.
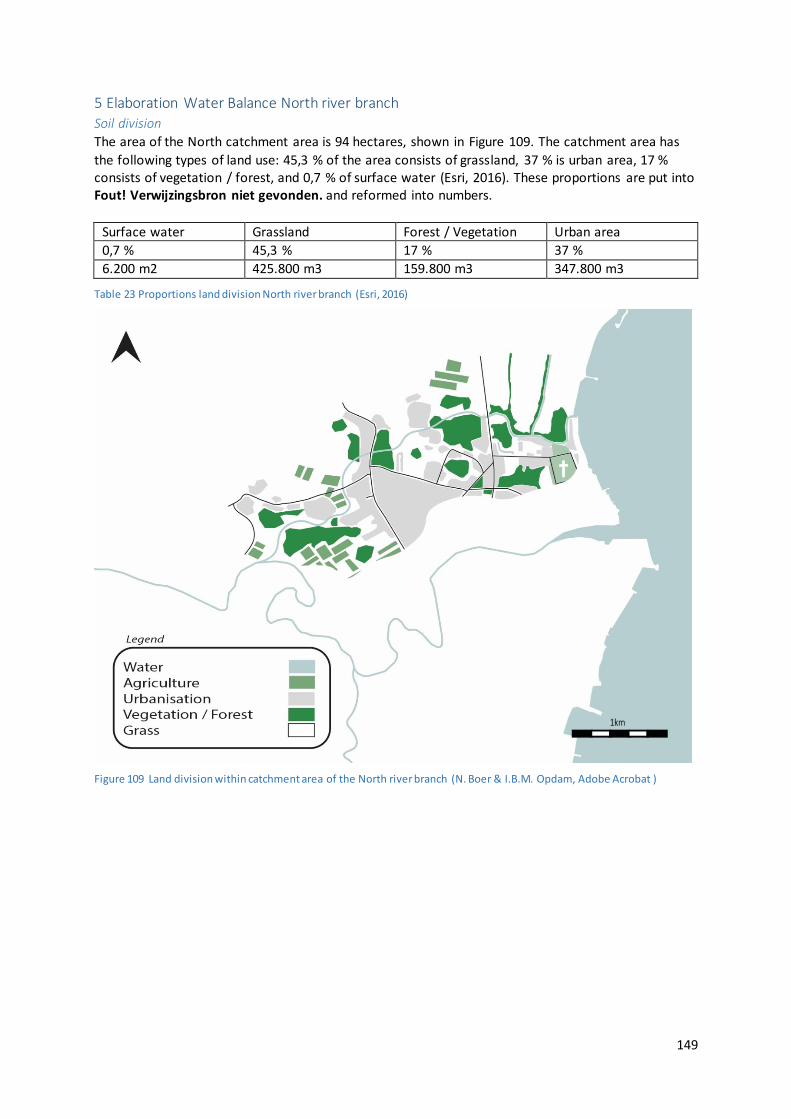
149
5 Elaboration Water Balance North river branch
Soil division
The area of the North catchment area is 94 hectares, shown in Figure 109. The catchment area has
the following types of land use: 45,3 % of the area consists of grassland, 37 % is urban area, 17 % consists of vegetation / forest, and 0,7 % of surface water (Esri, 2016). These proportions are put into Fout! Verwijzingsbron niet gevonden. and reformed into numbers.
Surface water Grassland Forest / Vegetation Urban area
0,7 % 45,3 % 17 % 37 %
6.200 m2 425.800 m3 159.800 m3 347.800 m3
Table 23 Proportions land division North river branch (Esri, 2016)
Figure 109 Land division within catchment area of the North river branch (N. Boer & I.B.M. Opdam, Adobe Acrobat )
150
Precipitation To prevent future flooding’s and making the water system more climate proof there is chosen for a
rain shower that occurs once every 4 years. This rain shower pours down 20mm in 100 minutes. Dividing this intensity over the different land uses gives the amounts of cubic metres precipitation
per land use. Below is explained where the amount of precipitation is from and is described with an equation.
P - Total precipitation in catchment area 𝑃 = 𝐴𝑟𝑒𝑎 𝑜𝑓 𝑐𝑎𝑡𝑐ℎ𝑚𝑒𝑛𝑡 𝑎𝑟𝑒𝑎 × 𝑅𝑎𝑖𝑛 𝑖𝑛𝑡𝑒𝑛𝑠𝑖𝑡𝑦) 𝑃 = (94ℎ𝑎 × 10.000𝑚3) × (20𝑚𝑚 ÷ 1.000) = 18.800𝑚3
Ps - Precipitation on surface water
Ps = 𝐴𝑟𝑒𝑎 𝑜𝑓 𝑠𝑢𝑟𝑓𝑎𝑐𝑒 𝑤𝑎𝑡𝑒𝑟 × 𝑅𝑎𝑖𝑛 𝑖𝑛𝑡𝑒𝑛𝑠𝑖𝑡𝑦 ) Ps = 6.200𝑚3 × (20𝑚𝑚 ÷ 1.000) = 124𝑚3
Pg - Precipitation on grass land
Pg = 𝐴𝑟𝑒𝑎 𝑜𝑓 𝑔𝑟𝑎𝑠𝑠𝑙𝑎𝑛𝑑 × 𝑅𝑎𝑖𝑛 𝑖𝑛𝑡𝑒𝑛𝑠𝑖𝑡𝑦) Pg = 425.800𝑚3 × (20𝑚𝑚 ÷ 1.000) = 8.516𝑚3
Pv - Precipitation on vegetation / forest Pv = 𝐴𝑟𝑒𝑎 𝑜𝑓 𝑣𝑒𝑔𝑒𝑡𝑎𝑡𝑖𝑜𝑛/𝑓𝑜𝑟𝑒𝑠𝑡 × 𝑅𝑎𝑖𝑛 𝑖𝑛𝑡𝑒𝑛𝑠𝑖𝑡𝑦)
Pv = 159.800𝑚3 × (20𝑚𝑚 ÷ 1.000) = 3.196𝑚3
Pu - Precipitation on urban area Pu = 𝐴𝑟𝑒𝑎 𝑜𝑓 𝑢𝑟𝑏𝑎𝑛 𝑎𝑟𝑒𝑎 × 𝑅𝑎𝑖𝑛 𝑖𝑛𝑡𝑒𝑛𝑠𝑖𝑡𝑦 )
Pu = 347.800𝑚3 × (20𝑚𝑚 ÷ 1.000) = 6.956𝑚3
151
Infiltration Each land use has a different infiltration, in the overview below the amounts of each land use are
given and described with an equation. Geoscience Technologies Inc. explains that the top soil for the lower elevation in Danao is primarily clay loam (Geoscience Technologies Inc., 2013). Furthermore,
Geoscience Technologies Inc. tells that it is fertile since it is organic in nature, and it can also retain a portion of water (Geoscience Technologies Inc., 2013). Literature studies from the University of Wageningen tell that Clay loam has a permeability (k) of 0,2216 metre a day (Alterra, University of
Wageningen, 2005). In the descriptions below the amount of permeability for each land use is described and elaborated with an equation.
ks - Permeability of the surface water
ks = 𝐴𝑟𝑒𝑎 𝑜𝑓 𝑠𝑢𝑟𝑓𝑎𝑐𝑒 𝑤𝑎𝑡𝑒𝑟 × (𝑘 ÷ 𝑛𝑎𝑡𝑢𝑟𝑎𝑙 𝑑𝑎𝑦 × 𝑟𝑎𝑖𝑛 𝑑𝑢𝑟𝑎𝑡𝑖𝑜𝑛) ks = 6.200𝑚3 × (0,2216𝑚/𝑑 ÷ 1440𝑚𝑖𝑛 × 100𝑚𝑖𝑛) = 95,41𝑚3
kg - Permeability of the grassland
kg = 𝐴𝑟𝑒𝑎 𝑜𝑓 𝑔𝑟𝑎𝑠𝑠𝑙𝑎𝑛𝑑 × (𝑘 ÷ 𝑛𝑎𝑡𝑢𝑟𝑎𝑙 𝑑𝑎𝑦 × 𝑟𝑎𝑖𝑛 𝑑𝑢𝑟𝑎𝑡𝑖𝑜𝑛) kg = 425.800𝑚3 × (0,2216𝑚/𝑑 ÷ 1440𝑚𝑖𝑛 × 100𝑚𝑖𝑛) = 6.552,59𝑚3
kv - Permeability of the vegetation / forest kv = 𝐴𝑟𝑒𝑎 𝑜𝑓 𝑣𝑒𝑔𝑒𝑡𝑎𝑡𝑖𝑜𝑛/𝑓𝑜𝑟𝑒𝑠𝑡 × (𝑘 ÷ 𝑛𝑎𝑡𝑢𝑟𝑎𝑙 𝑑𝑎𝑦 × 𝑟𝑎𝑖𝑛 𝑑𝑢𝑟𝑎𝑡𝑖𝑜𝑛)
kv = 159.800𝑚3 × (0,2216𝑚/𝑑 ÷ 1440𝑚𝑖𝑛 × 100𝑚𝑖𝑛) = 2.459,14𝑚3 𝑇𝑜𝑡𝑎𝑙 𝐼𝑛𝑓𝑖𝑙𝑡𝑟𝑎𝑡𝑖𝑜𝑛 = 95,41𝑚3 + 6.552,59𝑚2 + 2.459,14𝑚3 = 9.107,14𝑚3
152
Storage of land Each land use has a different storage capacity, in the overview below the amounts of each land use
are given and described with an equation. The forest has a higher storage capacity than grass land because it has more vegetation. That is also why the urban area has the lowest, because of the lag of
vegetation. Grass land - Storage capacity of 0,5mm Storage capacity = 𝐴𝑟𝑒𝑎 𝑜𝑓 𝑔𝑟𝑎𝑠𝑠 𝑙𝑎𝑛𝑑 × 𝑠𝑡𝑜𝑟𝑎𝑔𝑒 𝑐𝑎𝑝𝑎𝑐𝑖𝑡𝑦 Storage capacity = 425.800𝑚3 × (0,5𝑚𝑚 ÷ 1000) = 212,9𝑚3
Vegetation / forest - Storage capacity of 2,5mm Storage capacity = 𝐴𝑟𝑒𝑎 𝑜𝑓 𝑣𝑒𝑔𝑒𝑡𝑎𝑡𝑖𝑜𝑛/𝑓𝑜𝑟𝑒𝑠𝑡 × 𝑠𝑡𝑜𝑟𝑎𝑔𝑒 𝑐𝑎𝑝𝑎𝑐𝑖𝑡𝑦 Storage capacity = 159.800𝑚3 × (2,5𝑚𝑚 ÷ 1000) = 399,5𝑚3
Urban area - Storage capacity of 0,1mm
Storage capacity = 𝐴𝑟𝑒𝑎 𝑜𝑓 𝑢𝑟𝑏𝑎𝑛 𝑎𝑟𝑒𝑎 × 𝑠𝑡𝑜𝑟𝑎𝑔𝑒 𝑐𝑎𝑝𝑎𝑐𝑖𝑡𝑦 Storage capacity = 347.800𝑚3 × (0,1𝑚𝑚 ÷ 1000) = 34,78𝑚3
𝑇𝑜𝑡𝑎𝑙 𝑆𝑡𝑜𝑟𝑎𝑔𝑒 𝑐𝑎𝑝𝑎𝑐𝑖𝑡𝑦 = 212,9𝑚3 + 399,5𝑚3 + 34,78𝑚3 = 647,18𝑚3
Qinflow
The Qinflow is the inflow from the Tangon River into the river branch. To create a flow which will flush the river branch a flow of 0,11m/s is created. With this flow the river branch will be filled 1/9
th of
the total volume. This will create the storage for the rain shower that occurs once every 4 years. The discharge of the Qinflow will become 0,229167m3/s, see the equation below for elaboration.
𝑄 =𝑣
𝐴
𝑄 = 𝐷𝑖𝑠𝑐ℎ𝑎𝑟𝑔𝑒 > 𝑚3/𝑠 𝑣 = 𝑤𝑎𝑡𝑒𝑟 𝑓𝑙𝑜𝑤 > 𝑚/𝑠 𝐴 = 𝑆𝑢𝑟𝑓𝑎𝑐𝑒 𝑎𝑟𝑒𝑎 𝑜𝑓 𝑡ℎ𝑒 𝑐𝑟𝑜𝑠𝑠 𝑠𝑒𝑐𝑡𝑖𝑜𝑛 > 𝑚2
𝑄 = 0,11𝑚/𝑠 ÷ 0,48𝑚2 = 0,229167𝑚3/𝑠 During the rain shower that occurs once every 4 years the Qinflow will remain the same. This mean that the total of volume entering the water system in 100 minutes during the rain shower is: 𝑄𝑖𝑛𝑓𝑙𝑜𝑤 = 𝑄 × 60𝑠 × 100𝑚𝑖𝑛 𝑄𝑖𝑛𝑓𝑙𝑜𝑤 = 0,229167𝑚3/𝑠 × 60𝑠 × 100𝑚𝑖𝑛 = 1.375𝑚3/100𝑚𝑖𝑛
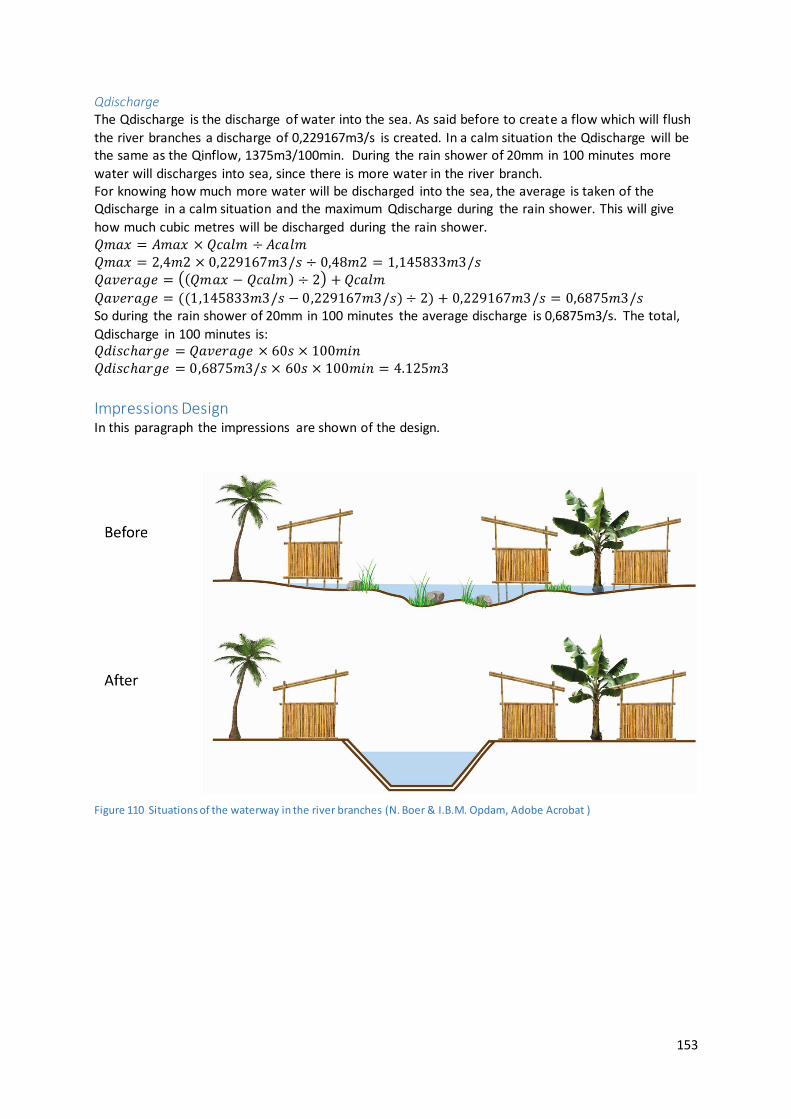
153
Qdischarge The Qdischarge is the discharge of water into the sea. As said before to create a flow which will flush
the river branches a discharge of 0,229167m3/s is created. In a calm situation the Qdischarge will be the same as the Qinflow, 1375m3/100min. During the rain shower of 20mm in 100 minutes more
water will discharges into sea, since there is more water in the river branch. For knowing how much more water will be discharged into the sea, the average is taken of the Qdischarge in a calm situation and the maximum Qdischarge during the rain shower. This will give
how much cubic metres will be discharged during the rain shower. 𝑄𝑚𝑎𝑥 = 𝐴𝑚𝑎𝑥 × 𝑄𝑐𝑎𝑙𝑚 ÷ 𝐴𝑐𝑎𝑙𝑚 𝑄𝑚𝑎𝑥 = 2,4𝑚2 × 0,229167𝑚3/𝑠 ÷ 0,48𝑚2 = 1,145833𝑚3/𝑠 𝑄𝑎𝑣𝑒𝑟𝑎𝑔𝑒 = ((𝑄𝑚𝑎𝑥 − 𝑄𝑐𝑎𝑙𝑚) ÷ 2) + 𝑄𝑐𝑎𝑙𝑚
𝑄𝑎𝑣𝑒𝑟𝑎𝑔𝑒 = ((1,145833𝑚3/𝑠 − 0,229167𝑚3/𝑠) ÷ 2) + 0,229167𝑚3/𝑠 = 0,6875𝑚3/𝑠 So during the rain shower of 20mm in 100 minutes the average discharge is 0,6875m3/s. The total,
Qdischarge in 100 minutes is: 𝑄𝑑𝑖𝑠𝑐ℎ𝑎𝑟𝑔𝑒 = 𝑄𝑎𝑣𝑒𝑟𝑎𝑔𝑒 × 60𝑠 × 100𝑚𝑖𝑛 𝑄𝑑𝑖𝑠𝑐ℎ𝑎𝑟𝑔𝑒 = 0,6875𝑚3/𝑠 × 60𝑠 × 100𝑚𝑖𝑛 = 4.125𝑚3
Impressions Design In this paragraph the impressions are shown of the design.
Figure 110 Situations of the waterway in the river branches (N. Boer & I.B.M. Opdam, Adobe Acrobat )
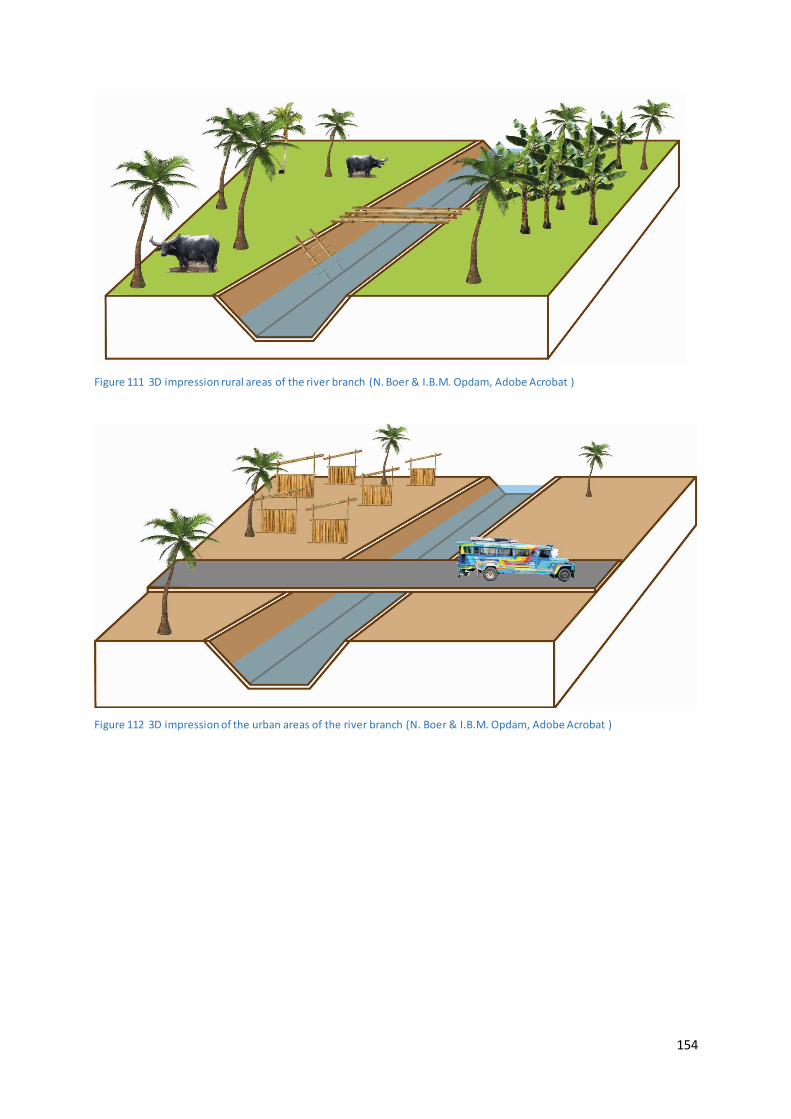
154
Figure 111 3D impression rural areas of the river branch (N. Boer & I.B.M. Opdam, Adobe Acrobat )
Figure 112 3D impression of the urban areas of the river branch (N. Boer & I.B.M. Opdam, Adobe Acrobat )
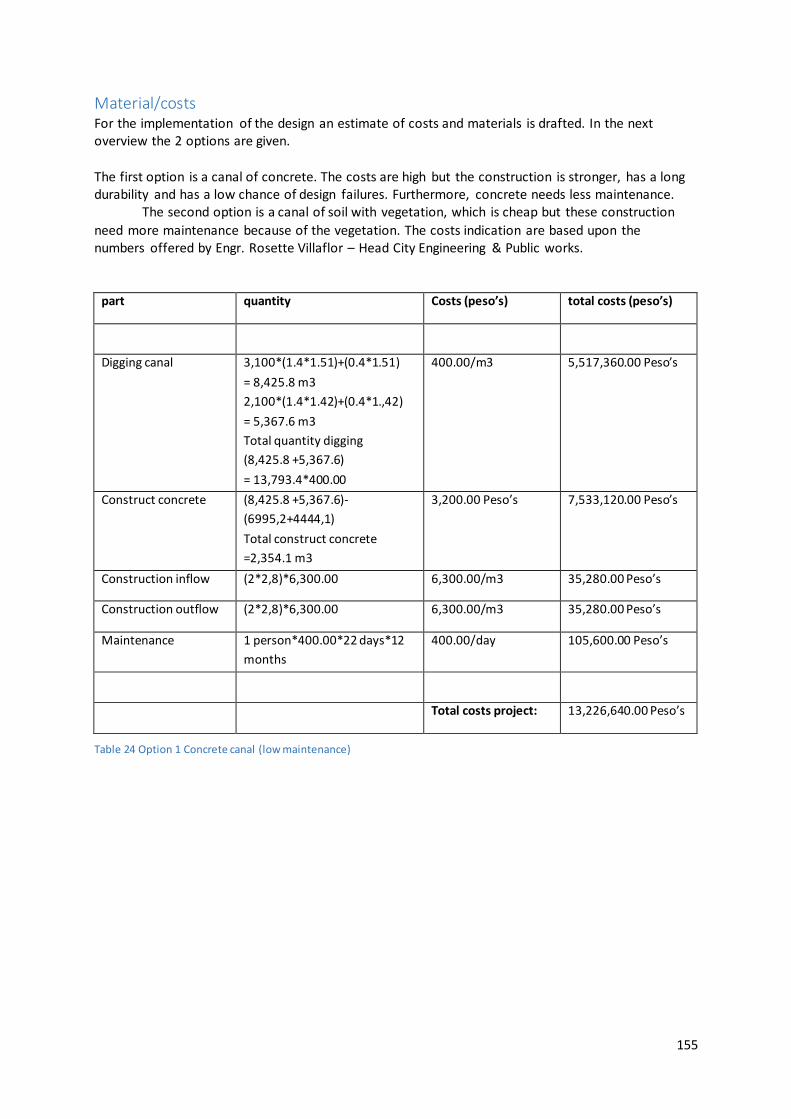
155
Material/costs For the implementation of the design an estimate of costs and materials is drafted. In the next overview the 2 options are given.
The first option is a canal of concrete. The costs are high but the construction is stronger, has a long durability and has a low chance of design failures. Furthermore, concrete needs less maintenance.
The second option is a canal of soil with vegetation, which is cheap but these construction
need more maintenance because of the vegetation. The costs indication are based upon the numbers offered by Engr. Rosette Villaflor – Head City Engineering & Public works.
part quantity Costs (peso’s) total costs (peso’s)
Digging canal 3,100*(1.4*1.51)+(0.4*1.51)
= 8,425.8 m3
2,100*(1.4*1.42)+(0.4*1.,42)
= 5,367.6 m3
Total quantity digging
(8,425.8 +5,367.6)
= 13,793.4*400.00
400.00/m3 5,517,360.00 Peso’s
Construct concrete (8,425.8 +5,367.6)-
(6995,2+4444,1)
Total construct concrete
=2,354.1 m3
3,200.00 Peso’s 7,533,120.00 Peso’s
Construction inflow (2*2,8)*6,300.00 6,300.00/m3 35,280.00 Peso’s
Construction outflow (2*2,8)*6,300.00 6,300.00/m3 35,280.00 Peso’s
Maintenance 1 person*400.00*22 days*12
months
400.00/day 105,600.00 Peso’s
Total costs project: 13,226,640.00 Peso’s
Table 24 Option 1 Concrete canal (low maintenance)
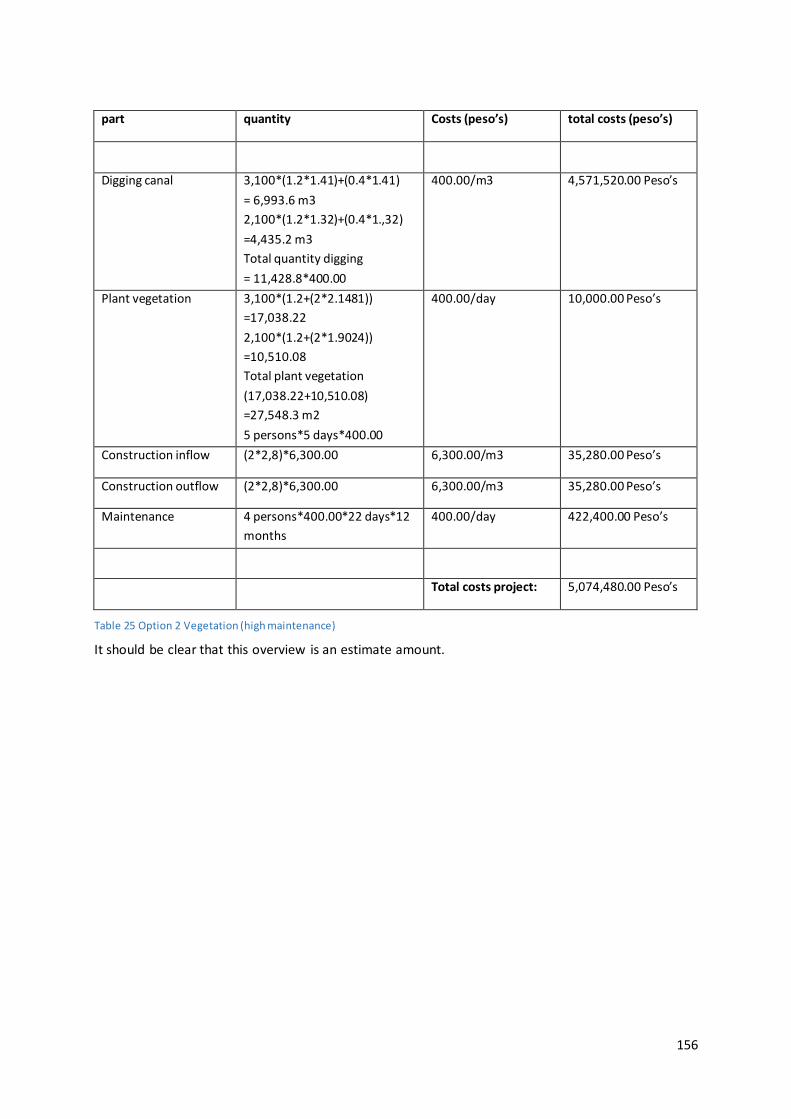
156
part quantity Costs (peso’s) total costs (peso’s)
Digging canal 3,100*(1.2*1.41)+(0.4*1.41)
= 6,993.6 m3
2,100*(1.2*1.32)+(0.4*1.,32)
=4,435.2 m3
Total quantity digging
= 11,428.8*400.00
400.00/m3 4,571,520.00 Peso’s
Plant vegetation 3,100*(1.2+(2*2.1481))
=17,038.22
2,100*(1.2+(2*1.9024))
=10,510.08
Total plant vegetation
(17,038.22+10,510.08)
=27,548.3 m2
5 persons*5 days*400.00
400.00/day 10,000.00 Peso’s
Construction inflow (2*2,8)*6,300.00 6,300.00/m3 35,280.00 Peso’s
Construction outflow (2*2,8)*6,300.00 6,300.00/m3 35,280.00 Peso’s
Maintenance 4 persons*400.00*22 days*12
months
400.00/day 422,400.00 Peso’s
Total costs project: 5,074,480.00 Peso’s
Table 25 Option 2 Vegetation (high maintenance)
It should be clear that this overview is an estimate amount.
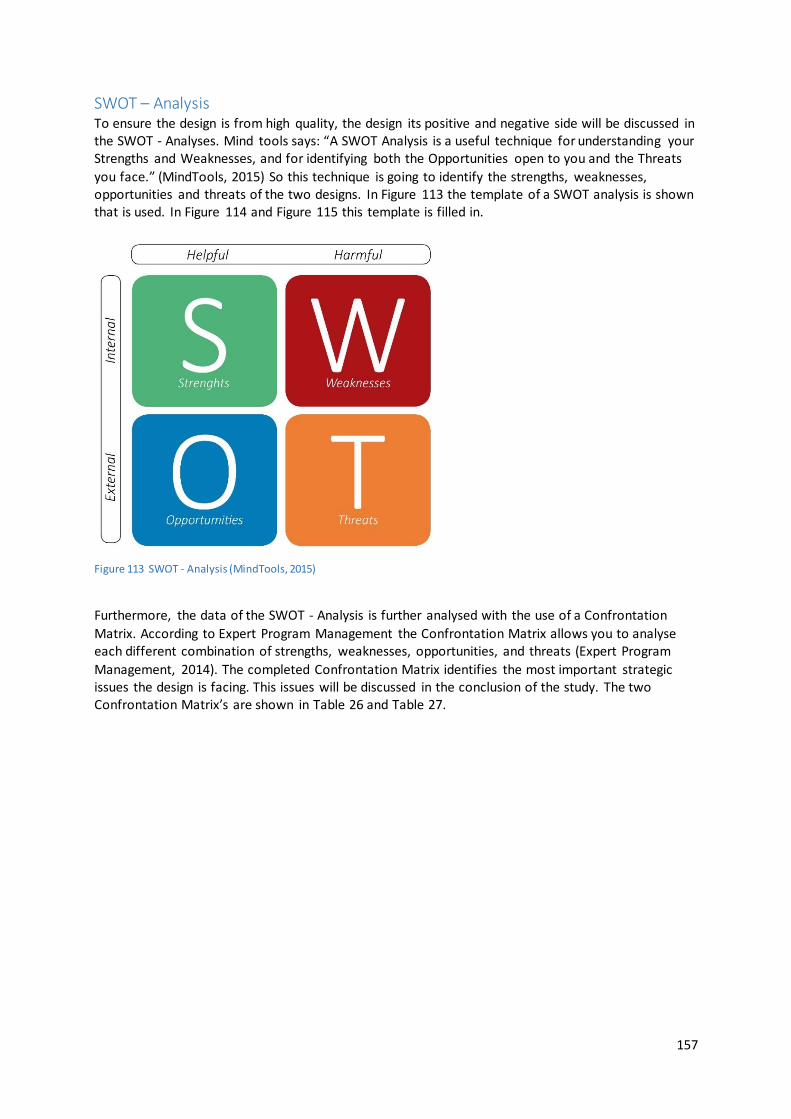
157
SWOT – Analysis To ensure the design is from high quality, the design its positive and negative side will be discussed in the SWOT - Analyses. Mind tools says: “A SWOT Analysis is a useful technique for understanding your Strengths and Weaknesses, and for identifying both the Opportunities open to you and the Threats
you face.” (MindTools, 2015) So this technique is going to identify the strengths, weaknesses, opportunities and threats of the two designs. In Figure 113 the template of a SWOT analysis is shown that is used. In Figure 114 and Figure 115 this template is filled in.
Figure 113 SWOT - Analysis (MindTools, 2015)
Furthermore, the data of the SWOT - Analysis is further analysed with the use of a Confrontation
Matrix. According to Expert Program Management the Confrontation Matrix allows you to analyse each different combination of strengths, weaknesses, opportunities, and threats (Expert Program
Management, 2014). The completed Confrontation Matrix identifies the most important strategic issues the design is facing. This issues will be discussed in the conclusion of the study. The two Confrontation Matrix’s are shown in Table 26 and Table 27.
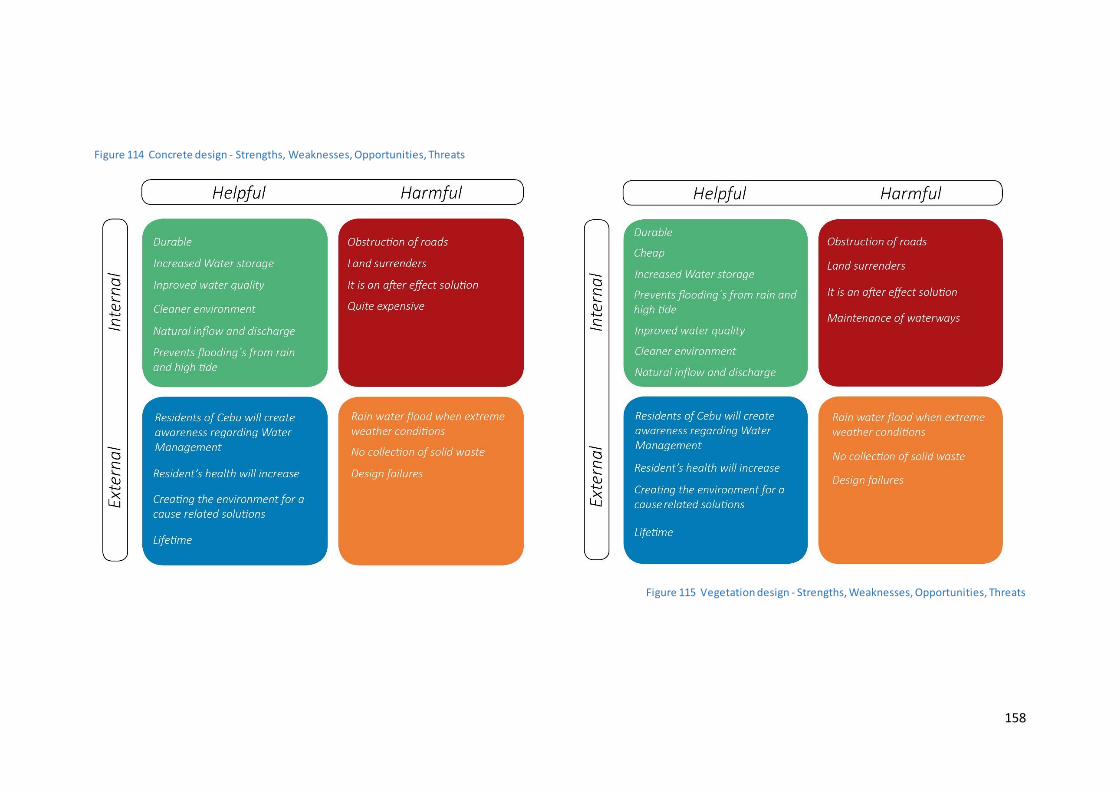
158
Figure 114 Concrete design - Strengths, Weaknesses, Opportunities, Threats
Figure 115 Vegetation design - Strengths, Weaknesses, Opportunities, Threats
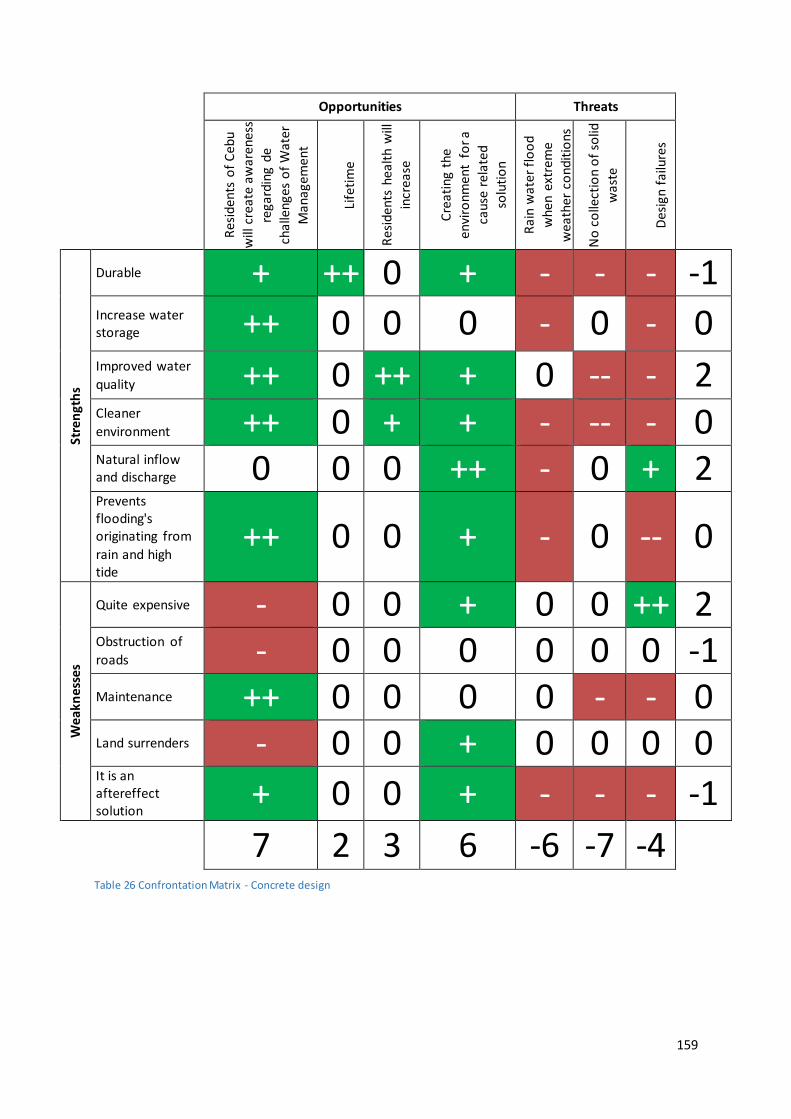
159
Opportunities Threats
R
esid
ents
of
Ceb
u
will
cre
ate
aw
aren
ess
reg
ardi
ng d
e
chal
len
ges
of
Wat
er
Man
agem
ent
Life
tim
e
Res
iden
ts h
ealt
h w
ill
incr
ease
Cre
ati
ng t
he
envi
ronm
ent
for
a
caus
e re
late
d
solu
tio
n
Rai
n w
ater
flo
od
whe
n e
xtre
me
wea
ther
co
ndit
ions
No
co
llect
ion
of
solid
was
te
Des
ign
failu
res
Stre
ngt
hs
Durable + ++ 0 + - - - -1 Increase water storage ++ 0 0 0 - 0 - 0 Improved water
quality ++ 0 ++ + 0 -- - 2 Cleaner
environment ++ 0 + + - -- - 0 Natural inflow and discharge 0 0 0 ++ - 0 + 2 Prevents flooding's originating from
rain and high tide
++ 0 0 + - 0 -- 0
Wea
knes
ses
Quite expensive - 0 0 + 0 0 ++ 2 Obstruction of
roads - 0 0 0 0 0 0 -1 Maintenance ++ 0 0 0 0 - - 0 Land surrenders - 0 0 + 0 0 0 0 It is an aftereffect solution
+ 0 0 + - - - -1
7 2 3 6 -6 -7 -4 Table 26 Confrontation Matrix - Concrete design
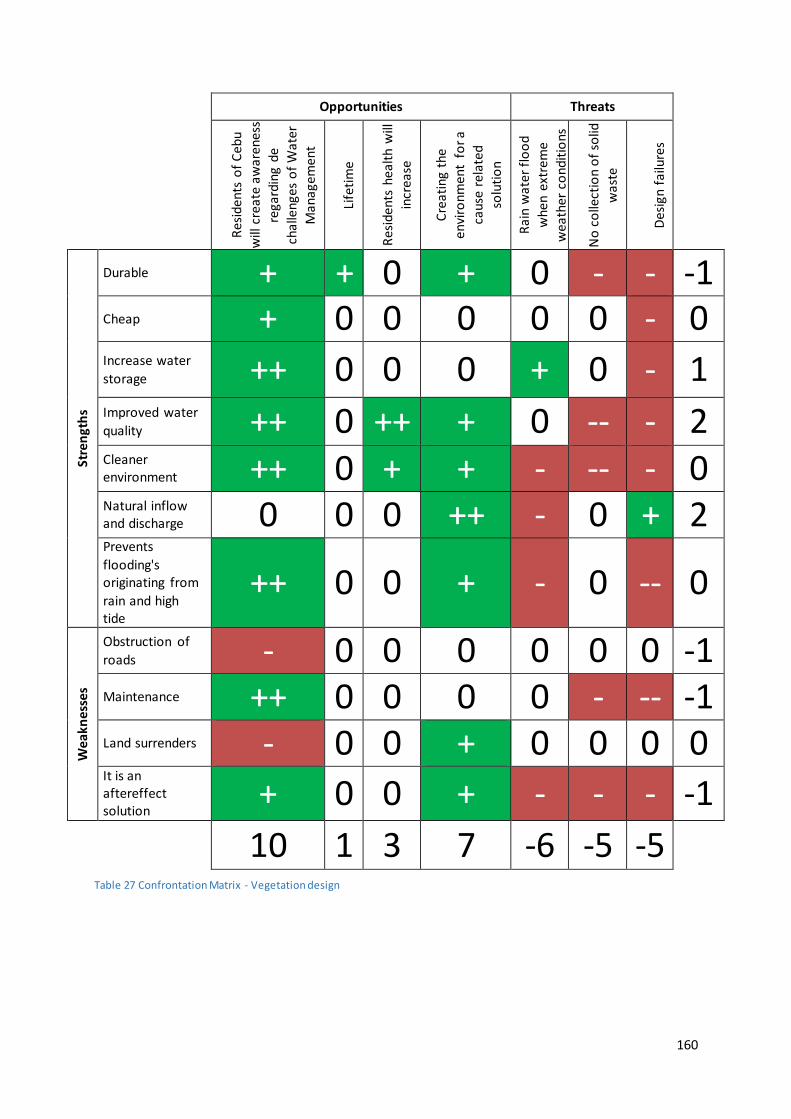
160
Opportunities Threats
R
esid
ents
of
Ceb
u
will
cre
ate
aw
aren
ess
reg
ardi
ng d
e
chal
len
ges
of
Wat
er
Man
agem
ent
Life
tim
e
Res
iden
ts h
ealt
h w
ill
incr
ease
Cre
ati
ng t
he
envi
ronm
ent
for
a
caus
e r
elat
ed
solu
tio
n
Rai
n w
ater
flo
od
whe
n e
xtre
me
wea
ther
co
ndit
ions
No
co
llect
ion
of
solid
was
te
Des
ign
failu
res
Stre
ngt
hs
Durable + + 0 + 0 - - -1 Cheap + 0 0 0 0 0 - 0 Increase water
storage ++ 0 0 0 + 0 - 1 Improved water
quality ++ 0 ++ + 0 -- - 2 Cleaner environment ++ 0 + + - -- - 0 Natural inflow and discharge 0 0 0 ++ - 0 + 2 Prevents
flooding's originating from
rain and high tide
++ 0 0 + - 0 -- 0
Wea
knes
ses
Obstruction of
roads - 0 0 0 0 0 0 -1 Maintenance ++ 0 0 0 0 - -- -1 Land surrenders - 0 0 + 0 0 0 0 It is an aftereffect solution
+ 0 0 + - - - -1
10 1 3 7 -6 -5 -5 Table 27 Confrontation Matrix - Vegetation design

161
Result & discussion Confrontation Matrix In the Confrontation Matrix’s the vegetation design reaches the residents of Cebu and creates more
awareness regarding de challenges of Water Management because it is cheap it will address more residents. Furthermore, since soil is uses there is a higher danger for design failures than a concrete
waterway. This design also needs a lot more maintenance which brings along new risks. In the Confrontation Matrix’s the concrete design is more expensive but is very strong and that is
why there is less chance of design failures. Furthermore, the concrete design will create an environment for a cause related solution. Also this design has a longer lifetime since vegetation is
easier damaged. Eventually the expensive concrete has a higher result in combination than the cheap vegetation.
The following combinations have to be reckoned with for a success of both designs: When implementing this design the water storage will increase, this causes the reduce of the
consequences of heavy rainfall.
When people see the design residents will create more awareness regarding water quality and preventing floods, alluring them to create a mind-set for a cleaner environment.
The people do not have to regulate the water flow since the dam will create the right amount of flow. The only maintenance that is needed is the collection of solid waste and maintaining the waterway.
The biggest opportunity is the creation of a much healthier environment. Diseases will be less likely
to occur since the water quality is majorly improved. The biggest weakness is the obstruction of roads. There are a few intersections in the design
between rivers and roads that need construction for the waterways to be connected that the residents will experience as annoying.
Another weakness is that the design is an aftereffect solution, this means that the solution solves the symptoms of the problem.
One of the best strengths on the other hand is that the concrete design will create an environment for a cause related solution. A cause related solution would be a place where waste no longer ends
up in the waterways.
162
Conclusion This chapter will answer the sub question: ”What design contributes in increasing the water storage and improving of the river’s water quality?” By using the wishes and requirements shown in the stakeholder analysis a program of requirements
is drafted. In combination with the water system analysis a final solution is designed. By creating a canal with the next dimensions; a wide of 2 metres and a dept. of 1,41 or 1,32, a water storage of 11.439,3 m3 can be realized. This will be enough to flush the water system to protect the
residents of pollution. By flushing the water system stench and diseases of the river water are no longer a problem. To discharge a small amount of river water out of the main stream of the Tangon
River, a flow with enough strengths to flush the system will be created. Beside that there is enough storage in the canal to store 10.295,37m3 rainwater during extreme rainfall. Flooding’s during extreme weather are no longer possible.
To collect all floating garbage in the river system a garbage collector is designed at the end of the river branches. Cleaner water will discharged to the sea. To prevent the river area of the incoming sea during high tide, two valves are designed. These valves will close if the pressure of the sea is
bigger than the pressure of the river. For this project two different options are made. Option one is a solution with a concrete canal. This
option is needs an estimate budget of 13,226,640.00 Peso’s. this option needs a high budget but it is more powerful and has a longer durability. Beside that there is barely maintenance needed. The other option is a cheaper one, this solution is a canal of soil with vegetation. This option is much
cheaper but needs more maintenance because of the vegetation. This option needs an estimate budget of 5,074,470.00 Peso’s. This option can be a good alternative by a lower available budget.
163
Bibliography Alterra, University of Wageningen. (2005). De doorlatendheid van de bodem voor
infiltratiedoeleinden. Retrieved from Library.wur: http://library.wur.nl/WebQuery/wurpubs/fulltext/29252
Cebu Daily News. (2013, July 17). Flood sweep Danao City Brgys, displace 30 families. Cebu Daily News. Retrieved from newsinfo.inquire.net/446629/floods-danao-brgys-displace-30-families
Department of Environment & Natural Resources. (2014). The Philippine Clean Water Act.
Department of Environment & Natural Resources, Environment Management Bureau Region 7, Cebu City. Retrieved 9 2, 2016, from http://119.92.161.2/embgovph/r07/WQMA.aspx
Esri. (2016). ArcGIS. Retrieved from GIS online map making: https://www.arcgis.com/home/webmap/viewer.html
Expert Program Management. (2014, December 4). The Confrontation Matrix. Retrieved from Expert
Program Management: http://www.expertprogrammanagement.com/2011/08/the-confrontation-matrix/
Geoscience Technologies Inc. (2013, March 24). Soil Mechanics. Retrieved from Copy of Soil:
https://prezi.com/dtksnk51dajl/copy-of-soil/ geoview. (2016, 9 2). geoview. Retrieved from geoview:
http://ph.geoview.info/kinalumsan_river,1708717 Google. (2016). Google Earth. Retrieved from Google Maps: https://www.google.com/maps greedypeg. (2015, June 15). Greedypeg. Retrieved from Greedypeg:
http://greedypeg.org/cebu/Guadalupe-River.html inquirernews. (2011). 18 firms to clean up Butuanon River. inquirernews, Mandaue city, Cebu, Cebu,
Philippines. Kitakyushu Initiative Network Cities. (n.d.). River Improvement Project in Cebu City . Retrieved from
http://kitakyushu.iges.or.jp/docs/demo/cebu_philippines/report.pdf
Lao, E. (2016, September 6). City Counselor of Danao. (I. I. Opdam, & N. N. Boer, Interviewers) Lao, E. (2016, September 6). City Counselor of Danao. (I. Opdam, & N. Boer, Interviewers) MindTools. (2015, December 31). SWOT analysis. Retrieved from MindTools:
https://www.mindtools.com/pages/article/newTMC_05.htm N. Boer, N., & I.B.M. Opdam, I. (2016, October 20). Field research. Surroundings Danao City, Cebu,
Philippines. N. Boer, N., & I.B.M. Opdam, I. (2016). Photography. Photographs. Presidential Commision for the
Urban Poor, Cebu.
N. Boer, N., & I.B.M. Opdam, I. (n.d.). Adobe Acrobat . Adobe InDesign & Illustrator. Presidential Commission for the Urban Poor, Cebu City.
Nationwide Operational Assessment of Hazards. (2016). Flood Hazard Danao. Danao, Cebu,
Philippines. Retrieved from http://noah.dost.gov.ph/#/section/geoserver/flood100 newsinfo. (2010). newsinfo.inquirer. Retrieved from
http://newsinfo.inquirer.net/breakingnews/nation/view/20100925-294232/Sewerage-system-for-Met
OpenStreetMap. (2016). OpenStreetMap. Retrieved from OpenStreetMap:
https://www.openstreetmap.org/ Philstar. (2013). Philstar. Retrieved from http://www.philstar.com:8080/cebu-
news/2013/07/17/980341/heavy-rains-not-waterspout-hit-danao
Sunstar. (2015, June 04). Butuanon ‘worst river in the Philippines'. Sunstar, p. 1. Retrieved from http://www.sunstar.com.ph/cebu/local-news/2015/06/04/butuanon-worst-river-phils-
411231


