Embed Size (px)
Citation preview
Individual differences in auditory abilitiesGary R. Kidd, Charles S. Watson, and Brian GygiDepartment of Speech and Hearing Sciences, Indiana University, Bloomington, Indiana 47405
�Received 30 June 2006; revised 13 January 2007; accepted 7 April 2007�
Performance on 19 auditory discrimination and identification tasks was measured for 340 listenerswith normal hearing. Test stimuli included single tones, sequences of tones, amplitude-modulatedand rippled noise, temporal gaps, speech, and environmental sounds. Principal components analysisand structural equation modeling of the data support the existence of a general auditory ability andfour specific auditory abilities. The specific abilities are �1� loudness and duration �overall energy�discrimination; �2� sensitivity to temporal envelope variation; �3� identification of highly familiarsounds �speech and nonspeech�; and �4� discrimination of unfamiliar simple and complex spectraland temporal patterns. Examination of Scholastic Aptitude Test �SAT� scores for a large subset ofthe population revealed little or no association between general or specific auditory abilities andgeneral intellectual ability. The findings provide a basis for research to further specify the nature ofthe auditory abilities. Of particular interest are results suggestive of a familiar sound recognition�FSR� ability, apparently specialized for sound recognition on the basis of limited or distortedinformation. This FSR ability is independent of normal variation in both spectral-temporal acuityand of general intellectual ability. © 2007 Acoustical Society of America.�DOI: 10.1121/1.2743154�
PACS number�s�: 43.66.Fe, 43.66.Mk, 43.71.Es �MSS� Pages: 418–435
I. INTRODUCTION
The study of individual differences has a long history inpsychology, most notably in the area of mental or cognitiveabilities �e.g., Cattell, 1885; Galton, 1869, 1883; Binet, 1903;Thurstone, 1938; Carroll, 1993�. Rather than simply docu-menting the range of abilities on various tasks, a primarygoal of the subfield of differential psychology has been toidentify the independent dimensions on which individualsvary. The identification of such dimensions, often termedabilities, has been a crucial component in the development oftheories of intelligence and cognition. The nature of theseabilities, and the extent to which they are utilized in differentcognitive tasks, has been investigated with a wide range oftests �e.g., Sternberg, 1977; Hunt, 1978; Carroll, 1993�. Insome cases, experimental manipulations have both validatedand further elucidated the nature and significance of specificabilities �e.g., Snow and Lohman, 1988�.
The present study applies the individual differences ap-proach to the study of auditory abilities. The goal was toidentify the number and nature of distinct auditory abilitiesthat underlie performance on a broad range of auditory dis-crimination and recognition tasks. The potential usefulnessof such a determination is illustrated by the hypothesis thatproblems with speech recognition are a consequence of lim-ited temporal �or spectral� processing ability. Rather than testthis hypothesis by comparing speech recognition perfor-mance to performance on some single test of temporal reso-lution, a more valid approach would ask whether speech testsin general correlate strongly with a variety of different tem-poral and spectral processing measures. An extension of thisapproach would determine the relative contributions of each
of several independent auditory abilities �assuming that such418 J. Acoust. Soc. Am. 122 �1�, July 2007 0001-4966/2007/1
Downloaded 28 Jun 2013 to 128.243.253.115. Redistribution sub
abilities do exist� to performance on speech recognitiontasks. That strategy is employed in the research reported inthis article.
“Auditory ability” is an abstract concept, comparable togeneral intelligence or physical strength. It is often a practi-cal convenience to characterize individuals as more or lessintelligent or strong, despite the uncertain referents of thoseconcepts or intervening variables �MacCorquodale andMeehl, 1948�. The validity of intervening variables dependson two properties, the first of which is the existence of agroup of different measures �behavioral or psychophysicaltests in the case of auditory abilities�, all of which are sig-nificantly correlated with each other. The second property,which can elevate an intervening variable’s status from astatistical inference to something more substantial, is a dem-onstrated neurophysiological correlate of those psychophysi-cal measures, such as the rate of neural transmission, lengthof the cochlea, or volume of neural tissue in one of the au-ditory areas of the CNS. If multiple psychophysical measuresof an ability are reliably demonstrated, there is a strong like-lihood that a neural correlate will eventually be discovered.The work reported here addresses the first of these propertiesby using principal components analysis and structural equa-tion modeling to identify distinct auditory abilities that un-derlie performance on a wide range of auditory tests.
Despite a number of earlier efforts, there is only modestagreement about the number or nature of auditory abilities.An exception to this generalization is found in one basicability, auditory sensitivity as reflected in the audiogram. Ifpersons with clinically significant hearing loss are included,this is clearly a primary dimension on which individuals dif-fer and which predicts performance on many tasks, includingspeech recognition. This observation was made early in au-
ditory research and has been reflected in the development of© 2007 Acoustical Society of America22�1�/418/18/$23.00
ject to ASA license or copyright; see http://asadl.org/terms
the Articulation Index �French and Steinberg, 1947� and inmore recent derivatives of that index �Pavlovic, 1984; Hu-mes and Riker, 1992�. Other basic auditory abilities havealso been discussed, particularly ones that appear essentialfor tasks demanding resolution of complex stimuli, notablytemporal acuity �e.g., Hirsh, 1959; Green, 1971; Watson,2004� and spectral resolving power �e.g., Feth and O’Malley,1977; Moore and Glasberg, 1986�.
Auditory sensitivity is thus regarded as the major dimen-sion on which listeners differ, reflecting the severe conse-quences of variation in this ability, and the frequency withwhich it is diminished, particularly in old age. Loss or de-velopmental impairment of other auditory abilities, such astemporal or spectral resolving power, has also been postu-lated as the cause of disorders such as delayed language de-velopment or dyslexia �e.g., Tallal et al., 1993�. No specificmeasures of these abilities have, however, achieved the ca-nonical status of the pure-tone audiogram as the measure ofsensitivity.
The identification of basic auditory abilities using apurely psychophysical methodology requires the testing of alarge number of people on a large number of auditory tests.The size requirements are dictated by well-established prin-ciples relating test reliability, intertest correlations, and theexpected range of performance �see, for example, Gorsuch,1983�. The set of auditory tests must be sufficiently large thatit can be reasonably assumed to exceed the number of dis-crete auditory abilities and include multiple tests of eachability.
Application of factor analysis, or principal componentsanalysis, is a systematic method by which to identify subsetsof similar tasks that provide measures of a common under-lying ability. These techniques, originally developed bySpearman �1904�, have been widely employed in the searchfor primary mental abilities by Thurstone �1947� and manymore recent investigators. A limitation of this approach isthat the discrete abilities that can be identified depend on theselection of measures included in the test battery. This re-quirement has made it difficult to compare the results ofearlier factor analytic studies of auditory abilities, because ofonly moderate overlap among the tests that were employed.This is illustrated by the range of tests included in the Sea-shore battery �Seashore et al., 1939, 1960�, which includesmany tests of rhythm and of the perception of musical seg-ments that are not found in any of the other major studies,but it has only a few measures of basic auditory temporal orspectral discrimination abilities. Nevertheless, there has beensufficient commonality among the tests used in some of theearlier studies to suggest the existence of a few discrete pri-mary auditory abilities, as described in the following section.
A. Previous factor analytic studies of auditoryabilities
Factor analytic studies of auditory abilities conductedprior to the mid-1980s have been reviewed in an earlier ar-ticle �Johnson, Watson, and Jensen, 1987�. Ten such studiesused widely differing collections of auditory tests, method-ologies, and numbers and types of subjects, ranging from
high school sophomores �Elliott et al., 1966� to prison in-J. Acoust. Soc. Am., Vol. 122, No. 1, July 2007
Downloaded 28 Jun 2013 to 128.243.253.115. Redistribution sub
mates �Stankov and Horn, 1980�. While the variety of testsemployed makes it difficult to compare across the studies,most of the studies supported the existence of multiple audi-tory abilities. These included the abilities to discriminate dif-ferences in pitch, intensity, and duration, plus the higher-level ability of auditory memory. One of the earliest andmost complete of these studies was conducted by Karlin�1942�, a student of Thurstone. Karlin found that the abilityto recognize speech was surprisingly independent of the lis-teners’ spectral and temporal discrimination abilities.
More recently, in a remarkable survey of factor analyticstudies of human cognitive abilities, Carroll �1993� devotedone of 11 ability-specific chapters to “Abilities in the Do-main of Auditory Reception.” Carroll observed that, “Thedomain of individual differences in auditory receptive abili-ties has received relatively little attention in the factor ana-lytic literature.” Nevertheless, he was able to find 38 pub-lished datasets that provide some basis for establishing thestructure of the domain of auditory abilities. Carroll consid-ered only one of these sets to provide a reasonable statisticalaccount of individual differences in speech processing �Han-ley, 1956�. Carroll’s list of candidate factors included “hear-ing acuity” �auditory sensitivity measured with either tonesor speech�, “speech sound discrimination,” “spectral, tempo-ral and intensive discrimination,” “speech perception underdistortion,” “cognitive relations” �among tonal patterns�,“musicality,” and several others.
Watson et al. �1976� observed large ranges of perfor-mance in tonal pattern discrimination studies, spurring aninterest in individual differences. In an effort to learn moreabout individual listeners who showed exceptionally good orpoor ability to detect changes in these spectral-temporal pat-terns, the Test of Basic Auditory Capabilities �TBAC� wasdeveloped �Watson et al., 1982a, b�. This battery has sincebeen used in a number of investigations �e.g., Christophersonand Humes, 1992; B. Watson and Miller, 1993; Drennan andWatson, 2001; Surprenant and Watson, 2001; Jakobson et al.,2003�. The original TBAC included three single-tone dis-crimination tests, three tests of temporal pattern discrimina-tion, and two speech tests. �These are subtests 1 through 8 ofthe current test battery and are described below.� In the firstuse of the TBAC, 127 adults with normal hearing were testedin a free field. There was virtually no association betweenperformance on the nonspeech subtests and the two speechtests, supporting Karlin’s �1942� finding of a dissociation be-tween the recognition of “social sounds” and measures ofauditory acuity. Later, Surprenant and Watson �2001� con-ducted a replication of this study in which three additionalspeech tests �identification of sentences, words, and CVs�were added to the eight TBAC subtests. Analysis of the datafrom this extended battery showed three factors, one forspeech recognition, a second for nonspeech discriminationtests with both simple and complex stimuli, and a third fortemporal-order discrimination, supporting the earlier findingsof independence between performance with speech and non-speech stimuli.
Although spectral and temporal resolving power varysignificantly among normal-hearing adults, the average spec-
tral and temporal abilities of normal-hearing adults areKidd et al.: Auditory abilities 419
ject to ASA license or copyright; see http://asadl.org/terms
clearly more than sufficient for the demands of speech rec-ognition under quiet listening conditions. The lack of asso-ciation between speech and nonspeech tests in these studieswas not, however, due to a limited range of variation inspeech recognition or in spectral-temporal acuity. Surprenantand Watson �2001� found a range of speech-to-noise ratios ofabout 7.0 dB for 50% correct identification of words in CIDsentences �Davis and Silverman, 1970�, and threshold mea-sures for spectral and temporal discrimination differed byfactors of from 3 to 10 times. Failure of measures of dis-crimination acuity to predict performance in the identifica-tion of nonsense syllables, words, or sentences pointed tosome other ability as the source of the considerable range ofspeech recognition scores in noise. Another observation sug-gested that this hypothesized ability might be cognitiverather than auditory �more central than peripheral�. Watson etal. �1996� found a modest correlation �r=0.52, p�0.005,N=90� between speech recognition by ear alone and that byeye alone �speechreading�. While not a particularly strongassociation, this correlation is considerably larger than thatbetween speech recognition and any single measure of spec-tral or temporal acuity obtained with nonspeech stimuli.
While this correlational evidence might appear to sup-port arguments that speech recognition is “special” �i.e., ex-plained by a speech-specific mechanism not utilized in theperception of nonspeech stimuli�, the data are subject toother interpretations. In Surprenant and Watson �2001�, aswell as in virtually all prior factor analytic studies of audi-tory abilities, the speech tests differed from all of the non-speech tests in at least two ways, in addition to the apparentdifferences between speech and most laboratory-generatedstimuli. The first is that speech perception has been evaluatedwith recognition tests rather than with discrimination tests,placing quite different demands on the listeners. Discrimina-tion tests generally reward the strategy of learning to focuson a dimension or property that is subject to change, whilerecognition tests encourage attention to larger patterns ofspectral and temporal information. A second, more funda-mental, difference is that the speech of one’s native languageis an extremely familiar stimulus, while the nonspeechstimuli used in these studies are novel laboratory-generatedsounds. Most of a listener’s knowledge about the nonspeechstimuli is gained during a relatively brief period of testing.However, listeners have extensive explicit and tacit knowl-edge about the structure of speech sounds, including themany constraints �linguistic and physical� that govern thisclass of sounds. An individual’s ability to effectively use thisknowledge is likely a major factor accounting for differencesin speech recognition performance, especially in tests thatrequire listeners to identify speech stimuli that have beendegraded or masked by noise. Under these conditions, listen-ers who can use their knowledge to develop better attentionalstrategies �or better “guessing” strategies� might have an ad-vantage over others with equally acute spectral and temporalresolution.
B. Expanded test battery for the present project
Despite the support provided by Karlin �1942� and Sur-
prenant and Watson �2001� for the independence of the abili-420 J. Acoust. Soc. Am., Vol. 122, No. 1, July 2007
Downloaded 28 Jun 2013 to 128.243.253.115. Redistribution sub
ties to process speech and nonspeech sounds, there is ampleevidence in the literature that temporal and spectral acuityare necessary to distinguish among the sounds of speech�e.g., the long line of research with vocoders, begun by Dud-ley �1939��. Thus, persons with significantly worse than av-erage spectral or temporal acuity might reasonably be ex-pected to be correspondingly worse at recognizing speech. Itis a common assertion among audiologists that, although am-plification can return sensitivity to normal values, speechperception by the hearing impaired remains below that ofnonimpaired persons because their auditory resolving poweris inadequate. While this assertion may be true for personswith impaired hearing, it does not necessarily follow that thevariation in resolving power among those with normal sen-sitivity will predict their speech recognition abilities.
An obvious problem with the earlier studies is the lim-ited number of tests of spectral and temporal acuity, perhapsfailing to include other discrimination tests that would pre-dict speech recognition. Several spectral and temporal mea-sures were therefore added to yield an expanded TBAC bat-tery, including: �1� ripple-noise discrimination, a measure ofspectral resolution as a function of the depth of troughs in thefrequency spectrum �Yost et al., 1978�; �2� detection of am-plitude modulation in Gaussian noise, measured at differentmodulation rates �a measure of temporal resolution first stud-ied by Viemeister, 1979�; and �3� detection and discrimina-tion of temporal gaps, a test reported to be correlated withspeech recognition �e.g., Glasberg and Moore, 1989; Snell etal., 2002; Tyler et al., 1982�. The association between gapdetection and speech recognition is perhaps the most widelycited finding in support of a relation between nonspeech andspeech processing abilities. However, that association hasbeen observed only with older or hearing-impaired listeners,and some studies have failed to find it even with these popu-lations �e.g., Nelson, Nittrouer, and Norton, 1995; Strouse etal., 1998�. To some extent, the discrepancies may be due todifferences in the details of the tests used to assess non-speech and speech abilities �e.g., the duration and complexityof the stimulus in which a gap appears, the location of thegap, the type of speech stimuli and background noise�. Thepresent study assesses the relation between temporal process-ing and speech recognition in a large population of normal-hearing listeners, using several measures of temporal pro-cessing in addition to gap detection and gap discrimination,and several measures of speech recognition. The use of alarge population �N=340� was expected to provide a widerange of performance on all measures and allows for a moredefinitive assessment of the relation among speech and non-speech abilities.
An additional test was added to the battery to evaluatethe hypothesis suggested earlier, that the difference betweenperformance on speech and nonspeech tests is a consequenceof differences in the familiarity of the stimuli used in thesetests. For this purpose, a recognition test for familiar non-speech sounds was added to the battery. The stimuli wereenvironmental sounds produced by both animate and inani-mate sources �e.g., dogs barking, doors slamming, cars start-
ing�. These sounds were presented in Gaussian noise, follow-Kidd et al.: Auditory abilities
ject to ASA license or copyright; see http://asadl.org/terms
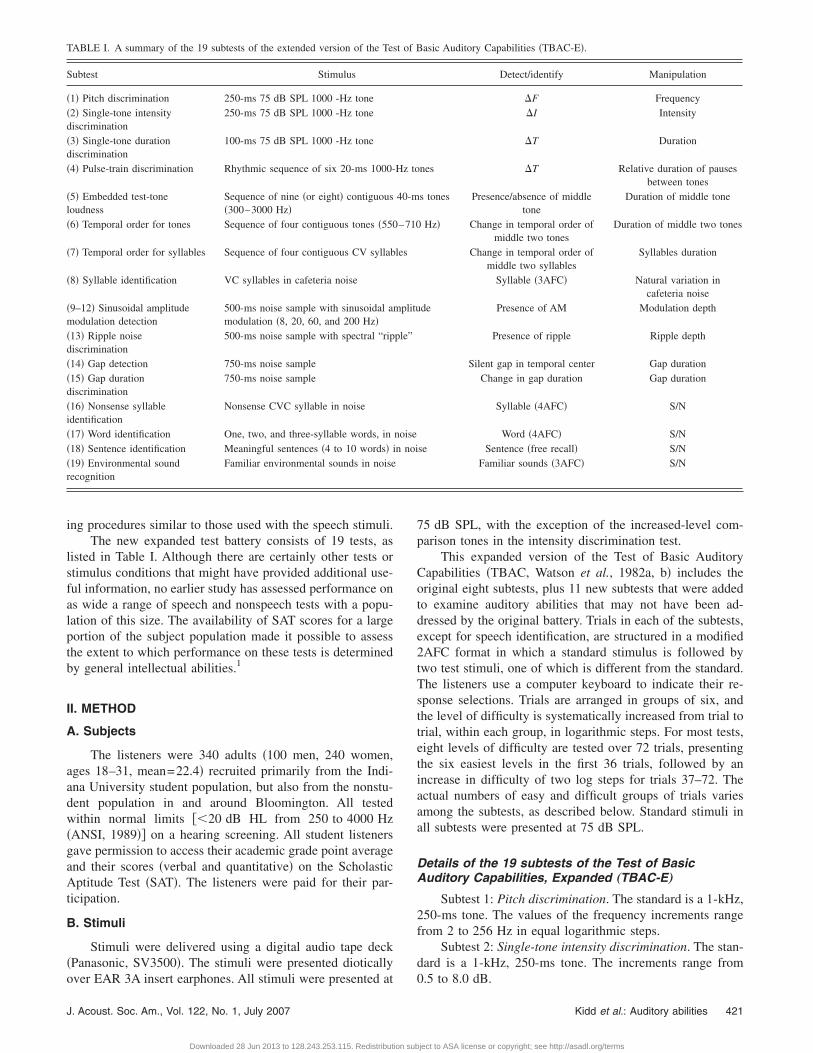
ing procedures similar to those used with the speech stimuli.The new expanded test battery consists of 19 tests, as
listed in Table I. Although there are certainly other tests orstimulus conditions that might have provided additional use-ful information, no earlier study has assessed performance onas wide a range of speech and nonspeech tests with a popu-lation of this size. The availability of SAT scores for a largeportion of the subject population made it possible to assessthe extent to which performance on these tests is determinedby general intellectual abilities.1
II. METHOD
A. Subjects
The listeners were 340 adults �100 men, 240 women,ages 18–31, mean=22.4� recruited primarily from the Indi-ana University student population, but also from the nonstu-dent population in and around Bloomington. All testedwithin normal limits ��20 dB HL from 250 to 4000 Hz�ANSI, 1989�� on a hearing screening. All student listenersgave permission to access their academic grade point averageand their scores �verbal and quantitative� on the ScholasticAptitude Test �SAT�. The listeners were paid for their par-ticipation.
B. Stimuli
Stimuli were delivered using a digital audio tape deck�Panasonic, SV3500�. The stimuli were presented diotically
TABLE I. A summary of the 19 subtests of the extended version of the Tes
Subtest Stimulus
�1� Pitch discrimination 250-ms 75 dB SPL 1000 -Hz tone�2� Single-tone intensitydiscrimination
250-ms 75 dB SPL 1000 -Hz tone
�3� Single-tone durationdiscrimination
100-ms 75 dB SPL 1000 -Hz tone
�4� Pulse-train discrimination Rhythmic sequence of six 20-ms 1000-
�5� Embedded test-toneloudness
Sequence of nine �or eight� contiguous�300–3000 Hz�
�6� Temporal order for tones Sequence of four contiguous tones �550
�7� Temporal order for syllables Sequence of four contiguous CV syllab
�8� Syllable identification VC syllables in cafeteria noise
�9–12� Sinusoidal amplitudemodulation detection
500-ms noise sample with sinusoidal ammodulation �8, 20, 60, and 200 Hz�
�13� Ripple noisediscrimination
500-ms noise sample with spectral “rip
�14� Gap detection 750-ms noise sample�15� Gap durationdiscrimination
750-ms noise sample
�16� Nonsense syllableidentification
Nonsense CVC syllable in noise
�17� Word identification One, two, and three-syllable words, in�18� Sentence identification Meaningful sentences �4 to 10 words� i�19� Environmental soundrecognition
Familiar environmental sounds in noise
over EAR 3A insert earphones. All stimuli were presented at
J. Acoust. Soc. Am., Vol. 122, No. 1, July 2007
Downloaded 28 Jun 2013 to 128.243.253.115. Redistribution sub
75 dB SPL, with the exception of the increased-level com-parison tones in the intensity discrimination test.
This expanded version of the Test of Basic AuditoryCapabilities �TBAC, Watson et al., 1982a, b� includes theoriginal eight subtests, plus 11 new subtests that were addedto examine auditory abilities that may not have been ad-dressed by the original battery. Trials in each of the subtests,except for speech identification, are structured in a modified2AFC format in which a standard stimulus is followed bytwo test stimuli, one of which is different from the standard.The listeners use a computer keyboard to indicate their re-sponse selections. Trials are arranged in groups of six, andthe level of difficulty is systematically increased from trial totrial, within each group, in logarithmic steps. For most tests,eight levels of difficulty are tested over 72 trials, presentingthe six easiest levels in the first 36 trials, followed by anincrease in difficulty of two log steps for trials 37–72. Theactual numbers of easy and difficult groups of trials variesamong the subtests, as described below. Standard stimuli inall subtests were presented at 75 dB SPL.
Details of the 19 subtests of the Test of BasicAuditory Capabilities, Expanded „TBAC-E…
Subtest 1: Pitch discrimination. The standard is a 1-kHz,250-ms tone. The values of the frequency increments rangefrom 2 to 256 Hz in equal logarithmic steps.
Subtest 2: Single-tone intensity discrimination. The stan-dard is a 1-kHz, 250-ms tone. The increments range from
asic Auditory Capabilities �TBAC-E�.
Detect/identify Manipulation
�F Frequency�I Intensity
�T Duration
nes �T Relative duration of pausesbetween tones
s tones Presence/absence of middletone
Duration of middle tone
Hz� Change in temporal order ofmiddle two tones
Duration of middle two tones
Change in temporal order ofmiddle two syllables
Syllables duration
Syllable �3AFC� Natural variation incafeteria noise
de Presence of AM Modulation depth
Presence of ripple Ripple depth
Silent gap in temporal center Gap durationChange in gap duration Gap duration
Syllable �4AFC� S/N
Word �4AFC� S/Nse Sentence �free recall� S/N
Familiar sounds �3AFC� S/N
t of B
Hz to
40-m
–710
les
plitu
ple”
noisen noi
0.5 to 8.0 dB.
Kidd et al.: Auditory abilities 421
ject to ASA license or copyright; see http://asadl.org/terms
Subtest 3: Single-tone duration discrimination. The stan-dard is a 1-kHz, 100-ms tone. Increments in duration rangefrom 8 to 256 ms in equal logarithmic steps.
Subtest 4: Pulse-train discrimination. The standardstimulus consists of six 20-ms pulses of a 1-kHz tone. Thesepulses are arranged in three pairs, with 40 ms of silence be-tween members of a pair and 120 ms between pairs. Thetemporal structure of the “different” sequence is varied byincreasing the separation between members of each pair,with a corresponding decrease in the between-pair time �and,thus, a constant interval between the first tones in each of thesuccessive pairs�. Increases in within-pair separation rangedfrom 5- to 50-ms increments, in equal logarithmic steps.Thus, the first, third, and fifth tones are fixed in time, whilethe onsets of the second, fourth, and sixth tones are delayedby varying amounts. This is a minimal test of the ability todetect changes in the relative timing of events in a repeatedtemporal sequence �i.e., rhythm�. However, it should benoted that, in principle, this test can be performed solely onthe basis of changes in absolute durations.
Subtest 5: Embedded test-tone loudness. Subjects listenfor one member of a sequence of nine tones with frequenciesranging from 300 to 3000 Hz. A different, randomly selectedseries of nine tones is presented on each trial. The task is todetect the presence of the fifth tone in the sequence. The toneis absent in the standard. The duration of all tones except thefifth, or target tone, is 40 ms. The test is made more difficultby reducing the duration of the target tone from200 to 10 ms, in equal logarithmic steps. The name of thistest derives from the listener’s experience. Only the durationof the target tone is directly manipulated.
Subtest 6: Temporal order for tones. The task is to dis-criminate the order in which two equal-duration tones �550and 710 Hz� are presented. The duration of the two tones isvaried from 20 to 200 ms in equi-log steps. The tones arepresented without a gap between them and are preceded andfollowed, without gaps, by 100-ms “leader” and “trailer”tones at 625 Hz.
Subtest 7: Temporal order for syllables. This is a speechanalog to subtest 6, in which the listener is to discriminatethe syllable sequence /ta/ka/ from /ka/ta/, when the two CVsyllables are preceded and followed by the syllables /fa/ and/pa/. The listener’s task is thus to discriminate /fa/-/ta/-/ka/-/pa/ from /fa/-/ka/-/ta/-/pa/, and subjects are told that only themiddle syllables vary. The duration of the syllables was var-ied from 75 to 250 ms in five steps.
Subtest 8: Syllable identification. This is a subset of theDubno and Levitt �1981� nonsense syllable test. NonsenseVC syllables are presented in cafeteria noise and a three-alternative forced-choice identification procedure is used.Syllables are presented in a carrier phrase �e.g., “You willmark oothe please”�. The original test was modified by re-ducing the number of alternatives on each trial to the correctresponse plus the two most likely errors, as shown in confu-sion matrices provided to us by the authors.
Subtests 9–12: Sinusoidal Amplitude Modulation (SAM)noise discrimination. Fifty-four independent 500-ms samplesof Gaussian noise are sinusoidally amplitude modulated at
four different rates: 8, 20, 60, and 200 Hz. For each AM rate,422 J. Acoust. Soc. Am., Vol. 122, No. 1, July 2007
Downloaded 28 Jun 2013 to 128.243.253.115. Redistribution sub
eight different modulation depths are used, ranging from−18 to −32 dB for the slowest modulation rate, to −10 to−24 dB for the fastest rate. �Modulation depth is here ex-pressed as 20 log�m�, where m is a modulation index thatranges from 0.0 to 1.0.� The modulated and unmodulatedstimuli are equated for total rms energy. The standard is al-ways a 500-ms broadband noise with no amplitude modula-tion, and one of the two test stimuli is modulated. Eachmodulation rate is tested in separate blocks of 54 trials, in theorder of increasing modulation rate. Each block consists offour 6-trial groups with the largest modulation depths, fol-lowed by five 6-trial groups with the smallest depths.
Subtest 13: Ripple noise discrimination. Seventy-two in-dependent 500-ms digital samples of Gaussian noise are low-pass filtered at 3000 Hz. Sinusoidal ripples are created in thepower spectrum by delaying the samples by 5 ms and addingthem to the input. Before adding, the delayed signal is at-tenuated by an amount ranging from 0 dB �maximum ripple�to 14 dB �slight ripple�, in seven 2-dB steps. The resultingeight “rippled” �i.e., spectrally modulated� noises are thenhigh-pass filtered at 300 Hz and are equated for rms. Thestandard is always a 500-ms broadband noise with the samebandpass filtering as the “rippled” samples, but with a uni-form power spectrum. One of the two comparison patterns isrippled. The test consists of 72 trials: six easier 6-trial groups�deep ripple: 0–10-dB attenuation� followed by six moredifficult 6-trial groups �shallower ripple: 4–14-dB attenua-tion�.
Subtest 14: Gap detection. Seventy-two independent750-ms digital samples of Gaussian noise have gaps of si-lence of eight different durations at their temporal centers.The gap durations range from 0.5 to 64 ms, in log steps,while the total durations remained constant. The noises have0.5-ms cosine ramps at the beginning and end of the silentintervals. The standard is always a 750-ms broadband noisethat has no gap in it. One of the two comparison stimulicontains a gap. The test consists of 72 trials: six easier 6-trialgroups �gaps ranging from 2 to 64 ms� followed by six moredifficult 6-trial groups �gaps from 0.5 to 16 ms�.
Subtest 15: Gap-duration discrimination. Seventy-twoindependent 750-ms digital samples of Gaussian noise havesilent gaps of 40 ms placed at their temporal centers. Incre-ments in gap duration range from 4 to 200 ms, in log steps.The total duration of the noise is kept constant while the gapduration increases, resulting in an increase in total durationwith increases in gap duration. The noise bursts have a0.5-ms cosine ramp at onset and offset. The standard is al-ways a 750-ms broadband noise with a 40-ms silent gap atits temporal center. One of the comparison patterns containsa larger gap �with total noise duration remaining constant�,while the other is identical to the standard. The test consistsof 72 trials: six easier 6-trial groups �gap increments rangingfrom 12 to 200 ms� followed by six more difficult 6-trialgroups �gap increments from 4 to 65 ms�.
Subtests 16–18: Speech tests. Equal speech and noiselevels for 0-dB speech-to-noise ratios were set by digitallyrecording at a peak VU-meter reading equal to that of theGaussian noise samples. Various speech-to-noise ratios were
achieved by attenuating the speech. Presentation levels wereKidd et al.: Auditory abilities
ject to ASA license or copyright; see http://asadl.org/terms
determined by setting a 1-kHz calibration tone, recordedwith the same rms value as the Gaussian noise, to 75 dBSPL. Talkers were two male and two female students in theDepartment of Theatre and Drama at Indiana University, allof whom were native speakers of Standard American English�Midwestern dialect�. Responses for all speech tests are re-corded either on paper response sheets or by using a com-puter keyboard and monitor. In either case, the response al-ternatives are presented on each trial for the nonsense-syllable and word tests, while the sentence test is given inopen-set format.
For all speech tests, the speech-to-noise �S/N� ratioswere adjusted after the first 146 subjects had been tested andestimates of psychometric functions were examined. �Origi-nal and adjusted values are provided for each test below.�The new S/N values were selected to minimize testing atvalues that produce near-chance or near-perfect performanceand to provide equal increments in percent correct betweeneach step. New S/N values were interpolated from the psy-chometric functions, for values of percent correct from 40%�15 percentage points above chance� to 90% in steps of 12.5percentage points. For the sentence identification test �whichused an open-ended response protocol�, S/N values were in-terpolated for percent-correct values from 20% to 90% insteps of 17.5 percentage points. The resulting S/N values foreach subtest are given below.
Subtest 16: Nonsense syllable identification. A set of 100nonsense CVC syllables uses all of the standard English con-sonants and vowels in random combinations. The stimuli aremixed with broadband Gaussian noise at five speech-to-noiseratios �initial values: −3, −7, −11, −15, −19 dB; adjustedvalues: −0.4, −5.1, −8.4, −11.5, −15.4 dB�. A four-alternative forced-choice procedure is used. Three foils �in-correct CVCs� for each of the stimuli were generated bychanging either the initial consonant, the vowel, or the finalconsonant �one for each foil�. The response options are pre-sented, and listeners are asked to indicate the sound that waspresented on each trial. Listeners are given 3 s to indicatetheir response. The set of 100 stimuli is presented twice inseparate blocks of trials using two different random orders.Stimuli are presented with decreasing S/N values within eachgroup of five trials.
Subtest 17: Word identification. The set of 100 stimuliconsisted of 60 one-syllable, 25 two-syllable, and 15 three-syllable words. The stimuli were mixed with broadbandGaussian noise at five speech-to-noise ratios �initial values:−3, −7, −11, −15, −19 dB; adjusted values: −2.9, −7.8,−11.1, −14.4, −18.3 dB�. The method was the same as thatfor nonsense syllables, except for a slightly different strategyfor generating foils. Three foils were generated by modifyingthe beginning, middle, or ending portion of each word �onefor each foil�. To accommodate the constraints of Englishwords with different numbers of syllables, it was necessaryfor the modified portion to range from single consonants orvowels to full syllables.
Subtest 18: Sentence identification. A set of 40 sentenceswas composed for this test. The number of words per sen-tence ranged from four to ten. All sentences consisted of
familiar words and concepts. Sentences were highly predict-J. Acoust. Soc. Am., Vol. 122, No. 1, July 2007
Downloaded 28 Jun 2013 to 128.243.253.115. Redistribution sub
able so that listeners’ abilities to use context would be evalu-ated by this test. The stimuli were mixed with broadbandGaussian noise at five speech-to-noise ratios �initial values:−4, −6, −8, −10, −12 dB; adjusted values: −6.3, −7.9, −9.0,−10.1, −11.7 dB�. Listeners were allowed 6 s to write thewords they could identify, in order, on a response sheet. All40 sentences were presented twice, using two random ordersin two blocks of trials. As with the other speech tests, stimuliwere presented with decreasing S/N values within eachgroup of five trials. The total number of correctly identifiedwords �regardless of order� was recorded for each sentence.
Subtest 19: Environmental sound identification. Twenty-five digitally recorded sounds were selected from two high-quality sound effects collections �Hollywood Edge andSound FX The General�. All were 16-bit stereo soundssampled at 44.1 kHz. The sounds were converted to monau-ral format and presented diotically. The particular soundswere selected from among several hundred options, based oncriteria of familiarity, detectability, and pairwise discrim-inability. These 25 sounds and several others from the col-lections cited above have been extensively studied by ourresearch group �Gygi, 2001; Gygi, Kidd, and Watson, 2004,in press�. The sounds were all perfectly recognizable at highevent-to-noise ratios �e.g., in excess of +20 dB�. To simulatedifficult listening conditions, samples were prepared by mix-ing each sound with Gaussian noise at eight different event-to-noise ratios �Ev/N�. Equal sound and noise levels for 0 dBEv/N were achieved by equating the rms values. The level ofthe environmental sound was adjusted to create other Ev/Nvalues. The levels were selected so that the probability ofidentification would range from near chance to near perfect,which was achieved in seven 3-dB steps. The range for eachevent is centered on the Ev/N level corresponding to an av-erage probability of detection of 0.66, as determined in apreliminary experiment with a group of four normal-hearingcollege students. Minimum Ev/Ns ranged from −31.6 to−16.9 across the set of sounds. A 3AFC format is employed,in which one sample is played to the listeners who thenselect the correct response from among three alternatives.The two incorrect alternatives on each trial are those soundsfrom the same 25-stimulus catalog that were determined inpilot studies to be most likely to be confused with the soundactually presented. Trials are presented in groups of six withincreasing Ev/N levels within each group. The test consistsof two 150-trial blocks, each with a different a random se-quence of the 25 sounds. In the first block, the sounds arepresented at the six highest Ev/N levels. In the second block,the sounds are presented at the six lowest Ev/N ratios.
C. Procedures
Participants were tested in a sound-treated room ingroups of up to 12 listeners per session. Testing of eachparticipant was conducted over four 90-min sessions on con-secutive weekdays �one session per day�. The sequences oftests and of stimuli within each test were the same for allparticipants. The rationale is that, in an individual differencesstudy, the goal is to eliminate variance due to any factors
other than differences among the subjects. Subtests 1–8 wereKidd et al.: Auditory abilities 423
ject to ASA license or copyright; see http://asadl.org/terms
administered in the first session, subtests 9–15 in the second,subtests 16–18 in the third, and subtest 19 in the final ses-sion. All tests began with detailed recorded instructions,which included two practice trials. Subjects were encouragedto make their “best guess” on each trial, regardless of theirconfidence level.
III. RESULTS
A. Reliability of TBAC measures
Christopherson and Humes �1992� examined the reli-ability of the original eight TBAC subtests. The tests wereadministered multiple times to the same listeners and werefound to be reliable; Cronbach’s alpha values were above 0.7for all but the Syllable Identification subtest, which had avalue of 0.58. Performance on all subtests changed little oversix repeated administrations of the TBAC. The new TBACtests employed here were constructed following the sameprinciples as the earlier tests and utilized stimuli and tasksthat have been used extensively in previous research. Thereliability of all subtests was estimated as part of this re-
TABLE II. Split-half reliability coefficients for the 19 TBAC subtests.
TBAC-ISubtests Reliability
Addedsubtests Reliability
Embedded tone 0.723 SAM 8 Hz 0.786Pitch 0.819 SAM 20 Hz 0.815Pulse train 0.816 SAM 60 Hz 0.702Duration 0.755 SAM 200 Hz 0.717Loudness 0.878 Ripple 0.759Temporal order 0.807 Gap discrim. 0.560Syllable ID 0.501 Gap detect. 0.612Syllable sequence 0.766 Nonwords 0.787
Words 0.635Sentences 0.795Env. sounds 0.827
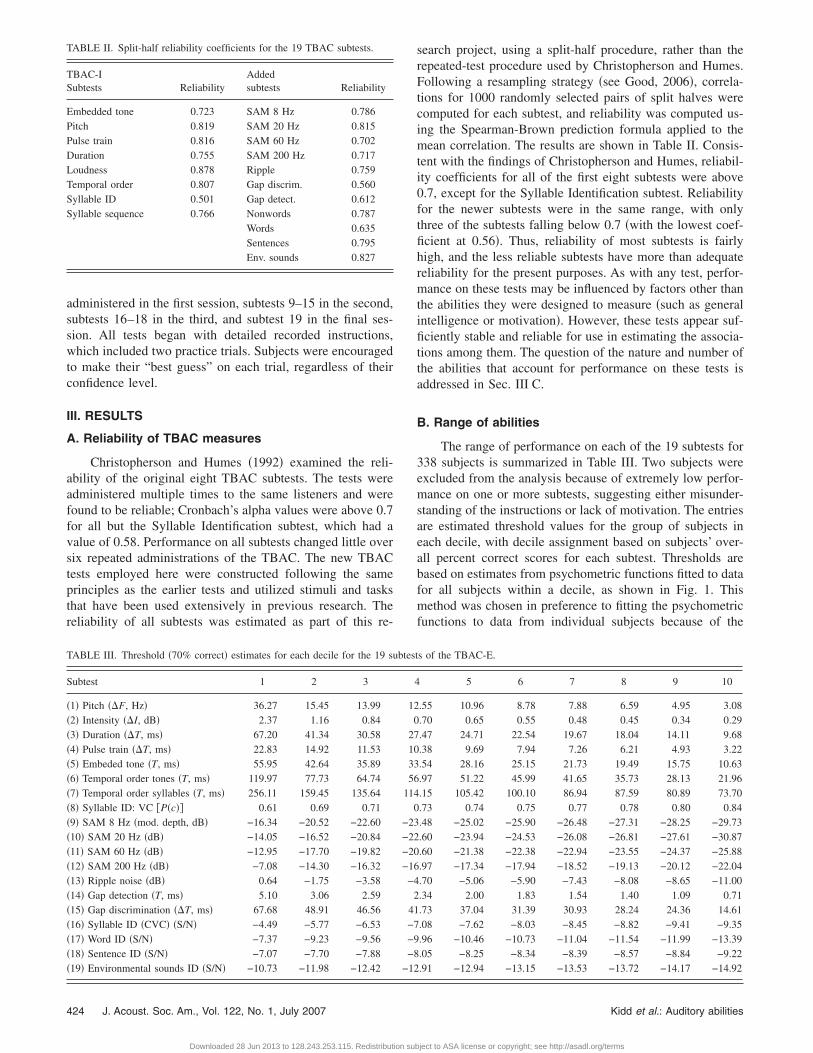
TABLE III. Threshold �70% correct� estimates for each decile for the 19 su
Subtest 1 2 3
�1� Pitch ��F, Hz� 36.27 15.45 13.99�2� Intensity ��I, dB� 2.37 1.16 0.84�3� Duration ��T, ms� 67.20 41.34 30.58�4� Pulse train ��T, ms� 22.83 14.92 11.53�5� Embeded tone �T, ms� 55.95 42.64 35.89�6� Temporal order tones �T, ms� 119.97 77.73 64.74�7� Temporal order syllables �T, ms� 256.11 159.45 135.64�8� Syllable ID: VC �P�c�� 0.61 0.69 0.71�9� SAM 8 Hz �mod. depth, dB� −16.34 −20.52 −22.60�10� SAM 20 Hz �dB� −14.05 −16.52 −20.84�11� SAM 60 Hz �dB� −12.95 −17.70 −19.82�12� SAM 200 Hz �dB� −7.08 −14.30 −16.32�13� Ripple noise �dB� 0.64 −1.75 −3.58�14� Gap detection �T, ms� 5.10 3.06 2.59�15� Gap discrimination ��T, ms� 67.68 48.91 46.56�16� Syllable ID �CVC� �S/N� −4.49 −5.77 −6.53�17� Word ID �S/N� −7.37 −9.23 −9.56�18� Sentence ID �S/N� −7.07 −7.70 −7.88�19� Environmental sounds ID �S/N� −10.73 −11.98 −12.42
424 J. Acoust. Soc. Am., Vol. 122, No. 1, July 2007
Downloaded 28 Jun 2013 to 128.243.253.115. Redistribution sub
search project, using a split-half procedure, rather than therepeated-test procedure used by Christopherson and Humes.Following a resampling strategy �see Good, 2006�, correla-tions for 1000 randomly selected pairs of split halves werecomputed for each subtest, and reliability was computed us-ing the Spearman-Brown prediction formula applied to themean correlation. The results are shown in Table II. Consis-tent with the findings of Christopherson and Humes, reliabil-ity coefficients for all of the first eight subtests were above0.7, except for the Syllable Identification subtest. Reliabilityfor the newer subtests were in the same range, with onlythree of the subtests falling below 0.7 �with the lowest coef-ficient at 0.56�. Thus, reliability of most subtests is fairlyhigh, and the less reliable subtests have more than adequatereliability for the present purposes. As with any test, perfor-mance on these tests may be influenced by factors other thanthe abilities they were designed to measure �such as generalintelligence or motivation�. However, these tests appear suf-ficiently stable and reliable for use in estimating the associa-tions among them. The question of the nature and number ofthe abilities that account for performance on these tests isaddressed in Sec. III C.
B. Range of abilities
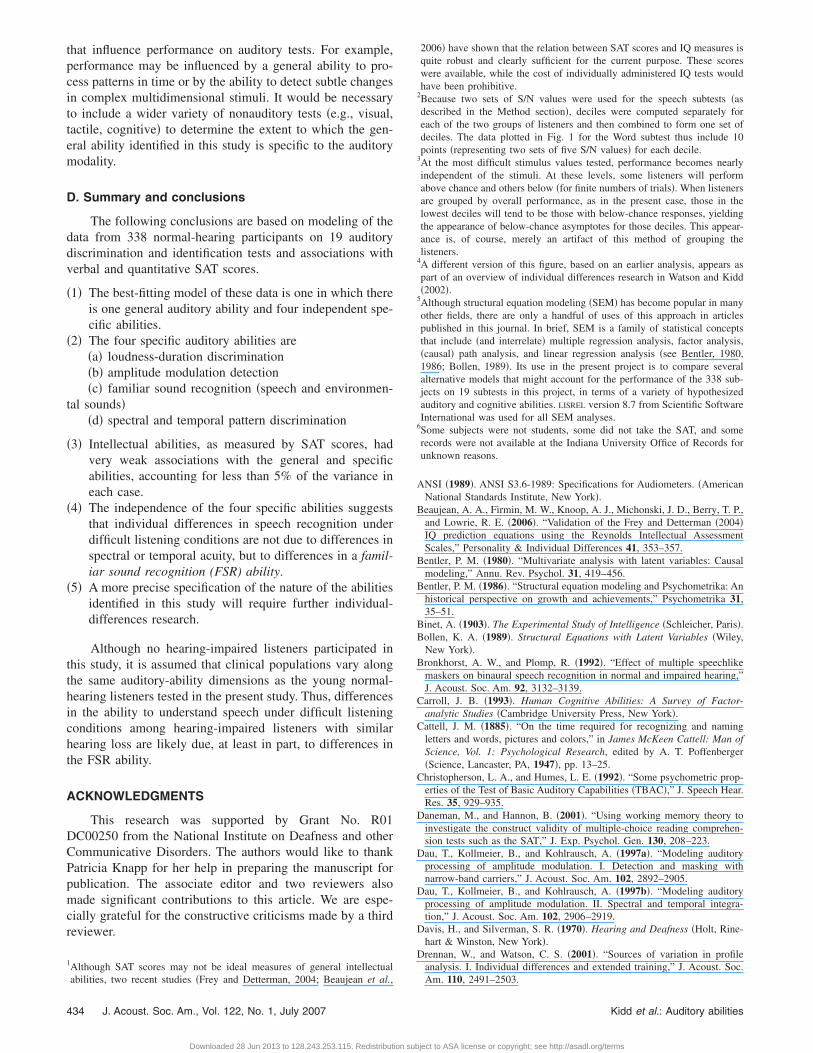
The range of performance on each of the 19 subtests for338 subjects is summarized in Table III. Two subjects wereexcluded from the analysis because of extremely low perfor-mance on one or more subtests, suggesting either misunder-standing of the instructions or lack of motivation. The entriesare estimated threshold values for the group of subjects ineach decile, with decile assignment based on subjects’ over-all percent correct scores for each subtest. Thresholds arebased on estimates from psychometric functions fitted to datafor all subjects within a decile, as shown in Fig. 1. Thismethod was chosen in preference to fitting the psychometricfunctions to data from individual subjects because of the
s of the TBAC-E.
5 6 7 8 9 10
.55 10.96 8.78 7.88 6.59 4.95 3.08
.70 0.65 0.55 0.48 0.45 0.34 0.29
.47 24.71 22.54 19.67 18.04 14.11 9.68
.38 9.69 7.94 7.26 6.21 4.93 3.22
.54 28.16 25.15 21.73 19.49 15.75 10.63
.97 51.22 45.99 41.65 35.73 28.13 21.96
.15 105.42 100.10 86.94 87.59 80.89 73.70
.73 0.74 0.75 0.77 0.78 0.80 0.84
.48 −25.02 −25.90 −26.48 −27.31 −28.25 −29.73
.60 −23.94 −24.53 −26.08 −26.81 −27.61 −30.87
.60 −21.38 −22.38 −22.94 −23.55 −24.37 −25.88
.97 −17.34 −17.94 −18.52 −19.13 −20.12 −22.04
.70 −5.06 −5.90 −7.43 −8.08 −8.65 −11.00
.34 2.00 1.83 1.54 1.40 1.09 0.71
.73 37.04 31.39 30.93 28.24 24.36 14.61
.08 −7.62 −8.03 −8.45 −8.82 −9.41 −9.35
.96 −10.46 −10.73 −11.04 −11.54 −11.99 −13.39
.05 −8.25 −8.34 −8.39 −8.57 −8.84 −9.22
.91 −12.94 −13.15 −13.53 −13.72 −14.17 −14.92
btest
4
120
27103356
1140
−23−22−20−16
−42
41−7−9−8
−12
Kidd et al.: Auditory abilities
ject to ASA license or copyright; see http://asadl.org/terms
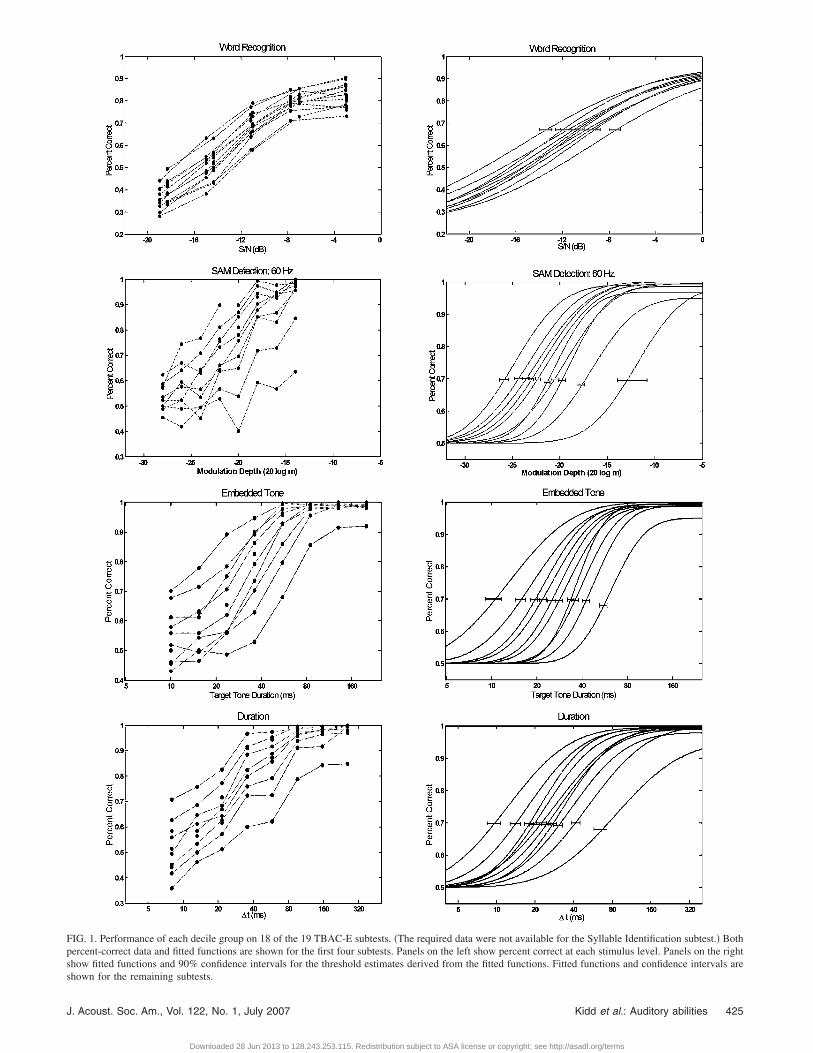
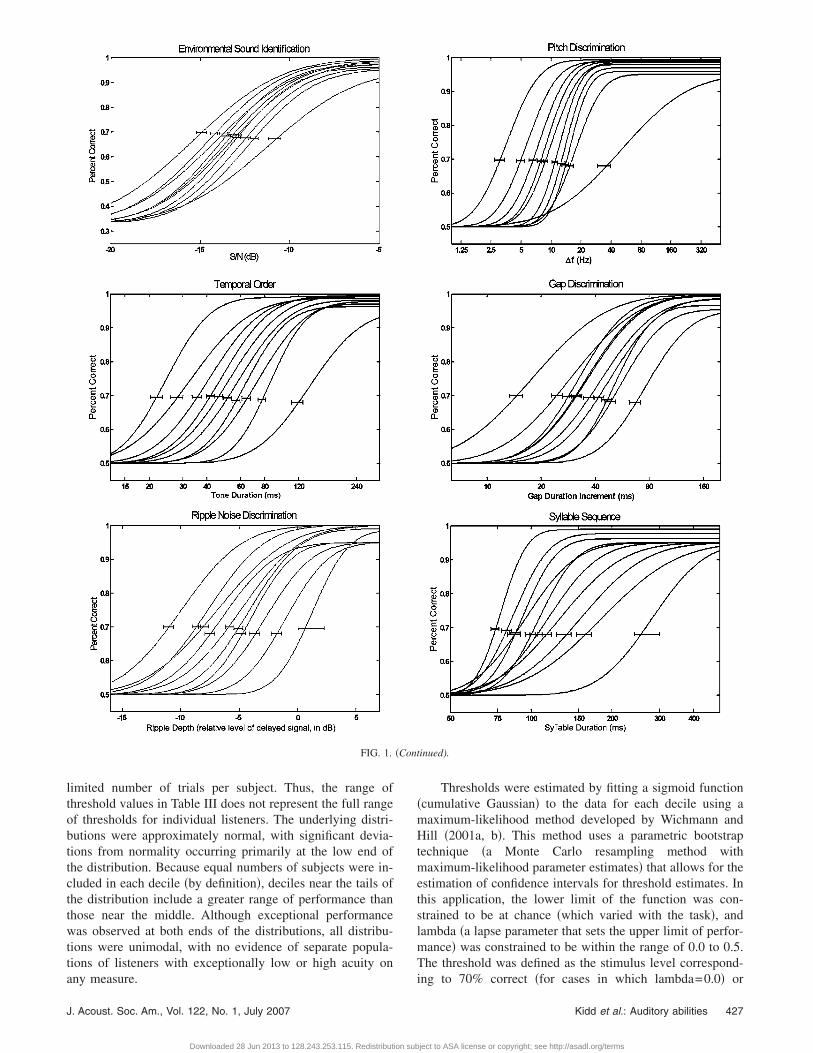
FIG. 1. Performance of each decile group on 18 of the 19 TBAC-E subtests. �The required data were not available for the Syllable Identification subtest.� Bothpercent-correct data and fitted functions are shown for the first four subtests. Panels on the left show percent correct at each stimulus level. Panels on the rightshow fitted functions and 90% confidence intervals for the threshold estimates derived from the fitted functions. Fitted functions and confidence intervals areshown for the remaining subtests.
J. Acoust. Soc. Am., Vol. 122, No. 1, July 2007 Kidd et al.: Auditory abilities 425
Downloaded 28 Jun 2013 to 128.243.253.115. Redistribution subject to ASA license or copyright; see http://asadl.org/terms
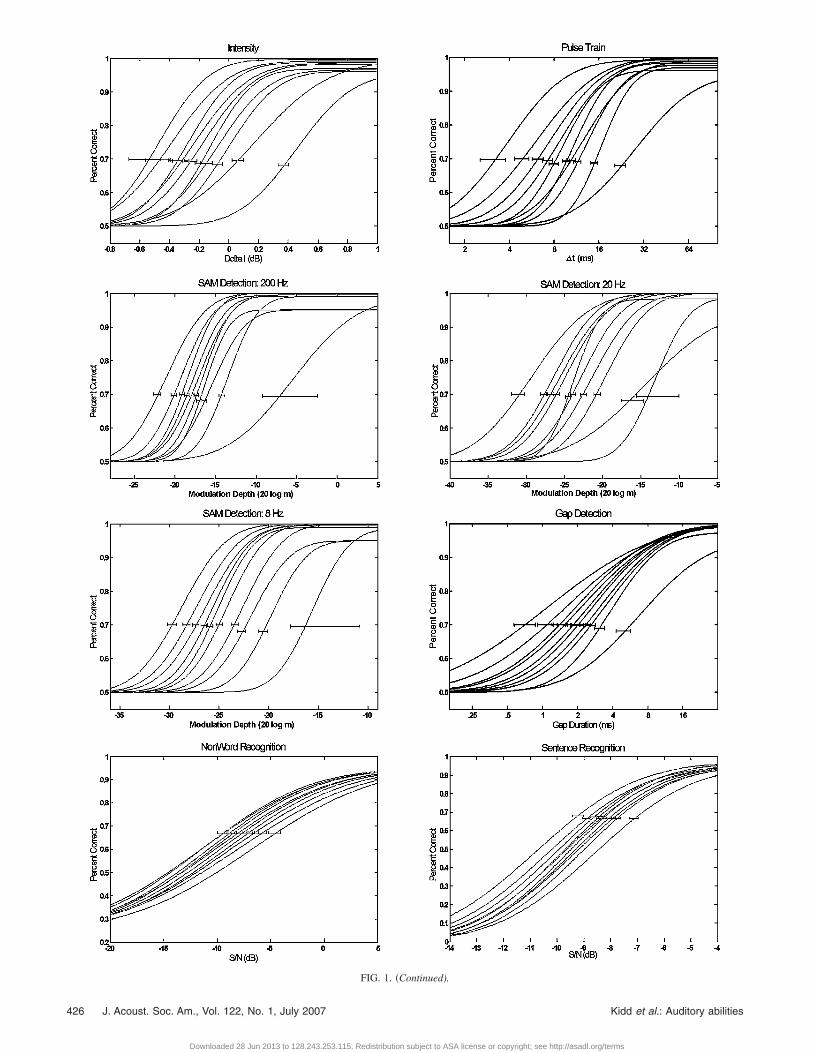
FIG. 1. �Continued).
426 J. Acoust. Soc. Am., Vol. 122, No. 1, July 2007 Kidd et al.: Auditory abilities
Downloaded 28 Jun 2013 to 128.243.253.115. Redistribution subject to ASA license or copyright; see http://asadl.org/terms
limited number of trials per subject. Thus, the range ofthreshold values in Table III does not represent the full rangeof thresholds for individual listeners. The underlying distri-butions were approximately normal, with significant devia-tions from normality occurring primarily at the low end ofthe distribution. Because equal numbers of subjects were in-cluded in each decile �by definition�, deciles near the tails ofthe distribution include a greater range of performance thanthose near the middle. Although exceptional performancewas observed at both ends of the distributions, all distribu-tions were unimodal, with no evidence of separate popula-tions of listeners with exceptionally low or high acuity on
FIG. 1.
any measure.
J. Acoust. Soc. Am., Vol. 122, No. 1, July 2007
Downloaded 28 Jun 2013 to 128.243.253.115. Redistribution sub
Thresholds were estimated by fitting a sigmoid function�cumulative Gaussian� to the data for each decile using amaximum-likelihood method developed by Wichmann andHill �2001a, b�. This method uses a parametric bootstraptechnique �a Monte Carlo resampling method withmaximum-likelihood parameter estimates� that allows for theestimation of confidence intervals for threshold estimates. Inthis application, the lower limit of the function was con-strained to be at chance �which varied with the task�, andlambda �a lapse parameter that sets the upper limit of perfor-mance� was constrained to be within the range of 0.0 to 0.5.The threshold was defined as the stimulus level correspond-
tinued).
�Coning to 70% correct �for cases in which lambda=0.0� or
Kidd et al.: Auditory abilities 427
ject to ASA license or copyright; see http://asadl.org/terms
slightly less for nonzero values of lambda. This represents atype of correction for inattention in that the actual percent-correct value at which the threshold is estimated is a constantproportional distance between chance and the upper limit ofthe fitted function �defined by lambda�.
Perhaps the most remarkable aspect of the data in TableIII is the broad range of performance on many of the tests.The ranges of threshold values are close to those reported bySurprenant and Watson �2001� for the first seven TBAC sub-tests, with substantial differences occurring for only two ofthe subtests. The best performance on the Embedded Tonesubtest �i.e., in the highest deciles� was considerably betterthan in the earlier study, as was the worst performance �firstdecile� on the Duration subtest. In general, performance ofthe top 10% on each subtest approaches that found withhighly trained listeners using more traditional psychophysi-cal procedures, while the worst 10% performed quite poorly.For example, the top group was able to detect a 0.3% changein frequency �or 5.3 cents�, while the bottom group requireda 3.6% change in frequency �or 61.7 cents�. Thresholds interms of duration, or of changes in duration, in temporaltasks increased from 3.5 to 7.0 times across the deciles, andthresholds for modulation depth and ripple depth rangedfrom 12 to 16 dB. The range of threshold S/N values forrecognition of familiar sounds �speech and environmentalsounds� may seem small in comparison �2 to 6 dB� to thoseof the unfamiliar laboratory test sounds. But, it should beconsidered that because of the steep psychometric functionsfor these stimuli, relatively small changes in S/N translateinto large changes in percent-correct identification. For ex-ample, at a S/N of −10 dB, the worst subjects could under-stand only about 18% of the words in sentences, while thebest subjects could understand about 52%. Others �Sur-prenant and Watson, 2001; Bronkhorst and Plomp, 1992�have found a larger range for sentence recognition thresholdsof roughly 6 to 7 dB. This represents a substantial range inthe ability of normal-hearing listeners to understand speechin noise.
Fitted psychometric functions for each decile are shownin Fig. 1 for 18 TBAC subtests.2 �No slope or thresholdestimates could be derived for the Syllable Identificationsubtest �subtest 8� because of the stimulus values used.� Rawdata and fitted functions are shown in separate plots for fourof the subtests.3 These four subtests were chosen becausethey are representative of the different patterns of results inthe full set of tests and because they represent each of thefour factors identified in the factor analysis described below.The 90% confidence intervals indicated for each of thethreshold estimates show consistent accuracy, with the ex-ception of the first decile for the 8-Hz SAM subtest. Thereduced accuracy results from the restricted range of above-chance performance for this decile, suggesting that even theeasiest stimulus levels were too challenging for the worstlisteners. This was an issue for all SAM subtests, the Ripplesubtest, and the Syllable Identification subtest �subtest 8�.Despite the reduced accuracy, these are valid threshold esti-mates. They indicate a low level of performance at the samestimulus levels that result in near-perfect performance for
most listeners. Such a large difference in performance at428 J. Acoust. Soc. Am., Vol. 122, No. 1, July 2007
Downloaded 28 Jun 2013 to 128.243.253.115. Redistribution sub
these levels may indicate that, for these tasks, the worst sub-jects are not simply less sensitive to the to-be-detected stimu-lus dimension; they may be using a different listening strat-egy that is inefficient or inappropriate for the task.
The families of psychometric functions are quite orderly,with thresholds decreasing consistently across the deciles.The largest change in threshold typically occurs between thefirst and second deciles. Slopes of functions for adjacentdeciles are generally similar across the deciles, and anychanges in slope tend to be gradual. For 13 of the subtests,slopes tended to increase slightly with increasing thresholds,while the opposite was true for the remaining cases. Thus,there was no consistent tendency for slopes to change sys-tematically with the ability of the listeners.
C. Identification of basic auditory abilities
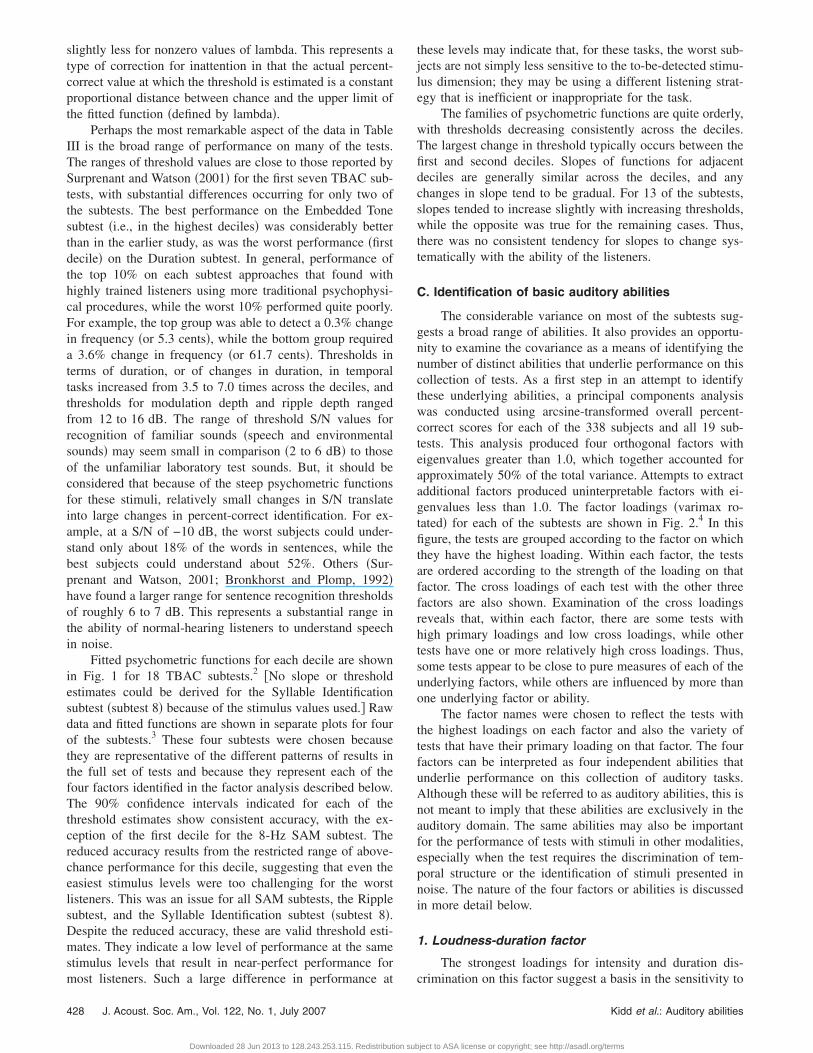
The considerable variance on most of the subtests sug-gests a broad range of abilities. It also provides an opportu-nity to examine the covariance as a means of identifying thenumber of distinct abilities that underlie performance on thiscollection of tests. As a first step in an attempt to identifythese underlying abilities, a principal components analysiswas conducted using arcsine-transformed overall percent-correct scores for each of the 338 subjects and all 19 sub-tests. This analysis produced four orthogonal factors witheigenvalues greater than 1.0, which together accounted forapproximately 50% of the total variance. Attempts to extractadditional factors produced uninterpretable factors with ei-genvalues less than 1.0. The factor loadings �varimax ro-tated� for each of the subtests are shown in Fig. 2.4 In thisfigure, the tests are grouped according to the factor on whichthey have the highest loading. Within each factor, the testsare ordered according to the strength of the loading on thatfactor. The cross loadings of each test with the other threefactors are also shown. Examination of the cross loadingsreveals that, within each factor, there are some tests withhigh primary loadings and low cross loadings, while othertests have one or more relatively high cross loadings. Thus,some tests appear to be close to pure measures of each of theunderlying factors, while others are influenced by more thanone underlying factor or ability.
The factor names were chosen to reflect the tests withthe highest loadings on each factor and also the variety oftests that have their primary loading on that factor. The fourfactors can be interpreted as four independent abilities thatunderlie performance on this collection of auditory tasks.Although these will be referred to as auditory abilities, this isnot meant to imply that these abilities are exclusively in theauditory domain. The same abilities may also be importantfor the performance of tests with stimuli in other modalities,especially when the test requires the discrimination of tem-poral structure or the identification of stimuli presented innoise. The nature of the four factors or abilities is discussedin more detail below.
1. Loudness-duration factor
The strongest loadings for intensity and duration dis-
crimination on this factor suggest a basis in the sensitivity toKidd et al.: Auditory abilities
ject to ASA license or copyright; see http://asadl.org/terms
at fac
changes in overall energy as an explanation of the common-ality of these subtests. The remaining three subtests that havetheir highest loadings on this factor have their highest crossloading on the factor to which they seem logically to belong:Syllable ID on the Familiar Sound Factor, Pulse Train on thePitch-Time Factor, and SAM 200 on the Amplitude Modula-tion Factor. However, the Pulse Train subtest does requiresubjects to detect changes in duration, and the 200-Hz SAMtest involves rapid �i.e., short-duration� changes in intensity.Note that the duration of the intensity dips for the 200-HzSAM test are comparable to threshold gap durations in theGap Detection subtest, which has similar loadings on theLoudness-Duration and Amplitude Modulation factors. �A re-viewer suggested that the 200-Hz SAM stimuli might havestronger pitch strength when deeply modulated, which mightin turn be perceived as greater loudness, which seems a plau-sible argument.� The high cross loadings indicate that thesetests require a second ability, almost to the same degree asthe primary Loudness-Duration ability. The role of this abil-ity in the Syllable Identification test �“you will mark ooze,please”� is less obvious than in the other tests with highloadings on this factor, but the loadings also suggest that theuse of duration and intensity cues may be especially impor-tant in discriminating among the alternatives when nonsenseVCs are presented in this context �cafeteria noise�.
2. Amplitude modulation factor
This factor includes the SAM noise discrimination testswith modulation rates of 8, 20, and 60 Hz, as well as the gapdetection subtest. The modulation rates of subtests in this
FIG. 2. Factor loadings for each of the 19 TBAC-E subtests. Subtests are growithin each factor according to the magnitude of the primary loading on th
factor are considerably slower than the 200-Hz rate for the
J. Acoust. Soc. Am., Vol. 122, No. 1, July 2007
Downloaded 28 Jun 2013 to 128.243.253.115. Redistribution sub
SAM test that loaded most strongly on the Loudness-Duration Factor. This is consistent with the change in per-ceptual quality as the modulation rate increases. At theslower rates, the change in amplitude has a time-varying or“fluttering” quality, while at the fastest rate, the modulationis heard as an overall “roughness” or “buzzing” quality. In-clusion of the gap detection test in this factor seems under-standable as it is yet another measure of the ability to followbrief changes in level. As with the 200-Hz SAM test, theamplitude fluctuation is brief �roughly 1 to 5 ms�, and bothtests have relatively high �and similar� loadings on theLoudness-Duration and Amplitude Modulation Factors. Itappears that both tests utilize the two underlying abilities�envelope following and duration/intensity discrimination� inroughly equal amounts.
3. Familiar sounds factor
In previous studies with the TBAC, this factor has beendesignated a speech factor �e.g., Surprenant and Watson,2001�. However, earlier studies did not include any familiarsounds other than speech. While the strongest loading for theenvironmental sounds test is on this factor, unlike thenonsense-word, word, and sentence tests, it has a relativelystrong cross loading on another factor �Loudness-Duration�.This suggests the existence of a familiar sound recognitionability that is not specific to speech. Implications of a singlefactor with high loadings for tests of both speech and other
according to the factor on which they have the highest loading and orderedtor.
uped
familiar sounds are discussed in a later section.
Kidd et al.: Auditory abilities 429
ject to ASA license or copyright; see http://asadl.org/terms
4. Pitch and time factor
The six subtests that load most strongly on this factorrequire two types of pattern processing: spectral �the pitchand ripple-noise discrimination tests� and spectral-temporal�temporal order for tones, embedded test tone, gap discrimi-nation, and syllable sequence�. The syllable sequence subtestmight have been expected to have its highest loading on thefamiliar sounds factor. However, it is perceptually quite dif-ferent from the other speech tests in that it consists of se-quences of natural speech tokens �/fa/ /ta/ /ka/ /pa/� that aremade difficult to discriminate by deleting multiple cycles ofthe fundamental pitch from the vowels. As the componentsbecome brief, they lose their similarity to natural speech, andthe test becomes similar to the nonspeech temporal-order testin which temporal-order judgments are based on changes inholistic pattern properties rather than an identification of theorder of the components. Because all of the spectral-temporal subtests in this factor consist of brief patterns thatare made more difficult by shortening durations that changethe overall sound of the patterns, it may be that these testsare performed by attending to holistic properties that affectthe overall sound quality. This interpretation is consistentwith earlier reports indicating that subjects can detectchanges in the temporal order of brief tones based on holisticproperties, even when they are unable to identify the order ofthe tones �Hirsh, 1959; Watson, 2004�.
Although the four factors described above do not cap-ture the wide range of auditory abilities included in Carroll’s�1993� analysis �primarily because of the narrower range ofauditory tests included�, the variety of tests within this nar-rower domain provides considerable information about thenature of the underlying abilities. The types of tests andstimuli were similar to those included in two of Carroll’sfactors: �1� Spectral, Temporal, and Intensive Discriminationof Nonspeech Sounds and �2� Speech Recognition underDistortion. Three of the present factors can be seen as a finerdifferentiation of the first factor, suggesting different abilitiesunderlying different types of temporal and spectral tests. TheFamiliar Sounds factor supports Karlin’s �1942� finding of aseparate factor for understanding speech under difficult lis-tening conditions �Carroll’s “Speech Recognition under Dis-tortion”�. The inclusion of an environmental sound test in thepresent study and its major loading on the factor that other-wise contains only speech tests suggests that this factor maybe related to a more general ability.
5. General auditory and intellectual abilities
Before considering the nature of these four factors andthe underlying abilities they may represent in more detail,the possible role of general auditory or intellectual abilitiesin the performance of these tests should be considered. Theinfluence of a general ability, and the degree to which thisability may be auditory or intellectual, will be evaluatedthrough comparison of different models of the latent variablestructure that underlies the measured variables, using struc-tural equation modeling.5 The role of intellectual abilitieswill be evaluated by examining the correlations between
SAT and latent variable scores.430 J. Acoust. Soc. Am., Vol. 122, No. 1, July 2007
Downloaded 28 Jun 2013 to 128.243.253.115. Redistribution sub
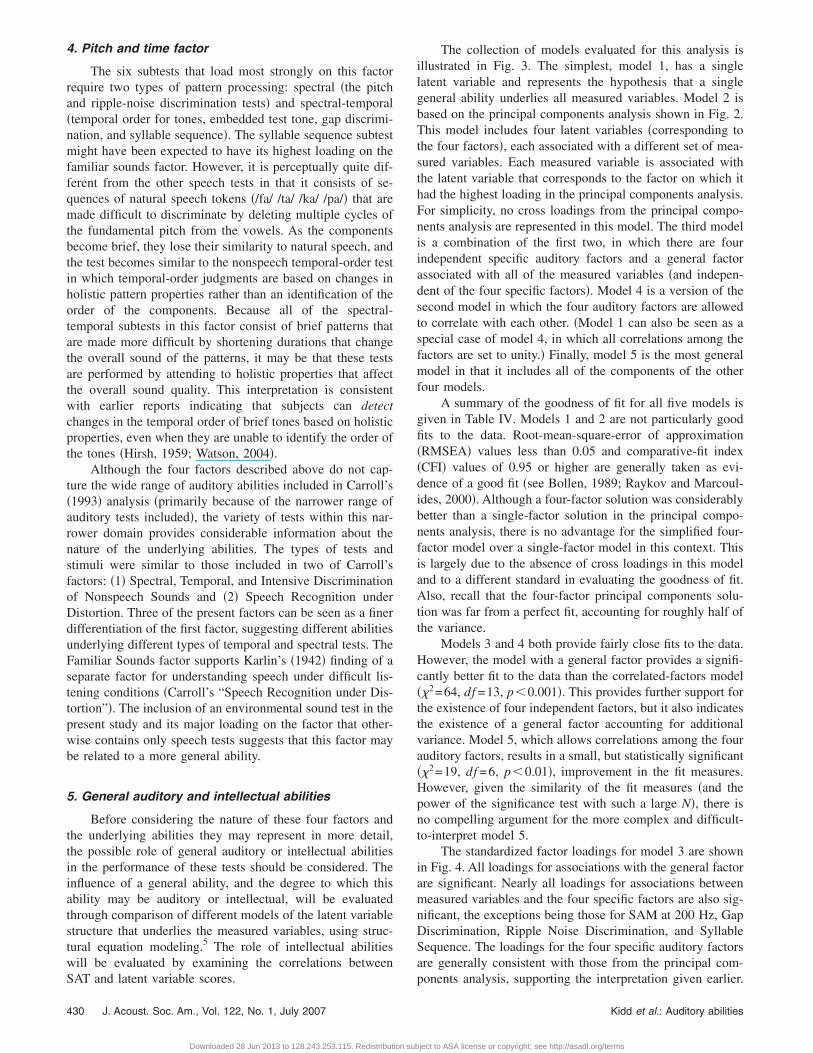
The collection of models evaluated for this analysis isillustrated in Fig. 3. The simplest, model 1, has a singlelatent variable and represents the hypothesis that a singlegeneral ability underlies all measured variables. Model 2 isbased on the principal components analysis shown in Fig. 2.This model includes four latent variables �corresponding tothe four factors�, each associated with a different set of mea-sured variables. Each measured variable is associated withthe latent variable that corresponds to the factor on which ithad the highest loading in the principal components analysis.For simplicity, no cross loadings from the principal compo-nents analysis are represented in this model. The third modelis a combination of the first two, in which there are fourindependent specific auditory factors and a general factorassociated with all of the measured variables �and indepen-dent of the four specific factors�. Model 4 is a version of thesecond model in which the four auditory factors are allowedto correlate with each other. �Model 1 can also be seen as aspecial case of model 4, in which all correlations among thefactors are set to unity.� Finally, model 5 is the most generalmodel in that it includes all of the components of the otherfour models.
A summary of the goodness of fit for all five models isgiven in Table IV. Models 1 and 2 are not particularly goodfits to the data. Root-mean-square-error of approximation�RMSEA� values less than 0.05 and comparative-fit index�CFI� values of 0.95 or higher are generally taken as evi-dence of a good fit �see Bollen, 1989; Raykov and Marcoul-ides, 2000�. Although a four-factor solution was considerablybetter than a single-factor solution in the principal compo-nents analysis, there is no advantage for the simplified four-factor model over a single-factor model in this context. Thisis largely due to the absence of cross loadings in this modeland to a different standard in evaluating the goodness of fit.Also, recall that the four-factor principal components solu-tion was far from a perfect fit, accounting for roughly half ofthe variance.
Models 3 and 4 both provide fairly close fits to the data.However, the model with a general factor provides a signifi-cantly better fit to the data than the correlated-factors model��2=64, df =13, p�0.001�. This provides further support forthe existence of four independent factors, but it also indicatesthe existence of a general factor accounting for additionalvariance. Model 5, which allows correlations among the fourauditory factors, results in a small, but statistically significant��2=19, df =6, p�0.01�, improvement in the fit measures.However, given the similarity of the fit measures �and thepower of the significance test with such a large N�, there isno compelling argument for the more complex and difficult-to-interpret model 5.
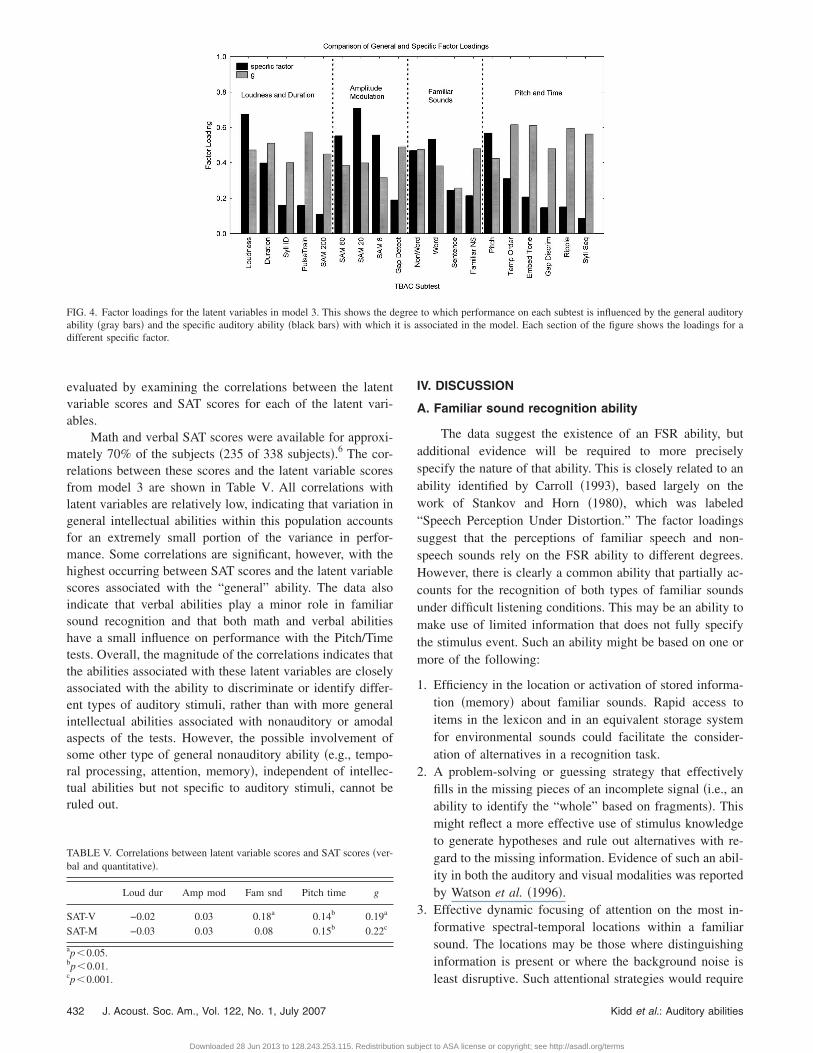
The standardized factor loadings for model 3 are shownin Fig. 4. All loadings for associations with the general factorare significant. Nearly all loadings for associations betweenmeasured variables and the four specific factors are also sig-nificant, the exceptions being those for SAM at 200 Hz, GapDiscrimination, Ripple Noise Discrimination, and SyllableSequence. The loadings for the four specific auditory factorsare generally consistent with those from the principal com-
ponents analysis, supporting the interpretation given earlier.Kidd et al.: Auditory abilities
ject to ASA license or copyright; see http://asadl.org/terms
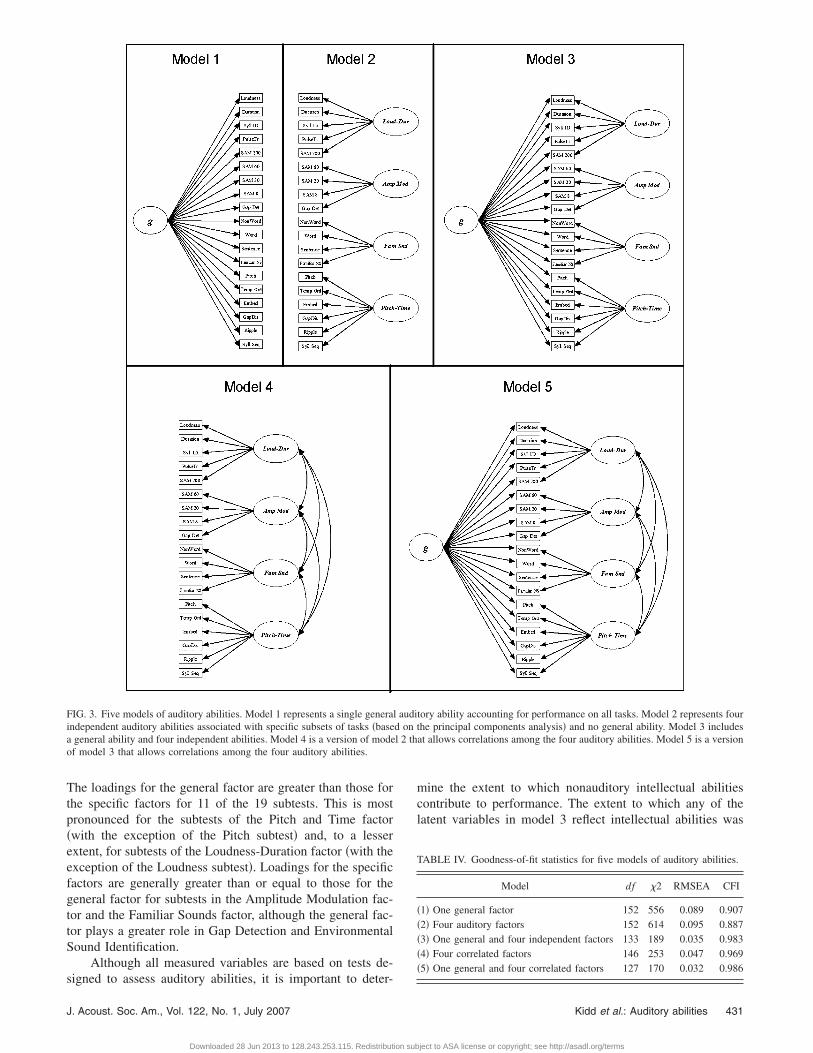
The loadings for the general factor are greater than those forthe specific factors for 11 of the 19 subtests. This is mostpronounced for the subtests of the Pitch and Time factor�with the exception of the Pitch subtest� and, to a lesserextent, for subtests of the Loudness-Duration factor �with theexception of the Loudness subtest�. Loadings for the specificfactors are generally greater than or equal to those for thegeneral factor for subtests in the Amplitude Modulation fac-tor and the Familiar Sounds factor, although the general fac-tor plays a greater role in Gap Detection and EnvironmentalSound Identification.
Although all measured variables are based on tests de-
FIG. 3. Five models of auditory abilities. Model 1 represents a single generalindependent auditory abilities associated with specific subsets of tasks �basea general ability and four independent abilities. Model 4 is a version of modeof model 3 that allows correlations among the four auditory abilities.
signed to assess auditory abilities, it is important to deter-
J. Acoust. Soc. Am., Vol. 122, No. 1, July 2007
Downloaded 28 Jun 2013 to 128.243.253.115. Redistribution sub
mine the extent to which nonauditory intellectual abilitiescontribute to performance. The extent to which any of thelatent variables in model 3 reflect intellectual abilities was
TABLE IV. Goodness-of-fit statistics for five models of auditory abilities.
Model df �2 RMSEA CFI
�1� One general factor 152 556 0.089 0.907�2� Four auditory factors 152 614 0.095 0.887�3� One general and four independent factors 133 189 0.035 0.983�4� Four correlated factors 146 253 0.047 0.969�5� One general and four correlated factors 127 170 0.032 0.986
tory ability accounting for performance on all tasks. Model 2 represents fourthe principal components analysis� and no general ability. Model 3 includesat allows correlations among the four auditory abilities. Model 5 is a version
audid onl 2 th
Kidd et al.: Auditory abilities 431
ject to ASA license or copyright; see http://asadl.org/terms
evaluated by examining the correlations between the latentvariable scores and SAT scores for each of the latent vari-ables.
Math and verbal SAT scores were available for approxi-mately 70% of the subjects �235 of 338 subjects�.6 The cor-relations between these scores and the latent variable scoresfrom model 3 are shown in Table V. All correlations withlatent variables are relatively low, indicating that variation ingeneral intellectual abilities within this population accountsfor an extremely small portion of the variance in perfor-mance. Some correlations are significant, however, with thehighest occurring between SAT scores and the latent variablescores associated with the “general” ability. The data alsoindicate that verbal abilities play a minor role in familiarsound recognition and that both math and verbal abilitieshave a small influence on performance with the Pitch/Timetests. Overall, the magnitude of the correlations indicates thatthe abilities associated with these latent variables are closelyassociated with the ability to discriminate or identify differ-ent types of auditory stimuli, rather than with more generalintellectual abilities associated with nonauditory or amodalaspects of the tests. However, the possible involvement ofsome other type of general nonauditory ability �e.g., tempo-ral processing, attention, memory�, independent of intellec-tual abilities but not specific to auditory stimuli, cannot beruled out.
TABLE V. Correlations between latent variable scores and SAT scores �ver-bal and quantitative�.
Loud dur Amp mod Fam snd Pitch time g
SAT-V −0.02 0.03 0.18a 0.14b 0.19a
SAT-M −0.03 0.03 0.08 0.15b 0.22c
ap�0.05.bp�0.01.c
FIG. 4. Factor loadings for the latent variables in model 3. This shows the dability �gray bars� and the specific auditory ability �black bars� with whichdifferent specific factor.
p�0.001.
432 J. Acoust. Soc. Am., Vol. 122, No. 1, July 2007
Downloaded 28 Jun 2013 to 128.243.253.115. Redistribution sub
IV. DISCUSSION
A. Familiar sound recognition ability
The data suggest the existence of an FSR ability, butadditional evidence will be required to more preciselyspecify the nature of that ability. This is closely related to anability identified by Carroll �1993�, based largely on thework of Stankov and Horn �1980�, which was labeled“Speech Perception Under Distortion.” The factor loadingssuggest that the perceptions of familiar speech and non-speech sounds rely on the FSR ability to different degrees.However, there is clearly a common ability that partially ac-counts for the recognition of both types of familiar soundsunder difficult listening conditions. This may be an ability tomake use of limited information that does not fully specifythe stimulus event. Such an ability might be based on one ormore of the following:
1. Efficiency in the location or activation of stored informa-tion �memory� about familiar sounds. Rapid access toitems in the lexicon and in an equivalent storage systemfor environmental sounds could facilitate the consider-ation of alternatives in a recognition task.
2. A problem-solving or guessing strategy that effectivelyfills in the missing pieces of an incomplete signal �i.e., anability to identify the “whole” based on fragments�. Thismight reflect a more effective use of stimulus knowledgeto generate hypotheses and rule out alternatives with re-gard to the missing information. Evidence of such an abil-ity in both the auditory and visual modalities was reportedby Watson et al. �1996�.
3. Effective dynamic focusing of attention on the most in-formative spectral-temporal locations within a familiarsound. The locations may be those where distinguishinginformation is present or where the background noise is
to which performance on each subtest is influenced by the general auditoryssociated in the model. Each section of the figure shows the loadings for a
egreeit is a
least disruptive. Such attentional strategies would require
Kidd et al.: Auditory abilities
ject to ASA license or copyright; see http://asadl.org/terms
the use of information about the properties of the familiarsounds to be identified and of the background or interfer-ing sounds.
These three skills are not mutually exclusive, and theFSR ability may reflect a combination of them. That is, effi-cient access to stored information about familiar sounds canfacilitate guessing or stimulus-completion strategies or helpallocate attention. It should also be noted that these abilitiesare not necessarily purely auditory. The memory retrieval,stimulus-completion, or attentional strategies that make upthe FSR ability may facilitate the recognition of any familiarstimulus �or perhaps any familiar temporal pattern� regard-less of its sensory modality. That FSR is independent of theother abilities identified in this study does not mean thatspectral and temporal resolving power are unimportant forthe recognition of speech and other familiar sounds. Thefindings indicate only that individual differences in spectraland temporal resolving power among young normal-hearinglisteners do not account for individual differences in the abil-ity to recognize speech or environmental sounds under diffi-cult listening conditions. A more severe degradation of spec-tral acuity can certainly impair the ability to understandspeech, as is evident in the effects of processing speechthrough a vocoder with only a few channels �Dudley, 1939;Shannon et al., 1995; Friesen et al., 2001�. The identificationof an FSR ability, independent of spectral-temporal resolvingpower does, however, strongly suggest that cognitive ap-proaches to improving speech understanding in hearing-impaired individuals should be explored. Although nohearing-impaired individuals were tested in this study, a cor-responding range of the FSR ability seems certain to exist inthe hearing-impaired population and thus to account for dif-ferences in speech recognition abilities among listeners withsimilar hearing loss.
B. Spectral and temporal processing abilities
The remaining three specific factors identified in thisstudy reflect a variety of spectral or temporal processingabilities. These three factors represent a further differentia-tion of a factor identified by Carroll �1993�, which he de-scribed as encompassing spectral and temporal processingfor nonspeech complex stimulus patterns. This division ofCarroll’s single factor into three is a consequence of a widerrange of relevant tests than in any of the earlier investiga-tions considered by Carroll. There was some evidence in thedatasets analyzed by Carroll for a distinction between spec-tral abilities �e.g., frequency and timbre discrimination� andtemporal abilities �e.g., intensity, duration, and rhythm dis-crimination�, but the data did not provide clear support forthe existence of these two independent factors.
Rather than revealing a distinction between spectral andtemporal abilities, the present study suggests the presence ofthree distinct types of temporal processing abilities. TheLoudness-Duration factor reflects the ability to detectchanges in overall energy �and duration�. This ability has anobvious element of temporal processing, suggestive of theenergy detection model �the “leaky integrator” model� devel-
oped within signal detection theory �Green and Swets, 1966;J. Acoust. Soc. Am., Vol. 122, No. 1, July 2007
Downloaded 28 Jun 2013 to 128.243.253.115. Redistribution sub
Jeffress, 1967�. The Pitch-and-Time factor suggests a com-bined spectral-temporal pattern processing ability that isclosely associated with spectrum and timbre discrimination.A range of tests with both spectral �i.e., frequency or timbre�and temporal �i.e., duration or timing� aspects is included.This factor may largely reflect the ability to discriminate ho-listic changes in the sound quality of a spectral-temporalpattern, whether due to spectral changes, temporal changes,or both. Finally, the Amplitude Modulation factor �consistingof SAM detection at the slower rates and gap detection� sug-gests an envelope-following ability that is distinct from anenergy detection ability.
Despite the relatively large number of auditory tests �19�employed in the present study, compared to earlier investiga-tions, a still wider range appears necessary to achieve a sat-isfactory definition of each of the four auditory abilities. Thecurrent findings provide a basis for the selection of additionaltests that utilize the hypothesized abilities to different de-grees. For example, the inclusion of other modulation-basedtasks �e.g., modulation masking, modulation detection inter-ference, modulation rate discrimination� might help clarifythe nature of the ability that underlies the Amplitude Modu-lation factor, perhaps clarifying the role of modulation filters�Dau et al., 1997a, b; Langner et al., 2002� in these abilities.The inclusion of a rhythm discrimination test that requiredthe discrimination of relative timing �e.g., by using time-transposed rhythmic patterns� plus other temporal discrimi-nation tasks with different types of temporal structure over arange of time frames might help clarify the relations amongthe different temporal abilities observed in the present study.The inclusion of tasks that require the discrimination of fa-miliar sounds with different types of stimulus changes wouldhelp to clarify the nature of the FSR ability and its relation toother auditory abilities.
C. The possibility of an “auditory g”
The latent variable analysis revealed the existence of ageneral ability in addition to the four independent auditoryabilities. This represents common variance among all audi-tory tests that was not accounted for by the four factors. Theinfluence of the general factor on performance was signifi-cant for all tests and was greater than that of the specificfactors for a majority of the tests �11 of 19�. However, bothspecific and general factors had a significant influence on allbut four of the tests. The influence of specific factors wassomewhat greater than that of the general factor for testsassociated with the Amplitude Modulation and FamiliarSounds factors, while the opposite was true for the Pitch andTime factor and the Loudness-Duration factor.
Although a small portion of this general ability is relatedto math and verbal abilities, as measured by SAT scores, thisability is largely independent of intellectual abilities and ap-pears to reflect a general facility with auditory stimuli. Whilemany cognitive abilities, such as working memory or con-trolled attention, have been shown to be correlated with SATscores �Daneman and Hannon, 2001; Engle et al., 1999�, ashas general intelligence �Frey and Detterman, 2004;
Beaujean et al., 2006�, there may be other amodal abilitiesKidd et al.: Auditory abilities 433
ject to ASA license or copyright; see http://asadl.org/terms
that influence performance on auditory tests. For example,performance may be influenced by a general ability to pro-cess patterns in time or by the ability to detect subtle changesin complex multidimensional stimuli. It would be necessaryto include a wider variety of nonauditory tests �e.g., visual,tactile, cognitive� to determine the extent to which the gen-eral ability identified in this study is specific to the auditorymodality.
D. Summary and conclusions
The following conclusions are based on modeling of thedata from 338 normal-hearing participants on 19 auditorydiscrimination and identification tests and associations withverbal and quantitative SAT scores.
�1� The best-fitting model of these data is one in which thereis one general auditory ability and four independent spe-cific abilities.
�2� The four specific auditory abilities are�a� loudness-duration discrimination�b� amplitude modulation detection�c� familiar sound recognition �speech and environmen-
tal sounds��d� spectral and temporal pattern discrimination
�3� Intellectual abilities, as measured by SAT scores, hadvery weak associations with the general and specificabilities, accounting for less than 5% of the variance ineach case.
�4� The independence of the four specific abilities suggeststhat individual differences in speech recognition underdifficult listening conditions are not due to differences inspectral or temporal acuity, but to differences in a famil-iar sound recognition (FSR) ability.
�5� A more precise specification of the nature of the abilitiesidentified in this study will require further individual-differences research.
Although no hearing-impaired listeners participated inthis study, it is assumed that clinical populations vary alongthe same auditory-ability dimensions as the young normal-hearing listeners tested in the present study. Thus, differencesin the ability to understand speech under difficult listeningconditions among hearing-impaired listeners with similarhearing loss are likely due, at least in part, to differences inthe FSR ability.
ACKNOWLEDGMENTS
This research was supported by Grant No. R01DC00250 from the National Institute on Deafness and otherCommunicative Disorders. The authors would like to thankPatricia Knapp for her help in preparing the manuscript forpublication. The associate editor and two reviewers alsomade significant contributions to this article. We are espe-cially grateful for the constructive criticisms made by a thirdreviewer.
1Although SAT scores may not be ideal measures of general intellectual
abilities, two recent studies �Frey and Detterman, 2004; Beaujean et al.,434 J. Acoust. Soc. Am., Vol. 122, No. 1, July 2007
Downloaded 28 Jun 2013 to 128.243.253.115. Redistribution sub
2006� have shown that the relation between SAT scores and IQ measures isquite robust and clearly sufficient for the current purpose. These scoreswere available, while the cost of individually administered IQ tests wouldhave been prohibitive.
2Because two sets of S/N values were used for the speech subtests �asdescribed in the Method section�, deciles were computed separately foreach of the two groups of listeners and then combined to form one set ofdeciles. The data plotted in Fig. 1 for the Word subtest thus include 10points �representing two sets of five S/N values� for each decile.
3At the most difficult stimulus values tested, performance becomes nearlyindependent of the stimuli. At these levels, some listeners will performabove chance and others below �for finite numbers of trials�. When listenersare grouped by overall performance, as in the present case, those in thelowest deciles will tend to be those with below-chance responses, yieldingthe appearance of below-chance asymptotes for those deciles. This appear-ance is, of course, merely an artifact of this method of grouping thelisteners.
4A different version of this figure, based on an earlier analysis, appears aspart of an overview of individual differences research in Watson and Kidd�2002�.
5Although structural equation modeling �SEM� has become popular in manyother fields, there are only a handful of uses of this approach in articlespublished in this journal. In brief, SEM is a family of statistical conceptsthat include �and interrelate� multiple regression analysis, factor analysis,�causal� path analysis, and linear regression analysis �see Bentler, 1980,1986; Bollen, 1989�. Its use in the present project is to compare severalalternative models that might account for the performance of the 338 sub-jects on 19 subtests in this project, in terms of a variety of hypothesizedauditory and cognitive abilities. LISREL version 8.7 from Scientific SoftwareInternational was used for all SEM analyses.
6Some subjects were not students, some did not take the SAT, and somerecords were not available at the Indiana University Office of Records forunknown reasons.
ANSI �1989�. ANSI S3.6-1989: Specifications for Audiometers. �AmericanNational Standards Institute, New York�.
Beaujean, A. A., Firmin, M. W., Knoop, A. J., Michonski, J. D., Berry, T. P.,and Lowrie, R. E. �2006�. “Validation of the Frey and Detterman �2004�IQ prediction equations using the Reynolds Intellectual AssessmentScales,” Personality & Individual Differences 41, 353–357.
Bentler, P. M. �1980�. “Multivariate analysis with latent variables: Causalmodeling,” Annu. Rev. Psychol. 31, 419–456.
Bentler, P. M. �1986�. “Structural equation modeling and Psychometrika: Anhistorical perspective on growth and achievements,” Psychometrika 31,35–51.
Binet, A. �1903�. The Experimental Study of Intelligence �Schleicher, Paris�.Bollen, K. A. �1989�. Structural Equations with Latent Variables �Wiley,
New York�.Bronkhorst, A. W., and Plomp, R. �1992�. “Effect of multiple speechlike
maskers on binaural speech recognition in normal and impaired hearing,”J. Acoust. Soc. Am. 92, 3132–3139.
Carroll, J. B. �1993�. Human Cognitive Abilities: A Survey of Factor-analytic Studies �Cambridge University Press, New York�.
Cattell, J. M. �1885�. “On the time required for recognizing and namingletters and words, pictures and colors,” in James McKeen Cattell: Man ofScience, Vol. 1: Psychological Research, edited by A. T. Poffenberger�Science, Lancaster, PA, 1947�, pp. 13–25.
Christopherson, L. A., and Humes, L. E. �1992�. “Some psychometric prop-erties of the Test of Basic Auditory Capabilities �TBAC�,” J. Speech Hear.Res. 35, 929–935.
Daneman, M., and Hannon, B. �2001�. “Using working memory theory toinvestigate the construct validity of multiple-choice reading comprehen-sion tests such as the SAT,” J. Exp. Psychol. Gen. 130, 208–223.
Dau, T., Kollmeier, B., and Kohlrausch, A. �1997a�. “Modeling auditoryprocessing of amplitude modulation. I. Detection and masking withnarrow-band carriers,” J. Acoust. Soc. Am. 102, 2892–2905.
Dau, T., Kollmeier, B., and Kohlrausch, A. �1997b�. “Modeling auditoryprocessing of amplitude modulation. II. Spectral and temporal integra-tion,” J. Acoust. Soc. Am. 102, 2906–2919.
Davis, H., and Silverman, S. R. �1970�. Hearing and Deafness �Holt, Rine-hart & Winston, New York�.
Drennan, W., and Watson, C. S. �2001�. “Sources of variation in profileanalysis. I. Individual differences and extended training,” J. Acoust. Soc.
Am. 110, 2491–2503.Kidd et al.: Auditory abilities
ject to ASA license or copyright; see http://asadl.org/terms
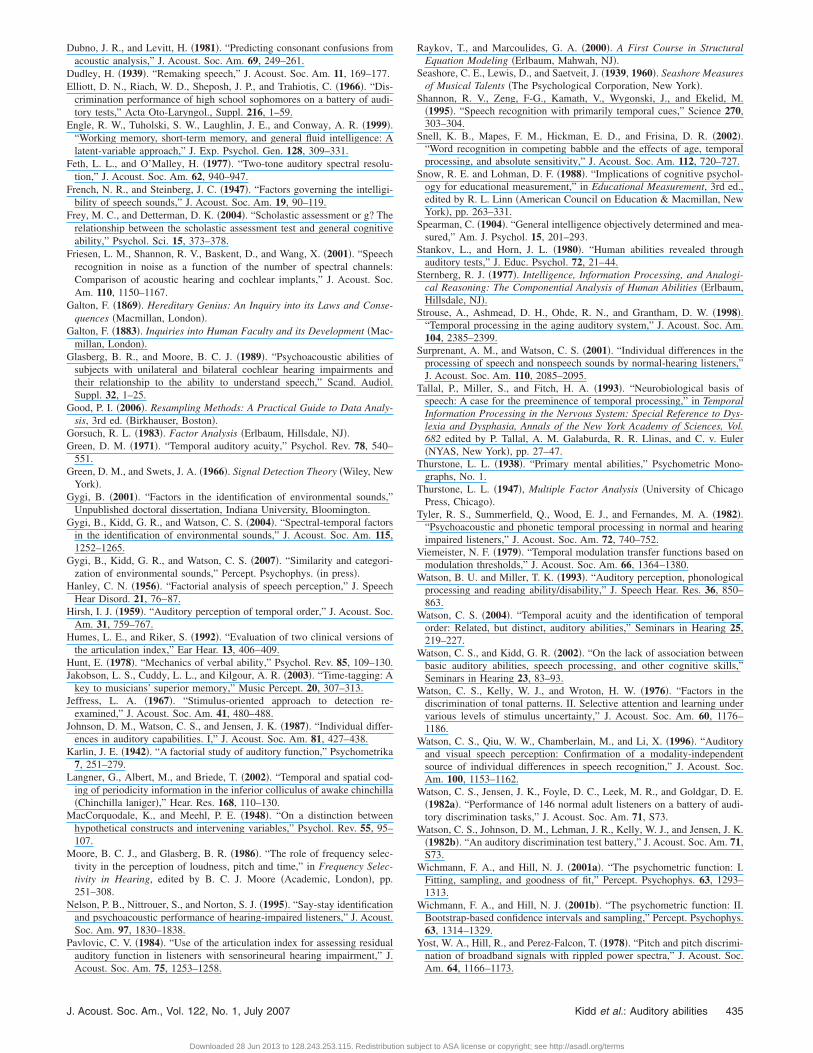
Dubno, J. R., and Levitt, H. �1981�. “Predicting consonant confusions fromacoustic analysis,” J. Acoust. Soc. Am. 69, 249–261.
Dudley, H. �1939�. “Remaking speech,” J. Acoust. Soc. Am. 11, 169–177.Elliott, D. N., Riach, W. D., Sheposh, J. P., and Trahiotis, C. �1966�. “Dis-
crimination performance of high school sophomores on a battery of audi-tory tests,” Acta Oto-Laryngol., Suppl. 216, 1–59.
Engle, R. W., Tuholski, S. W., Laughlin, J. E., and Conway, A. R. �1999�.“Working memory, short-term memory, and general fluid intelligence: Alatent-variable approach,” J. Exp. Psychol. Gen. 128, 309–331.
Feth, L. L., and O’Malley, H. �1977�. “Two-tone auditory spectral resolu-tion,” J. Acoust. Soc. Am. 62, 940–947.
French, N. R., and Steinberg, J. C. �1947�. “Factors governing the intelligi-bility of speech sounds,” J. Acoust. Soc. Am. 19, 90–119.
Frey, M. C., and Detterman, D. K. �2004�. “Scholastic assessment or g? Therelationship between the scholastic assessment test and general cognitiveability,” Psychol. Sci. 15, 373–378.
Friesen, L. M., Shannon, R. V., Baskent, D., and Wang, X. �2001�. “Speechrecognition in noise as a function of the number of spectral channels:Comparison of acoustic hearing and cochlear implants,” J. Acoust. Soc.Am. 110, 1150–1167.
Galton, F. �1869�. Hereditary Genius: An Inquiry into its Laws and Conse-quences �Macmillan, London�.
Galton, F. �1883�. Inquiries into Human Faculty and its Development �Mac-millan, London�.
Glasberg, B. R., and Moore, B. C. J. �1989�. “Psychoacoustic abilities ofsubjects with unilateral and bilateral cochlear hearing impairments andtheir relationship to the ability to understand speech,” Scand. Audiol.Suppl. 32, 1–25.
Good, P. I. �2006�. Resampling Methods: A Practical Guide to Data Analy-sis, 3rd ed. �Birkhauser, Boston�.
Gorsuch, R. L. �1983�. Factor Analysis �Erlbaum, Hillsdale, NJ�.Green, D. M. �1971�. “Temporal auditory acuity,” Psychol. Rev. 78, 540–
551.Green, D. M., and Swets, J. A. �1966�. Signal Detection Theory �Wiley, New
York�.Gygi, B. �2001�. “Factors in the identification of environmental sounds,”
Unpublished doctoral dissertation, Indiana University, Bloomington.Gygi, B., Kidd, G. R., and Watson, C. S. �2004�. “Spectral-temporal factors
in the identification of environmental sounds,” J. Acoust. Soc. Am. 115,1252–1265.
Gygi, B., Kidd, G. R., and Watson, C. S. �2007�. “Similarity and categori-zation of environmental sounds,” Percept. Psychophys. �in press�.
Hanley, C. N. �1956�. “Factorial analysis of speech perception,” J. SpeechHear Disord. 21, 76–87.
Hirsh, I. J. �1959�. “Auditory perception of temporal order,” J. Acoust. Soc.Am. 31, 759–767.
Humes, L. E., and Riker, S. �1992�. “Evaluation of two clinical versions ofthe articulation index,” Ear Hear. 13, 406–409.
Hunt, E. �1978�. “Mechanics of verbal ability,” Psychol. Rev. 85, 109–130.Jakobson, L. S., Cuddy, L. L., and Kilgour, A. R. �2003�. “Time-tagging: A
key to musicians’ superior memory,” Music Percept. 20, 307–313.Jeffress, L. A. �1967�. “Stimulus-oriented approach to detection re-
examined,” J. Acoust. Soc. Am. 41, 480–488.Johnson, D. M., Watson, C. S., and Jensen, J. K. �1987�. “Individual differ-
ences in auditory capabilities. I,” J. Acoust. Soc. Am. 81, 427–438.Karlin, J. E. �1942�. “A factorial study of auditory function,” Psychometrika
7, 251–279.Langner, G., Albert, M., and Briede, T. �2002�. “Temporal and spatial cod-
ing of periodicity information in the inferior colliculus of awake chinchilla�Chinchilla laniger�,” Hear. Res. 168, 110–130.
MacCorquodale, K., and Meehl, P. E. �1948�. “On a distinction betweenhypothetical constructs and intervening variables,” Psychol. Rev. 55, 95–107.
Moore, B. C. J., and Glasberg, B. R. �1986�. “The role of frequency selec-tivity in the perception of loudness, pitch and time,” in Frequency Selec-tivity in Hearing, edited by B. C. J. Moore �Academic, London�, pp.251–308.
Nelson, P. B., Nittrouer, S., and Norton, S. J. �1995�. “Say-stay identificationand psychoacoustic performance of hearing-impaired listeners,” J. Acoust.Soc. Am. 97, 1830–1838.
Pavlovic, C. V. �1984�. “Use of the articulation index for assessing residualauditory function in listeners with sensorineural hearing impairment,” J.Acoust. Soc. Am. 75, 1253–1258.
J. Acoust. Soc. Am., Vol. 122, No. 1, July 2007
Downloaded 28 Jun 2013 to 128.243.253.115. Redistribution sub
Raykov, T., and Marcoulides, G. A. �2000�. A First Course in StructuralEquation Modeling �Erlbaum, Mahwah, NJ�.
Seashore, C. E., Lewis, D., and Saetveit, J. �1939, 1960�. Seashore Measuresof Musical Talents �The Psychological Corporation, New York�.
Shannon, R. V., Zeng, F-G., Kamath, V., Wygonski, J., and Ekelid, M.�1995�. “Speech recognition with primarily temporal cues,” Science 270,303–304.
Snell, K. B., Mapes, F. M., Hickman, E. D., and Frisina, D. R. �2002�.“Word recognition in competing babble and the effects of age, temporalprocessing, and absolute sensitivity,” J. Acoust. Soc. Am. 112, 720–727.
Snow, R. E. and Lohman, D. F. �1988�. “Implications of cognitive psychol-ogy for educational measurement,” in Educational Measurement, 3rd ed.,edited by R. L. Linn �American Council on Education & Macmillan, NewYork�, pp. 263–331.
Spearman, C. �1904�. “General intelligence objectively determined and mea-sured,” Am. J. Psychol. 15, 201–293.
Stankov, L., and Horn, J. L. �1980�. “Human abilities revealed throughauditory tests,” J. Educ. Psychol. 72, 21–44.
Sternberg, R. J. �1977�. Intelligence, Information Processing, and Analogi-cal Reasoning: The Componential Analysis of Human Abilities �Erlbaum,Hillsdale, NJ�.
Strouse, A., Ashmead, D. H., Ohde, R. N., and Grantham, D. W. �1998�.“Temporal processing in the aging auditory system,” J. Acoust. Soc. Am.104, 2385–2399.
Surprenant, A. M., and Watson, C. S. �2001�. “Individual differences in theprocessing of speech and nonspeech sounds by normal-hearing listeners,”J. Acoust. Soc. Am. 110, 2085–2095.
Tallal, P., Miller, S., and Fitch, H. A. �1993�. “Neurobiological basis ofspeech: A case for the preeminence of temporal processing,” in TemporalInformation Processing in the Nervous System: Special Reference to Dys-lexia and Dysphasia, Annals of the New York Academy of Sciences, Vol.682 edited by P. Tallal, A. M. Galaburda, R. R. Llinas, and C. v. Euler�NYAS, New York�, pp. 27–47.
Thurstone, L. L. �1938�. “Primary mental abilities,” Psychometric Mono-graphs, No. 1.
Thurstone, L. L. �1947�, Multiple Factor Analysis �University of ChicagoPress, Chicago�.
Tyler, R. S., Summerfield, Q., Wood, E. J., and Fernandes, M. A. �1982�.“Psychoacoustic and phonetic temporal processing in normal and hearingimpaired listeners,” J. Acoust. Soc. Am. 72, 740–752.
Viemeister, N. F. �1979�. “Temporal modulation transfer functions based onmodulation thresholds,” J. Acoust. Soc. Am. 66, 1364–1380.
Watson, B. U. and Miller, T. K. �1993�. “Auditory perception, phonologicalprocessing and reading ability/disability,” J. Speech Hear. Res. 36, 850–863.
Watson, C. S. �2004�. “Temporal acuity and the identification of temporalorder: Related, but distinct, auditory abilities,” Seminars in Hearing 25,219–227.
Watson, C. S., and Kidd, G. R. �2002�. “On the lack of association betweenbasic auditory abilities, speech processing, and other cognitive skills,”Seminars in Hearing 23, 83–93.
Watson, C. S., Kelly, W. J., and Wroton, H. W. �1976�. “Factors in thediscrimination of tonal patterns. II. Selective attention and learning undervarious levels of stimulus uncertainty,” J. Acoust. Soc. Am. 60, 1176–1186.
Watson, C. S., Qiu, W. W., Chamberlain, M., and Li, X. �1996�. “Auditoryand visual speech perception: Confirmation of a modality-independentsource of individual differences in speech recognition,” J. Acoust. Soc.Am. 100, 1153–1162.
Watson, C. S., Jensen, J. K., Foyle, D. C., Leek, M. R., and Goldgar, D. E.�1982a�. “Performance of 146 normal adult listeners on a battery of audi-tory discrimination tasks,” J. Acoust. Soc. Am. 71, S73.
Watson, C. S., Johnson, D. M., Lehman, J. R., Kelly, W. J., and Jensen, J. K.�1982b�. “An auditory discrimination test battery,” J. Acoust. Soc. Am. 71,S73.
Wichmann, F. A., and Hill, N. J. �2001a�. “The psychometric function: I.Fitting, sampling, and goodness of fit,” Percept. Psychophys. 63, 1293–1313.
Wichmann, F. A., and Hill, N. J. �2001b�. “The psychometric function: II.Bootstrap-based confidence intervals and sampling,” Percept. Psychophys.63, 1314–1329.
Yost, W. A., Hill, R., and Perez-Falcon, T. �1978�. “Pitch and pitch discrimi-nation of broadband signals with rippled power spectra,” J. Acoust. Soc.Am. 64, 1166–1173.
Kidd et al.: Auditory abilities 435
ject to ASA license or copyright; see http://asadl.org/terms


