Embed Size (px)
Citation preview
RAPID ASSESSMENT
SYNTHESIS REPORTAPRIL 2018
INDONESIA
MARINE DEBRISHOTSPOT
KEMENTERIAN KOORDINATORBIDANG KEMARITIMAN
Pub
lic D
iscl
osur
e A
utho
rized
Pub
lic D
iscl
osur
e A
utho
rized
Pub
lic D
iscl
osur
e A
utho
rized
Pub
lic D
iscl
osur
e A
utho
rized
ACRONYMSANDABBREVIATIONS
BLH IndonesianProvincialEnvironmentalAgencyBPS IndonesianNationalStatisticsAgencyDANIDA DanishInternationalDevelopmentAgencyDINAS IndonesianAgencyorDepartmentDKPP IndonesianCleansing,ParksandCemeteriesDepartmentattheMunicipalLevelGDP GrossDomesticProductIDR IndonesianRupiah(currencyofIndonesia)IPRC InternationalPacificResearchCenterLISA CityofMakassar“SeeWaste,TakeIt”ProgramLONGGAR CityofMakassar“CleanAlleyWay”ProgramMARPOL TheInternationalConventionforthePreventionofPollutionfromShips73/78MSW MunicipalSolidWasteNGO Non-GovernmentalOrganizationOECD OrganizationforEconomicCooperationandDevelopmentOSPAR AbbreviationoftheOsloandParisConventions(Mechanismbywhich15governmentsandthe
EUcooperatetoprotectthemarineenvironmentoftheNorth-EastAtlantic)PEEK PolyetherEtherKetonePlasticsPELINDO IndonesiaPortCorporationsRPJMN IndonesiaNationalFiveYearMediumTermDevelopmentPlanRT IndonesianNeighborhoodAssociationRW IndonesianCommunityAssociationSDN IndonesianPublicElementarySchoolSMAN IndonesianPublicSeniorHighSchoolSNI IndonesiaNationalStandardSWM SolidWasteManagementTPA IndonesianFinalDisposalSites(centralopendumpsitesorlandfills)TPS IndonesianTemporaryDisposalorDumpSitesTPST IndonesianIntermediateTransferFacilities UPT IndonesianTechnicalImplementationUnit
ACKNOWLEDGEMENTS
The Indonesia Marine Debris Hotspots Rapid Assessment exercise benefited from the generousfinancialsupportofDANIDAandtechnicalsupportoftheRoyalEmbassyofDenmarkinJakarta.Theteam would like to extend its gratitude to Ambassador Casper Klynge, Jacob Hansen, KirstineJespersenandHannaJohansenfortheirdedicatedsupportthroughouttheassessmentprocess.
TheWorldBanktechnicalteamwasmanagedbyIainShukerandledbyCaryAnneCadman.TheteamcomprisedKenButler,LucyMitchell,JackyLatuheru,HanifaAsquf,IsnantoSolihinYugoPratomo,RijalM.Idrus,PankiePangermanan,Khirlan, IinPratamasari, IqbalNoor,AyuPrasetyawati,MayaSarahandKikiPrioUtomo.AnjaliAcharyaledthefinalizationofthesynthesisreport.Administrativesupportwas provided by Sandra Buana Sari, AriphoertiWoerasihingtijas and Anita Ristanti. SimultaneoustranslationserviceswereprovidedbyIbnuNajibandIbuWanty.
Feedback on the preliminary findings from participants of the Indonesia National Marine DebrisSummitheldinJakarta,Indonesia,November1–3,2016informedtherefinementoftheassessment.TheteamalsobenefitedfromtechnicalpeerreviewadviceprovidedbyFrankVanWoerden,JosteinNygardandErnestoSanchez-Triana.
TABLEOFCONTENTS
1 INTRODUCTIONANDRATIONALE........................................................................................................1 1.1 GrowingCrisisofOceanPlasticsPollution...........................................................................................1 1.2 Indonesia’sMarineDebrisChallenge..................................................................................................2
1.2.1 CoastalandMarineEcosystemsunderthreat.................................................................................2 1.2.2 StateofIndonesia’sSolidWasteSector..........................................................................................3
2 SCOPEANDMETHODOLOGY................................................................................................................5 2.1 Overview..............................................................................................................................................5 2.2 DetailedFieldSurveyMethodology.....................................................................................................6
3 WASTEMANAGEMENT:BASELINECONDITIONS..................................................................................9 3.1 AgenciesResponsibleforMunicipalSolidWaste................................................................................9 3.2 AgenciesResponsibleforWasteManagementinWaterways..........................................................10 3.3 ConsideringCityTiersforSupportINGSolidWasteManagement.....................................................11 3.4 SurveyofLandUseActivitiesAndWastePatterns...........................................................................12 3.5 WasteManagementInfrastructureinTargetCities..........................................................................13
3.5.1 WasteBanks..................................................................................................................................13 3.5.2 WaterwayWasteInfrastructureandOperations.........................................................................15
4 WASTEGENERATIONESTIMATIONS...................................................................................................18 4.1 MunicipalSolidWaste(MSW)GenerationRates:Modelling............................................................18 4.2 WasteGenerationAndCollectionRates:SurveyResults..................................................................19
5 WASTESAMPLINGANDCHARACTERIZATION.....................................................................................20 5.1 MunicipalSolidWasteComposition..................................................................................................20 5.2 WaterwayWasteSamplingandCharacterization.............................................................................20
6 WATERWAYHOTSPOTSMAPPING.....................................................................................................23 6.1 SummaryoftheTidalZoneAreaHotspots........................................................................................23 6.2 SummaryofHotspotCharacteristics.................................................................................................28
7 SOCIO-BEHAVIORALFINDINGS..........................................................................................................30 7.1 CommunityProfiles...........................................................................................................................30 7.2 Communitylevelattitudesandpractices..........................................................................................31
8 DISCUSSIONANDRECOMMENDATIONS............................................................................................32 8.1 LinkagestoRelatedGovernmentPrograms......................................................................................32
8.1.1 GovernmentProgramforImprovingSolidWasteManagement:..................................................32 8.1.2 GovernmentofIndonesia’sMarineDebrisActionPlan.................................................................33
8.2 RecommendationsforAddressingIndonesia’sPlasticWaste...........................................................34 8.3 InformingtheMarinePlasticDebrisManagementRoadmap...........................................................38
8.3.1 SystemicSupportthroughtheSolidWasteManagementProject.................................................38 8.3.2TargetedSupportthroughtheIndonesiaOceans,MarineDebrisandCoastalMDTF...................39
REFERENCES...............................................................................................................................................40
S Y N T H E S I S R E P O R T |1
1 INTRODUCTIONANDRATIONALE
TheMarineDebrisHotspotRapidAssessmentforIndonesiawasconductedbytheWorldBankattherequestofrelevantIndonesiagovernmentagenciesandresearchinstitutions,toprovideaninformedand focused analysis of land-based leakage of solid waste, particularly plastics, to the marineenvironment. The assessmentwas a rapid study carried out in two phases, providing up-to-dateinformation from 15 cities in Western and Central Indonesia. The assessment aimed to supportIndonesia’sresponsetothegrowingcrisisofplasticsanddebrisinthecountry’sandworld’soceans.
1.1 GrowingCrisisofOceanPlasticsPollution
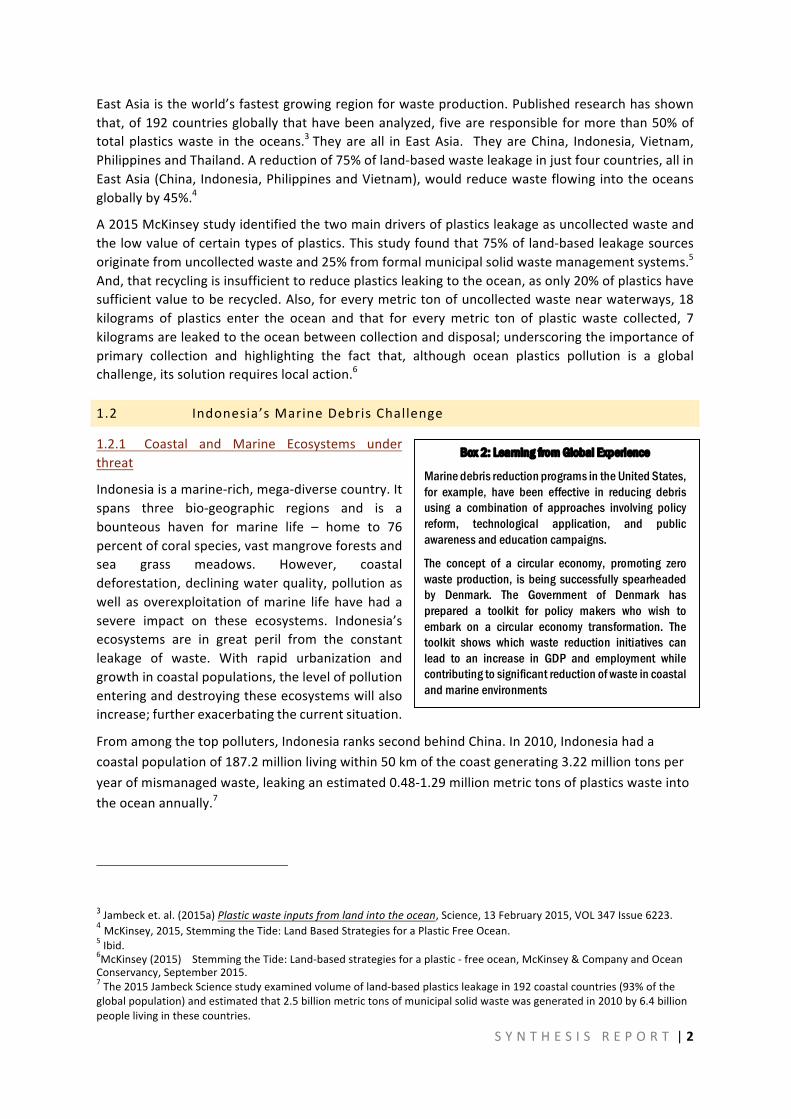
Fivewideningoceangyresofplastics–floatingfieldsofgarbage--offerthestarkestimagesofthemarinedebriscrisis–onethatisalsovisibleontheworld’sbeaches,mangrovesandwaterways.Itisestimated theabout300million tonsofplasticsbeingproducedannually.1Theveryqualities thatmakeplasticsuseful–lightness,durability,strength,versatilityandlowproductioncosts–havetodayresultedinamountingglobaloceanspollutioncrisis.
Therearecurrently150milliontonsofplasticsintheworld’soceansandanother250millionwillbeaddedifcurrenttrendsinurbanization,productionandconsumptioncontinue.AreportbytheWorldEconomicForumandEllenMacArthurFoundationestimatedthatby2050therewillbe“moreplasticsthanfish(byweight),”barring“effectiveafter-usepathwaysforplastics;drasticallyreducingleakageofplasticsintonaturalsystems,inparticularoceans;anddecouplingplasticsfromfossilfeedstocks.2”
Box 1: Primer on Marine Debris
Marine debris, also known as marine litter, has been defined by UNEP (2009) as “any persistent, manufactured or processed solid material discarded, disposed of or abandoned in the marine and coastal environment”. Marine debris consists of items that have been made or used by people and deliberately discarded into the sea or rivers or left on beaches and shores; brought indirectly to the sea with rivers, sewage, storm water or winds; or accidentally lost, including material lost at sea (fishing gear).
Marine debris is present in all marine habitats, from densely populated regions to remote points far from human activities; from beaches and shallow waters to deep-ocean trenches. The density of marine debris varies among locations, influenced by anthro-pogenic activities, hydrological/meteorological conditions, geomorphology, entry point, and physical characteristics of debris items.
Marine debris can be classified into several distinct categories (a) Plastics, covering a wide range of synthetic polymeric materials, including fishing nets, ropes, buoys and other fisheries-related equipment; consumer goods, such as plastic bags, plastic bottles, plastic packaging, plastic toys; tampon applicators; nappies; smoking-related items, such as cigarette butts, lighters and cigar tips; plastic resin pellets; microplastic particles; (b) Metal, including drink cans, aerosol cans, foil wrappers and disposable barbeques; (c) Glass, including bottles, bulbs; (d) Processed timber, including pallets, crates and particle boards; (e) Paper and cardboard, including cartons, cups and bags; (f) Rubber, including tires, balloons and gloves; (g) Clothing and textiles, including shoes, furnishings and towels.
1PlasticsEurope,op.cit.note1:EuropeanHouse-Ambrosette,op.cit.note7citedinGourmelon,G.(2015)GlobalPlasticProductionRises,RecyclingLages.VitalSigns.WorldWatchInstitute.2WorldEconomicForum,EllenMacArthurFoundation,andMcKinsey&Company,“Thenewplasticseconomy:Rethinkingthefutureofplastics,”Jan.19,2016.
S Y N T H E S I S R E P O R T |2
EastAsiaistheworld’sfastestgrowingregionforwasteproduction.Publishedresearchhasshownthat,of192countriesgloballythathavebeenanalyzed,fiveareresponsibleformorethan50%oftotalplasticswaste in theoceans.3Theyareall in EastAsia. TheyareChina, Indonesia,Vietnam,PhilippinesandThailand.Areductionof75%ofland-basedwasteleakageinjustfourcountries,allinEastAsia(China,Indonesia,PhilippinesandVietnam),wouldreducewasteflowingintotheoceansgloballyby45%.4
A2015McKinseystudyidentifiedthetwomaindriversofplasticsleakageasuncollectedwasteandthelowvalueofcertaintypesofplastics.Thisstudyfoundthat75%ofland-basedleakagesourcesoriginatefromuncollectedwasteand25%fromformalmunicipalsolidwastemanagementsystems.5And,thatrecyclingisinsufficienttoreduceplasticsleakingtotheocean,asonly20%ofplasticshavesufficientvaluetoberecycled.Also,foreverymetrictonofuncollectedwastenearwaterways,18kilograms of plastics enter the ocean and that for everymetric ton of plastic waste collected, 7kilogramsareleakedtotheoceanbetweencollectionanddisposal;underscoringtheimportanceofprimary collection and highlighting the fact that, although ocean plastics pollution is a globalchallenge,itssolutionrequireslocalaction.6
1.2 Indonesia’sMarineDebrisChallenge
1.2.1 Coastal and Marine Ecosystems underthreat
Indonesiaisamarine-rich,mega-diversecountry.Itspans three bio-geographic regions and is abounteous haven for marine life – home to 76percentofcoralspecies,vastmangroveforestsandsea grass meadows. However, coastaldeforestation,decliningwaterquality,pollutionaswell asoverexploitationofmarine lifehavehadasevere impact on these ecosystems. Indonesia’secosystems are in great peril from the constantleakage of waste. With rapid urbanization andgrowthincoastalpopulations,thelevelofpollutionenteringanddestroyingtheseecosystemswillalsoincrease;furtherexacerbatingthecurrentsituation.
Fromamongthetoppolluters,IndonesiarankssecondbehindChina.In2010,Indonesiahadacoastalpopulationof187.2millionlivingwithin50kmofthecoastgenerating3.22milliontonsperyearofmismanagedwaste,leakinganestimated0.48-1.29millionmetrictonsofplasticswasteintotheoceanannually.7
3Jambecket.al.(2015a)Plasticwasteinputsfromlandintotheocean,Science,13February2015,VOL347Issue6223.4McKinsey,2015,StemmingtheTide:LandBasedStrategiesforaPlasticFreeOcean.5Ibid.6McKinsey(2015) StemmingtheTide:Land-basedstrategiesforaplastic-freeocean,McKinsey&CompanyandOceanConservancy,September2015.7The2015JambeckSciencestudyexaminedvolumeofland-basedplasticsleakagein192coastalcountries(93%oftheglobalpopulation)andestimatedthat2.5billionmetrictonsofmunicipalsolidwastewasgeneratedin2010by6.4billionpeoplelivinginthesecountries.
Box 2: Learning from Global Experience
Marine debris reduction programs in the United States, for example, have been effective in reducing debris using a combination of approaches involving policy reform, technological application, and public awareness and education campaigns.
The concept of a circular economy, promoting zero waste production, is being successfully spearheaded by Denmark. The Government of Denmark has prepared a toolkit for policy makers who wish to embark on a circular economy transformation. The toolkit shows which waste reduction initiatives can lead to an increase in GDP and employment while contributing to significant reduction of waste in coastal and marine environments
S Y N T H E S I S R E P O R T |3
Marine litter is part of the broader problem of waste management. Solid waste management isbecomingamajorpublichealthandenvironmentalconcerninmanycountrieslikeIndonesia,wherea lackofappropriatesystemsforthemanagementofwaste,fromitssourceto itsfinaldisposalorprocessing,exists.(UNEP2005).ThewastemanagementchallengesfacingIndonesiaareformidable,but theyarebynomeans insurmountable.TheGovernmentof Indonesia isaddressing itsmarinedebrischallengehead-on,andcanhelpturnthetideforEastAsia.ThebulkofIndonesia’schallengetohaltmarinedebrisleakageinvolvesaddressingitsinadequatemunicipalwastemanagementserviceprovision.1.2.2 StateofIndonesia’sSolidWasteSector
The Government of Indonesia’s Long-Term National Urban Development Plan, 2015-2045, setstargetsofurbanservicestandardsandcitywastemanagement–demandinghighsectorperformance.Solidwastemanagementishighonthenationalagenda,asexemplifiedbytheNationalMediumTermDevelopment Plan’s (RPJMN) “100-0-100” target of eliminating all slums and providing universalaccesstowaterandsanitation,includingsolidwaste,by2019.8
AlsoincludedistheSolidWasteManagementAct(No.18/2008)–whichrequiredtheclosureofallopen dumping by 2013; and requires all three levels of government (national, provincial,kota/kabupaten)tocontributetofinancingthesector.Thissetsanambitiousgoalforimprovementofpublicservicedeliverygivencurrentestimatesthatonly45to50%ofIndonesia’surbansolidwasteiscollected,withsignificantvariationinperformanceamongcities.Forexample,from98%collectionandtransfertodisposalsitesinWestJakartatoaslowas15%transferredtodisposalfacilitiesinSouthTangerang.Whiledataqualityremainsanissue,collectionratesseemstohaveimprovedmodestlyovertime,withtheformerMinistryofEnvironmentreporting40%ofsolidwastecollectedin2001.
Inaddition,thegovernmenthaspledgedtoreduceplasticandothermarinewasteby70%by2025,which is strongly linked to overall 100% urban collection targets on land. The National WasteManagement Policy and Strategy (Jakstranas) drafted by the Coordinating Ministry of EconomicAffairs(KEMENKO)alsoproposesatargetof30%wastereductionandrecyclingby2025.
Solidwastemanagement is included as the thirdmost important sector in Indonesia’sNationallyDeterminedContribution(INDC)preparedforthe2015ParisClimateChangeConference(COP21).Inaddition,pertheWasteManagementLaw2008,allopening-dumpingsitesshouldalreadyhavebeenclosed by 2013 and all large cities should exclusively be sending their waste to sanitary disposalfacilities.
Today,currentestimatesshowthatabout85,000tonsofwasteisgenerateddailyinIndonesiawithanexpectedincreaseto150,000tonsproduceddailyby2025;9a76%increaseinthenext10yearsalone. Approximately 40% of solid waste is generated by households. 10 Hence, not only doesIndonesianeedtoincreasecollectionofexistinghouseholds,butitalsoneedstocontendwiththeannual increaseof6,500 tonsofwasteproduceddue tourbanpopulationgrowthandassociatedincreasesinwastegenerationrates.
8The“100-0-100”targetrefersto100%householdaccesstowatersupply;zeroslums;and100%householdaccesstosanitation(includingwastewatertreatmentandsolidwastecollection).9WorldBank(2012):WhataWaste:AGlobalReviewofSolidWasteManagement10Theremainingpercentageisproducedbyavarietyofsources,suchasmarkets(20%),streets(9%),publicfacilities(9%),offices(8%),andindustry(6%)
S Y N T H E S I S R E P O R T |4
Current operational practices require significant strengthening. The wastemanagement sector isstronglyunderfunded (both investmentsandoperational). Local governmentallocationsare small(average 2.6% of total APBD11) at $5-6 per capita/per annum – a rate that compares poorly tointernationalbenchmarks($15-20percapita/perannum).Wastemanagementsystemsareheavilysubsidizedfromlocalbudgets.Thelackofinvestmentinthesectorleadstosevereinefficienciesandmuchhigheroperatingcosts. There isvirtuallynoenforcementofsolidwaste lawsandstandards(fromcity-levelviolationstoindividualpolluters).Recyclingislargelyaninformalsectoractivity(15%of totalwaste)with formal recycling systems capturing less than 5%ofwaste generated. Lack ofcapacityinlocalgovernmentcreatesalackofconfidenceandunreasonablyhighriskstotheprivatesector-preventingadditionalinvestmentfromcrediblebusinesses.
11AnggaranPendapatanBelanjaDaerah(regionalexpenditurebudget)
S Y N T H E S I S R E P O R T |5
2 SCOPEANDMETHODOLOGY
2.1 Overview
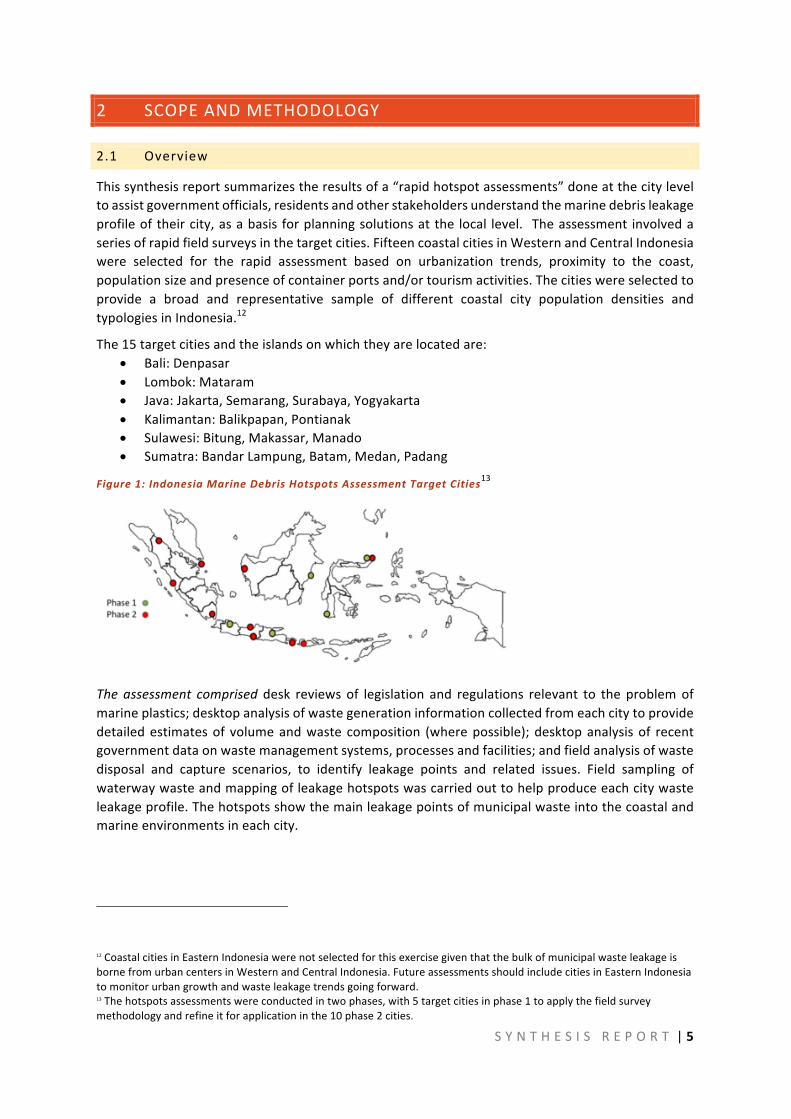
Thissynthesisreportsummarizestheresultsofa“rapidhotspotassessments”doneatthecityleveltoassistgovernmentofficials,residentsandotherstakeholdersunderstandthemarinedebrisleakageprofileoftheircity,asabasis forplanningsolutionsatthe local level. Theassessment involvedaseriesofrapidfieldsurveysinthetargetcities.FifteencoastalcitiesinWesternandCentralIndonesiawere selected for the rapid assessment based on urbanization trends, proximity to the coast,populationsizeandpresenceofcontainerportsand/ortourismactivities.Thecitieswereselectedtoprovide a broad and representative sample of different coastal city population densities andtypologiesinIndonesia.12
The15targetcitiesandtheislandsonwhichtheyarelocatedare:• Bali:Denpasar• Lombok:Mataram• Java:Jakarta,Semarang,Surabaya,Yogyakarta• Kalimantan:Balikpapan,Pontianak• Sulawesi:Bitung,Makassar,Manado• Sumatra:BandarLampung,Batam,Medan,Padang
Figure1:IndonesiaMarineDebrisHotspotsAssessmentTargetCities13
The assessment comprised desk reviewsof legislation and regulations relevant to the problemofmarineplastics;desktopanalysisofwastegenerationinformationcollectedfromeachcitytoprovidedetailedestimatesof volumeandwaste composition (wherepossible);desktopanalysisof recentgovernmentdataonwastemanagementsystems,processesandfacilities;andfieldanalysisofwastedisposal and capture scenarios, to identify leakage points and related issues. Field sampling ofwaterwaywasteandmappingofleakagehotspotswascarriedouttohelpproduceeachcitywasteleakageprofile.Thehotspotsshowthemainleakagepointsofmunicipalwasteintothecoastalandmarineenvironmentsineachcity.
12CoastalcitiesinEasternIndonesiawerenotselectedforthisexercisegiventhatthebulkofmunicipalwasteleakageisbornefromurbancentersinWesternandCentralIndonesia.FutureassessmentsshouldincludecitiesinEasternIndonesiatomonitorurbangrowthandwasteleakagetrendsgoingforward.13Thehotspotsassessmentswereconductedintwophases,with5targetcitiesinphase1toapplythefieldsurveymethodologyandrefineitforapplicationinthe10phase2cities.
S Y N T H E S I S R E P O R T |6
Eachcityreportpresents:• Overviewofmethodsusedfortheassessment,includingsurveylocationdetails;• Summaryofbaselineconditionsofwastemanagement,includingadministration,andland-use;• Estimatesofwastegenerationfromsurveyresults;• Findingsofwastesamplingandcharacterization;• Findingsonhotspotsmapping,landuseattheleakagepointsinwaterwaysandcoastalareas;• Reflectionsoncommunityprofiles,andfindingsfromcommunityattitudesinhotspotlocations;
and• Recommendations.
Caveatsandlimitations:Itisimportanttonotethatthisreportpresentssynthesisresultsof15city-levelrapidhotspotassessments,andisnotmeanttoreplacemorerigorousassessments.Aconsistentmethodology for qualitative/quantitative surveyswere followed for 15 target cities for a rangeofseasons,withone fieldvisitper city.Due todifferences in cities, typesof infrastructure,dataandcommunities, target locations, and accessibility, comparisons between cities should be cautiouslyinterpreted.Also,thefocusofthisassessment–especiallywastesampling–wasonplastics.
2.2 DetailedFieldSurveyMethodology
Thefieldassessmentswerecarriedoutintidalandnon-tidalzonesofthetargetcities.Forthesefieldsurveys,thetwozonesweredefinedasdownstream(tidal)andupstream(non-tidal)oftrashracksorotherinfrastructurebarriersplacedatthelaststationpriortothecoastalenvironmentinthecities’mainwaterways.Theassessment’sdeskreviewandfieldsurvey findings fromthenon-tidalzoneswereusedtopreparecitywasteprofiles,documentingwastegenerationvolume,collectionratesanddisposal mechanisms, municipal waste management budgets, staffing levels, equipment andinfrastructure (and their functioning) in addition todocumenting government and community-ledactivities to reduce overall waste, as well as identifying prevalent attitudes, behaviors andopportunitiesforimprovement.DetailsoftherapidassessmentmethodsaredescribedinAnnex1.
NON-TIDALZONESThe work completed in non-tidal zones focused on developing city waste management profiles,identifyingandmappingofhotspotsalongthecities’mainwaterwaysanddocumentingmunicipalwastemanagementservices,infrastructureandequipmentusedinwasteremovalalongandinthemainwaterways.Adedicatedfocuswasplacedonthecities’mainwaterwaysastheyareconsideredthemainarteriesforwasteleakagetocoastalenvironments.
The work examined the composition of waste drawn from samples in each of the cities’ mainwaterwaysatthelastphysicalbarrier(floodgates,littertraps,tidalgates)towastedischargingtothecoastalenvironmentabovethetidalinfluence.Themainwaterwaysflowingtothecoastalareasineach targetcity surveyed in thisassessmentare listed in thecity reports. Forwastecompositionanalysis, the plastics classification developed by the Convention for the Protection of theMarineEnvironmentoftheNorth-EastAtlantic(the‘OSPARConvention')wasusedasitprovidesthemostappropriateclassificationtotheIndonesiancontext.14
14OSPARCommission-BeachLitterStatisticalAnalysis14OSPARisthemechanismbywhich15GovernmentsandtheEuropeanUnioncooperatetoprotectthemarineenvironmentoftheNorth-EastAtlantic.
S Y N T H E S I S R E P O R T |7
Desk review and semi-structured interviews were used for collection of baseline information from localgovernment offices on organizational structure of municipal waste management, waste managementprotocols, type and condition ofwaste collection equipment andwastemanagement services related towasteextractionfromurbanwaterways.
Fieldsurveyswereconductedbyboatand,whereboattransitwasnotpossible,settlementsselectedforthesurveyswereidentifiedbyfollowingthewaterwaysonland.Settlementsselectedalongcitywaterwaysweresurveyed to identify waste leakage hotspots. Field surveys also included qualitative interviews withstakeholdersinselectedsettlementstodocumentlocalwastemanagementpracticesandrelatedhouseholdbehaviors.Low-incomeareaswereselectedasafocusduetotheirhighincidenceofwasteleakageintocitywaterways.
TIDALZONESThe tidal zones were defined for the purposes of the assessment as coastal areas, includingsettlements,downstreamofanytrashrackorsimilarinfrastructureand/orclearlypositionedattheend of waterways that have tidal flows. Sub-catchments in selected tidal zoneswere defined bymapping the foreshore area based on administrative status, demographics and land use fromgovernmentsources15.Ineachcity,datawerecollectedover3-5days,usingthefollowingqualitativeresearchtechniques:
DeskReview:Priortofieldvisitsineachcity,teamsreviewedonlinesourcesoneachcity’swastemanagementcontext, landusemapsandneighborhood-specific scansusingGoogleearth. Thehigher-incomehousingareas,tourismandrecreationareasaswellasharborandindustrialareas,havegreateraccesstoformalwastecollection services and so weremostly inspected via desk cameras, to ascertain whether there was anyevidenceofillegaldumpingorlikelylocationsworthcheckingontheground.Basedondeskreview,thefieldsurveyplanforforeshoremappingwasdeveloped,withafocusoninformalsettlementsandfishingvillagesexpectedtohavelessregulatedwastecollectionservices.
Fieldsurveysandobservationstoverifylandusemappingandinvestigatepre-identifiedwastedumpingareasintidalzones,teamswalkedthroughsettlementareasandconducteddrive-bysonmotorbikeorcanoe.Fieldobservationswerecarriedoutbyboat to reach lessaccessiblecoastalareas.Teamsusedan investigativeapproach to identify dumping areas and leakagehotspots. Photographic recordswere prepared for eachhotspot;markedformappingpurposes.
Semi-structured interviewswerecarriedoutwithresidents, traders,wastecollectorsand localgovernmentauthorities. The interview protocol was developed using the National Statistics Agency’s EnvironmentalBehaviors Survey, modifying select questions and including parameters to establish a community wasteprofile.Fieldreconnaissanceworkincludedtransectanalysisofslumhousingareas,marketplaces,industrialand unmarked buildings on the foreshore. Researchers used local community guides and approachedrespondentsinsitu,throughformalappointmentsandfollowupinterviews.
Integrativeanalyseswereconducteduponcompletionofthefieldwork.Afieldreportwaspreparedforeachcity,datafromtidalandnon-tidalareaswerecross-checkedandidentifiedhotspotswererecordedonGoogleEarthmaps,tyingtogethervariousdatastreamsandreflectingcommonsocialandculturalaspectsofthecommunitiessurveyed,acrosssettlementtypologiesandgeographicareas.
15JakartaUtaraDalamAngka2015,BPS(NationalStatisticsAgency):2014and2015;smartcityjakarta.go.id(Jakartacityadministrationsite);peta.BPN.go.id(landagencysiteswithmaps);GoogleMaps“streetview”function.
S Y N T H E S I S R E P O R T |8
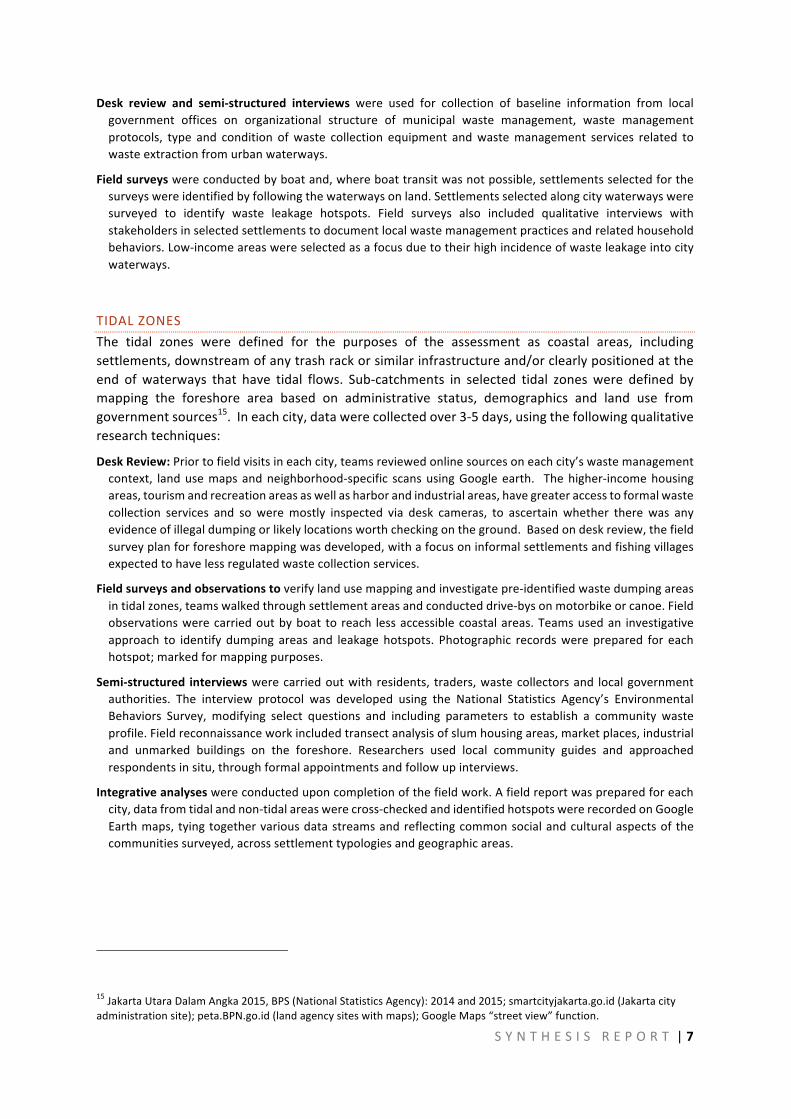
Box3:ExampleofTidalandNon-TidalZoneSurveyMethodsforJakarta
Tidalzonesurveyscollecteddatainthetidally influencedforeshoreareaofNorthJakarta.Datacollectioninvolveddirectobservationsandtargetedinterviewswithcommunitymembers.BasedontheforeshoremappingdoneusingGooglemaps,SmartcityandBPNmapsonline,surveyareasselectedwereMuaraKamal,Pluit/Penjaringan,KaliBaruandCilincing/Cakung.TheseareasarespreadfromWesttoEast,andcharacterizedbyinformalsettlementsandfishingvillagesthathavelessregulatedcollectionservices.
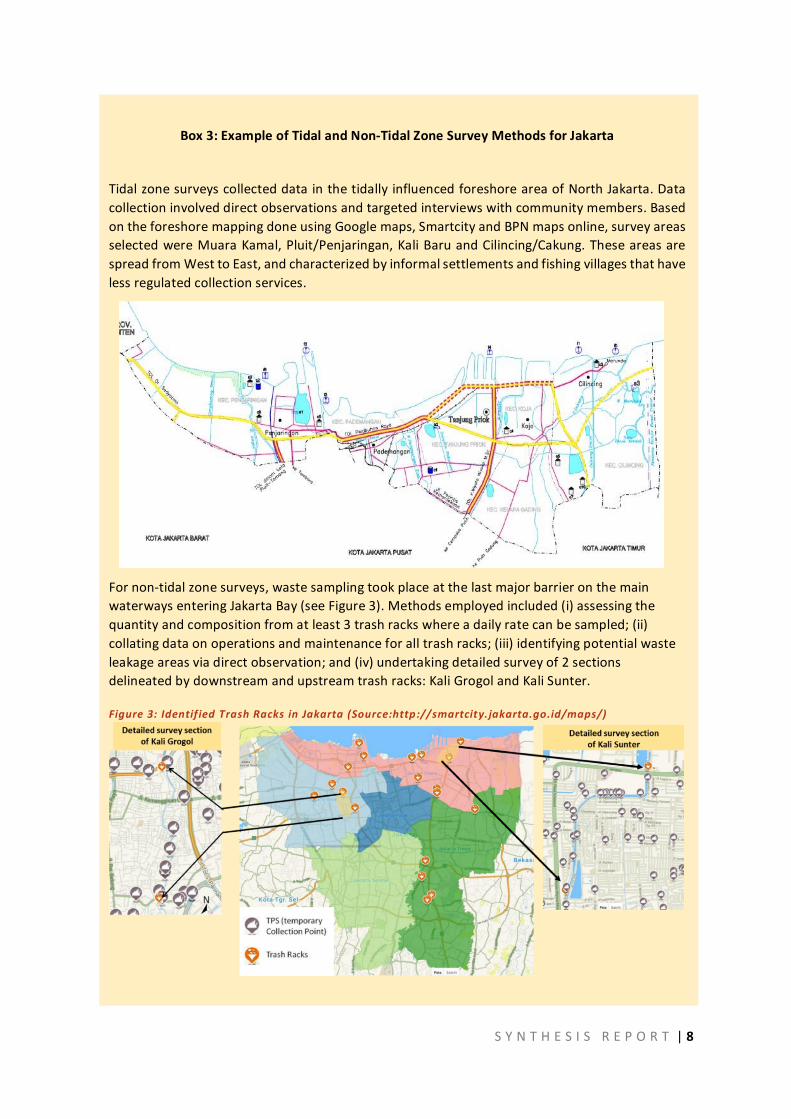
Fornon-tidalzonesurveys,wastesamplingtookplaceatthelastmajorbarrieronthemainwaterwaysenteringJakartaBay(seeFigure3).Methodsemployedincluded(i)assessingthequantityandcompositionfromatleast3trashrackswhereadailyratecanbesampled;(ii)collatingdataonoperationsandmaintenanceforalltrashracks;(iii)identifyingpotentialwasteleakageareasviadirectobservation;and(iv)undertakingdetailedsurveyof2sectionsdelineatedbydownstreamandupstreamtrashracks:KaliGrogolandKaliSunter.
Figure3:Identif iedTrashRacksinJakarta(Source:http://smartcity.jakarta.go.id/maps/)
S Y N T H E S I S R E P O R T |9
3 WASTEMANAGEMENT:BASELINECONDITIONS
3.1 AgenciesResponsibleforMunicipalSolidWaste
There are multiple ministries associated with waste management in Indonesia. Ministry ofEnvironment and Forestry (MoEF) has the responsibility for developing policies, formulatingregulations,andcoordinatingefforts inpollutioncontrol(wastecollection&recycling).MinistryofPublicWorksandHousing(MPWH)isgenerallylimitedtoprovidingtechnicaladvice,promotingpilotprojects,andconstructing/supervisinglarge-scaleoff-sitesolidwastefacilities(landfills).Althoughtheministries offer sectoral interlinkages across departments, persistent overlaps in their roles andresponsibilities adversely affect efficiency and effectiveness of execution of mandates andinstitutional responsibilities. There is limited monitoring of local government performance (e.g.Adipuraawards(MoEF),GreenCitiesIndex(Bappenas),KotaHijau(MPWH)).Enforcementislargelyabsent,bothatcommunitylevelandmanagementofwastefacilities.
In Indonesia, delineation is drawn between the collection, transfer and disposal pathwayresponsibilities of local government and communities. The Ministry of Home Affairs Regulation(Permendagri)No.33/2010addressesadministrativeaspectsofwastemanagementatthelevelofhouseholds, residential estates, commercial and industrial estates, aswell as at public and socialfacilities.
City and district governments are ultimately responsible for solid waste management (WasteManagement Act (No.18/2008). Local government regulations often fail to uphold nationalgovernmentlaws&policies.TheMunicipalPlanningAgencyandCleansingServicesUnitarethemainlocalgovernmentagenciesresponsibleforplanningandimplementationofsolidwastemanagement.However, the finances available to local governments are insufficient to cover the high recurrentexpendituresassociatedwith collectionand landfillmaintenance.And, the transferof solidwasteresponsibilitiestolocalgovernmentswasnotaccompaniedwithtransferofnecessarytechnicalskills.
Responsibilitiesforspecificstagesofwasteserviceprovisionareasfollows:• CollectionandtransportofhouseholdwastetoTemporaryDisposalSites(TPS)orIntermediateTransferFacilities(TPST)aretheresponsibilityoftheneighborhoodandcommunityorganizations(RT/RW)16
• Transport of waste from the TPS/TPST to the Landfill (TPA) is the responsibility of localgovernment
• CollectionandtransportofestatewastefromsourcetotheTPS/TPST,ordirectlytotheTPA,isthe responsibilityof theestatemanagement (residential, commercialor industrial).Collectionandtransportofwastefrompublicandsocialfacilitiesistheresponsibilityoflocalgovernment.
16RT/RWistheneighborhoodorganization(rukuntetangga-RT)withinanurbanvillage.TheactivitiesofseveralRTarecoordinatedbyacommunityorganization(rukunwarga–RW).RT/RWarevoluntaryinstitutions,establishedthroughdiscussionandagreementamongcommunities,whoseroleistocooperatewiththesub-districtorvillageheadtoadvancecommunityempowerment.EachRTandRWhasahead,secretaryandtreasurer.RTandRWactivitiesarenotsalaried.Operationalfundingisthroughsub-districtorvillagebudgetandfromhigherlevelgrants.
S Y N T H E S I S R E P O R T |10
3.2 AgenciesResponsibleforWasteManagementinWaterways
InIndonesia,institutionaloversightdiffersforthemanagementofthesolidwastefromhouseholdand in waterways.Municipal solid waste (MSW)management is typically done by the CleansingDepartment (Seksi Kebersihan) of each district, with household level collection delegated to thelowestlevelsofgovernment.Ontheotherhand,managingMSWinwaterwaysishandledbydifferentdepartments,dependingonthecity.Someexamplesfollowbelow.
JAKARTA:InDKIJakarta,theWaterwaysManagementUnit(UPKBadanAir)withintheCleansingDepartmentisresponsible for removing floatingwaste fromwaterways, includingmanagementof trash racks and trashtrap/net/buoy locations instreams.Wastecollected fromwaterways is thentransported,usingsmallandmediumtrucks,totheemplacementlocation(transferstation).Thereare3transferstationsinDKIJakartaviz. WadukPluitEmplacement,PerintisKemerdekaanEmplacement,andMarundaEmplacement.WadukPluitEmplacementaccommodatesMSWfromwaterwaysinNorthJakartaandWestJakarta,whilePerintisEmplacementreceiveMWSfromwaterwaysinSouthJakarta,EastJakarta,CentralJakarta,andNorthJakarta.
MAKASSAR:WastemanagementinwaterwaysofMakassarCityismanagedbyParkandCleansingDepartmentin collaboration with Public Works Department and Marine, Fisheries, Agriculture, Animal HusbandryDepartment (DKP3 – Dinas Kelautan, Perikanan, Pertanian, Peternakan). The Public Works Department(DrainageDivision)isresponsibleforwastemanagementinallstreamsandcanals–collectionofwastefromthewaterways,transfertothePWDtrucks,andtransporttotheFDSatTamangapa.DKP3isresponsibleforwaste management around the shore –using 3 boats called Pattasa’ki to handle waste sweeping andcollectionparticularlyalongtheLosaribeachwaterfront.ThewasteneedstobebaggedpriortotransfertolandcollectionpointsfortheParkandCleansingDepartmenttruckfleettotransportittotheFDS.
BALIKPAPAN:Balikpapan’swaterwaysarediverseinsize.Althoughtherearenomechanicalscreensortrashracks installedon thecity’smainwaterways, thePublicWorksDepartment is responsible formaintainingwaterflowinthecity’scanalsandremovingwastefromthewaterwayswhichitdoesbymeansofmanualstemmednets.Forwaterwayswithawidthof lessthan1meter,cleansingactivity isconductedbyDKPP,whilethecleansingactivityforwaterwayswithawidthofmorethan1meteristheresponsibilityofPublicWorksDepartmentundertheDrainageTechnicalImplementationUnit(UPT).Mostalltheprimarychannels(thoseemptyingtothesea)aremorethan1meterinwidthandthereforetheresponsibilityoftheUPT.
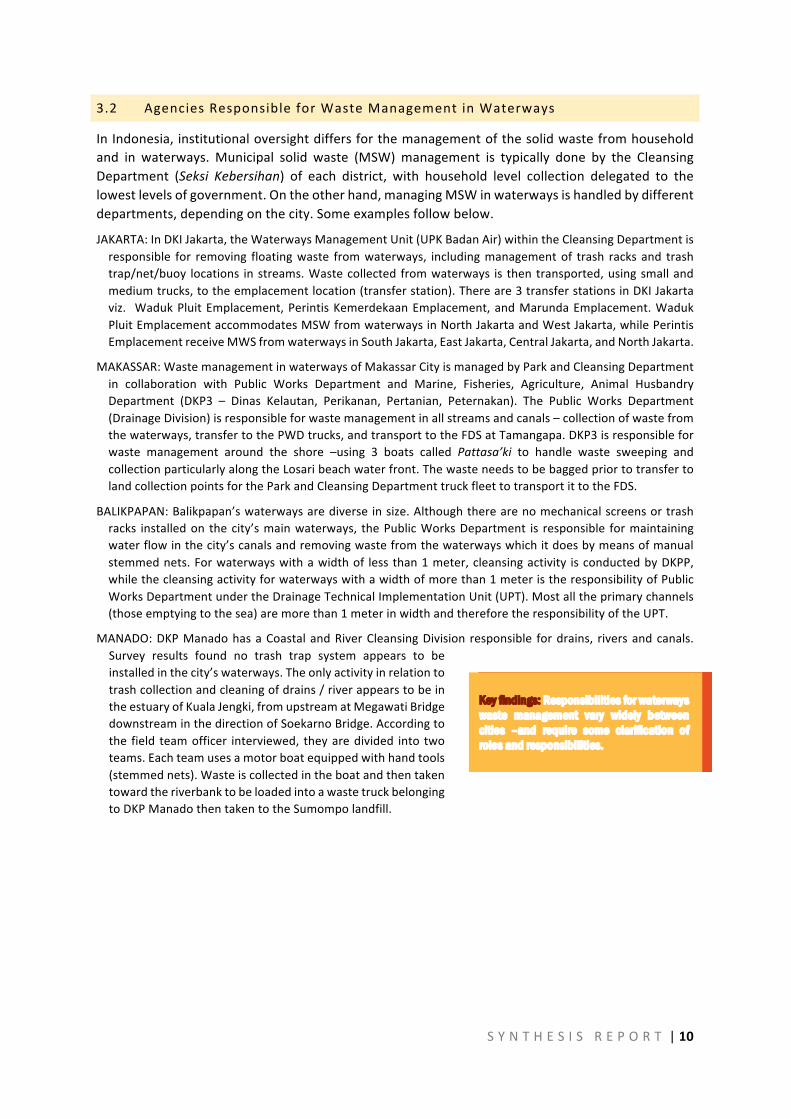
MANADO:DKPManadohasaCoastalandRiverCleansingDivision responsible fordrains, riversandcanals.Survey results found no trash trap system appears to beinstalledinthecity’swaterways.Theonlyactivityinrelationtotrashcollectionandcleaningofdrains/riverappearstobeintheestuaryofKualaJengki,fromupstreamatMegawatiBridgedownstreaminthedirectionofSoekarnoBridge.Accordingtothe field teamofficer interviewed, theyaredivided intotwoteams.Eachteamusesamotorboatequippedwithhandtools(stemmednets).WasteiscollectedintheboatandthentakentowardtheriverbanktobeloadedintoawastetruckbelongingtoDKPManadothentakentotheSumompolandfill.
Key findings: Responsibilities for waterways waste management vary widely between cities –and require some clarification of roles and responsibilities.
S Y N T H E S I S R E P O R T |11
3.3 ConsideringCityTiersforSupportingSolidWasteManagement
As part of the preparation of an upcoming solid waste management World Bank loan, acomprehensiveevaluationof104citiesandurbandistrictswithpopulationsover100,000peoplewasdone to identify the different levels at which national resources will be focused. The immensechallenges,shortagesoffinancingandthewiderangesinperformanceandcommitmenttoimprovesolidwastemanagement across Indonesia’s cities anddistricts necessitates a process to prioritizeresourcestothemostimpactfulinterventions.Fromtheverybeginning,therewasstrongconsensusamongstgovernmentleadersthattheloanprogramactivitiesshouldbestructuredtofocusresourcesoncities/districtsthatpossessthemostpromisetoimplementwastemanagementsystemsthatcanbearolemodelforallotherIndonesiancities.
Thecitiesweredividedintothreetiersdependingontheircurrentperformanceandcommitmenttosolidwastemanagement improvements.Themarinehotspotassessmentandthe loanpreparationaligninseveralareas,includingthefocusoncitiesindifferenttiers,where11of15citiesinthehotspotassessment were identified under tier 1 and 2 for potential investments under the solid wastemanagementprogramloan.
Tier1 citiesanddistricts are those thatdemonstrated thehighest levelsofpastperformanceandcommitment These cities are deemed to have demonstrated sufficient capacity in solid wastemanagementtojustifylargeinvestmentsincomplexsystemsandadvancedtreatmenttechnologies.Tier2citiesanddistrictswerethosethatwerefoundtohaveaveragepastperformanceandpossessingmediumpotentialforfutureimprovement.Theywereconsideredtohavestrongpotentialforsmallerorincrementaltypeinvestments,butnotfullsystemsinitially.TheremainingcitiesanddistrictswereclassifiedasTier3,whichindicatedthatpastperformanceandcurrentperceivedcommitmentmadetheseareasalowpriorityandwouldnotlikelybeincludedintheprogramconsideringthelowlevelsofresourcescurrentlyavailable.
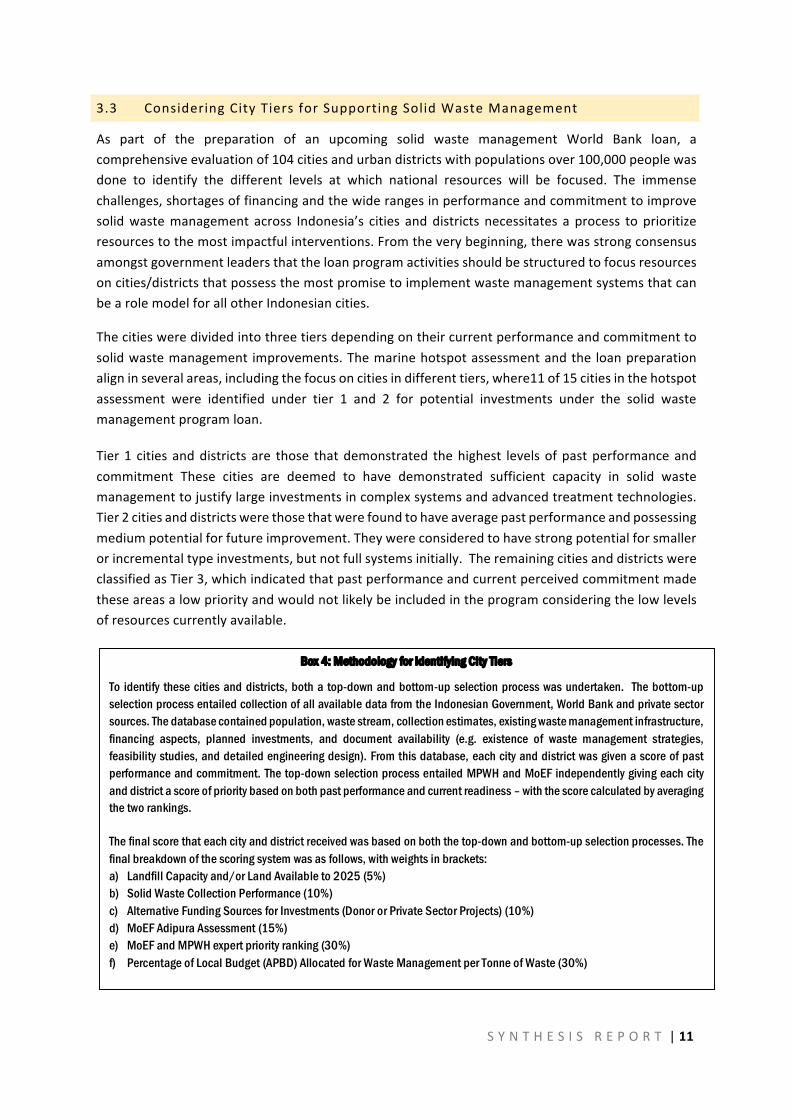
Box 4: Methodology for Identifying City Tiers
To identify these cities and districts, both a top-down and bottom-up selection process was undertaken. The bottom-up selection process entailed collection of all available data from the Indonesian Government, World Bank and private sector sources. The database contained population, waste stream, collection estimates, existing waste management infrastructure, financing aspects, planned investments, and document availability (e.g. existence of waste management strategies, feasibility studies, and detailed engineering design). From this database, each city and district was given a score of past performance and commitment. The top-down selection process entailed MPWH and MoEF independently giving each city and district a score of priority based on both past performance and current readiness – with the score calculated by averaging the two rankings.
The final score that each city and district received was based on both the top-down and bottom-up selection processes. The final breakdown of the scoring system was as follows, with weights in brackets: a) Landfill Capacity and/or Land Available to 2025 (5%) b) Solid Waste Collection Performance (10%) c) Alternative Funding Sources for Investments (Donor or Private Sector Projects) (10%) d) MoEF Adipura Assessment (15%) e) MoEF and MPWH expert priority ranking (30%) f) Percentage of Local Budget (APBD) Allocated for Waste Management per Tonne of Waste (30%)
S Y N T H E S I S R E P O R T |12
3.4 SurveyofLandUseActivitiesandWastePatterns
Hotspotswere identified inthree landusetypes:beachandrecreationareas;humansettlements;andlightindustrialzonesandurbanareas.Eachofthesetypesoflanduseandhotspotlocationshavedifferentpatternsofwastedisposal.
BeachandrecreationareasTheseareasarewell-knownlocaldestinations,mostlyforlocalrecreationwhere city residents spend time, particularly on weekends and public holidays. Nearly all citiessurveyedhavesuchrecreationzones.Theseareastypicallyhavealimitednumberofwastebins,ofteninadequate in number, poorly located, and/or not emptied at the required frequency given thevolumeofuse.Assuch,muchofthewastegenerateddoesnotgetdisposedofinthebinsavailable,whichareoftenoverflowing.Insomelocations,localcleaningpersonnelburythewasteinthesand,whichisthendugupbydogsoruncoveredbytides,andwashedtosea.
HumansettlementsAcrossallcitiessurveyed,plasticswastehotspotswereidentifiedinsettlementsin the tidal zone.Thesearemainlydenselypopulated, low-incomehousingareasand/or informalhousingareaswithsemi-permanenthousingandlimitedfacilities.Whileelitehousingcomplexesarealso located insomecoastalareas(e.g.,northJakartaPluitarea),provisionofwastemanagementservices in those locations was found to be adequate. It is the poor settlements that are morewidespread, have greater population densities and higher waste volumes that suffer from lessfrequentwasteremovalserviceprovision.Theidentifiedhotspotsareoftenlocatedontheedgeofthesesettlements,atlocationsresidentscaneasilyaccessandwhichmayormaynotbe‘outofsight’,suchasoveraculvertorunderabridge.Floatingsettlements–housingareassuspendedoverthewater-werefoundinmanycitiesand,whilethesemayappearasobvioushotspotssinceresidentscanthrowtheirhouseholdwastestraightthroughtheirfloorboardsintothesea,thesesettlementsoftendohavesufficientcollectionservices.
LightindustrialzonesandcommonurbanareasAlongshorelines,inmostcities,therearesectionszonedforlightindustry,closedorwithlimitedpublicaccessandmanagedbyaprivateorgovernmententity,suchastheportauthority.Fishmarketsareoftenlocatedinthesezones.Thesurveyalsonotedcommonareasdemarcatedforpublicusewithinurbanprecincts,wherepeoplecongregate,eatandtrade.Theindustrialzonesarehardertoaccessandcouldcontainhotspots,butlimitedaccessduringthesurveyperiodmadeitdifficulttoascertain.Conversely,openpublicareasareeasilyaccessedandwere not found to have large accumulations of waste. However, the surveys did confirm wastedisposaloverboardwalksdirectintothesea.Whiletherewerefewerhotspotsidentifiedinsuchareas,theyarenotedasoneoftheprinciplelandusesinthetidalzonesofthesurveyedcities.
S Y N T H E S I S R E P O R T |13
3.5 WasteManagementInfrastructureinTargetCities
Findingspresentedhereinareasynthesisofthetargetcitiessurveyed,withexampleshighlightingcommonpointsanduniquefeaturesthatcanbereplicated.
3.5.1 WasteBanks17
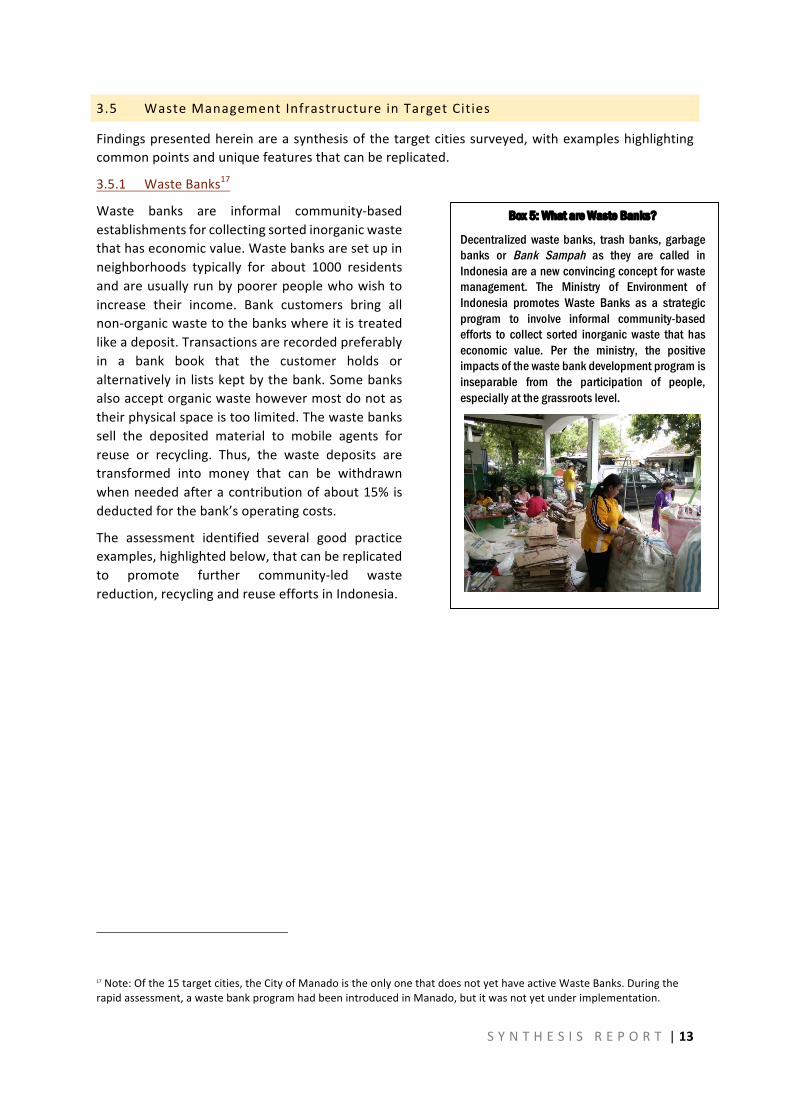
Waste banks are informal community-basedestablishmentsforcollectingsortedinorganicwastethathaseconomicvalue.Wastebanksaresetupinneighborhoods typically for about 1000 residentsandareusuallyrunbypoorerpeoplewhowishtoincrease their income. Bank customers bring allnon-organicwastetothebankswhereitistreatedlikeadeposit.Transactionsarerecordedpreferablyin a bank book that the customer holds oralternatively in listskeptbythebank.Somebanksalsoacceptorganicwastehowevermostdonotastheirphysicalspaceistoolimited.Thewastebankssell the deposited material to mobile agents forreuse or recycling. Thus, the waste deposits aretransformed into money that can be withdrawnwhenneededafteracontributionofabout15%isdeductedforthebank’soperatingcosts.
The assessment identified several good practiceexamples,highlightedbelow,thatcanbereplicatedto promote further community-led wastereduction,recyclingandreuseeffortsinIndonesia.
17Note:Ofthe15targetcities,theCityofManadoistheonlyonethatdoesnotyethaveactiveWasteBanks.Duringtherapidassessment,awastebankprogramhadbeenintroducedinManado,butitwasnotyetunderimplementation.
Box 5: What are Waste Banks?
Decentralized waste banks, trash banks, garbage banks or Bank Sampah as they are called in Indonesia are a new convincing concept for waste management. The Ministry of Environment of Indonesia promotes Waste Banks as a strategic program to involve informal community-based efforts to collect sorted inorganic waste that has economic value. Per the ministry, the positive impacts of the waste bank development program is inseparable from the participation of people, especially at the grassroots level.
S Y N T H E S I S R E P O R T |14
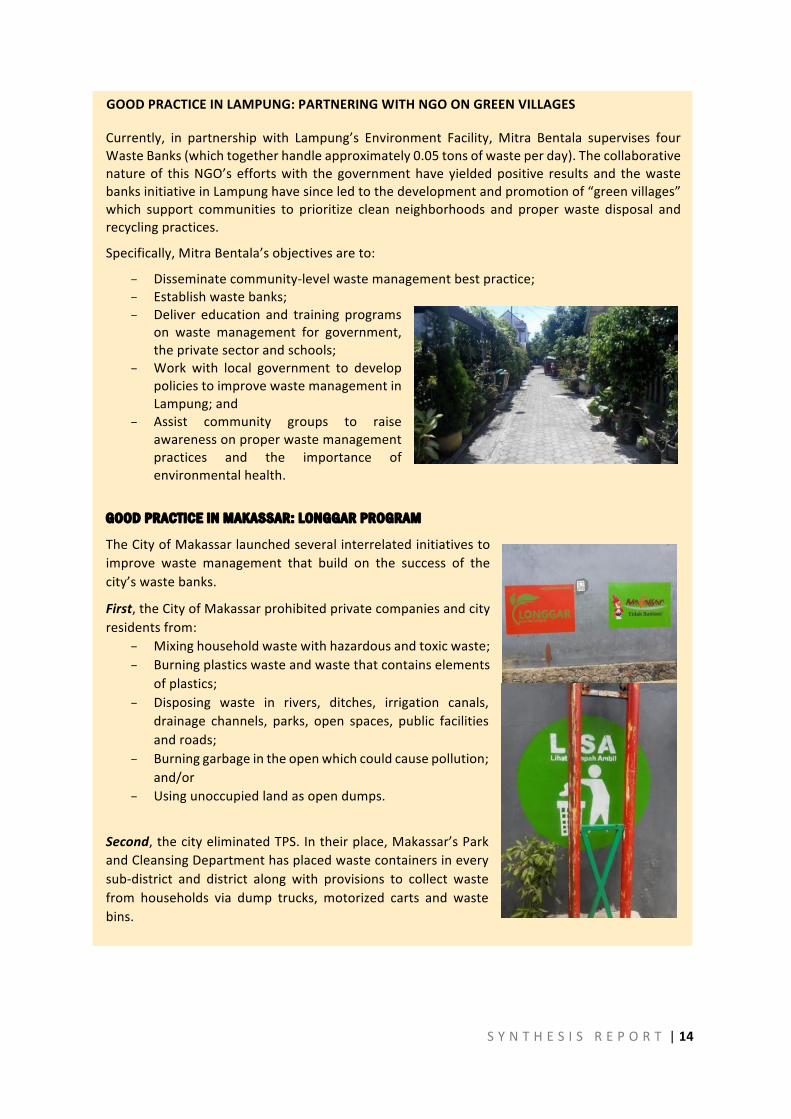
GOODPRACTICEINLAMPUNG:PARTNERINGWITHNGOONGREENVILLAGES
Currently, in partnership with Lampung’s Environment Facility, Mitra Bentala supervises fourWasteBanks(whichtogetherhandleapproximately0.05tonsofwasteperday).Thecollaborativenatureof thisNGO’seffortswith thegovernmenthaveyieldedpositive results and thewastebanksinitiativeinLampunghavesinceledtothedevelopmentandpromotionof“greenvillages”which support communities to prioritize clean neighborhoods and properwaste disposal andrecyclingpractices.
Specifically,MitraBentala’sobjectivesareto:
– Disseminatecommunity-levelwastemanagementbestpractice;– Establishwastebanks;– Deliver education and training programs
on waste management for government,theprivatesectorandschools;
– Work with local government to developpoliciestoimprovewastemanagementinLampung;and
– Assist community groups to raiseawarenessonproperwastemanagementpractices and the importance ofenvironmentalhealth.
GOOD PRACTICE IN MAKASSAR: LONGGAR PROGRAM
TheCityofMakassarlaunchedseveralinterrelatedinitiativestoimprove waste management that build on the success of thecity’swastebanks.
First,theCityofMakassarprohibitedprivatecompaniesandcityresidentsfrom:– Mixinghouseholdwastewithhazardousandtoxicwaste;– Burningplasticswasteandwastethatcontainselements
ofplastics;– Disposing waste in rivers, ditches, irrigation canals,
drainage channels, parks, open spaces, public facilitiesandroads;
– Burninggarbageintheopenwhichcouldcausepollution;and/or
– Usingunoccupiedlandasopendumps.
Second,thecityeliminatedTPS.Intheirplace,Makassar’sParkandCleansingDepartmenthasplacedwastecontainersineverysub-district and district along with provisions to collect wastefrom households via dump trucks, motorized carts and wastebins.
S Y N T H E S I S R E P O R T |15
Third,theMayorlaunchedtheLONGGARprogramtopromotecleanandhealthyenvironmentsinthecity’salleysthroughalleywaygatecleaning,graffitiremoval,installationofpergolas,wallpaintingsandhorticultureplantsinadditiontositing90x40cmwastebinswithsteelstands.The program has been successfully established in 42 alleys in 14 districts since 2015; anadditional28alleyswereunderdevelopmentin2016atthetimeofthisassessment.
Fourth, the LONGGAR program is alignedwiththecity’sLISAprogram(LihatSampahAmbil–SeeWasteTakeIt).Together,thesesteps have functioned to promote theMayor’s ‘Makassar Tidak Rantasa’(Makassar is Not Dirty) program furthercomplementingtheeffortspromotedbythecity’swastebanks.
3.5.2 WaterwayWasteInfrastructureandOperations
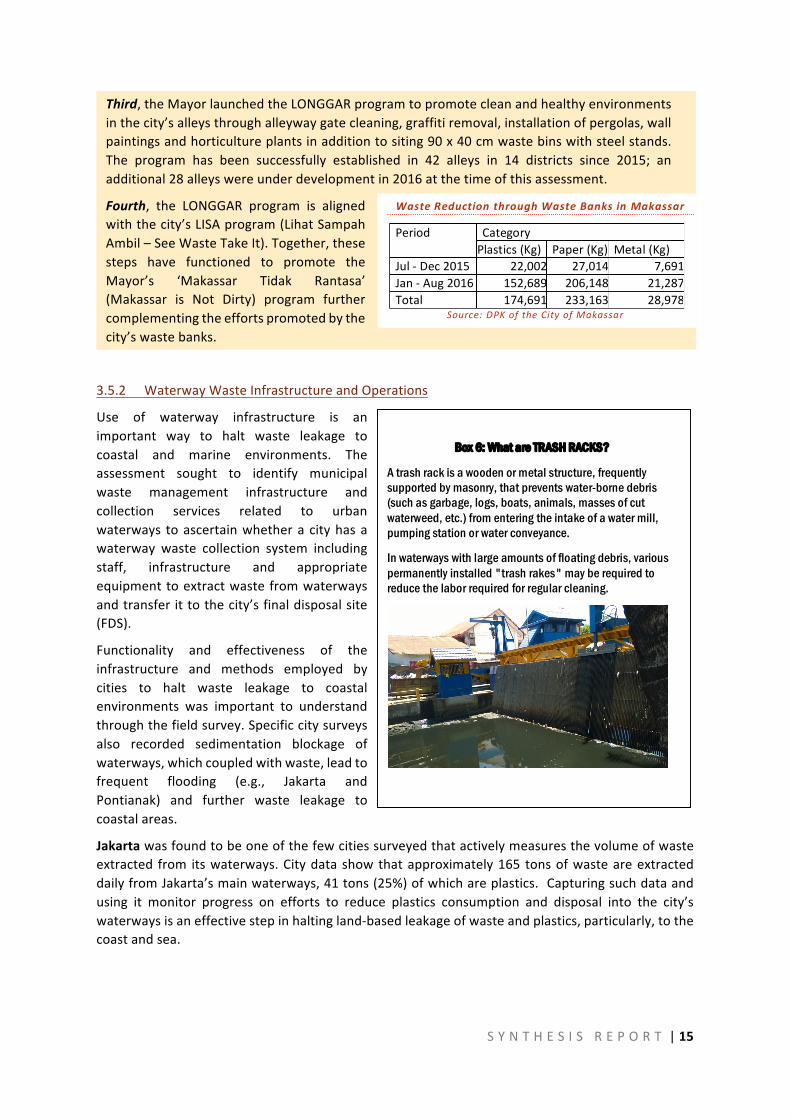
Use of waterway infrastructure is animportant way to halt waste leakage tocoastal and marine environments. Theassessment sought to identify municipalwaste management infrastructure andcollection services related to urbanwaterways toascertainwhethera cityhasawaterway waste collection system includingstaff, infrastructure and appropriateequipmenttoextractwastefromwaterwaysandtransferittothecity’sfinaldisposalsite(FDS).
Functionality and effectiveness of theinfrastructure and methods employed bycities to halt waste leakage to coastalenvironments was important to understandthroughthefieldsurvey.Specificcitysurveysalso recorded sedimentation blockage ofwaterways,whichcoupledwithwaste,leadtofrequent flooding (e.g., Jakarta andPontianak) and further waste leakage tocoastalareas.
Jakartawasfoundtobeoneofthefewcitiessurveyedthatactivelymeasuresthevolumeofwasteextracted from itswaterways.Citydatashowthatapproximately165 tonsofwasteareextracteddailyfromJakarta’smainwaterways,41tons(25%)ofwhichareplastics.Capturingsuchdataandusing it monitor progress on efforts to reduce plastics consumption and disposal into the city’swaterwaysisaneffectivestepinhaltingland-basedleakageofwasteandplastics,particularly,tothecoastandsea.
Box 6: What are TRASH RACKS?
A trash rack is a wooden or metal structure, frequently supported by masonry, that prevents water-borne debris (such as garbage, logs, boats, animals, masses of cut waterweed, etc.) from entering the intake of a water mill, pumping station or water conveyance.
In waterways with large amounts of floating debris, various permanently installed "trash rakes" may be required to reduce the labor required for regular cleaning.
WasteReductionthroughWasteBanksinMakassar
Period CategoryPlastics(Kg) Paper(Kg) Metal(Kg)
Jul-Dec2015 22,002 27,014 7,691Jan-Aug2016 152,689 206,148 21,287Total 174,691 233,163 28,978
Source: DPKoftheCity of Makassar
S Y N T H E S I S R E P O R T |16
InPontianak,anothercitythatsystematicallycollectsdataonwasteextractedfromitswaterways,itwasconfirmedthat24m3ofwasteareextracteddailyfromthecity’swaterwaysandtransportedtotheBatuLayanglandfill.Citystaffextractwastefromwaterwaysusingwastecatchersorbarrierssuchasbarscreens,trapnetsandbamboosticktraps.Withanaverageof283workingdaysperyear,theamountofwastecollectedfromPontianak’swaterwaysandtransportedtolandfillannuallyis6,792m3.
InManadoandBalikpapan,bothcitiesthatdonothavetrashrack infrastructureinstalledintheirwaterways,waterwaywasteiscollectedmanuallybyboat,butthevolumeandcompositionisnotrecorded.Inothercitieswheretherearenoracksinplaceoroperating,suchasinYogyakarta,Medan,BitungandBatam18,wasteleakageflowsdirecttothecoastwithlimitedopportunitiesformunicipalagentstoremovethewastebeforeitreachesthecoast.
Eachofthecityreportspresentedinthetechnicalvolumeincludeanassessmentofthestatusandcondition of all trash racks in place on the city’s main waterways. For example, in Jakarta, datacollectedonthelocation,conditionandfunctionoftrashracksispresentedinTable6toinformlocalgovernmentwheremaintenanceworkisneededtoensurethatallofJakarta’strashracksarebroughtbacktofullfunctionalitytosupportwasteleakagepreventioneffortstoJakarta’scoastalareaandJavasea.
Table6:JakartaTrashRackLocation,ConditionandFunction–SUNTERRIVER
#Location
Area TrashRackCondition
%Function
Sub-District District
1 PumpStationandTrashRackIKIP(PintuAir8)
KelapaGadingBarat
KelapaGading
2MEHRobots,Work:1,Bamboo
MEHRobot:50%BambooScreen:70%
2 PasarUlar RawaBadakUtara
Koja 6MEHRobots,Work:1
MEHRobot:16.7%
3 SunterKresek Koja Koja 18Trashtrapscreen,NoRobot
Screen:80%
4 PerintisEmplacement KelapaGadingTimur
KelapaGading
Barscreen,ExcavatorAmphibious
Screen:50%
Source:ExtractedfromIndonesiaMarineDebrisRapidHotspotsAssessmentNon-TidalZoneFieldSurvey,2016
18Note:Batamhasonerotaryscreeninstalledbutonlyonatrialbasisanditisinaprivateresidentialareasoforthepurposeofthisassessment,itisnotconsideredafullyfunctioningtrashrackmanagedbythecityonamainwaterway.
S Y N T H E S I S R E P O R T |17
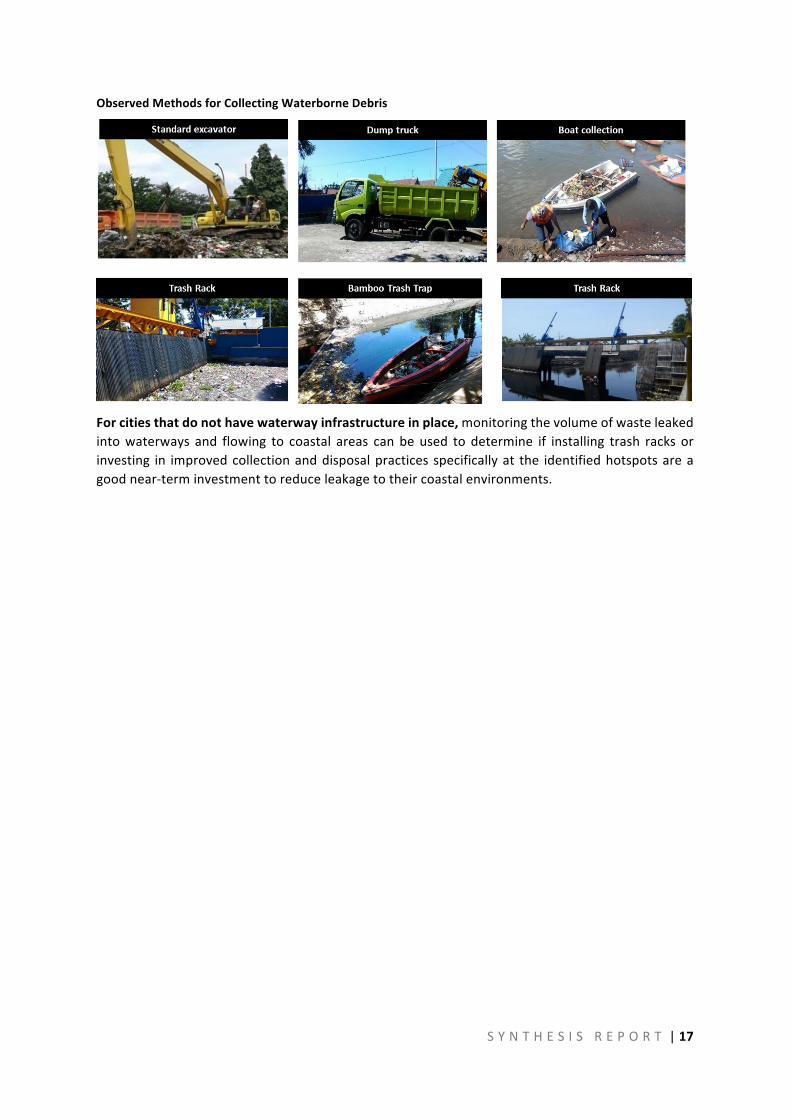
ObservedMethodsforCollectingWaterborneDebris
Forcitiesthatdonothavewaterwayinfrastructureinplace,monitoringthevolumeofwasteleakedintowaterways and flowing to coastal areas canbeused to determine if installing trash racks orinvesting in improvedcollectionanddisposalpracticesspecificallyat the identifiedhotspotsareagoodnear-terminvestmenttoreduceleakagetotheircoastalenvironments.
S Y N T H E S I S R E P O R T |18
4 WASTEGENERATIONESTIMATIONS
4.1 MunicipalSolidWaste(MSW)GenerationRates:Modelling
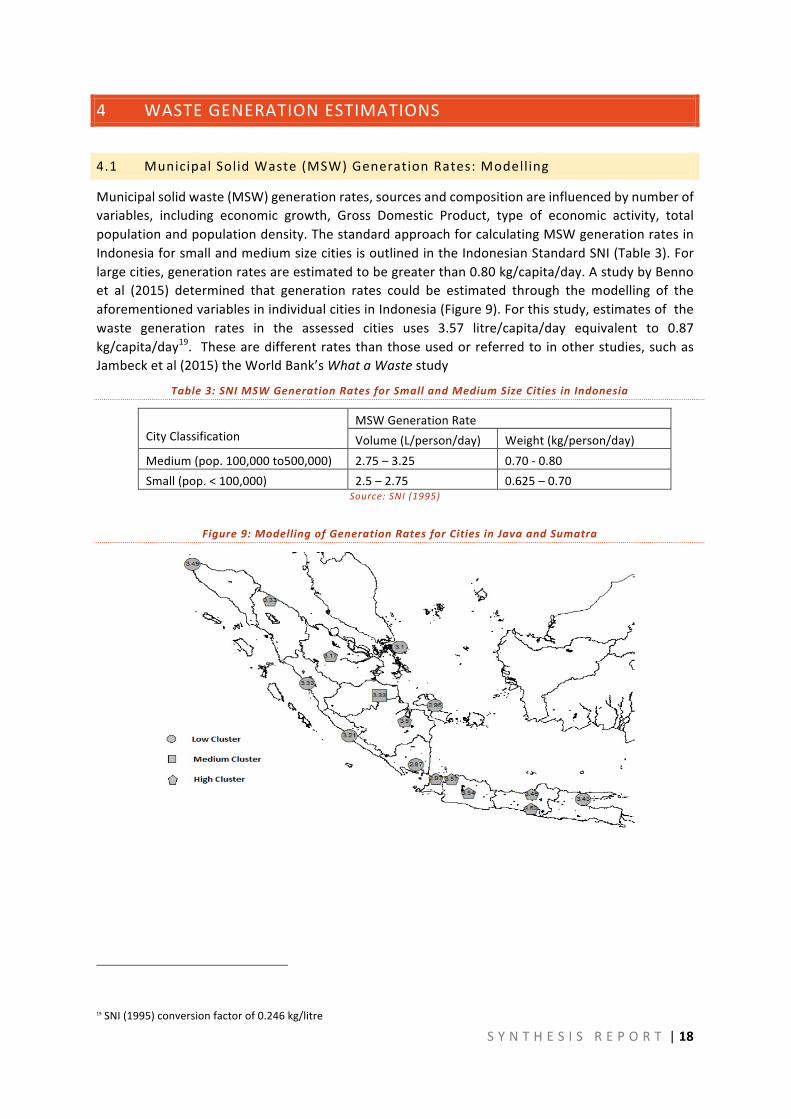
Municipalsolidwaste(MSW)generationrates,sourcesandcompositionareinfluencedbynumberofvariables, including economic growth, Gross Domestic Product, type of economic activity, totalpopulationandpopulationdensity.ThestandardapproachforcalculatingMSWgenerationratesinIndonesiaforsmallandmediumsizecitiesisoutlinedintheIndonesianStandardSNI(Table3).Forlargecities,generationratesareestimatedtobegreaterthan0.80kg/capita/day.AstudybyBennoet al (2015) determined that generation rates could be estimated through the modelling of theaforementionedvariablesinindividualcitiesinIndonesia(Figure9).Forthisstudy,estimatesofthewaste generation rates in the assessed cities uses 3.57 litre/capita/day equivalent to 0.87kg/capita/day19. Thesearedifferentratesthanthoseusedorreferredto inotherstudies,suchasJambecketal(2015)theWorldBank’sWhataWastestudy
Table3:SNIMSWGenerationRatesforSmallandMediumSizeCitiesinIndonesia
CityClassification
MSWGenerationRateVolume(L/person/day) Weight(kg/person/day)
Medium(pop.100,000to500,000) 2.75–3.25 0.70-0.80Small(pop.<100,000) 2.5–2.75 0.625–0.70
Source:SNI(1995)
Figure9:ModellingofGenerationRatesforCitiesinJavaandSumatra
19SNI(1995)conversionfactorof0.246kg/litre
S Y N T H E S I S R E P O R T |19
SourcesofMSW:DomesticMSWtypicallyaccountsfor upwards of 75% of urban waste generation inIndonesia (Table4). In larger cities, like Jakarta andSurabaya, domestic waste is expected to be lowerrelativetocommercial/industrialsources.Forsmallercities, like Manado and Padang, the opposite isexpected; higher domestic and lower commercialwastevolumes.
4.2 WasteGenerationandCollectionRates:SurveyResults
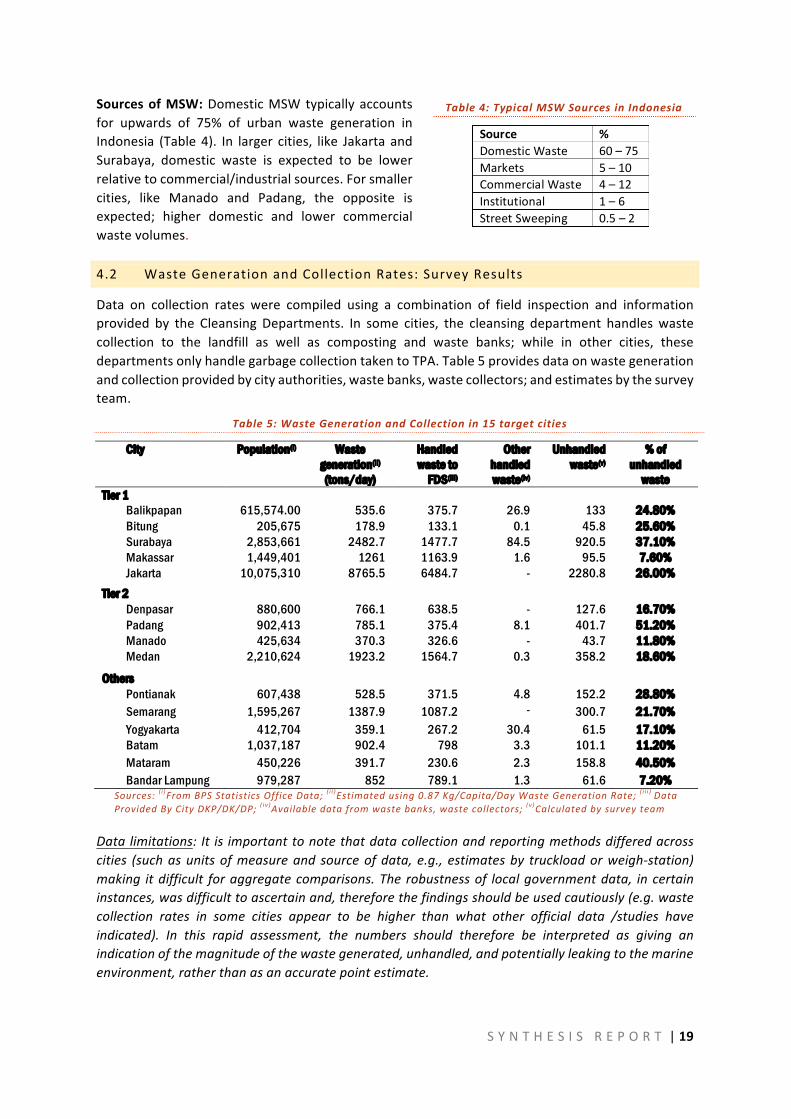
Data on collection rates were compiled using a combination of field inspection and informationprovided by the Cleansing Departments. In some cities, the cleansing department handleswastecollection to the landfill as well as composting and waste banks; while in other cities, thesedepartmentsonlyhandlegarbagecollectiontakentoTPA.Table5providesdataonwastegenerationandcollectionprovidedbycityauthorities,wastebanks,wastecollectors;andestimatesbythesurveyteam.
Table5:WasteGenerationandCollectionin15targetcities
City Population(i) Waste generation(ii) (tons/day)
Handled waste to
FDS(iii)
Other handled waste(iv)
Unhandled waste(v)
% of unhandled
waste Tier 1 Balikpapan 615,574.00 535.6 375.7 26.9 133 24.80% Bitung 205,675 178.9 133.1 0.1 45.8 25.60% Surabaya 2,853,661 2482.7 1477.7 84.5 920.5 37.10% Makassar 1,449,401 1261 1163.9 1.6 95.5 7.60% Jakarta 10,075,310 8765.5 6484.7 - 2280.8 26.00%
Tier 2 Denpasar 880,600 766.1 638.5 - 127.6 16.70% Padang 902,413 785.1 375.4 8.1 401.7 51.20% Manado 425,634 370.3 326.6 - 43.7 11.80% Medan 2,210,624 1923.2 1564.7 0.3 358.2 18.60%
Others Pontianak 607,438 528.5 371.5 4.8 152.2 28.80% Semarang 1,595,267 1387.9 1087.2 - 300.7 21.70% Yogyakarta 412,704 359.1 267.2 30.4 61.5 17.10% Batam 1,037,187 902.4 798 3.3 101.1 11.20% Mataram 450,226 391.7 230.6 2.3 158.8 40.50% Bandar Lampung 979,287 852 789.1 1.3 61.6 7.20%
Sources:( i )FromBPSStatisticsOfficeData;( i i )Estimatedusing0.87Kg/Capita/DayWasteGenerationRate;( i i i ) DataProvidedByCityDKP/DK/DP;( iv )Availabledatafromwastebanks,wastecollectors;(v )Calculatedbysurveyteam
Datalimitations: It is importanttonotethatdatacollectionandreportingmethodsdifferedacrosscities (suchasunitsofmeasureand sourceofdata, e.g., estimatesby truckloadorweigh-station)making itdifficult foraggregatecomparisons.The robustnessof localgovernmentdata, incertaininstances,wasdifficulttoascertainand,thereforethefindingsshouldbeusedcautiously(e.g.wastecollection rates in some cities appear to be higher than what other official data /studies haveindicated). In this rapid assessment, the numbers should therefore be interpreted as giving anindicationofthemagnitudeofthewastegenerated,unhandled,andpotentiallyleakingtothemarineenvironment,ratherthanasanaccuratepointestimate.
Table4:TypicalMSWSourcesinIndonesia
Source %DomesticWaste 60–75Markets 5–10CommercialWaste 4–12Institutional 1–6StreetSweeping 0.5–2
S Y N T H E S I S R E P O R T |20
5 WASTESAMPLINGANDCHARACTERIZATION
5.1 MunicipalSolidWasteComposition
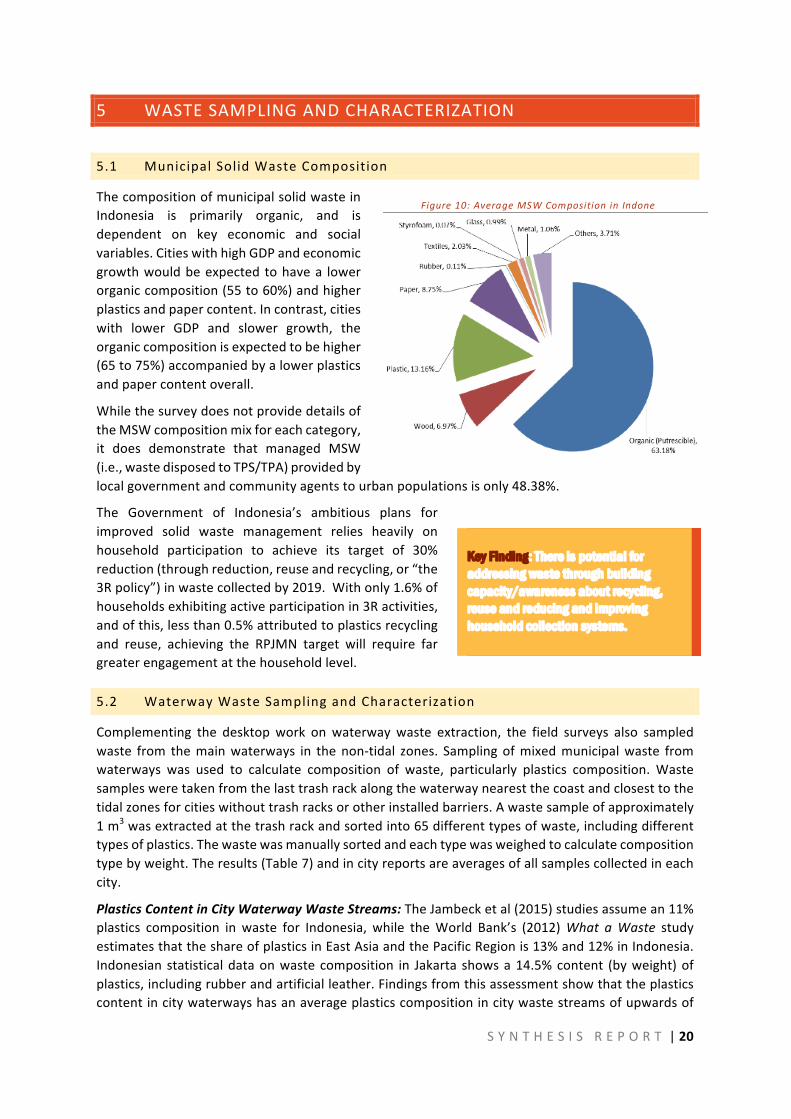
ThecompositionofmunicipalsolidwasteinIndonesia is primarily organic, and isdependent on key economic and socialvariables.CitieswithhighGDPandeconomicgrowthwouldbeexpectedtohavea lowerorganiccomposition(55to60%)andhigherplasticsandpapercontent.Incontrast,citieswith lower GDP and slower growth, theorganiccompositionisexpectedtobehigher(65to75%)accompaniedbyalowerplasticsandpapercontentoverall.
WhilethesurveydoesnotprovidedetailsoftheMSWcompositionmixforeachcategory,it does demonstrate that managed MSW(i.e.,wastedisposedtoTPS/TPA)providedbylocalgovernmentandcommunityagentstourbanpopulationsisonly48.38%.
The Government of Indonesia’s ambitious plans forimproved solid waste management relies heavily onhousehold participation to achieve its target of 30%reduction(throughreduction,reuseandrecycling,or“the3Rpolicy”)inwastecollectedby2019.Withonly1.6%ofhouseholdsexhibitingactiveparticipationin3Ractivities,andofthis,lessthan0.5%attributedtoplasticsrecyclingand reuse, achieving the RPJMN target will require fargreaterengagementatthehouseholdlevel.
5.2 WaterwayWasteSamplingandCharacterization
Complementing the desktopwork onwaterwaywaste extraction, the field surveys also sampledwaste from themainwaterways in thenon-tidal zones. Samplingofmixedmunicipalwaste fromwaterways was used to calculate composition of waste, particularly plastics composition. Wastesamplesweretakenfromthelasttrashrackalongthewaterwaynearestthecoastandclosesttothetidalzonesforcitieswithouttrashracksorotherinstalledbarriers.Awastesampleofapproximately1m3wasextractedatthetrashrackandsortedinto65differenttypesofwaste,includingdifferenttypesofplastics.Thewastewasmanuallysortedandeachtypewasweighedtocalculatecompositiontypebyweight.Theresults(Table7)andincityreportsareaveragesofallsamplescollectedineachcity.
PlasticsContentinCityWaterwayWasteStreams:TheJambecketal(2015)studiesassumean11%plastics composition in waste for Indonesia, while theWorld Bank’s (2012)What aWaste studyestimatesthattheshareofplasticsinEastAsiaandthePacificRegionis13%and12%inIndonesia.Indonesian statisticaldataonwastecomposition in Jakarta showsa14.5%content (byweight)ofplastics,includingrubberandartificialleather.Findingsfromthisassessmentshowthattheplasticscontentincitywaterwayshasanaverageplasticscompositionincitywastestreamsofupwardsof
Key Finding: There is potential for addressing waste through building capacity/awareness about recycling, reuse and reducing and improving household collection systems.
Figure10:AverageMSWCompositioninIndone
S Y N T H E S I S R E P O R T |21
31%,rangingfrom20%to38%(Table7).However,thisestimateisbasedonsamplesextractedatthelastphysicalbarriertothecoastinthecities’mainwaterwaysandnotfromgenerationpointsource,TPS facilitiesor landfills.Dueto theconcentrationsofplastics inwasteextracted fromwaterways(heavymaterialssink,organicsdissolve),thesefiguresdonotcontradicttheplasticfractionsof11-15%foundinmixedwastegeneration.
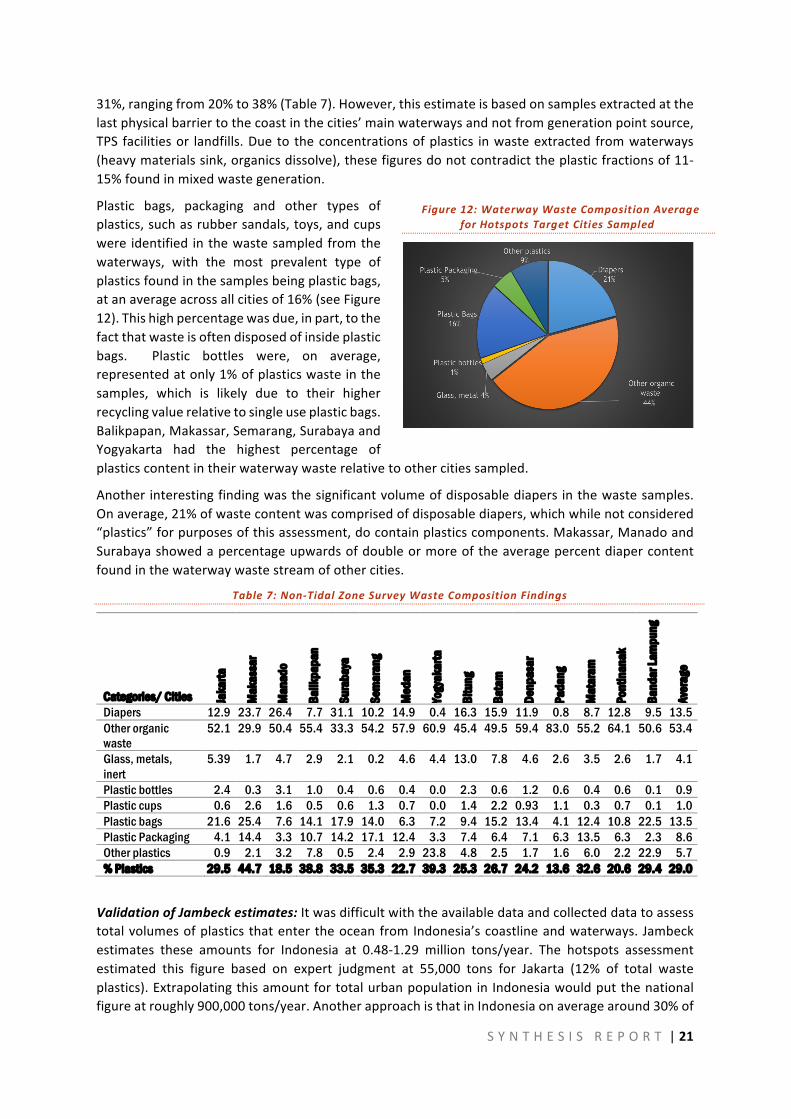
Plastic bags, packaging and other types ofplastics,suchasrubbersandals,toys,andcupswere identified inthewastesampledfromthewaterways, with the most prevalent type ofplasticsfoundinthesamplesbeingplasticbags,atanaverageacrossallcitiesof16%(seeFigure12).Thishighpercentagewasdue,inpart,tothefactthatwasteisoftendisposedofinsideplasticbags. Plastic bottles were, on average,representedatonly1%ofplasticswasteinthesamples, which is likely due to their higherrecyclingvaluerelativetosingleuseplasticbags.Balikpapan,Makassar,Semarang,SurabayaandYogyakarta had the highest percentage ofplasticscontentintheirwaterwaywasterelativetoothercitiessampled.
Anotherinterestingfindingwasthesignificantvolumeofdisposablediapers inthewastesamples.Onaverage,21%ofwastecontentwascomprisedofdisposablediapers,whichwhilenotconsidered“plastics”forpurposesofthisassessment,docontainplasticscomponents.Makassar,ManadoandSurabayashowedapercentageupwardsofdoubleormoreoftheaveragepercentdiapercontentfoundinthewaterwaywastestreamofothercities.
Table7:Non-TidalZoneSurveyWasteCompositionFindings
Categories/ Cities Jaka
rta
Mak
assa
r
Man
ado
Balik
papa
n
Sura
baya
Sem
aran
g
Med
an
Yogy
akar
ta
Bitu
ng
Bata
m
Denp
asar
Pada
ng
Mat
aram
Pont
inan
ak
Band
ar La
mpu
ng
Aver
age
Diapers 12.9 23.7 26.4 7.7 31.1 10.2 14.9 0.4 16.3 15.9 11.9 0.8 8.7 12.8 9.5 13.5 Other organic waste
52.1 29.9 50.4 55.4 33.3 54.2 57.9 60.9 45.4 49.5 59.4 83.0 55.2 64.1 50.6 53.4
Glass, metals, inert
5.39 1.7 4.7 2.9 2.1 0.2 4.6 4.4 13.0 7.8 4.6 2.6 3.5 2.6 1.7 4.1
Plastic bottles 2.4 0.3 3.1 1.0 0.4 0.6 0.4 0.0 2.3 0.6 1.2 0.6 0.4 0.6 0.1 0.9 Plastic cups 0.6 2.6 1.6 0.5 0.6 1.3 0.7 0.0 1.4 2.2 0.93 1.1 0.3 0.7 0.1 1.0 Plastic bags 21.6 25.4 7.6 14.1 17.9 14.0 6.3 7.2 9.4 15.2 13.4 4.1 12.4 10.8 22.5 13.5 Plastic Packaging 4.1 14.4 3.3 10.7 14.2 17.1 12.4 3.3 7.4 6.4 7.1 6.3 13.5 6.3 2.3 8.6 Other plastics 0.9 2.1 3.2 7.8 0.5 2.4 2.9 23.8 4.8 2.5 1.7 1.6 6.0 2.2 22.9 5.7 % Plastics 29.5 44.7 18.5 38.8 33.5 35.3 22.7 39.3 25.3 26.7 24.2 13.6 32.6 20.6 29.4 29.0
ValidationofJambeckestimates:ItwasdifficultwiththeavailabledataandcollecteddatatoassesstotalvolumesofplasticsthatentertheoceanfromIndonesia’scoastlineandwaterways. Jambeckestimates these amounts for Indonesia at 0.48-1.29 million tons/year. The hotspots assessmentestimated this figure based on expert judgment at 55,000 tons for Jakarta (12% of total wasteplastics).ExtrapolatingthisamountfortotalurbanpopulationinIndonesiawouldputthenationalfigureatroughly900,000tons/year.AnotherapproachisthatinIndonesiaonaveragearound30%of
Figure12:WaterwayWasteCompositionAverageforHotspotsTargetCitiesSampled
S Y N T H E S I S R E P O R T |22
urbanwaste(total105,000tons/year)isnotcollected,resultinginleakageof15-20%asbetween10-15%ofuncollectedwastedoesnotentertheformalsystemsduetoinformalcollectionofrecyclables.
Expertjudgmentputsthefractionofuncollectedwastebeingdischargedtowaterwaysbetween30-50%.ThisfortheurbanpopulationinIndonesiawithaplasticsfractioninmixedwastearound11-14%wouldgiveaplastictowaterwaysestimateof400,000tons/year.TheseoutcomesareintherangeoftheJambeckestimates.Theydiscardwastefromruralareasbuttheseareashavemuchlowerwastegenerationlevelspercapitaandinadditionalowerplasticsfraction.
EXAMPLE: BANDAR LAMPUNG PLASTICS PROCESSING
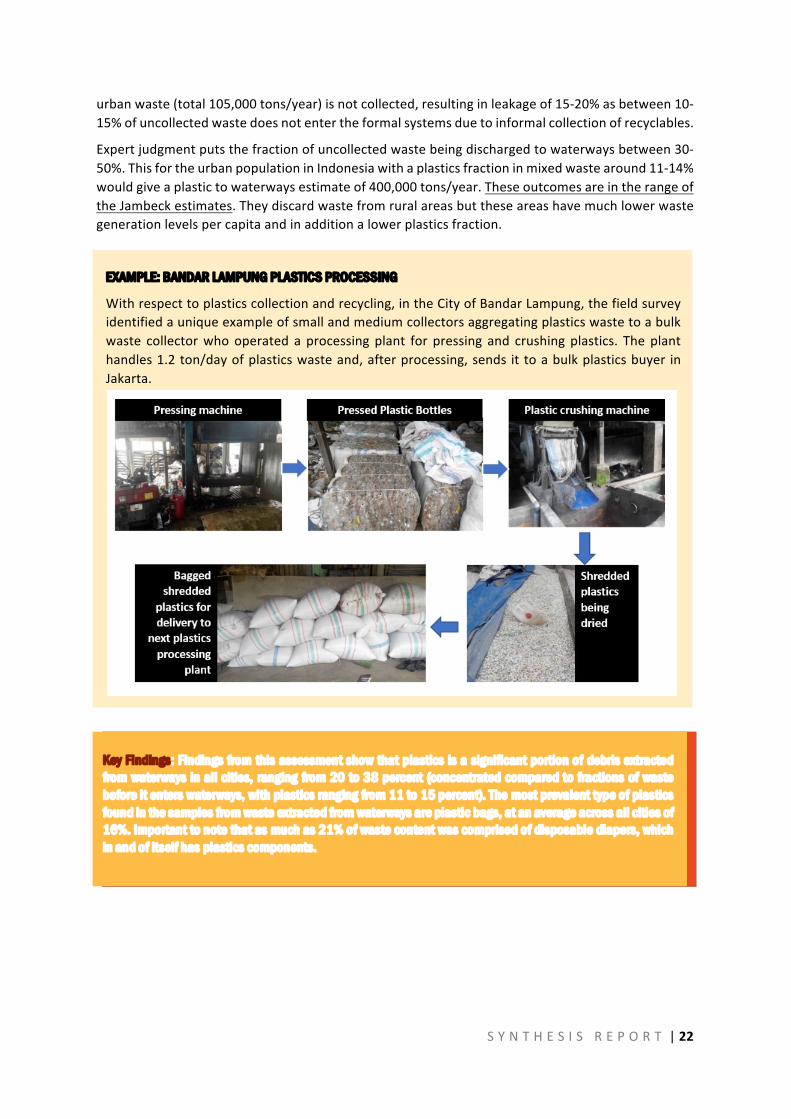
Withrespecttoplasticscollectionandrecycling,intheCityofBandarLampung,thefieldsurveyidentifiedauniqueexampleofsmallandmediumcollectorsaggregatingplasticswastetoabulkwaste collectorwhooperated a processing plant for pressing and crushing plastics. Theplanthandles1.2ton/dayofplasticswasteand,afterprocessing,sends it toabulkplasticsbuyer inJakarta.
Key Findings: Findings from this assessment show that plastics is a significant portion of debris extracted from waterways in all cities, ranging from 20 to 38 percent (concentrated compared to fractions of waste before it enters waterways, with plastics ranging from 11 to 15 percent). The most prevalent type of plastics found in the samples from waste extracted from waterways are plastic bags, at an average across all cities of 16%. Important to note that as much as 21% of waste content was comprised of disposable diapers, which in and of itself has plastics components.
S Y N T H E S I S R E P O R T |23
6 WATERWAYHOTSPOTSMAPPING
The assessment identified themain waste leakage points or ‘hotspots’ along each cities’ centralwaterways.Mappingofcity-specifichotspotsincludeddocumentingwastecollectioninfrastructureandwastedisposal guidance signage along the same trajectory andwhere, despite these efforts,wasteisstilldisposedofinandalongsidewaterways.Foreachcitysurveyed,thedetailedhotspotsmapsareincludedinthetechnicalvolumesaccompanyingthisreport.
Overall,surveydatashowthatdespiteprovisionofwastecontainersandsignageguidingresidentsaboutproperdisposalpractices,significantgapsremain inseveral locationsacrossallcitieswhereprovisionofappropriatewastecollectionreceptacles(andfrequencyofservice)andsignagearenotavailableor insufficient,andwherecommunitysensitizationandbehavioralchangecampaignsareneededtohalt illegaldumpinganddevelopmentofwastehotspotsalongwaterways.Thefindingsalsounderscoretheneedtotailorremediationstrategiestocity-specificoperatingenvironments.
6.1 SummaryoftheTidalZoneAreaHotspots
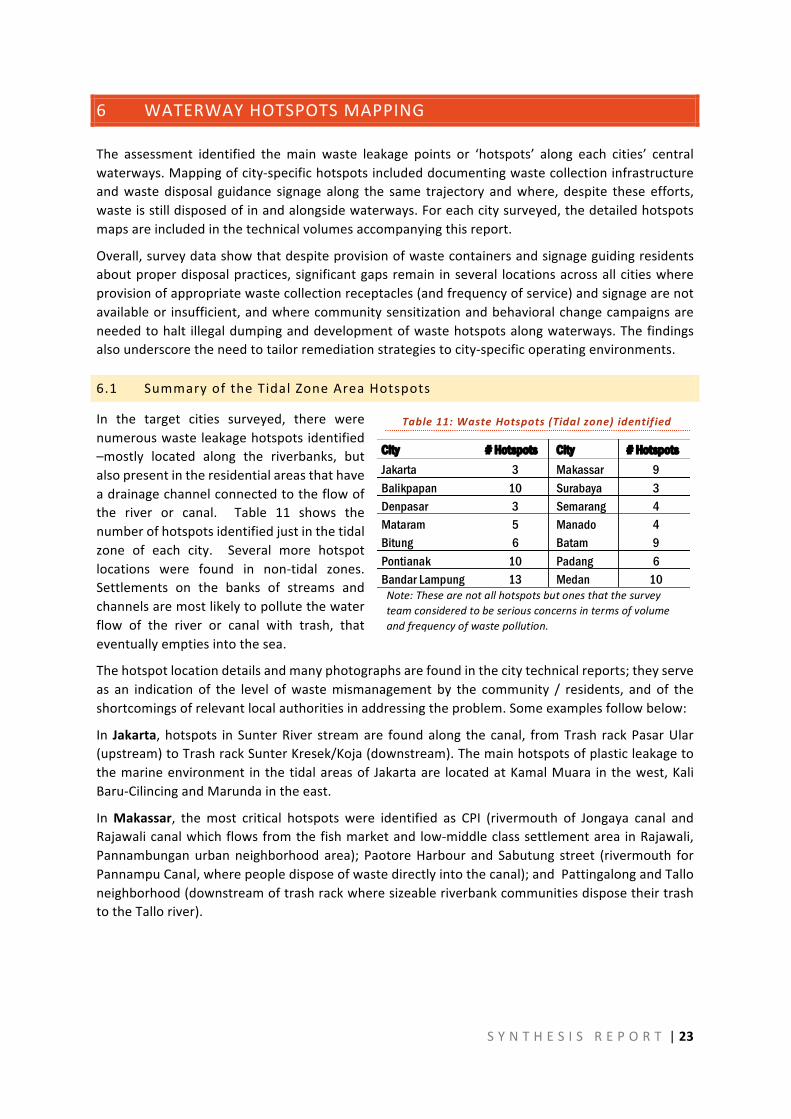
In the target cities surveyed, there werenumerouswasteleakagehotspots identified–mostly located along the riverbanks, butalsopresentintheresidentialareasthathaveadrainagechannelconnectedtotheflowofthe river or canal. Table 11 shows thenumberofhotspotsidentifiedjustinthetidalzone of each city. Several more hotspotlocations were found in non-tidal zones.Settlements on the banks of streams andchannelsaremostlikelytopollutethewaterflow of the river or canal with trash, thateventuallyemptiesintothesea.
Thehotspotlocationdetailsandmanyphotographsarefoundinthecitytechnicalreports;theyserveas an indication of the level ofwastemismanagement by the community / residents, and of theshortcomingsofrelevantlocalauthoritiesinaddressingtheproblem.Someexamplesfollowbelow:
In Jakarta,hotspots inSunterRiver streamare foundalong thecanal, fromTrash rackPasarUlar(upstream)toTrashrackSunterKresek/Koja(downstream).Themainhotspotsofplasticleakagetothemarineenvironment inthetidalareasof Jakartaare locatedatKamalMuara inthewest,KaliBaru-CilincingandMarundaintheeast.
InMakassar, themost critical hotspots were identified as CPI (rivermouth of Jongaya canal andRajawalicanalwhichflowsfromthefishmarketand low-middleclasssettlementarea inRajawali,Pannambunganurbanneighborhoodarea); PaotoreHarbour and Sabutung street (rivermouth forPannampuCanal,wherepeopledisposeofwastedirectlyintothecanal);andPattingalongandTalloneighborhood(downstreamoftrashrackwheresizeableriverbankcommunitiesdisposetheirtrashtotheTalloriver).
Table11:WasteHotspots(Tidalzone)identif ied
City # Hotspots City # Hotspots Jakarta 3 Makassar 9 Balikpapan 10 Surabaya 3 Denpasar 3 Semarang 4 Mataram 5 Manado 4 Bitung 6 Batam 9 Pontianak 10 Padang 6 Bandar Lampung 13 Medan 10 Note:Thesearenotallhotspotsbutonesthatthesurveyteamconsideredtobeseriousconcernsintermsofvolumeandfrequencyofwastepollution.
S Y N T H E S I S R E P O R T |24
CASE STUDY: CITY OF BITUNG
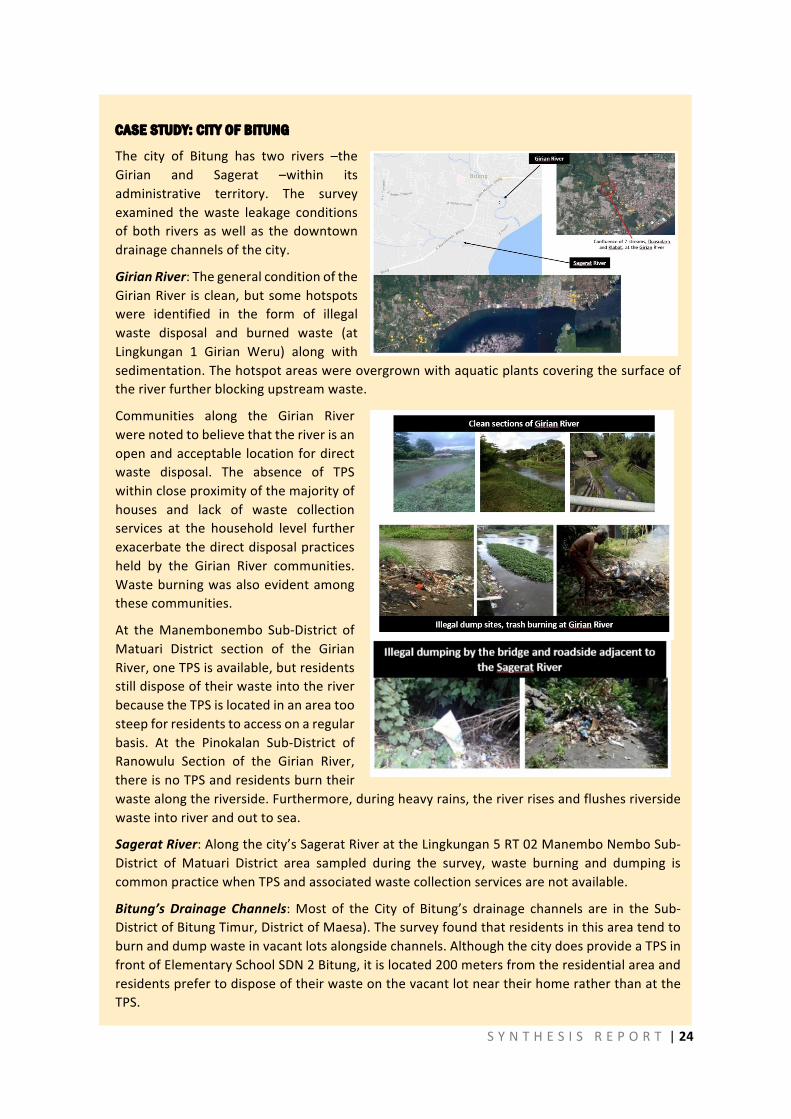
The city of Bitung has two rivers –theGirian and Sagerat –within itsadministrative territory. The surveyexamined thewaste leakage conditionsofboth rivers aswell as thedowntowndrainagechannelsofthecity.
GirianRiver:ThegeneralconditionoftheGirianRiver isclean,butsomehotspotswere identified in the form of illegalwaste disposal and burned waste (atLingkungan 1 Girian Weru) along withsedimentation.Thehotspotareaswereovergrownwithaquaticplantscoveringthesurfaceoftheriverfurtherblockingupstreamwaste.
Communities along the Girian Riverwerenotedtobelievethattheriverisanopenandacceptable locationfordirectwaste disposal. The absence of TPSwithincloseproximityofthemajorityofhouses and lack of waste collectionservices at the household level furtherexacerbatethedirectdisposalpracticesheld by the Girian River communities.Wasteburningwasalsoevidentamongthesecommunities.
At theManembonembo Sub-District ofMatuari District section of the GirianRiver,oneTPSisavailable,butresidentsstilldisposeoftheirwasteintotheriverbecausetheTPSislocatedinanareatoosteepforresidentstoaccessonaregularbasis. At the Pinokalan Sub-District ofRanowulu Section of the Girian River,thereisnoTPSandresidentsburntheirwastealongtheriverside.Furthermore,duringheavyrains,theriverrisesandflushesriversidewasteintoriverandouttosea.
SageratRiver:Alongthecity’sSageratRiverattheLingkungan5RT02ManemboNemboSub-District of Matuari District area sampled during the survey, waste burning and dumping iscommonpracticewhenTPSandassociatedwastecollectionservicesarenotavailable.
Bitung’s Drainage Channels:Most of the City of Bitung’s drainage channels are in the Sub-DistrictofBitungTimur,DistrictofMaesa).Thesurveyfoundthatresidentsinthisareatendtoburnanddumpwasteinvacantlotsalongsidechannels.AlthoughthecitydoesprovideaTPSinfrontofElementarySchoolSDN2Bitung,itislocated200metersfromtheresidentialareaandresidentsprefertodisposeoftheirwasteonthevacantlotneartheirhomeratherthanattheTPS.
S Y N T H E S I S R E P O R T |25
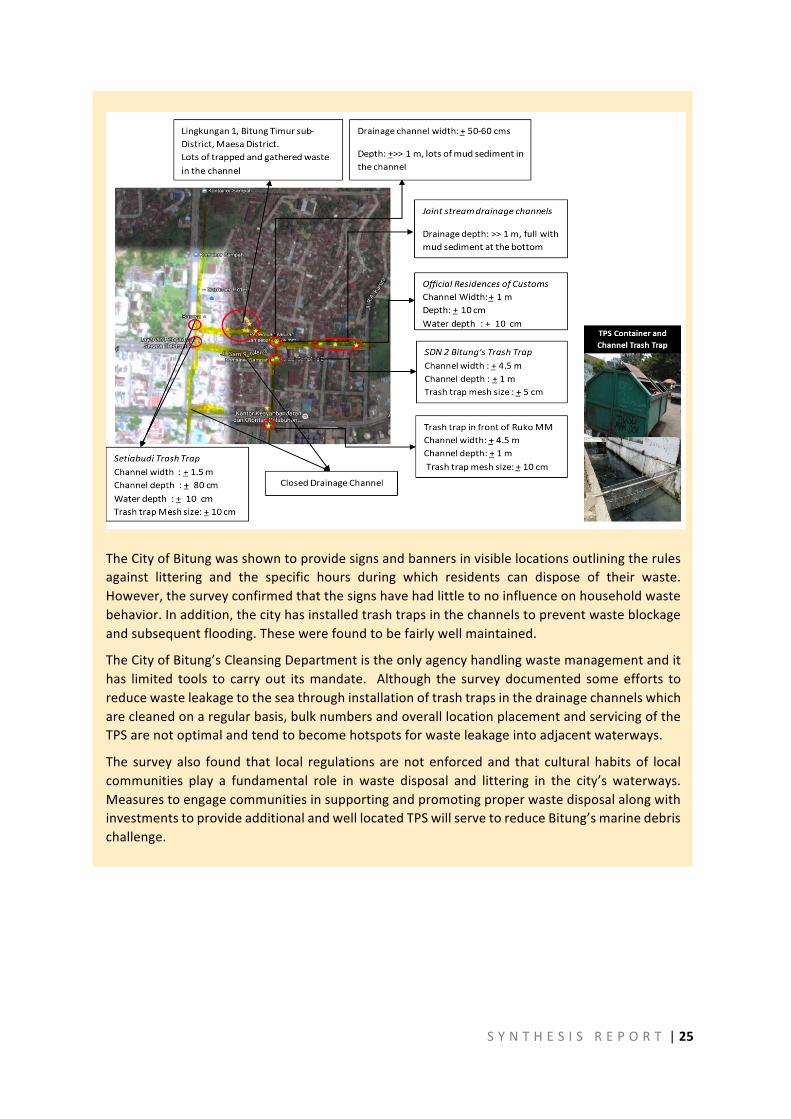
TheCityofBitungwasshowntoprovidesignsandbannersinvisiblelocationsoutliningtherulesagainst littering and the specific hours during which residents can dispose of their waste.However,thesurveyconfirmedthatthesignshavehadlittletonoinfluenceonhouseholdwastebehavior.Inaddition,thecityhasinstalledtrashtrapsinthechannelstopreventwasteblockageandsubsequentflooding.Thesewerefoundtobefairlywellmaintained.
TheCityofBitung’sCleansingDepartmentistheonlyagencyhandlingwastemanagementandithas limited tools to carry out itsmandate. Although the surveydocumented someefforts toreducewasteleakagetotheseathroughinstallationoftrashtrapsinthedrainagechannelswhicharecleanedonaregularbasis,bulknumbersandoveralllocationplacementandservicingoftheTPSarenotoptimalandtendtobecomehotspotsforwasteleakageintoadjacentwaterways.
The surveyalso found that local regulationsarenotenforcedand that culturalhabitsof localcommunities play a fundamental role in waste disposal and littering in the city’s waterways.MeasurestoengagecommunitiesinsupportingandpromotingproperwastedisposalalongwithinvestmentstoprovideadditionalandwelllocatedTPSwillservetoreduceBitung’smarinedebrischallenge.
S Y N T H E S I S R E P O R T |26
CASE STUDY: WAIN AND SOMBER RIVERS OF THE CITY OF BALIKPAPAN
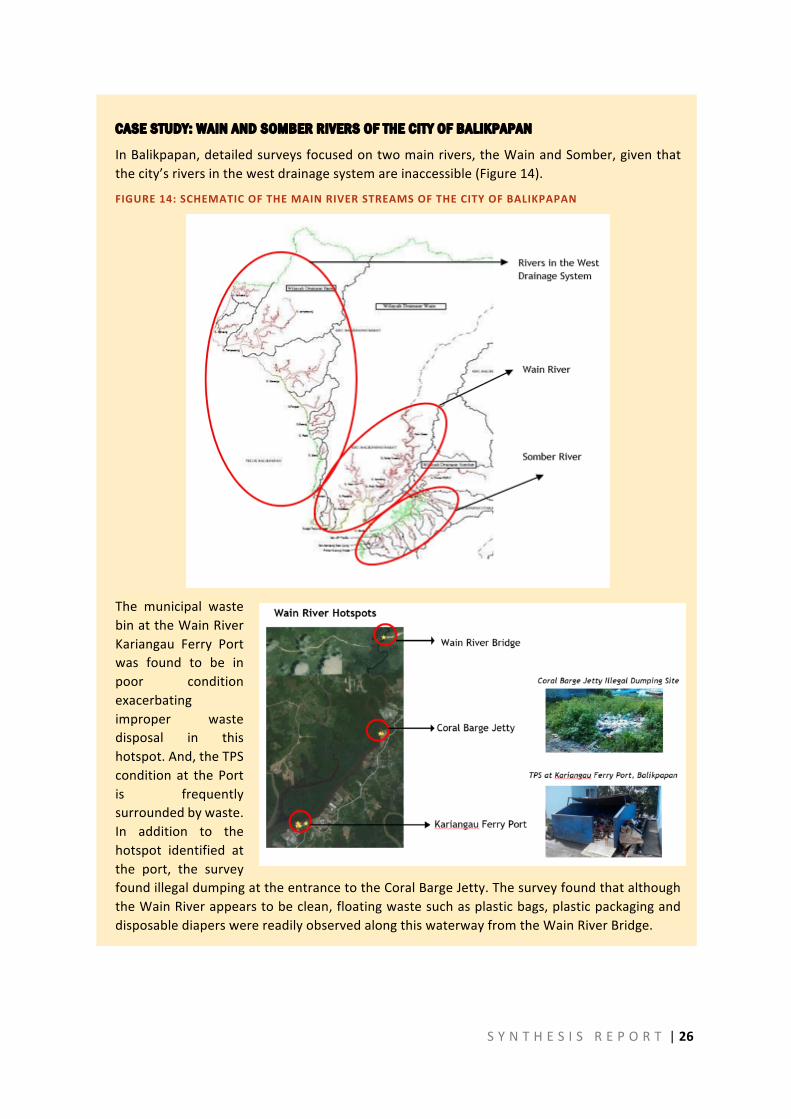
InBalikpapan,detailedsurveysfocusedontwomainrivers,theWainandSomber,giventhatthecity’sriversinthewestdrainagesystemareinaccessible(Figure14).
FIGURE14:SCHEMATICOFTHEMAINRIVERSTREAMSOFTHECITYOFBALIKPAPAN
The municipal wastebinattheWainRiverKariangau Ferry Portwas found to be inpoor conditionexacerbatingimproper wastedisposal in thishotspot.And,theTPScondition at thePortis frequentlysurroundedbywaste.In addition to thehotspot identified atthe port, the surveyfoundillegaldumpingattheentrancetotheCoralBargeJetty.ThesurveyfoundthatalthoughtheWainRiverappearstobeclean,floatingwastesuchasplasticbags,plasticpackaginganddisposablediaperswerereadilyobservedalongthiswaterwayfromtheWainRiverBridge.
S Y N T H E S I S R E P O R T |27
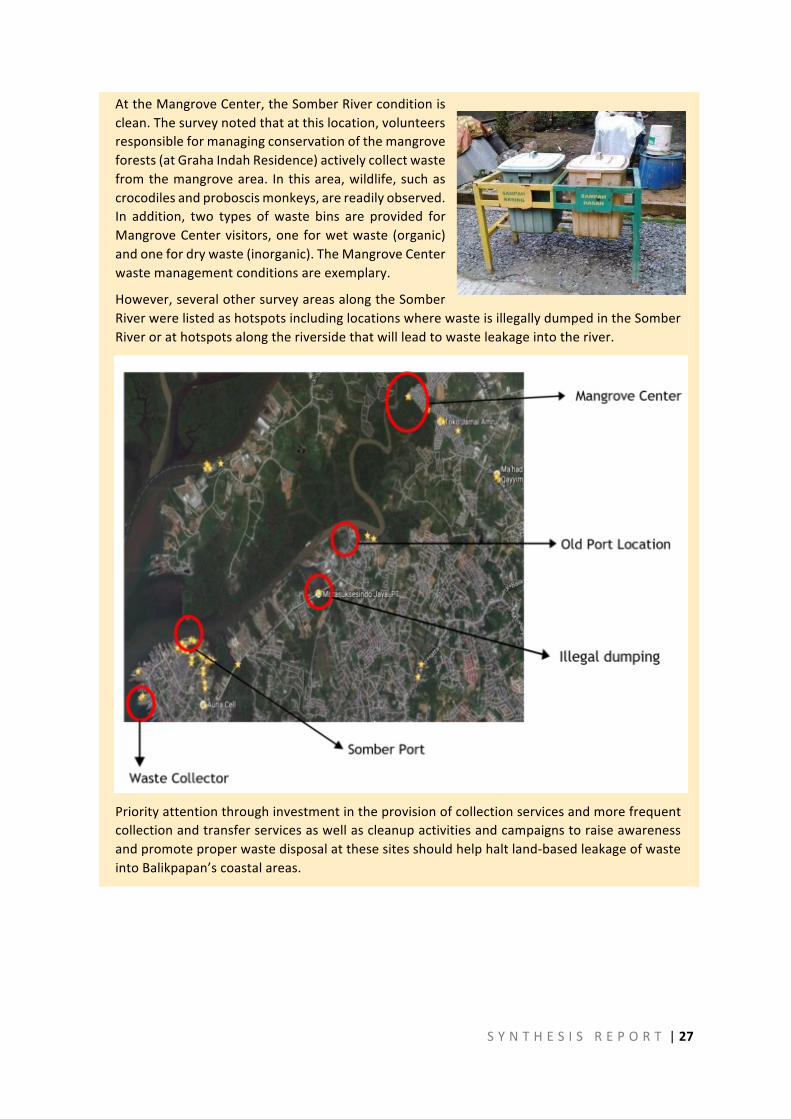
AttheMangroveCenter,theSomberRiverconditionisclean.Thesurveynotedthatatthislocation,volunteersresponsibleformanagingconservationofthemangroveforests(atGrahaIndahResidence)activelycollectwastefromthemangrovearea. Inthisarea,wildlife,suchascrocodilesandproboscismonkeys,arereadilyobserved.In addition, two types ofwaste bins are provided forMangroveCentervisitors,oneforwetwaste (organic)andonefordrywaste(inorganic).TheMangroveCenterwastemanagementconditionsareexemplary.
However,severalothersurveyareasalongtheSomberRiverwerelistedashotspotsincludinglocationswherewasteisillegallydumpedintheSomberRiverorathotspotsalongtheriversidethatwillleadtowasteleakageintotheriver.
Priorityattentionthroughinvestmentintheprovisionofcollectionservicesandmorefrequentcollectionandtransferservicesaswellascleanupactivitiesandcampaignstoraiseawarenessandpromoteproperwastedisposalatthesesitesshouldhelphaltland-basedleakageofwasteintoBalikpapan’scoastalareas.
S Y N T H E S I S R E P O R T |28
6.2 SummaryofHotspotCharacteristics
Ananalysisofthemaincharacteristicsidentifiedineachofthesurveyedcities,showseveralcommonelementsviz. poor access to, and infrequent solid wastecollection; inadequate and ill-functioning waterwaysinfrastructure; deficiencies in community andhousehold awareness and waste managementbehaviors; and lack of appropriate financing andinstitutionalmechanisms.Examplesfromthe15citiesaresummarizedintheparagraphsbelow.
WasteInfrastructure:AccessibilityandFrequency
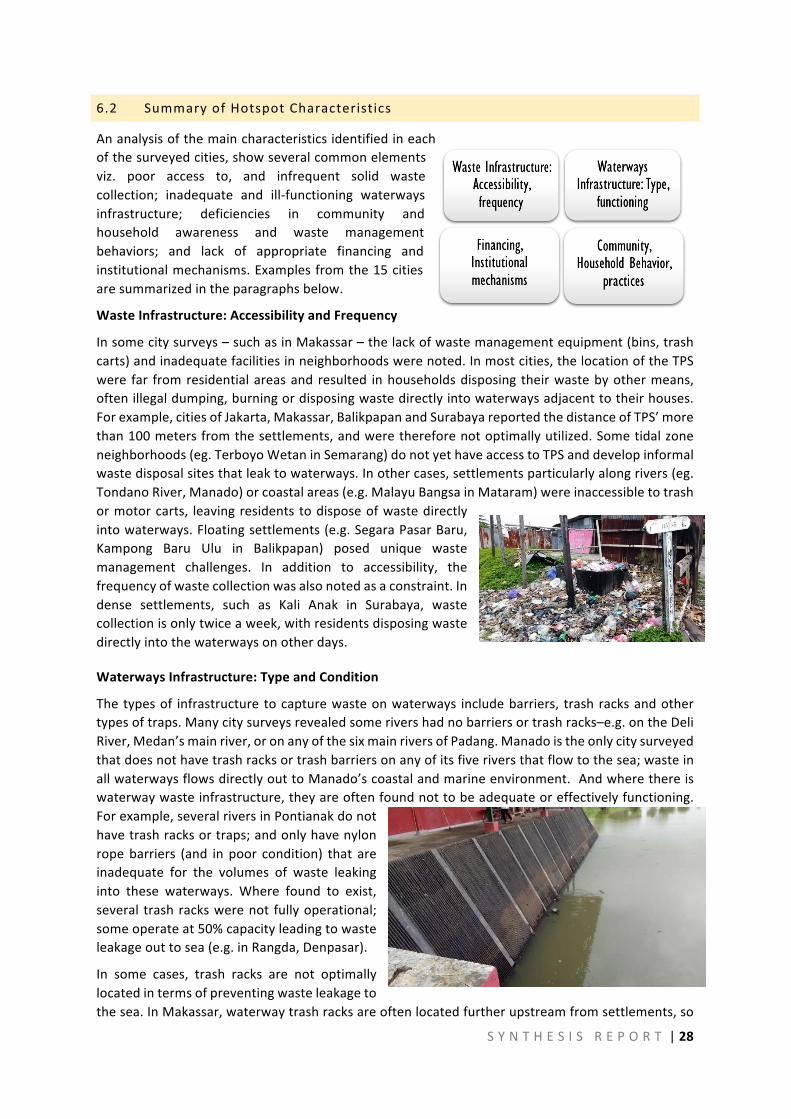
Insomecitysurveys–suchasinMakassar–thelackofwastemanagementequipment(bins,trashcarts)andinadequatefacilitiesinneighborhoodswerenoted.Inmostcities,thelocationoftheTPSwere far fromresidentialareasandresulted inhouseholdsdisposing theirwastebyothermeans,oftenillegaldumping,burningordisposingwastedirectlyintowaterwaysadjacenttotheirhouses.Forexample,citiesofJakarta,Makassar,BalikpapanandSurabayareportedthedistanceofTPS’morethan100metersfromthesettlements,andwerethereforenotoptimallyutilized.Sometidalzoneneighborhoods(eg.TerboyoWetaninSemarang)donotyethaveaccesstoTPSanddevelopinformalwastedisposalsitesthatleaktowaterways.Inothercases,settlementsparticularlyalongrivers(eg.TondanoRiver,Manado)orcoastalareas(e.g.MalayuBangsainMataram)wereinaccessibletotrashormotorcarts, leavingresidentstodisposeofwastedirectlyintowaterways.Floatingsettlements(e.g.SegaraPasarBaru,Kampong Baru Ulu in Balikpapan) posed unique wastemanagement challenges. In addition to accessibility, thefrequencyofwastecollectionwasalsonotedasaconstraint.Indense settlements, such as Kali Anak in Surabaya, wastecollectionisonlytwiceaweek,withresidentsdisposingwastedirectlyintothewaterwaysonotherdays.
WaterwaysInfrastructure:TypeandCondition
Thetypesof infrastructuretocapturewasteonwaterways includebarriers, trashracksandothertypesoftraps.Manycitysurveysrevealedsomerivershadnobarriersortrashracks–e.g.ontheDeliRiver,Medan’smainriver,oronanyofthesixmainriversofPadang.Manadoistheonlycitysurveyedthatdoesnothavetrashracksortrashbarriersonanyofitsfiveriversthatflowtothesea;wasteinallwaterwaysflowsdirectlyouttoManado’scoastalandmarineenvironment.Andwherethereiswaterwaywasteinfrastructure,theyareoftenfoundnottobeadequateoreffectivelyfunctioning.Forexample,severalriversinPontianakdonothavetrashracksortraps;andonlyhavenylonropebarriers (and inpoor condition) that areinadequate for the volumes of waste leakinginto these waterways. Where found to exist,several trashrackswerenot fullyoperational;someoperateat50%capacityleadingtowasteleakageouttosea(e.g.inRangda,Denpasar).
In some cases, trash racks are not optimallylocatedintermsofpreventingwasteleakagetothesea.InMakassar,waterwaytrashracksareoftenlocatedfurtherupstreamfromsettlements,so
S Y N T H E S I S R E P O R T |29
wasteleakagetowaterwaysoccursdownstreamfromtheracks;inSurabaya,theyarelocatedinsidestreamssotheyhaltleakageenteringthemainrivers,buttheyarenotplacedinthemainrivers.Somecitiescitedaccessconstraintsforfishingboatstobestationedinestuariesiftrashracksareinstalledalongwaterways.
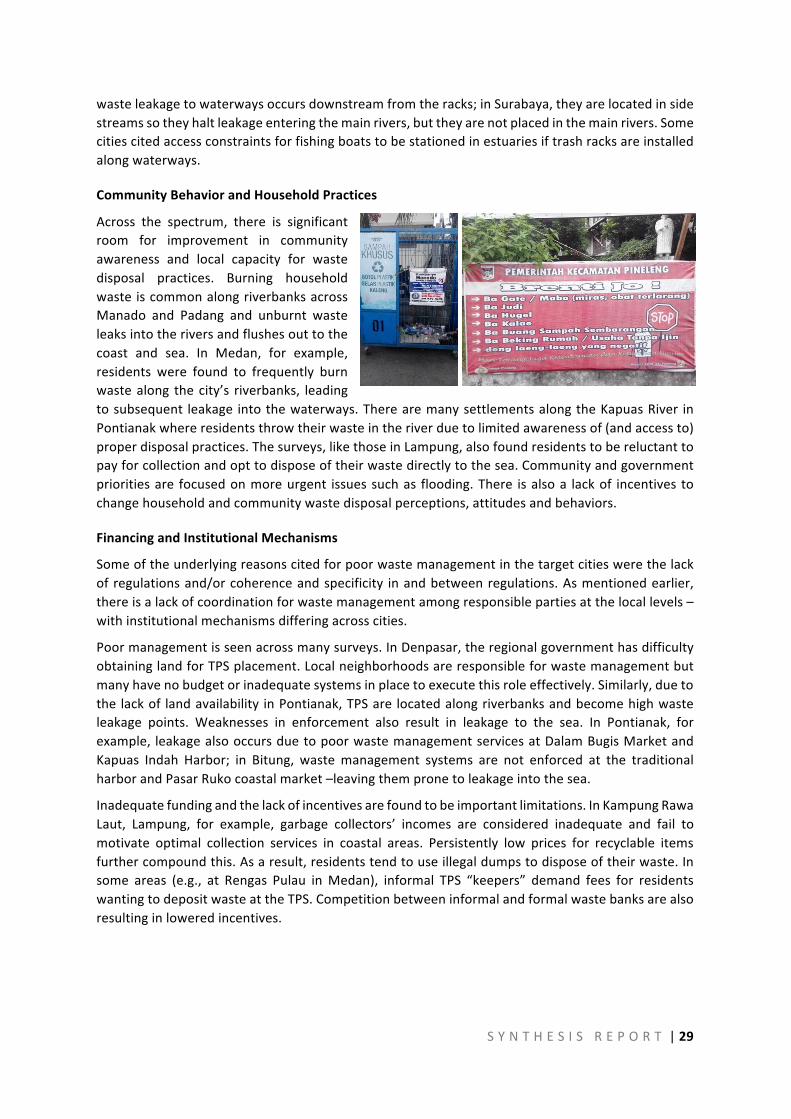
CommunityBehaviorandHouseholdPractices
Across the spectrum, there is significantroom for improvement in communityawareness and local capacity for wastedisposal practices. Burning householdwasteiscommonalongriverbanksacrossManado and Padang and unburnt wasteleaksintotheriversandflushesouttothecoast and sea. In Medan, for example,residents were found to frequently burnwastealong thecity’s riverbanks, leadingtosubsequent leakage intothewaterways.TherearemanysettlementsalongtheKapuasRiver inPontianakwhereresidentsthrowtheirwasteintheriverduetolimitedawarenessof(andaccessto)properdisposalpractices.Thesurveys,likethoseinLampung,alsofoundresidentstobereluctanttopayforcollectionandopttodisposeoftheirwastedirectlytothesea.Communityandgovernmentprioritiesare focusedonmoreurgent issuessuchas flooding.There isalsoa lackof incentives tochangehouseholdandcommunitywastedisposalperceptions,attitudesandbehaviors.
FinancingandInstitutionalMechanisms
Someoftheunderlyingreasonscitedforpoorwastemanagementinthetargetcitieswerethelackof regulationsand/orcoherenceandspecificity inandbetweenregulations.Asmentionedearlier,thereisalackofcoordinationforwastemanagementamongresponsiblepartiesatthelocallevels–withinstitutionalmechanismsdifferingacrosscities.
Poormanagementisseenacrossmanysurveys.InDenpasar,theregionalgovernmenthasdifficultyobtaininglandforTPSplacement.Localneighborhoodsareresponsibleforwastemanagementbutmanyhavenobudgetorinadequatesystemsinplacetoexecutethisroleeffectively.Similarly,duetothe lackof landavailability inPontianak,TPSare locatedalongriverbanksandbecomehighwasteleakage points. Weaknesses in enforcement also result in leakage to the sea. In Pontianak, forexample, leakagealsooccursduetopoorwastemanagementservicesatDalamBugisMarketandKapuas Indah Harbor; in Bitung, wastemanagement systems are not enforced at the traditionalharborandPasarRukocoastalmarket–leavingthempronetoleakageintothesea.
Inadequatefundingandthelackofincentivesarefoundtobeimportantlimitations.InKampungRawaLaut, Lampung, for example, garbage collectors’ incomes are considered inadequate and fail tomotivate optimal collection services in coastal areas. Persistently low prices for recyclable itemsfurthercompoundthis.Asaresult,residentstendtouseillegaldumpstodisposeoftheirwaste.Insome areas (e.g., at Rengas Pulau inMedan), informal TPS “keepers” demand fees for residentswantingtodepositwasteattheTPS.Competitionbetweeninformalandformalwastebanksarealsoresultinginloweredincentives.
S Y N T H E S I S R E P O R T |30
7 SOCIO-BEHAVIORALFINDINGS
Qualitative socio-behavioral interviews carried out in the target citieswere analyzed to elucidatewaste production and disposal practices and to assess community perceptions related to wastemanagement. Community input was elicited through semi-structured and targeted interviewsapplyingthestandardframeworkusedforGovernment’sBPSsurveyof2015.20Findingspresentedhereinareasynthesisofthecitiessurveyed,withexamplestohighlightcommonpoints.
7.1 CommunityProfiles
Thepopulationinthehotspotareastendtobediverseintermsofethnicity,occupationanddurationof residency.21 Occupation, education and income levels of survey respondents varied with themajoritybeinghousewives, fisher-folk, small-scale traders,waste collectors and local governmentemployees. Across cities,most tidal zoneswere found tohave collectionanddisposal systems–however, communities of lower economic status were associated with poorer facilities andinadequate waste service provision. In these areas, the waste management infrastructure andservicesareoffered,butarelimitedandresidentsdonothaveaccesstoinformationorawarenessofproperwastedisposal.
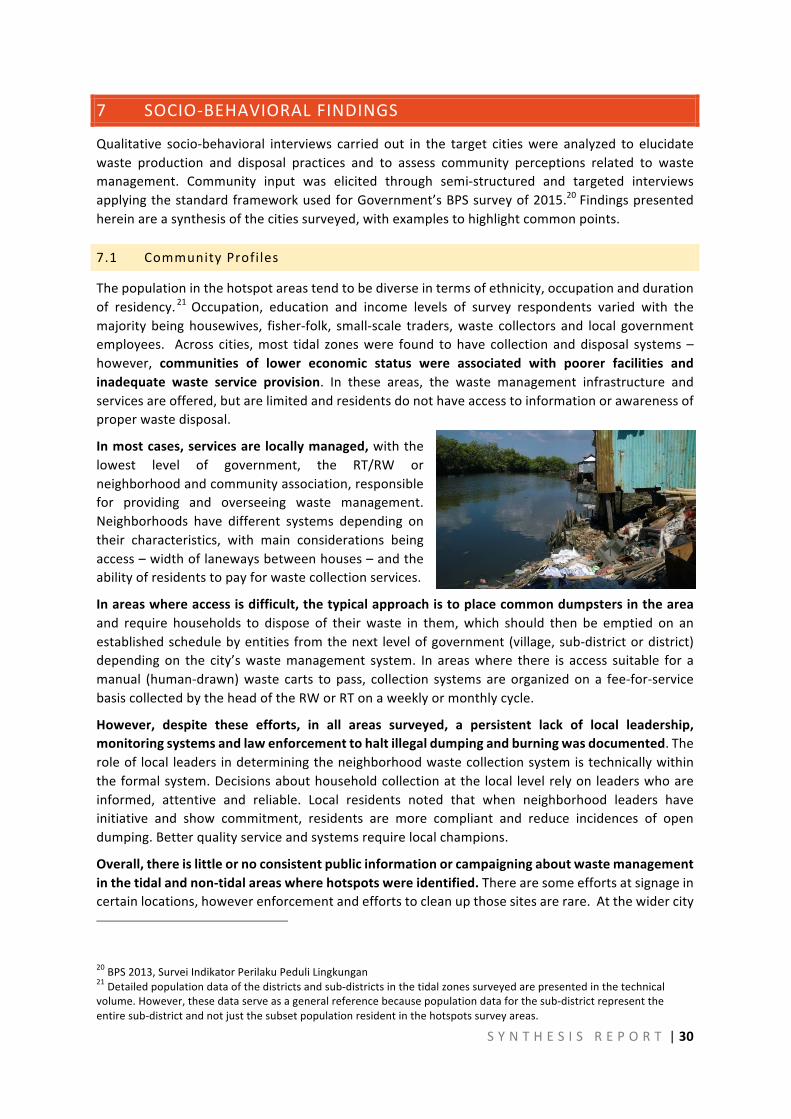
Inmostcases,servicesarelocallymanaged,withthelowest level of government, the RT/RW orneighborhoodandcommunityassociation,responsiblefor providing and overseeing waste management.Neighborhoods have different systems depending ontheir characteristics, with main considerations beingaccess–widthoflanewaysbetweenhouses–andtheabilityofresidentstopayforwastecollectionservices.
Inareaswhereaccessisdifficult,thetypicalapproachistoplacecommondumpstersintheareaand require households to dispose of theirwaste in them,which should then be emptied on anestablishedschedulebyentitiesfromthenext levelofgovernment(village,sub-districtordistrict)dependingon the city’swastemanagement system. In areaswhere there is access suitable for amanual (human-drawn)waste carts topass, collection systemsareorganizedon a fee-for-servicebasiscollectedbytheheadoftheRWorRTonaweeklyormonthlycycle.
However, despite these efforts, in all areas surveyed, a persistent lack of local leadership,monitoringsystemsandlawenforcementtohaltillegaldumpingandburningwasdocumented.Theroleof local leaders indeterminingtheneighborhoodwastecollectionsystemistechnicallywithintheformalsystem.Decisionsabouthouseholdcollectionatthe local levelrelyon leaderswhoareinformed, attentive and reliable. Local residents noted that when neighborhood leaders haveinitiative and show commitment, residents are more compliant and reduce incidences of opendumping.Betterqualityserviceandsystemsrequirelocalchampions.
Overall,thereislittleornoconsistentpublicinformationorcampaigningaboutwastemanagementinthetidalandnon-tidalareaswherehotspotswereidentified.Therearesomeeffortsatsignageincertainlocations,howeverenforcementandeffortstocleanupthosesitesarerare.Atthewidercity
20BPS2013,SurveiIndikatorPerilakuPeduliLingkungan21Detailedpopulationdataofthedistrictsandsub-districtsinthetidalzonessurveyedarepresentedinthetechnicalvolume.However,thesedataserveasageneralreferencebecausepopulationdataforthesub-districtrepresenttheentiresub-districtandnotjustthesubsetpopulationresidentinthehotspotssurveyareas.
S Y N T H E S I S R E P O R T |31
level,thereislimitedeffortatpublicawarenessraisingaboutwastemanagementandtheinitiativesnotedarerestrictedtoplacingbannersforbiddingopendumpingandquotingregulationsandfines.Lackofgeneralawareness,andruleswithoutenforcementareevidentinalllocationssurveyed.
Inbothtidalandnon-tidalareas,thereislimitedawarenessaboutrecyclingandtheexistenceandpurposeofwastebanks.Recyclingandhousehold separationofwastearenot standardpractice,although the survey did find a few instanceswhere local residents salvaged valuable items fromriverbedsandwaterwaystoexchangeforcreditatwastebanksorselltocollectors.Tidalzoneaswellasnon-tidalzoneresidentsdonotseparatetheirwaste,duetoalackofinformationandawareness;aperceptionthatseparatedwastewillbemixedbygarbagecollectors;concernsthatstockpileditemswillattractpests;andtheperceptionthatthepurchasepriceforrecyclablesistoolowandthereforenotworththeeffort.
7.2 Communitylevelattitudesandpractices
Thepracticeofwastedisposal variesdependingon the community situation,wastemanagementsystemandtheotherfactorsincludingeconomicsandeducation.Culturalvaluesandcustomsoftenplayaroleinbehaviorrelatingtowastedisposal.Someanecdotesfromthesurveys:
• ExamplesfromCumpatSettlementAreasinNorthSurabaya,forexample,stillthrowtheirwasteintotheseaparticularly,domesticandfishscaleswaste,becausetheirgarbagecollectorsonlyoperateonceevery4days.Accordingtosomeinformants,DISPOSINGtheirwastetotheoceanismuchmoreeffectivebecausethetrashwillbetakenbythewaves.
• InJakarta,residentsindenseandpoorhousingareastypicallyliketokeeptheirimmediatesmallareaofspaceascleanaspossible,sweepingfrequentlyandkeepingaclearpathtotheirdoorstep.However,thereisnotspaceinthenarrowlanewaysofslumareas,sopeopleareneverthelesslivingamongstthewastetheytrytosweepandtidyunless,oruntil,isitcollected.Itisoftensweptintoanearbydrainorwaterwaytocreateacleanerareainfrontofhomes/doorways.
• CurbsiderecyclingbinsareprovidedinMargasariurbanneighborhood,WestBalikpapanbutpeoplestillmixed their waste because the bins are too small and fill up quickly, i.e. before they are emptied.Furthermore, the community garbage collector alwaysmixes the trashwhen emptying the bin, so theseparationbyresidentsisperceivedaspointless.
Box 6: Building Social Capital to Improve Waste Management
Opportunities related to improving waste management conditions in the tidal zones by building on social capital, include: expanding the success of existing community organizations active in waste management (e.g., Woman’s Associations and NGOs in Semarang and Mataram) and nascent waste banks such as in Medan; strengthen existing organizations as entry points to improving community awareness and action; for example, Pagubuyan Warga Stren Kali in Surabaya and waste volunteers in Padang. Social capital opportunities also include: identifying and supporting local champions; increasing local awareness raising events; scaling up and replicating existing routines, such as: (i) the ‘Friday Neighborhood Tours’ in Mataram for waste monitoring, and (ii) the Makassar sub-district leaders compulsory recording of community aspirations and aligning these with targets and timeframes set by the Mayor. Additional opportunities include: expanding use of social media to support coordination and reporting (e.g., Pontianak and Makassar). Collaboration with Corporate Social Responsibility programs can also be scaled up and applied to the waste sector.
S Y N T H E S I S R E P O R T |32
8 DISCUSSIONANDRECOMMENDATIONS
TheassessmenthasbeenanimportantfirststepinacquiringtheevidencebaseforwasteleakageandtheconnectionsbetweenwastemanagementandmarinedebrisinkeycitiesinIndonesia.Findingsfrom this assessment can provide important inputs to national level programs in solid wastemanagement,andthemarinedebrisactionplan.
Basedonthefindingsoftheassessment,near-termentrypointstoaddressIndonesia’smarinedebrischallengewereidentifiedandarepresentedinthissection.Theentrypointsidentifiedareorganizedbynationallevelpolicyandinvestmentrecommendationsapplicableacrosstheboardaswellascityspecificactionstailoredtoaddressingconditionsassessedduringthefieldsurveysanddirectedatcomplementingandstrengtheningeachcity’smunicipalsolidwastemanagementservices.
8.1 LinkagestoRelatedGovernmentPrograms
8.1.1 GovernmentProgramforImprovingSolidWasteManagement:
TheGovernmentofIndonesiaiscurrentlypreparinganationalplatformprogramforImprovingSolidWasteManagementtobeimplementedbytheMinistryofPublicWorkswithsupportfromMinistryofEnvironmentandForestry, theMinistryofHomeAffairsandBappenas.Support to thecitiesofIndonesia would entail investment planning, system improvement, operational capacity building,financialmanagementandinvestmentsupporttoachieve100%collectionserviceaccessanddisposalandreducewastevolumesthroughmoreadvancedtechnologies.Itwouldalsoneedthedevelopmentof national innovative and inclusive models and methods for community based collection andimprovingwastereduction(3Rs/WasteBank).Accompanyingthiswouldbethedevelopmentofasuite of incentive and enforcement mechanisms for improving sector performance across localgovernments.Finally,itwouldrequirethedevelopmentofpoliciesandprogramsforwaste-to-energy,recycling/composting,andland-basedmarinedebris.
Box 7: Complementary investments considered under the proposed World Bank loan IMPROVEMENT OF SOLID WASTE MANAGEMENT TO SUPPORT REGIONAL AND METROPOLITAN CITIES
Under the proposed loan ($100 million) being prepared, there are investments of more than $ 1.0 billion to be leveraged that enable necessary improvements in solid waste, including activities targeting recycling and plastics leakage. The Project Development Objective (PDO) for this loan is to improve solid waste management services for urban populations in selected cities across Indonesia and the project will have a dedicated result indicator for reduction of waste leakages to waterways.
Strategic studies will focus on key impediments to enhancing the solid waste sector’s overall performance. Identified studies for program implementation: (a) household waste reduction support (including 3Rs (reduce, reuse, recycle) and “Waste Bank” ; (b) mechanisms for incorporating the informal waste workers and wider communities in formal waste collection and recycling systems; (c) a roadmap for transitioning Dinas Kebersihan to BLUD institutions; (d) policy and legal frameworks for promoting waste-to-energy investments; (e) strategies for leveraging additional private and public financing for solid waste management; and (f) development of policy measures to reduce land-based marine pollution and prevent plastic waste from entering waterways and the ocean.
Themarinedebrishotspotassessmentservestoinformthetypesofpoliciesandinvestments,aswellasthecitylevelneedsforwaterwaysinfrastructure,improvedwastemanagement,andstrategiesandmeasuresforbehaviorchange.
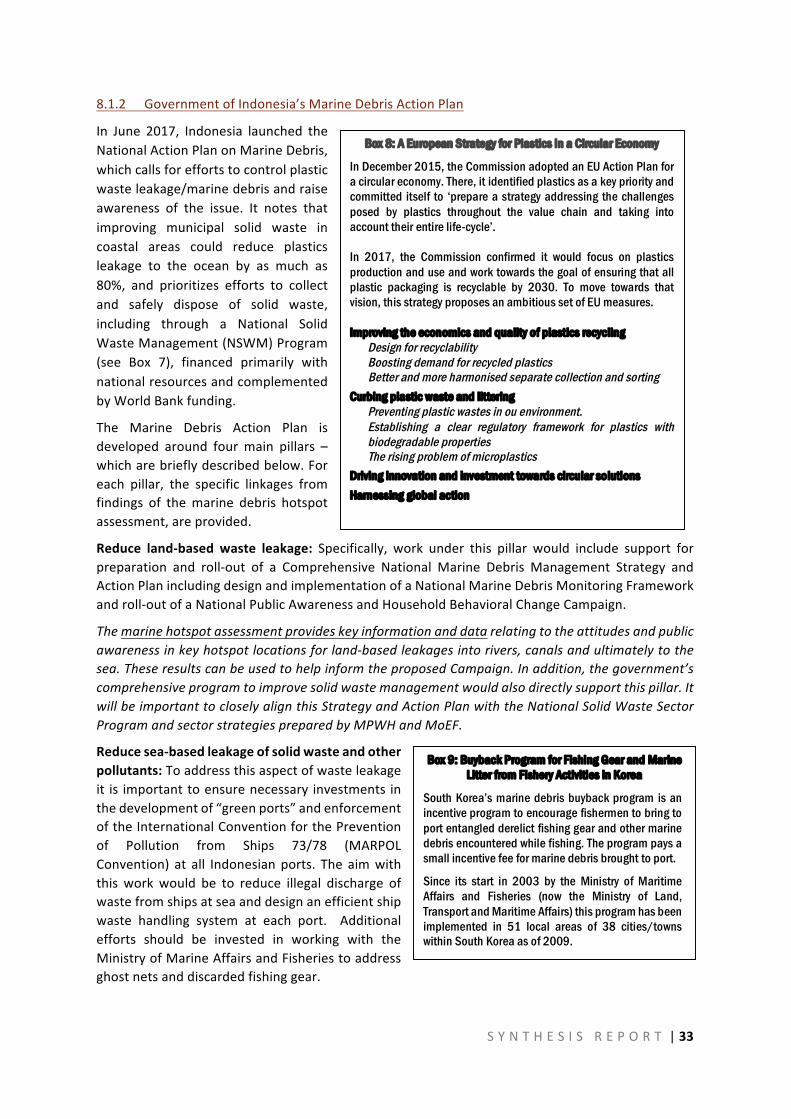
S Y N T H E S I S R E P O R T |33
8.1.2 GovernmentofIndonesia’sMarineDebrisActionPlan
In June 2017, Indonesia launched theNationalActionPlanonMarineDebris,whichcallsforeffortstocontrolplasticwasteleakage/marinedebrisandraiseawareness of the issue. It notes thatimproving municipal solid waste incoastal areas could reduce plasticsleakage to the ocean by as much as80%, and prioritizes efforts to collectand safely dispose of solid waste,including through a National SolidWasteManagement(NSWM)Program(see Box 7), financed primarily withnationalresourcesandcomplementedbyWorldBankfunding.
The Marine Debris Action Plan isdeveloped around four main pillars –whicharebrieflydescribedbelow.Foreach pillar, the specific linkages fromfindings of themarine debris hotspotassessment,areprovided.
Reduce land-based waste leakage: Specifically, work under this pillar would include support forpreparation and roll-out of a Comprehensive National Marine Debris Management Strategy andActionPlanincludingdesignandimplementationofaNationalMarineDebrisMonitoringFrameworkandroll-outofaNationalPublicAwarenessandHouseholdBehavioralChangeCampaign.
Themarinehotspotassessmentprovideskeyinformationanddatarelatingtotheattitudesandpublicawarenessinkeyhotspotlocationsforland-basedleakagesintorivers,canalsandultimatelytothesea.TheseresultscanbeusedtohelpinformtheproposedCampaign.Inaddition,thegovernment’scomprehensiveprogramtoimprovesolidwastemanagementwouldalsodirectlysupportthispillar.ItwillbeimportanttocloselyalignthisStrategyandActionPlanwiththeNationalSolidWasteSectorProgramandsectorstrategiespreparedbyMPWHandMoEF.
Reducesea-basedleakageofsolidwasteandotherpollutants:Toaddressthisaspectofwasteleakageit is importanttoensurenecessary investments inthedevelopmentof“greenports”andenforcementoftheInternationalConventionforthePreventionof Pollution from Ships 73/78 (MARPOLConvention) at all Indonesianports. The aimwiththis workwould be to reduce illegal discharge ofwastefromshipsatseaanddesignanefficientshipwaste handling system at each port. Additionalefforts should be invested in working with theMinistryofMarineAffairsandFisheriestoaddressghostnetsanddiscardedfishinggear.
Box 9: Buyback Program for Fishing Gear and Marine Litter from Fishery Activities in Korea
South Korea’s marine debris buyback program is an incentive program to encourage fishermen to bring to port entangled derelict fishing gear and other marine debris encountered while fishing. The program pays a small incentive fee for marine debris brought to port.
Since its start in 2003 by the Ministry of Maritime Affairs and Fisheries (now the Ministry of Land, Transport and Maritime Affairs) this program has been implemented in 51 local areas of 38 cities/towns within South Korea as of 2009.
Box 8: A European Strategy for Plastics in a Circular Economy In December 2015, the Commission adopted an EU Action Plan for a circular economy. There, it identified plastics as a key priority and committed itself to ‘prepare a strategy addressing the challenges posed by plastics throughout the value chain and taking into account their entire life-cycle’. In 2017, the Commission confirmed it would focus on plastics production and use and work towards the goal of ensuring that all plastic packaging is recyclable by 2030. To move towards that vision, this strategy proposes an ambitious set of EU measures. Improving the economics and quality of plastics recycling
Design for recyclability Boosting demand for recycled plastics Better and more harmonised separate collection and sorting
Curbing plastic waste and littering Preventing plastic wastes in ou environment. Establishing a clear regulatory framework for plastics with biodegradable properties The rising problem of microplastics
Driving innovation and investment towards circular solutions Harnessing global action
S Y N T H E S I S R E P O R T |34
Themarinehotspotsassessmentdidnotcoversea-basedleakageofwaste–whichisestimatedtobeatleast20%ofwasteleakedintoIndonesia’smarineenvironments.However,informationfromsomeofthecitiessurveyedpointedtowastemanagementconcernsinharborareas,pointingtoneedforcleanup.
Reduceaccumulatedcoastalandmarinepollution:Underthispillar,theActionPlanaimstoreducetheadverseimpactsofaccumulatedmarinedebrisonhumanhealth,tourism,shipping,fisheriesandcoastalandmarineecosystems.Specific investmentswould includeassessmentandpromotionofrelevantandcost-effectivetechnologies toremoveandproperlydisposeofaccumulateddebris incoastalandmarineareasaswellasestablishmechanismstofacilitateremoval,androllouteducationcampaignsonimpactsofmarinedebrisonhealthandenvironment.
The marine hotspots assessment provides evidence for the need to expand community ledengagementforclean-upeffortstofurtherpromotecommunityawarenessandcommitmenttoproperwastedisposal.Inaddition,italsopointstoareasforfutureresearchintothehuman,environmentalandeconomiccostsofmarinedebris,suchasanassessmentoftheimpactsofanthropogenicdebrisin Indonesia’sseafoodsupplyto informpublichealthrisksandseafoodsafetyadvisoriesrelatedtobioaccumulationofpollutantsandhazardouschemicals.
Reduceplasticsproductionanduse:TheworkunderthispillaroftheActionPlanplacesaprimaryfocusonprivatesectorengagementandresponsibilityinhelpingtoaddressIndonesia’smarinedebrischallenge.ActionsenvisionedunderthispillarincludesupportfornationwidescaleupofIndonesia’splastic bags tax pilot to include bottles as well as plastics packaging and promotion of greenprocurementpolicies.Furtheractionsrecommendedincluderoll-outofproducer‘cradletocradle’responsibilityprinciples,scalingupandpromotionofprivatesector-ledplasticsreductionaction.
The marine hotspots assessment details some good practice initiatives of waste management,includingthoseincollaborationwiththeprivatesectorandNGOs.Futureresearchproposedfurtherbelowpointstotheneedforpoliciesandinvestmentsrelatingtoplasticsreduction,andexplorationofalternatives.Thewastestreamanalysiswouldalsohelptoidentifyspecificproducts(suchastypesofsingleuseplastics)totargetasafirstpriority.
8.2 RecommendationsforAddressingIndonesia’sPlasticWaste
Drawing from the results from this rapid assessment, there are several recommendations foraddressing the growing problem of plasticwaste /marine litter in Indonesia.With 80 percent ofleakage coming from land-based sources,many recommendations are systemic – and part of (orshouldbemadepartof) theoverall solidwastemanagementstrategy (revolvingaround improvedcollection,recycling,sourcesegregation,andfinaldisposaloptions). Thissection includessomeofsystemicrecommendationsforinclusionorfurtheremphasisintheintegratedSWMagenda,butalsonarrowsinonthemarinelitter/plasticswastepollutionwhichmaynotbefullycoveredyetbycurrentwaste sector strategies. In other cases, the recommendations relating to technology, upstreampoliciesetc.arespecifictoaddressingplasticwaste.
1. REDUCEINSTITUTIONALFRAGMENTATION
Duetothemulti-sectoralandcross-cuttingnatureoftheplasticswasteagenda,thereisastrongneedfor clear institutional responsibility. Importantly, the institutional framework for thegovernment’smarine debris actions needs to be firmly embedded into the national solid waste managementstrategy and action plans. Evidence from this rapid assessment, points to several institutionalstrengtheningmeasuresatthecitylevelonoverallwastemanagement.Theseinclude:
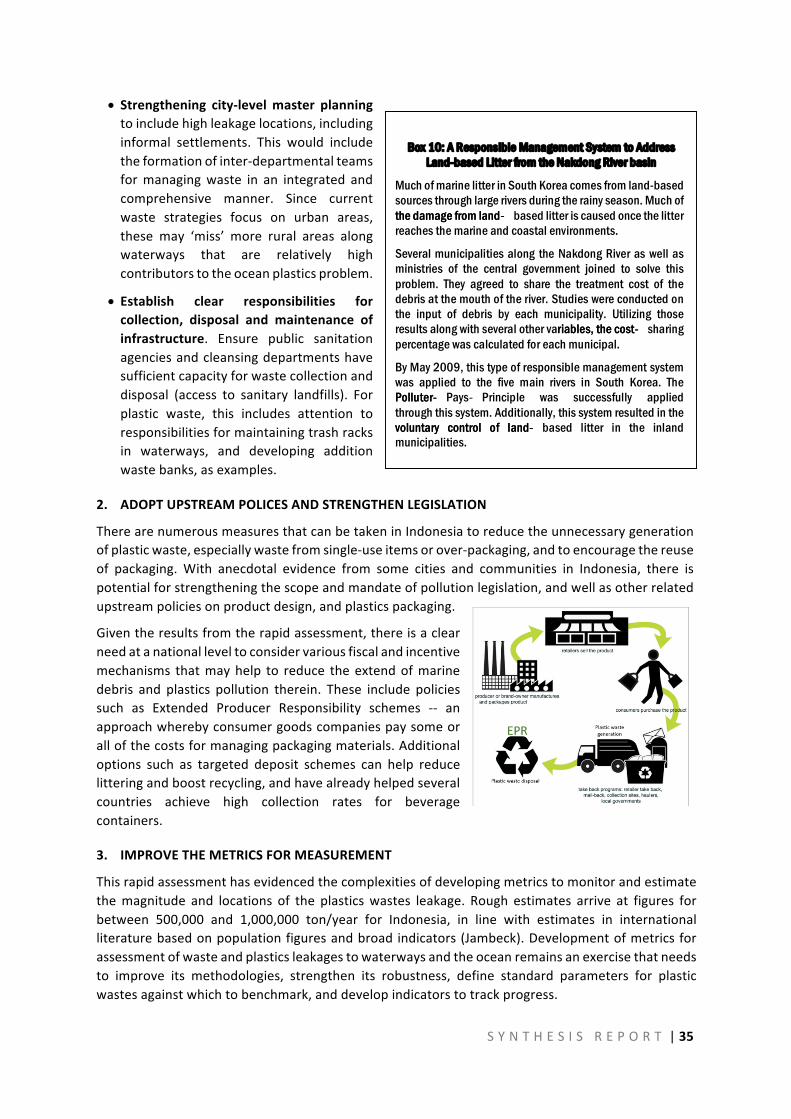
S Y N T H E S I S R E P O R T |35
• Strengthening city-levelmaster planningtoincludehighleakagelocations,includinginformal settlements. This would includetheformationofinter-departmentalteamsformanagingwaste in an integrated andcomprehensive manner. Since currentwaste strategies focus on urban areas,these may ‘miss’ more rural areas alongwaterways that are relatively highcontributorstotheoceanplasticsproblem.
• Establish clear responsibilities forcollection, disposal and maintenance ofinfrastructure. Ensure public sanitationagenciesandcleansingdepartmentshavesufficientcapacityforwastecollectionanddisposal (access to sanitary landfills). Forplastic waste, this includes attention toresponsibilitiesformaintainingtrashracksin waterways, and developing additionwastebanks,asexamples.
2. ADOPTUPSTREAMPOLICESANDSTRENGTHENLEGISLATION
TherearenumerousmeasuresthatcanbetakeninIndonesiatoreducetheunnecessarygenerationofplasticwaste,especiallywastefromsingle-useitemsorover-packaging,andtoencouragethereuseof packaging. With anecdotal evidence from some cities and communities in Indonesia, there ispotentialforstrengtheningthescopeandmandateofpollutionlegislation,andwellasotherrelatedupstreampoliciesonproductdesign,andplasticspackaging.
Giventheresultsfromtherapidassessment,thereisaclearneedatanationalleveltoconsidervariousfiscalandincentivemechanisms thatmayhelp to reduce theextendofmarinedebris and plastics pollution therein. These include policiessuch as Extended Producer Responsibility schemes -- anapproachwherebyconsumergoodscompaniespaysomeorallofthecostsformanagingpackagingmaterials.Additionaloptions such as targeted deposit schemes can help reducelitteringandboostrecycling,andhavealreadyhelpedseveralcountries achieve high collection rates for beveragecontainers.
3. IMPROVETHEMETRICSFORMEASUREMENT
Thisrapidassessmenthasevidencedthecomplexitiesofdevelopingmetricstomonitorandestimatethemagnitude and locations of the plasticswastes leakage. Rough estimates arrive at figures forbetween 500,000 and 1,000,000 ton/year for Indonesia, in line with estimates in internationalliteraturebasedonpopulationfiguresandbroadindicators(Jambeck).Developmentofmetricsforassessmentofwasteandplasticsleakagestowaterwaysandtheoceanremainsanexercisethatneedsto improve its methodologies, strengthen its robustness, define standard parameters for plasticwastesagainstwhichtobenchmark,anddevelopindicatorstotrackprogress.
Box 10: A Responsible Management System to Address Land-based Litter from the Nakdong River basin
Much of marine litter in South Korea comes from land-based sources through large rivers during the rainy season. Much of the damage from land-the damage from land- based litter is caused once the litter reaches the marine and coastal environments.
Several municipalities along the Nakdong River as well as ministries of the central government joined to solve this problem. They agreed to share the treatment cost of the debris at the mouth of the river. Studies were conducted on the input of debris by each municipality. Utilizing those results along with several other variables, the cost-riables, the cost- sharing percentage was calculated for each municipal.
By May 2009, this type of responsible management system was applied to the five main rivers in South Korea. The Polluter-Polluter- Pays- Principle was successfully applied through this system. Additionally, this system resulted in the voluntary control of land-voluntary control of land- based litter in the inland municipalities.
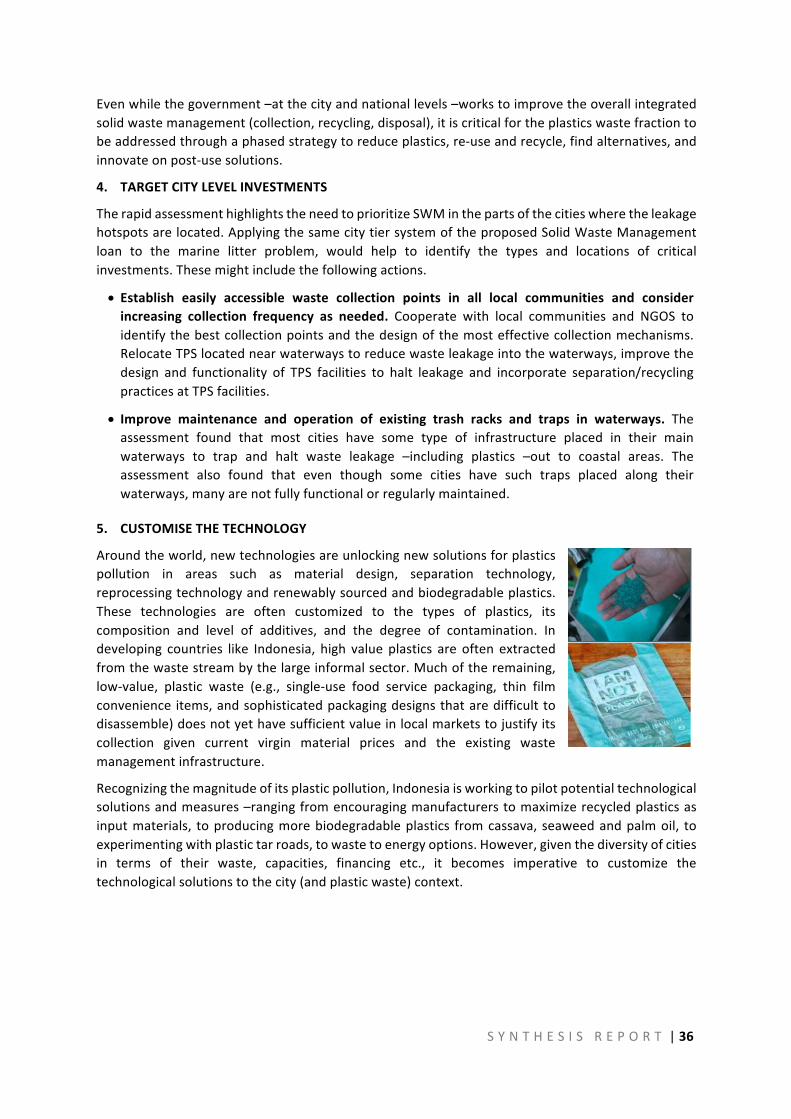
S Y N T H E S I S R E P O R T |36
Evenwhilethegovernment–atthecityandnationallevels–workstoimprovetheoverallintegratedsolidwastemanagement(collection,recycling,disposal),itiscriticalfortheplasticswastefractiontobeaddressedthroughaphasedstrategytoreduceplastics,re-useandrecycle,findalternatives,andinnovateonpost-usesolutions.
4. TARGETCITYLEVELINVESTMENTS
TherapidassessmenthighlightstheneedtoprioritizeSWMinthepartsofthecitieswheretheleakagehotspotsarelocated.ApplyingthesamecitytiersystemoftheproposedSolidWasteManagementloan to the marine litter problem, would help to identify the types and locations of criticalinvestments.Thesemightincludethefollowingactions.
• Establish easily accessible waste collection points in all local communities and considerincreasing collection frequency as needed. Cooperate with local communities and NGOS toidentifythebestcollectionpointsandthedesignofthemosteffectivecollectionmechanisms.RelocateTPSlocatednearwaterwaystoreducewasteleakageintothewaterways,improvethedesign and functionality of TPS facilities to halt leakage and incorporate separation/recyclingpracticesatTPSfacilities.
• Improve maintenance and operation of existing trash racks and traps in waterways. Theassessment found that most cities have some type of infrastructure placed in their mainwaterways to trap and halt waste leakage –including plastics –out to coastal areas. Theassessment also found that even though some cities have such traps placed along theirwaterways,manyarenotfullyfunctionalorregularlymaintained.
5. CUSTOMISETHETECHNOLOGY
Aroundtheworld,newtechnologiesareunlockingnewsolutionsforplasticspollution in areas such as material design, separation technology,reprocessingtechnologyandrenewablysourcedandbiodegradableplastics.These technologies are often customized to the types of plastics, itscomposition and level of additives, and the degree of contamination. Indeveloping countries like Indonesia, high value plastics are often extractedfromthewastestreambythelargeinformalsector.Muchoftheremaining,low-value, plastic waste (e.g., single-use food service packaging, thin filmconvenience items,andsophisticatedpackagingdesignsthataredifficulttodisassemble)doesnotyethavesufficientvalueinlocalmarketstojustifyitscollection given current virgin material prices and the existing wastemanagementinfrastructure.
Recognizingthemagnitudeofitsplasticpollution,Indonesiaisworkingtopilotpotentialtechnologicalsolutionsandmeasures–rangingfromencouragingmanufacturerstomaximizerecycledplasticsasinputmaterials, toproducingmorebiodegradableplastics fromcassava, seaweedandpalmoil, toexperimentingwithplastictarroads,towastetoenergyoptions.However,giventhediversityofcitiesin terms of their waste, capacities, financing etc., it becomes imperative to customize thetechnologicalsolutionstothecity(andplasticwaste)context.
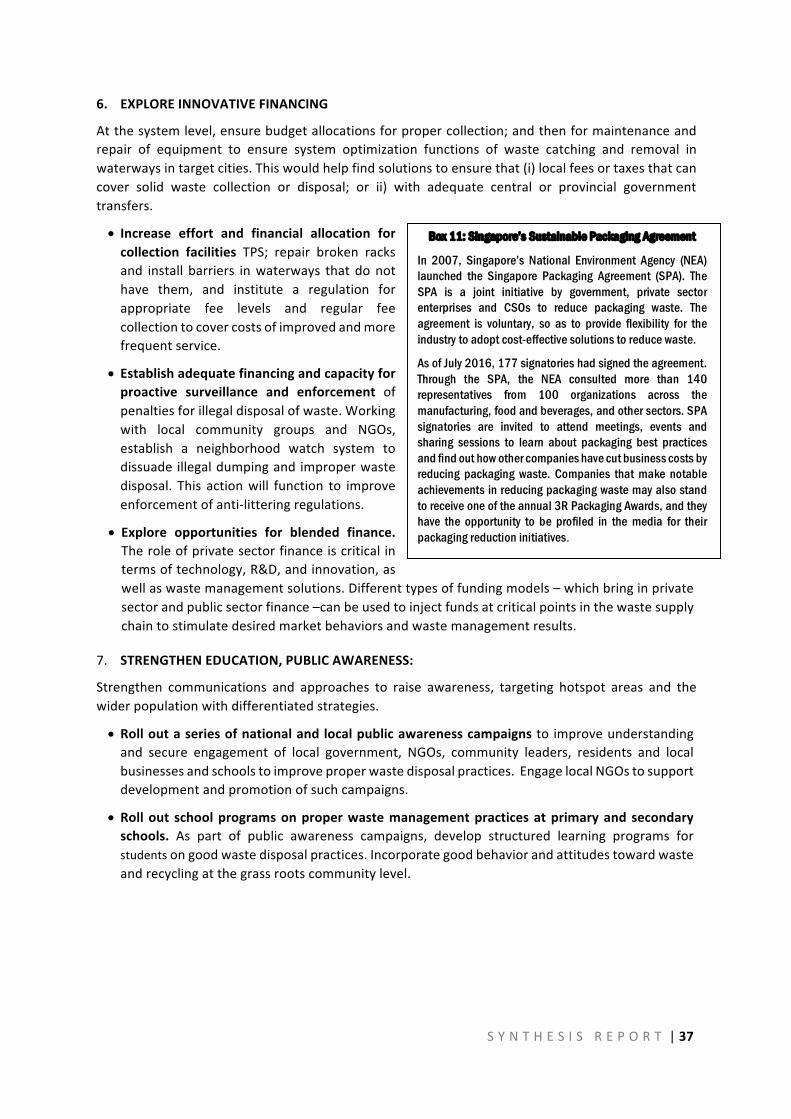
S Y N T H E S I S R E P O R T |37
6. EXPLOREINNOVATIVEFINANCING
Atthesystemlevel,ensurebudgetallocationsforpropercollection;andthenformaintenanceandrepair of equipment to ensure system optimization functions of waste catching and removal inwaterwaysintargetcities.Thiswouldhelpfindsolutionstoensurethat(i)localfeesortaxesthatcancover solid waste collection or disposal; or ii) with adequate central or provincial governmenttransfers.
• Increase effort and financial allocation forcollection facilities TPS; repair broken racksand install barriers inwaterways that donothave them, and institute a regulation forappropriate fee levels and regular feecollectiontocovercostsofimprovedandmorefrequentservice.
• Establishadequatefinancingandcapacityforproactive surveillance and enforcement ofpenaltiesforillegaldisposalofwaste.Workingwith local community groups and NGOs,establish a neighborhood watch system todissuadeillegaldumpingandimproperwastedisposal. This actionwill function to improveenforcementofanti-litteringregulations.
• Explore opportunities for blended finance.Theroleofprivatesectorfinanceiscriticalintermsoftechnology,R&D,andinnovation,aswellaswastemanagementsolutions.Differenttypesoffundingmodels–whichbringinprivatesectorandpublicsectorfinance–canbeusedtoinjectfundsatcriticalpointsinthewastesupplychaintostimulatedesiredmarketbehaviorsandwastemanagementresults.
7. STRENGTHENEDUCATION,PUBLICAWARENESS:
Strengthen communications and approaches to raise awareness, targeting hotspot areas and thewiderpopulationwithdifferentiatedstrategies.
• Rolloutaseriesofnationalandlocalpublicawarenesscampaigns to improveunderstandingand secure engagement of local government, NGOs, community leaders, residents and localbusinessesandschoolstoimproveproperwastedisposalpractices.EngagelocalNGOstosupportdevelopmentandpromotionofsuchcampaigns.
• Rollout schoolprogramsonproperwastemanagementpracticesatprimaryandsecondaryschools. As part of public awareness campaigns, develop structured learning programs forstudentsongoodwastedisposalpractices.Incorporategoodbehaviorandattitudestowardwasteandrecyclingatthegrassrootscommunitylevel.
Box 11: Singapore’s Sustainable Packaging Agreement
In 2007, Singapore’s National Environment Agency (NEA) launched the Singapore Packaging Agreement (SPA). The SPA is a joint initiative by government, private sector enterprises and CSOs to reduce packaging waste. The agreement is voluntary, so as to provide flexibility for the industry to adopt cost-effective solutions to reduce waste.
As of July 2016, 177 signatories had signed the agreement. Through the SPA, the NEA consulted more than 140 representatives from 100 organizations across the manufacturing, food and beverages, and other sectors. SPA signatories are invited to attend meetings, events and sharing sessions to learn about packaging best practices and find out how other companies have cut business costs by reducing packaging waste. Companies that make notable achievements in reducing packaging waste may also stand to receive one of the annual 3R Packaging Awards, and they have the opportunity to be profiled in the media for their packaging reduction initiatives.
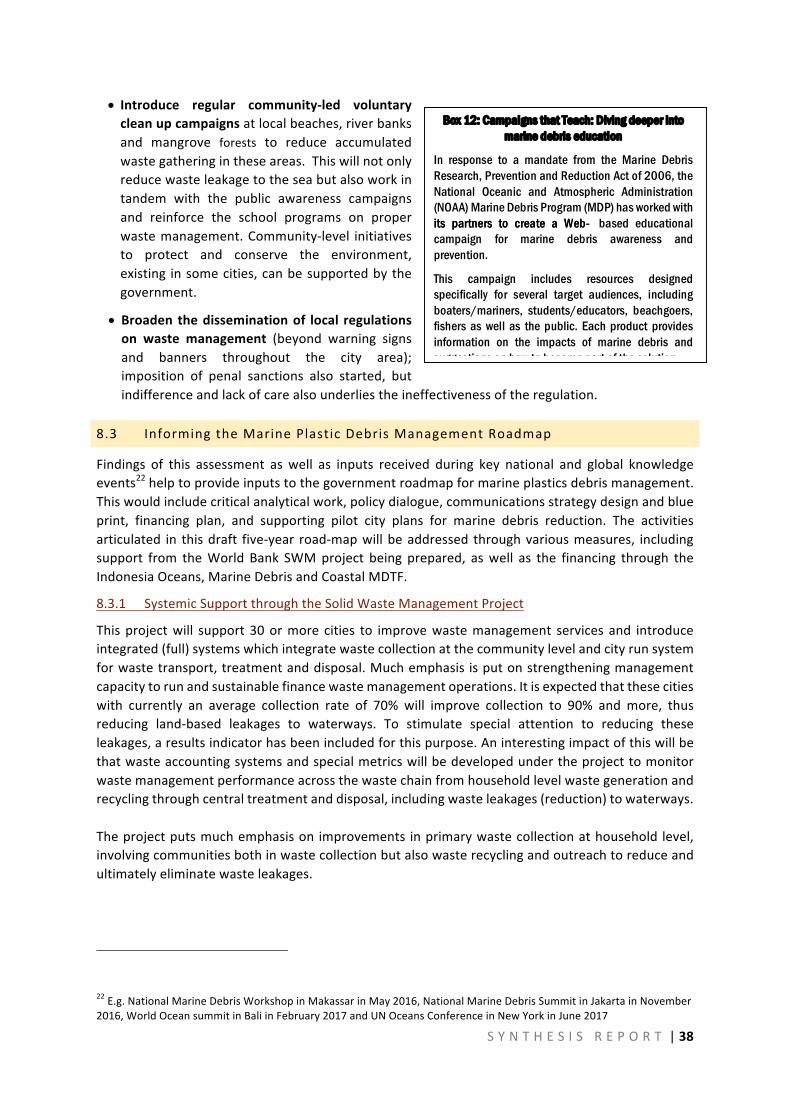
S Y N T H E S I S R E P O R T |38
• Introduce regular community-led voluntarycleanupcampaignsatlocalbeaches,riverbanksand mangrove forests to reduce accumulatedwastegatheringintheseareas.Thiswillnotonlyreducewasteleakagetotheseabutalsoworkintandem with the public awareness campaignsand reinforce the school programs on properwastemanagement.Community-level initiativesto protect and conserve the environment,existing insomecities,canbesupportedbythegovernment.
• Broadenthedisseminationof local regulationson waste management (beyond warning signsand banners throughout the city area);imposition of penal sanctions also started, butindifferenceandlackofcarealsounderliestheineffectivenessoftheregulation.
8.3 InformingtheMarinePlasticDebrisManagementRoadmap
Findings of this assessment as well as inputs received during key national and global knowledgeevents22helptoprovideinputstothegovernmentroadmapformarineplasticsdebrismanagement.Thiswouldincludecriticalanalyticalwork,policydialogue,communicationsstrategydesignandblueprint, financing plan, and supporting pilot city plans for marine debris reduction. The activitiesarticulated in thisdraft five-year road-mapwillbeaddressed throughvariousmeasures, includingsupport from theWorld Bank SWMproject being prepared, aswell as the financing through theIndonesiaOceans,MarineDebrisandCoastalMDTF.
8.3.1 SystemicSupportthroughtheSolidWasteManagementProject
Thisprojectwill support 30ormore cities to improvewastemanagement services and introduceintegrated(full)systemswhichintegratewastecollectionatthecommunitylevelandcityrunsystemforwastetransport,treatmentanddisposal.Muchemphasis isputonstrengtheningmanagementcapacitytorunandsustainablefinancewastemanagementoperations.Itisexpectedthatthesecitieswith currently an average collection rate of 70% will improve collection to 90% andmore, thusreducing land-based leakages to waterways. To stimulate special attention to reducing theseleakages,aresultsindicatorhasbeenincludedforthispurpose.Aninterestingimpactofthiswillbethatwasteaccountingsystemsandspecialmetricswillbedevelopedundertheprojecttomonitorwastemanagementperformanceacrossthewastechainfromhouseholdlevelwastegenerationandrecyclingthroughcentraltreatmentanddisposal,includingwasteleakages(reduction)towaterways.Theprojectputsmuchemphasison improvements inprimarywastecollectionathousehold level,involvingcommunitiesbothinwastecollectionbutalsowasterecyclingandoutreachtoreduceandultimatelyeliminatewasteleakages.
22E.g.NationalMarineDebrisWorkshopinMakassarinMay2016,NationalMarineDebrisSummitinJakartainNovember2016,WorldOceansummitinBaliinFebruary2017andUNOceansConferenceinNewYorkinJune2017
Box 12: Campaigns that Teach: Diving deeper into marine debris education
In response to a mandate from the Marine Debris Research, Prevention and Reduction Act of 2006, the National Oceanic and Atmospheric Administration (NOAA) Marine Debris Program (MDP) has worked with its partners to create a Web-its partners to create a Web- based educational campaign for marine debris awareness and prevention.
This campaign includes resources designed specifically for several target audiences, including boaters/mariners, students/educators, beachgoers, fishers as well as the public. Each product provides information on the impacts of marine debris and suggestions on how to become part of the solution.
S Y N T H E S I S R E P O R T |39
8.3.2 TargetedSupportthroughtheIndonesiaOceans,MarineDebrisandCoastalMDTF
UndertheMDTF,component2onmarinedebriswillfinanceanalyticalandpilotinvestmentsupport–alignedspecificallytosupportandstrengthentheimplementationoftheNationalActionPlanonMarineDebris,andaimedatreducingplasticdebrisinIndonesia’scoastalareas,managingplasticinthesea,andincreasingresearchandinnovationinhandlingofmarinedebris.Underthedraftworkplanarethefollowingactivities:Research,AnalyticalStudies• ReplicateandExpandRapidHotspotsAssessments:Thespecificityaffordedbytheassessmentisevident
inthecityspecificinsightsandoverallbroaderlessonsitprovides.Thefindingsallowfordevelopmentofacomprehensive national response with local granularity. Replicating the assessment in coastal cities,especially in Eastern Indonesia, would help create a national baseline of waste leakage to coastalenvironments,andanaccompanyingnationalmonitoringframeworktotrackprogressonnationalandlocalscale.
• MainstreamandDeepenHotspotsAssessments:Developafollowupstudydesignedtoassessseasonalandannual fluctuations inwaste leakagefromwaterwaystocoastalareas.Designrobustprotocolsandmodellingtoestimatevolumeofwasteleakage;andtomeasure/monitormarinedebrisoncoastalshoresanddocumentorigin.Undertakedeep-diveassessmentsintosolutionstoreducewasteleakageforspecificriversegment.
• AssessPlasticsContentinSeafoodSupplyChain:Expandinitialresearchonplasticscontentindomesticfishsupply. Indonesiatargets increasedfishconsumptionasthemajorsourceofprotein;understandingtheextentofplasticscontaminationindomesticallyconsumedseafoodiscriticalforthisstrategy,aswellasforwiderseafoodsafetycompliance.
• AccumulatedWaste Clean Up Technologies: Conduct research on the costs and benefits of differentcoastalandmarinewasteclean-uptechnologiestodeterminethemostappropriateforIndonesiaandinspecific cities/coastal areas depending on waste volume, costs and viability (operation, maintenance,transport,associatedequipmentandinfrastructureneeds).
Communications/ Behavior change: Design and test the implementation of awareness,communicationsandbehaviorchangecampaignsforprimarywastecollectionandrecyclinginprioritycities(“championcities”tocombatlocalmarinedebris).Workwithlocalcommunitiestocustomizecampaignsatthelocallevel.
Policies,Regulations, IncentiveMechanisms: Activities to informnational level policies, incentivemechanisms,andregulationstohaltwasteleakageintoriversandtheocean.Analysisofpotentialfortaxes on plastic bags/ plastics packaging; ban on select single-use plastics; enhanced research onbiodegradable alternatives;deposit systems forplasticbottles and containers; and regulationsonproducerresponsibilityforproductpackaging.
TechnicalAssistance,Pilots,Investments:UsingthetiersystemforcitiesproposedundertheBank-financedSWMproject,identifyareasfortechnicalassistancetosupportcity-levelplanningformarinedebris reduction, including conceptual development, data bases, strategies, monitoring andevaluation;developingamodelthatcanbereplicated.With informationfromthetechnologyandcost-effectivenessstudies,provideinputstofeasibilitystudiesforcustomizedpilotsandinvestments.
S Y N T H E S I S R E P O R T |40
REFERENCES
APEC(2009) UnderstandingtheEconomicBenefitsandCostsofControllingMarineDebrisintheAPECRegion,APECMarineResourcesConservationWorkingGroup.
BPS(2015a) IndikatorPerilakuPeduliLingkunganHidup2014(HasilSurveiSosialEkonomiNasional2014,ModulKetahananSosial),BadanPusatStatistik(BPS),Jakarta-Indonesia.
BPS(2015b)
StatistikIndonesia,StatisticalYearbookofIndonesia2015,BadanPusatStatistik(BPS),Jakarta-Indonesia.
BPS-Jkt(2015) JakartaDalamAngka–JakartainFigures2015,BadanPusatStatistikProvinsiDKIJakarta.
BAPPENAS(2015) LaporanPencapaianTujuanPembangunanMileniumdiIndonesia2014,BadanPerencanaanPembangunanNasional(BAPPENAS)Indonesia.(MillenniumDevelopmentGoals(MDG)),LaporanMDGs2014Final.pdf
BennoR.etal(2015) TheInfluenceofEconomicandDemographicFactorstoWasteGenerationinCapitalCityofJavaandSumatera.TheThirdJointSeminarofJapanandIndonesia.EnvironmentalSustainabilityandDisasterPrevention(3rdESDP-2015)InstitutTeknologiBandung,Indonesia–November25th,2015
EriksenM.etal.(2014) PlasticPollutionintheWorld’sOceans:Morethan5TrillionPlasticPiecesWeighingover250,000TonsAfloatatSea.PloSONE9(12):e111913.
EU(2013) GuidanceonMonitoringofMarineLitterinEuropeanSeas,EuropeanCommission,JointResearchCentre,InstituteforEnvironmentandSustainability.
Girietal.(2011) Statusanddistributionofmangroveforestsoftheworldusingearthobservationsatellitedata.GlobalEcologyandBiogeography,(2011),20,154-159.
GOI(UU18–2008) Undang-UndangRepublikIndonesiaNomor18Tahun2008TentangPengelolaanSampah,(WasteManagementAct),GovernmentofIndonesia
GOI(PP81-2012) PeraturanPemerintahRepublikIndonesia,Nomor81Tahun2012,TentangPengelolaanSampahRumahTanggaDanSampahSejenisSampahRumahTangga,GovernmentofIndonesia.
GordonM.(2006a)
MunicipalBestManagementPracticesForControllingTrashandDebrisInStormwaterAndUrbanRunoff,CaliforniaCoastalCommission.
GordonM.(2006b) EliminatingLand-basedDischargesOfMarineDebrisInCalifornia:APlanofActionfromThePlasticDebrisProjectCaliforniaCoastalCommission.
S Y N T H E S I S R E P O R T |41
IPRC(2008) TrackingOceanDebris.InternationalPacificResearchCenterIPRCClimateNewsletter,Volume8,Number2.
J.Raynaud(2014) Valuingplastic:Thebusinesscaseformeasuring,managinganddisclosingplasticuseintheconsumergoodsindustry,UNEPRep.,2014.
Jambecket.al.(2015a) Plasticwasteinputsfromlandintotheocean,Science,13February2015Volume347,Issue6223.
Jambecket.al.(2015b) SupplementaryMaterialsfor:Plasticwasteinputsfromlandintotheocean,Science,13February2015,VOL347Issue6223.www.sciencemag.org/content/347/6223/768/suppl/DC1
MARPOL73/78 AnnexV(preventionofpollutionbygarbagefromships)
McKinsey(2015) StemmingtheTide:Land-basedstrategiesforaplastic-freeocean,McKinsey&CompanyandOceanConservancy,September2015.
McKinsey(2016) ManagingWasteinEmergingMarkets.
Mugabi,J.(2014) HowtoFinanceSolidWasteManagement–StartingfromResults.WorldBank.
Obbard,R.W.,etal.(2014) GlobalWarmingReleasesMicroplasticLegacyFrozeninArticIce,Earth’sFuture,Volume2,Issue6,pages315-320(2014).
Gourmelon,G.(2015)
GlobalPlasticProductionRises,RecyclingLags.VitalSigns.WorldWatchInstitute.CitationofPlasticsEurope,op.cit.note1:EuropeanHouseAmbrosette,op.cit.Note7.
Rahim,I.R.et.al.(2012) CostAnalysisofMunicipalSolidWasteManagementinMajorIndonesianCities,JournalofJapanSocietyofCivilEngineers,Ser.G(EnvironmentalResearch)Vol.68(2012)No.6p.II_79-II_88,https://www.jstage.jst.go.jp/article/jscejer/68/6/68_II_79/_pdf
SesiniM.(2011): TheGarbagePatchintheOceans:TheProblemAndPossibleSolutions,EarthInstitute,ColumbiaUniversity
SNI(1995) IndonesianStandards:SNI19-1983-1995.SpesifikasitimbulansampahuntukkotakecildankotasedangdiIndonesia,StandardNationalIndonesia.
SNI(2002) IndonesianStandards:SNI19-2454-2002Tatacarateknikoperasionalpengelolaansampahperkotaan,StandardNationalIndonesia.
SNI(2008) IndonesianStandards:SNI3242-2008Pengelolaansampahdipermukiman,StandardNationalIndonesia.
UNEP(2005) MarineLitter,ananalyticaloverview.
UNEP(2009a) MarineLitter:AGlobalChallenge.
UNEP(2009b)
UNEP/IOCGuidelinesonSurveyandMonitoringofMarineLitter,RegionalSeasReportsandStudieso.186IOCTechnicalSeriesNo.83.
UNEP(2015) GlobalWasteManagementOutlook.
S Y N T H E S I S R E P O R T |42
WatkinsE.etal(2015) Marinelitter:socio-economicstudyScopingreport,InstituteforEuropeanEnvironmentalPolicy,2June2015
WoodwardD.(2013) InstitutionalDevelopmentandCostRecoveryStudyFinalReport,preparedfortheWorldBank’s“IndonesiaSolidWasteManagementImprovementProjectforRegionalandMetropolitanCities”,WorldBankJakarta.
WorldBank(2012) WhataWaste:AGlobalReviewofSolidWasteManagement
WorldEconomicForum,EllenMacarthurFoundation,andMcKinsey&Company(2016)
“Thenewplasticseconomy:Rethinkingthefutureofplastics,”Jan.19,2016.


