Embed Size (px)
Citation preview
PergailwnEnergy Com>ers.Mgml Vol. 38, No.6, pp. 563-599, I
iD 1997 Elsevier SciencePrinted in Great Britain. All rights rese,
PH: 80196-8904(96)00073-8 0196-8904/97 $17.00 +.
INDUSTRIAL ENERGY UTILISATION IN KARNATAKAAND POTENTIAL SAVINGS
T. V. RAMACHANDRAt and D. K. SUBRAMANIANCentre for Ecological Sciences. Indian Institute of Science. Bangalore 560012, India
(Received 25 August 1995)
Abstract-Energy is essential for industrial production. Because of the past abundance of low-cost energy,historically, the rate of social progress among industrial societies has not been limited by energyavailability. Energy cost has not been significant when compared with no energy use. Mechanisation ofagriculture, increased use of electrical appliances in the domestic sector and rapid industrialisation to meetthe demand of exponentially growing population have resulted in an energy crisis. The raised fossil fuelprices and the environmental factors playing the dominant role in implementation of large scale projects,such as hydro, thermal and nuclear, have aggravated the problem further. In this context, an integratedenergy plan for a country seems essential for ecologically sound development of a region. An integratedplan includes strategies to:
. improve the efficiencies of end use devices and/or conversion equipment in all sectors;.optimise energy sources (end use matching);
. maximise the use of renewable resources;
. balance the exploitation of biomass energy resources; and
. discourage the use of depletable resources.
Conservation through improvement of the efficiencies of end use devices is one of the most effectiveways to provide immediate relief for the energy problem. This helps to maintain economic growth andsocial progress of a region. Environmental problems, resource depletion and growing demand of energyin the state/region make it increasingly imperative that we use energy as efficiently as possible, and plannersshould take note of this untapped resource. The potential for improved energy efficiency is great, and asubstantial part of that potential could be realised in the course of events.
The industrial sector constitutes a major consumer of commercial energy. Improvement of energyefficiency in the industrial sector would result in a slower rate of energy growth. A secure energy supplyis the major concern of most industrialists. It is, thus, necessary to examine industrial energy use and theeconomy. The analyses of consumption patterns and the assessment of feasible energy conservationpossibilities show that the potential for energy conservation in the industrial sector and in all sectors issubstantial. The barriers identified to tap this potential are a lack of information on specific measures andoptions for achieving energy conservation, lack of capital for schemes involving technology upgrading andefficiency improvements. pricing policies which deviate from rational tariffs and the inadequacy ofinstitutional arrangements for promoting energy conservation in different sectors of the economy. In thisregard, research should be sponsored to develop system designs, cost and pricing policies, problems relatedto system interconnection with public utilities and an assessment of potential energy savings, and researchinto methods of matching energy resources to work requirements, rather than vice versa, for improvedefficiency. It is essential for the planning machinery to foster the integrated approach in energy planningof a region.
This paper discusses an attempt made by us to illustrate the industrial energy scene in Karnataka andreveals the possibilities of energy conservation. Analysis of the energy consumption data of Karnatakaand India shows that the per capita consumption of energy is low (compared with 56 countries in theworld), while for the industrial sector, energy per state domestic product (SOP comparable to GDP) isat least 10-20 times higher than that of industria Iised countries. This implies inefficiency in energyutilisation.
Detailed investigation of the industrial sector through analysis of the Specific Energy Consumption(SEC)-industry wise and yearly for a seven-year period-reveals that about 27.72% of energy could besaved in the industrial sector. This, when quantified, accounts for savings of 1541 million kWh per yearin Karnataka, which is equivalent to the power output of 300 MW (Mega Watts) electric power generatingstation (hydro/thermal). ({) 1997 Elsevier Science Ltd. All rights reserved
Per capita energyconsumption(PCCE) Grossdomesticproduct (GDP)capita GDP Energy elasticity Specific energy consumption (SEC)planning
Energy intensity PerSEC ratios Energy
tTo whom all correspondence should be addressed.
ECM 38/6~C 563
564 RAMACHANDRA and SUBRAMANIAN: INDUSTRIAL ENERGY UTILISATION IN KARNATAKA
INTRODUCTION
Energy utilisation in India and in Karnataka State differs radically from that of other,industrialised countries. Non-commercial sources of energy. such as firewood and agriculturalresidues, constitute the main source of energy in rural areas. There are enormous variations in theamount of energy used within India in different states and regions. There exists regional disparitiesboth in terms of energy supply and demand. Linkages between various energy sub-sectors, suchas coal, oil, electricity and non-commercial energy sources, are non-existent. Energy planning inour country is not an integrated activity. The plans for electricity, oil, coal and firewood areseparate exercises. Secondly, the planning activity considers only the demand and projects thedemand over a period of years. Efficiency in utilisation has not been investigated. The primary goalof planners is supply expansions based on the assumption of linkage between energy consumptionand the economic growth of a region. With this approach, energy becomes an end in itself, andthe focus shifts on meeting increased energy consumption through energy supply expansion alone:This supply and demand based planning for each individual energy form has resulted in problemslike inefficiency,losses, more conversions and other environmental problems. This conflict betweenenergy demand and environmental quality goals can be solved by an integrated approach to theproblem of energy planning with emphasis to minimise the consumption of non-renewable sourcesof energy, such as coal, oil, etc. to maximise the efficiency of end use devices in all sectors andto organise an approach towards optimal use of renewable sources. This path would certainly helpin boosting economic growth of a region, and equally important, it promotes structural changeswhich are conductive to overall development. In order to get an idea of Karnataka and India'slevel of energy consumption with other countries, we have carried out energy analyses andcompared with energy consumption data from 56 countries.
The energy use per capita and GDP per capita data of 56 countries reveals that Karnataka Stateand India have very low per capita energy consumption. There are only small differences in percapita energy consumption between the developing countries. For high income countries, thedifference is much larger. That is, energy use per capita increases with higher income, but crosscountry comparisons can be misleading and inappropriate due to large variations among countriesin terms of economic structure, climate, geographic location, etc. Energy intensity (energyconsumption per GDP) and GDP per capita data reveal that India and Karnataka State have highenergy intensities compared to other developed industrialised countries, which clearly shows thatKarnataka State and India have good potential in energy conservation.
A comparative study of energy use, mainly electrical, in industries in Karnataka and in thoseof some other industrialised countries reveals that Karnataka consumes 6.13 times the energyconsumed in Switzerland, 5.28 times the energy consumed in Japan, 3.35 times the energy consumedin the U.K. and 1.98 times the energy consumed in the U.S.A. for the same GDP (Gross DomesticProduct). Sectoral energy values also have been calculated.
A sectoral analysis of electricity users in Karnataka shows that the growth of connected loadis mainly in two categories-AEH (All Electric Homes) and Small Scale (LT) Industries. Thegrowth rate is 19.46% for the former and 27.33% for the latter. The growth increases in the pastfour years are 67.4% and 55%, respectively. If we look at the annual increases in the number ofinstallations, again the LT industrial sector has a very high rate of 38.66% followed by AEH witha rate of 19.15%. More than 50% of our industries are clustered in and around Bangalore. Barringa few exceptions, there is only limited industrial activity in other parts of Karnataka. Energyconsumption patterns show that Bangalore uses 26.67% of HT energy. A few industries like IndianAluminum at Be\gaum, VISL at Bhadravathi, etc. show higher energy consumption values for somedivisions. Belgaum consumes 21.6% of total HT energy in the State. Sector wise commercial energyconsumption data shows that the industrial sector, with 51.4% of total consumption, constitutesthe major energy consumer in Karnataka. Hence, we have taken the industrial sector for furtherstudy.
Linkages between energy sources and the impacts of substitution of energy from one source bythat from another can be understood only if there is an integrated picture of energy use. Since thistype of information was not available, the energy analysis was confined to utilisation of energyfrom only one source, namely electricity. A survey was, therefore, conducted covering many
RAMACHANDRA and SUBRAMANIAN: INDUSTRIAL ENERGY UTILISATION IN KARNATAKA 565
industries in Karnataka. A questionnaire was prepared and sent to more than 250 industries.Replies received from about 60 industries were analysed for their energy consumptions for theperiod 1980-85. Recently, another round of surveys was carried out by sending questionnaires to510 industries, and 78 replies were received pertaining to the data for the years 1990-91 and1991-92. It was found that, in many industrial sectors, energy consumption/rupee of productionwas higher than the Indian norm. Further, energy consumption varied considerably within a groupor sector, indicating a distinct possibility for a substantial reduction in energy use by manyindustries for the same level of production.
Similarly, a look at the specific energy consumption by an industry over a five year period showsan increase in some industries and, fortunately, a reduction in some others. The greatest possibilitiesfor more efficient use of energy in industry lie in careful management of process heat, electricity,energy intensive materials and direct fuel consumption. Processes involving energy intensiveoperations or materials are to be reviewed to determine if new technology, recycling or substitution,or alternative forms of material or energy could be employed to increase efficiency.
This paper is organised as follows: Section I discusses energy utilisation patterns and energyintensity trends among 56 countries. In Sections 2 and 3, we discuss the energy scenarios of Indiaand Karnataka. Section 4 discusses the primary survey carried out by us for compiling data, whileSections 5-9 deal with analyses, discussion and results of the energy analyses.
1. PATTERNS OF ENERGY CONSUMPTION AND ENERGY INTENSITY TRENDSAMONG COUNTRIES
The role of energy utilisation in economic growth has received much attention in the last twodecades. Schurr and Eliasberg [I] investigated the long term relationship between energyconsumption and real GNP. They conclude that, from 50 years time series data, there was a steadyrise in energy requirement per unit of GNP initially. However, the use of energy per unit of GNPdeclined steadily in the next phase. Increased industrialisation initially might have resulted in therelative rise, while decline, according to Schurr and Eliasberg, is due to:
(I) increased efficiencyof energy production, resulting in dramatic increases in the useful energyoutput obtained from raw energy input;
(2) significant technological improvements, resulting in greater efficiency; and(3) changes in structural composition of GNP partially explain the decline in relative energy
output.
1.1. Data
The basic gross domesticproduct and energy data used in this researchare from the 1991UNEnergy Statistics' Yearbook [2] and from the report "Current Energy Scene in India, 1993"published by the Centre for Monitoring Indian Economy Pvt. Ltd., Bombay [3]. The energy dataare measured in tons of oil equivalent (toe), the GDP data are measured in local currencies buthave been adjusted for price changes. The population of various countries is from the WorldPopulation Data Sheet 1994[4].
1.2. Comparisons of energy use
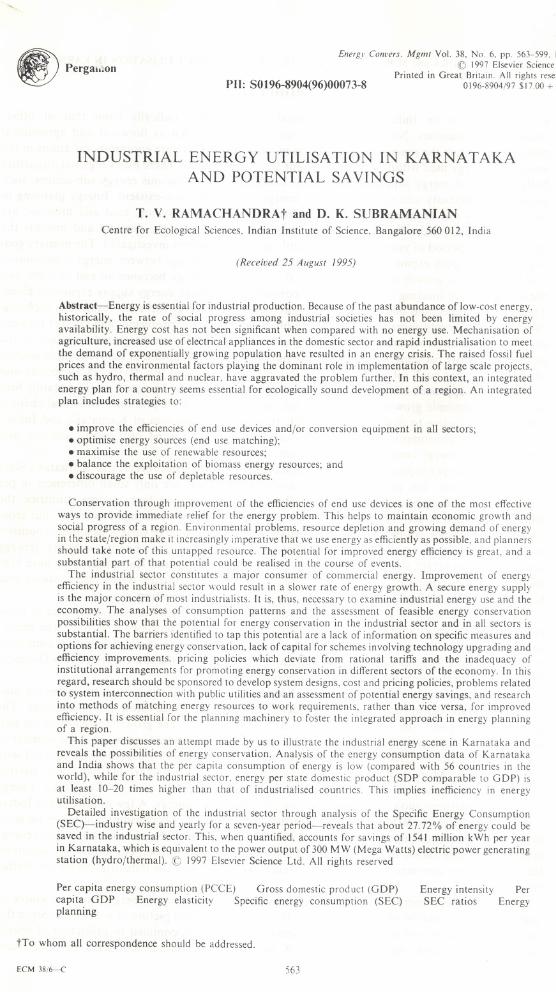
Since energy consumption plays an important role in indicating the life style or quality, thereare many indicators to compare life styles in various countries. Initially, energy consumption wascompared with a country's gross domestic product (GDP). Later on, energy consumptionsper capita for many countries were plotted against GDP/capita (Fig. la). It was found from56 countries data that there is a strong correlation existing between national output per capita andenergy per capita. Table I gives the energy-output relationships for the 56 countries and KarnatakaState.
In order to make a quantitative estimate of the response of energy consumption per capita toGDP per capita, a regression analysis is carried out for a set of data pertaining to the 56 countries.Both linearand nonlinearregressionanalyses werecarried out (about 25 types of equations were
566 RAMACHANDRA and SUBRAMANIAN: INDUSTRIAL ENERGY UTILISATION IN KARNATAKA
c 120Q.E 10::JIIIC0
0 8>-m...Q)
c 6
~ CZECHOSLOVAKIA- I xQ.<3 4
UAEx
CANADAx
NORWAYx
USAx
KUWAITx
SWEDENx
...Q)D.
AUSTRALIAx x
2KOREAXX
SPAINx
UXK Ft&A:CEBELGIUM
z
JAPANx
5 10 15 20
Gross Domestic Procluct/Capha ('000 $ )
25 30
[ - y = 0.918(x) " 0.8938
(b) 1.2
IRANx
MALAYSIA
~RAZILx
1.08G)0
::::. 0.96>-mG; 0.84cW
COLOMBIAx
TURKEYx
0 0.72c.2Q. 0.6E::J~ 0.4800.! 0.36Q.!G0 0.24
CHINAx
PERUx
THAILANDx
xx
x
x
0.8 1.6 2.4Gross Domestic Procluct/Capha ('000 $)
3.2
[ - y = 0.918(x) " 0.8938
Fig. I. (a) Per capita energy (toe) and GOP per capita ('000$); (b) for < 3200.
(a)16
G)14
g
RAMACHANDRA and SUBRAMANIAN: INDUSTRIAL ENERGY UTILISATION IN KARNATAKA 567
(c)- 1000
-SOUTH AFRICA
EGYPT-VENEZUELA
...................................................
Q.QCI*c~E-.!!0(J:0-j?!w
-SAUDI ARABIA
600-J~.~~.~1_~ .....................................................................-USSR
-PtRU -UAE
-CANADA
400 ;""""""'.'..~CO'."'...'.'."......
-BRAZIL -AUSTRALIA--KOREA -
-..,.~:~~~g UK".;iifti............200-6IGANDA"""""'. -SPAIN 8BELGIUMEPAL
-BURMA
.."""""".""".""'."."""""..."."."'.." .............................
-USA -NORWAY
-SWEDEN..............................................
-JAPAN -SWISS
00 5 10 15 20 25 30
GDP per capita ('000 dollars)
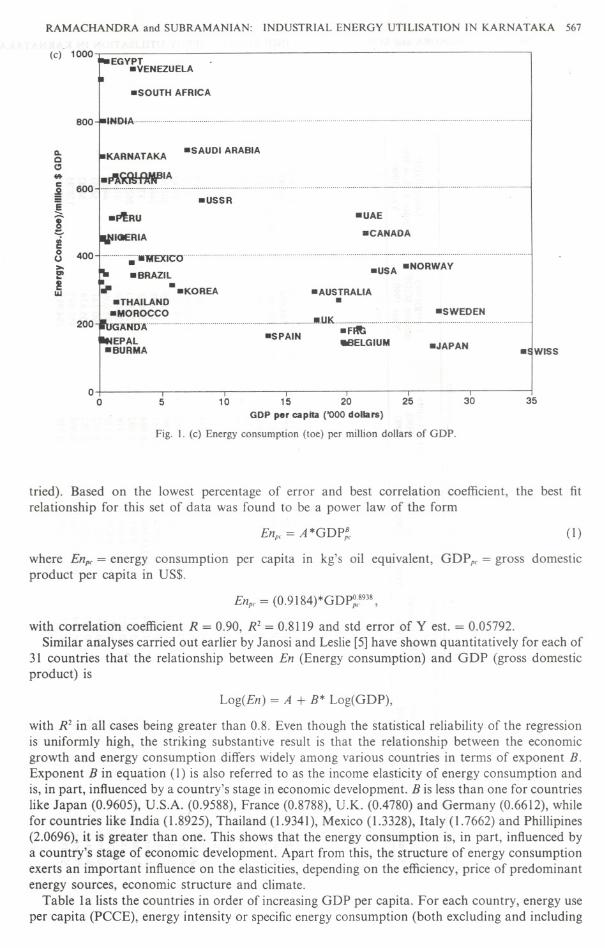
Fig. I. (c) Energy consumption (toe) per million dollars of GDP.
35
tried). Based on the lowest percentage of error and best correlation coefficient, the best fitrelationship for this set of data was found to be a power law of the form
Enpc = A *GDP~ (1)
where Enpc= energy consumption per capita in kg's oil equivalent, GDP pc= gross domesticproduct per capita in US$.
Enpc = (0.9184)*GDpi},;8938 ,
with correlation coefficient R = 0.90, R2 = 0.8119 and std error of Y est. = 0.05792.Similar analyses carried out earlier by Janosi and Leslie [5]have shown quantitatively for each of
31 countries that' the relationship between En (Energy consumption) and GDP (gross domesticproduct) is
Log(En) = A + B* Log(GDP),
with R2 in all cases being greater than 0.8. Even though the statistical reliability of the regressionis uniformly high, the striking substantive result is that the relationship between the economicgrowth and energy consumption differs widely among various countries in terms of exponent B.Exponent B in equation (1) is also referred to as the income elasticity of energy consumption andis, in part, influenced by a country's stage in economic development. B is less than one for countrieslike Japan (0.9605), U.S.A. (0.9588), France (0.8788), U.K. (0.4780) and Germany (0.6612), whilefor countries like India (1.8925), Thailand (1.9341), Mexico (1.3328), Italy (1.7662) and Phillipines(2.0696), it is greater than one. This shows that the energy consumption is, in part, influenced bya country's stage of economic development. Apart from this, the structure of energy consumptionexerts an important influence on the elasticities, depending on the efficiency, price of predominantenergy sources, economic structure and climate.
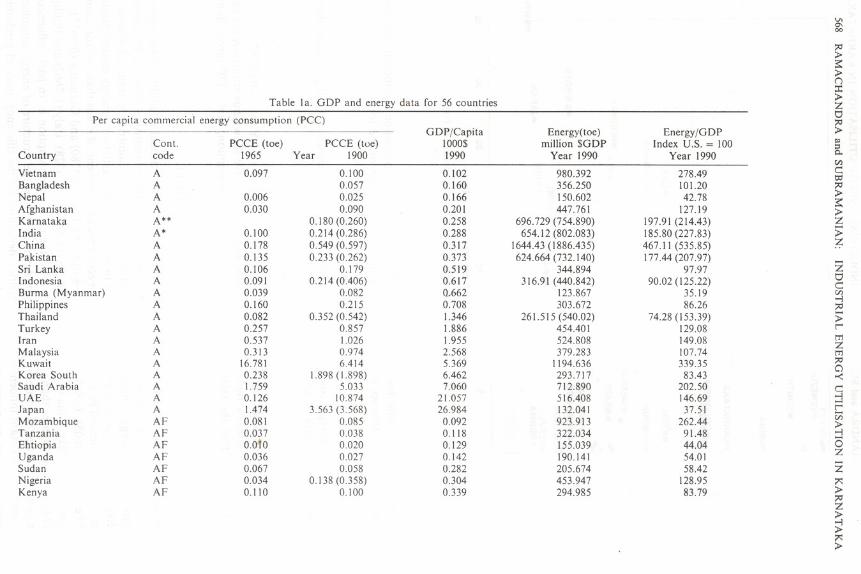
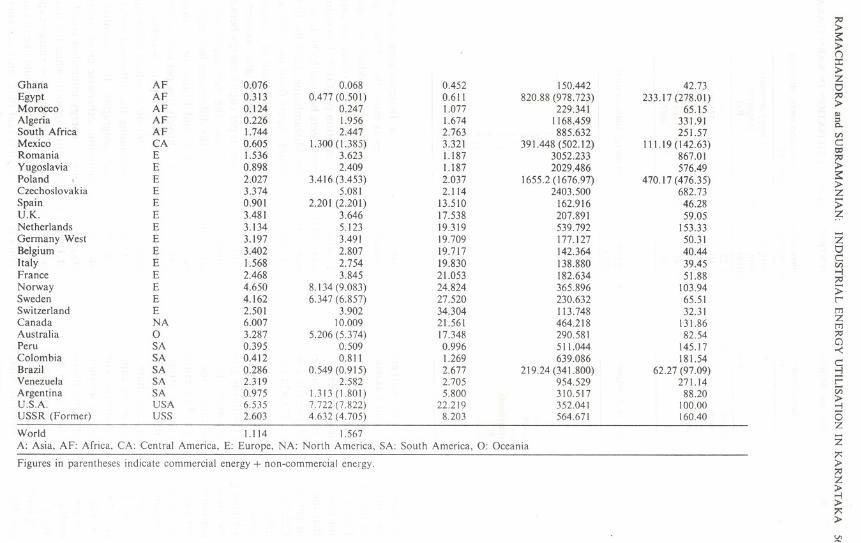
Table 1a lists the countries in order of increasing GDP per capita. For each country, energy useper capita (PCCE), energy intensity or specific energy consumption (both excluding and including
VI0\00
;:Q;I>-
:!::;l>-n:t;I>-Z(:);:Q;l>-I»::3Q.CI:>c:t:I:I;:Q;I>-:!::;I>-zS;~
52(:)c:CI:>...,;:Q
S;l'tTJZtTJ;:Qa-<c::jl'en;I>-...,(3z52~;I>-;:QZ;I>-...,;I>-~;I>-
Table la. GDP and energy data for 56 countries
Per capIta commercia'i energy consumption (PCe)GDP/Capita Energy(toe) Energy/GDP
Cont. PCCE (toe) PCCE (toe) 1000$ million $GDP Index U.S. = 100Country code 1965 Year 1900 1990 Year 1990 Year 1990
Vietnam A 0.097 0.100 0.102 980.392 278.49Bangladesh A 0.057 0.160 356.250 101.20Nepal A 0.006 0.025 0.166 150.602 42.78Afghanistan A 0.030 0.090 0.201 447.761 127.19Karnataka A** 0.180(0.260) 0.258 696.729 (754.890) 197.91 (214.43)India A* 0.100 0.214 (0.286) 0.288 654.12 (802.083) 185.80 (227.83)China A 0.178 0.549 (0.597) 0.317 1644.43 (1886.435) 467.11 (535.85)Pakistan A 0.135 0.233 (0.262) 0.373 624.664 (732.140) 177.44 (207.97)Sri Lanka A 0.106 0.179 0.519 344.894 97.97Indonesia A 0.091 0.214 (0.406) 0.617 316.91 (440.842) 90.02 (125.22)Burma (Myanmar) A 0.039 0.082 0--662 123.867 35.19Philippines A 0.160 0.215 0.708 303.672 86.26Thailand A 0.082 0.352 (0.542) 1.346 261.515 (540.02) 74.28 (153.39)Turkey A 0.257 0.857 1.886 454.401 129.08Iran A 0.537 1.026 1.955 524.808 149.08Malaysia A 0.313 0.974 2.568 379.283 107.74Kuwait A 16.781 6.414 5.369 1194.636 339.35Korea South A 0.238 1.898 (1.898) 6.462 293.717 83.43Saudi Arabia A 1.759 5.033 7.060 712.890 202.50UAE A 0.126 10.874 21.057 516.408 146.69Japan A 1.474 3.563 (3.568) 26.984 132.D41 37.51Mozambique AF 0.081 0.085 0.092 923.913 262.44Tanzania AF 0.037 0.038 0.118 322.034 91.48Ehtiopia AF O.oto 0.020 0.129 155.039 44.04Uganda AF 0.036 0.027 0.142 190.141 54.01Sudan AF 0.067 0.058 0.282 205.674 58.42Nigeria AF 0.034 0.138 (0.358) 0.304 453.947 128.95Kenya AF 0.110 0.100 0.339 294.985 83.79
;:0>s:>(j:I:>ZGhana AF 0.076 0.068 0.452 150.442 42.73 \:)
Egypt AF 0.313 0.477 (0.501) 0.611 820.88 (978.723) 233.17 (278.01) ;:0>Morocco AF 0.124 0.247 1.077 229.341 65.15
Algeria AF 0.226 1.956 1.674 1168.459 331.91 ::>Q..South Africa AF 1.744 2.447 2.763 885.632 251.57 enMexico CA 0.605 1.300 (1.385) 3.321 391.448 (502.12) 111.19 (142.63) c:
IX'Romania E 1.536 3.623 1.187 3052.233 867.01 ;:0Yugoslavia E 0.898 2.409 1.187 2029.486 576.49 >s:Poland . E 2.027 3.416 (3.453) 2.037 1655.2 (1676.97) 470.17 (476.35) >Czechoslovakia E 3.374 5.081 2.114 2403.500 682.73 ZSpain E 0.901 2.201 (2.201) 13.510 162.916 46.28 ;;U.K. E 3.481 3.646 17.538 207.891 59.05 ZNetherlands E 3.134 5.123 19.319 539.792 153.33Germany West E 3.197 3.491 19.709 177.127 50.31 ZBelgium E 3.402 2.807 19.717 142.364 40.44 \:)
c:Italy E 1.568 2.754 19.830 138.880 39.45 enFrance E 2.468 3.845 21.053 182.634 51.88 >-i
;:0Norway E 4.650 8.134(9.083) 24.824 365.896 103.94 ;;Sweden E 4.162 6.347 (6.857) 27.520 230.632 65.51 r-Switzerland E 2.501 3.902 34.304 113.748 32.31 tT1Canada NA 6.007 10.009 21.561 464.218 131.86 Z
tT1Australia 0 3.287 5.206 (5.374) 17.348 290.581 82.54 ;:0
aPeru SA 0.395 0.509 0.996 511.044 145.17 -<Colombia SA 0.412 0.811 1.269 639.086 181.54 c:Brazil SA 0.286 0.549 (0.915) 2.677 219.24 (341.800) 62.27 (97.09) ::JVenezuela SA 2.319 2.582 2.705 954.529 271.14 r-Argentina SA 0.975 1.313 (1.801) 5.800 310.517 88.20 r;;
>U.S.A. USA 6.535 7.722 (7.822) 22.219 352.041 100.00 >-iUSSR (Former) USS 2.603 4.632 (4.705) 8.203 564.671 160.40 <5
ZWorld I.] 14 1.567A: Asia, AF: Africa, CA: Central America, E: Europe, NA: North America, SA: South America, 0: Oceania
Zr:
Figures in parentheses indicate commercial energy + non-commercial energy. >;:0Z>>-i>r:>
;!>
570 RAMACHANDRA and SUBRAMANIAN: INDUSTRIAL ENERGY UTILISATION IN KARNATAKA
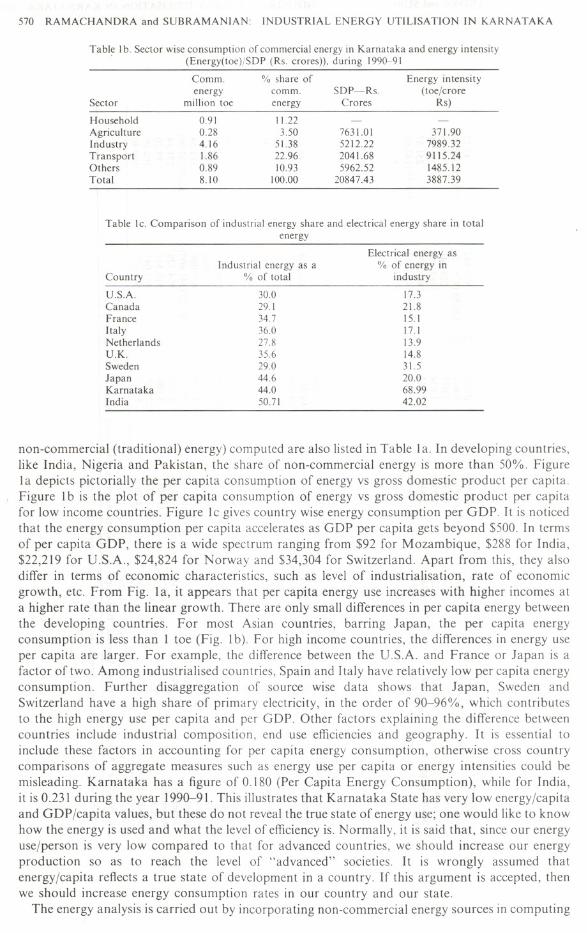
Table 1b. Sector wise consumption of commercial energy in Karnataka and energy intensity(Energy(toe)jSDP (Rs. crores)), during 1990-91
Table Ic. Comparison of industrial energy share and electrical energy share in totalenergy
30.029134.736.027.835.629.044.644.050.71
Electrical energy as% of energy in
industry
17.321.815.117.113.914.831.520.068.9942.02
Country
U.S.A.CanadaFranceItalyNetherlandsU.K.SwedenJapanKarnatakaIndia
Industrial energy as a% of total
non-commercial (traditional) energy) computed are also listed in Table la. In developing countries,like India, Nigeria and Pakistan, the share of non-commercial energy is more than 50%. Figurela depicts pictorially the per capita consumption of energy vs gross domestic product per capita.
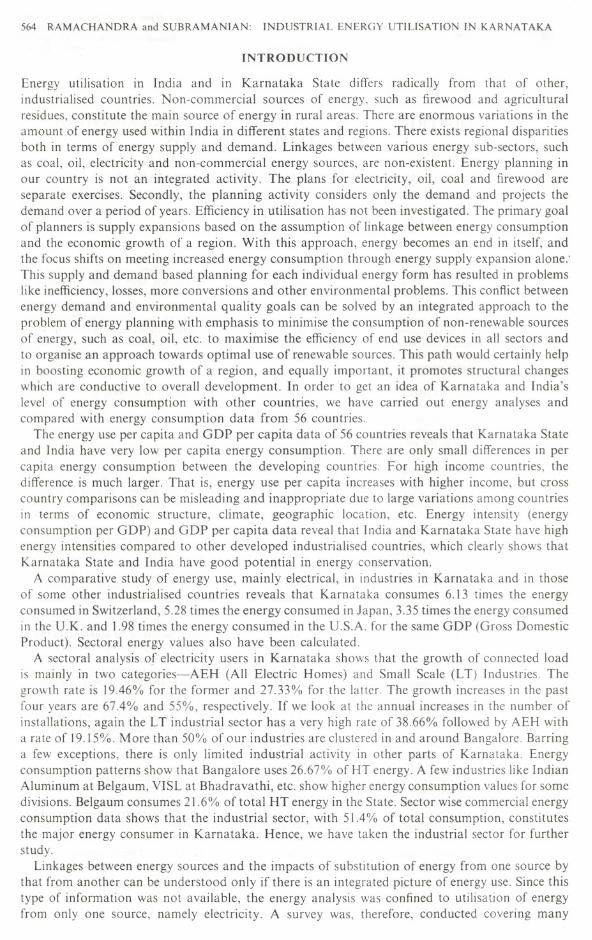
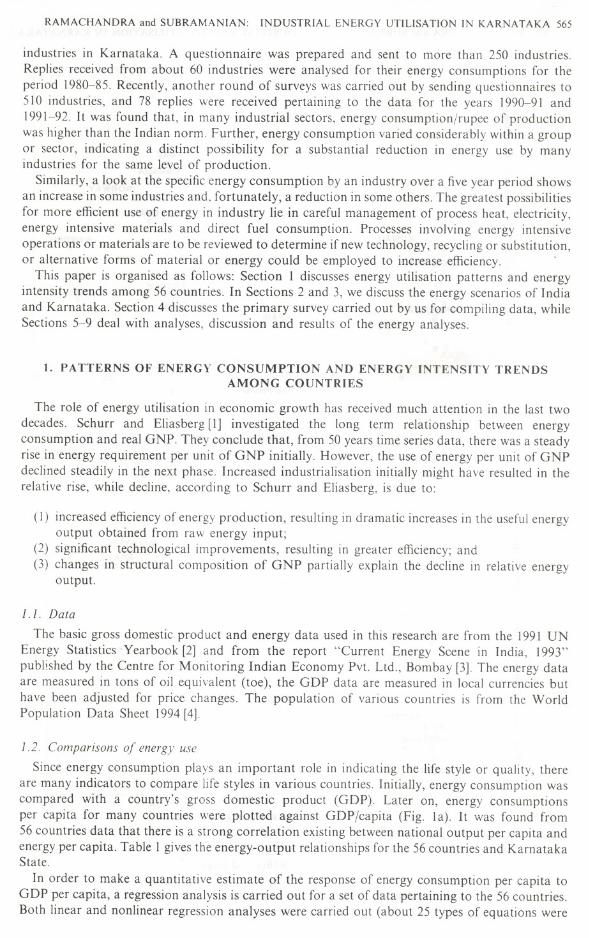
, Figure Ib is the plot of per capita consumption of energy vs gross domestic product per capitafor low income countries. Figure Ic gives country wise energy consumption per GDP. It is noticedthat the energy consumption per capita accelerates as GDP per capita gets beyond $500. In termsof per capita GDP, there is a wide spectrum ranging from $92 for Mozambique, $288 for India,$22,219 for U.S.A., $24,824 for Norway and $34,304 for Switzerland. Apart from this, they alsodiffer in terms of economic characteristics, such as level of industrialisation, rate of economicgrowth, etc. From Fig. la, it appears that per capita energy use increases with higher incomes ata higher rate than the linear growth. There are only small differences in per capita energy betweenthe developing countries. For most Asian countries, barring Japan, the per capita energyconsumption is less than 1 toe (Fig. Ib). For high income countries, the differences in energy useper capita are larger. For example, the difference between the U.S.A. and France or Japan is afactor of two. Among industrialised countries, Spain and Italy have relatively low per capita energyconsumption. Further disaggregation of source wise data shows that Japan, Sweden andSwitzerland have a high share of primary electricity, in the order of 90-96%, which contributesto the high energy use per capita and per GDP. Other factors explaining the difference betweencountries include industrial composition, end use efficiencies and geography. It is essential toinclude these factors in accounting for per capita energy consumption, otherwise cross countrycomparisons of aggregate measures such as energy use per capita or energy intensities could bemisleading. Karnataka has a figure of 0.180 (Per Capita Energy Consumption), while for India,it is 0.231 during the year 1990-91. This illustrates that Karnataka State has very low energy/capitaand GDP/capita values, but these do not reveal the true state of energy use; one would like to knowhow the energy is used and what the level of efficiency is. Normally, it is said that, since our energyuse/person is very low compared to that for advanced countries, we should increase our energyproduction so as to reach the level of "advanced" societies. It is wrongly assumed thatenergy/capita reflects a true state of development in a country. If this argument is accepted, thenwe should increase energy consumption rates in our country and our state.
The energy analysis is carried out by incorporating non-commercial energy sources in computing
Comm. % share of Energy intensityenergy comm. SDPRs. (toefcrore
Sector million toe energy Crores Rs)
Household 0.91 1122Agriculture 0.28 3.50 7631.0I 371.90Industry 4.16 51.38 5212.22 7989.32Transport 1.86 22.96 2041.68 9115.24Others 0.89 10.93 5962.52 1485.12Total 8.10 100.00 20847.43 3887.39
RAMACHANDRA and SUBRAMANIAN: INDUSTRIAL ENERGY UTILISATION IN KARNATAKA 571
Per Capita Energy Consumption, which constitutes the significant portion in total energyconsumption in countries like India, Nigeria, etc. By incorporating non-commercial sources ofenergy in the total energy, the per capita energy consumption for Karnataka becomes 0.260, whilefor India it is 0.266. The Per Capita Energy Consumption computed by including non-commercialenergy sources is given in parentheses in Table la.
Recently, there has been a shift in the thinking, even in the industrial nations. The index to beused is not energy/person, but energy/GOP, i.e. the amount of energy consumed for producing Iunit of GOP. This index is given in column 7 of Table I. This index also reflects the efficiency ofenergy use at a macro level. Column 6 gives the absolute values of energy/GOP in tons oilequivalent per million dollars. The values for Canada, 464.218, Norway, 365.896 and, the U.S.A.,352.041, are on the high side. Japan, France and Italy with values of 132.041, 182.634and 138.880,respectively, are on the low side. Although per capita energy use increases with higher GOP, Fig. Icdoes not suggest or reflect that the energy intensity (energy consumption/GOP) of low incomecountries needs to be increased much with economic growth and development. Energy intensityis listed in column 6 of Table I, while column 7 presents a relative figure wherein energy/GOP iscomputed with the U.S.A. value equal to 100. India has an energy intensity value of 654.12toe/million dollars and Karnataka State has a value of 696.729 toe/million dollars. With inclusionof the non-commercial energy share, India's energy intensity increases to 802.083, while forKarnataka, it is 754.89. Compared to the U.S.A., India consumes 2.25 times, compared to France,4 times and Japan 6 times more energy for the same output. However, these calculations do notinclude animate energy share, such as human and animal energy. If these are quantified andincluded, then the energy/GOP for India would shoot up further.
During 1991, India's energy intensity was 838 toe/m$ compared to U.S.A.'s 344, Japan's 133and Sweden's 172. This shows the increase in energy intensity for India while a decline for Japan,U.S.A. and Sweden. An explanation for the differences in energy intensities between these countriescannot be done based on this aggregate analysis. That would require each region/country's sectoralenergy use, industrial composition, etc. This necessitates a detailed look at the energy scenario andenergy auditing in energy intensive sectors to improve the efficiency of energy usage in order tobring down the energy intensity. Hence, the industry sector in Karnataka has been chosen fordetailed analyses.
Karnataka is on the very low side as far as energy/capita is concerned. Let us look at the picturefor energy/SOP (State Domestic Product). Karnataka State has an energy consumption/SOP valueof 694.729toe/million dollars for the year 1990-91. This means that we are consuming more energyfor less output. For a relative picture, column 7 of Table I is computed. Here, the energy/GOPis calculated with the U.S. value equal to 100. Coupled with column 7, we see that Karnataka hasan index of 197.91 for the year 1990-91. This means that we are consuming 1.98 times the energyconsumed by the U.S. for the same output. When compared with Switzerland, Japan and Italy,we consume 6.13, 5.28 and 5.02, respectively, times the energy consumed by them for the sameoutput. This energy consumption does not include human/animal energy. If these are also included,then the energy/SOP value will be higher (ours is more of an employment oriented society still).
The second factor seen is that the energy/SOP is increasing for Karnataka. One possibleconclusion is that the energy efficiency (of use) is decreasing and not increasing. Post oil crisissituations saw considerable reductions in energy/GOP. For instance, West Germany showed adecrease from 1,080 to 1,010; similar decreases were evident for the U.K. and the Netherlands. TheUnited States has shown a steady value for a period of nearly 20 years (1961-74), varying from1,400to 1,480 (a max. of 5% difference), whereas Karnataka has shown an increase of about 10%in 5 years. Hence, it is desirable to actively pursue the introduction of energy efficient methods.The reasons why the U.S. has a flat curve for the 15 years period may be: frequent updating oftechnology; efficient methods due to competition; stability in the system due to many years ofenergy use; and saturation (?).
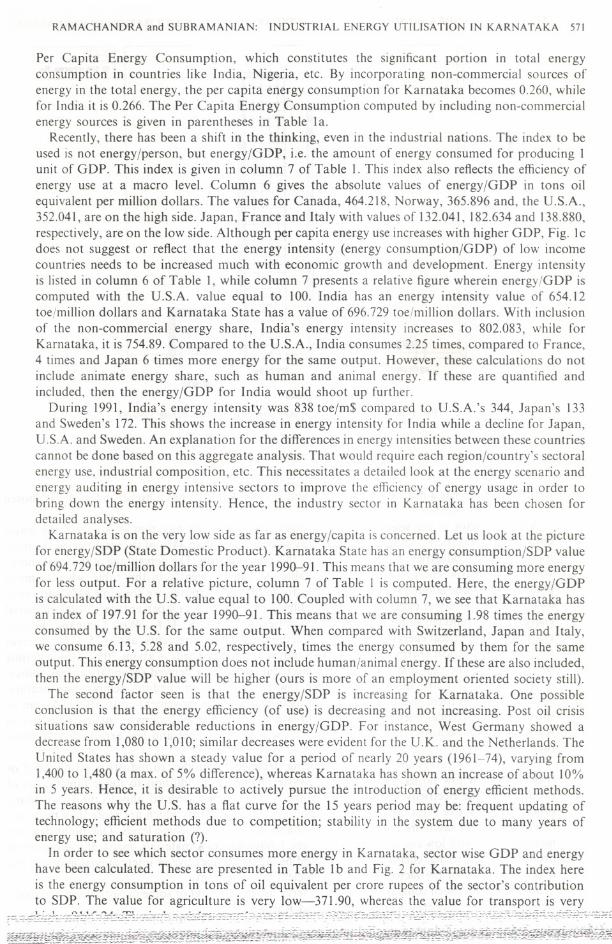
In order to see which sector consumes more energy in Karnataka, sector wise GOP and energyhave been calculated. These are presented in Table Ib and Fig. 2 for Karnataka. The index hereis the energy consumption in tons of oil equivalent per crore rupees of the sector's contributionto SOP. The value for agriculture is very low-371.90, whereas the value for transport is very
c~~:::~~.~;,:h;:::=~h'£ "~~.j:0-~'- :;::;:::=:':0 :=C-;:""'::::'0""'oo.,.:~. :-"""2~:o,,-::"?:.';:;'~?~":.:.,,;,.£'~3"o:=~ ~'-"~C:.:,~::.~,,;~ ~~'~~:,~=';:~""~;:'~,,,.,;"":'cc:'~-:;:,;o;:=;
~ ~~~fic i~~~~~~ ~~z..~J;-~~~--o~¥~ ~~~~~~~~ ~~" ?~;f~~~ ~~§~
572 RAMACHANDRA and SUBRAMANIAN: INDUSTRIAL ENERGY UTILISATION IN KARNATAKA
agriculture transportothersIndustry
sectors
Fig. 2. Sector wise energy per state domestic product during 1990-9 I.
tEEIn loe/crores.Rs
industrial sector has a mix of many sources and devices, and also has a higher index, it was chosenfor further comparison.
Another factor in the selection of the industrial sector is the fact that it is one of the majorconsumers of electricity-a high quality energy source. More than 44% of the total electrical energyis consumed by industries. Table lc illustrates this phenomenon. The percentage of the total energywhich is industrial energy is given in this table. As can be seen from this table, whereas manycountries consume about 30% of their energy for industrial purposes, we consume 44% and Japan44.6%. The quantity of electrical energy consumed by industries as a percentage of total industrialenergy is also reflected in the table. Even countries like the U.S., U.K., West Germany, France,etc. resort to electrical energy for a smaller fraction of their requirements, about 15-17%, whereasthe share of electrical energy in Karnataka's industrial energy needs is about 70%. This is despitepower cuts for the past many years. Since electrical energy is a derived secondary energy source,it is inefficient for low quality work-like low temperature or medium temperature heating-applications. Electrical energy is efficient for lighting and static movement applications. As can beshown later, electrical energy finds a lot of use in heating applications in many industries inKarnataka, not because it is efficient, but because it is convenient and less expensive than otherfuels.
Efficient use of energy implies proper pricing strategies. Subsidies to industries on the tariff orfuel charges or low tariffs result in larger waste of energy in addition to lower direct costs ofproduction. The electricity tariff for Karnataka is the cheapest (second only to the U.S.). Manyother countries, like West Germany, U.K. and France have tariffs which are more than twice ourrate. One cannot say more on this, because it also depends on income levels. One point deservesmention here, with low costs of energy charges, labour and raw materials, many of our industrialproducts--engineering, chemical, etc.=--should be highly competitive in international markets, butit is not so, one of the factors may be inefficient use of energy.
So far, we have seen comparisons of our energy usage with that of some industrialised countries.Let us look at the energy scene in India and Karnataka.
10000
9000
8000
CD 7000..
:s
I:i6000
,j,
! 5000
Q.C
4000>-0)..! 3000w
2000
1000
0
"
11
t
I
"
I
I
RAMACHANDRA and SUBRAMANIAN: INDUSTRIAL ENERGY UTILISATION IN KARNATAKA 573
2. ENERGY SOURCES AND BALANCES
Various energy resources, considered in this paper, are generally classified into three broadcategories as:
1. Commercial fuels: coal, oil, gas and electricity (including that generated in large scalehydro-electric schemes). These fuels have commercial value.
2. Non-commercial, traditional or biomass fuels: wood, charcoal and crop and animal residues.These fuels are non-commodified, may be gathered freely from the local environment, havebeen used extensively for many thousands of years and are the fuels closely associated withthe crisis of energy for survival.
3. New and renewable sources of energy: wind, wave, solar, mini-hydro, ethanol, biogas, tidaland so on.
Conservation in one sense, could also be considered an energy 'resource' because using enefgymore efficiently produces the same work with less fuel.
2.1. India's energy scene
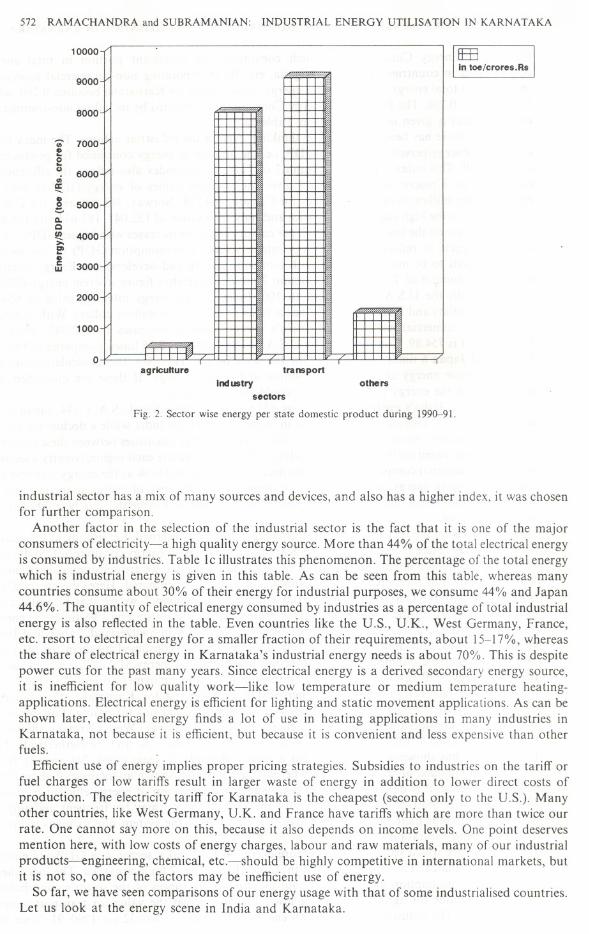
The supply of primary sources of commercial energy in the last two decades is tabulated inTable 2. As seen in Table 2, coal is the predominant energy source (58.39%), followed by oil(27.18%), natural gas (7.61%), lignite (3.71%), hydro power (2.84%) and nuclear power (0.27%).The growth in commercial energy consumption for the period 1980-81-1989-90 is shown inFig. 3. Non-commercial sources, such as fuelwood, agricultural residues and animal wastes,account for more than 50% in the total energy consumption. Non-commercial energy consumptionis estimated to be 143 million toe (69.55% in total energy scene) for 1972-73 and 161 million toe(59.47%) for 1982-83. A major portion of these non-commercial energy sources is used in ruralareas for activities such as cooking, water heating and in industries.
Coal is a major commercial fuel source, constituting 58.39% of total consumption, of which56.96% is available in the country and the balance of 1.43% is imported. Coal, historically, wasavailable in all industrialised countries and probably used inefficiently. Thus, the greater the shareof coal in total energy consumption, the less energy consumption is added per unit of increasedGDP, as there is room for increased efficiency of energy utilisation. It is inversely related to theelasticities. Hydro-electricity, on the other hand, is usually inexpensive wherever it is available, andtherefore the greater the share in energy consumption, the greater would be the income elasticity.
Table 2. Supply of primary sources of commercial energy (in million tonnes of oil equivalent-mtoe)
HydroYear Lignite Coal Oil N gas power Nuclear Total
70-71 1.66 35.75 18.51 1.24 2.10 0.20 59.4671-72 1.81 35.49 20.25 132 2.34 0.10 61.3072-73 1.52 37.84 19.41 134 2.27 0.09 62.46873-74 1.62 38.31 21.04 1.47 2.41 0.20 65.0574-75 1.47 43.36 21.70 1.75 2.32 0.18 70.7975-76 1.48 48.84 22.07 203 2.78 0.22 77.4276-77 1.97 49.51 22.95 2.08 2.90 0.27 79.6877-78 1.75 49.43 25.27 2.43 3.17 0.19 82.2478-79 1.62 49.96 26.29 2.41 3.93 0.23 84.4479-80 1.42 50.94 27.89 2.37 3.79 0.24 86.6480-81 2.50 55.97 26.76 202 3.88 0.25 91.3881-82 3.09 61.06 30.65 3.30 4.13 0.25 102.4882-83 3.40 64.44 33.46 4.23 4.03 0.17 109.7283-84 3.58 67.90 36.47 5.11 4.16 0.30 117.5184-85 3.82 72.55 36.15 6.20 4.48 0.34 123.5685-86 3.94 76.76 44.78 6.97 4.24 0.42 137.1286-87 4.62 82.42 45.95 8.44 4.48 0.42 146.3387-88 5.47 89.63 48.09 9.82 3.95 0.42 157.3888-89 6.16 97.73 49.85 11.32 4.82 0.49 170.3789-90 6.19 100.73 53.58 14.55 5.17 0.39 180.6190-91 6.91 106.63 53.72 15.42 ....5:%. u.:>.A.,dj26. 189.1691-92 7.80 115.29 54.33 15.98 6.05 0.46 199.9192-93 7.60 119.66 55.70 15.59 5.81 0.56 204.92% share 3.71 58.39 27.18 7.61 2.84 0.27 100.00
574 RAMACHANDRA and SUBRAMANIAN INDUSTRIAL ENERGY UTILISATION IN KARNATAKA
IndustryTransport
Residential
other Energy Uses
Non Energy Uses
Agriculture3 4 5 6 7 8 9 10Year (from 1980-81 to 1989-90)
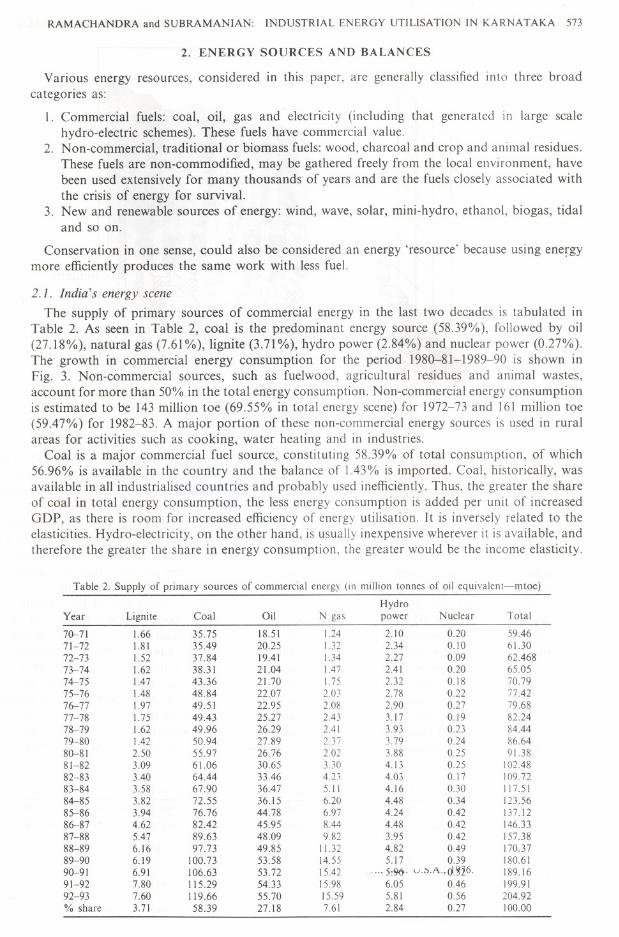
Fig. 3. Sectorial energy consumption (commercial) in India.
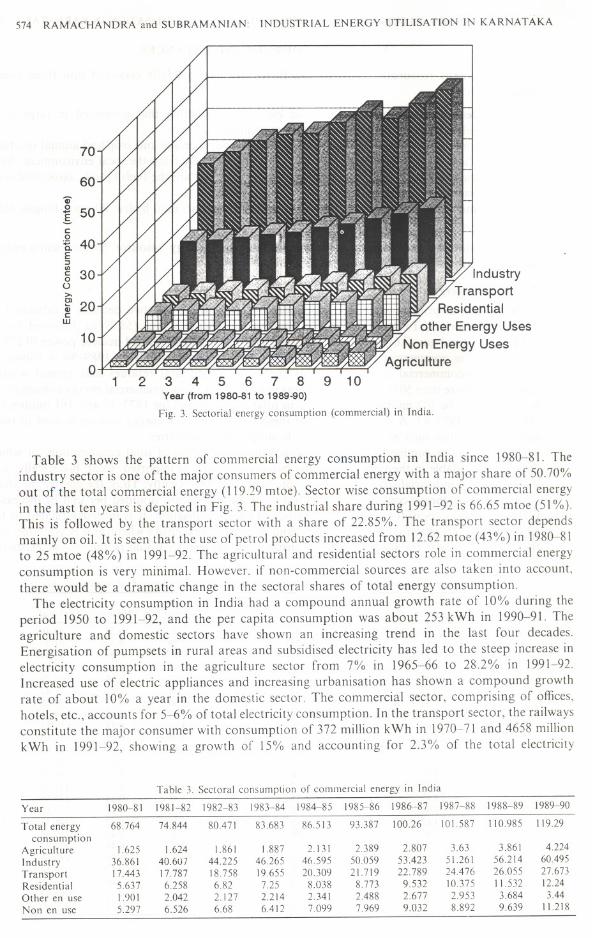
Table 3 shows the pattern of commercial energy consumption in India since 1980-81. Theindustry sector is one of the major consumers of commercial energy with a major share of 50.70%out of the total commercial energy (119.29 mtoe). Sector wise consumption of commercial energyin the last ten years is depicted in Fig. 3 The industrial share during 1991-92 is 66.65 mtoe (51%).This is followed by the transport sector with a share of 22.85%. The transport sector dependsmainly on oil. It is seenthat the useof petrol productsincreasedfrom 12.62mtoe (43%) in 1980-81to 25 mtoe (48%) in 1991-92. The agricultural and residential sectors role in commercial energyconsumption is very minimal. However. if non-commercial sources are also taken into account,there would be a dramatic change in the sectoral shares of total energy consumption.
The electricity consumption in India had a compound annual growth rate of 10% during theperiod 1950 to 1991-92, and the per capita consumption was about 253 kWh in 1990-91. Theagriculture and domestic sectors have shown an increasing trend in the last four decades.Energisation of pumpsets in rural areas and subsidised electricity has led to the steep increase inelectricity consumption in the agriculture sector from 7% in 1965-66 to 28.2% in 1991-92.Increased use of electric appliances and increasing urbanisation has shown a compound growthrate of about 10% a year in the domestic sector. The commercial sector, comprising of offices,hotels, etc., accounts for 5-6% of total electricity consumption. In the transport sector, the railwaysconstitute the major consumer with consumption of 372 million kWh in 1970-71 and 4658 millionkWh in 1991-92, showing a growth of 15% and accounting for 2.3% of the total electricity
70
60
GI
150c0'K 40E'"UI
§ 30()>-
20cw
10
01 2
Table 3. Sectoralconsumptionof commercialenergy in India
Year 1980-81 1981-82 1982-83 1983-84 1984-85 1985-86 1986-87 1987-88 1988-89 1989-90
Total energy 68764 74.844 80.471 83683 86513 93387 100.26 101.587 110.985 11929
consumptionAgriculture 1.625 1.624 1.861 1.887 2.131 2.389 2.807 3.63 3.861 4.224
Industry 36.861 40.607 44.225 46.265 46.595 50.059 53.423 51.26I 56.214 60.495
Transport I 7.443 17787 18.758 19.655 20.309 21.719 22.789 24.476 26.055 27.673
Residential 5.637 6.258 682 7.25 8.038 8.773 9.532 10.375 11.532 12.24
Other en use 1.90I 2.042 2.127 2.214 2.341 2.488 2.677 2.953 3.684 3.44
Non en use 5297 6.526 6.68 6.412 7.099 7969 9.032 8.892 9.639 11.218
RAMACHANDRA and SUBRAMANIAN: INDUSTRIAL ENERGY UTILISATION IN KARNATAKA 575
consumption. Power shortages and poor quality of supply has made the industrial sector dependentmore on captive power generation.
During 1991-92, peak and energy shortages in India were 17.7% and 8.5%, respectively. Withproper conservation measures and an integrated energy planning approach, these shortages couldbe reduced. Conservation measures include improvement of efficiencies of end use devices in allsectors, improvement of plant load factor in thermal power stations by improving the coalprocessing facilities and improvement of a properly trained work force. Paucity of funds in thepower sector to implement conservation measures could be managed with proper restructuring thetariffs in line with the cost of power generation and supply.
2.2. Energy planning
Currently, energy planning in our country is not an integrated activity. Since there are manyenergy sources and end uses, there are many organisations and agencies that deal with differentaspects of energy. The plans for electricity, coal, oil and fuelwood are made by respectiveorganisations mainly based on the projection of energy demand. The primary goal of this approachis for energy supply expansions on the assumption that there is a correlation between energy useand gross domestic product. With this approach, energy becomes an end in itself, and the focusshifts on meeting increased energy consumption through energy supply expansion alone. Thissupply and demand based planning approach for each individual energy form has resulted inproblems like more losses, more conversions and low efficiencies. This is evident from thedisappearance Of forests, village wood lots, roadside trees, construction of giant hydro electricdams, fossil fuel based power plants and controversial nuclear plants. This conflict between theenergy demand and environmental quality goals can be solved by having an integrated approachto the problem of energy planning with a view to minimise consumption of non-renewableresources of energy, to maximise efficiency of energy usage and to harness renewable sources ofenergy in an ecologically sound way. Another aspect that has to be considered in the planningprocess is that of matching energy resources and end uses. Because of convenience, the currentusage of high quality energy such as electricity for low quality activities like bath water heating,is to be discouraged. Hence, strategies for integrated energy planning should include (a)improvements in efficiencies of end use devices and/or conversion equipments, (b) optimisingenergy source--end use matching, (c) an organised approach towards optimal use of renewableresources, (d) proper exploitation of biomass energy resources and (e) discourage use of depletableresources (by penalising).
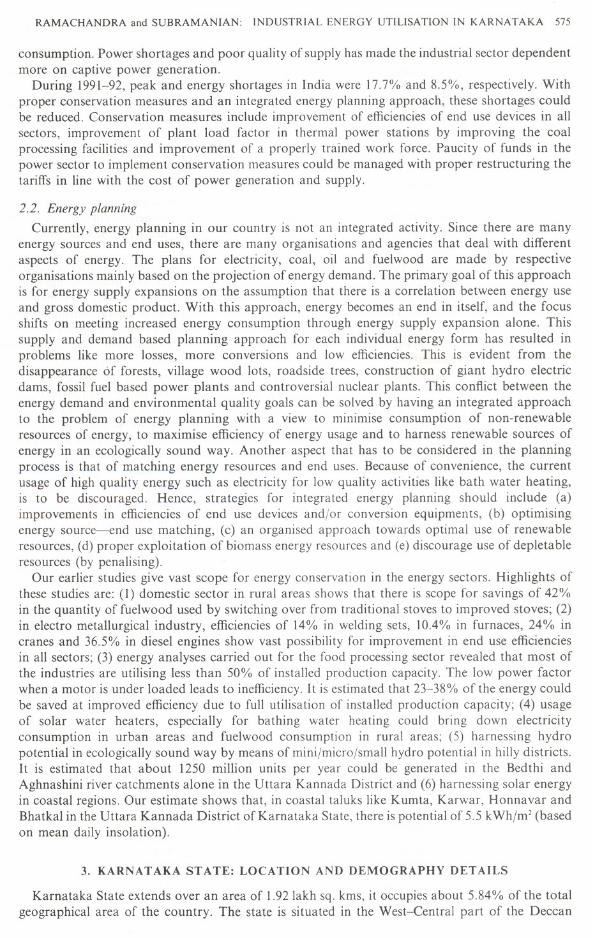
Our earlier studies give vast scope for energy conservation in the energy sectors. Highlights ofthese studies are: (I) domestic sector in rural areas shows that there is scope for savings of 42%in the quantity of fuelwood used by switching over from traditional stoves to improved stoves; (2)in electro metallurgical industry, efficiencies of 14% in welding sets, 10.4% in furnaces, 24% incranes and 36.5% in diesel engines show vast possibility for improvement in end use efficienciesin all sectors; (3) energy analyses carried out for the food processing sector revealed that most ofthe industries are utilising less than 50% of installed production capacity. The low power factorwhen a motor is under loaded leads to inefficiency. It is estimated that 23-38% of the energy couldbe saved at improved efficiency due to full utilisation of installed production capacity; (4) usageof solar water heaters, especially for bathing water heating could bring down electricityconsumption in urban areas and fuelwood consumption in rural areas; (5) harnessing hydropotential in ecologically sound way by means of mini/micro/small hydro potential in hilly districts.It is estimated that about 1250 million units per year could be generated in the Bedthi andAghnashini river catchments alone in the Uttara Kannada District and (6) harnessing solar energyin coastal regions. Our estimate shows that, in coastal taluks like Kumta, Karwar, Honnavar andBhatkal in the Uttara Kannada District of Karnataka State, there is potential of 5.5 kWh/m2 (basedon mean daily insolation).
3. KARNATAKA STATE: LOCATION AND DEMOGRAPHY DETAILS
Karnataka State extends over an area of 1.92 lakh sq. kms, it occupies about 5.84% of the totalgeographical area of the country. The state is situated in the West-Central part of the Deccan
576 RAMACHANDRA and SUBRAMANIAN: INDUSTRIAL ENERGY UTILISATION IN KARNATAKA
Peninsula of the Indian union and is stretched between 13° 3' and 18°45' north latitudes and 74° 12'and 78° 40' east longitudes. The major portion of Karnataka lies in the elevation range between450 and 900 metres above mean sea level. With a population of 4,49,77,201, it accounts for 5.4%of the country's population. For administrative purpose, the state has been divided into divisions,districts and taluks. There are 27,024 villages spread over 175 taluks. 69.07% of the populationresides in rural areas (31,069,413 people).
3.1. Karnataka's energy scene
Karnataka does not have any coal deposits. It gets its coal from outside. The electrical energyfor Karnataka was purely hydro, and with the commissioning of Raichur thermal power station,it gets electrical energy from coal also. The other major source of commercial energy-oil-is alsonot available in Karnataka. Hence, the main source of commercial energy for the state comes fromhydroelectric plants.
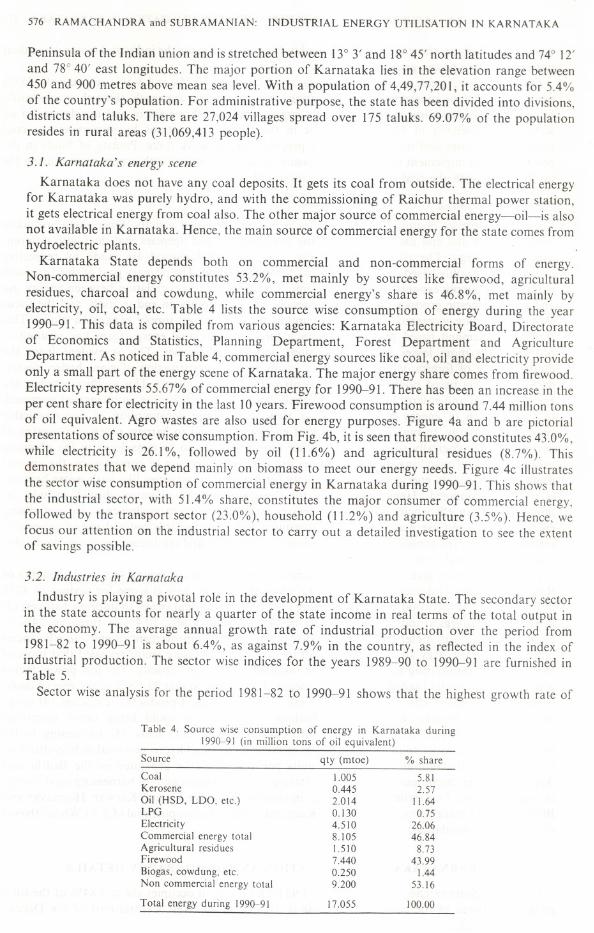
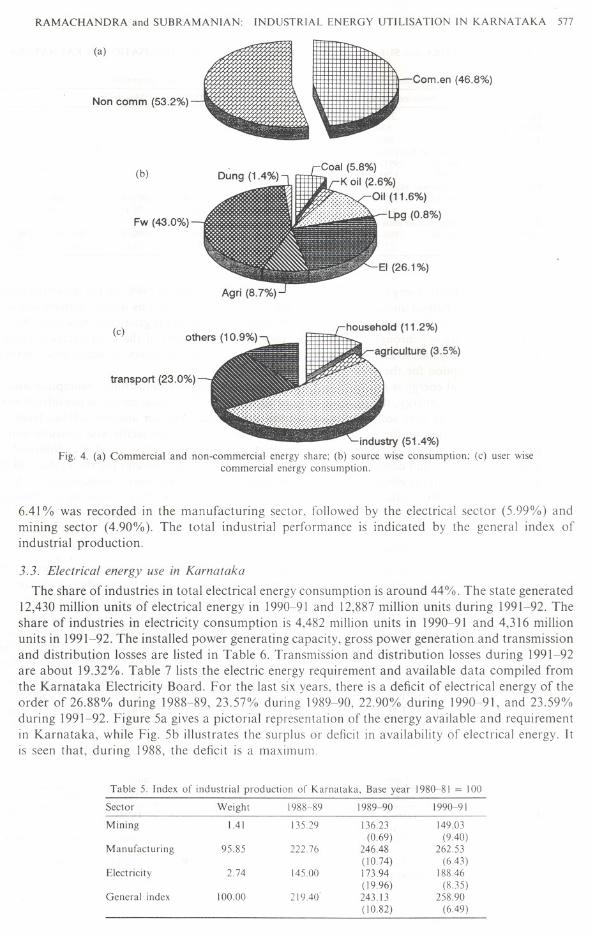
Karnataka State depends both on commercial and non-commercial forms of energy.Non-commercial energy constitutes 53.2%, met mainly by sources like firewood, agriculturalresidues, charcoal and cowdung, while commercial energy's share is 46.8%, met mainly byelectricity, oil, coal, etc. Table 4 lists the source wise consumption of energy during the year1990-91. This data is compiled from various agencies: Karnataka Electricity Board, Directorateof Economics and Statistics, Planning Department, Forest Department and AgricultureDepartment. As noticed in Table 4, commercial energy sources like coal, oil and electricity provideonly a small part of the energy scene of Karnataka. The major energy share comes from firewood.Electricity represents 55.67% of commercial energy for 1990-91. There has been an increase in theper cent share for electricity in the last 10years. Firewood consumption is around 7.44 million tonsof oil equivalent. Agro wastes are also used for energy purposes. Figure 4a and b are pictorialpresentations of source wise consumption. From Fig. 4b, it is seen that firewood constitutes 43.0%,while electricity is 26.1%, followed by oil (11.6%) and agricultural residues (8.7%). Thisdemonstrates that we depend mainly on biomass to meet our energy needs. Figure 4c illustratesthe sector wise consumption of commercial energy in Karnataka during 1990-91. This shows thatthe industrial sector, with 51.4% share, constitutes the major consumer of commercial energy,followed by the transport sector (23.0%), household (11.2%) and agriculture (3.5%). Hence, wefocus our attention on the industrial sector to carry out a detailed investigation to see the extentof savings possible.
3.2. Industries in Karnataka
Industry is playing a pivotal role in the development of Karnataka State. The secondary sectorin the state accounts for nearly a quarter of the state income in real terms of the total output inthe economy. The average annual growth rate of industrial production over the period from1981-82 to 1990-91 is about 6.4%, as against 7.9% in the country, as reflected in the index ofindustrial production. The sector wise indices for the years 1989-90 to 1990-91 are furnished inTable 5.
Sector wise analysis for the period 1981-82 to 1990-91 shows that the highest growth rate of
Table 4. Source wise consumption of energy in Karnataka during]990-91 (in million tons of oil equivalent)
Source qty (mtoe) % share
Coal 1.005 5.81Kerosene 0.445 2.57Oil (HSD, LDa. etc.) 2.014 11.64LPG 0.130 0.75Electricity 4.510 26.06Commercial energy total 8.105 46.84Agricultural residues 1.510 8.73Firewood 7.440 43.99Biogas, cowdung, etc. 0.250 1.44Non commercial energy total 9.200 53.16
Total energy during 1990-91 17.055 100.00
RAMACHANDRA and SUBRAMANIAN: INDUSTRIAL ENERGY UTILISATION IN KARNATAKA 577
(a)
Com.en (46.8%)
Non comm (53.2%)
(b)Coal (5.8%)
K oil (2.6%)
Oil (11.6%)
Lpg (0.8%)Fw (43.0%)
(c)
transport (23.0%)
industry (51.4%)
Fig. 4. (a) Commercial and non-commercial energy share: (b) source wise consumption: (c) user wisecommercial energy consumption.
6.41% was recorded in the manufacturing sector, followed by the electrical sector (5.99%) andmining sector (4.90%). The total industrial performance is indicated by the general index ofindustrial production.
3.3. Electrical energy use in Karnataka
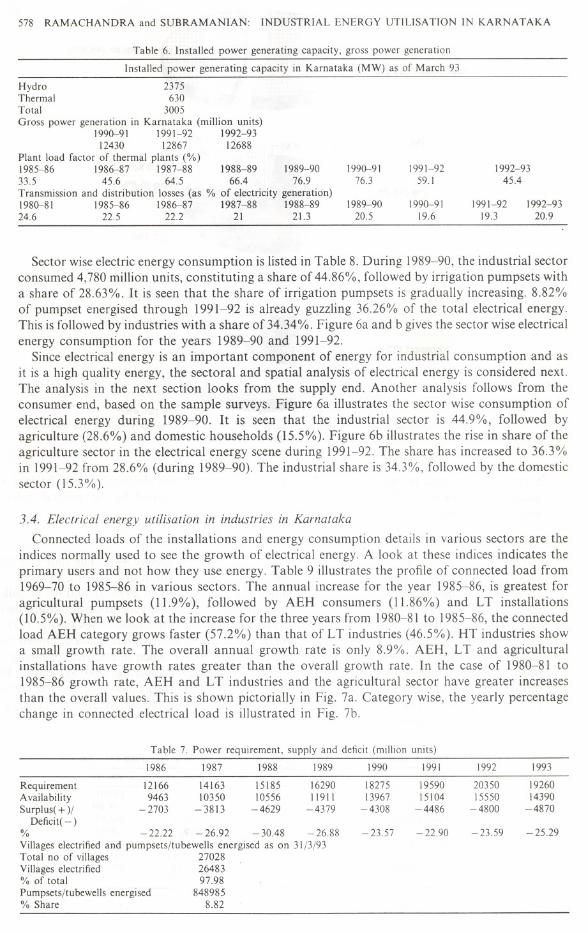
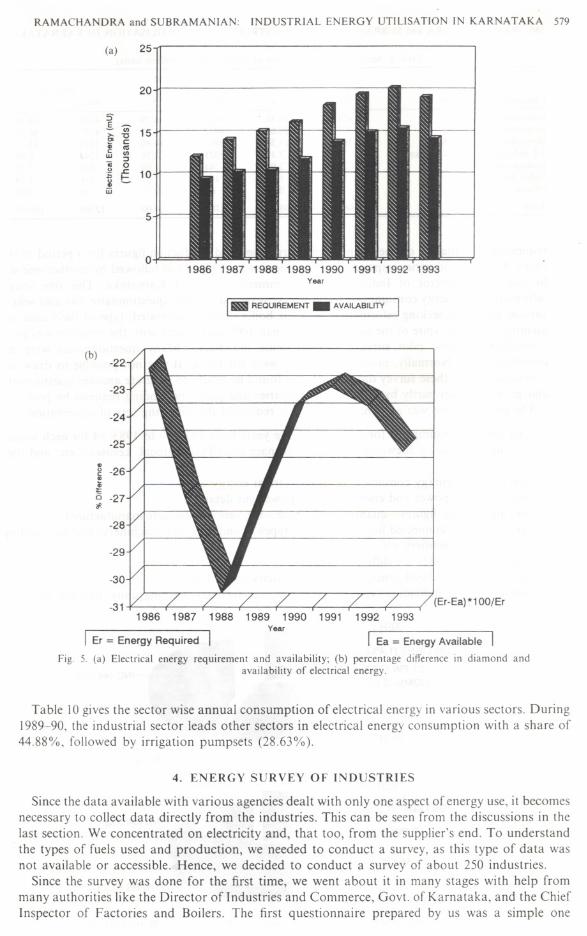
The share of industries in total electrical energy consumption is around 44%. The state generated12,430 million units of electrical energy in 1990-91 and 12,887 million units during 1991-92. Theshare of industries in electricity consumption is 4,482 million units in 1990-91 and 4,316 millionunits in 1991-92. The installed power generating capacity, gross power generation and transmissionand distribution losses are listed in Table 6. Transmission and distribution losses during 1991-92are about 19.32%. Table 7 lists the electric energy requirement and available data compiled fromthe Karnataka Electricity Board. For the last six years, there is a deficit of electrical energy of theorder of 26.88% during 1988-89, 23.57% during 1989-90,22.90% during 1990-91, and 23.59%during 1991-92. Figure 5a gives a pictorial representation of the energy available and requirementin Karnataka, while Fig. 5b illustrates the surplus or deficit in availability of electrical energy. Itis seen that, during 1988, the deficit is a maximum.
Table 5. Index of industrial production of Karnataka, Base year 1980-81 = 100
Sector Weight 1988-89 1989-90 1990-91
Mining 1.41 13529 136.23 149.03(0.69) (9.40)
Manufacturing 95.85 22276 246.48 262.53(10.74) (6.43)
Electricity 2.74 14500 173.94 188.46(19.96) (8.35)
General index 100.00 219.40 243.13 258.90(10.82) (6.49)
578 RAMACHANDRA and SUBRAMANIAN: INDUSTRIAL ENERGY UTILISATION IN KARNATAKA
Table 6. Installed power generating capacity, gross power generation
Installed power generating capacity in Karnataka (MW) as of March 93
Hydro 2375Thermal 630Total 3005Gross power generation in Karnataka (million units)
1990-91 1991-92 1992-9312430 12867 12688
Plant load factor of thermal plants (%)1985-86 1986-87 1987-88 1988-89 1989-9033.5 45.6 64.5 66.4 76.9Transmission and distribution losses (as % of electricity generation)1980-8I 1985-86 1986-87 1987-88 1988-8924.6 22.5 22.2 21 21.3
1990-9176.3
1991-9259.1
1992-9345.4
1989-9020.5
1990-9119.6
1991-9219.3
1992-9320.9
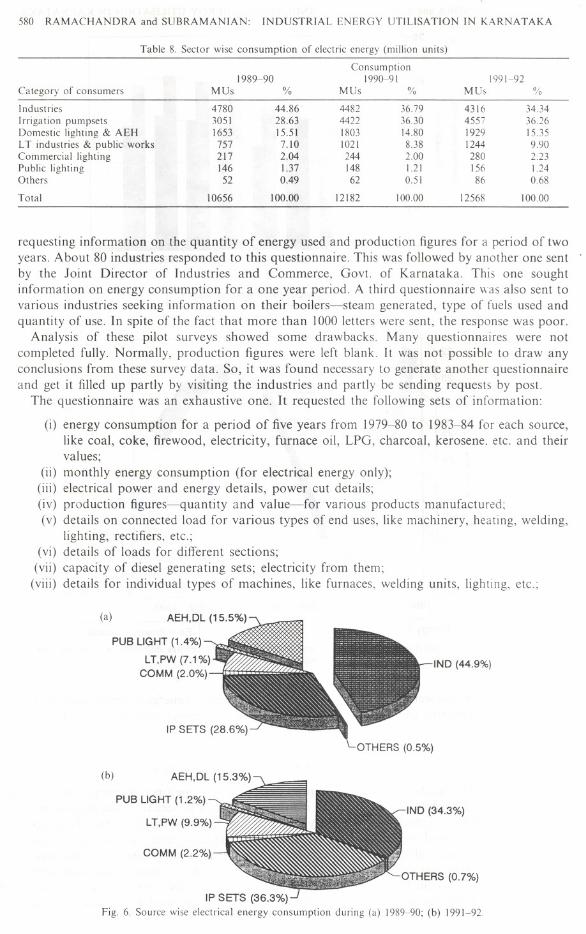
Sector wise electric energy consumption is listed in Table 8. During 1989-90, the industrial sectorconsumed 4,780 million units, constituting a share of 44.86%, followed by irrigation pump sets witha share of 28.63%. It is seen that the share of irrigation pumpsets is gradually increasing. 8.82%of pumpset energised through 1991-92 is already guzzling 36.26% of the total electrical energy.This is followed by industries with a share of 34.34%. Figure 6a and b gives the sector wise electricalenergy consumption for the years 1989-90 and 1991-92.
Since electrical energy is an important component of energy for industrial consumption and asit is a high quality energy, the sectoral and spatial analysis of electrical energy is considered next.The analysis in the next section looks from the supply end. Another analysis follows from theconsumer end, based on the sample surveys. Figure 6a illustrates the sector wise consumption ofelectrical energy during 1989-90. It is seen that the industrial sector is 44.9%, followed byagriculture (28.6%) and domestic households (15.5%). Figure 6b illustrates the rise in share of theagriculture sector in the electrical energy scene during 1991-92. The share has increased to 36.3%in 1991-92 from 28.6% (during 1989-90). The industrial share is 34.3%, followed by the domesticsector (15.3%).
3.4. Electrical energy utilisation in industries in Karnataka
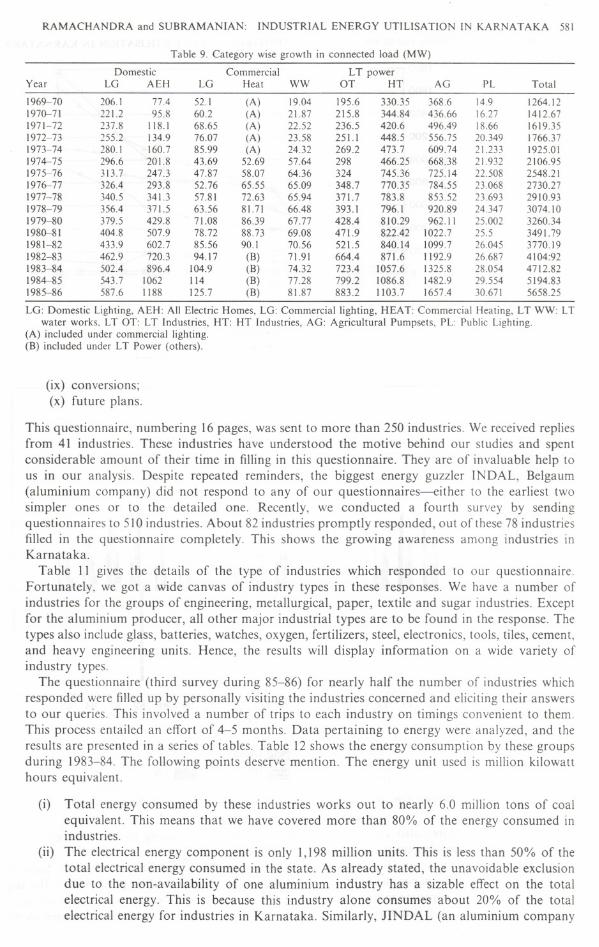
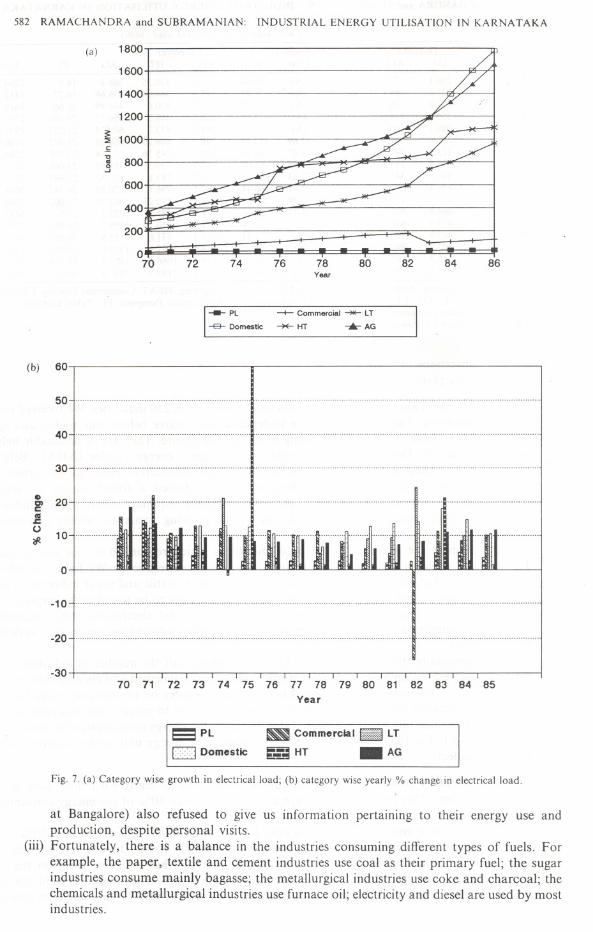
Connected loads of the installations and energy consumption details in various sectors are theindices normally used to see the growth of electrical energy. A look at these indices indicates theprimary users and not how they use energy. Table 9 illustrates the profile of connected load from1969-70 to 1985-86 in various sectors. The annual increase for the year 1985-86, is greatest foragricultural pumpsets (11.9%), followed by AEH consumers (11.86%) and LT installations(10.5%). When we look at the increase for the three years from 1980-81 to 1985-86, the connectedload AEH category grows faster (57.2%) than that of LT industries (46.5%). HT industries showa small growth rate. The overall annual growth rate is only 8.9%. AEH, LT and agriculturalinstallations have growth rates greater than the overall growth rate. In the case of 1980-81 to1985-86 growth rate, AEH and LT industries and the agricultural sector have greater increasesthan the overall values. This is shown pictorially in Fig. 7a. Category wise, the yearly percentagechange in connected electrical load is illustrated in Fig. 7b.
Table 7. Power requirement, supply and deficit (million units)
RequirementAvailabilitySurplus( + )/
Deficit(-)% -22.22 -26.92 -30.48 -26.88Villages electrified and pumpsets/tubewells energised as on 31/3/93Total no of villages 27028Villages electrified 26483% of total 97.98Pumpsets/tubewells energised 848985% Share 8.82
1986
121669463
- 2703
1987
1416310350
-3813
1988
1518510556
-4629
1989
]62901191I
-4379
1990 1991 1992 1993
18275 19590 20350 1926013967 15104 15550 14390
- 4308 -4486 -4800 -4870
- 23.57 -22.90 - 23.59 -25.29
RAMACHANDRA and SUBRAMANIAN: INDUSTRIAL ENERGY UTILISATION IN KARNATAKA 579
(a) 25
5
20
5.§.u;-i;;"tJ 15- co~ I'CIw '"~ 5E t=. 10~ -iii
01986 1987 1988 1989 1990 1991 1992 1993
Year
I~ REQUIREMENT- AVAILABIUTY I
-23
(Er-Ea)*100/Er
(b) -22
-24
-25
g -26..~~0 -27'*
-28
-29
-30
-311986 1987 1988 1989 1990 1991 1992 1993
Year
I Er = Energy Required I I Ea = EnergyAvailable IFig. 5. (a) Electrical energy requirement and availability; (b) percentage difference in diamond and
availability of electrical energy.
Table 1Ogives the sector wise annual consumption of electrical energy in various sectors. During1989-90, the industrial sector leads other sectors in electrical energy consumption with a share of44.88%, followed by irrigation pumpsets (28.63%).
4. ENERGY SURVEY OF INDUSTRIES
Since the data available with various agencies dealt with only one aspect of energy use, it becomesnecessary to collect data directly from the industries. This can be seen from the discussions in thelast section. We concentrated on electricity and, that too, from the supplier's end. To understandthe types of fuels used and production, we needed to conduct a survey, as this type of data wasnot available or accessible. Hence, we decided to conduct a survey of about 250 industries.
Since the survey was done for the first time, we went about it in many stages with help frommany authorities like the Director of Industries and Commerce, Govt. of Karnataka, and the ChiefInspector of Factories and Boilers. The first questionnaire prepared by us was a simple one
580 RAMACHANDRA and SUBRAMANIAN: INDUSTRIAL ENERGY UTILISATION IN KARNATAKA
requesting information on the quantity of energy used and production figures for a period of twoyears. About 80 industries responded to this questionnaire. This was followed by another one sent.by the Joint Director of Industries and Commerce, Govt. of Karnataka. This one soughtinformation on energy consumption for a one year period. A third questionnaire was also sent tovarious industries seeking information on their boilers-steam generated, type of fuels used andquantity of use. In spite of the fact that more than 1000 letters were sent, the response was poor.
Analysis of these pilot surveys showed some drawbacks. Many questionnaires were notcompleted fully. Normally, production figures were left blank. It was not possible to draw anyconclusions from these survey data. So, it was found necessary to generate another questionnaireand get it filled up partly by visiting the industries and partly be sending requests by post.
The questionnaire was an exhaustive one. It requested the following sets of information:
(i) energy consumption for a period of five years from 1979-80 to 1983-84 for each source,like coal, coke, firewood, electricity, furnace oil, LPG, charcoal, kerosene. etc. and theirvalues;
(ii) monthly energy consumption (for electrical energy only);(iii) electrical power and energy details, power cut details;(iv) production figures-quantity and value-for various products manufactured;(v) details on connected load for various types of end uses, like machinery, heating, welding,
lighting, rectifiers, etc.;(vi) details of loads for different sections;(vii) capacity of diesel generating sets; electricity from them;
(viii) details for individual types of machines, like furnaces, welding units, lighting, etc.;
(a)
PUB LIGHT (1.4%)
LT,PW (7.1%)COMM (2.0%)-
IND (44.9%)
(b)
COMM (2.2%)
IND (34.3%)PUB LIGHT (1.2%)
LT,PW (9.9%)
OTHERS (0.7%)
IP SETS (36.3%)Fig. 6. Source wise electrical energy consumption during (a) 1989-90; (b) 1991-92
Table 8. Sector wise consumption of electric energy (million units)
Consumption1989-90 1990-91 1991-92
Ca tegory of consumers MUs % MUs % MUs %
Industries 4780 44.86 4482 3679 4316 34.34Irrigation pumpsets 3051 28.63 4422 36.30 4557 36.26Domestic lighting & AEH 1653 15.51 1803 14.80 1929 15.35LT industries & public works 757 7.10 1021 8.38 1244 9.90Commercial lighting 217 2.04 244 2.00 280 2.23Public lighting 146 1.37 148 1.21 156 1.24Others 52 0.49 62 0.51 86 068
Total 10656 100.00 12182 100.00 12568 100.00
RAMACHANDRA and SUBRAMANIAN: INDUSTRIAL ENERGY UTILISATION IN KARNATAKA 581
This questionnaire, numbering 16 pages, was sent to more than 250 industries. We received repliesfrom 41 industries. These industries have understood the motive behind our studies and spentconsiderable amount of their time in filling in this questionnaire. They are of invaluable help tous in our analysis. Despite repeated reminders, the biggest energy guzzler INDAL, Belgaum(aluminium company) did not respond to any of our questionnaires---either to the earliest twosimpler ones or to the detailed one. Recently, we conducted a fourth survey by sendingquestionnaires to 510 industries. About 82 industries promptly responded, out of these 78 industriesfilled in the questionnaire completely. This shows the growing awareness among industries inKarnataka.
Table II gives the details of the type of industries which responded to our questionnaire.Fortunately, we got a wide canvas of industry types in these responses. We have a number ofindustries for the groups of engineering, metallurgical, paper, textile and sugar industries. Exceptfor the aluminium producer, all other major industrial types are to be found in the response. Thetypes also include glass, batteries, watches, oxygen, fertilizers, steel, electronics, tools, tiles, cement,and heavy engineering units. Hence, the results will display information on a wide variety ofindustry types.
The questionnaire (third survey during 85-86) for nearly half the number of industries whichresponded were filled up by personally visiting the industries concerned and eliciting their answersto our queries. This involved a number of trips to each industry on timings convenient to them.This process entailed an effort of 4-5 months. Data pertaining to energy were analyzed, and theresults are presented in a series of tables. Table 12 shows the energy consumption by these groupsduring 1983-84. The following points deserve mention. The energy unit used is million kilowatthours equivalent.
(i) Total energy consumed by these industries works out to nearly 6.0 million tons of coalequivalent. This means that we have covered more than 80% of the energy consumed inindustries.
(ii) The electrical energy component is only 1,198 million units. This is less than 50% of thetotal electrical energy consumed in the state. As already stated, the unavoidable exclusiondue to the non-availability of one aluminium industry has a sizable effect on the totalelectrical energy. This is because this industry alone consumes about 20% of the totalelectrical energy for industries in Karnataka. Similarly, JINDAL (an aluminium company
Table 9. Category wise growth in connected load (MW)
Domestic Commercial LT powerYear LG AEH LG Heat WW OT HT AG PL Total
1969-70 206.1 77.4 52.1 (A) 19.04 195.6 330.35 368.6 14.9 1264.121970-71 221.2 95.8 60.2 (A) 2\.87 215.8 344.84 436.66 16.27 1412.671971-72 237.8 118.1 68.65 (A) 22.52 236.5 420.6 496.49 18.66 1619.351972-73 255.2 134.9 76.07 (A) 23.58 251.1 448.5 556.75 20.349 1766.371973-74 280.1 160.7 85.99 (A) 24.32 269.2 473.7 609.74 21.233 1925.011974-75 296.6 20\.8 43.69 52.69 57.64 298 466.25 668.38 2\.932 2106.951975-76 313.7 247.3 47.87 58.07 64.36 324 745.36 725.14 22.508 2548.211976-77 326.4 293.8 52.76 65.55 65.09 348.7 770.35 784.55 23.068 2730.271977-78 340.5 341.3 57.81 72.63 65.94 371.7 783.8 853.52 23.693 2910.931978-79 356.4 371.5 63.56 81.71 66.48 393.1 796.1 920.89 24.347 3074.101979-80 379.5 429.8 7\.08 86.39 67.77 428.4 810.29 962.11 25.002 3260.341980-81 404.8 507.9 78.72 88.73 69.08 47\.9 822.42 1022.7 25.5 3491.791981-82 433.9 602.7 85.56 90.1 70.56 521.5 840.14 1099.7 26.045 3770.191982-83 462.9 720.3 94.17 (B) 7\.91 664.4 87\.6 1192.9 26.687 4104:921983-84 502.4 896.4 104.9 (B) 74.32 723.4 1057.6 1325.8 28.054 4712.821984-85 543.7 1062 114 (B) 77.28 799.2 1086.8 1482.9 29.554 5194.831985-86 587.6 1188 125.7 (B) 8\.87 883.2 1103.7 1657.4 30.671 5658.25
LG: Domestic Lighting, AEH: All Electric Homes, LG: Commercial lighting, HEAT: Commercial Heating, LT WW: LTwater works. LTOT: LT Industries. HT: HT Industries, AG: Agricultural Pumpsets, PL: Public Lighting.
(A) included under commercial lighting.(B) included under LT Power (others).
(ix) conversions;
(x) future plans.
582 RAMACHANDRA and SUBRAMANIAN: INDUSTRIAL ENERGY UTILISATION IN KARNATAKA
(b) 60
50
40
30-<.......................
8)
~ 20«I.c()
"#. 10
72 82 868476 78Year
8074
--- PL -+- Commercial --- LT
-a- Domestic AG--- HT
............................... ........................
.......................
...................
0
,..................
-10""'.""""""""'."""""""""""""""""""""""'"
-20
-3070 71
........._......... ......................
72 73 74 75 76 77 78 79 80 81Year
82 83 84 85
8PL
I::j Domestic
~ Commercialt,:;::,::}!LT
~~.; HT - AG
Fig. 7. (a) Category wise growth in electrical load; (b) category wise yearly % change in electrical load.
at Bangalore) also refused to give us information pertaining to their energy use andproduction, despite personal visits.
(iii) Fortunately, there is a balance in the industries consuming different types of fuels. Forexample, the paper, textile and cement industries use coal as their primary fuel; the sugarindustries consume mainly bagasse; the metallurgical industries use coke and charcoal; thechemicals and metallurgical industries use furnace oil; electricity and diesel are used by mostindustries.
(a) 1800
1600
1400
1200
§ 1000.5."os 8000--'
600
400
200
070
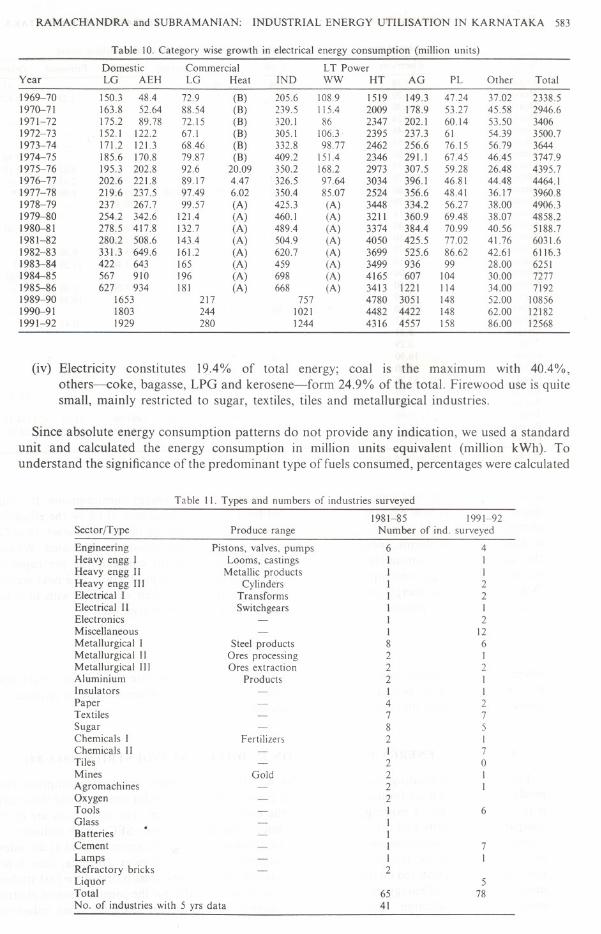
RAMACHANDRA and SUBRAMANIAN: INDUSTRIAL ENERGY UTILISATION IN KARNATAKA 583
(iv) Electricity constitutes 19.4% of total energy; coal is the maximum with 40.4%,others---coke, bagasse, LPG and kerosene-form 24.9% of the total. Firewood use is quitesmall, mainly restricted to sugar, textiles, tiles and metallurgical industries.
Since absolute energy consumption patterns do not provide any indication, we used a standardunit and calculated the energy consumption in million units equivalent (million kWh). Tounderstand the significance of the predominant type of fuels consumed, percentages were calculated
Table] 1. Types and numbers of industries surveyed
Gold
Sector/Type
EngineeringHeavy engg IHeavy engg IIHeavy engg IIIElectrica] IElectrical IIElectronicsMiscellaneousMetallurgical IMetallurgical IIMetallurgical IIIAluminiumInsulatorsPaperTextilesSugarChemicals IChemicals IITilesMinesAgromachinesOxygenToolsGlassBatteries .CementLampsRefractory bricksLiquorTotalNo. of industries with 5 yrs data
Produce range
Pistons, valves, pumpsLooms, castings
Metallic productsCylinders
Transforms
Switchgears
Steel productsOres processingOres extraction
Products
Fertilizers
Table 10. Category wise growth in electrical energy consumption (million units)
Domestic Commercial LT PowerYear LG AEH LG Heat IND WW HT AG PL Other Total
]969-70 ]50.3 48.4 72.9 (B) 205.6 108.9 1519 149.3 47.24 37.02 2338.51970-71 163.8 5264 88.54 (B) 239.5 115.4 2009 178.9 53.27 45.58 2946.61971-72 ]75.2 89.78 72.15 (B) 320.1 86 2347 202.1 60.]4 53.50 34061972-73 ]52.] 122.2 67.1 (B) 305.1 106.3 2395 237.3 6] 54.39 3500.71973-74 ]7].2 121.3 68.46 (B) 332.8 98.77 2462 256.6 76.]5 56.79 36441974-75 ]85.6 170.8 79.87 (B) 409.2 151.4 2346 291.1 67.45 46.45 3747.91975-76 ]95.3 202.8 92.6 20.09 350.2 168.2 2973 307.5 59.28 26.48 4395.71976-77 202.6 221.8 89.17 4.47 326.5 97.64 3034 396.1 46.81 44.48 4464.11977-78 219.6 237.5 97.49 6.02 350.4 85.07 2524 356.6 48.4] 36.17 3960.81978-79 237 267.7 99.57 (A) 425.3 (A) 3448 334.2 56.27 38.00 4906.3]979-80 254.2 342.6 121.4 (A) 460.] (A) 3211 360.9 69.48 38.07 4858.2]980-81 278.5 417.8 132.7 (A) 489.4 (A) 3374 384.4 70.99 40.56 5]88.71981-82 280.2 508.6 143.4 (A) 504.9 (A) 4050 425.5 77.02 41.76 6031.6]982-83 331.3 649.6 161.2 (A) 620.7 (A) 3699 525.6 86.62 42.61 6] ]6.31983-84 422 643 ]65 (A) 459 (A) 3499 936 99 28.00 625]]984-85 567 9]0 196 (A) 698 (A) 4165 607 104 30.00 7277]985-86 627 934 ]81 (A) 668 (A) 3413 122] 1]4 34.00 7]921989-90 1653 2]7 757 4780 305] 148 52.00 108561990-91 1803 244 1021 4482 4422 148 62.00 12]821991-92 1929 280 1244 43]6 4557 158 86.00 12568
]981-85 ]991-92Number of indo surveyed
6 41 ]I ]1 21 21 11 21 ]28 62 I2 22 I1 I4 27 78 52 I] 72 02 ]2 I2] 6]I] 7I ]2
565 7841
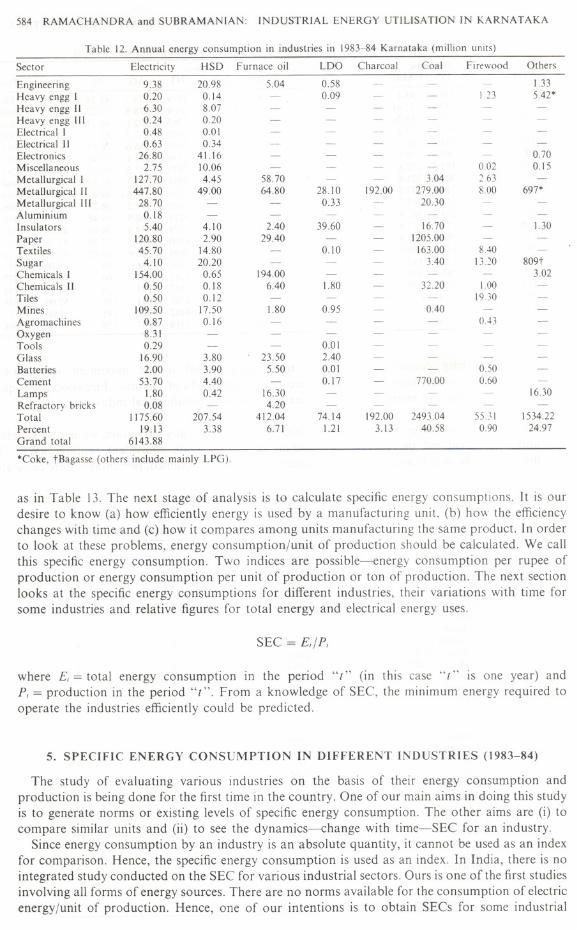
as in Table 13. The next stage of analysis is to calculate specific energy consumptions. It is ourdesire to know (a) how efficiently energy is used by a manufacturing unit, (b) how the efficiencychanges with time and (c) how it compares among units manufacturing the same product. In orderto look at these problems, energy consumption/unit of production should be calculated. We callthis specific energy consumption. Two indices are possible-energy consumption per rupee ofproduction or energy consumption per unit of production or ton of production. The next sectionlooks at the specific energy consumptions for different industries, their variations with time forsome industries and relative figures for total energy and electrical energy uses.
SEC = E,/P,
where E, = total energy consumption in the period" (" (in this case" (" is one year) andP, = production in the period "(". From a knowledge of SEC, the minimum energy required tooperate the industries efficiently could be predicted.
5. SPECIFIC ENERGY CONSUMPTION IN DIFFERENT INDUSTRIES (1983-84)
The study of evaluating various industries on the basis of their energy consumption andproduction is being done for the first time in the country. One of our main aims in doing this studyis to generate norms or existing levels of specific energy consumption. The other aims are (i) tocompare similar units and (ii) to see the dynamics-change with time-SEe for an industry.
Since energy consumption by an industry is an absolute quantity, it cannot be used as an indexfor comparison. Hence, the specific energy consumption is used as an index. In India, there is nointegrated study conducted on the SEC for various industrial sectors. Ours is one of the first studiesinvolving all forms of energy sources. There are no norms available for the consumption of electricenergy/unit of production. Hence, one of our intentions is to obtain SECs for some industrial
584 RAMACHANDRA and SUBRAMANIAN: INDUSTRIAL ENERGY UTILISATION IN KARNATAKA
Table 12. Annual energy consumption in industries in 1983-84 Karnataka (million units)
Sector Electricity HSD Furnace oil LDO Charcoal Coal Firewood Others
Engineering 9.38 20.98 5.04 0.58 - 1.33
Heavy engg I 0.20 0.14 - 0.09 123 5.42-
Heavy engg II 6.30 8.07Heavy engg III 0.24 0.20Electrical 1 0.48 0.01Electrical II 0.63 0.34Electronics 26.80 41.16 0.70Miscellaneous 2.75 10.06 0.02 0.15
Metallurgical 1 127.70 4.45 58.70 3.04 263 -
Metallurgical II 447.80 49.00 64.80 28.10 192.00 279.00 800 697-
Metallurgical III 28.70 - - 0.33 20.30Aluminium 0.18 -
Insulators 5.40 4.10 2.40 39.60 16.70 1.30
Paper 120.80 2.90 29.40 1205.00Textiles 45.70 14.80 - 0.10 163.00 8.40
Sugar 4.10 20.20 3.40 13.20 809tChemicals I 154.00 0.65 194.00 - 3.02Chemicals II 0.50 0.18 6.40 1.80 32.20 1.00Tiles 0.50 0.12 - - 19.30Mines 109.50 17.50 1.80 0.95 0.40
Agromachines 0.87 0.16 - 0.43
Oxygen 8.31Tools 0.29 - - 0.01Glass 16.90 3.80 23.50 2.40Batteries 2.00 3.90 5.50 0.01 - 0.50Cement 53.70 4.40 - 0.17 - 770.00 0.60
Lamps 1.80 0.42 16.30 - 16.30Refractory bricks 0.08 4.20 -Total 1175.60 207.54 412.04 74.14 192.00 249304 55.31 1534.22Percent 19.13 3.38 6.71 1.21 3.13 40.58 0.90 24.97Grand total 6143.88
-Coke, tBagasse (others include mainly LPG).
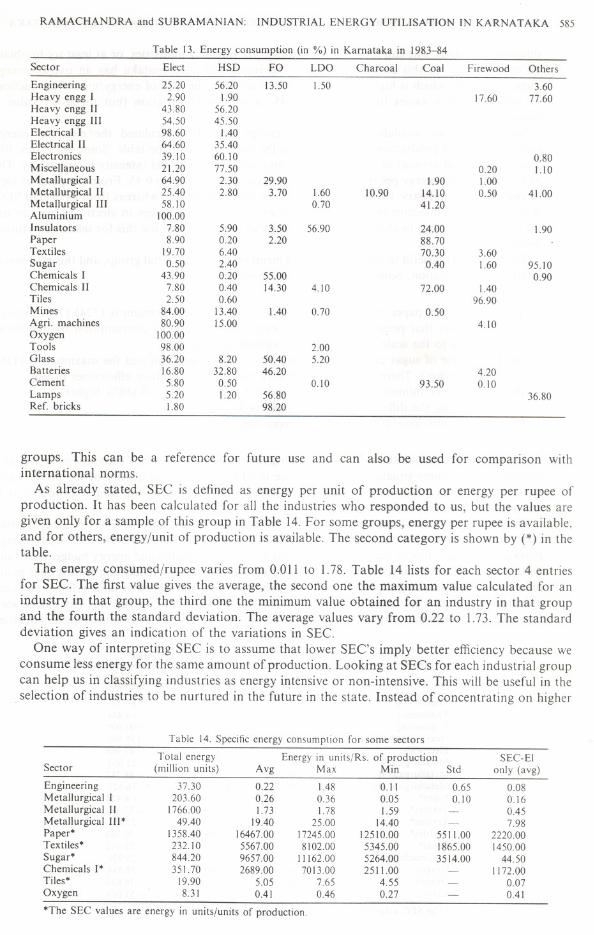
groups. This can be a reference for future use and can also be used for comparison withinternational norms.
As already stated, SEC is defined as energy per unit of production or energy per rupee ofproduction. It has been calculated for all the industries who responded to us, but the values aregiven only for a sample of this group in Table 14. For some groups, energy per rupee is available,and for others, energy/unit of production is available. The second category is shown by (*) in thetable.
The energy consumed/rupeevaries from 0.011to 1.78.Table 14 lists for each sector 4 entriesfor SEe. The first value gives the average, the second one the maximum value calculated for anindustry in that group, the third one the minimum value obtained for an industry in that groupand the fourth the standard deviation. The average values vary from 0.22 to 1.73. The standarddeviation gives an indication of the variations in SEe.
One way of interpreting SEC is to assume that lower SEe's imply better efficiency because weconsume less energy for the same amount of production. Looking at SECs for each industrial groupcan help us in Classifyingindustries as energy intensive or non-intensive. This will be useful in theselection of industries to be nurtured in the future in the state. Instead of concentrating on higher
RAMACHANDRA and SUBRAMANIAN: INDUSTRIAL ENERGY UTILISATION IN KARNATAKA 585
Table 13. Energy consumption (in %) in Karnataka In 1983-84Sector Elect HSO Fa LOa Charcoal Coal Firewood Others
Engineenng 25.20 56.20 ]3.50 1.50 3.60Heavy engg I 2.90 1.90 17.60 77.60Heavy engg II 43.80 56.20Heavy engg III 54.50 45.50Electrical I 98.60 1.40Electrical II 64.60 35.40Electronics 39.10 60.10 0.80Miscellaneous 21.20 77.50 0.20 1.10Metallurgical I 64.90 2.30 29.90 1.90 1.00Metallurgical II 25.40 2.80 3.70 1.60 10.90 14.10 0.50 41.00Metallurgical III 58.10 0.70 41.20Aluminium 100.00Insulators 7.80 5.90 3.50 56.90 24.00 1.90Paper 8.90 0.20 2.20 88.70Textiles 19.70 6.40 70.30 3.60Sugar 0.50 2.40 0.40 1.60 95.10Chemicals I 43.90 0.20 55.00 0.90Chemicals II 7.80 0.40 14.30 4.10 72.00 1.40Tiles 2.50 0.60 96.90Mines 84.00 13.40 1.40 0.70 0.50Agri. machines 80.90 15.00 4.10Oxygen 100.00Tools 98.00 2.00Glass 36.20 8.20 50.40 5.20Batteries 16.80 32.80 46.20 4.20Cement 5.80 0.50 0.10 93.50 0.10Lamps 5.20 1.20 56.80 36.80Ref. bricks 1.80 98.20
Table 14. Specific energy consumption for some sectors
Total energy Energy in units/Rs. of production SEC-EISector (million units) Avg Max Min Std only (avg)
EngIneering 37.30 0.22 1.48 0.11 0.65 0.08Metallurgical I 203.60 0.26 0.36 0.05 0.10 0.16Metallurgical II 1766.00 1.73 1.78 1.59 - 0.45Metallurgical III. 49.40 19.40 25.00 14.40 7.98Paper. 1358.40 16467.00 17245.00 12510.00 5511.00 2220.00Textiles. 232.10 5567.00 8102.00 5345.00 1865.00 1450.00Sugar. 844.20 9657.00 11162.00 5264.00 3514.00 44.50Chemicals I. 351.70 2689.00 7013.00 2511.00 1172.00Tiles. 19.90 5.05 7.65 4.55 - 0.07Oxygen 8.31 0.41 0.46 0.27 - 0.41
.The SEC values are energy in units/units of production.
586 RAMACHANDRA and SUBRAMANIAN: INDUSTRIAL ENERGY UTILISATION IN KARNATAKA
intensity industries, one can look for and select lower intensity industries, or at least try to obtainan optimal mix. In this connection, it may be recalled that Karnataka has an overall energyintensity of 1.96 which is higher than the national level. In the case of energy/unit of production,we can see that it varies from 4.55 to 17245-a very wide variation (but the lower value isenergy/tile).
Since norms are available for electrical energy, we also calculated the electrical energyconsumed/unit of production. This is given in the last column of the table. Some industries, liketiles, use the least amount of electrical energy and some have a higher intensity for electricity. TheSEC for electrical energy per rupee of production varies from 0.08 to 0.45. From the point of viewof electricity, an industry, like oxygen, has become energy intensive, whereas from its overall SEC,it is not a highly intensive industry. So, when we have acute shortages in electricity, we can usethe SEC for electricity to characterise the intensity of industries and use this for selection of futureindustries.
The SEC is very useful to look at individual members in an industrial group, and this may revealinteresting information. Some examples are cited below:
(i) In the case of paper, the minimum SEC is 12510 and the maximum is 17245 (38% higher).This shows that possibly one industry can reduce its energy consumption by improvingefficiency to the scale of the minimum valued industry.
(ii) In the case of sugar also, the minimum SEC is 5264 units/ton and the maximum is 11162(112% higher). There is a large possibility here also to improve efficiencies of use.
(iii) For tiles, the minimum value is 4.55 and the maximum is 7.65 (68% higher).(iv) For textiles, the difference (in percentage) is 52%.(v) Oxygen units have a difference (in percentage) of 70%.
The above illustrations show that there is a high probability of efficiencyenhancements. It is alsopossible that, in some situations, the difference in SEC is due to the quality of the product andnot due to energy efficiencies, but wherever large differences occur for similar products, it isdesirable to look deeper for the maladies.
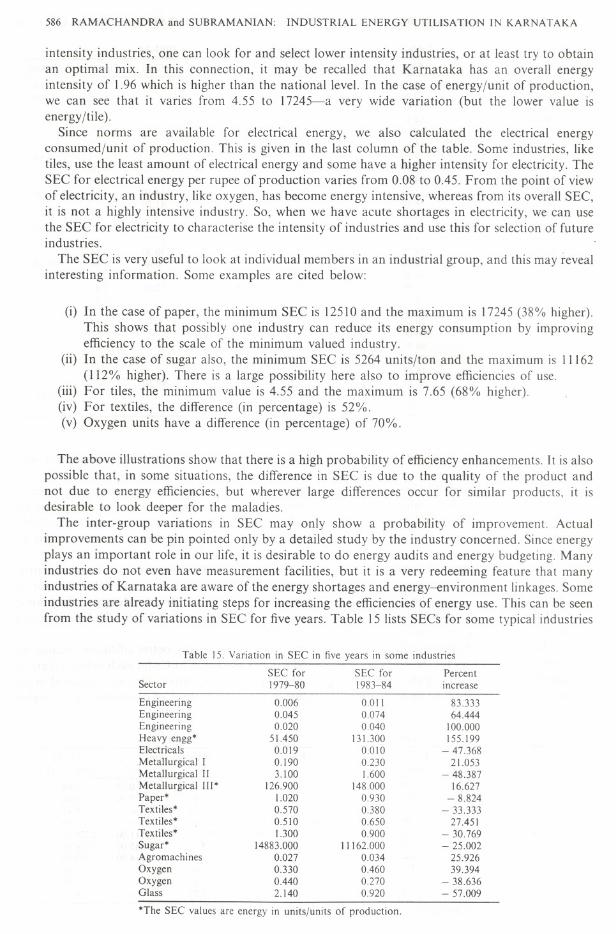
The inter-group variations in SEC may only show a probability of improvement. Actualimprovements can be pin pointed only by a detailed study by the industry concerned. Since energyplays an important role in our life, it is desirable to do energy audits and energy budgeting. Manyindustries do not even have measurement facilities, but it is a very redeeming feature that manyindustries of Karnataka are aware of the energy shortages and energy-environment linkages. Someindustries are already initiating steps for increasing the efficiencies of energy use. This can be seenfrom the study of variations in SEC for five years. Table 15 lists SECs for some typical industries
Table 15. VarIation in SEC in five years in some industrIes
SEC for SEC for PercentSector 1979-80 1983-84 increase
Engineering 0.006 0.011 83.333Engineering 0.045 0.074 64.444Engineering 0.020 0.040 100.000Heavy engg' 51.450 131.300 155.199Electricals 0.019 0.010 - 47.368Metallurgical I 0.190 0.230 21.053Metallurgical II 3.100 1.600 - 48.387Metallurgical III' 126.900 148.000 16.627Paper* 1.020 0.930 - 8.824Textiles' 0.570 0.380 - 33.333Textiles' 0.510 0.650 27.451Textiles* 1.300 0.900 - 30.769Sugar' 14883.000 11162.000 - 25.002Agromachines 0.027 0.034 25.926Oxygen 0.330 0.460 39.394Oxygen 0.440 0.270 - 38.636Glass 2.140 0.920 - 57.009
'The SEC values are energy in units/units of production.
RAMACHANDRA and SUBRAMANIAN: INDUSTRIAL ENERGY UTILISATION IN KARNATAKA 587
Table ]6. Comparison of percent electrical energy to SEC to total
Ratio of electric % ratio of SECSector energy to total for electric to total
EngineeringMetallurgical IMetallurgical IIMetallurgical III*Paper*Sugar*ChemicalsTilesOxygen
25.2064.9025.4058.108.900.50
43.902.50
100.00
36.8063.1026.0041 1013.500.50
43.60036
100.00
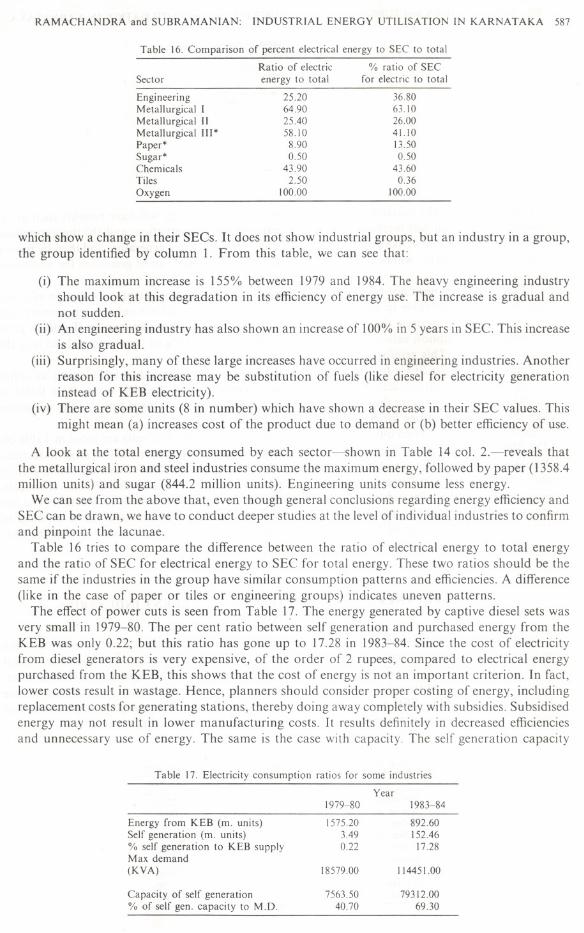
which show a change in their SECs. It does not show industrial groups, but an industry in a group,the group identified by column 1. From this table, we can see that:
(i) The maximum increase is 155% between 1979 and 1984. The heavy engineering industryshould look at this degradation in its efficiency of energy use. The increase is gradual andnot sudden.
(ii) An engineering industry has also shown an increase of 100% in 5 years in SEe. This increaseis also gradual.
(iii) Surprisingly, many of these large increases have occurred in engineering industries. Anotherreason for this increase may be substitution of fuels (like diesel for electricity generationinstead of KEB electricity).
(iv) There are some units (8 in number) which have shown a decrease in their SEC values. Thismight mean (a) increases cost of the product due to demand or (b) better efficiency of use.
A look at the total energy consumed by each sector-shown in Table 14 col. 2.-reveals thatthe metallurgical iron and steel industries consume the maximum energy, followed by paper (1358.4million units) and sugar (844.2 million units). Engineering units consume less energy.
We can see from the above that, even though general conclusions regarding energy efficiency andSEC can be drawn, we have to conduct deeper studies at the level of individual industries to confirmand pinpoint the lacunae.
Table 16 tries to compare the difference between the ratio of electrical energy to total energyand the ratio of SEC for electrical energy to SEC for total energy. These two ratios should be thesame if the industries in the group have similar consumption patterns and efficiencies. A difference(like in the case of paper or tiles or engineering groups) indicates uneven patterns.
The effect of power cuts is seen from Table 17. The energy generated by captive diesel sets wasvery small in 1979-80. The per cent ratio between self generation and purchased energy from theKEB was only 0.22; but this ratio has gone up to 17.28 in 1983-84. Since the cost of electricityfrom diesel generators is very expensive, of the order of 2 rupees, compared to electrical energypurchased from the KEB, this shows that the cost of energy is not an important criterion. In fact,lower costs result in wastage. Hence, planners should consider proper costing of energy, includingreplacement costs for generating stations, thereby doing away completely with subsidies. Subsidisedenergy may not result in lower manufacturing costs. It results definitely in decreased efficienciesand unnecessary use of energy. The same is the case with capacity. The self generation capacity
Table 17. Electricity consumption ratios for some industries
Year1979-80 1983-84
Energy from KEB (m. units) 1575.20 892.60Self generation (m. units) 3.49 152.46% self generation to KEB supply 0.22 17.28Max demand(KVA) 18579.00 114451.00
Capacity of self generation 7563.50 79312.00% of self gen. capacity to M.D. 40.70 69.30
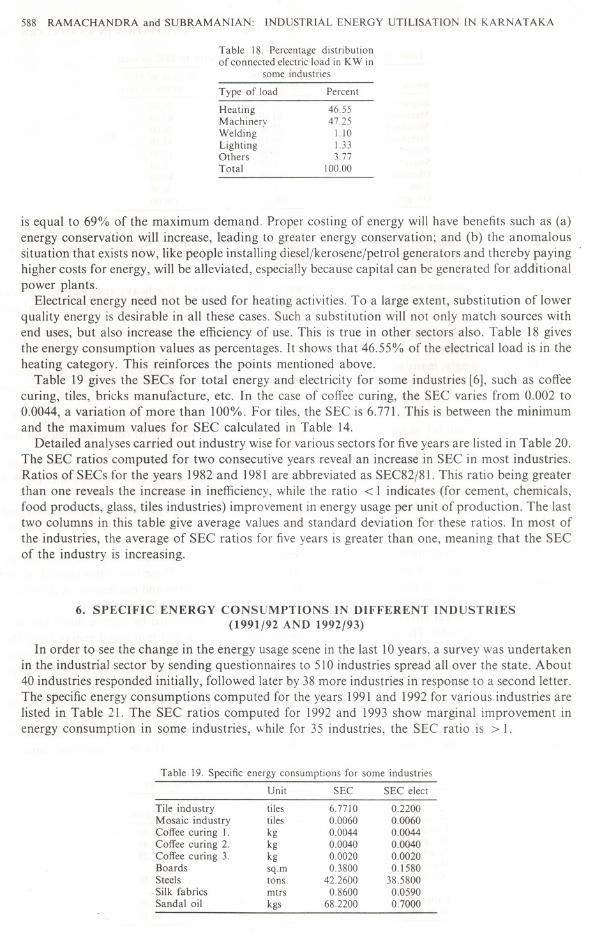
588 RAMACHANDRA and SUBRAMANIAN: INDUSTRIAL ENERGY UTILISATION IN KARNATAKA
Table 18. Percentage distributionof connected electric load in KW in
some industries
Type of load
HeatingMachineryWeldingLightingOthersTotal
Percent
46.5547.25
1.101.333.77
100.00
is equal to 69% of the maximum demand. Proper costing of energy will have benefits such as (a)energy conservation will increase, leading to greater energy conservation; and (b) the anomaloussituation that exists now, like people installing diesel/kerosene/petrol generators and thereby paying'higher costs for energy, will be alleviated, especially because capital can be generated for additionalpower plants.
Electrical energy need not be used for heating activities. To a large extent, substitution of lowerquality energy is desirable in all these cases. Such a substitution will not only match sources withend uses, but also increase the efficiency of use. This is true in other sectors also. Table 18 givesthe energy consumption values as percentages. It shows that 46.55% of the eIectricalload is in theheating category. This reinforces the points mentioned above.
Table 19 gives the SECs for total energy and electricity for some industries [6], such as coffeecuring, tiles, bricks manufacture, etc. In the case of coffee curing, the SEC varies from 0.002 to0.0044, a variation of more than 100%. For tiles, the SEC is 6.771. This is between the minimumand the maximum values for SEC calculated in Table 14.
Detailed analyses carried out industry wise for various sectors for five years are listed in Table 20.The SEC ratios computed for two consecutive years reveal an increase in SEC in most industries.Ratios ofSECs for the years 1982 and 1981 are abbreviated as SEC82/81. This ratio being greaterthan one reveals the increase in inefficiency, while the ratio < 1 indicates (for cement, chemicals,food products, glass, tiles industries) improvement in energy usage per unit of production. The lasttwo columns in this table give average values and standard deviation for these ratios. In most ofthe industries, the average of SEC ratios for five years is greater than one, meaning that the SECof the industry is increasing.
6. SPECIFIC ENERGY CONSUMPTIONS IN DIFFERENT INDUSTRIES(1991/92 AND 1992/93)
In order to see the change in the energy usage scene in the last 10years, a survey was undertakenin the industrial sector by sending questionnaires to 510 industries spread all over the state. About40 industries responded initially, followed later by 38 more industries in response to a second letter.The specific energy consumptions computed for the years 1991and 1992 for various industries arelisted in Table 21. The SEC ratios computed for 1992 and 1993 show marginal improvement inenergy consumption in some industries, while for 35 industries, the SEC ratio is > 1.
Table 19. Specific energy consumptions for some industries
Unit SEC SEC elect
Tile industry tiles 6.7710 0.2200Mosaic industry tiles 0.0060 0.0060Coffee curing I. kg 0.0044 0.0044Coffee curing 2. kg 0.0040 0.0040Coffee curing 3. kg 0.0020 0.0020Boards sq.m 0.3800 0.1580Steels tons 42.2600 38.5800
. Silk fabrics mtrs 0.8600 0.0590Sandal oil kgs 68.2200 0.7000
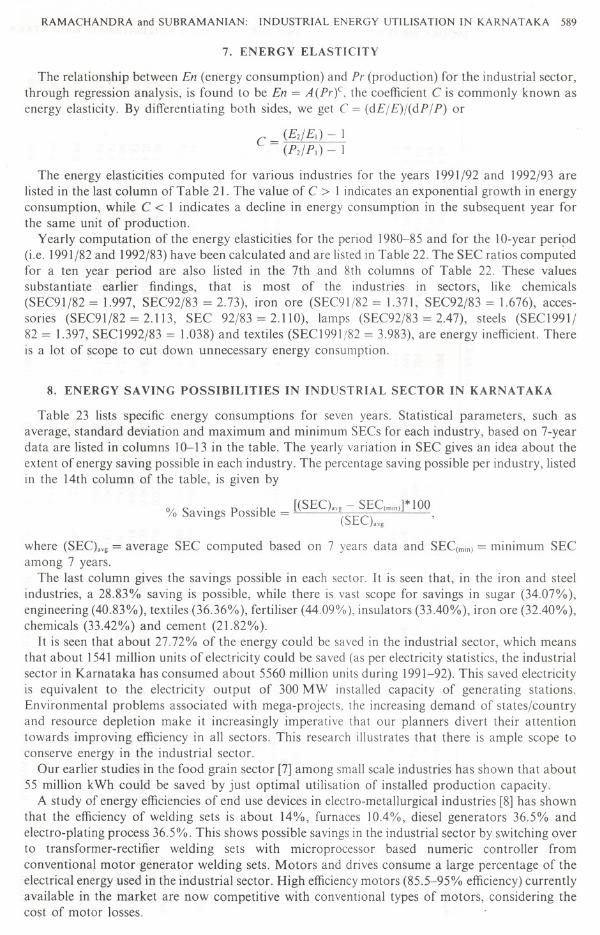
RAMACHANDRA and SUBRAMANIAN: INDUSTRIAL ENERGY UTILISATION IN KARNATAKA 589
7. ENERGY ELASTICITY
The relationship between En (energy consumption) and Pr (production) for the industrial sector,through regression analysis, is found to be En = A(Prf, the coefficient C is commonly known asenergy elasticity. By differentiating both sides, we get C = (dE/E)/(dP/P) or
C = (E2/EI)- 1(P2/P1) - 1
The energy elasticities computed for various industries for the years 1991/92 and 1992/93 arelisted in the last column of Table 21. The value of C > 1 indicates an exponential growth in energyconsumption, while C < I indicates a decline in energy consumption in the subsequent year forthe same unit of production.
Yearly computation of the energy elasticities for the period 1980-85 and for the 10-year peri9d(i.e. 1991/82and 1992/83) have been calculated and are listed in Table 22. The SEC ratios computedfor a ten year period are also listed in the 7th and 8th columns of Table 22. These valuessubstantiate earlier findings, that is most of the industries in sectors, like chemicals(SEC91/82 = 1.997, SEC92/83 = 2.73), iron ore (SEC9l/82 = 1.371, SEC92/83 = 1.676), acces-sories (SEC91/82 = 2.113, SEC 92/83 = 2.110), lamps (SEC92/83 = 2.47), steels (SECI991/82 = 1.397, SECI992/83 = 1.038) and textiles (SECI991/82 = 3.983), are energy inefficient. Thereis a lot of scope to cut down unnecessary energy consumption.
8. ENERGY SAVING POSSIBILITIES IN INDUSTRIAL SECTOR IN KARNA TAKA
Table 23 lists specific energy consumptions for seven years. Statistical parameters, such asaverage, standard deviation and maximum and minimum SECs for each industry, based on 7-yeardata are listed in columns 10-13 in the table. The yearly variation in SEC gives an idea about theextent of energy saving possible in each industry. The percentage saving possible per industry, listedin the 14th column of the table, is given by
0/ S.
P.bl - [(SEC)"g - SEC(mm)]*100
/0 avmgs OSSI e - (SEC)avg ,
where (SEC)avg= average SEC computed based on 7 years data and SEC(mi")= minimumSECamong 7 years.
The last column gives the savings possible in each sector. It is seen that, in the iron and steelindustries, a 28.83% saving is possible, while there is vast scope for savings in sugar (34.07%),engineering (40.83%), textiles (36.36%), fertiliser (44.09%), insulators (33.40%), iron ore (32.40%),chemicals (33.42%) and cement (21.82%).
It is seen that about 27.72% of the energy could be saved in the industrial sector, which meansthat about 1541million units of electricity could be saved (as per electricity statistics, the industrialsector in Karnataka has consumed about 5560 million units during 1991-92). This saved electricityis equivalent to the electricity output of 300 MW installed capacity of generating stations.Environmental problems associated with mega-projects, the increasing demand of states/countryand resource depletion make it increasingly imperative that our planners divert their attentiontowards improving efficiency in all sectors. This research illustrates that there is ample scope toconserve energy in the industrial sector.
Our earlier studies in the food grain sector [7] among small scale industries has shown that about55 million kWh could be saved by just optimal utilisation of installed production capacity.
A study of energy efficiencies of end use devices in electro-metallurgical industries [8] has shownthat the efficiency of welding sets is about 14%, furnaces 10.4%, diesel generators 36.5% andelectro-plating process 36.5%. This shows possible savings in the industrial sector by switching overto transformer-rectifier welding sets with microprocessor based numeric controller fromconventional motor generator welding sets. Motors and drives consume a large percentage of theelectrical energy used in the industrial sector. High efficiencymotors (85.5-95% efficiency)currentlyavailable in the market are now competitive with conventional types of motors, considering thecost of motor losses.
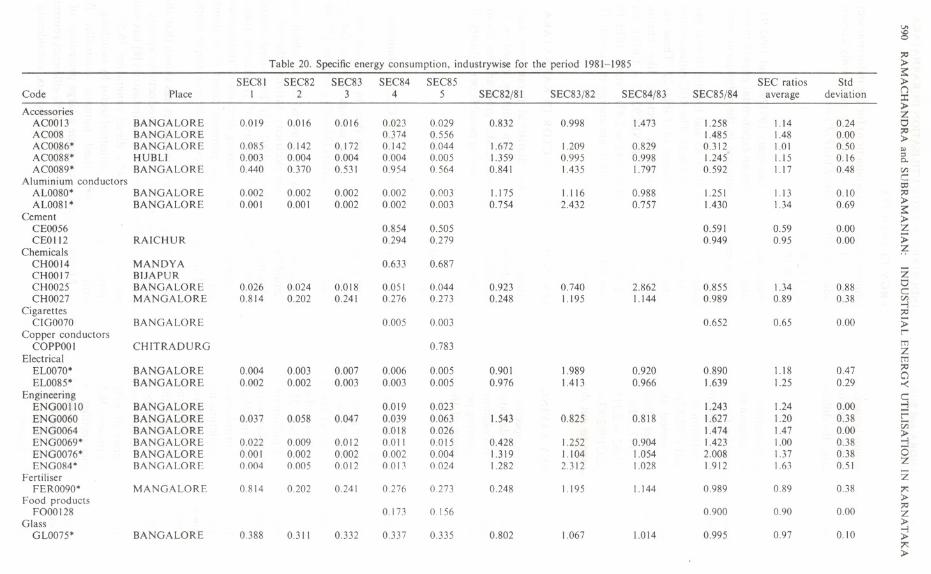
v.-c0
i"Table 20. Specific energy consumption, industrywise for the period 1981-1985 :>
SEC81 SEC82 SEC83 SEC84 SEC85 SEC ratios Std :>Code Place I 2 3 4 5 SEC82(81 SEC83(82 SEC84(83 SEC85(84 average deviation (j
::tAccessories :>
ZACOOI3 BANGALORE 0.019 0.016 0,016 0.023 0.029 0.832 0.998 1.473 1.258 1.14 0.24 0ACO08 BANGALORE 0.374 0.556 1.485 1.48 0.00 i"
:>ACO086* BANGALORE 0,085 0.142 0.172 0.142 0.044 1.672 1.209 0.829 0.312 1.0I 0.50 '"ACO088* HUBLI 0.003 0.004 0.004 0.004 0.005 1.359 0.995 0.998 1.245 1.15 0.16 ::s
0-ACO089* BANGALORE 0.440 0.370 0.531 0.954 0.564 0.841 1.435 1.797 0.592 1.17 0.48 (.11
Aluminium conductors c:::C'
ALO080. BANGALORE 0.002 0.002 0.002 0.002 0.003 1.175 1.116 0.988 1.251 1.13 0.]0 i"ALO081. BANGALORE 0.001 0.001 0.002 0.002 0.003 0.754 2.432 0.757 1.430 1.34 0.69 :>
Cement :>CEOO56 0.854 0.505 0.591 0.59 0.00 ZCEOl12 RAICHUR 0.294 0.279 0.949 0.95 0.00 :>
ChemicalsCHOOl4 MANDYA 0.633 0.687
ZCHOO!7 BIJAPURCHO025 BANGALORE 0.026 0.024 0.018 0.051 0.044 0.923 0.740 2.862 0.855 1.34 0.88 0
c:::CHO027 MANGALORE 0.814 0.202 0.241 0.276 0273 0.248 1.195 1.144 0.989 0.89 0.38 (.11
Cigarettes-ii"
CIGO070 BANGALORE 0.005 0.003 0.652 0.65 0.00 :>Copper conductors t""
COPPOOI CHITRADURG 0.783 {'T'IZ
Electrical {'T'IELO070. BANGALORE 0.004 0.003 0.007 0,006 0.005 0.901 1.989 0.920 0.890 1.18 0.47 i"
aELO085. BANGALORE 0.002 0.002 0.003 0.003 0.005 0.976 1.413 0.966 1.639 1.25 0.29 -<
Engineering c:::ENGOOIIO BANGALORE 0.019 0.023 1.243 1.24 0.00 -iENGO060 BANGALORE 0.037 0.058 0.047 0.039 0.063 1.543 0.825 0.818 1.627 1.20 0.38 t=
CiiENGOO64 BANGALORE 0.018 0.026 1.474 1.47 0.00 :>ENGO069* BANGALORE 0.022 0.009 0.012 0.011 0.015 0.428 1.252 0.904 1.423 1.00 0.38 -iENGO076. BANGALORE 0.001 0.002 0.002 0.002 0.004 1.319 1.104 1.054 2.008 1.37 0.38 0ENG084. BANGALORE 0.004 0.005 0.012 0.013 0.024 1.282 2.312 1.028 1.912 1.63 0.51 Z
Fertiliser ZFERO090* MANGALORE 0.814 0.202 0.241 0.276 0.273 0.248 1.195 1.144 0.989 0.89 0.38 ;><:
Food products :>i"FOOOl28 0.173 0.156 0.900 0.90 0.00 Z
Glass :>GLO075. BANGALORE 0.388 0.311 0.332 0.337 0.335 0.802 1.067 1.014 0.995 0.97 0.10 -i
:>;><::>
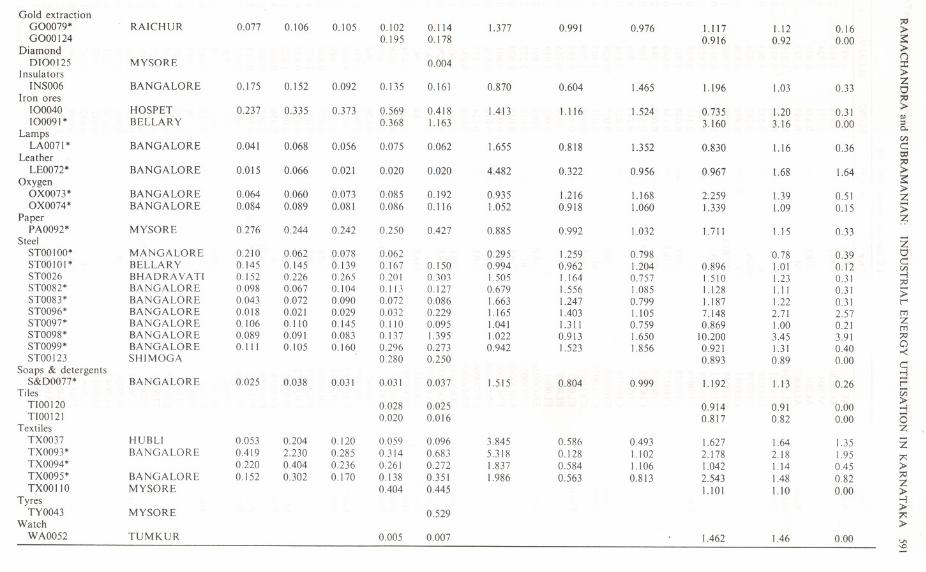
Gold extraction '"GOO079* RAICHUR 0.077 0.106 0.105 0.102 0.114 1.377 0.991 0.976 1.117 1.12 0.16 ;I>GOOOl24 0.195 0.178 0.916 0.92 0.00
Diamond ;I>n
0100125 MYSORE 0.004 ::r:Insulators ;I>
ZINSO06 BANGALORE 0.175 0.152 0.092 0.135 0.161 0.870 0.604 1.465 1.196 1.03 0.33 0Iron ores '"
100040 HOSPET 0.237 0.335 0.373 0.569 0.418 1.413 1.116 1.524 0.735 1.20 0.31;I>.,
100091 * BELLAR Y 0.368 1.163 3.160 3.16 0.00 ::!0.Lamps C/)
LAO071* BANGALORE 0.041 0.068 0.056 0.075 0.062 1.655 0.818 1.352 0.830 1.16 0.36 c::OJLeather '"
LEOO72* BANGALORE 0.015 0.066 0.021 0.020 0.020 4.482 0.322 0.956 0.967 1.68 1.64 ;I>Oxygen a::
;I>OXO073* BANGALORE 0.064 0.060 0.073 0.085 0.]92 0.935 1.216 1.168 2.259 1.39 0.51 ZOXO074* BANGALORE 0.084 0.089 0.081 0.086 0.116 1.052 0.918 1.060 1.339 1.09 0.15 ;;
PaperPAO092* MYSORE 0.276 0.244 0.242 0.250 0.427 0.885 0.992 1.032 1.711 1.15 0.33
Steel ZSTOOIOO* MANGALORE 0.210 0.062 0.078 0.062 0.295 1.259 0.798 0.78 0.39 0
c::STOOIOI* BELLARY 0.145 0.145 0.139 0.167 0.150 0.994 0.962 1.204 0.896 1.0I 0.12 C/)STO026 BHADRAVATI 0.152 0226 0.265 0.201 0.303 1.505 1.164 0.757 1.510 1.23 0.31 ...,
'"STO082* BANGALORE 0.098 0.067 0.104 0.113 0.127 0.679 1.556 1.085 1.128 1.11 0.31 ;;STO083* BANGALORE 0.043 0.072 0.090 0.072 0.086 1.663 1.247 0.799 1.187 1.22 0.31 r'STO096* BANGALORE 0.018 0.021 0.029 0.032 0.229 1.165 1.403 1.105 7.148 2.71 2.57 mSTO097* BANGALORE 0.106 0.110 0.145 0.110 0.095 1.041 1.311 0.759 0.869 1.00 0.21 Z
mSTO098* BANGALORE 0.089 0.091 0.083 0.137 1.395 1.022 0.913 1.650 10.200 3.45 3.91 '"STO099* BANGALORE 0.111 0.105 0.160 0.296 0.273 0.942 1.523 1.856 0.921 1.31 0.40 Q
-<STOOl23 SHIMOGA 0.280 0.250 0.893 0.89 0.00 c::
Soaps & detergents ::jS&DOO77* BANGALORE 0.025 0.038 0.031 0.031 0.037 1.515 0.804 0.999 1.192 1.13 0.26 r'
Tiles u;;I>TIO0120 0.028 0.025 0.914 0.91 0.00 ...,
TlOOl21 0.020 0.016 0.817 0.82 0.00 (5Textiles Z
TXO037 HUBLI 0.053 0.204 0.120 0.059 0.096 3.845 0.586 0.493 1.627 1.64 1.35 ZTXO093* BANGALORE 0.419 2.230 0.285 0.314 0.683 5.318 0.128 1.102 2.178 2.18 1.95 ;>::TXO094* 0.220 0.404 0.236 0.261 0.272 1.837 0.584 1.106 1.042 1.14 0.45 ;I>TXO095* BANGALORE 0.152 0.302 0.170 0.138 0.351 1.986 0.563 0.813 2.543 1.48 0.82 '"
ZTXOOIIO MYSORE 0.404 0.445 1.101 1.10 0.00 ;I>Tyres ...,
;I>TYO043 MYSORE 0.529 ;>::Watch ;I>
WAO052 TUMKUR 0.005 0.007 1.462 1.46 0.00 v.
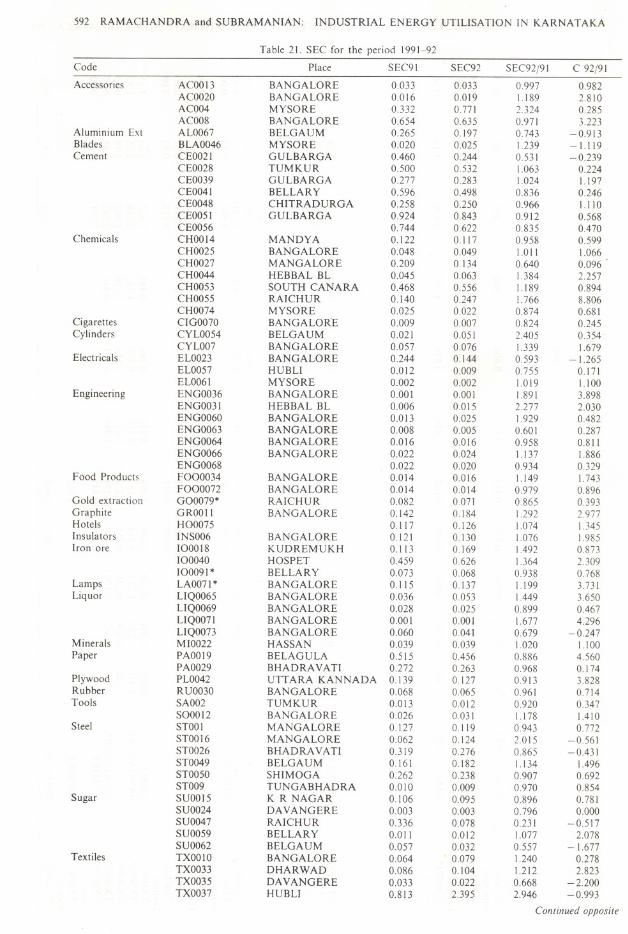
592 RAMACHANDRA and SUBRAMANIAN: INDUSTRIAL ENERGY UTILISATION IN KARNATAKA
Table 21. SEC for the period 1991-92Code Place SEC91 SEC92 SEC92/91 C 92/91Accessories ACOOI3 BANGALORE 0.033 0.033 0.997 0.982
ACO020 BANGALORE 0.016 0.019 1.189 2.810ACO04 MYSORE 0.332 0771 2324 0.285ACO08 BANGALORE 0.654 0.635 0.971 3.223
Aluminium Ext ALO067 BELGAUM 0.265 0.197 0.743 -0.913Blades BLAO046 MYSORE 0.020 0.025 1.239 -1.l19Cement CEO021 GULBARGA 0.460 0.244 0.531 -0.239
CEO028 TUMKUR 0.500 0532 1.063 0.224CEO039 GULBARGA 0277 0.283 1.024 1.197CEO041 BELLAR Y 0.596 0.498 0.836 0.246CEO048 CHITRADURGA 0.258 0.250 0.966 1.110CEO051 GULBARGA 0.924 0.843 0.912 0.568CEO056 0.744 0.622 0.835 0.470
Chemicals CHOOl4 MANDYA 0.122 0.117 0958 0.599CHO025 BANGALORE 0.048 0.049 1.011 1.066CHO027 MANGALORE 0.209 0.134 0.640 0.096 .CHOO44 HEBBAL BL 0.045 0.063 1.384 2.257CHO053 SOUTH CANARA 0.468 0.556 1.189 0.894CHO055 RAICHUR 0.140 0.247 1.766 8.806CHO074 MYSORE 0.025 0.022 0.874 0.681
Cigarettes CIGO070 BANGALORE 0.009 0.007 0.824 0.245Cylinders CYLO054 BELGAUM 0.021 0.051 2.405 0.354
CYLO07 BANGALORE 0.057 0.076 1.339 1.679Electricals ELO023 BANGALORE 0.244 0.144 0.593 -1.265
ELO057 HUBLl 0.012 0.009 0.755 0.171ELO061 MYSORE 0.002 0.002 1.019 1.100
Engineering ENGO036 BANGALORE 0.001 0.001 1.891 3.898ENGO031 HEBBAL BL 0.006 0.015 2.277 2.030ENGO060 BANGALORE 0.013 0.025 1.929 0.482ENGO063 BANGALORE 0.008 0.005 0.601 0.287ENGOO64 BANGALORE 0.016 0.016 0.958 0.811ENGOO66 BANGALORE 0.022 0.024 1.137 1.886ENGO068 0.022 0.020 0.934 0.329
Food Products FOOO034 BANGALORE 0.014 0.016 1.149 1.743FOOOO72 BANGALORE 0.014 0.014 0.979 0.896
Gold extraction GOO079* RAICHUR 0.082 0.071 0.865 0.393Graphite GROOII BANGALORE 0.142 0.184 1.292 2977Hotels HOO075 0.117 0.126 1.074 1.345Insulators INSO06 BANGALORE 0.121 0.130 1.076 1.985Iron ore 100018 KUDREMUKH 0.113 0.169 1.492 0.873
100040 HOSPET 0.459 0.626 1.364 2.309100091* BELLARY 0.073 0.068 0.938 0768
Lamps LAOO7l* BANGALORE 0.115 0.137 1 199 3.731Liquor LlQO065 BANGALORE 0.036 0.053 1.449 3.650
LlQO069 BANGALORE 0.028 0.025 0.899 0.467LlQO071 BANGALORE 0.001 0.001 1.677 4.296LlQO073 BANGALORE 0.060 0.041 0.679 -0.247
Minerals MIO022 HASSAN 0.039 0.039 1.020 1.100Paper PAOOl9 BELAGULA 0.515 0.456 0.886 4.560
PAO029 BHADRAVATI 0.272 0263 0.968 0.174Plywood PLO042 UTTARA KANNADA 0.139 0127 0913 3.828Rubber RUO030 BANGALORE 0.068 0.065 0961 0.714Tools SAO02 TUMKUR 0.013 0.012 0.920 0.347
SOOOl2 BANGALORE 0.026 0.031 1.178 1.410Steel STOOl MANGALORE 0.127 0.119 0.943 0.772
STOOl6 MANGALORE 0.062 0.124 2.015 -0.561STO026 BHADRAVATI 0.319 0.276 0.865 -0.431STO049 BELGAUM 0.161 0.182 1.134 1.496STO050 SHIMOGA 0.262 0238 0.907 0.692STO09 TUNGABHADRA 0.010 0.009 0.970 0.854
Sugar SUOOl5 K R NAGAR 0.106 0.095 0.896 0.781SUO024 DAVANGERE 0.003 0.003 0.796 0.000SUO047 RAICHUR 0.336 0.078 0.231 -0.517SUO059 BELLAR Y 0.011 0.012 1.077 2.078SUO062 BELGAUM 0.057 0.032 0.557 -1.677
Textiles TXOOIO BANGALORE 0.064 0.079 1.240 0.278TXO033 DHARWAD 0.086 0.104 1.212 2.823TXO035 DAVANGERE 0.033 0.022 0.668 - 2.200TXO037 HUBLI 0.813 2.395 2.946 -0.993
Continued opposite
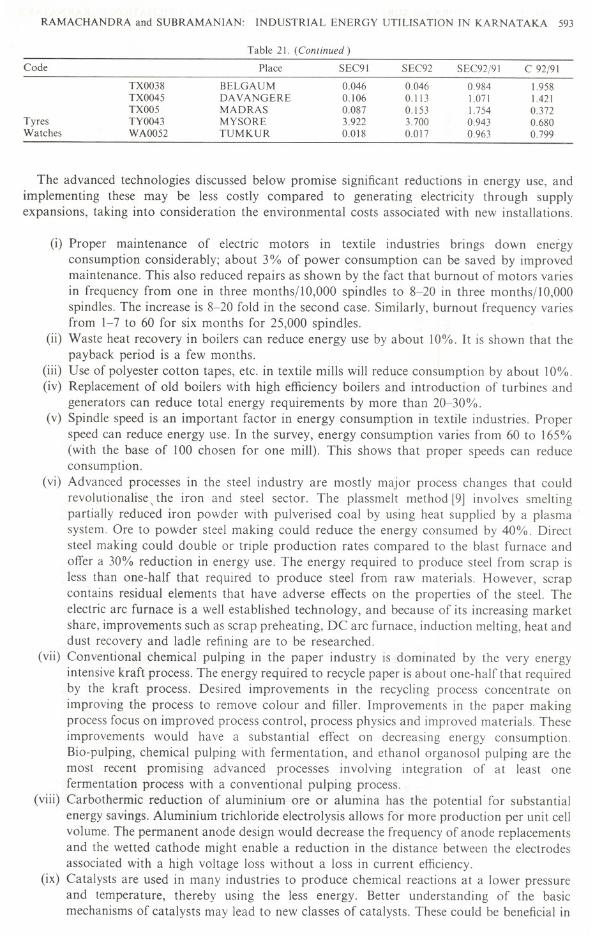
RAMACHANDRA and SUBRAMANIAN: INDUSTRIAL ENERGY UTILISATION IN KARNATAKA 593
Code
TyresWatches
The advanced technologies discussed below promise significant reductions in energy use, andimplementing these may be less costly compared to generating electricity through supplyexpansions, taking into consideration the environmental costs associated with new installations.
(i) Proper maintenance of electric motors in textile industries brings down energyconsumption considerably; about 3% of power consumption can be saved by improvedmaintenance. This also reduced repairs as shown by the fact that burnout of motors variesin frequency from one in three monthsjlO,OOOspindles to 8-20 in three monthsjlO,OOOspindles. The increase is 8-20 fold in the second case. Similarly, burnout frequency variesfrom 1-7 to 60 for six months for 25,000 spindles.
(ii) Waste heat recovery in boilers can reduce energy use by about 10%. It is shown that thepayback period is a few months.
(iii) Use of polyester cotton tapes, etc. in textile mills will reduce consumption by about 10%.(iv) Replacement of old boilers with high efficiency boilers and introduction of turbines and
generators can reduce total energy requirements by more than 20--30%.(v) Spindle speed is an important factor in energy consumption in textile industries. Proper
speed can reduce energy use. In the survey, energy consumption varies from 60 to 165%(with the base of 100 chosen for one mill). This shows that proper speeds can reduceconsumption.
(vi) Advanced processes in the steel industry are mostly major process changes that couldrevolutionalise, the iron and steel sector. The plassmelt method [9] involves smeltingpartially reduced iron powder with pulverised coal by using heat supplied by a plasmasystem. Ore to powder steel making could reduce the energy consumed by 40%. Directsteel making could double or triple production rates compared to the blast furnace andoffer a 30% reduction in energy use. The energy required to produce steel from scrap isless than one-half that required to produce steel from raw materials. However, scrapcontains residual elements that have adverse effects on the properties of the steel. Theelectric arc furnace is a well established technology, and because of its increasing marketshare, improvements such as scrap preheating, DC arc furnace, induction melting, heat anddust recovery and ladle refining are to be researched.
(vii) Conventional chemical pulping in the paper industry is dominated by the very energyintensive kraft process. The energy required to recycle paper is about one-half that requiredby the kraft process. Desired improvements in the recycling process concentrate onimproving the process to remove colour and filler. Improvements in the paper makingprocess focus on improved process control, process physics and improved materials. Theseimprovements would have a substantial effect on decreasing energy consumption.Bio-pulping, chemical pulping with fermentation, and ethanol organosol pulping are themost recent promising advanced processes involving integration of at least onefermentation process with a conventional pulping process.
(viii) Carbothermic reduction of aluminium ore or alumina has the potential for substantialenergy savings. Aluminium trichloride electrolysis allows for more production per unit cellvolume. The permanent anode design would decrease the frequency of anode replacementsand the wetted cathode might enable a reduction in the distance between the electrodesassociated with a high voltage loss without a loss in current efficiency.
(ix) Catalysts are used in many industries to produce chemical reactions at a lower pressureand temperature, thereby using the less energy. Better understanding of the basicmechanisms of catalysts may lead to new classes of catalysts. These could be beneficial in
Table 21. (Continued)
Place SEC91 SEC92 SEC92/91 C 92/91
TXO038 BELGAUM 0.046 0.046 0.984 1.958TXO045 DAVANGERE 0.106 0.113 1.071 1.421TXO05 MADRAS 0.087 0.153 1.754 0.372TYO043 MYSORE 3.922 3.700 0.943 0.680WAO052 TUMKUR 0.018 0.017 0.963 0.799
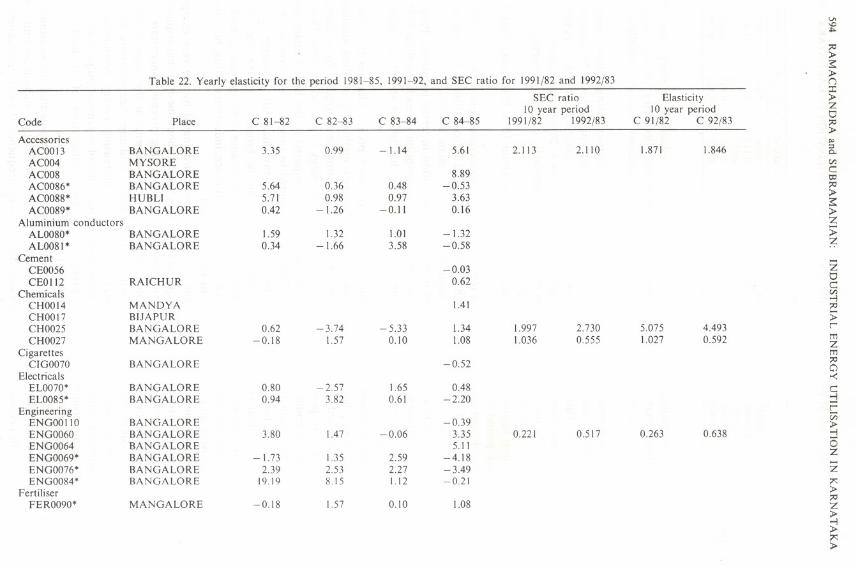
V>'-D.I>-
;:tI>-
3:Table 22. Yearly elasticity for the period 1981-85, 1991-92, and SEC ratio for 1991/82 and 1992/83
>-n::c
SEC ratio Elasticity >-
10 year period 10 year periodZ0
Code Place C 81-82 C 82-83 C 83-84 C 84-85 1991/82 1992/83 C 91/82 C 92/83 ;:tI>-
Accessories .,ACOOl3 BANGALORE 3.35 0.99 -1.14 5.61 2.113 2.110 1.871 1.846 ::30-ACO04 MYSORE C/J
ACO08 BANGALORE 8.89 Ct:t'
ACO086* BANGALORE 5.64 0.36 0.48 -0.53 ;:tI
ACO088* HUBL! 5.71 0.98 0.97 3.63 >-3:
ACO089* BANGALORE 0.42 -1.26 -0.11 0.16 >-Aluminium conductors Z
ALO080* BANGALORE 1.59 1.32 1.01 - 1.32 ;;ALO081* BANGALORE 0.34 -1.66 3.58 -0.58 ?;.
Cement ZCEO056 -0.03CEOl12 RAICHUR 0.62 0
CChemicals C/J
CHOOl4 MANDY A 1.41...,;:tI
CHOOl7 BIJAPUR ;;CHO025 BANGALORE 0.62 -3.74 -5.33 1.34 1.997 2.730 5.075 4.493 r-CHO027 MANGALORE -0.18 1.57 0.10 1.08 1.036 0.555 1.027 0.592 tT1
ZCigarettes tT1
CIGO070 BANGALORE -0.52 ;:tICJ
Electricals -<ELO070* BANGALORE 0.80 -2.57 1.65 0.48 c::ELO085* BANGALORE 0.94 3.82 0.61 -2.20 :j
Engineering CENGOOIIO BANGALORE -0.39 C/J
>-ENGO060 BANGALORE 3.80 1.47 -0.06 3.35 0.221 0.517 0.263 0.638 ...,
ENGO064 BANGALORE 5.11 (3ENGO069* BANGALORE - 1.73 1.35 2.59 -4.18
Z
ENGO076* BANGALORE 2.39 2.53 2.27 -3.49 ZENGO084* BANGALORE 19.19 8.15 1.12 -0.21 (":
Fertiliser >-
FERO090* MANGALORE -0.18 1.57 0.10 1.08;:tIZ>-...,>-(":>-
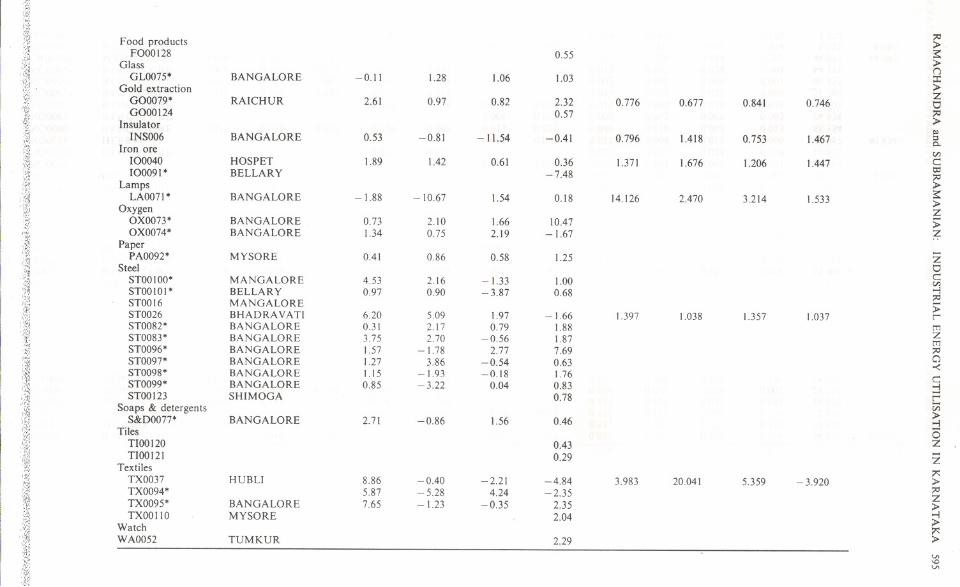
Food productsFOOOl28
GlassGLO075*
Gold extractionGOO079*GOOOl24
InsulatorINSO06
Iron ore100040100091 *
LampsLAO071*
OxygenOXO073*OXO074*
PaperPAOOn*
SteelSTOOIOO*STOO 10 I *
STOOl6STO026STO082*STO083*STO096*STO097*STO098*STO099*STOOl23
Soaps & detergentsS&OOO77*
TilesTIO0120TIO0121
TextilesTXO037TXO094*TXO095*TXOOIIO
WatchWAO052
, BANGALORE
RAICHUR
BANGALORE
HOSPETBELLAR Y
BANGALORE
BANGALOREBANGALORE
MYSORE
MANGALOREBELLARYMANGALOREBHAORAVATIBANGALOREBANGALOREBANGALOREBANGALOREBANGALOREBANGALORESHIMOGA
BANGALORE
HUBLI
BANGALOREMYSORE
TUMK UR
-0.11
2.61
0.53
1.89
- 1.88
0.731.34
0.41
4.530.97
6.200.313.751.571.271.150.85
2.71
8.865.877.65
1.28
0.97
-0.81
1.42
-10.67
2.100.75
0.86
2.160.90
5.092.172.70
- 1.783.86
- 1.93-3.22
-0.86
-0.40-5.28- 1.23
1.06
0.82
- 11.54
0.61
1.54
1.662.19
0.58
- 1.33-3.87
1.970.79
-0.562.77
-0.54-0.18
0.04
1.56
-2.214.24
-0.35
0.55
1.03
2.320.57
-0.41
0.36-7.48
0.18
10.47- 1.67
1.25
1.000.68
- 1.661.881.877.690.631.760.830.78
0.46
0.430.29
-4.84-2.35
2.352.04
2.29
0.776
0.796
1.371
14.126
1.397
3.983
0.677
1.418
1.676
2.470
1.038
20.041
0.841
0.753
1.206
3.214
1.357
5.359
0.746
::tI;I>~;I>(')::t;I>ZtJ::tI;I>~::s0..enc:::tX:I::tI;I>~;I>Z;;~
1.467
1.447
1.533
1.037
ZtJc:::en...,::tI:;r-tTJZtTJ::tIa-<
c:::...,
r::Vi;I>...,
0zZ«:;I>::tIZ;I>...,;I>«:;I>
- 3.920
v.'-Cv.
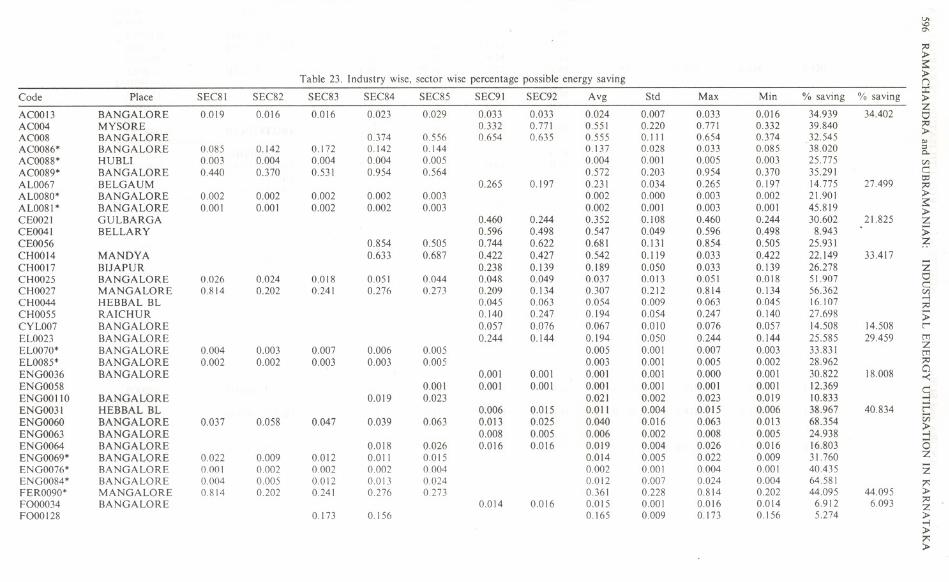
U\'>CJ0-,
iO>-$:
Table 23. Industry wise, sector wIse percentage possible energy saving>-(')
Code Place SEC81 SEC82 SEC83 SEC84 SEC85 SEC91 SEcn Avg Std Max Min % saving % saving::r:>-
0.033 0.033 0.024 0.007 0.033 0.016 34.939 34.402Z
ACOO13 BANGALORE 0.019 0.016 0.016 0.023 0.029 tJACO04 MYSORE 0.332 0.771 0.551 0.220 0.771 0.332 39.840 iOACO08 BANGALORE 0.374 0.556 0.654 0.635 0.555 0.111 0.654 0.374 32.545 >-
'"ACO086' BANGALORE 0.085 0.142 0.172 0.142 0.144 0.137 0.028 0.033 0.085 38.020 "Q.ACO088' HUBL! 0.003 0.004 0.004 0.004 0.005 0.004 0.001 0.005 0.003 25.775 f/l
ACO089' BANGALORE 0.440 0.370 0.531 0.954 0.564 0.572 0.203 0.954 0.370 35.291 c:1:0
ALO067 BELGAUM 0.265 0.197 0.231 0.034 0.265 0.197 14.775 27.499 iOALO080' BANGALORE 0.002 0.002 0.002 0.002 0.003 0.002 0.000 0.003 0.002 21.90 I >-
ALO08I' BANGALORE 0.001 0.001 0.002 0.002 0.003 0.002 0.001 0.003 0.001 45.819 $:>-
CEO021 GULBARGA 0.460 0.244 0.352 0.108 0.460 0.244 30.602 21.825 ZCEO04I BELLARY 0.596 0.498 0.547 0.049 0.596 0.498 8.943 ;;CEO056 0.854 0.505 0.744 0.622 0.681 0.131 0.854 0.505 25.931CHOOl4 MANDY A 0.633 0.687 0.422 0.427 0.542 0.119 0.033 0.422 22.149 33.417CHOOl7 BIJAPUR 0.238 0.139 0.189 0.050 0.033 0.139 26.278 ZCHO025 BANGALORE 0.026 0.024 0.018 0.051 0.044 0.048 0.049 0.037 0.013 0.051 0.018 51.907 0
c:CHO027 MANGALORE 0.814 0.202 0.241 0.276 0.273 0.209 0.134 0.307 0.212 0.814 0.134 56.362 f/l
CHOO44 HEBBAL BL 0.045 0.063 0.054 0.009 0.063 0.045 16.107 ....,iO
CHO055 RAICHUR 0.140 0.247 0.194 0.054 0.247 0.140 27.698 ;;CYLO07 BANGALORE 0.057 0.076 0.067 0.010 0.076 0.057 14.508 14.508 l'ELO023 BANGALORE 0.244 0.144 0.194 0.050 0.244 0.144 25.585 29.459 tTI
ELO070' BANGALORE 0.004 0.003 0.007 0.006 0.005 0.005 0.001 0.007 0.003 33.831 ZtTI
ELO085' BANGALORE 0.002 0.002 0.003 0.003 0.005 0.003 0.001 0.005 0.002 28.962 iOENGOO36 BANGALORE 0.001 0.001 0.001 0.001 0.000 0.001 30.822 18.008 a
-<ENGO058 0.001 0.001 0.001 0.001 0.001 0.001 0.001 12.369 c:ENGOOIIO BANGALORE 0.019 0.023 0.021 0.002 0.023 0.019 10.833 ::jENGO031 HEBBAL BL 0.006 0.015 0.011 0.004 0.015 0.006 38.967 40.834 l'ENGO060 BANGALORE 0.037 0.058 0.047 0.039 0.063 0.013 0.025 0.040 0.016 0.063 0.013 68.354 U;
>-ENGO063 BANGALORE 0.008 0.005 0.006 0.002 0.008 0.005 24.938 ....,ENGO064 BANGALORE 0.018 0.026 0.016 0.016 0.019 0.004 0.026 0.016 16.803 0ENGO069' BANGALORE 0.022 0.009 0.012 0.011 0.015 0.014 0.005 0.022 0.009 31.760 Z
ENGO076' BANGALORE 0.001 0.002 0.002 0.002 0.004 0.002 0.001 0.004 0.001 40.435 ZENGO084' BANGALORE 0.004 0.005 0.012 0.013 0.024 0.012 0.007 0.024 0.004 64581 i"FERO090' MANGALORE 0.814 0.202 0.241 0.276 0.273 0.361 0.228 0.814 0.202 44.095 44.095 >-FOOO034 BANGALORE 0.014 0.016 0.015 0.001 0.016 0.014 6.912 6.093 iO
ZFOOOl28 0.173 0.156 0.165 0.009 0.173 0.156 5.274 >-
....,>-i">-
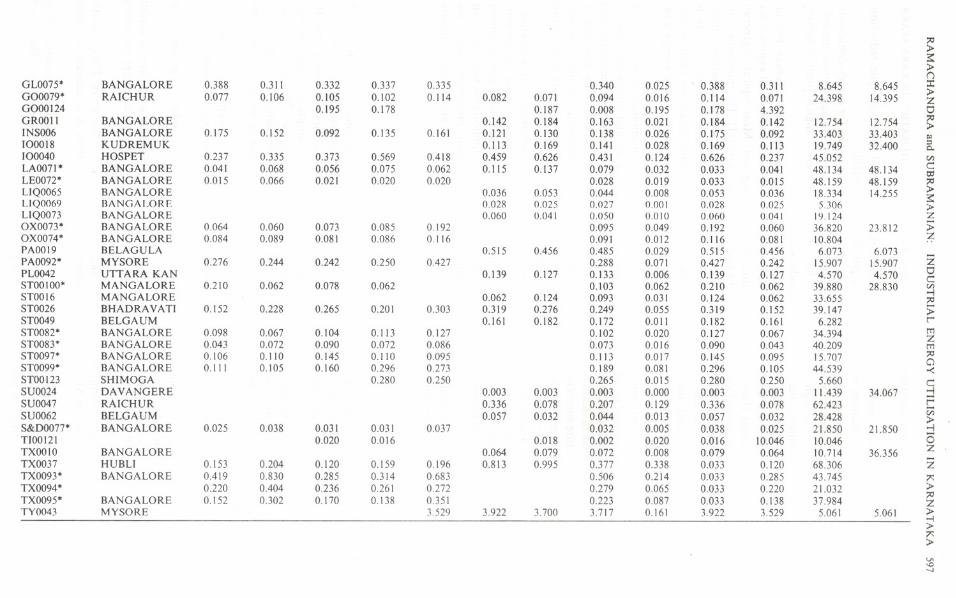
;:I:':>s:::>(j
GLO075* BANGALORE 0.388 0.311 0.332 0.337 0.335 0.340 0.025 0.388 0.311 8.645 8.645 ::c:>GO0079* RAICHUR 0.077 0.106 0.105 0.102 0.114 0.082 0.071 0.094 0.016 0.114 0.071 24.398 14.395 Z
GOool24 0.195 0.178 0.187 0.008 0.195 0.178 4.392 0GROOl1 BANGALORE 0.142 0.184 0.163 0.021 0.184 0.142 12.754 12.754 ;:I:'
:>INS006 BANGALORE 0.175 0.152 0.092 0.135 0.161 0.121 0.130 0.138 0.026 0.175 0.092 33.403 33.403 ""
100018 KUDREMUK 0.1 \3 0.169 0.141 0.028 0.169 0.113 19.749 32.400 ::s0.100040 HOSPET 0.237 0.335 0.373 0.569 0.418 0.459 0.626 0.431 0.124 0.626 0.237 45.052 enLA0071* BANGALORE 0.041 0.068 0.056 0.075 0.062 0.115 0.137 0.079 0.032 0.033 0.041 48.134 48.134 c::
c:JLEOO72* BANGALORE 0.015 0.066 0.021 0.020 0.020 0.028 0.019 0.033 0.015 48.159 48.159 ;:I:'LIQO065 BANGALORE 0.036 0.053 0.044 0.008 0.053 0.036 18.334 14.255 :>
s::LlQO069 BANGALORF. 0.02R 0.025 0.027 0.001 0.02R 0.025 5.306 :>LIQ0073 BANGALORE 0.060 0.041 0.050 0.010 0.060 0.041 19.124 ZOXO073* BANGALORE 0.064 0.060 0.073 0.085 0.192 0.095 0.049 0.192 0.060 36.820 23.812 ;;:OXO074* BANGALORE 0.084 0.089 0.081 0.086 0.116 0.091 0.012 0.116 0.081 10.804PAOOl9 BELAGULA 0.515 0.456 0.485 0.029 0.515 0.456 6.073 6.073
ZPAoo92* MYSORE 0.276 0.244 0.242 0.250 0.427 0.288 0.071 0.427 0.242 15.907 15.907PLO042 UTTARA KAN 0.139 0.127 0.133 0.006 0.139 0.127 4.570 4.570 0
c::STOOIOO* MANGALORE 0.210 0.062 0.078 0.062 0.103 0.062 0.210 0.062 39.880 28.830 enSTOO16 MANGALORE 0.062 0.124 0.093 0.031 0.124 0.062 33.655 -!
;:I:'STO026 BHADRA VATI 0.152 0.228 0.265 0.201 0.303 0.319 0.276 0.249 0.055 0.319 0.152 39.147 ;;:STO049 BELGAUM 0.161 0.182 0.172 0.011 0.182 0.161 6.282 c-STO082* BANGALORE 0.098 0.067 0.104 0.113 0.127 0.102 0.020 0.127 0.067 34.394 m
ZSTO083* BANGALORE 0.043 0.072 0.090 0.072 0.086 0.073 0.016 0.090 0.043 40.209 mSTO097* BANGALORE 0.106 0.110 0.145 0.110 0.095 0.113 0.017 0.145 0.095 15.707 ;:I:'
aSTO099* BANGALORE 0.111 0.105 0.160 0.296 0.273 0.189 0.081 0.296 0.105 44.539 -<STOOl23 SHIMOGA 0.280 0.250 0.265 0.015 0.280 0.250 5.660 c::SU0024 DAVANGERE 0.003 0.003 0.003 0.000 0.003 0.003 11.439 34.067 -!SUO047 RAICHUR 0.336 0.078 0.207 0.129 0.336 0.078 62.423 t=
c:;;SU0062 BELGA UM 0.057 0.032 0.044 0.0\3 0.057 0.032 28.428 :>S&DOO77 * BANGALORE 0.025 0.038 0.031 0.031 0.037 0.032 0.005 0.038 0.025 21.850 21.850 -!Tloo121 0.020 0.016 0.018 0.002 0.020 0.016 10.046 10.046 i5TXOOIO BANGALORE 0.064 0.079 0.072 0.008 0.079 0.064 10.714 36.356 Z
TXO037 HUBLI 0.153 0.204 0.120 0.159 0.196 0.813 0.995 0.377 0.338 0.033 0.120 68.306 ZTXO093* BANGALORE 0.419 0.830 0.285 0.314 0.683 0.506 0.214 0.033 0.285 43.745 '"TXO094* 0.220 0.404 0.236 0.261 0.272 0.279 0.065 0.033 0.220 21.032 :>
;:I:'TXO095* BANGALORE 0.152 0.302 0.170 0.138 0.351 0.223 0.087 0.033 0.138 37.984 ZTYO043 MYSORE 3.529 3.922 3.700 3.717 0.161 3.922 3.529 5.061 5.061 :>
-!:>'":>V>-J
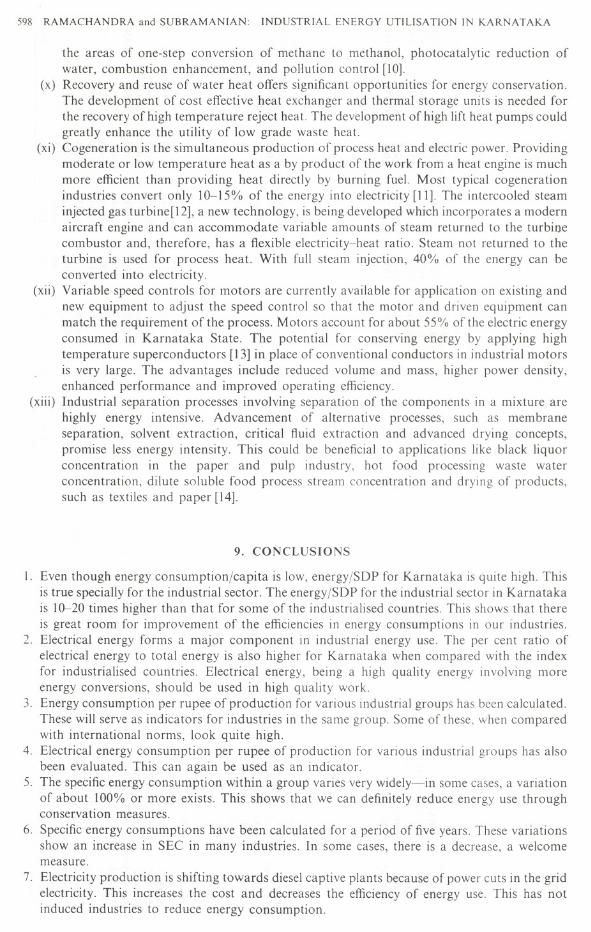
598 RAMACHANDRA and SUBRAMANIAN: INDUSTRIAL ENERGY UTILISATION IN KARNATAKA
the areas of one-step conversion of methane to methanol, photocatalytic reduction ofwater, combustion enhancement, and pollution control [10].
(x) Recovery and reuse of water heat offers significant opportunities for energy conservation.The development of cost effective heat exchanger and thermal storage units is needed forthe recovery of high temperature reject heat. The development of high lift heat pumps couldgreatly enhance the utility of low grade waste heat.
(xi) Cogeneration is the simultaneous production of process heat and electric power. Providingmoderate or low temperature heat as a by product of the work from a heat engine is muchmore efficient than providing heat directly by burning fuel. Most typical cogenerationindustries convert only 10-15% of the energy into electricity [II]. The intercooled steaminjected gas turbine[12], a new technology, is being developed which incorporates a modernaircraft engine and can accommodate variable amounts of steam returned to the turbinecombustor and, therefore, has a flexible electricity-heat ratio. Steam not returned to theturbine is used for process heat. With full steam injection, 40% of the energy can beconverted into electricity.
(xii) Variable speed controls for motors are currently available for application on existing andnew equipment to adjust the speed control so that the motor and driven equipment canmatch the requirement of the process. Motors account for about 55% of the electric energyconsumed in Karnataka State. The potential for conserving energy by applying hightemperature superconductors [13] in place of conventional conductors in industrial motorsis very large. The advantages include reduced volume and mass, higher power density,enhanced performance and improved operating efficiency.
(xiii) Industrial separation processes involving separation of the components in a mixture arehighly energy intensive. Advancement of alternative processes, such as membraneseparation, solvent extraction, critical fluid extraction and advanced drying concepts,promise less energy intensity. This could be beneficial to applications like black liquorconcentration in the paper and pulp industry, hot food processing waste waterconcentration, dilute soluble food process stream concentration and drying of products,such as textiles and paper [14].
9. CONCLUSIONS
I. Even though energy consumption/capita is low, energy/SOP for Karnataka is quite high. Thisis true specially for the industrial sector. The energy/SOP for the industrial sector in Karnatakais 10-20 times higher than that for some of the industrialised countries. This shows that thereis great room for improvement of the efficiencies in energy consumptions in our industries.
2. Electrical energy forms a major component in industrial energy use. The per cent ratio ofelectrical energy to total energy is also higher for Karnataka when compared with the indexfor industrialised countries. Electrical energy, being a high quality energy involving moreenergy conversions, should be used in high quality work.
3. Energy consumption per rupee of production for various industrial groups has been calculated.These will serve as indicators for industries in the same group. Some of these, when comparedwith international norms, look quite high.
4. Electrical energy consumption per rupee of production for various industrial groups has alsobeen evaluated. This can again be used as an indicator.
5. The specific energy consumption within a group varies very widely-in some cases, a variationof about 100% or more exists. This shows that we can definitely reduce energy use throughconservation measures.
6. Specific energy consumptions have been calculated for a period of five years. These variationsshow an increase in SEC in many industries. In some cases, there is a decrease, a welcomemeasure.
7. Electricity production is shifting towards diesel captive plants because of power cuts in the gridelectricity. This increases the cost and decreases the efficiency of energy use. This has notinduced industries to reduce energy consumption.
RAMACHANDRA and SUBRAMANIAN: INDUSTRIAL ENERGY UTILISATION IN KARNATAKA 599
8. A study of electric load patterns indicates that about 40% of the load is for heating. Hence,these can be easily converted to use other forms of energy, thereby increasing efficiencyof useand relieving the demand on electrical energy.
9. A study of electrical energy and power distribution throughout the state reveals a large spatialdisparity in energy use with most of the use being concentrated in Bangalore and one or twosingular points.
10. This study only reveals the possibilities of energy conservation. Actual measures depend onstudies in individual industrial units. Hence, energy budgeting and auditing measures in manymajor industries should be initiated. The research and development must be undertaken nowin order to make major contributions in the decades following the year 2000.
Acknowledgements-Many industries cooperated with us in the collection of this data. Without their cooperation, it wouldhave been impossible to write this article. We are happy to record our thanks to all these industries. We hope that thisexercise will encourage them to look into their energy activities and start conservation measures. The Director of Industriesand Commerce, Karnataka, Joint Directors and other officers were very helpful in our data collection work. Our thanksare due to them for their cooperation and help. We are grateful to Dr N. V. Johis and Prof. K. M. Chetty for suggestionsand many useful ideas. This work was supported by grants from the Ministry of Environment and Forests, Governmentof India.
REFERENCES
I. Schurr, S. H. and Eliasberg, V. F., Energy and Economic Growth in the United States. Resources for the Future Inc.,Washington, 1962.
2. The United Nations, Energy Statistics Yearbook. United Nations Publications, New York, 1991.3. Economic Intelligence Service, Current Energy Scene in India. Centre for Monitoring Indian Economy Pvt. Ltd.,
Bombay, India, May 1993.4.. World Population Data Sheet, Demographic Data and Estimatesfor the Countries and Regions of the World. Population
Reference Bureau Inc., Washington, 1994.5. Janosi, P. E. D. and Grayson, L. E., Journal of Development Studies, 1972,8, 241.6. Subramanian, D. K. and Ramachandra, T. V., State of Environment Report Karnataka, ed. C. J. Saldanha, 1985
pp. 107-127.7. Ramachandra, T. V. and Subramanian, D. K., Energy Policy, June 1993, 644.8. Ramachandra, T. V. and Subramanian, D. K., Energy Conversion and Management, 1991, 33, 899.9. Carlsmith, R. S., Chandler, W. D., McMohan, 1. E. and Santini, D. J., Energy Efficiency. How far can we go?
ORNLjTM-11441, Martin Marietta Energy Systems Inc., USA, 1990.10. Fulkerson, W. Fairchild, P. D. and Judkins, D. R. Energy Technology R & D: What Could Make A Difference? Part
I-Synthesis Report. ORNL-6541jVI, Oak Ridge National Laboratory, Oak Ridge, TN, 1989.II. Williams, R. H., Annual Review of Energy, 1978,3,313.12. Ross, M., Science, 1989,244,311.13. Dale, S. J., Assessment of Energy Applications of High Temperature Superconductivity: ExTended Summary Report.
Electricity Power Research Institute, Palo Alto, CA 1991.14. DOE, The DOE Industrial Energy Conservation Program: Research and Development in Separation Technology.
DOEjNBM-8002773, U.S. Department of Energy, 1987.


