Embed Size (px)
Citation preview

This article was downloaded by: [Professor Rajah Rasiah]On: 25 March 2015, At: 07:34Publisher: RoutledgeInforma Ltd Registered in England and Wales Registered Number: 1072954 Registeredoffice: Mortimer House, 37-41 Mortimer Street, London W1T 3JH, UK
Click for updates
Journal of the Asia Pacific EconomyPublication details, including instructions for authors andsubscription information:http://www.tandfonline.com/loi/rjap20
Industrialization and labour in MalaysiaRajah Rasiaha, Vicki Crinisb & Hwok-Aun Leea
a Faculty of Economics and Administration, University of Malaya,Kuala Lumpur, Malaysiab Faculty of Law, Humanities and Creative Arts, University ofWollongong, New South Wales, AustraliaPublished online: 13 Nov 2014.
To cite this article: Rajah Rasiah, Vicki Crinis & Hwok-Aun Lee (2015) Industrialization and labourin Malaysia, Journal of the Asia Pacific Economy, 20:1, 77-99, DOI: 10.1080/13547860.2014.974327
To link to this article: http://dx.doi.org/10.1080/13547860.2014.974327
PLEASE SCROLL DOWN FOR ARTICLE
Taylor & Francis makes every effort to ensure the accuracy of all the information (the“Content”) contained in the publications on our platform. However, Taylor & Francis,our agents, and our licensors make no representations or warranties whatsoever as tothe accuracy, completeness, or suitability for any purpose of the Content. Any opinionsand views expressed in this publication are the opinions and views of the authors,and are not the views of or endorsed by Taylor & Francis. The accuracy of the Contentshould not be relied upon and should be independently verified with primary sourcesof information. Taylor and Francis shall not be liable for any losses, actions, claims,proceedings, demands, costs, expenses, damages, and other liabilities whatsoever orhowsoever caused arising directly or indirectly in connection with, in relation to or arisingout of the use of the Content.
This article may be used for research, teaching, and private study purposes. Anysubstantial or systematic reproduction, redistribution, reselling, loan, sub-licensing,systematic supply, or distribution in any form to anyone is expressly forbidden. Terms &

Conditions of access and use can be found at http://www.tandfonline.com/page/terms-and-conditions
Dow
nloa
ded
by [
Prof
esso
r R
ajah
Ras
iah]
at 0
7:34
25
Mar
ch 2
015
Industrialization and labour in Malaysia
Rajah Rasiaha*, Vicki Crinisb and Hwok-Aun Leea
aFaculty of Economics and Administration, University of Malaya, Kuala Lumpur, Malaysia; bFacultyof Law, Humanities and Creative Arts, University of Wollongong, New South Wales, Australia
Although increasing globalizations spurred rapid industrialization in Malaysia, thisarticle shows that the lack of significant technological upgrading and structural changehas caused the premature plateauing of manufacturing, stemming from failures tocoordinate policies, enforce standards, sustain high productivity growth and stimulatetransition to higher value-added activities. Manufacturing as a whole has registered slowwage growth since the late 1990s, with labour markets characterized by heavy presenceof low-skilled foreign workers, increased contract labour and outsourcing and decliningworker organization. The focus on perspiration-based low-skilled foreign labour ratherthan on expanding professional and skilled labour has driven Malaysia down the lowindustrialization road. The Malaysian experience reflects a case of manufacturing’simportance and direct contribution to the economy contracting before recording highlevels of value added and sustained productivity growth, and with labour marketpractices constraining instead of facilitating positive change.
Keywords:Malaysia; manufacturing; trade; productivity; wages; industrialization
JEL Classifications: J31, J51, J61, O14, O53
1. Introduction
For a long time, Malaysia was heralded as a model of a rapidly industrializing country for
other countries to emulate (World Bank 1993). However, the lack of industrial deepening,
and the onset of negative deindustrialization since the late 1990s have cast a different
light on the Malaysian experience. The importance of manufacturing towards sustaining
economic growth and development is well established, but conditionally on continuous
productivity gains and in successful cases, on passage through positive deindustrializa-
tion. Heterodox economists identified manufacturing as the path to engender rapid growth
and structural change because of its increasing returns (Young 1928).1 Industrialization is
viewed to drive its own growth, as well as that of the other sectors, including stimulating
structural change from low value-added activities to high value-added activities and the
consequent differentiation and division of labour to provide the opportunities for generat-
ing more and better jobs. To this argument, we take a related argument that was taken up
by political economists concerned with the impact of differentiation and division of
labour on the quality of jobs created. Piore and Sabel (1984), Pyke and Sengenberger
(1992) and Zeitlin (1992) focused on the high road to industrialization. This article takes
a leaf out of this argument by examining the Malaysian experience to evaluate the propo-
sition that economies gripped by negative deindustrialization are incapable of supporting
significant improvements in wages.
The aggressive promotion of export processing zones since 1972 assisted manufactur-
ing industries in overtaking agriculture in Malaysia’s GDP in 1988 (Malaysia 1991a).
*Corresponding author. Email: [email protected]
� 2014 Taylor & Francis
Journal of the Asia Pacific Economy, 2015
Vol. 20, No. 1, 77�99, http://dx.doi.org/10.1080/13547860.2014.974327
Dow
nloa
ded
by [
Prof
esso
r R
ajah
Ras
iah]
at 0
7:34
25
Mar
ch 2
015

Foreign direct investment (FDI) helped make Malaysia a major exporter of light manufac-
tured goods. Electric�electronics, vegetable oils and fats and textiles and clothing were
among the main manufactured exports generated by the Malaysian economy since the
1990s. Import-substitution policies targeted at heavy industries from 1981 drove the
expansion of steel, transport equipment and cement manufacturing through protection,
subsidies and government capitalization (Malaysia 1986). Transport equipment in partic-
ular has continued to enjoy strong government support.
Massive inflows of FDI into the manufacturing sector also caused tightening of the
labour market by the mid-1990s (Ariff 1991; Rasiah 1995a). The focus of industrial pol-
icy shifted towards industrial deepening as the government attempted to take advantage
of low unemployment levels (which reached 2.7% in 1995) to stimulate structural change
into high value-added activities. Following the introduction of the Way Forward initiative
by the government in 1991 targeted at making Malaysia a developed economy by 2020, a
series of instruments were introduced to promote industrial deepening, alongside the
Action Plan for Industrial Technology Development (APITD) of 1990 (Malaysia, 1991a).
Unfortunately, the effectiveness of these instruments to stimulate structural change
from low to high value-added activities was attenuated by a combination of poor policy
coordination and monitoring, counterproductive labour market practices and human
resource constraints. Efforts to redistribute ownership and cultivate enterprise along eth-
nic lines have faltered, leading to both underachievement in Bumiputera participation in
manufacturing, and efficiency losses more generally. In the absence of decisive and effec-
tive policy, firms resorted to importing foreign unskilled labour to sustain their opera-
tions, which aggravated further the situation by reducing the pressure to upgrade (Rasiah
1995b; Henderson and Phillips 2007). Imports of unskilled foreign labour and failure to
stimulate upgrading technologically weakened the capacity of the manufacturing sector
to support improvements in labour productivity and wages. Furthermore, Malaysia has
sustained production substantially from extracting long work hours per week, rather than
raising productivity per hour. At the same time, declining education quality inhibits the
scope for technological absorption and innovation, while the industrial relations system
has continuously diluted over time, instead of being harnessed for dynamic and coordi-
nated gains in productivity and wages.
This article seeks to contribute to the debate on deindustrialization by showing that its
premature occurrence has restricted both improvements in labour productivity and wages
in Malaysia’s manufacturing sector. The rest of the article is organized as follows. The
next section discusses the main theoretical arguments on industrialization as an engine of
growth. Section 3 discusses the premature deindustrialization experience of Malaysia. The
subsequent section analyzes the impact of premature deindustrialization on labour produc-
tivity and wages. The final section finishes with conclusions and policy implications.
2. Theoretical considerations
The arguments on industrialization as the engine of growth and development arose largely
from the advocates of industrial policy. Smith (1776) and Young (1928) had argued inci-
sively on the capacity of industrialization to drive increasing returns activities. Veblen
(1915), Gerschenkron (1962) and Abramovitz (1956) provided evidence to argue that
successful industrializers have used industrial policy to stimulate rapid economic growth
and structural change.2 Rowthorn and Wells (1987) provided evidence to show that, as
manufacturing matures, the shift towards services has been accompanied by continued
improvements in productivity in a number of industries in the United States (positive
78 R. Rasiah et al.
Dow
nloa
ded
by [
Prof
esso
r R
ajah
Ras
iah]
at 0
7:34
25
Mar
ch 2
015

deindustrialization) while it has declined in the United Kingdom (negative
deindustrialization).
Industrialization � both the growth in share of GDP and its diversification into higher
value-added activities � has been associated with the successful development of the
Organization for Economic Cooperation and Development (OECD) countries in the ini-
tial years of rapid growth. East and Southeast Asia’s successful developers � i.e. the fly-
ing geese stock of Japan, Hong Kong, Korea, Singapore and Taiwan enjoyed rapid
industrialization throughout their high growth years (Hamilton 1983; Amsden 1989;
Wade 1990; Rodan 1989).
Attempts to discuss the importance of industrialization will not be complete without a
discussion of the trade and the structural orientation of industries that should be pro-
moted. The 1950s’ advocates of industrial development recommended a focus on inward-
oriented heavy and capital goods as an integral part of final consumption goods
manufacturing. Advocates of this approach argue that the department two goods (capital
goods) are critical complementary inputs for the development of other industries (Kalecki
1976; McFarlane 1981). Britain, United States, Germany, Japan, South Korea and Taiwan
very much enjoyed the development of both light manufacturing and complementary
heavy industries, thereby making them versatile in entering a wide range of final goods
industries. Yet, light manufacturing goods such as textiles and garments also grew rapidly
in these countries. Because the expansion of these industries did not raise substantially the
material living conditions of the masses, Adam (1975, 102) referred to them as ‘banana
republics that become pyjama republics’.
The focus on heavy industries behind import-substitution � in both large and small
domestic markets � foundered in many countries because of failure to attain economies
of scale and prevalence of clientelist approaches that removed competitive pressures and
negated the translation of subsidies and grants into productive rents that drive firm-level
technological catch-up. For example, poorly coordinated and corrupt import-substitution
policies failed in Indonesia, the Philippines and in many Latin American countries
(Rasiah 2010; Ofreneo 2008; Jenkins 1987; Evans 1997; Cardoso 2001).
However, Korea managed to achieve international competitiveness in the heavy
industries of steel, shipbuilding and cars, and machinery and steel by using import-substi-
tution for export promotion, while Taiwan managed to achieve competitiveness in
machinery and metals, and electronics through deliberate promotional strategies and
effective appraisal mechanisms (Amsden 1989; Fransman 1986; Amsden and Chu 2003).
Governments in these countries enjoyed autonomy from clientelist groups to enforce
stringent performance conditions on the manufacturers (Khan 1989). Hence, it can be
argued that strategic industrial policy a la the Northeast Asian models have been success-
ful. South Korea and Taiwan have also experienced a contraction in manufacturing’s con-
tribution to GDP with a trend expansion in services while manufacturing productivity has
continued to rise, consistent with positive deindustrialization.
3. Premature plateauing of manufacturing
Although Malaysia has undergone considerable structural change, we present four argu-
ments to support our claim that Malaysia has begun facing premature deindustrialization.
First, the contribution of the manufacturing sector to GDP has started to contract since
2000, which has taken place when Malaysia’s GDP per capita is still entrenched among
upper middle-income countries. Second, the springboard of manufacturing growth, i.e.
the light export-oriented electric�electronics and textile�garment industries, has faced a
Journal of the Asia Pacific Economy 79
Dow
nloa
ded
by [
Prof
esso
r R
ajah
Ras
iah]
at 0
7:34
25
Mar
ch 2
015

slowdown over the period 2000�2010. Third, the import-substituting automobile industry
that was promoted through heavy protection from 1981 has also begun contracting.
Fourth, Malaysia’s leading export-oriented manufacturing sectors have been continuously
facing a downward slide in revealed comparative advantage.
Manufacturing enjoyed double-digit annual average growth since 1971 to overtake
agriculture to become the leading propeller of GDP among the primary and secondary
sectors in 1988 (see Rasiah 1995a). The swiftest growth in manufacturing was achieved
over the period 1971�1994. However, average annual manufacturing growth fell from
11.7% in 1990�1994 to 5.9% in 1995�1999, 4.8% in 2000�2004 and 2.6% in
2005�2010 (see Table 1).
In contrast, the services sector recorded the largest expansion as its share in GDP grew
from 31.6% in 1990 to 48.5% in 2010 (see Table 2). However, because the inter-sectoral
dynamics of structural change has not evolved sufficiently well and with manufacturing
value-added growth slowing down since 2000 before a structural shift to high value-
added activities, the expansion in services is unlikely to produce the complimentary
impact of driving GDP growth. Apart from investment forays into infrastructure,
Table 1. Sectoral GDP growth, Malaysia, 1990�2010.
Sectors 1990�1994 1995�1999 2000�2004 2005�2010
Agriculture 0.4 0.7 3.3 2.7
Mining 2.7 3.0 3.2 ¡1.7
Manufacturing 11.7 5.9 4.5 2.6
Electricity, gas and water 14.9 4.8 5.4 4.3
Construction 13.0 ¡1.7 1.6 4.9
Trade 12.8 3.8 4.2 8.4
Transport and communication 11.4 5.7 5.6 6.2
Financea 16.0 9.6 5.9 8.2
Public administration 5.7 4.5 5.8 6.6
Othersb 10.6 4.9 4.1 2.3
GDP 9.4 3.8 4.6 4.4
Note: arefers to finance, insurance, real estate and business services; brefers to community, social and personalservices, producers of private non-profit services and domestic services of households including owner-occupieddwellings.Source: ADB (2010).
Table 2. Structure of GDP, Malaysia, 1970�2010 (%).
Sectors 1970 1975 1980 1985 1990 1995 2000 2005 2010
Agriculture 29.0 27.7 22.9 20.8 15.2 12.9 8.6 8.4 10.4
Mining 13.7 4.6 10.1 10.5 11.8 6.2 10.6 14.4 10.9
Manufacturing 13.9 16.4 19.6 19.7 24.2 26.4 30.9 29.6 24.6
Construction 3.5 3.8 4.6 4.8 3.5 4.5 3.4 2.7 3.3
Utilities 0.3 2.5 2.7 0.7 2.8 3.1 2.5 2.4 2.3
Services 39.6 45 40.1 43.5 42.5 46.9 44.0 42.5 48.5
GDP 100 100 100 100 100 100 100 100 100
Source: Malaysia (1971�2011).
80 R. Rasiah et al.
Dow
nloa
ded
by [
Prof
esso
r R
ajah
Ras
iah]
at 0
7:34
25
Mar
ch 2
015

telecommunications and banking services development abroad, the services are yet to
become a major foreign exchange earner.
Similarly, the contribution of manufacturing, which had risen from 24.2% in 1990 to
30.9% in 2000, fell to 24.6% in 2010 (see Table 2). The evidence obviously shows a
declining trend in the relative contribution of manufacturing to Malaysia’s GDP growth
since 2000. In addition, a shift is observed in the share of agriculture, which fell in signifi-
cance from the 1960s until 2005 (Osman, Pazim, and Rasiah 2011), has begun to rise
again from 8.4% in 2005 to 10.4% in 2010.
From its 60% contribution in 1957 (Osman, Pazim, and Rasiah 2011), agriculture
remained the main employment generator in Malaysia until around 1990 when services
took over as the lead job creator (see Table 3). Manufacturing surpassed agriculture
around 1995 to become the next leading employment creator in Malaysia, but its overall
contribution has started to fall from 2005. The infusion of foreign unskilled labour into
manufacturing helped raise the share of employment in manufacturing, which rose signif-
icantly to 28.7% in 2005 before falling slightly to 28.3% in 2010.
Rapid inter-sectoral structural change also took place with exports. Agriculture
accounted for 57% of Malaysian exports in 1970 but its share in total exports fell dramati-
cally since to reach a trough of 3.7% in 2000, before rising again to 10.8% in 2010 (see
Table 4). Manufactured exports enjoyed the biggest expansion rising from 11.1% of total
exports in 1970 to reach its peak of 90.1% in 2000 before falling to 76.2% in 2010. The
relative slowdown in manufacturing has allowed the agriculture and mining sectors
together to increase their share in total exports from 9.8% in 2000 to 23.3% in 2010.
Table 3. Sectoral employment structure (%), Malaysia, 1970�2010.
Sector 1970 1975 1980 1985 1990 1995 2000 2005 2010
Agriculture 53.5 49.3 39.7 35.7 26.0 19.0 16.0 12.9 11.6
Mining and quarrying 2.6 2.2 1.7 1.1 0.6 0.5 0.5 0.4 0.3
Manufacturing 8.7 10.1 15.7 15.1 19.9 25.7 27.1 28.7 28.3
Construction 2.7 2.9 5.6 6.9 6.3 8.9 9.2 7.0 6.4
Services� 20.5 22.5 23.6 26.2 34.5 35.1 37.2 51.0 53.3
Total employment (‘000) 3340 3928 4817 5625 6686 8024 8547 10,895 11,956
Note: �includes gas, water and electricity.Source: Malaysia (1971�2011) and Osman, Pazim and Rasiah (2011).
Table 4. Sectoral export structure, Malaysia, 1970�2010 (%).
Sector 1970 1975 1980 1985 1990 1995 2000 2005 2010
Agriculture 57.0 49.8 39.9 30.2 19.1 9.3 3.7 7.1 10.8
Mining 21.4 18.6 30.0 29.6 15.9 5.0 6.1 9.3 11.5
Manufacturing 11.1 20.9 21.8 32.7 58.8 84.2 90.1 81.6 76.2
Others� 10.5 10.6 8.3 7.4 6.2 1.4 0.1 2.0 1.6
Total (MYR billion) 5.6 10.2 30.7 42.5 88.7 204 427 552.1 638.5
Note: �includes unclassified agricultural, mining and manufactured goods and services.Source: Malaysia (1971�2011).
Journal of the Asia Pacific Economy 81
Dow
nloa
ded
by [
Prof
esso
r R
ajah
Ras
iah]
at 0
7:34
25
Mar
ch 2
015

While manufacturing became the largest real sector since 1988, its share in GDP
began to fall after 2000. Table 5 shows average annual growth in value addition experi-
enced by the manufacturing industries in Malaysia. Foreign capital became the prime
driver of manufactured exports as large waves of foreign capital relocated textile and gar-
ment industries and electric�electronics assembly and processing plants in Malaysia
since the 1970s, and subsequently from the second half of the 1980s following massive
inflows from Japan and the Asian Newly Industrialized Economies (NIEs) that helped
expand export manufacturing further.
Although manufacturing expansion began from the 1970s, government efforts to stim-
ulate industrial widening and deepening only began with the introduction of the Industrial
Master Plan (IMP) in 1986 (Malaysia 1986), and the Second Industrial Master Plan
(IMP2) in 1996. The first IMP targeted incentives to attract foreign capital and to stimu-
late training, while the IMP2 continued this with the addition of incentives and grants for
clustering and R&D activities (Malaysia 1996). Serious shortages in human capital and
the failure of the meso-organizations created from 1991 to stimulate knowledge-based
Table 5. Manufacturing value-added growth (% per year), Malaysia, 1979�2010.
Sector 1979�1985 1985�1990 1990�1995 1995�2000 2000�2005 2005�2010
Food 5.5 6.6 12.2 10.7 3.0 11.0
Beverages ¡0.3 2.4 ¡3.0 5.5 20.0
Tobacco 15.2 ¡13.7 4.4 16.7
Textiles andgarments
4.7 12.8 17.1 6.8 ¡11.5 ¡1.3
Footwear(exceptrubber)
NA NA 10.2 7.3 ¡2.7 14.3
Wood ¡4.5 13.1 16.4 3.8 ¡0.3 1.0
Furniture andfixtures
NA NA 35.8 19.3 2.6 ¡1.7
Printing,publishingand allied
NA NA 17.9 5.1 4.5 2.1
Paper NA NA 20.3 15.0 ¡3.3 7.0
Leather NA NA 29.4 ¡2.4 2.9 4.4
Rubber 4.2 25.0 13.6 7.6 ¡1.6 4.6
Chemical 2.8 7.9 12.5 12.0 12.3 ¡27.3
Petroleumand coal
NA NA 25.3 37.4 11.1 11.2
Non-metallicmineral
3.6 7.4 16.7 4.4 1.3 8.4
Basic metal 9.8 5.0 8.7 10.2 4.4 13.6
Fabricatedmetal
23.9 9.9 1.7 7.6
Machinery 9.0 6.6 26.0 25.3 ¡16.5 2.7
Electricalmachineryand electronics
8.0 16.4 26.8 12.1 0.5 1.3
Transportequipment
9.0 15.0 17.6 6.5 4.6 10.6
Source: Computed from Malaysia 1986�2011.
82 R. Rasiah et al.
Dow
nloa
ded
by [
Prof
esso
r R
ajah
Ras
iah]
at 0
7:34
25
Mar
ch 2
015

activities such as designing and R&D restricted the capacity of IMP2 to stimulate indus-
trial deepening (Rasiah 2010).
Ethnic considerations in government policies increased since the 1970s. The Indus-
trial Coordination Act of 1975 required large-scale establishments to allocate at least
30% of equity to Bumiputeras. Export-oriented manufacturers, which were largely for-
eign-owned, were exempted from this rule. However, many domestically oriented
medium-scale Malaysian Chinese-owned companies, not qualifying for the exemption on
export grounds, kept their operations below the size threshold to avoid having the divest
their holdings, thus curtailing economies of scale (Lee 2007). Mandated transfers, as
expected, did not spur much capability building or innovative activity. Malaysia’s early-
1980s heavy industries programme, under which the national automobile maker Proton
was established, also targeted the cultivation of Bumiputera ownership and enterprise.
These ventures largely struggled or failed, beset inter alia by poor selection and weak
monitoring. The manufacturing investment climate was liberalized from the mid-1980s,
although pockets of ethnic preferential policies have remained, such as in automobiles.
Massive FDI inflows into the manufacturing sector from the late 1980s helped reduce
the pressure on the government to create jobs (see Ariff 1991; Rasiah 1995a). The focus of
industrial policy shifted towards industrial deepening as the government attempted to take
advantage of low unemployment levels, which reached 2.7% in 1995. The APITD of 1990
helped provide the groundwork for the opening of the Human Resource Development
Fund (HRDF), Malaysian Technology Development Corporation (MTDC), the Malaysia
Industry Government High Technology (MIGHT), the cluster-based IMP2, the Multimedia
Super Corridor (MSC) and the Multimedia Development Corporation (MDec) in the 1990s
to support technological deepening (Malaysia 1991b, 1991c). The Malaysian Institute of
Microelectronics Systems (MIMOS) was also corporatized in the 1990s.
More generally, deficiencies in coordination and performance standards have hin-
dered value addition in the manufacturing sector, in spite of various initiatives to set
Malaysia in this direction. Hence, firms approached the government to import foreign
labour to sustain their operations, which aggravated further the situation by reducing the
pressure to upgrade. Government focus on unskilled labour over the 1980s and the 1990s
undermined firm-level initiatives to upgrade. These developments led a number of
authors to warn that the Malaysian industrialization project may have stalled (see Best
and Rasiah 2003; Henderson and Phillips 2007).3
The failure of the meso-organizations to stimulate the production of human capital
and knowledge stocks to spur upgrading led to a slowdown in manufacturing growth since
2000. The government introduced the Third Industrial Master Plan (IMP3) in 2006 which
attempted to continue its focus on clustering with the addition of support for services.
However, the IMP3 neither enjoyed the positive elements of clustering contained in
IMP2 nor addressed the latter’s weakness of not comprehending complementary activities
effectively (see Rasiah 2011). Manufacturing value added grew only by 2.6% annually on
average in the period 2005�2010. The fastest-growing industries in 2005�2010 were
beverages and footwear, and the resource-based industries of petroleum and coal, and
metals (see Table 5). The textile and garment industries faced a contraction in
2000�2010, recording an annual average growth of ¡11.5% in 2000�2005 and ¡1.3%
in 2005�2010. The electric�electronics industry, which is Malaysia’s largest
manufacturing industry, recorded an annual average growth rate of 0.5% in 2000�2005
and 1.3% in 2005�2010. While the contraction of the textiles industry appears as an
unavoidable result of the termination of the Multi-Fibre Agreement (MFA) and rising
competition from China, India, Vietnam and the least developed countries (LDCs),4 the
Journal of the Asia Pacific Economy 83
Dow
nloa
ded
by [
Prof
esso
r R
ajah
Ras
iah]
at 0
7:34
25
Mar
ch 2
015

contraction and slowdown in other manufacturing industries is a consequence of slow
upgrading.
The discussion on premature deindustrialization will not be complete without an anal-
ysis of trade performance. The indices examined are trade balance (TB), imports in
domestic demand, export intensity of output and the shares of exports in overall exports.
The TB index denotes the relative significance of exports against imports and the estima-
tions are shown in Table 6. The TB index varies between ¡1 and 1 with negative balances
denoting that imports exceed exports. It can be seen that food and beverage, wood and
petroleum and coal products have enjoyed the highest trade balances over the period
1990�2005. The data show that the TB improved for most industries over the period
1990�2000 and started to worsen over the period 2000�2005. However, other than food
and other industries, the remaining industries recorded improvements in their TB in
2005�2008. The withdrawal of MFA quotas in 2004 suggests that textiles and garments
are likely to face further contraction. The machinery industry enjoyed improvements over
the period 1990�2000 with its TB recording a positive index only in 2000 and 2008, sug-
gesting that the strategic instruments used to promote the industry following the launch-
ing of the IMP3 of 2006 has not materialized.
The transport equipment industry enjoyed strong protection since the promulgation of
the Heavy Industries Corporation of Malaysia (HICOM) in 1980 and subsequent launch-
ing of Proton (Alavi 1996). The government approved further domestic automobile manu-
facturers in Perodua, Naza Motors, Modenas and Inakom. However, the TB account of
the transport equipment industry has shown little improvement (see Table 6). The export
value of automotive products from Malaysia rose from US$121 million in 1990 to only
US$369 million in 2000 and US$1154 million in 2008. The commensurate export figures
for Indonesia rose from US$22 million in 1990 to US$369 million in 2000 and
US$2783 million in 2008 while those of Thailand rose from US$108 million in 1990 to
US$2417 million in 2000 and US$16,227 million in 2008 (WTO 2009: Table 11.60).
Clearly, exports from Thailand and Indonesia have grown significantly faster than exports
from Malaysia over the period 1990�2008.
Table 6. Manufacturing trade balance, Malaysia, 1979�2008.
Sector 1979 1985 1990 1995 2000 2005 2008
Food and beverage ¡0.171 ¡0.327 0.594 0.641 0.520 0.594 0.159
Textiles and garments ¡0.058 0.106 0.082 0.122 0.271 0.082 0.302
Wood 0.913 0.874 0.660 0.491 0.417 0.660 0.854
Chemicals ¡0.710 ¡0.721 ¡0.635 ¡0.428 ¡0.176 ¡0.635 0.174
Petroleum and coal NA NA 0.512 0.382 0.379 0.512 0.052
Rubber and plastics 0.470 0.113 0.218 0.177 0.106 0.218 0.734
Non-metallic mineral ¡0.335 ¡0.518 ¡0.464 ¡0.420 ¡0.156 ¡0.464 0.155
Basic metal 0.570 0.252 ¡0.492 ¡0.517 ¡0.393 ¡0.492 ¡0.393
Machinery(inc electrical)
¡0.069 ¡0.071 ¡0.093 ¡0.019 0.104 ¡0.093 0.087
Transport equipment ¡0.652 ¡0.624 ¡0.598 ¡0.502 ¡0.518 ¡0.598 ¡0.407
Professional andscientific
¡0.477 ¡0.451 ¡0.385 ¡0.279 ¡0.150 ¡0.385 ¡0.322
Others NA NA 0.357 0.024 0.223 0.357 0.288
Note: Formula used: (Export¡ Import)/(ExportC Import).Source: Malaysia (1983�1991, 2010); ADB (2008).
84 R. Rasiah et al.
Dow
nloa
ded
by [
Prof
esso
r R
ajah
Ras
iah]
at 0
7:34
25
Mar
ch 2
015
The results suggest that domestic capabilities seem to have developed more in
resource-based industries enjoying natural endowments in the country. However, given
that these industries are dependent on finite non-renewable resources, the government
will have to gradually reduce overdependence on these industries. A sustained long-term
strategy of industrial deepening cannot be built in these industries.
Machinery (mainly electric�electronics products) has dominated manufactured
exports from Malaysia over the period 1990�2008 (see Table 7). Petroleum and coal
products enjoyed the next highest share of exports. However, while the share of machin-
ery and petroleum products showed an increase over 2000�2005 and subsequently a fall
in 2005�2008, machinery recorded the opposite, falling in 2005 before rising in
2005�2008. While the relative contraction in exports in the 1990s was a consequence of
massive expansion in electric and electronics exports, the fall after 2000 was caused by
the termination of the MFA and increased exports from China and LDCs such as Cambo-
dia (see Rasiah 2009a).5
While local suppliers grew,6 the number of electronics MNCs in Malaysia engaged in
designing and R&D activities constituted only 1.0% of the total in 2007 (see Rasiah 2010,
310). As most firms failed to evolve their technological capabilities to designing and R&D
activities in the face of rapid expansion in China and Vietnam, the supplier base began to
contract from the late 1990s (Grunsven 2006; Rasiah 2010). The lack of engineers and sci-
entists in particular has been a glaring problem that has slowed down productivity growth
in the industry. For example, Malaysia had only 729 researchers per million people when
there were 7059 in Singapore and 6028 in Korea in 2007 (UNESCAP 2009, 97).
The trend decline in manufacturing labour productivity growth, with the key export-
oriented industries and inward-oriented industry of transport equipment recording either
a sharply declining or negative growth rates over the period 2000�2008, is a consequence
of falling competitiveness arising from slow upgrading. Beverages and tobacco enjoyed
the highest productivity growth in 2005�2008. While the share of electronics exports
from Singapore and Thailand in global exports rose from 7.6% and 1.9%, respectively, in
2000 to 2.0% and 8.1%, respectively, in 2006, the commensurate shares from Malaysia
fell from 5.4% in 2000 to 4.7% in 2006 (see Rasiah 2009b).
Table 7. Composition of manufacturing export, Malaysia, 1979�2008.
Sector 1979 1985 1990 1995 2000 2005 2008
Food and beverage 0.123 0.127 0.101 0.088 0.044 0.059 0.038
Textiles and garments 0.072 0.100 0.049 0.036 0.027 0.019 0.021
Wood 0.043 0.028 0.122 0.070 0.041 0.035 0.021
Chemicals 0.034 0.033 0.014 0.021 0.030 0.041 0.088
Petroleum and coal NA NA 0.193 0.073 0.098 0.141 0.067
Rubber and plastics 0.016 0.009 0.064 0.054 0.039 0.053 0.027
Non-metallic mineral 0.010 0.011 0.022 0.016 0.014 0.016 0.011
Basic metal 0.307 0.140 0.033 0.029 0.025 0.031 0.017
Machinery (inc electrical) 0.321 0.497 0.341 0.533 0.624 0.541 0.597
Transport equipment 0.033 0.043 0.025 0.029 0.008 0.010 0.020
Professional and scientific NA NA 0.014 0.016 0.020 0.023 0.018
Others NA NA 0.023 0.035 0.030 0.031 0.075
Note: Formula used: export of the industry divided by total manufactured exports; NA � not available.Source: Malaysia (1983�1990); Computed from ADB (2008).
Journal of the Asia Pacific Economy 85
Dow
nloa
ded
by [
Prof
esso
r R
ajah
Ras
iah]
at 0
7:34
25
Mar
ch 2
015

Taken together, the evidence is overwhelming that manufacturing has started to fall in
significance from the mid-1990s with the contraction being the most serious since 2000. Crit-
ically, manufacturing industries have faced a slowdown or a fall in trade performance and
productivity since 2000. The chronic contraction trends suggest that manufacturing growth
in Malaysia has indeed plateaued and is facing negative deindustrialization since 2000.
4. Implications for employment, productivity and wages
Having established the long-term slowdown in manufacturing growth, in this section, we
provide evidence to show that its premature slowdown has restricted both labour produc-
tivity and wage growth in the sector in Malaysia. Because of the paucity of comparable
data, we use the period 1988 until 2010 in this section with the periodization defined on
the basis of growth in mean wages in the manufacturing sector. We then evaluate labour
policies and labour market outcomes, which have been inconsistent and counterproduc-
tive, specifically in failing to chart a clear and effective passage towards higher skills,
higher wages and improved work conditions. Instead, Malaysia has entrenched depen-
dency on low-skilled foreign workers. Labour policy regarding foreign labour has suf-
fered from inconsistency, tendency to react to circumstances, lack of worker protection
and poor monitoring against non-compliance and abuse (Devadason and Meng 2014).
Average annual employment enjoyed positive growth in all industries over the periods
1988�1990 and 1990�1997 (Table 8). Tobacco, textiles, footwear, and petroleum and
coal experienced negative growth over the period 2001�2005. The number of industries
Table 8. Annual average growth of employment, Malaysia, 1988�2010 (%).
Sectors 1988�1990 1990�1997 2001�2005 2005�2010
Food and beverages 2.38 4.19 6.06 6.05
Tobacco products 24.32 13.37 ¡8.26 ¡18.01
Textiles 8.30 2.63 ¡0.70 ¡4.96
Footwear (except rubber footwear),other wearing apparel andmade-up textile goods
18.14 0.41 ¡0.18 ¡1.93
Wood products 18.78 8.11 3.38 ¡3.09
Furniture and fixtures 12.55 17.69 6.97 ¡4.66
Printing, publishing andallied industries
5.86 8.50 10.72 2.53
Paper and paper products 15.61 9.05 5.50 7.82
Leather and leather products 69.03 2.83 3.41 0.41
Rubber products 12.26 3.20 7.47 ¡0.08
Chemicals and chemical products 11.62 7.46 8.85 ¡9.50
Products of petroleum and coal 0.00 16.29 ¡2.84 9.96
Non-metallic mineral products 17.26 10.07 3.11 3.31
Basic metal industries 18.84 11.04 5.33 7.87
Fabricated metal products 18.54 13.57 8.73 5.48
Machinery except electrical machinery 30.24 16.67 2.88 5.47
Electrical machinery and electronics 28.61 11.36 3.79 ¡1.50
Transport equipment 31.00 13.74 5.88 7.48
Source: Computed from various issues of manufacturing survey reports.
86 R. Rasiah et al.
Dow
nloa
ded
by [
Prof
esso
r R
ajah
Ras
iah]
at 0
7:34
25
Mar
ch 2
015

facing negative employment growth increased further over the period 2005�2010.
Employment in tobacco, textiles, footwear, wood, furniture and fixtures, rubber, chemi-
cals and electrical machinery contracted over the period 2005�2010.
Attracted by the provision of financial incentives and imports of foreign labour,
manufacturing enjoyed significant labour productivity growth until 1997. All manufactur-
ing industries enjoyed positive labour productivity growth over the period 1990�1997
(Table 9). Except for petroleum and coal products, the remaining manufacturing indus-
tries experienced negative labour productivity growth so that overall manufacturing
labour productivity actually declined over the period 2000�2005. Apart from inward-ori-
ented and resource-based industries, labour productivity of several export-oriented indus-
tries recorded negative or low annual average growth over the period 2005�2010.
Petroleum and coal, basic metals and chemicals were the only manufacturing indus-
tries to record positive labour productivity growth over the period 2000�2005 (see
Table 9). Although labour productivity of most industries grew positively over the period
2005�2010, overall manufacturing labour productivity only grew by 1.8% on average
per annum over this period. Labour productivity of the key industry, electric�electronics
industry, grew at an annual average of 11.8% in 1990�1997 but grew by ¡0.9% in
2000�2005 and 0.04% in 2005�2010. The strong technological synergies offered by
multinational corporations in the late 1980s and early 1990s appear to have been
Table 9. Annual average growth of labour productivity, Malaysia, 1988�2010 (%).
Sector 1988�1990 1990�1997 2001�2005 2005�2010
Food and beverages 6.63 2.74 ¡3.91 4.66
Tobacco products ¡25.57 1.56 ¡0.14 42.31
Textiles 4.64 13.87 ¡10.57 6.79
Footwear (except rubber footwear),other wearing apparel andmade-up textile goods
3.87 5.63 ¡4.81 0.63
Wood products 2.62 4.75 ¡0.38 4.25
Furniture and fixtures 9.72 10.57 ¡6.00 3.12
Printing, publishing andallied industries
17.62 7.07 ¡4.59 ¡4.55
Paper and paper products 8.69 4.46 ¡11.56 ¡0.76
Leather and leather products ¡12.04 13.26 ¡1.70 3.95
Rubber products 10.19 9.09 ¡3.97 4.68
Chemicals and chemical products ¡6.95 5.43 5.48 ¡19.69
Products of petroleum and coal 33.37 5.93 28.15 1.08
Non-metallic mineral products ¡0.32 3.28 ¡7.58 4.97
Basic metal industries 7.48 3.53 4.34 5.43
Fabricated metal products 6.20 6.27 ¡4.87 2.00
Machinery except electrical machinery 6.47 8.60 ¡3.05 ¡2.62
Electrical machinery and electronics 4.97 11.79 ¡0.91 0.04
Transport equipment 11.26 4.57 ¡12.41 3.24
Total manufacturing 6.53 5.87 ¡1.46 1.75
Source: Computed from various issues of manufacturing survey reports.
Journal of the Asia Pacific Economy 87
Dow
nloa
ded
by [
Prof
esso
r R
ajah
Ras
iah]
at 0
7:34
25
Mar
ch 2
015

undermined by a lack of effective rooting policies for local firms to upgrade to the tech-
nology frontier (Rasiah 2009b).
The clothing and textile industry expanded during the MFA quota period
(1974�2004) in Malaysia. The total export value of the textile and clothing industry for
the year 1998 amounted to MR$ 9.6 billion (4.7% of total exports) and was the third larg-
est foreign exchange earner after the electronics and palm oil industries. In the previous
years, the amount of export value in the textile and garment industry more than doubled.
But in 2012, the industry had the same value as it did in 1998 and in 2012 registered a
12.4% contraction.7 The decline is the result of the end of the MFA. In addition, most of
the small garment factories have not introduced higher levels of technology but have
relied on a combination of foreign workers, labour intensification and home-based work-
ers to meet the increased competition and just-in-time production. Home-based produc-
tion has expanded in the urban areas because working class Malaysian women were
unable to work long hours in the factories but instead opted to take on homework for the
manufacturing industries (Crinis 2013). According to the 2012 Informal Sector Work
Force Survey Report, the largest share of women in informal employment are working in
manufacturing activities (28% of total), followed by human health and social work (24%)
and food and accommodation (19%; DOS 2013). Home workers, particularly in garments
and textiles, account for a considerable majority of women in informal manufacturing.
The dual workforce of low-skilled factory and home workers has kept wages low.
Unlike the clothing and textile industry, a study of two electronic firms showed that
factory women with access to long-term employment had the opportunity to increase their
skills since the 1990s when technology became more automated, incorporating flexible
production techniques evident in the components sub-sector (Mohamad 1999). However,
the employment pattern in this industry is unstable and is highly susceptible to over-pro-
duction. Hence, national workers applying for jobs in the electronic factories have
declined because the wages were too low. Instead of training workers and limiting the
number of foreign workers, the government allowed manufacturers to resume foreign
worker recruitment.8 As a result, the industry has remained low-tech and labour-intensive
due to the dependence on low wages and transient nature of employment.
In the manufacturing industries, foreign workers are employed on one to three year
contracts (can be extended to five years), provided with accommodation and in some
cases transport. The employment contract specifies the name of the employer and condi-
tions, such as wages and terms of work, including hours of work and overtime. In Malay-
sia, the lowest paid category of workers on the government’s ‘Doing business in
Malaysia’ website are production workers (Crinis 2013). Before the minimum wage intro-
duction, foreign workers were paid MYR18�26 per day. For the first 3 months, workers
were paid MYR18 per day and then the rate went up to a ceiling rate of around MYR26
per day. Migrant workers do not bargain for higher wages because they fear losing their
jobs. They increase their wages by working as much overtime as allocated. During the
Global Economic Crisis (GEC), the number of foreign workers declined by 300,000
because expiring work permits were not renewed and the government restricted further
intake of migrant workers. By the end of 2009, manufacturers had to increase wages to
entice Malaysian workers. During the period of labour shortage, the wages of manufactur-
ing workers rose from MYR450 (USD130) a month in 2008 to MYR650 (USD185). In
response to pressure from manufacturers, the Malaysian government once again allowed
electronics and textile firms to resume recruitment of male and female foreign workers
(Crinis 2012).
88 R. Rasiah et al.
Dow
nloa
ded
by [
Prof
esso
r R
ajah
Ras
iah]
at 0
7:34
25
Mar
ch 2
015

Real wage growth in the manufacturing sector in Malaysia never reached double-digit
figures owing to a preponderance of specialization in low value-added activities and the
use of anti-union labour policies by the government (Jomo and Todd 1994; Rasiah 1995b).
Real wages grew most in the 1990s despite the inflow of foreign labour imports into the
manufacturing sector because of a saturated labour market. However, real wages grew little
after 2000 as investments and labour productivity in manufacturing began to fall.
In addition to the regulatory environment facing workers in Malaysia that has
remained hostile, low labour productivity growth further undermined the capacity of
labour to enjoy high wages in the manufacturing sector. Most industries recorded negative
or low growth in real wages since 1988 (see Table 10), which reflects the low wage nature
of manufacturing in Malaysia. Real wages in the manufacturing sector grew, on average,
annually by only 0.6% and 1.3% in 2000�2005 and 2005�2010, respectively. Except for
tobacco, which enjoyed significant growth in domestic demand, other manufacturing
industries experienced either low or negative growth since 2001.
It is clear that real manufacturing wages grew little over the years owing to little tech-
nological upgrading (Table 11). The strategy to import foreign unskilled labour has
accentuated the problem further as it has removed the pressure for firms to raise wages.
National policies to transform the country to developed status since 1991 has also been
ineffective as not only have the country been unable to mobilize human capital
Table 10. Annual average growth, real wages, Malaysia, 1988�2010.
Sector 1988�1990 1990�1997 2001�2005 2005�2010
Food and beverages 2.45 ¡0.23 0.01 1.66
Tobacco products ¡14.92 ¡13.66 6.93 18.20
Textiles 5.77 3.06 ¡2.01 0.07
Footwear (except rubber footwear),other wearing appareland made-up textiles
7.56 1.96 ¡1.61 ¡1.33
Wood products 1.29 ¡1.36 1.30 1.91
Furniture and fixtures 5.76 3.34 1.07 0.50
Printing, publishing andallied industries
3.12 0.01 ¡1.28 ¡4.22
Paper and paper products 2.74 3.51 ¡1.54 ¡0.01
Leather and leather products ¡4.99 6.66 0.42 1.01
Rubber products 3.14 3.64 0.48 3.14
Chemicals and chemical products 1.23 2.19 2.96 ¡5.71
Products of petroleum and coal ¡2.69 ¡0.80 0.70 ¡0.88
Non-metallic mineral products ¡1.21 0.76 0.76 2.46
Basic metal industries ¡1.54 1.58 0.74 5.43
Fabricated Metal products ¡1.78 1.69 0.25 1.18
Machinery except electrical machinery ¡1.20 2.78 ¡0.02 ¡0.83
Electrical machinery and electronics 1.24 4.29 1.41 1.82
Transport equipment ¡2.87 3.74 ¡0.92 0.42
Total manufacturing ¡1.17 0.92 0.55 1.31
Source: Computed from DOS (various issues), Industrial Surveys.
Journal of the Asia Pacific Economy 89
Dow
nloa
ded
by [
Prof
esso
r R
ajah
Ras
iah]
at 0
7:34
25
Mar
ch 2
015

domestically and from abroad, but the meso-organizations created to stimulate R&D and
other forms of knowledge networks have translated little into firms participating in
knowledge-intensive activities. Only a handful of firms have benefited from hiring the
limited human capital available to participate in R&D and designing activities. Hence,
Malaysia has remained confined to the low industrialization route.
The manufacturing sector has also lacked the supply of quality labour as the quality of
education has declined over the period 1999�2011. For example, in the Trends in Mathe-
matics and Science Survey (TIMSS) international standardized test, the share of Malay-
sian eighth graders attaining the ‘high performance’ benchmark plummeted from 39% in
1999 to 18% in 2007 and 12% in 2011 for mathematics, and from 24% to 18% and 11%
in the respective years for science.
Standing (1992) found, from a broad survey of Malaysian manufacturing establish-
ments, that unionized firms are more likely to engage in training and technological
change. This is not surprising; firms are more likely to train workers who are likely to
remain for the long term, which in turn derives significantly from workers being orga-
nized and having a greater stake in their workplace. Pressure from unions for higher
wages and better benefits can also stimulate productivity gains. Malaysia’s trends in
unionization and utilization of contract labour, however, militate against such potential
productivity- and wage-enhancement. Union density has continuously declined, from an
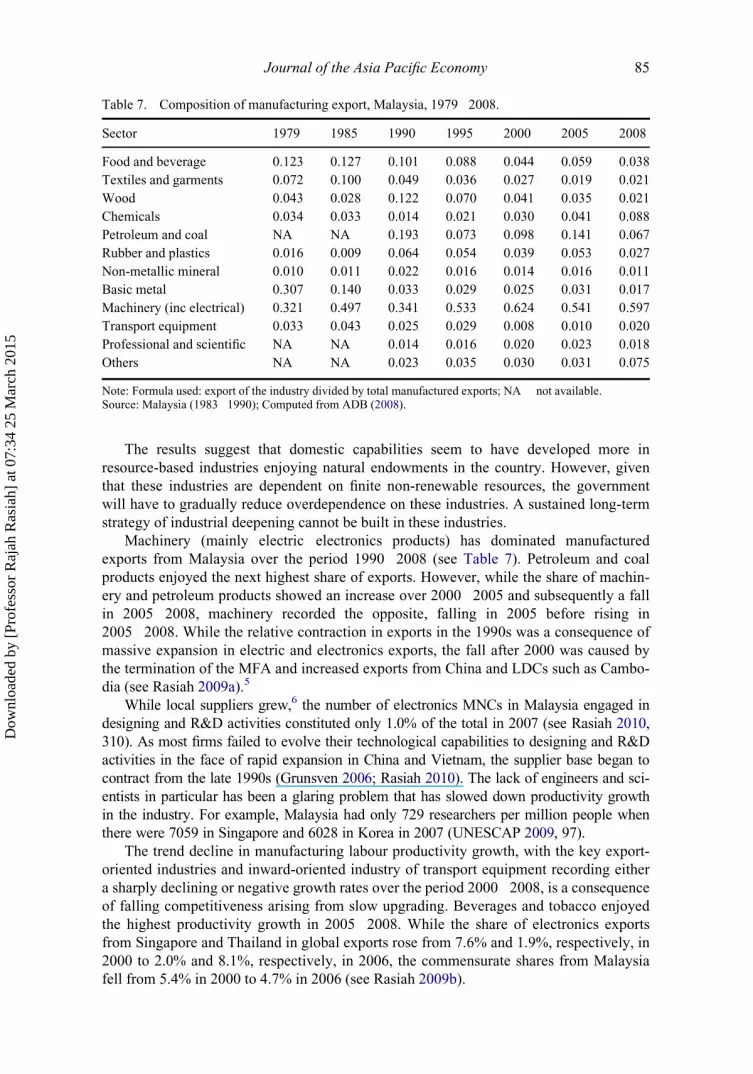
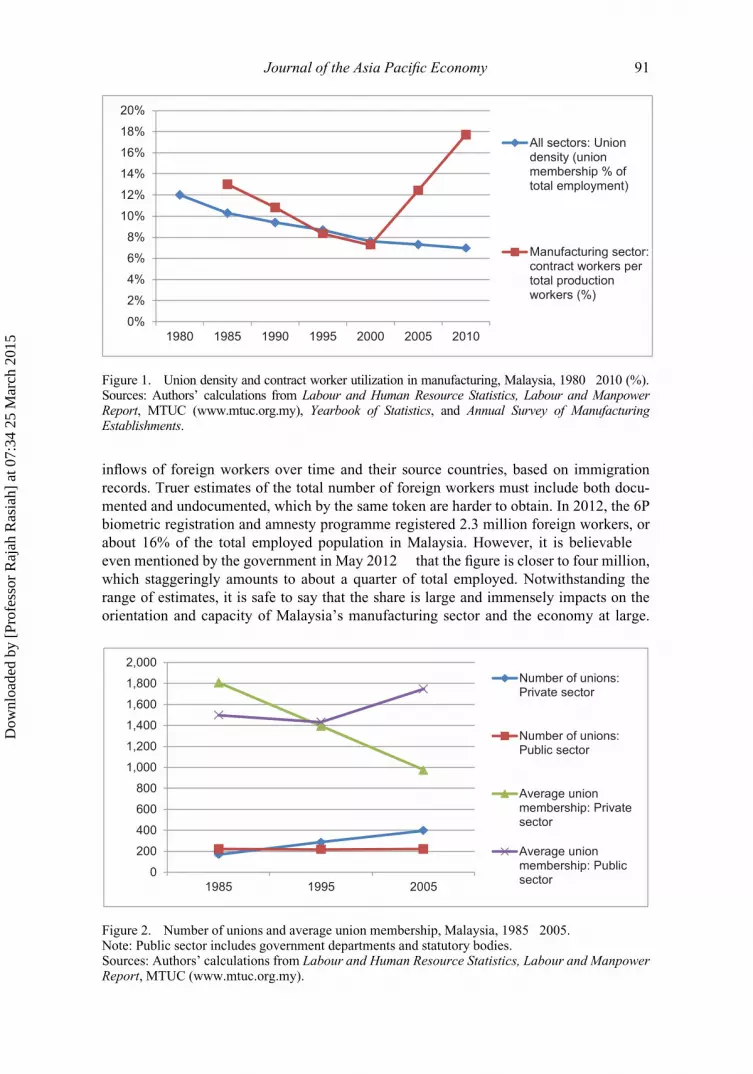
already low starting point of 12% in 1980, to 7% in 2010 (Figure 1). The share of contract
workers � a transient, precarious, largely foreign and migrant labour pool � grew
through the 2000s. Furthermore, while the number of private sector unions has grown,
their average size has dwindled in recent decades, constricting their bargaining power
and effectiveness in representing workers’ interests (Figure 2)
Wage growth has also been suppressed by massive inflows of foreign unskilled labour
into manufacturing since 1990. Figure 3 and Tables 11 and 12 show massive official
Table 11. Foreign workers in Malaysia, 2007.
Country Domestic Construction Manufacturing Services Plantations Agriculture Total
Indonesia 294,764 211,016 206,780 41,012 290,454 103,974 1,148,000
Nepal 31 4493 172,311 1904 2584 8080 189,403
India 126 7382 28,446 60,049 22,451 23,575 142,029
Myanmar 61 14,857 29,906 6 1484 7911 54,225
Vietnam 31 5251 104,948 2951 79 645 113,905
Bangladesh 21 40,497 128,664 21,843 14,207 12,006 217,238
Philippines 10,443 1640 2858 1103 4562 2577 23,173
Thailand 426 1122 793 15,532 53 530 18,456
Pakistan 2 4947 3140 1708 971 6045 16,813
Cambodia 7458 173 2582 240 207 95 10,755
China 18 2284 959 3137 221 14 6633
Sri Lanka 883 106 1580 731 91 295 3686
Laos 1 13 16 1 1 32
Uzbekistan 6 1 4 11
Total 314,265 293,787 682,984 150,220 337,365 165,748 1,944,358
Source: Immigration Department (cited by Khamis Ar Majid, Labour Minister 2008).
90 R. Rasiah et al.
Dow
nloa
ded
by [
Prof
esso
r R
ajah
Ras
iah]
at 0
7:34
25
Mar
ch 2
015
inflows of foreign workers over time and their source countries, based on immigration
records. Truer estimates of the total number of foreign workers must include both docu-
mented and undocumented, which by the same token are harder to obtain. In 2012, the 6P
biometric registration and amnesty programme registered 2.3 million foreign workers, or
about 16% of the total employed population in Malaysia. However, it is believable �even mentioned by the government in May 2012 � that the figure is closer to four million,
which staggeringly amounts to about a quarter of total employed. Notwithstanding the
range of estimates, it is safe to say that the share is large and immensely impacts on the
orientation and capacity of Malaysia’s manufacturing sector and the economy at large.
0%
2%
4%
6%
8%
10%
12%
14%
16%
18%
20%
1980 1985 1990 1995 2000 2005 2010
All sectors: Uniondensity (unionmembership % oftotal employment)
Manufacturing sector:contract workers pertotal productionworkers (%)
Figure 1. Union density and contract worker utilization in manufacturing, Malaysia, 1980�2010 (%).Sources: Authors’ calculations from Labour and Human Resource Statistics, Labour and ManpowerReport, MTUC (www.mtuc.org.my), Yearbook of Statistics, and Annual Survey of ManufacturingEstablishments.
0
200
400
600
800
1,000
1,200
1,400
1,600
1,800
2,000
1985 1995 2005
Number of unions:Private sector
Number of unions:Public sector
Average unionmembership: Privatesector
Average unionmembership: Publicsector
Figure 2. Number of unions and average union membership, Malaysia, 1985�2005.Note: Public sector includes government departments and statutory bodies.Sources: Authors’ calculations from Labour and Human Resource Statistics, Labour and ManpowerReport, MTUC (www.mtuc.org.my).
Journal of the Asia Pacific Economy 91
Dow
nloa
ded
by [
Prof
esso
r R
ajah
Ras
iah]
at 0
7:34
25
Mar
ch 2
015

The educational profile of foreign and Malaysian workers evinces the overwhelming dis-
parity in qualifications. In 2010, 60% of foreign workers had primary schooling or less,
compared to 16% of Malaysian workers.9
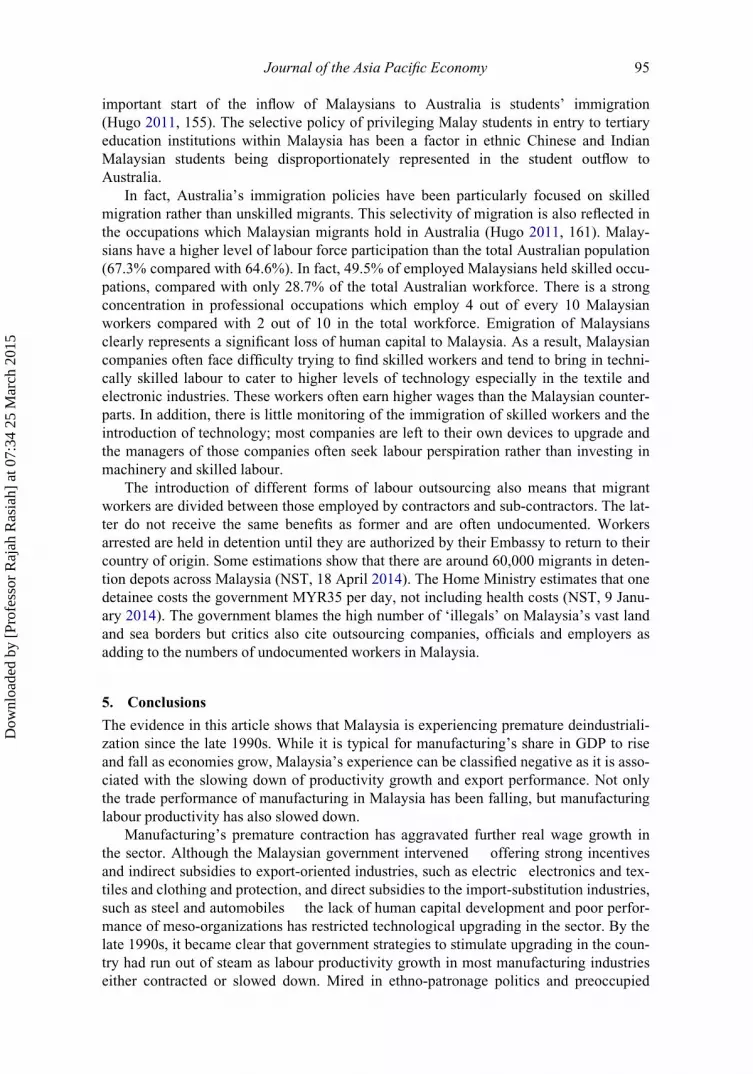
Inflows of foreign labour have influenced productivity negatively in the sector. Since
1995, over 90% of foreign workers have been engaged in low-skilled jobs, compared to
Figure 3. Foreign workers by sector, Malaysia, 1990�2008.Source: Athukorala and Devadason 2012.
Table 12. Foreign workers in manufacturing industries, 2007 and 2010.
Country 2007 Manufacturing 2007 Country 2010 Manufacturing 2010
Indonesia 206,780 Indonesia 198,643
Nepal 172,311 Bangladesh 170,332
Bangladesh 128,664 Nepal 135,764
Vietnam 104,948 Myanmar 92,135
Myanmar 29,906 Vietnam 68,433
India 28,446 India 13,866
Philippines 2858 Pakistan 2217
Thailand 793 Filipina 1915
Pakistan 3140 Cambodia 2353
Cambodia 2582 China 935
China 959 Thailand 893
Sri Lanka 1580 Sri Lanka 1382
Laos 16 Laos 16
Uzbekistan 1 Uzbekistan 0
Others 2
Total 682,984 688,886
Source: Malaysian Bar Council; Malaysian Textiles Manufacturing Association.
92 R. Rasiah et al.
Dow
nloa
ded
by [
Prof
esso
r R
ajah
Ras
iah]
at 0
7:34
25
Mar
ch 2
015

less than 50% of Malaysian workers. Between 1985 and 2008, the number of foreign
workers in low-skill production jobs increased by 81 times (from 5500 to 447,400). Over
the same period, the number of foreigners increased 4 times at management and profes-
sional levels, 19 times among technical and supervisory staff and 21 times for clerical
and general workers. In 2008, 96% of foreign workers in manufacturing were classified
as unskilled, compared to 73% in 1985 (Athukorala and Devadason 2012).
The preference for low-skilled foreign labour corresponds with production character-
ized more by extracting perspiration rather than productivity. Comparison of weekly
hours worked demonstrates the appeal and higher exploitability of foreign, especially
low-skilled, workers, and confirms the entrenchment of a high exertion model in Malay-
sia. In 2009, foreign workers reported an overall average of 55 hours of work per week,
compared to 46 hours for Malaysian workers � which clearly correlates with 48 hours as
the legal definition of full-time employment.10 The disparity is greater in those who are
less skilled and more heavily worked. Among workers without formal education, 20% of
foreigners worked more than 70 hours per week, compared to 54 hours for the corre-
sponding fifth of longest working Malaysians.
An inertia and dependency has set in that is difficult to break, with abundant access to
low-skilled foreign labour and scant market incentive to disrupt a still profitable system.
Past experience, however, strongly suggests that promotion of productivity per hour
yields higher development dividends, in view of the shift in industrialized economies
towards fewer hours while maintaining positive deindustrialization. The International
Labour Organisation (ILO)’s databases permit some comparison, based on GDP per hour.
South Korea increased real GDP per hour (in 2005 dollars), from $4.7 in 1980 to $9.7 in
1990, before progressing further to $25.4 in 2010. In contrast, Malaysia registered an esti-
mated GDP per hour of $5.3 in 2000, close to South Korea’s of 1980, but only raised this
to $7.1 in 2010. From 2000 to 2008, South Korea’s average hours worked per week
dropped from 49 to 44, while Malaysia’s held at 49.11
The MTUC unsuccessfully tried to persuade the government to stop the inflow of for-
eign labour on the grounds that it depresses the wage structure and weakens incentives to
attract Malaysian workers (Crinis 2008). By 2012, foreign workers exceeded national
workers in a number of manufacturing industries. Foreign workers make up about 80% of
the workforce in the clothing industry (Crinis 2012).
Foreign workers are subjected to levels of abuse ranging from wage deductions, injury
and premature repatriation, and many injustices are overlooked because there are few
labour inspectors (around 300) in a workforce of almost 14 million.12 The burgeoning
presence of foreign workers is inextricable from the chronic decline in union density in
Malaysia, and an increasing utilization of labour contracting in the 2000s, as shown in
Figure 3. These trajectories attenuate the capacity for stable employment and worker
representation, which can contribute positively to upskilling and upgrading.
Most migrant workers are not organized in the electronic, clothing and textile industry
due to government restrictions and initial union inaction towards short-term contract
workers. First, the government limited the rights of workers to join unions in the export
industries in the 1970s because of the risk of increasing labour costs and undermining
international competitiveness. The union movement in Malaysia was unable to reach the
large numbers of workers in the electronic industry because the government and employ-
ers preferred the Japanese model of in-house unions. While the MTUC continued to lobby
the government to lift the ban on unions in the electronic industries, the US employers
threatened to re-locate if the bans were lifted. After more than 30 years, workers were
allowed to form regional unions in 2010.13
Journal of the Asia Pacific Economy 93
Dow
nloa
ded
by [
Prof
esso
r R
ajah
Ras
iah]
at 0
7:34
25
Mar
ch 2
015

Second, the MTUC initially argued that migrants were a source of labour that under-
mined unionized workers job security and their terms of employment.14 It was not until
2008 that the MTUC sent a report to the ILO on the denial of Freedom of Association for
migrant workers and worked towards making groups of migrant workers aware of their
rights under national labour laws.15 After this the MTUC started to lobby for contract
workers as well as foreign workers and called for the government to assess labour market
needs before issuing more work permits for overseas workers. Nonetheless employers
continued to hire foreign workers because they were flexible, could work longer hours
and could be repatriated when the contract ended. In more recent times, the MTUC has
supported worker associations such as Gefont, a Nepalese Association helpline to reach
foreign workers.
The MTUC also called on the government to at least set a minimum wage for the low-
est paid workers (both nationals and foreign workers) to meet the cost of living which had
increased over the 2000s due to increases in food, rents, petrol prices and water privatiza-
tion.16 But according to MTUC sources, the government listened to employers who
argued that a minimum wage would reduce competition and FDI would move to another
‘low-cost’ location if a minimum wage was introduced.17
Not only have some employers preferred non-unionized foreign unskilled workers
because of the attraction of low wages, they have also been able to bind foreign workers
contractually over longer periods to reduce job hopping. The Human Resource Develop-
ment Act of 1992, which was targeted at forcing firms to train national workers, became
ineffective as companies, instead of providing training, resorted to hiring foreign workers.
To make matters worse for labour, the government has confined the minimum wage legis-
lation that was gazetted in parliament in 2012 to only national workers.
The Malaysian government eventually introduced minimum wages of MYR900
(USD291) for Peninsular Malaysia and MYR800 (USD259) for Sabah and Sarawak in Janu-
ary, 2013. However, opposition from SMEs deferred its enforcement until the end of 2013.18
For the larger companies who had to pay the minimum wage increase, the government
allowed employers to deduct money from migrant wages to recover the expenses made for
employing foreign workers. Despite the fact that the government stopped the practice of
allowing employers to deduct the levy in 2009 after the Nike and Hytex incidents, it allowed
employers to resume this practice (Crinis 2013). It appears that some workers were better off
before introduction of the minimum wage legislation. Hence, the Minimum Wage Act offers
little support for wage improvements in the manufacturing sector.
4.1. High-skilled labour outflows
In addition to the increase in unskilled migrant labour in Malaysia, skilled Malaysian
workers have sought higher paying jobs outside Malaysia. Factors driving the brain drain
are Malaysia’s race-based affirmative action policies, as well as the fact that workers can
make more money in Australia and Singapore. A recent estimate of Malaysia’s Ministry
of Human Resources indicates that there are 350,000 Malaysians working abroad, over
half of which had tertiary education, and the Malaysian Employers Federation argues that
there are 785,000 Malaysians working in overseas countries (Hugo 2011). Despite the
government’s array of programmes to lure professionals to Malaysia, few have returned
(Roasa 2011).
Emigration from Malaysia is highly slanted towards ethnic Chinese, which accounted
for more than two-thirds of emigrants to Australia (Hugo 2011, 156). The proportion of
Chinese Malaysians was similar in both the 1986 and 2006 Australian censuses. An
94 R. Rasiah et al.
Dow
nloa
ded
by [
Prof
esso
r R
ajah
Ras
iah]
at 0
7:34
25
Mar
ch 2
015
important start of the inflow of Malaysians to Australia is students’ immigration
(Hugo 2011, 155). The selective policy of privileging Malay students in entry to tertiary
education institutions within Malaysia has been a factor in ethnic Chinese and Indian
Malaysian students being disproportionately represented in the student outflow to
Australia.
In fact, Australia’s immigration policies have been particularly focused on skilled
migration rather than unskilled migrants. This selectivity of migration is also reflected in
the occupations which Malaysian migrants hold in Australia (Hugo 2011, 161). Malay-
sians have a higher level of labour force participation than the total Australian population
(67.3% compared with 64.6%). In fact, 49.5% of employed Malaysians held skilled occu-
pations, compared with only 28.7% of the total Australian workforce. There is a strong
concentration in professional occupations which employ 4 out of every 10 Malaysian
workers compared with 2 out of 10 in the total workforce. Emigration of Malaysians
clearly represents a significant loss of human capital to Malaysia. As a result, Malaysian
companies often face difficulty trying to find skilled workers and tend to bring in techni-
cally skilled labour to cater to higher levels of technology especially in the textile and
electronic industries. These workers often earn higher wages than the Malaysian counter-
parts. In addition, there is little monitoring of the immigration of skilled workers and the
introduction of technology; most companies are left to their own devices to upgrade and
the managers of those companies often seek labour perspiration rather than investing in
machinery and skilled labour.
The introduction of different forms of labour outsourcing also means that migrant
workers are divided between those employed by contractors and sub-contractors. The lat-
ter do not receive the same benefits as former and are often undocumented. Workers
arrested are held in detention until they are authorized by their Embassy to return to their
country of origin. Some estimations show that there are around 60,000 migrants in deten-
tion depots across Malaysia (NST, 18 April 2014). The Home Ministry estimates that one
detainee costs the government MYR35 per day, not including health costs (NST, 9 Janu-
ary 2014). The government blames the high number of ‘illegals’ on Malaysia’s vast land
and sea borders but critics also cite outsourcing companies, officials and employers as
adding to the numbers of undocumented workers in Malaysia.
5. Conclusions
The evidence in this article shows that Malaysia is experiencing premature deindustriali-
zation since the late 1990s. While it is typical for manufacturing’s share in GDP to rise
and fall as economies grow, Malaysia’s experience can be classified negative as it is asso-
ciated with the slowing down of productivity growth and export performance. Not only
the trade performance of manufacturing in Malaysia has been falling, but manufacturing
labour productivity has also slowed down.
Manufacturing’s premature contraction has aggravated further real wage growth in
the sector. Although the Malaysian government intervened � offering strong incentives
and indirect subsidies to export-oriented industries, such as electric�electronics and tex-
tiles and clothing and protection, and direct subsidies to the import-substitution industries,
such as steel and automobiles � the lack of human capital development and poor perfor-
mance of meso-organizations has restricted technological upgrading in the sector. By the
late 1990s, it became clear that government strategies to stimulate upgrading in the coun-
try had run out of steam as labour productivity growth in most manufacturing industries
either contracted or slowed down. Mired in ethno-patronage politics and preoccupied
Journal of the Asia Pacific Economy 95
Dow
nloa
ded
by [
Prof
esso
r R
ajah
Ras
iah]
at 0
7:34
25
Mar
ch 2
015

with raising ethnic corporate ownership over upgrading technological capabilities, the
incentive system in Malaysia lacked the mechanism to attract performers, as well as an
appraisal system to transform the rents productively. Hence, the low industrialization
road experienced by Malaysia got worse when Malaysia’s labour productivity and trade
competitiveness in a number of industries began to fall with real wages either slowing
down or contracting since 2000.
While the successful industrializers, such as the United States, Germany, Japan, Korea
and Taiwan, experienced a sustained rise in real wages even after deindustrialization set
in, Malaysia’s premature deindustrialization process has undermined its manufacturing
sector’s capacity to support a similar experience. Large imports of low-skilled labour
have further aggravated the situation.
The Malaysian experience serves as a good example of promotional strategies lacking
in the instruments to ensure industrial deepening of nascent economies. Liberal invita-
tional strategies can engender the conditions to stimulate early manufacturing, but they
are not sufficient to sustain rapid growth and structural change towards high value-added
activities. Like most clientelist political alliances, ethno-patronage politics can be seri-
ously rent dissipating as they compromise performance.
Acknowledgements
The Crinis research is part of a collaborative study funded by the Australian Research Council(ARC), 2007 to 2011.
Notes
1. The original argument on industrial policy can be traced to Smith (1776).2. Countries such as Netherlands, Switzerland and New Zealand developed without much
industrialization.3. Rasiah (2011) offered conclusive evidence to show that the manufacturing sector have been
facing negative deindustrialization since 2000.4. Particularly from Cambodia (Rasiah 2009a).5. A number of Malaysian firms have even relocated manufacturing in Cambodia to access
developed markets (see Rasiah 2009a).6. American multinationals initiated such efforts for their own self-expansion (Rasiah 1995a).7. Malaysian Knitting Manufacturers Association, Statistic, ‘Malaysian Exports of Textile and
Apparel’ http://www.mkma.org/ (accessed 7 November 2013).8. Migration News ‘Malaysia: New Migrants’ March 1999, Volume 6, Number 3.9. Authors’ calculations from the 2010 Labour Force Survey Report.10. Calculations from the 2009 (1st Quarter) Labour Force Survey.11. Authors’ calculations from online ILOSTAT and LABORSTA databases.12. Bar Council (personal communication, Andrew, September 2013).13. Malaysian Trades Union Congress, ‘Regional Unions for Electronic Workers’, Labour Bulle-
tin, January 2010.14. Malaysian Trades Union Congress, Reduce Dependency on Migrant Labour MOHR Should
Play a More Central Role, ‘Labour Bulletin’, April 2007.15. Malaysian Trades Union Congress, MTUC Report to ILO of Freedom of Association for
Migrant Workers, ‘Labour Bulletin’, April 2008.16. Malaysian Trades Union Congress, CPI Figures, Are They Reliable? ‘Labour Bulletin’, 25
June 2010.17. Malaysian Trades Union Congress, Abdullah Badawi Sidelined and Ignored the Needs of 7
Million Workers, ‘Labour Bulletin’, March 2009.18. Federal Government Gazette, Minimum Wage (Amendment), 28 May 2013. http://www.
mkma.org/Notice%20Board/2013/MWOAmendment28Mei2013Statement.pdf (accessed 7November 2013).
96 R. Rasiah et al.
Dow
nloa
ded
by [
Prof
esso
r R
ajah
Ras
iah]
at 0
7:34
25
Mar
ch 2
015

Notes on contributors
Rajah Rasiah is professor of Economics and Technology Management at the Faculty of Economicsand Administration, University of Malaya. He is currently on sabbatical at Harvard University.
Dr. Vicki Crinis is a research associate with the Faculty of Law, Humanities and Creative Arts at theUniversity of Wollongong, Australia. Her research focuses on the clothing industry in the AsiaPacific and migrant workers, trade unions and NGOs in Malaysia. She has published a number ofbook chapters and journal articles on these topics. Her current research is looking at Work and Carein Malaysia.
Hwok-Aun Lee is senior lecturer in the Department of Development Studies, Faculty of Economicsand Administration, University of Malaya. His research interests include affirmative action,inequality, labour, social policy, discrimination, and education. His recent works have been pub-lished in Journal of Contemporary, Journal of Asian and African Studies, and in books publishedby Oxford University Press, Edward Elgar and Routledge.
References
Abramovitz, M. 1956. “Resource and Output Trends in the United States Since the 1870.” AmericanEconomic Review 46 (2): 5�23.
Adam, G. 1975. “Multinational Corporations and Worldwide Sourcing.” In International Firms andModern Imperialism, edited by H. Radice, 89�103. Harmondsworth: Penguin.
ADB. 2008. Asian Development Outlook.Manila: Asian Development Bank.ADB. 2010. Asian Development Outlook.Manila: Asian Development Bank.Alavi, R. 1996. Industrialization in Malaysia. London: Routledge.Amsden, Alice. 1989. Asia’s Next Giant: South Korea and Late Industrialization. New York:
Oxford University Press.Amsden, Alice, and Wan-Wen Chu. 2003. Beyond Late Industrialization: Taiwan’s Upgrading Pol-
icies. Cambridge: MIT Press.Ariff, K.M. 1991. The Malaysian Economy: Pacific Connections. Kuala Lumpur: Oxford University
Press.Athukorala, Premachandra, and Evelyn Devadason. 2012. “The Impact of Foreign Labor on Host
Country Wages: The Experience of a Southern Host, Malaysia.” World Development 40 (8):1497—1510.
Best, M.H., and R. Rasiah. 2003. Malaysian Electronics at the Crossroads. Vienna: United NationsIndustrial Development Organization.
Cardoso, F. Hernandez. 2001. Charting a New Course: The Politics of Globalization and SocialTransformation. New York: Rowman & Little.
Crinis, Vicki. 2008. “Women Labour Activism and Unions.” In Women and Labour Organizing inAsia: Diversity, Autonomy and Activism, edited by Kaye Broadbent and Michele Ford, 50�65.London: Routledge.
Crinis, Vicki. 2012. “Global Commodity Chains in Crisis: The Garment Industry in Malaysia, theBefore, the Now and the Hereafter.” Institutions and Economies 4 (3): 61�83.
Crinis, Vicki. 2013. “Vietnamese Clothing Workers in Malaysia: Global Production, TransnationalLabour Migration and Social Reproduction.” InWomen Workers and the Household in Interna-tional Political Economy, edited by Juanita Elias and Samanthi J. Gunawardana, 162�177.London: Palgrave.
Dermawan, Audrey. 2014. “Home Ministry Hopes to Make Deportation of Illegals Easier: Zahid.”New Straits Times, April 18, 2014.
Devadason, Evelyn, and Chan Wai Meng. 2014. “Policies and Laws Regulating Migrant Workers inMalaysia: A Critical Appraisal.” Journal of Contemporary Asia 44 (1): 19�35.
DOS. 2013. Informal Sector Work Force Survey Report. Putrajaya: Department of Statistics.DOS. various issues. Industrial Surveys. Putrajaya: Department of Statistics.Evans, Peter. 1997. Embedded Autonomy: States and Industrialization. Princeton, NJ: Princeton
University Press.Fransman, Martin. 1986. “International Competitiveness, Technical Change and the State: The
Machine Tool Industries in Taiwan and Japan.”World Development 14 (12): 1375�1396.
Journal of the Asia Pacific Economy 97
Dow
nloa
ded
by [
Prof
esso
r R
ajah
Ras
iah]
at 0
7:34
25
Mar
ch 2
015

Gerschenkron, Alexander. 1962. Economic Backwardness in Historical Perspective. Cambridge,MA: Belknap Press.
Grunsven, Leo. 2006. Theorizing Differential Dynamics of Mature MNC-Driven ExportManufacturing Complexes in Southeast Asia. Utrecht: Royal Dutch Geographical Society.
Jenkins, R. 1987. Transnational Corporations and Uneven Development. London: Routledge.Hamilton, Clive. 1983. “Capitalist Industrialization in East Asia’s Four Little Tigers.” Journal of
Contemporary Asia 13 (1): 35�73.Henderson, Jeffrey, and Richard Phillips. 2007. “Unintended Consequences: Social Policy, State
Institutions and the ‘Stalling’ of the Malaysian Industrialization Project.” Economy and Society36 (1): 78�102.
Heng, Sim Bak. 2014. “RM 19m to House and Deport Illegals.” New Straits Times, January 9, 2014.Hugo, G. 2011. “Malaysian Migration to Australia.”Malaysian Journal of Economic Studies 48 (2):
147�174.Jomo, K.S., and Patricia Todd. 1994. Trade Unions and the State in Peninsular Malaysia. Kuala
Lumpur: Oxford University Press.Kalecki, Michal. 1976. Essays on Developing Economies. Hassocks: Harvester.Khan, Mushtaq. 1989. “Clientelism, Corruption and the Capitalist State: A Study of Bangladesh and
Korea.” PhD thesis, Cambridge University.Lee, Hwok-Aun. 2007. “Industrial Policy and Inter-ethnic Income Distribution in Malaysia: Indus-
trial Development and Equity Ownership, 1975�1997.” In Industrial Policy in Malaysia, editedby K.S. Jomo, 216�244. Singapore: Singapore University Press.
Malaysia. 1986. Sixth Malaysia Plan, 1986�1990. Kuala Lumpur: Government Printers.Malaysia. 1991a. Action Plan for Industrial Technology Development. Kuala Lumpur: Ministry of
Science, Technology and Environment.Malaysia. 1991b. Second Industrial Master Plan, 1991�1996. Kuala Lumpur: Ministry of Interna-
tional Trade and Industry.Malaysia. 1991c. Sixth Malaysia Plan, 1991�1996. Kuala Lumpur: Government Printers.Malaysia. 1986�2011. Industrial Surveys (Various Issues). Kuala Lumpur: Department of
Statistics.Malaysia. 1996. Eighth Malaysia Plan, 1996�2000. Kuala Lumpur: Government Printers.McFarlane, Bruce. 1981. Australian Capitalism in Boom and Depression. Kuala Lumpur: APCD.Mohamad, Maznah. 1999. “The Management of Technology, and Women, in Two Electronic Firms
in Malaysia.” In Positioning Women in Malaysia, edited by Cecelia Ng, 95�166. London:Macmillan.
Ofreneo, Rene. 2008. “Arrested Development: Multinationals, TRIMs and the Philippines’ Auto-motive Industry.” Asia Pacific Business Review 14 (1): 65�84.
Osman, R.H., O. Pazim, and R. Rasiah. 2011. “Development of Agriculture.” In MalaysianEconomy: Unfolding Growth and Social Change, edited by R. Rasiah. Shah Alam: OxfordUniversity Press.
Piore, M., and C. Sabel. 1984. The Second Industrial Divide. Cambridge, MA: MIT Press.Pyke, F., and W. Sengenberger (eds.). 1992. Industrial Districts and Local Economic Regeneration.
Geneva: International Labour Organization.Rasiah, Rajah. 1995a. Foreign Capital and Industrialization in Malaysia. London: Macmillan.Rasiah, Rajah. 1995b. “Labour and Industrialization in Malaysia.” Journal of Contemporary Asia
25 (1): 73�92.Rasiah, Rajah. 2009a. “Garment Manufacturing in Cambodia and Laos.” Journal of the Asia Pacific
Economy 14 (2): 150�161.Rasiah, Rajah. 2009b. “Growth and Slowdown in the Electronics Industry in Southeast Asia.” Jour-
nal of the Asia Pacific Economy 14 (2): 123�137.Rasiah, Rajah. 2010. “Industrialization in the Second-Tier NIEs.” In The New Political Economy of
Southeast Asia, edited by R. Rasiah and D.J. Schmidt, 44�102. Cheltenham: Edward Elgar.Rasiah, Rajah. 2011. “Is Malaysia Facing Negative Deindustrialization?”. Pacific Affairs 84 (4):
715�736.Roasa, Dustin. 2011. “Malaysia at Economic Crossroads as It Fights the Great Brain Drain.” The
Guardian. Accessed April 10. http://www.theguardian.com/world/2011/apr/21/malaysia-fights-brain-drain
Rodan, Garry. 1989. The Political Economy of Singapore’s Industrialization: National State andInternational Capital. Basingstoke: Macmillan.
98 R. Rasiah et al.
Dow
nloa
ded
by [
Prof
esso
r R
ajah
Ras
iah]
at 0
7:34
25
Mar
ch 2
015

Rowthorn, Robert, and John Wells. 1987. Deindustrialization and Foreign Trade. Cambridge, UK:Cambridge University Press.
Smith, Adam. 1776. An Inquiry into the Nature and Causes of the Wealth of the Nations. London:Strahan & Cadell.
Standing, Guy. 1992. “Do Unions Impede or Accelerate Structural Adjustment? Industrial VersusCompany Unions in an Industrialising Labour Market.” Cambridge Journal of Economics 16:327�354.
UNESCAP. 2009. Statistical Yearbook for Asia and the Pacific. Bangkok: United NationsEconomic and Social Commission for Asia and the Pacific.
Veblen, T. 1915. Imperial Germany and the Industrial Revolution. New York, NY: Macmillan.Wade, Robert. 1990. Governing the Market: Economic Theory and the Role of Government in East
Asian Industrialization. Princeton, NJ: Princeton University Press.World Bank. 1993. The East Asian Miracle. Washington, DC: World Bank and Oxford University
Press.WTO. 2009. International Trade Statistics. Geneva: World Trade Organization.Young, Alyn. 1928. “Increasing Returns and Economic Progress.” The Economic Journal 38 (152):
527�542.Zeitlin, J. 1992. “Industrial Districts and Local Economic Regeneration: Overview and
Comment.” In Industrial Districts and Local Economic Regeneration, edited by F. Pyke andW. Sengenberger, 279�294. Geneva: International Labour Organization.
Journal of the Asia Pacific Economy 99
Dow
nloa
ded
by [
Prof
esso
r R
ajah
Ras
iah]
at 0
7:34
25
Mar
ch 2
015


