Embed Size (px)
Citation preview

UvA-DARE is a service provided by the library of the University of Amsterdam (https://dare.uva.nl)
UvA-DARE (Digital Academic Repository)
Infection prevention and control and antibiotic stewardshipTwo sides of the same coin in the prevention of antimicrobial resistanceMaina, J.M.
Publication date2021Document VersionFinal published versionLicenseOther
Link to publication
Citation for published version (APA):Maina, J. M. (2021). Infection prevention and control and antibiotic stewardship: Two sides ofthe same coin in the prevention of antimicrobial resistance.
General rightsIt is not permitted to download or to forward/distribute the text or part of it without the consent of the author(s)and/or copyright holder(s), other than for strictly personal, individual use, unless the work is under an opencontent license (like Creative Commons).
Disclaimer/Complaints regulationsIf you believe that digital publication of certain material infringes any of your rights or (privacy) interests, pleaselet the Library know, stating your reasons. In case of a legitimate complaint, the Library will make the materialinaccessible and/or remove it from the website. Please Ask the Library: https://uba.uva.nl/en/contact, or a letterto: Library of the University of Amsterdam, Secretariat, Singel 425, 1012 WP Amsterdam, The Netherlands. Youwill be contacted as soon as possible.
Download date:20 Oct 2022


1
Infection prevention and
control and antibiotic
stewardship: two sides of
the same coin in the
prevention of antimicrobial
resistance
Jackson Michuki Maina

2
This thesis was prepared at the Faculty of Medicine, Academic Medical Center
of the University of Amsterdam, The Netherlands and at the KEMRI-Wellcome
Trust Research Programme, Nairobi Kenya.
Copyright 2021, J. M Maina, Nairobi, Kenya
All rights are reserved. No part of this thesis may be reproduced, stored or
transmitted in any form or by any means without the prior permission of the
author.
Front cover: Daniel Maina
Paranymph: Nduku Kiko
Printed by IPSKAMP with support from the Academic Medical Center, University
of Amsterdam.
Michuki was the recipient of an IDEAL (Initiative to Develop African research
Leaders) PhD fellowship. This work was supported through the DELTAS Africa
Initiative [DEL-15-003]. The DELTAS Africa Initiative is an independent funding
scheme of the African Academy of Sciences (AAS)'s Alliance for Accelerating
Excellence in Science in Africa (AESA) and supported by the New Partnership for
Africa's Development Planning and Coordinating Agency (NEPAD Agency) with
funding from the Wellcome Trust [107769/Z/10/Z] and the UK government. The
views expressed in this publication are those of the author(s) and not
necessarily those of AAS, NEPAD Agency, Wellcome Trust or the UK
government.

3
Infection prevention and control and antibiotic stewardship:
two sides of the same coin in the prevention of antimicrobial
resistance
ACADEMISCH PROEFSCHRIFT
ter verkrijging van de graad van doctor
aan de Universiteit van Amsterdam
op gezag van de Rector Magnificus
prof. dr. ir. K.I.J. Maex
ten overstaan van een door het College voor Promoties ingestelde commissie,
in het openbaar te verdedigen in de Agnietenkapel
op woensdag 24 februari 2021, te 16.00 uur
door Jackson Michuki Maina
geboren te Nyeri
4
Promotiecommissie
Promotores: prof. dr. C. Schultsz
prof. dr. M. English
AMC-UvA
University of Oxford
Copromotores: dr. O. Tosas Auguet
dr. J. McKnight
University of Oxford
University of Oxford
Overige leden: prof. dr. M. van Vugt
prof. dr. S.E. Geerlings
AMC-UvA
AMC-UvA
prof. dr. M. Boele van Hensbroek AMC-UvA
prof. dr. R.C. Pool Universiteit van Amsterdam
prof. dr. F.N. Were University of Nairobi
prof. dr. A. Voss Radboud Universiteit
Faculteit der Geneeskunde

5
TABLE OF CONTENTS
Abbreviations 6
Chapter 1 Introduction 7
Chapter 2 Extending the use of the World Health Organisations’
water sanitation and hygiene assessment tool for surveys
in hospitals – from WASH-FIT to WASH-FAST
41
Chapter 3 Evaluating the foundations that help avert antimicrobial
resistance: Performance of essential water sanitation and
hygiene functions in hospitals and requirements for action
in Kenya
77
Chapter 4 Infection prevention and control during the COVID-19
pandemic: challenges and opportunities for Kenyan public
hospitals
169
Chapter 5 Evaluating hospital performance in antibiotic stewardship
to guide action at national and local levels in a lower-
middle-income setting
203
Chapter 6 Antibiotic use in Kenyan public hospitals: Prevalence,
appropriateness and link to guideline availability
233
Chapter 7 Using treatment guidelines to improve antibiotic use:
Insights from an antibiotic point prevalence survey in
Kenyan public hospitals
291
Chapter 8 Using a common data platform to facilitate audit and
feedback on the quality of hospital care provided to sick
newborns in Kenya
305
Chapter 9 General Discussion 329
Chapter 10 Summary, Samenvatting, Acknowledgements, Author
Portfolio & Resume
349

6
ABBREVIATIONS
A&F: Audit and feedback
ABS: Antibiotic Stewardship
AMR: Antimicrobial Resistance
ATC: Anatomical Therapeutic Chemical Classification System
BPP: Basic Paediatric Protocols
CIN: Clinical Information Network
ETAT+: Emergency Triage Assessment and Treatment Plus Admission
HAI: Hospital-Acquired Infections
IQR: Interquartile range
IPC: Infection Prevention and Control
KEMRI: Kenya Medical Research Institute
LMIC: Low and middle-income countries
MOH: Ministry of Health
NAR: Neonatal Admission Record
PPS: Point Prevalence Survey
REDCap: Research Electronic Data Capture
WASH: Water Sanitation and Hygiene
WASH-FIT: Water Sanitation and Hygiene Facility Improvement Tool
WASH-FAST: Water Sanitation and Hygiene facility survey tool
WHO: World Health Organisation

7
Chapter 1: Introduction
8
BACKGROUND Antibiotic use for infections was heralded as one of the significant discoveries
of our time, saving millions of lives since the discovery of penicillin in 1928
[1]. The discovery of newer molecules has not kept pace with the growing
resistance to antibiotics that has accompanied their ever-widening use.
Antimicrobial resistance (AMR) is broadly defined as the resistance of a
pathogenic micro-organism to an antimicrobial agent which was initially
effective for the treatment of infections caused by the organism [2]. In
addition to AMR related deaths, estimated at 10 million per year by 2050 [3],
worrying social and economic effects have also been noted. These include
pushing millions of people into extreme poverty as a result of increased costs
from drug-resistant infections and reduced productivity and loss of labour
due to sickness, and therefore widening the gap between the rich and
developing nations [4]. Although the threat of AMR is global, the most
significant effects will be in the low-income countries found mainly in sub-
Saharan Africa and the Asian continent [4]. These regions are already dealing
with multiple other health challenges, and the effects of AMR are expected
to worsen these.
Interventions to combat AMR mainly involve the integration of strategies
across sectors and levels of different systems. The ‘One Health’ approach is
one good example of this integration. The organisms that affect animal and
plant health also have a direct implication on the infections in humans and
vice versa. With this realisation interventions to combat AMR have also
targeted antimicrobial use in animals and plants [5]. Within the health sector,
interventions to combat AMR have been proposed at all levels, from the
community and hospital levels to the regional and international levels. These
interventions include the development of vaccines, newer drugs, increased

9
public awareness, improved diagnostics and surveillance, rational
antimicrobial use and infection prevention and control (IPC) measures[3, 6]
(Figure 1). Other interventions include the health workers educating the
patients on antibiotic use and proper prescription of antimicrobials. There is
now a push to actively and responsibly involve patients in IPC activities since
some of these patients have the potential to transmit disease. The patients
should, therefore, be viewed as real partners in IPC [7].
Figure 1 Strategies to combat Antimicrobial resistance at community, hospital, national and
international level
Despite the acceptance of the broad impact of antibiotic resistance and the
need for a one health approach, it is essential to recognise that hospitals play
an important role in resistance. Additionally, antibiotics are so central to the
role of the modern hospital, that any diminishment of their effectiveness
affects the overall capabilities of hospitals[8]. Hence, while an integrated and
holistic multisectoral approach encompassing multiple interventions is

10
pivotal for the management of AMR, this work focusses on hospital-level
strategies. Specifically, I focus on IPC and antibiotic stewardship in inpatient
settings [9, 10].
Here, I highlight the roles played by IPC and Water Sanitation and
Hygiene(WASH) in hospitals and their contributions to AMR. Additionally, I
propose why improving antibiotic use, and stewardship are central to the
reduction of AMR.
1.1 Infection Prevention and Control and Water Sanitation and Hygiene
Infection Prevention and Control is broadly defined as “a scientific approach
and practical solution designed to prevent harm caused by infection to
patients and health workers” [11]. Some of the IPC domains include hand
hygiene, waste management and use of personal protective equipment
(PPE). Water sanitation and hygiene (WASH) tends to crosscut all the major
IPC core components. These include water, sanitation and healthcare waste
management, hand hygiene, environmental management, cleanliness and
disinfection. Proper IPC and WASH structures within hospitals are associated
with better uptake of care by the community and increased health worker
morale and efficiency [9, 12]. They are also vital in moving countries towards
universal health coverage by improved quality of care and reducing
unnecessary expenditure caused by antimicrobial resistance in hospitals [13].
The contribution of WASH to AMR has been demonstrated at the community
and hospital levels. At the hospital level, the effects of these weak WASH and
IPC structures are demonstrated by the high burden of hospital-acquired
infections (HAIs). These HAIs are the most frequent adverse events in the
provision of healthcare worldwide which are largely preventable. Multidrug-

11
resistant organisms often cause these infections, which result in extended
hospital stays, increased costs of care and are associated with increased
mortality [14]. It is estimated that 15% of hospitalised patients in developing
countries develop hospital-acquired infections [15]. These HAIs include post-
partum and neonatal infections due to unclean deliveries [16].
In addition to hospitals being the epicentre for HAI’s, hospitals generate
clinical waste which if not well handled, contaminates the environment with
drug-resistant organisms with a resultant spread of disease to communities
[17]. With a focus on the one health approach, contamination of the water
and soils with these organisms also affects animal and plant health.
Poor WASH also alters the clinicians’ behaviour and practice. Some of which
lead to the overuse of antibiotics in hospitals. Recent surveys from Uganda
and Tanzania present antibiotic prescription as a “solution” or “quick fix” to
inherent problems of poor care due to weak health systems and lack of
proper hygiene structures. This focus on prescription instead of fixing the
underlying hygiene problems and other key issues worsens AMR due to
irrational use of antibiotics [18].
Improving behaviour, the environment (including WASH) coupled with
proper use of antibiotics can markedly reduce the burden of HAI[19]. In
resource-limited settings, providing high-quality primary care, some of which
entails proper WASH and IPC could see a marked reduction in hospital
mortalities, including neonatal deaths [20].
Recent global surveys by the World Health Organisation(WHO), in 2014, show
significant shortcomings in the state of WASH across all primary care health
facilities. About 25% of the facilities assessed did not have essential water
services, and 20% of them had poor sanitation services, including inadequate
functioning toilets. More than half of the facilities had inadequate waste

12
disposal arrangements [21]. Similar but limited work has been carried out in
Kenyan hospitals accessing WASH and IPC capacity. In a recent survey
observing IPC behaviour among health workers in primary health care
facilities in Kenya, there was poor compliance to hand hygiene practices, use
of personal protective equipment including the use of gloves, poor handling
of needles, sharps and waste segregation. The study found a weak
association between compliance and the level of clinician knowledge and
availability of supplies and it also demonstrated the need for reinforcing the
behavioural norms to improve IPC in addition to the provision of supplies and
training [22].
In addition to poor behaviour, weak WASH infrastructure and poor
leadership have also been demonstrated to reduce compliance to IPC.
Additional work assessing IPC compliance among hospital workers in a
Kenyan district hospital demonstrated the significant barriers to IPC
compliance included frequent water shortages, poor leadership due to
inactive IPC committees and lack of frequent training on IPC [23].
To improve IPC, the WHO developed guidelines on the core areas of focus on
IPC at national and hospital levels [24]. These components form the platform
on which most IPC arrangements at the facility level should be built (Figure
2).

13
Figure 1 Core components of Infection prevention and control
Based on these components, the Kenyan Ministry of Health developed
guidelines on IPC. The main areas of focus include the use of personal
protective equipment, hand hygiene, prevention of needle stick injuries,
waste disposal and environmental hygiene [25]. The implementation of these
Kenyan guidelines is underway, but there has been no formal assessment of
the state of IPC in Kenyan hospitals, and no clear mechanism for audit and
feedback exists to promote the improvement of IPC in Kenya.
At a global level, based on the eight IPC core components and from the
results of the WASH global survey, the WHO developed a facility improvement
tool (WASH FIT) that expands on existing standards for safe and clean health
facilities [13]. These standards include the “Essential Environmental Health
Standards in Health Care (EEHH)” that describe standards of water quality
and quantity and health care waste disposal [26].
Using WASH assessment tools like the WASH-FIT to assess IPC infrastructure
within health facilities is a good starting point to identify the IPC gaps. Training
materials on the use of the WASH-FIT are freely available, and the tool is easy
Core components of Infection prevention and control
1. IPC programme with a dedicated and trained team in every facility
2. Develop evidence-based guidelines to reduce HAI and AMR
3. Education and training on IPC at each facility
4. Facility-based surveillance of HAI
5. Implement IPC activities using a multimodal strategy
6. Regular monitoring, audit and feedback on IPC standards
7. Monitor workload, staffing and bed occupancy
8. Clean environment, materials and equipment for patient care

14
to use within hospital settings. In this thesis, I propose the use of this WASH-
FIT tool for IPC assessment in health facilities in Kenya and other resource-
limited settings.
1.2 Antibiotic Stewardship and Rational antimicrobial use
Rational antimicrobial use is another key strategy to reduce AMR. Rational
drug use as defined by the WHO demands that “the appropriate drug be
prescribed, that it be available at the right time at a price people can afford,
that it be dispensed correctly, and that it be taken in the right dose at the
right intervals and for the right length of time. The appropriate drug must be
effective, and of acceptable quality and safety defined” [27].
Antibiotic Stewardship (ABS) is defined as “the optimal selection, dosage, and
duration of antimicrobial treatment that results in the best clinical outcome
for the treatment or prevention of infection, with minimal toxicity to the
patient and minimal impact on subsequent resistance” [28]. Efforts to
promote rational antibiotic use have seen the development of antibiotic
stewardship policies and hospital committees. These policies include clinician
education on sound prescription patterns, hospital antibiotic audits,
antibiotic use guidelines, essential drug lists and surveillance systems to track
AMR patterns [29]. These programmes have been shown to decrease
antibiotic use, HAIs and subsequently AMR [10]. In many African countries,
these stewardship activities suffer from poor leadership and lack of funding.
Additionally, guidelines may not exist, or may not be frequently updated.
Also, few surveillance programmes to help to monitor the use of antibiotics
are currently in place [30].

15
Antibiotic stewardship, prescription and use is often driven by complex,
inter-related influences spanning macro ([inter]]National), meso (Hospital)
and micro (Patient and Clinician) levels of the health system.
At the patient level, age, sex, disease severity, and comorbidity influence the
number and type of antibiotics prescribed [31, 32]. At the clinician level,
some of the factors that drive antibiotic prescriptions include fear of missing
infections, poor practices taught by senior clinicians, prescription pressure
from patients and fellow clinicians and the level of training [33-35]. To retain
the doctor-patient relationship, some clinicians report having to prescribe
antibiotics with no clear indications for example in respiratory tract infections
which may be viral in origin or ‘just in case’ a bacterial infection is present due
to diagnostic uncertainty [36, 37]. In a review of prescriptions practices by
physicians in India, some prescribed antibiotics for sustainability and
financial reasons, with the physicians reporting they prescribed because they
did not want to watch and wait and therefore lose the patients to other
clinicians due to poor outcomes [37]. Other factors related to clinicians that
affect their prescriptions include their perceptions of patient safety and their
willingness to comply with treatment guidelines [38].
At the hospital level, the level of care provided by the facility affects antibiotic
use with critical care and neonatal units having more prescriptions and
greater use of non-first line regimens [39]. In other facilities where there was
an oversupply of antibiotics with near expiry dates, the clinicians resulted in
prescribing antibiotics that may not be necessary for the patients [37]. In
hospital presence of laboratory support and clinical practice guidelines can
improve decision making and positively affect antibiotic usage [40, 41].
Antibiotic stewardship committees, infectious disease specialists and

16
educational programmes that train the clinicians on antibiotic use also
influence how antibiotics are prescribed in these facilities [33, 42].
At the national level, the provision of national treatment guidelines and
training of medical personnel and the provision of essential drug lists
influences prescriptions across all levels of care [43]. There are also
professional norms instilled on health workers that define best practice
which would influence antibiotic use and stewardship [44]. At international
levels, some of the drivers include the efforts by organisations like the WHO
to improve antibiotic stewardship.
Studies examining antimicrobial resistance, antibiotic use and stewardship in
Africa and locally point to some serious challenges. The World Health
Organization (WHO) Antimicrobial Resistance Global Report on Surveillance
(2014) reports high resistance among major disease-causing organisms
(Escherichia coli, Klebsiella pneumoniae and Staphylococcus aureus) in most
regions across the world [45]. In the African region, data on AMR have been
collated in a recent systematic review of 144 studies. More than half of these
studies were conducted after 2013 [46]. The report shows significant median
resistance (MR) estimates to commonly used antibiotics for common
illnesses that are of significant concern (e.g. 26% MR to penicillin in
Streptococcus pneumoniae; 34% MR to amoxicillin in Haemophilus
Influenzae). MR was also estimated at 88% to amoxicillin and 30% to
gentamicin in Escherichia coli, which is a common bacterial pathogen in the
African region in the neonatal populations in particular. Similarly, East African
data on antimicrobial resistance reports increased resistance of
Streptococcus pneumoniae and Haemophilus Influenzae and other gram-
negative organisms to the common first-line therapies[47]. These alarming

17
levels of resistance highlight the need for prevention of further increases
while novel interventions are developed and implemented.
Data on antibiotic use in Africa report high proportions of use of beta-lactam
penicillins and cephalosporins in adult patients with less than 15% of these
prescriptions supported by bacteriological and antibiotic susceptibility tests
[48]. Kenyan studies which are mainly from single hospitals show that more
than 70% of hospitalised patients are on antibiotic treatment. This is despite
often having conditions that do not warrant antibiotic treatment [49]. The
common antibiotic prescriptions include penicillin, 3rd generation
cephalosporins and imidazole derivatives, mainly metronidazole [50].
To improve the availability of data on antibiotics, the WHO commissioned a
global surveillance system to measure antibiotic consumption at national and
regional levels[51]. This system encourages monitoring of antibiotic use at
the community and hospital level. At the community level, this surveillance
includes primary care settings and outpatient clinics. The system monitors
hospital data at both the public and private sectors looking at the antibiotics
used (products and packages). However, it does not consider prescription
quality at, ward or patient level. To measure antibiotic use and quality of
prescriptions at the hospital and patient level, point prevalence surveys(PPS)
have been extensively used [50, 52]. The Global Point Prevalence Survey of
Antimicrobial Consumption and Resistance (Global-PPS), is one of the leading
surveys available globally. Since its inception in 2015, the Global PPS has been
conducted yearly in more than 300 hospitals globally, but very few in Africa
and Kenya, only a few private hospitals are involved. The Global-PPS aims to
generate global data on antibiotic use and resistance in inpatient settings. It
also aims to identify and measure interventions to improve quality of
prescription [48, 53]. If done at a larger scale in Kenya, these surveys would

18
provide crucial data on antibiotic use. Part of this work carries out these
surveys in select Kenyan hospitals.
Following the endorsement of the Global action plan on AMR during the 68th
World Health assembly, Kenya developed a national policy on the prevention
and containment of AMR in 2017 [54]. The main objectives of the policy are
to improve awareness on AMR, increase AMR surveillance, reduction of
infections through improved IPC and optimisation of antimicrobial use. In the
policy, the national government is tasked with the process of resource
mobilisation to meet the objectives of the policy, including AMR surveillance
and also provide resources for related activities like IPC [54]. Little is known of
how these and other related policies have affected antibiotic use in Kenyan
public hospitals, and this work seeks to understand this.
1.3 IPC and AMR in the face of emerging infectious diseases
IPC and WASH are essential in the management of pandemics, including
COVID 19 and Ebola. Proper hand hygiene is crucial in reducing virus spread
[55]. In the hospital setting, waste disposal, disinfection, and the proper use
of personal protective equipment (PPE) are key to mitigate the spread of
COVID-19 and protect health workers [56].
The emergence of COVID-19 has also been a significant threat to AMR. This is
due to the increased use of antibiotics due to the fear of possible secondary
bacterial infections in COVID-19 patients [57]. Hospitalisations, including
those due to COVID-19 infection increase the risk of HAI, some of which are
drug-resistant infections [14]. The increased use of bactericidal cleaning
agents and disinfectants may increase the selection of drug-resistant genes
in hospitals and communities [58]. The disruption of health services due to
COVID-19 may result in a surge in vaccine-preventable diseases and HIV

19
associated infections which may mean increased antibiotic use further
driving AMR [59].
1.4 Kenyan Health System
In Kenya, hospitals are categorised based on the care provided into six levels.
The lowest level (level 1) is the community health services; level 2,
dispensaries and clinics; level 3 is health centres; level 4 are sub-county
hospitals (formerly district hospitals) and some private hospitals; level 5 is the
county referral hospitals and larger private hospitals, and the highest level
(level 6) is the national referral hospitals [60]. In August 2010, Kenya adopted
a devolved system of government with the creation of 47 counties and
devolved the management of health services to the county governments [61].
The central government is responsible for policy generation and the
management of level 6 hospitals. It also retained the running of some critical
programmes including national tuberculosis, HIV, blood transfusion and
immunisation programmes. Provision of curative services, the running of
hospitals (level 1 - 5) and human resource management are under the county
governments with funding by the central government. Funding for health in
Kenya is mainly through the government and donor agencies, contributions to
the national hospital insurance funds (NHIF) and private medical insurances
and out of pocket payments [62].
Overall, the public facilities account for 52% of all facilities, private facilities
at 37% and faith-based facilities at 11% [63]. The public health facilities cater
mainly for those in the lower-income brackets, most of whom do not have
medical insurance and pay for care out of pocket. Out of pocket expenditure
accounts for about 30% of the total health expenditure in Kenya [64]. Only

20
about 20% of Kenyans have some form of health insurance [64]. The health
insurance coverage is also skewed towards those who are wealthy. Insurance
coverage is higher in those in the highest wealth quintile at 42% coverage
compared to 3% coverage among those in the lowest quintile [65].
1.5 Study sites
This work was conducted in 16 hospitals in Kenya. These hospitals are located
in 11 counties in Kenya. Fifteen of these hospitals are selected purposively as
they are part of the clinical information network (CIN). The CIN is a
collaboration between the Ministry of Health, county departments of health,
Kenya Paediatric Association and the KEMRI Wellcome Trust Research
Programme. The main aim of the CIN, which was established in October 2013
is to improve the quality of paediatric and neonatal care through improving
the clinical documentation and data utilisation for decision making [66]. The
hospitals in the CIN are located in the high and low malaria zones of Kenya;
they are mainly level four and five public hospitals. These hospitals provide
inpatient medical, surgical and neonatal care. Some have specialised eye,
psychiatry, neurosurgery, renal and critical care units. The bed capacity
ranges between 130- 600 beds and the number of consultants in these
facilities ranging between 5-26. The additional hospital (H15 in figure 3
below) is a national referral hospital with 50 wards and 1800 beds. For this
hospital, due to logistical reasons, we conducted our study only in the
neonatal units. Figure 3 below provides the geographical location of these
hospitals in Kenya

21
Figure 3: Geographical location of the 16 study hospitals. The five hospitals in western
Kenya are located in the high malaria regions of Kenya.
2 JUSTIFICATION
As discussed above, I believe IPC and ABS are interlinked and understanding
them both individually and together is essential to combating AMR.
Unfortunately, little is known about their current level of implementation
across different settings in Kenya, what explains variability, and what
policymakers should prioritise. Additionally, this work seeks to identify what

22
gaps need to be addressed as starting points to strengthening these two
linked strategies to combat AMR.
To generate the contextual understanding of IPC arrangements in Kenya, this
work involved re-designing existing WHO assessment tools (WASH-FIT) to
make it appropriate for use in the context of larger hospitals that have
inpatient units [13]. This modified WASH-FIT tool was then used to assess
infrastructural, material and human resources to support WASH services,
across 15 county hospitals (mainly level 4 and 5 hospitals) in Kenya. Realising
the crucial role played by IPC and WASH in the containment of COVID-19, I
conducted follow-up interviews in the survey hospitals after the emergence
of COVID-19 in Kenya.
While most antibiotics are prescribed in outpatient clinics, consideration of
inpatient settings is crucial. Inpatient wards are where severe infections are
typically treated, and they also tend to be the sites where most HAI’s are
acquired and thus, are where patients are most likely to suffer the worst
clinical outcomes from AMR. Hospital inpatient areas also typically serve as
training centres where prescribing habits and behaviours often develop. This
work, therefore, focused on antibiotic use in inpatient settings. The work
examined antibiotic use and guideline availability across service units in
Kenyan public hospitals.
Additionally, I assessed the organisation of antibiotic stewardship structures
across these hospitals to highlight the challenges and opportunities to
improve antibiotic stewardship and use. Lastly, I propose some context-
relevant interventions specific to antibiotic stewardship and use. In
particular, I highlight the need for clinical practice guidelines in hospitals to
improve antibiotic usage. I also explore how improvements in data systems
might support better, continuous evaluation in the future.

23
OBJECTIVES
Main Objective
To assess hospitals Infection Prevention and Control (IPC) and Antibiotic
Stewardship(ABS) capacity as part of tracking and tackling efforts to limit
antimicrobial resistance in Kenya.
Specific Objectives
1. Develop a survey tool that can be applied at the national or sub-national
level to monitor WASH and infection prevention and control
performance in hospitals.
2. To evaluate the WASH and Infection prevention and control
arrangements in Kenyan county hospitals and explore how these may
vary within a single public health system.
3. To evaluate the opportunities and challenges for IPC and WASH
implementation in the COVID-19 pandemic.
4. To evaluate antibiotic stewardship arrangements in Kenyan hospitals to
guide action at the regional and national level.
5. To examine patterns of antibiotic use and guideline availability across
hospitals and medical specialities in Kenyan county hospitals.
6. To make a case for further development and use of treatment guidelines
in improving antibiotic usage in hospitals in low and middle-income
countries.
7. To examine the feasibility of creating an inpatient data platform to
support the regular assessment of appropriate and correct treatment in
Kenyan hospitals, taking inpatient neonatal units as an example.

24
3 STUDY DESIGN
Objective one took a mixed-methods approach. The development of the
survey tool involved conceptual thinking about the nature of the tool and its
purpose in the re-design phase, it also included a process of document review
and interviews with managers and a second phase was a consensus meeting
with relevant stakeholders to validate/critique the proposed tool
modifications. A mix of cross-sectional surveys and in-depth interviews were
employed for objective two and four. In-depth phone interviews were also
used for objective three to evaluate the opportunities and challenges for IPC
during the COVID-19 pandemic. A cross-sectional survey and hierarchical
modelling approaches were used to examine the factors influencing
antibiotic use and guideline availability (objective five). Objective six used
some data from the antibiotic survey to describe the importance of
developing clinical treatment guidelines. For the description of the common
data platform (objective seven), the data analysed were part of routine
admission data collected over three years in a neonatal unit, under the
neonatal clinical information network.
4 OUTLINE OF THE THESIS
This thesis consists of three main parts;
Part 1 ( Chapter two, three and four): This section assesses the structural and
organisational capacity of Infection prevention and control in Kenyan public
hospitals using a modification of the WHO WASH- FIT. To do this, I adapted the
WASH-FIT to a Water Sanitation and Hygiene Facility Survey Tool (WASH-
FAST) to enable assessment in larger hospitals and also assign responsibility
for action at different levels of the health systems.

25
Using the WASH-FAST, an assessment was carried out in 14 hospitals to
establish the status of WASH within hospital wards and across different
hospitals. These surveys were complemented by in-depth interviews with key
stakeholders at the hospital (hospital managers, doctors and nursed) and
county level to generate a contextual understanding of the survey results.
As follow up to the original surveys, I conducted follow up phone interviews
to the health workers in 11 hospitals during the COVID-19 pandemic to
understand if the findings and actions from the initial surveys had improved
preparedness and establish the new challenges the COVID-19 pandemic had
brought to the hospitals. Lastly, using a commentary, I present some insights
on the opportunities the COVID-19 pandemic brings to improve IPC.
This section concludes with two additions; an opinion piece on the role of the
infection prevention and control committees in the leadership of IPC within
the hospitals and why we should focus on strengthening these committees.
The second addendum is a policy brief that was prepared and presented to
the Ministry of Health and other stakeholders in Kenya. The brief provides an
overview of the WASH/IPC work.
Part 2 (Chapter five and six): This section focusses on antibiotic stewardship
and use. Using a set of 17 indicators, we assessed antibiotic stewardship
capacities in the study hospitals. These surveys were accompanied with in-
depth interviews with health workers, including pharmacy and laboratory
staff, to understand the stewardship practices better. Using a point
prevalence survey, I studied antibiotic use among hospitalised patients on
antibiotic treatment in the survey hospitals. The point prevalence survey also
assessed guideline availability within the hospital departments. Using
predefined criteria, I also established the appropriateness of antibiotic
treatment for these patients based on the documented diagnosis.

26
Part 3 (Chapter seven and eight): Based on findings from the first two parts,
I propose some interventions that would improve IPC and antibiotic
stewardship. The first is the importance of developing clinical practice
guidelines for use in hospitals. I use data from the point prevalence survey to
show the effects of having guidelines on treatment appropriateness. I
suggest some common clinical conditions in urgent need of guidelines and
highlight the guideline development process in resource-limited settings.
Secondly, I use routine clinical data from a large neonatal unit which was part
of the survey to illustrate how good data can improve decision making. Here
I illustrate how creating a standardised neonatal record together with cycles
of audit and feedback (A&F) to improve clinical documentation can generate
high-quality data and improve antibiotic dosing accuracy. Figure 4 below
illustrates how these sections are linked;

27
Figure 4; Framework of work to understand and improve the IPC and ABS arrangements
in Kenyan Hospitals
5 LIST OF PUBLICATIONS AND AUTHOR CONTRIBUTIONS
The individual papers and the authors are indicated in every chapter of this
thesis. The full table with author contributions is in the supplementary
materials (S1) which provides a list of publications by the objectives and
indicates the roles and contributions of all the authors.
6 FUNDING INFORMATION
This work was supported by funds from the economic and social research
council ESRCS # ES/P004938/1, and a Senior Research Fellowship awarded to
Prof Mike English by The Wellcome Trust (#207522). Michuki Maina is
supported by a grant from by the Initiative to Develop African Research
Leaders (IDeAL) through the DELTAS Africa Initiative [DEL-15-003], an
independent funding scheme of the African Academy of Sciences (AAS) ’s

28
Alliance for Accelerating Excellence in Science in Africa (AESA) and supported
by the New Partnership for Africa’s Development Planning and Coordinating
Agency (NEPAD Agency) with funding from the Wellcome Trust
[107769/Z/10/Z] and the UK government. The funders had no role in the
preparation or submission of this work.

29
7 REFERENCES
1. Ventola, C.L., The Antibiotic Resistance Crisis: Part 1: Causes and Threats. P t, 2015.
40(4): p. 277-83.
2. World Health Organization. Antimicrobial resistance. 2017 [cited 2017 18th
December]; Available from:http://www.who.int/mediacentre/factsheets/fs194/en/.
3. O’Neil, J., Review on Antimicrobial Resistance: Tackling Drug-Resistant Infections
Globally: Final Report and Recommendations. Wellcome Trust: London, UK, 2016.
4. Jonas, O.B., et al., Drug-resistant infections: a threat to our economic future. World
Bank Group, Washington, DC, 2017.
5. White, A. and J.M. Hughes, Critical Importance of a One Health Approach to
Antimicrobial Resistance. EcoHealth, 2019. 16(3): p. 404-409.
6. Rajesh R Uchil, G.S.K., Vijay M Katekhaye, Onkar C Swami, Strategies to Combat
Antimicrobial Resistance. Journal of Clinical and Diagnostic Research, 2014. 8(7): p.
ME01-ME04.
7. Fernandes Agreli, H., et al., Patient involvement in the implementation of infection
prevention and control guidelines and associated interventions: a scoping review. BMJ
open, 2019. 9(3): p. e025824- e025824.
8. Chandler, C.I., Current accounts of antimicrobial resistance: stabilisation,
individualisation and antibiotics as infrastructure. Palgrave communications, 2019.
5(1): p. 1-13.
9. Rainey R and Weinger M. The Role of Water, Sanitation and Hygiene (WASH) in
Healthcare Settings to Reduce Transmission of Antimicrobial Resistance. . AMR Control
2016 [cited 2017 18th December]; Available from:
http://resistancecontrol.info/infection-prevention-and-control/the-role-of-water-
sanitation-and-hygiene-wash-in-healthcare-settings-to-reduce-transmission-of-
antimicrobial- resistance/.
10. Paterson, D.L., The Role of Antimicrobial Management Programs in Optimizing
Antibiotic Prescribing within Hospitals. Clinical Infectious Diseases, 2006.
42(Supplement_2): p. S90-S95.
11. World Health Organisation. Infection prevention and control. 2018 [cited 2018 25th
October]; Available from: http://www.who.int/infection-prevention/about/ipc/en/.
12. World Health Organization, WASH in health care facilities: Links with the network for
improving quality of care for maternal newborn and child health 2017.
13. World Health Organization and UNICEF, Water and Sanitation for Health Facility
Improvement Tool (WASH FIT): a practical guide for improving quality of care through
water, sanitation and hygiene in health care facilities. 2017: Geneva.
14. Ducel, G., et al., Prevention of hospital-acquired infections: a practical guide. 2002.
15. Allegranzi, B., et al., Burden of endemic health-care-associated infection in developing
countries: systematic review and meta-analysis. The Lancet, 2011. 377(9761): p. 228-
241.
16. Say, L., et al., Global causes of maternal death: a WHO systematic analysis. Lancet Glob
Health, 2014.2(6): p. e323-33.

30
17. World Health Organisation. Safe management of waste from health care activities
2014 [cited 2018 18th December ]; Available from:
http://www.who.int/water_sanitation_health/publications/wastemanag/en/
18. Denyer Willis, L. and C. Chandler, Quick fix for care, productivity, hygiene and
inequality: reframing the entrenched problem of antibiotic overuse. BMJ Global Health,
2019. 4(4): p. e001590.
19. McLaws, M.-L., The relationship between hand hygiene and health care-associated
infection: it’s complicated. Infection and drug resistance, 2015. 8: p. 7.
20. Dickson, K.E., et al., Every Newborn: health-systems bottlenecks and strategies to
accelerate scale-up in countries. The Lancet, 2014. 384(9941): p. 438-454.
21. World Health Organization and UNICEF, Water, sanitation and hygiene in health care
facilities: status in low and middle income countries and way forward. 2015.
22. Bedoya, G., et al., Observations of infection prevention and control practices in primary
health care, Kenya. Bulletin of the World Health Organization, 2017. 95(7): p. 503.
23. Gichuhi, A., et al., Health Care Workers Adherence to Infection Prevention Practices
and Control Measures: A Case of a Level Four District Hospital in Kenya. American
Journal of Nursing Science, 2015. 4: p. 39-44.
24. World Health Organization, Guidelines on core components of infection prevention and
control programmes at the national and acute health care facility level. 2016: World
Health Organization.
25. Ministry of Public Health and Sanitation and Ministry of Medical Services, National
Infection Prevention and Control Guidelines for Health Care Services in Kenya. 2010,
Republic of Kenya: Nairobi.
26. John, A., B. Jamie, and C. Yves, Essential environmental health standards in health care.
Geneva: World Health Organization, 2008.
27. World Health Organization, The Rational Use of Drugs - Report of the Conference of
Experts, Nairobi 25-29 November 1985,. 1987, World Health Organization: Geneva.
28. Gerding, D.N., The search for good antimicrobial stewardship. Jt Comm J Qual Improv,
2001. 27(8): p. 403-4.
29. Centers for Disease Control and Prevention, Core elements of hospital antibiotic
stewardship programs. 2014.
30. Cox, J.A., et al., Antibiotic stewardship in low- and middle-income countries: the same
but different? Clin Microbiol Infect, 2017. 23(11): p. 812-818.
31. Monteiro, L.G.S., et al., Determinants of antibiotic prescription in paediatric patients:
The case of two hospitals in Maputo, Mozambique. South African Journal of Child
Health, 2017. 11: p. 109+.
32. Nobili, A., et al., Polypharmacy, length of hospital stay, and in-hospital mortality among
elderly patients in internal medicine wards. The REPOSI study. European Journal of
Clinical Pharmacology, 2011. 67(5): p. 507-519.
33. De Souza, V., et al., A qualitative study of factors influencing antimicrobial prescribing
by non- consultant hospital doctors. J Antimicrob Chemother, 2006. 58(4): p. 840-3.
34. Saleem, Z., et al., Antimicrobial prescribing and determinants of antimicrobial
resistance: a qualitative study among physicians in Pakistan. Int J Clin Pharm, 2019.
41(5): p. 1348-1358.

31
35. Steinke, D.T., et al., Practice factors that influence antibiotic prescribing in general
practice in Tayside. Journal of Antimicrobial Chemotherapy, 2000. 46(3): p. 509-512.
36. Butler, C.C., et al., Understanding the culture of prescribing: qualitative study of general
practitioners’ and patients’ perceptions of antibiotics for sore throats. Bmj, 1998.
317(7159): p. 637-42.
37. Kotwani, A., et al., Factors influencing primary care physicians to prescribe antibiotics
in Delhi, India. Family Practice, 2010. 27(6): p. 684-690.
38. Lucet, J.-C., et al., Antibiotic use: knowledge and perceptions in two university
hospitals. Journal of Antimicrobial Chemotherapy, 2011. 66(4): p. 936-940.
39. Benko, R., et al., Variations and determinants of antibiotic consumption in Hungarian
adult intensive care units. Pharmacoepidemiol Drug Saf, 2012. 21(1): p. 104-9.
40. Haldrup, S., et al., Microbiological point of care testing before antibiotic prescribing in
primary care: considerable variations between practices. BMC Fam Pract, 2017. 18(1):
p. 9.
41. Tan, T.Y., et al., Laboratory antibiotic susceptibility reporting and antibiotic prescribing
in general practice. Journal of Antimicrobial Chemotherapy, 2003. 51(2): p. 379-384.
42. Malani, A.N., et al., Clinical and economic outcomes from a community hospital’s
antimicrobial stewardship program. Am J Infect Control, 2013. 41(2): p. 145-8.
43. English, M., et al., Adoption of recommended practices and basic technologies in a low-
income setting. Arch Dis Child, 2014. 99(5): p. 452-6.
44. Ministry of Health, Kenya Quality Assurance Model for Health (KQAMH),Quality
Standards for Kenya Essential Package of Health. . 2009: Nairobi.
45. World Health Organisation, Antimicrobial Resistance Global Report on surveillance
2014, World Health Organization: Geneva
46. Tadesse, B.T., et al., Antimicrobial resistance in Africa: a systematic review. BMC
Infectious Diseases, 2017. 17(1): p. 616.
47. Ampaire, L., et al., A review of antimicrobial resistance in East Africa. Afr J Lab Med,
2016. 5(1): p. 432.
48. Versporten, A., et al., Antimicrobial consumption and resistance in adult hospital
inpatients in 53 countries: results of an internet-based global point prevalence survey.
The Lancet Global Health, 2018. 6(6): p. e619-e629.
49. Mulwa, N.C., et al., Patterns of Prescribing Practices in Makueni County Referral
Hospital, Kenya. African Journal of Pharmacology and Therapeutics, 2015. 4(4).
50. Okoth, C., et al., Point prevalence survey of antibiotic use and resistance at a referral
hospital in Kenya: findings and implications. Hospital practice, 2018. 46(3): p. 128-136.
51. World Health Organisation, WHO methodology for a global programme on surveillance
of antimicrobial consumption. 2016, WHO, Geneva.
52. Gharbi, M., et al., Using a simple point-prevalence survey to define appropriate
antibiotic prescribing in hospitalised children across the UK. BMJ Open, 2016. 6(11).
53. GLOBAL-PPS. Global Point Prevalence Survey of Antimicrobial Consumption and
Resistance 2015 [cited 2017 16th February]; Available from: http://www.global-
pps.com/.
54. Republic of Kenya, National Policy for the Prevention and Containment of Antimicrobial
Resistance. 2017: Nairobi, Kenya.

32
55. World Health Organization, Water, sanitation, hygiene, and waste management for the
COVID-19 virus: interim guidance, 23 April 2020. 2020, World Health Organization.
56. Herron, J.B.T., et al., Personal protective equipment and COVID 19- a risk to healthcare
staff? Br J Oral Maxillofac Surg, 2020.
57. Zhou, F., et al., Clinical course and risk factors for mortality of adult inpatients with
COVID-19 in Wuhan, China: a retrospective cohort study. Lancet, 2020. 395(10229): p.
1054-1062.
58. Caselli, E., Hygiene: microbial strategies to reduce pathogens and drug resistance in
clinical settings. Microbial Biotechnology, 2017. 10(5): p. 1079-1083.
59. Getahun, H., et al., Tackling antimicrobial resistance in the COVID-19 pandemic. Bull
World Health Organ, 2020. 98: p. 442-442A.
60. World Health Organization, Primary Health Care Systems (PRIMASYS): Case study from
Kenya. 2017, Geneva.
61. Government of Kenya, The constitution of Kenya. Government Printer. Kenya: Nairobi,
2010.
62. Barasa, E., P. Nguhiu, and D. McIntyre, Measuring progress towards sustainable
development goal 3.8 on universal health coverage in Kenya. BMJ global health, 2018.
3(3).
63. PharmAccess Group. A closer look at the healthcare system in Kenya. 2016 [cited 2020
26th August ]; Available from: https://www.pharmaccess.org/wp-
content/uploads/2018/01/The-healthcare-system- in-Kenya.pdf.
64. Dutta, A., et al., Kenya Health Financing System Assessment, 2018: Time to Pick the
Best Path. 2018, Palladium: Washington DC.
65. Ministry of Health, Kenya Household Health Expenditure and Utilisation Survey. 2018:
Nairobi.
66. Tuti, T., et al., Improving documentation of clinical care within a clinical information
network: an essential initial step in efforts to understand and improve care in Kenyan
hospitals. BMJ Global Health, 2016. 1(1).

33
Supplementary Materials S1: List of Manuscripts and Author Contributions
Chapter Manuscript Title Authors Author Roles
2 Extending the use of the World Health
Organisations’ water sanitation and hygiene
assessment tool for surveys in hospitals - from
WASH-FIT to WASH- FAST. PLoS One. 2019;14(12):
e0226548.
https://doi.org/10.1371/journal.pone.0226548
Michuki Maina, Olga
Tosas-Auguet, Jacob
McKnight, Mathias
Zosi, Grace Kimemia,
Paul Mwaniki,
Arabella Hayter,
Margaret
Montgomery,
Constance Schultsz
and Mike English
Michuki Maina: Conceptualisation, Data curation, Formal
analysis, Investigation, Methodology, Visualisation,
Writing – original draft, Writing
Olga Tosas-Auguet: Conceptualisation, Formal analysis,
Funding acquisition, Investigation, Methodology,
Supervision, Writing
Jacob McKnight: Conceptualisation, Formal analysis,
Investigation, Methodology, Supervision, Validation,
Writing
Mathias Zosi: Data curation, Investigation, Project
administration, Writing – review & editing
Grace Kimemia/ Paul Mwaniki: Formal analysis,
Investigation, Methodology, Software, Writing – review
& editing.
Arabella Hayter/ Margaret Montgomery: Methodology,
Resources, Validation, Writing – review & editing.
Constance Schultsz: Conceptualisation, Methodology,
Supervision, Writing
Mike English: Conceptualisation, Funding acquisition,
Methodology,Project administration, Supervision,
Validation, Writing – review & editing

34
3 Evaluating the foundations that help avert
antimicrobial resistance: Performance of essential
water sanitation and hygiene functions in hospitals
and requirements for action in Kenya. PLoS One.
2019;14(10): e0222922.
https://doi.org/10.1371/journal.pone.0222922
Michuki Maina, Olga
Tosas-Auguet, Jacob
McKnight, Mathias
Zosi, Grace Kimemia,
Paul Mwaniki,
Constance Schultsz,
Mike English
Michuki Maina: Conceptualisation, Data curation, Formal
analysis, Investigation, Methodology, Project
administration, Software, Supervision, Validation,
Visualization, Writing – original draft, Writing review &
editing
Olga Tosas-Auguet: Conceptualisation, Formal analysis,
Funding acquisition, Investigation, Methodology, Project
administration, Supervision, Validation, Visualization,
Writing – review & editing Jacob McKnight: Formal
analysis, Investigation, Methodology, Supervision,
Validation, review.
Mathias Zosi: Data curation, Investigation, Project
administration, Supervision, Writing – review & editing
Grace Kimemia/ Paul Mwaniki Formal analysis,
Investigation, Software, Validation, Writing – review &
editing
Constance Schultsz: Conceptualisation, Methodology,
Supervision, Writing – review & editing
Mike English: Conceptualisation, Funding acquisition,
Project
administration, Supervision, Writing – review & editing

35
4 Maina M, Tosas-Auguet O,
English M et al. Infection
prevention and control
during the COVID-19
pandemic: challenges and
opportunities for Kenyan
public hospitals [version 1;
peer review: 2
approved]. Wellcome Open
Res 2020, 5:211
(https://doi.org/10.12688/we
llcomeopenres.16222.1)
Michuki Maina, Olga
Tosas- Auguet, Mike
English, Constance
Schultsz and Jacob
McKnight
Michuki Maina: Conceptualisation, Interviews, Formal analysis,
interpretation Writing – original draft, Writing – review &
editing Olga Tosas-Auguet: Conceptualisation, Supervision,
Writing – review & editing
Mike English: Conceptualisation, Funding acquisition,
Project administration, interpretation, Writing – review
& editing, Supervision, Writing – review & editing
Constance Schultsz: Conceptualisation, Project
administration, interpretation, Writing – review & editing,
Supervision, Writing – review & editing
Jacob McKnight: Conceptualisation, Formal analysis,
Methodology, interpretation, Supervision, Writing – original
draft, Writing – review & editing
4(Addendum) COVID-19: An opportunity to
improve infection prevention and
control in LMICs
The Lancet Global Health,
Access Published:
August 13, 2020, DOI:
https://doi.org/10.1016
/S2214-109X(20)30352-
Michuki Maina, Olga
Tosas-Auguet, Mike
English, Constance
Schultsz, Jacob McKnight
Michuki Maina: Conceptualisation, Interviews, Formal
analysis, interpretation, Writing – original draft, review &
editing
Mike English/ Constance Schultsz/ Olga Tosas/ Jacob McKnight:
Conceptualisation, Methodology, interpretation Supervision,
Writing – review & editing
36
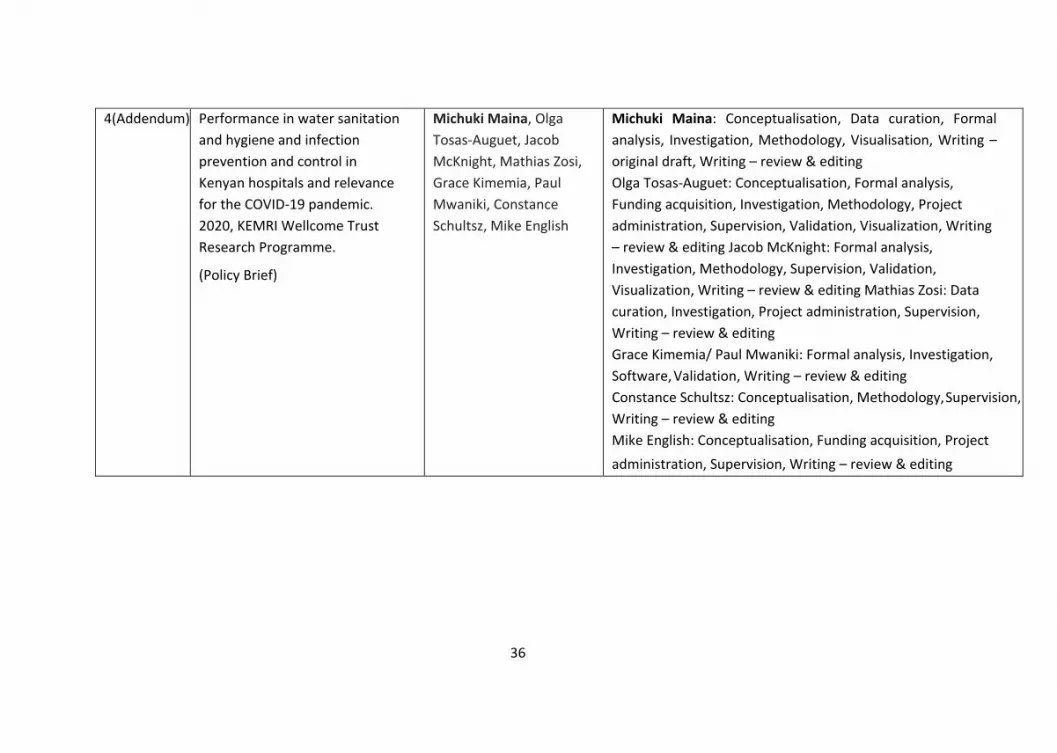
4(Addendum) Performance in water sanitation
and hygiene and infection
prevention and control in
Kenyan hospitals and relevance
for the COVID-19 pandemic.
2020, KEMRI Wellcome Trust
Research Programme.
(Policy Brief)
Michuki Maina, Olga
Tosas-Auguet, Jacob
McKnight, Mathias Zosi,
Grace Kimemia, Paul
Mwaniki, Constance
Schultsz, Mike English
Michuki Maina: Conceptualisation, Data curation, Formal
analysis, Investigation, Methodology, Visualisation, Writing –
original draft, Writing – review & editing
Olga Tosas-Auguet: Conceptualisation, Formal analysis,
Funding acquisition, Investigation, Methodology, Project
administration, Supervision, Validation, Visualization, Writing
– review & editing Jacob McKnight: Formal analysis,
Investigation, Methodology, Supervision, Validation,
Visualization, Writing – review & editing Mathias Zosi: Data
curation, Investigation, Project administration, Supervision,
Writing – review & editing
Grace Kimemia/ Paul Mwaniki: Formal analysis, Investigation,
Software, Validation, Writing – review & editing
Constance Schultsz: Conceptualisation, Methodology, Supervision,
Writing – review & editing
Mike English: Conceptualisation, Funding acquisition, Project
administration, Supervision, Writing – review & editing

37
5 Evaluating hospital performance
in antibiotic stewardship to
guide action at national and local
levels in a lower-middle-income
setting. Global health action.
2019;12(sup1):1761657.
https://doi.org/10.1080/16549716.
2020.1761657
Jacob McKnight, Michuki
Maina, Mathias Zosi,
Grace Kimemia, Truphena
Onyango, Constance
Schultsz, Mike English
and Olga Tosas-Auguet.
Jacob McKnight: Conceptualisation, design, acquisition of data
(interviewing), analysis and interpretation, drafting, revisions
Michuki Maina: Conceptualisation, design, acquisition of data
(interviewing, survey), analysis and interpretation, drafting,
revisions Mathias Zosi: Acquisition of data (survey), analysis and
interpretation Grace Kimemia: Acquisition of data
(interviewing), analysis and interpretation, drafting
Truphena Onyango: data acquisition(interviewing)
Paul Mwaniki: Analysis and interpretation, drafting;
Constance Schultsz/ Mike English: Conceptualisation, design,
analysis and interpretation, drafting, revisions
Olga Tosas-Auguet: Conceptualisation, design, acquisition of data
(survey), analysis and interpretation; drafting, revisions
6 Antibiotic use in Kenyan
public hospitals: Prevalence,
appropriateness and link to
guideline availability.
International Journal of infectious
diseases 2020. 99: p. 10-
18.
https://doi.org/10.1016/j.ijid.2020.
07.084
Michuki Maina, Paul
Mwaniki, Edwin
Odira, Nduku Kiko,
Jacob McKnight,
Constance Schultsz
Mike English and Olga
Tosas- Auguet
Michuki Maina: Conceptualisation, Project administration, data
collection and curation, Formal analysis, Investigation,
Methodology, Interpretation, Visualisation, Writing – original
draft, Writing – review & editing
Paul Mwaniki: Formal analysis, interpretation, visualisation,
Writing original draft, Writing – review & editing
Edwin Odira/ Nduku Kiko: Interpretation, Writing – original
draft, Supervision, Writing – review & editing
Jacob McKnight/ Constance Schultsz/ Mike English/ Olga Tosas:
Conceptualisation: Interpretation, Writing – original draft,
Supervision, Writing – review & editing

38
7 Using treatment guidelines
to improve antibiotic use:
Insights from an antibiotic
point prevalence survey in
Kenyan public hospitals
(Accepted for publication in BMJ
Global Health)
Michuki Maina, Jacob
McKnight, Olga Tosas-
Auguet, Constance
Schultsz and Mike
English
Michuki Maina: Conceptualisation, data collection, Formal
analysis, Investigation, Methodology, Interpretation,
Visualisation, Writing – original draft, Writing – review &
editing
Jacob McKnight/ Olga Tosas/ Constance Schultsz/Mike
English : Conceptualisation: Interpretation, Supervision,
Writing – review & editing
8 Using a common data platform
to facilitate audit and feedback
on the quality of hospital care
provided to sick newborns in
Kenya. BMJ Glob Health.
2018;3(5): e001027
http://dx.doi.org/10.1136/bmjgh
-2018-001027
Michuki Maina,
Jalemba Aluvaala,
Paul Mwaniki,
Olga Tosas-
Auguet,
Catherine
Mutinda, Beth
Maina, Constance Schultsz,
Mike English
Michuki Maina: Conceptualisation: Formal analysis,
Investigation, Interpretation, Visualisation, Writing – original
draft, Writing – review & editing
Jalemba Aluvaala: Conceptualisation, Interpretation, Writing –
review & editing. Paul Mwaniki: Formal analysis,
Visualisation, Writing – review & editing
Catherine Mutinda/ Beth Maina Interpretation, Writing –
review & editing
Constance Schultsz/ Olga Tosas/Mike English Interpretation,
Supervision Writing – review & editing

39
Section 1
Infection Prevention and Control in Kenyan Hospitals

40

41
Chapter 2
Extending the use of the World Health Organisations’ water sanitation and hygiene assessment tool for surveys in
hospitals - from WASH-FIT to WASH-FAST
Michuki Maina, Olga Tosas-Auguet, Jacob McKnight, Mathias Zosi,
Grace Kimemia, Paul Mwaniki, Arabella Hayter, Margaret Montgomery,
Constance Schultsz and Mike English
PLoS One. 2019;14(12): e0226548
https://doi.org/10.1371/journal.pone.0226548

42
Abstract
Background
Poor water sanitation and hygiene (WASH) in health care facilities increases
hospital-associated infections, and the resulting greater use of second-line
antibiotics drives antimicrobial resistance. Recognising the existing gaps, the
World Health Organisations’ Water and Sanitation for Health Facility
Improvement Tool (WASH-FIT) was designed for self-assessment. The tool was
designed for small primary care facilities, mainly providing outpatient and
limited inpatient care and was not designed to compare hospital performance.
Together with technical experts, we worked to adapt the tool for use in larger
facilities with multiple inpatient units (wards), allowing for comparison
between facilities and prompt action at different levels of the health system.
Methods
We adapted the existing facility improvement tool (WASH-FIT) to create a
simple numeric scoring approach. This is to illustrate the variation across
hospitals and to facilitate monitoring of progress over time and to group
indicators that can be used to identify this variation. Working with
stakeholders, we identified those responsible for action to improve WASH at
different levels of the health system and used piloting, analysis of interview
data to establish the feasibility and potential value of the WASH Facility Survey
Tool (WASH-FAST) to demonstrate such variability.
Results
We present an aggregate percentage score based on 65 indicators at the facility
level to summarise hospitals’ overall WASH status and how this varies. Thirty-

43
four of the 65 indicators spanning four WASH domains can be assessed at ward
level enabling within hospital variations to be highlighted. Three levels of
responsibility for WASH service monitoring and improvement were identified
with stakeholders: the county/regional level, senior hospital management and
hospital infection prevention and control committees.
Conclusion
We propose WASH-FAST can be used as a survey tool to assess, measure and
monitor the progress of WASH in hospitals in resource-limited settings,
providing useful data for decision making and tracking improvements over
time.

44
Introduction
Improving water supply, hygiene, sanitation and health care waste
management (segregation, collection, disposal and treatment of health care
waste) collectively abbreviated as WASH is a significant focus of the sustainable
development goals and the global health agenda [1]. In health care facilities,
this improvement is linked to specific benefits. These include reductions in
hospital-associated infections, antimicrobial resistance, better management
and control of disease outbreaks, improved staff morale and an overall
reduction in health care costs [2] [3]. The improvements in WASH also have a
positive influence at the community level as health staff model proper hygiene
practices even at the community level [4] - and may improve patients’ trust in
and experience of care and subsequently their satisfaction with and uptake of
health services [5] [6].
Gains to improve WASH in health care facilities, mainly in the low- and middle-
income countries have been slow in the last decade. In 2015, the World Health
Organization (WHO) and the United Nations Children’s Fund (UNICEF) through
the Joint Monitoring Programme for Water Supply, Sanitation and Hygiene
highlighted some the current gaps with WASH. From this evaluation of about
60,00 health facilities, almost 40% of these health care facilities did not have
access to an improved water source, about a third of them also lacked water
and soap for handwashing, and more than half lacked arrangements for safe
disposal of health care waste [7]. A majority of these facilities assessed were in
low- and middle-income countries.
In response to these challenges, the WHO/UNICEF developed the WASH in
health care facilities global action plan to “achieve universal access to WASH in
all facilities in all settings by 2030” [4]. As part of this initiative, core and

45
extended indicators to track and improve WASH in health care facilities were
developed, revised and tested across several African and Asian countries. The
”Water and Sanitation for Health Facility Improvement Tool” (WASH-FIT), which
contains these indicators, was then developed [8]. This tool has been validated
in several countries and was developed through consultation with experts and
stakeholders before its eventual roll out[9]. It is mainly targeted at facilities in
resource-limited settings. WASH-FIT covers four broad domains (Fig 1) and
comprises 65 indicators and targets for achieving minimum standards for
maintaining a safe and clean environment. These minimum standards are as set
out in the WHO Essential environmental health standards in health care[10] and
the WHO guidelines on core components of infection prevention and control
programmes at the national and acute health care facility level [11].
Fig 1 Domains assessed in WASH FIT[8]
WASH FIT was not designed for national or regional level situation analysis,
monitoring or tracking of WASH in health care facilities. Instead, the tool guides
health care facilities staff through a continuous cycle of assessing and
prioritising risks linked to poor WASH, defining and implementing
improvements and continually monitoring progress locally and autonomously.

46
WASH FIT thus focuses on actions involving maintenance and repair as well as
infrastructural and behavioural change, which are ideally integrated into
broader quality improvement plans.
WASH FIT is meant to be adaptable to the local context but was initially
developed for use in relatively small/less complex primary health care facilities
providing outpatient services, family planning, antenatal care and maternal,
newborn and child health services (including uncomplicated delivery; e.g.
health centres, health posts and small district hospitals). Following the
inspection of the facility as a whole, WASH FIT involves scoring all 65 indicators
using a three-level qualitative system (meets, partially meets, or does not meet
the required standard), but it does not generate an overall hospital score nor
can be used to generate a score for a particular service area or WASH domain.
Larger facilities (e.g. referral hospitals), however, raise specific issues. They
deliver both inpatient and outpatient care spread across multiple wards,
departments and service areas, and they also have more complex management
and leadership arrangements[8]. WASH FIT does not sufficiently consider the
broader health system context and its potential for influencing local change.
In Kenya for example, in larger hospitals, the hospital health management team
comprising the medical superintendent, health administrative officer, nursing
officer in charge and the departmental heads are involved in the day to day
running of the hospital [12]. These teams are assisted by different hospital
committees constituted within the hospitals; these include infection prevention
and control (IPC) committees. The hospital managers and committees prepare
budgets and staffing needs, but the final budgetary and human resource
allocation to these hospitals is the prerogative of regional/county government
[12]. Majority of these larger hospitals in many low- and middle-income
countries have similar organisational arrangements and some similar form of

47
regional administration who have a role in decision making and resource
allocation and need to be involved in the improvement of WASH.
Our report describes an adaptation of WASH-FIT to a Water Sanitation and
Hygiene Facility Survey Tool (WASH FAST). This entails an extension of the tool
to provide a comprehensive assessment of WASH services in hospitals providing
both outpatient and inpatient care. It also provides a mechanism to meet both
local, national and regional needs for tracking WASH improvements. The
adapted tool also considers the complex leadership and management
arrangements. It proposes how responsibilities should be allocated across
different levels of the health system to promote accountability and subsequent
improvement.
Methods
Ethics Statement
For this study, we sought and received informed consent in all cases where this
was relevant. All information received was handled confidentially. All quotes
from the study respondents were anonymised. This study received approval
from the Oxford Tropical research ethics committee ( OXTREC) from the
University of Oxford (Ref: 525-17) and from the Kenyan Medical Research
Institute (Ref: KEMRI/SERU/CGMR-C//086/3450).

48
Adaptation of WASH-FIT into WASH-FAST
The adaptation of WASH-FIT into WASH-FAST entailed: (1) Creating an intuitive
aggregation approach for the WASH indicators, to illustrate variation across
health care facilities and facilitate tracking of WASH over time; (2) Extending
assessment so that indicators are scored for each ward in addition to the facility
as a whole - to highlight potential variation in WASH within a larger facility and;
(3) identifying those responsible for action on WASH with relevant
stakeholders. We illustrate the value of extending WASH-FIT to WASH-FAST by
illustrating how data can be used for identifying challenges and highlighting
variation.
1. Aggregate scoring approach
The WASH-FIT already presents a ‘scoring’ approach with one of three possible
outcomes for each indicator, does not meet target, partially meets target and
fully meets target. The first step involved moving from this qualitative scoring
system to a simple quantitative scoring system that assigns a numeric score to
each indicator based on assessment findings as follows: 0- does not meet the
required standards (i.e. target), 1- partially meets target and 2- fully meets the
target. This enabled us to create aggregate domain scores (based on the
number of indicators within a domain) and aggregate facility scores (based on
all 65 indicators) that can be used to show domain and facilities’ performance.
These aggregate scores can also be colour coded to produce an easy to
interpret “traffic light” reporting approach.

49
2. Identification of ward level indicators
The second step involved identifying which of the existing and 65 WASH
indicators can be assessed at the inpatient-ward level. To select indicators for
assessment in every ward we employed an iterative process to review and
discuss the 65 indicators involving the research team and a team of 19 health
professionals comprising doctors, nurses, pharmacists and public health
officers who had been recruited to pilot test and apply the WASH assessments
in hospitals in Kenya. Using the same simple numeric scoring approach to the
identified indicators as in step 1 above enables aggregate ward scores to be
calculated to help identify variation between wards in the same hospital.
3. Assigning responsibility for action
The third part of the adaptation was to group indicators based on who should
take responsibility for action to improve WASH – addressing the issue of
accountability. For this process, a study team of 4 members familiar with the
Kenyan health care system and its management examined all 65 indicators in a
bid to understand how these indicators relate to one another and assign them
to domains linked to the persons/offices who would be responsible for action
to improve WASH. These levels of responsibility were confirmed through a
series of interviews with health care workers and a subsequent large
stakeholder workshop.
Demonstrating potential and creating tools to help visualise
performance and its variation
We proceeded to collect data using the WASH-FAST tool as part of a survey in
14 county hospitals varying in size and bed capacity across 11 counties during

50
which key informant interviews were also conducted (see below). This survey
is described in more detail in an accompanying paper [13]. In brief, the county
hospitals included are in high and low malaria zones in Kenya (five and nine
sites, respectively). The selection of these hospitals was purposeful and based
on links developed from ongoing work to improve clinical information as part
of a collaboration between the Kenya Medical Research Institute -Wellcome
Trust Research Programme and the Ministry of Health [14]. The survey involved
assembling a team of 7-8 people and conducting a facility assessment at each
hospital. The study team included a leader, four surveyors employed for the
study and 2-3 representatives selected based on their specific role as infection
prevention and control coordinators or public health officers from the
individual hospitals where the survey was being carried out. Data collection
used the same methodology as WASH-FIT and involved direct observation and
discussion with relevant hospital workers to provide clarification of the
assessment where needed. Each indicator was assessed, and the score
determined by team consensus as either not meeting target, partially or fully
meeting the target. Data were collected for each inpatient ward (using 34
WASH indicators), then for indicators assessed at the whole facility level (65
WASH indicators). The 65 facility level indicators included an assessment of
outpatient areas, common service areas (e.g. kitchen, laundry, laboratory,
waste management facilities) and the outdoor environment, taking account of
ward-specific scores where relevant, and represents an overall judgement of
the survey team. The data collection tools and standard operating procedures
used are provided in the supplementary information. (S1 File)
Aggregate scores were generated by summing individual indicator scores and
dividing this total by a denominator that assumed a perfect score for each
indicator.

51
In this way, we then estimate percentage scores for the hospital, WASH domain
and level of accountability using indicators linked to these grouping categories
as appropriate. Summary ward-specific scores were based on individual
indicator assessments made for each ward. The rationale for such sub-scores
was to highlight variation and priority areas for improvement and who should
take responsibility for improvement. To promote the rapid interpretation of
scores, we generated ‘traffic-light’ colour maps presenting percentage scores
using cut-offs of <40%, 40-60%, 60-80% and 80-100%. Data analysis for
visualisation was done using R, an open-source statistical package [15].
Use of qualitative data
Qualitative interviewing pursued two purposes; to understand IPC
arrangements in Kenyan hospitals (with findings reported elsewhere) and to
explore the feasibility and potential value of our proposed allocation of
indicators for accountability.
The interviews were conducted with 17 hospital managers (e.g. medical
directors, nursing and laboratory heads) and 14 frontline health workers (e.g.
consultants, medical and nursing officers) during the survey visits, in seven of
the 16 hospitals – sampled to ensure spread across different geographical
locations represented by the study hospitals.
Interviews were conducted by the first, third, and fifth authors and took
between 30 and 90 minutes. The first author led this section of work and
followed a semi-structured interview approach. The interviews were generally
guided by the ‘long’ or ‘ethnographic’ approach [16], but there was a particular
focus on responsibility for different areas of IPC and WASH, which provided
more structure to the inquiries in this area. All authors have experience with

52
medical research in Kenya, but the first author is a well-experienced doctor with
experience working in different county structures, and he guided the other
interviewers over the course of the interviewing.
The interviews were prefaced by an explanation from a senior member of staff
who had given permission for the research to take place on-site. All
interviewees were then given time to read a background information sheet
concerning the project, and each signed a full written consent. An opportunity
was offered to critique or refuse the interview, or to withdraw permission, but
no respondent chose to do this.
We used both purposive and snowball sampling in order to identify
respondents, and as much as was practically possible, we were mindful of the
mix of gender, age and experience and aimed to reflect this diversity in our
interviewee sampling strategy. Each interviewee was introduced to the
researchers by a senior member of staff familiar with the research, and the
interview took place in or near their place of work. The interviews were
conducted with one or two researchers away from patients and staff. We
ensured in each case that we did not take the respondent away from core tasks
or risk harm to their patients.
No repeat interviews were felt to be necessary, but the interview instrument
was honed to focus on areas of interest over time, allowing us to move beyond
areas where we had reached saturation and onto other new areas. The audio
files were transcribed and uploaded into NVivo 12, and the audio files were kept
on an encrypted laptop. It was relatively trivial to complete our primary goal of
identifying the formal, de jure responsibilities for each level, but it was also
important to code and describe the nuances of the de facto practices that
prevail in the studied sites (as described below).

53
We did not return transcripts to the respondents, but we have sought to share
general findings with hospital management and through the ministry and
county stakeholders with whom we are connected. Most importantly, we used
a stakeholder consultative workshop to confirm or revise the levels of
accountability and related indicator sets. This workshop included
approximately 120 technical experts and key stakeholders in WASH comprising;
Ministry of Health officials, Hospital WASH leaders, county health department
leaders, and doctors and nurses in Kenya with interest in IPC. This cross-
checking of indicator allocation to different levels of responsibility was
completed before creating scores for these domains. We also used the
stakeholder workshop to get feedback on the use of aggregate scores and data
visualisation approaches, confirming that the proposed reporting methods
would be of value to potential end-users.
The interview guides used for the study are available as a supplement. (S2File)
A (Consolidated criteria for Reporting Qualitative research) COREQ checklist
was successfully completed and is included as an appendix. (S3 File)
Results
From the tool redesign to collect data at ward level, we established that 34 of
the 65 indicators could also be assessed at the ward level. A description of all
65 indicators is provided as a supplement. Table 1 below provides a summary
of the number of indicators that were to be assessed at the ward and facility
level by the original WASH-FIT domains and by the proposed levels of
responsibility.

54
Responsibility for action
We developed a reorganisation of the existing WASH indicators based on their
logical relationship and who would be responsible for action resulting in a
classification with three levels of responsibility. These are, first, the county
government which should be concerned with indicators that are beyond the
control of hospital leadership (this level might be a national government where
resources are not fully devolved). The second level is the hospital health
management team (the medical superintendent, health administrative officer,
the nursing officer in charge and the departmental heads) and the last level is
the hospital infection prevention and control committee (Table 1).
On the proposed levels of responsibility in the WASH-FAST, although 2 of the 9
indicators under the responsibility of the county government could also be
assessed at ward level, these are (i) water services available in sufficient
amounts and (ii) having rewards for high performing staff, these only need to
be assessed at the facility level for tracking progress in follow up assessments.
Therefore, when grouped by the responsibility, we suggest only 32 of the
original 34 indicators are assessed at ward level (Table 1).

55
Table 1: Summary Indicators at ward and facility level by WASH domains and WASH-FAST
WASH-FIT WASH-FAST
WASH DOMAINS WASH DOMAINS ACCOUNTABILITY DOMAINS
Facility Ward Facility Ward Facility
Water 14 Water 6 14 County
Government
0 9
Sanitation &
Health care
Waste
22 Sanitation &
Health care
Waste
11 22 Hospital
Management
16 31
Hand hygiene,
Environmental
Management,
Cleanliness
and
Disinfection
18 Hand hygiene,
Environmental
Management,
Cleanliness
and
Disinfection
12 18 Infection
prevention &
control
committee
16 25
Organisational
Management
11 Organisational
Management
5 11
Total 65 Total 34 65 Total 32 65
The in-depth interviews allowed us to explore the relationships between the
WASH criteria and to establish where responsibilities lay for each. This
contributed to the emerging model of the layers of WASH management and
informed our understanding of the causalities and contingencies in this area.
County Level – The County is responsible for setting the budget for each
hospital, and importantly, sets the overall budget for health spending. This
impacts on general, but hugely important, WASH-related criteria such as

56
staffing levels and material upkeep of hospitals. Additionally, while each
department in each hospital is asked to project their needs for the next year as
part of hospital budgeting processes, the requested amounts may be ignored
by counties. Hospitals thus needed to work within the limitations of the budget
and staffing allowed them.
“You know normally we are told to itemise whatever we
require in the departments that we are working in …yes, by
different departments, come up with their budget proposal.
The administrator compiles the budget for the whole
hospital and then give it…we don’t control funds in the
institution. Every finance that is channelled to the hospital is
controlled by the chief officer in the county. So, we send the
budget to the county” Hospital Manager
Whereas the day to day running of the hospital is done by the hospital
management, some of the activities are delegated to committees within the
hospital.
Hospital Level – Key areas of hospital management were in part delegated to
committees that held responsibilities for activities and addressing needs. The
effectiveness of IPC committees in different hospitals appeared to be variable,
but where they were operational, they had an essential influence on resource
allocation and monitoring of WASH.
“…when the committee, the IPC committee, meets they raise
their needs as per various departments, and then the hospital
now addresses that. Like if you want to purchase, for instance,
you want bins, litter bins, disposal bags, waste disposal bags.

57
So, you raise your needs as per your department because you
know different departments have got their different needs”
Hospital Manager
However, despite their importance, these IPC committees in some facilities
struggled to gain respect relative to other more prestigious committees and
were regarded to be of low status.
There are some committees which are found to be more,
which are more do I say prestigious? They look better. So, if
I am in IPC, people will be thinking okay… so IPC will have no
one. I mean, what is the benefit of being in IPC, what is there,
how am I gaining being in IPC? Consultant
Ward Level – Interest and capability at the ward level is essential to effective
WASH. The individuals responsible for WASH at this level are not likely to have
the ability to affect budgets and resource allocation, but they are essential in
both maintaining supplies and overseeing important areas such as hand
hygiene. Variability in performance at ward level may be linked to the presence
of an individual in the ward who has interest and passion for IPC related
activities.
“And we also have someone, he’s also a team leader in the
infection control and making sure we have... whenever he’s
available we have our sanitisers, make sure we have soap,
make sure we have gloves” Frontline Health Worker
The relative importance of IPC varied ward to ward; however, with the newborn
units (NBU) often used as an example to contrast high versus low performance:

58
“Across the hospital, in NBU is where I know there is strict
infection prevention because once you are getting into NBU,
you remove your lab coat, you wash your hands and then you
get into the unit where you fold whatever you are wearing, a
long-sleeved anything you fold it, and then you get in the
unit… Now in other wards, we don’t have such strict infection
prevention, you get in, and you start...” Frontline Health
Worker
Consultative Workshop
The consultative workshop was held in November 2018 during the annual
national IPC symposium. There were 120 people in attendance. These included
Ministry of Health officials, managers from the hospitals and county
government, development partners and training institutions who are familiar
with infection prevention and control and WASH and frontline health workers.
The workshop attendees discussed, amended and approved the proposed
levels of accountability (Table 1) and made specific recommendations that
hospitals identify a champion to lead the IPC committees and to identify ways
of boosting morale for IPC related issues among health workers across these
hospitals.
Based on all of this work, a final indicator framework was developed (Fig 2)
that shows the relationship between the indicators, their original WASH-FIT
domains, and how they are allocated to different levels of responsibility. We
also use Fig 2 to highlight which of the individual indicators can also be
assessed at ward level.

59
Fig 2: Schematic layout of WASH FIT indicators. Illustrates how indicators assessed at ward and facility level are logically related. These are grouped by the original four domains and by levels of responsibility. The indicators with a red bold outline were also assessed at ward level. The dotted boxes are used to describe categories and are not part of the indicators.

60
Visualisation approaches to support monitoring
Using an example of data collected from four of the 14 hospitals, two large (H2,
H9) and two small (H1, H7) hospitals, we present an illustration (Fig 3) of how
performance of two domains (water and sanitation) vary between hospitals
(Panel A) and how the individual wards within these facilities performed (Panel
B). We note differences between domains and differences between hospitals,
with some facilities having scores of <50%. We also note variability across wards
in these hospitals. From this example (Panel B) for the water domain ward
scores in hospital H1 show, minimal variability compared to those of hospital
H9. We contrast our visualisations with data presented using the original
WASH-FIT template at the facility level for the four hospitals in Fig 3, Panel C.

61
Fig 3 Service performance variation by ward and hospital and the original WASH FIT scores. Panel
A: Radar Plot of facility-level scores from four hospitals for two domains (Water, Sanitation)
showing similar performance for sanitation overall but more marked variation for water varying
hospital performance. Panel B: Shows ward domain scores from multiple wards (dots) for two
domains (water, sanitation) illustrating their variation, the mean of these ward-specific scores (
circled cross) and the overall facility aggregate score (plain circle O). The overall facility score
includes an assessment of inpatient wards and other service areas (kitchen, outpatient, outdoor
environment) across the hospital. Panel C shows WASH-FIT facility-level scores of four hospitals
for the two domains.
To further illustrate how WASH-FAST can provide detailed information for use
at national and regional levels on hospital performance and where

62
responsibility for action lies, we present an example of all the 16 indicators
[spanning all the WASH domains] under the IPC committee at ward level. Here
we generate the summary ward scores for each of the four hospitals (H1, H2,
H7, H9) coded using a traffic light colour system with red being a score of <40%
and green indicating a score of >80%. Fig 4 illustrates a ‘dashboard’ approach
that shows performance across the hospitals for the individual IPC-committee
related indicators assessed at ward level (horizontal bar chart, for example
highlighting a need for the IPC committees to work on availing cleaning records
in the wards in these four hospitals). It also helps visualise the overall mean
ward scores for each hospital for all 16 indicators (the top panel vertical bar
chart). The central traffic light coding presents a summary of how the individual
indicators performed in each specific hospital.

63
Fig 4. Performance of IPC domain indicators. Ward level indicator performance (upper bars). The right bars summarise indicator performance across hospitals. The central grid shows individual indicator performance. SOP: standard operating procedures, ITN: insecticide-treated nets

64
Discussion
We have presented an adaptation of the Water and Sanitation for Health
Facility Improvement Tool (WASH-FIT) into WASH-FAST (Facility Survey Tool).
The adaptation entailed an extension of the tool to meet primarily national (i.e.
situation analysis, monitoring and tracking) needs, and to facilitate
comprehensive assessment of WASH services in larger – more complex –
secondary and tertiary health care facilities s encompassing both outpatient
and inpatient care and multiple medical specialties. The adapted tool scores
indicators at various levels of the facility (including by ward and by medical
specialty) and assigns levels of accountability for each indicator, to identify
what services can be addressed by whom locally or at higher levels of the health
system. An aggregated numeric scoring system, consisting of a percentage
score out of the total that would be obtained if all indicators met the expected
target, can be used to identify service areas requiring priority action within a
facility or to identify facilities or specialties requiring priority action nationally
or sub-nationally.
Adequate governance and leadership are one of the foundations for the
provision of quality care. Governance for quality includes improving
accountability and identifying the roles and responsibilities at all levels of health
systems and using data to make decisions [17]. Thus WASH-FAST may also be
used to identify responsible actors limiting or effecting positive change within
a facility and beyond, and to potentially reward excellent performance in a bid
to improve staff morale concerning IPC/WASH. WASH-FAST assumes that
performance and quality indicators for WASH are the responsibility of three
possible actors. These are, administrative division officers or governments
responsible for budgetary and human resource allocation to hospitals, senior

65
hospital management teams and relevant facility-based specialised committees
or groups of persons who are essential in decision making for IPC related
activities, such as the infection prevention and control committee. Although
the WASH-FAST was developed within a Kenyan context, we expect these broad
accountability domains (endorsed by government representatives, public
health officers, IPC experts and health care professionals through interviews
and a consultative workshop), to be generally applicable to most low- and
middle-income countries, with minor context-appropriate considerations. This
would allow more comprehensive use of WASH-FAST and could support within
or between-country comparisons where relevant.
We anticipate that aggregated scores derived from the application of WASH-
FAST can be used more broadly to inform health system leaders on whether
and what facilities and specialties require action at either local, sub-national or
national level to improve WASH services. The simple scores allow the
comparison of WASH services within and between facilities and or medical
specialties either cross-sectionally or over time (i.e. to identify changes in
quality and performance and trends), through repeated surveys. The extended
tool is hence a broadly applicable facility improvement tool – potentially
encompassing training, team building and risk assessment steps as per the
WASH-FIT process - that also appertains to WASH performance monitoring sub-
nationally and nationally. Training of health care facilities staff to partake in
surveys and facility improvement plans, in turn, empowers and encourages
staff to take interest and ownership on WASH and IPC, contributes to up-skilling
in these areas and improves short and long term sustainability of interventions
and developments where applicable [18]. WASH-FAST may also be applied to
help remedy the paucity of data on the status of WASH services in low- and
middle-income countries, help bridge evidence-based gaps and provide a

66
platform to monitor interventions aimed at improving AMR and patient safety.
This is while continuing to serve the original purpose of continuously informing
a local improvement plan in small primary health care facilities as well as more
extensive facilities comprising multiple wards and medical departments.
A limitation of both WASH-FAST (and WASH-FIT), is that the score assigned to
selected individual indicators may be subjective, where it relies on observations
that could vary from person to person. To mitigate this, we developed standard
operating procedures before data collection, conducted training for the data
collection teams and used consensus among surveyors to assign scores during
the assessments. WASH-FAST also rests on the premise that the hospitals have
well-structured leadership, including a functioning infection prevention and
control committee or relevant expert group. The indicators are also not
weighted in accordance to the health risk they pose, implying that identical
aggregate scores may have very different decision-making implications
depending on the composite of indicators considered in the score (e.g.
availability of water vs cleaning protocols). The same limitation applies to
repeated measurement, where a facility may get the same score over two
consecutive surveys, perhaps reflecting improvements in some areas but
worsening in others. To mitigate these limitations, aggregated (summary)
scores should be interpreted in the context of individual indicator scorings
presented through heatmaps or other visualisation tools.
We appreciate that although we adapted an already validated tool (WASH-FIT),
there is need to extend the use of the WASH-FAST to other populations and
settings to apply the tool under operational conditions, not by researchers.
Although it was not our aim to validate the WASH-FAST, we explored key
elements of face validity as described by Nevo [19]. We involved stakeholders,
experts and health workers in the consultative workshop, to check if the items

67
in the WASH-FAST were appropriate (rater involvement). The research team
and the stakeholders also assessed if the content in the tool, including the levels
of responsibility, was valid (hypothesised validity)[19]. The other major part of
face validity involves establishing if the method of measurement is appropriate,
and for this, we established through the consensus in the workshop that the
WASH-FAST was indeed suitable for assessing WASH practices. However,
looking at the nature of the tool and similar tools, where there are no gold
standard measures, validation may be challenging. It may need to be sufficient
that there is a consensus on the value of addressing the issues identified by
indicators. This may be thought of more as similar to an appraisal than a true
measurement of WASH performance on a linear scale.
To improve hospitals as platforms that provide high-quality care and prevent
the emergence of AMR, proper WASH, and IPC structures are core [17]. We
suggest that using WASH-FAST to monitor and improve the capacity for WASH
and IPC would enhance governance for quality and limit the emergence of AMR
by promoting accountability and identifying the roles and responsibilities at all
levels of the health systems [17]. In the process of accelerating universal health
coverage in many counties, hospital accreditation has become a key component
as it provides for insurers and governments a criterion for which hospitals to
include in their funding mechanisms. WASH-FAST can thus be used as part of
the tools for hospital accreditation to ensure they focus adequately on IPC
structures as part of preventing patient harm and AMR [20] [21].
Conclusion
We propose the WASH-FAST (Survey) tool as a modification/extension of the
original tool. Compared to the WASH-FIT, WASH-FAST provides for additional
assessment of WASH within the hospital and assigns responsibility for action.

68
Its use is most relevant in larger hospitals that have multiple inpatient
units(wards) as it allows for assessment at the ward level in addition to the
overall facility assessment. Due to its ability to provide aggregate scores, it can
be used to monitor and track the progress of WASH at the hospital, regional or
national levels providing crucial data for governments and international
development agencies who provide support for WASH. In addition, due to the
ability to assign responsibility for action, WASH-FAST allows for persons/teams
to take responsibility in improving the state of WASH at the hospital and
regional level. Where the primary aim is to support local improvement in
smaller facilities, WASH-FIT remains the tool of choice.
Acknowledgements
We thank the Ministry of Health and the council of governors who permitted
this work to be carried out. We also thank the hospital management and clinical
teams who supported the work in the survey hospitals. This work is published
with the permission of the Director of KEMRI.
Author contributions
The roles of the contributors were as follows: M Maina, J.M, O.T, C.S and M.E
conceived the study. M. Maina, G.K and M.Z, collected data, A.H and M
Montgomery, provided technical advice on the methodology, O.T, J.M assisted
M.M in data analysis and interpretation. M. Maina drafted the manuscript. M.
Maina, J.M, O.T, C.S, A.H, M. Montgomery and M.E critically revised the
manuscript for intellectual content. All authors read and approved the final
manuscript.

69
Data Availability
All summary data underlying the findings are freely available in the
manuscript and supplemental files. The raw data used for this manuscript are
hosted in a public repository Harvard Data verse. DOI Information:
https://doi.org/10.7910/DVN/IJUWWR

70
References
1. United Nations General Assembly. Transforming our world: the 2030 Agenda for
Sustainable Development. New York: United Nations. 2015;(1).
2. Hans Jørn Kolmos. Health Care Associated Infections: Sources and Routes of
Transmission. In: Infection Control – Updates Croatia2012 [cited 2017 2nd November ]. Available
from: http://cdn.intechopen.com/pdfs-wm/28876.pdf.
3. Rainey R and Weinger M. The Role of Water, Sanitation and Hygiene (WASH) in
Healthcare Settings to Reduce Transmission of Antimicrobial Resistance. 2016 [cited 2017 18th
December]. Available from: http://resistancecontrol.info/infection-prevention-and-control/the-
role-of-water-sanitation-and-hygiene-wash-in-healthcare-settings-to-reduce-transmission-of-
antimicrobial-resistance/.
4. WHO/UNICEF. Water, Sanitation and Hygiene (WASH) in Health Care Facilities Global
Action Plan [cited 2018 28th September]. Available from:
http://www.who.int/water_sanitation_health/healthcare_waste/wash-in-healthcare-facilities-
action-plan.pdf.
5. Bouzid M, Cumming O, Hunter PR. What is the impact of water sanitation and hygiene
in healthcare facilities on care seeking behaviour and patient satisfaction? A systematic review of
the evidence from low-income and middle-income countries. BMJ Global Health. 2018;3(3). doi:
10.1136/bmjgh-2017-000648. PubMed PMID: 29765776; PubMed Central PMCID:
PMCPMC5950627.
6. World Health Organization. WASH in health care facilities: Links with the network for
improving quality of care for maternal newborn and child health 2017.
7. World Health Organization, UNICEF. Water, sanitation and hygiene in health care
facilities: status in low and middle income countries and way forward. 2015.
8. World Health Organization, UNICEF. Water and Sanitation for Health Facility
Improvement Tool (WASH FIT): a practical guide for improving quality of care through water,
sanitation and hygiene in health care facilities. Geneva: 2017 9241511699.
9. Weber N, Patrick M, Hayter A, Martinsen AL, Gelting R. A conceptual evaluation
framework for the water and sanitation for health facility improvement tool (WASH FIT). Journal
of Water, Sanitation and Hygiene for Development. 2019. doi: 10.2166/washdev.2019.090.
10. John A, Jamie B, Yves C. Essential environmental health standards in health care.
Geneva: World Health Organization. 2008.
11. World Health Organization. Guidelines on core components of infection prevention and
control programmes at the national and acute health care facility level: World Health
Organization; 2016.
71
12. Barasa EW, Manyara AM, Molyneux S, Tsofa B. Recentralization within
decentralisation: County hospital autonomy under devolution in Kenya. PLOS ONE.
2017;12(8):e0182440. doi: 10.1371/journal.pone.0182440.
13. Maina M, McKnight J, Tosas-Auguet O, Zosi M, Kimemia G, Mwaniki P, et al. Evaluating
the foundations that help avert antimicrobial resistance: Performance of essential water
sanitation and hygiene functions in hospitals and requirements for action in Kenya
2019:Forthcoming.
14. Tuti T, Bitok M, Malla L, Paton C, Muinga N, Gathara D, et al. Improving documentation
of clinical care within a clinical information network: an essential initial step in efforts to
understand and improve care in Kenyan hospitals. BMJ Global Health. 2016;1(1). doi:
10.1136/bmjgh-2016-000028.
15. R Core Team. R: A language and environment for statistical computing. R Foundation
for Statistical Computing, Vienna, Austria. 2013.
16. McCracken G. The Long Interview.: Sage; 1988.
17. Kruk ME, Gage AD, Arsenault C, Jordan K, Leslie HH, Roder-DeWan S, et al. High-quality
health systems in the Sustainable Development Goals era: time for a revolution. The Lancet
Global Health. 2018;6(11):e1196-e252. doi: 10.1016/S2214-109X(18)30386-3.
18. de Francisco Shapovalova N, Meguid T, Campbell J. Health-care workers as agents of
sustainable development. The Lancet Global Health. 2015;3(5):e249-e50. doi: 10.1016/S2214-
109X(15)70104-X.
19. Nevo B. Face Validity Revisited. Journal of Educational Measurement. 1985;22(4):287-
93.
20. Smits H, Supachutikul A, Mate KS. Hospital accreditation: lessons from low- and middle-
income countries. Globalisation and Health. 2014;10(1):65. doi: 10.1186/s12992-014-0065-9.
21. National Health Insurance Fund. Assessment checklist for accreditation of Health
Facilities ( NHIF ACT 1998). Nairobi: NHIF; 2016.

72
Interviewee code Institution Position /role
Grade (where applicable) Age
Gender
Highest education / training
Years of experience in Infection Prevention and
Control
Membership to relevant organisations
Core competencies in infection prevention and control
(Tick the option that best defines the interviewee’s role)
Management / Supervision
Frontline contact, service or care
Comments:
Supporting Information S2
Semi-Structured Interview Guide for Hospital Managers and Frontline Healthcare Workers
C losed Questions
73
1. What IPC guidelines are available in this hospital? In your view, what guidelines/documents do you feel have affected the way you practice in this hospital?
Step through all general and domain-specific policy documentation and enquire about potential additional sources of information. >>
2. Do you have an IPC team? When did they last meet?
Ask who are members, when it meets, what roles and responsibilities are? >>
3. How are doctors, nurses and other healthcare workers trained for IPC at this hospital? How are they trained on the new guidelines? As a student?
Ask what percentage of staff have received; if renewed; who gave the training.>>
4. Is there a specific IPC budget? How much is it annually?
Investigate annual budget setting, how funds are allocated in general. Is IPC only funded as a management area by external sources? >>
5. What are the main IPC problems you experience at the hospital level?
<<Step into each one. Ask for examples, details on what the problems are and how they’re dealt with>>
Probes
Following the available guidelines by the clinicians? Funding
Lack of supply or poor-quality Equipment for IPC activities, e.g. gloves, masks
6. What do you think patients know about IPC?
<<Exploratory – looking for background. If they use phrases like ‘ignorant’, ask what they mean by this. If they differentiate between themselves and the patients, ask why nurses/doctors are different.>>

74
<<Explain AMR – infections becoming resistant to drugs – you know about Multi-Drug Resistant TB but happening to a lot of infections. Very difficult to treat – running out of antibiotics. IPC is one way of dealing with AMR, but we’re also interested in how you use antibiotics…
7. Have you heard of antibiotic stewardship? (yes – move to 8; no – explain ABS is where we’re careful we don’t use antibiotics for infections that don’t need them, or use the wrong antibiotics or don’t make sure patients finish their course).
8. Are there any guidelines or training for ABS (correct and rational use of antibiotics)? Is this dealt with as part of IPC?
By training, this may include CME, seminars and external training
<<Explore any differences. Be prepared to explain what ABS is. >>
9. How are doctors, nurses and other healthcare workers trained for ABS at this hospital? How are they trained on the new guidelines? As a student?
Ask what percentage of staff have received; if renewed; who gave the training.>>
10. Who sets policy for ABS in the hospital? What guidelines, if any are, they currently using for prescription of the antibiotics? How are you able to identify if antibiotics are not working? How is antibiotic resistance dealt with in this hospital?
Identify documents and guidelines in actual use first. Then ask if they are aware of national guidelines etc.
11. What do you think patients should know about antibiotics? Do you have patients that have preferred antibiotics? Do they know it’s important they should finish the course of medication? Do they sometimes stop and start? How do you get them to finish the course of medication?

75
<<As above, focus on any accusations of ‘ignorance’ or ‘lack of education’. Ask what this means, and how doctors/nurses deal with this. >>
12. I can imagine the workers at this hospital are very busy and have lots on their minds. How much do you think that IPC and ABS are prioritised at this hospital? Do medical staff see IPC as something important? how? why?
<<Do medical staff take responsibility for IPC? >>
(Thank the interviewee for their time, explain the project again, and inform them that they will be made aware of findings.)

76

77
Chapter 3
Evaluating the foundations that help avert
antimicrobial resistance: Performance of essential
water sanitation and hygiene functions in hospitals
and requirements for action in Kenya
Michuki Maina, Olga Tosas-Auguet, Jacob McKnight, Mathias Zosi,
Grace Kimemia, Paul Mwaniki, Constance Schultsz and Mike English
PLoS One. 2019;14(10): e0222922.
https://doi.org/10.1371/journal.pone.0222922

78
Abstract
Background
Water Sanitation and Hygiene (WASH) in healthcare facilities is critical in the
provision of safe and quality care. Poor WASH increases hospital-associated
infections and contributes to the rise of antimicrobial resistance (AMR). It is
therefore essential for governments and hospital managers to know the state
of WASH in these facilities to set priorities and allocate resources.
Methods
Using a recently developed survey tool and scoring approach, we assessed
WASH across four domains in 14 public hospitals in Kenya (65 indicators) with
specific assessments of individual wards (34 indicators). Aggregate scores were
generated for whole facilities and individual wards and used to illustrate
performance variation and link findings to specific levels of health system
accountability. To help interpret and contextualise these scores, we used data
from key informant interviews with hospital managers and health workers.
Results
Aggregate hospital performance ranged between 47 and 71% with five of the
14 hospitals scoring below 60%. A total of 116 wards were assessed within
these facilities. Linked to specific domains, ward scores varied within and across
hospitals and ranged between 20% and 80%. At ward level, some critical
indicators, which affect AMR like proper waste segregation and hand hygiene
compliance activities had pooled aggregate scores of 45 and 35% respectively.
From 31 interviews conducted, the main themes that explained this
heterogenous performance across facilities and wards included differences in

79
the built environment, resource availability, leadership and the degree to which
local managers used innovative approaches to cope with shortages.
Conclusion
Significant differences and challenges exist in the state of WASH within and
across hospitals. Whereas the senior hospital management can make some
improvements, input and support from the national and regional governments
are essential to improve WASH as a basic foundation for averting nosocomial
infections and the spread of AMR as part of safe, quality hospital care in Kenya.
Keywords
Water Sanitation and Hygiene (WASH), Infection prevention and control,
Antimicrobial Resistance
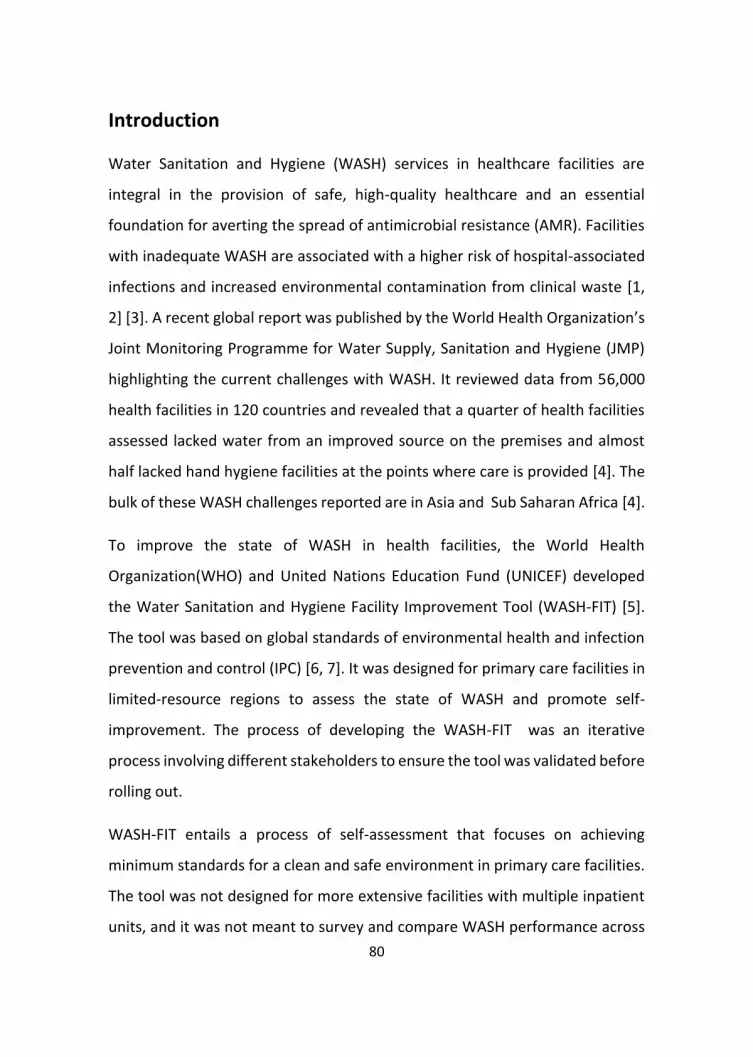
80
Introduction
Water Sanitation and Hygiene (WASH) services in healthcare facilities are
integral in the provision of safe, high-quality healthcare and an essential
foundation for averting the spread of antimicrobial resistance (AMR). Facilities
with inadequate WASH are associated with a higher risk of hospital-associated
infections and increased environmental contamination from clinical waste [1,
2] [3]. A recent global report was published by the World Health Organization’s
Joint Monitoring Programme for Water Supply, Sanitation and Hygiene (JMP)
highlighting the current challenges with WASH. It reviewed data from 56,000
health facilities in 120 countries and revealed that a quarter of health facilities
assessed lacked water from an improved source on the premises and almost
half lacked hand hygiene facilities at the points where care is provided [4]. The
bulk of these WASH challenges reported are in Asia and Sub Saharan Africa [4].
To improve the state of WASH in health facilities, the World Health
Organization(WHO) and United Nations Education Fund (UNICEF) developed
the Water Sanitation and Hygiene Facility Improvement Tool (WASH-FIT) [5].
The tool was based on global standards of environmental health and infection
prevention and control (IPC) [6, 7]. It was designed for primary care facilities in
limited-resource regions to assess the state of WASH and promote self-
improvement. The process of developing the WASH-FIT was an iterative
process involving different stakeholders to ensure the tool was validated before
rolling out.
WASH-FIT entails a process of self-assessment that focuses on achieving
minimum standards for a clean and safe environment in primary care facilities.
The tool was not designed for more extensive facilities with multiple inpatient
units, and it was not meant to survey and compare WASH performance across
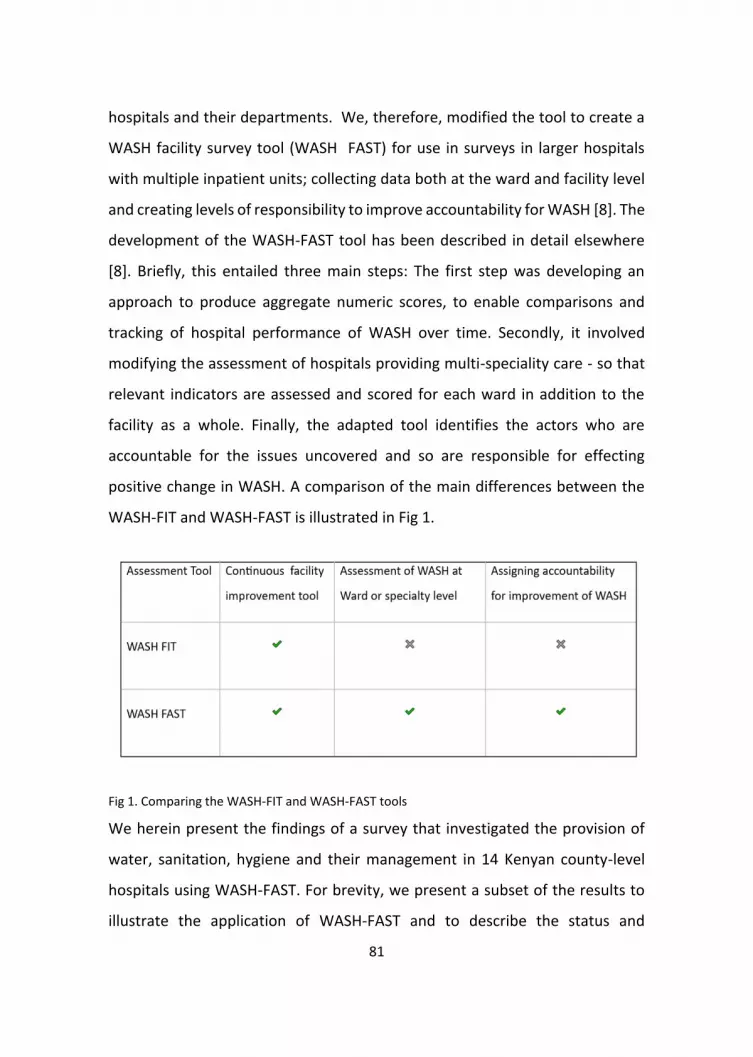
81
hospitals and their departments. We, therefore, modified the tool to create a
WASH facility survey tool (WASH FAST) for use in surveys in larger hospitals
with multiple inpatient units; collecting data both at the ward and facility level
and creating levels of responsibility to improve accountability for WASH [8]. The
development of the WASH-FAST tool has been described in detail elsewhere
[8]. Briefly, this entailed three main steps: The first step was developing an
approach to produce aggregate numeric scores, to enable comparisons and
tracking of hospital performance of WASH over time. Secondly, it involved
modifying the assessment of hospitals providing multi-speciality care - so that
relevant indicators are assessed and scored for each ward in addition to the
facility as a whole. Finally, the adapted tool identifies the actors who are
accountable for the issues uncovered and so are responsible for effecting
positive change in WASH. A comparison of the main differences between the
WASH-FIT and WASH-FAST is illustrated in Fig 1.
Fig 1. Comparing the WASH-FIT and WASH-FAST tools
We herein present the findings of a survey that investigated the provision of
water, sanitation, hygiene and their management in 14 Kenyan county-level
hospitals using WASH-FAST. For brevity, we present a subset of the results to
illustrate the application of WASH-FAST and to describe the status and

82
consistency of WASH services within and across hospitals. Full results at ward
level are provided in as a supplement (S1 Table). We draw on in-depth
interviews with hospital managers and frontline healthcare workers conducted
in parallel to the survey, to help interpret and contextualise WASH-FAST results.
We also show how the findings on WASH performance can be linked to different
levels of accountability within the health system. Finally, we identify best and
worst-performing indicators across the hospitals based on the scoring system,
some of which are critical to safe and quality patient care with implications for
emergence and transmission of antimicrobial resistance (AMR). The
quantitative and qualitative results combined provide important insights on
WASH to national and regional governments and hospital managers. Findings
can be used to inform prioritisation of actions and resource allocation aimed at
improving patient safety and reducing hospital-associated infections and AMR.
Methods
Ethics Statement
For this study, we made every effort to ensure the quality and integrity of the
research. We sought and received informed consent in all cases where this was
relevant. We respected the confidentiality and anonymity of our research
respondents and checked they were willing to participate in the study
voluntarily. We made every effort to anonymise quotes from the study
respondents. This study received approval from the Oxford Tropical research
ethics committee ( OXTREC) from the University of Oxford (Ref: 525-17) and the
Kenyan Medical Research Institute (Ref: KEMRI/SERU/CGMR-C//086/3450).
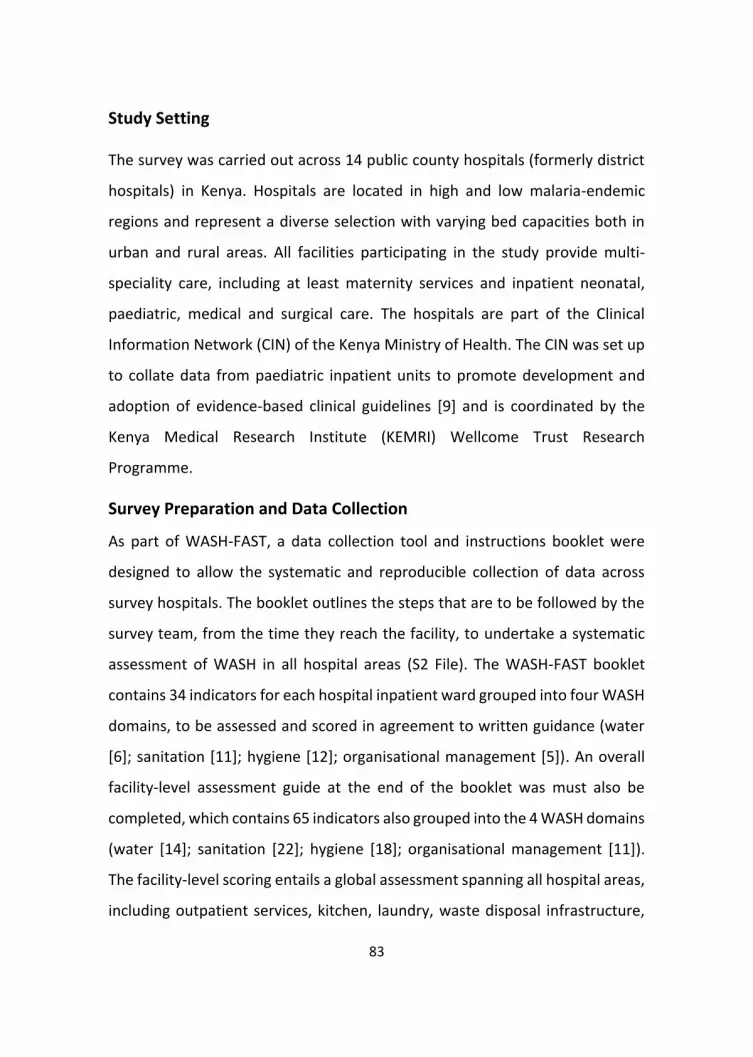
83
Study Setting
The survey was carried out across 14 public county hospitals (formerly district
hospitals) in Kenya. Hospitals are located in high and low malaria-endemic
regions and represent a diverse selection with varying bed capacities both in
urban and rural areas. All facilities participating in the study provide multi-
speciality care, including at least maternity services and inpatient neonatal,
paediatric, medical and surgical care. The hospitals are part of the Clinical
Information Network (CIN) of the Kenya Ministry of Health. The CIN was set up
to collate data from paediatric inpatient units to promote development and
adoption of evidence-based clinical guidelines [9] and is coordinated by the
Kenya Medical Research Institute (KEMRI) Wellcome Trust Research
Programme.
Survey Preparation and Data Collection
As part of WASH-FAST, a data collection tool and instructions booklet were
designed to allow the systematic and reproducible collection of data across
survey hospitals. The booklet outlines the steps that are to be followed by the
survey team, from the time they reach the facility, to undertake a systematic
assessment of WASH in all hospital areas (S2 File). The WASH-FAST booklet
contains 34 indicators for each hospital inpatient ward grouped into four WASH
domains, to be assessed and scored in agreement to written guidance (water
[6]; sanitation [11]; hygiene [12]; organisational management [5]). An overall
facility-level assessment guide at the end of the booklet was must also be
completed, which contains 65 indicators also grouped into the 4 WASH domains
(water [14]; sanitation [22]; hygiene [18]; organisational management [11]).
The facility-level scoring entails a global assessment spanning all hospital areas,
including outpatient services, kitchen, laundry, waste disposal infrastructure,

84
the outdoor environment, and prior assessment of inpatient wards. Written
guidance helps surveyors allocate a +, ++ or +++ score to each indicator, which
corresponds to 0, 1 or 2 in the numeric scale used to calculate aggregate and
percentage scores. The survey booklet provides text boxes to document field
findings and explain the rationale for individual indicator scores. Indicator
scores can also be used to assess specific WASH domains and sets of indicators
linked to different levels of accountability. At ward level, 32 of the 34 ward
indicators can be assigned for action/accountability. We use 16 indicators
linked to the overall hospital management domain and 16 to the infection
prevention and control committee (IPC) to explicate these uses [8].
A total of 19 health workers comprising doctors, nurses, pharmacists and public
health officers, were recruited before the study to assist with the survey. The
health workers were seconded to take part from the participating hospitals
based on their familiarity with, and interest in improving infection prevention
and control and WASH in their premises. Prospective surveyors were trained by
research team supervisors in February 2018 for one week. The training
comprised a theoretical and practical introduction to WASH, the WASH-FAST
tool and the survey standard operating procedures and included participation
in a one-day survey pilot at a district hospital with similar traits to facilities
participating in the study. WASH-FIT training modules from the World Health
Organisation (WHO) were adapted for the training of surveyors, while research
team supervisors received WASH-FIT training directly from WHO.
Data collection commenced one week after the training and pilot and continued
over two months (February- March 2018). Due to practical and logistical
considerations, surveyors were divided into three teams, each composed of 4-
5 surveyors plus one research team supervisor. Teams were then allocated a
sample of hospitals for assessment at either western Kenya (five Hospitals),

85
central Kenya (four hospitals) or around the capital city Nairobi (five Hospitals).
At survey sites, the surveyor team was joined by 2-3 hospital representatives
with specific roles as infection prevention and control coordinators or public
health officials. This approach facilitated the training of local focal persons and
built on-site capacity to undertake to follow up WASH assessments
independently in future.
Data collection began with a meeting with the hospital management to collate
information on the layout of the facility and retrieve the complete list of wards
and service areas. This was followed by a walk-through of the hospital, noting
the general external and indoor environments as well as any new or old
buildings and infrastructure. A thorough assessment of each eligible ward was
then conducted. The assessment included inpatient wards in the paediatric,
medical, surgical and neonatal departments but excluded units not present in
all hospitals (i.e. critical care, Ear Nose and Throat (ENT), eye, renal and
psychiatric units). In each eligible ward, ward assessment forms were
completed. Once these ward level inspections were complete, there was an
inspection of the entire facility, including the laundry, kitchen, outpatient areas
and the external environment. Each indicator was assessed by direct
observation and the score determined by team consensus on a three-point
scale (meets = 2, partially meets = 1, or does not meet = 0 the required
standard). A detailed explanation of the rating given was also provided in text
notes by the data collection team. In each facility, data were collected over four
days.
WASH is highly dependent on a range of health systems factors [10]. To
understand the causes for the performance outcomes we measured, and the
context of the survey results, the underlying health system components that
support WASH activities were also investigated, including the availability of

86
‘soft’ and ‘hard’ infrastructure, material resources, local guidelines, and
appropriate budgets. In addition, interviews were conducted with 17 hospital
managers (e.g. medical directors, nursing and laboratory heads) and 14
frontline health workers (e.g. consultants, medical and nursing officers) in
seven of the 14 hospitals. The sample was chosen to capture different socio-
demographic influences on WASH and to determine the generalisability of the
observations across the survey sites. To this end, interviewees also comprised
a balanced mix of gender, age and experience. The design of the original semi-
structured interview instrument was informed using informal discussions with
stakeholders and experienced Kenyan clinicians within the research team. The
instrument was subsequently revised organically throughout the research to
reflect new insights garnered through earlier interviews. These interviews were
conducted by the first, third and fifth authors. Each interview lasted 30-90
minutes. All the authors are well vast with the Kenyan context and have
conducted research in Kenya. The first author is a Kenya doctor with vast
experience working in the Kenyan health system and offered guidance to the
interviewers during this process. All the interviewees were approached under
the guidance of the hospital directors. Background information concerning the
study and interview was availed to these interviewees before consenting, which
was done in writing. None of the respondents declined to give informed
consent. These interviews were conducted in a quiet area of the hospital by one
or two members of the study team and were audio-recorded.
There were no repeat interviews conducted during this study after reaching
saturation. Although the transcripts were not returned to the respondents,
general anonymised feedback of the study was provided to hospital
management in each hospital.

87
All interview tools and information sheets are available on request. A
(Consolidated criteria for Reporting Qualitative research) COREQ checklist was
completed and is included as a supplement. (S3 File)
Data Quality Assurance
During the study, data on WASH were entered into paper forms in the booklets
provided. At the end of each day, the study coordinators together with the
teams reviewed the data entered to ensure all the indicators were assessed and
correctly documented. In case of any missing or unclear entries, the study team
made specific reassessments the following day to obtain the data. This was
done for all sites before moving to the next hospital. After completion of data
collection, data from the paper forms were entered electronically into a
database. To ensure data quality, double entry was done and counterchecked
by two members of the study team. All the interview recordings were stored
securely before being transcribed verbatim.
Data Analysis
For analysis, to compute aggregate scores, the three indicator levels: Does not
meet the target, partially meets and meets target were assigned numeric scores
0, 1, and 2 respectively and individual indicator scores summed within the pre-
specified levels of whole facility or ward or WASH domains or levels of
responsibility. There were two main scoring approaches used for data
analysis.[8]
1. Aggregate percentage scores within hospitals generated at
ward and facility level.
Percentage scores were derived after summing the numerators and
dividing these by the sum of denominators (representing the maximum

88
possible score) for sets of individual indicators as described above. We
used four categories to generate a colour chart with a “modified traffic
light” system to display results using cut-offs of <40%-red, 41-60%-
yellow, 61-80%-orange and 81-100%-green.
2. Aggregate performance across hospitals at domain and
indicator level.
The overall domain percentage across the 14 hospitals was derived
after summing the individual hospital indicator scores for each of the
four domains (numerator) presented as a proportion of the maximum
possible score. At the indicator level, the overall indicator percentage
by domain was computed as the total score of each indicator from all
the hospital wards as a proportion of the total maximum possible score.
These results are presented using simple histograms/bar charts to represent
results and variations, and in the case of ward level percentage score, a scatter
plot was used to describe each score and their variation and median score. All
quantitative data analysis was conducted in R [11].
Qualitative Data
The audio files were transcribed and uploaded into NVivo 12 [12], and the audio
files were kept on an encrypted laptop. The third and fifth researchers coded
the transcripts independently before discussing the codes and agreeing on
combined axial codes. These discussions also involved the first author who used
his knowledge of the survey data to make links between the survey findings and
the open codes generated from the transcripts. We then arranged the axial
codes according to the focus areas of the WASH-FAST survey,

89
Results
1.WASH-FAST
In this section, we present the results of the WASH survey at the facility level
and ward level. At ward level, these results are based on the specific WASH
domains and by levels of responsibility. We then use data from the qualitative
interviews to shed light on some of the quantitative findings from the WASH
indicator survey. We excluded two hospitals from our analysis (H12 and H15).
H12 is a rural health centre and therefore not comparable to the other more
extensive facilities. In H15, which is a national referral hospital, we only
assessed the neonatal unit and thus not able to compare with the other
hospitals.
The bed capacity for the 14 participating hospitals ranged from 131 to 594 beds
and the number of wards from 5 to 14. A total of 116 (85.3%) out of 136 wards
were assessed in the survey (Table 1). Of the 20 excluded wards, six were renal;
five were psychiatric, four were Ear Nose and Throat (ENT), three were
Intensive Care (ICU) and one each was an eye and a neurosurgical unit.

90
Table 1 Summary of Hospital size and wards assessed
Facility Hospital Bed capacity
Number of specialist doctors (consultants)
Number of wards in the facility
Wards assessed
Wards evaluated by Specialty Wards Excluded
Medical Mixed Medical Surgical
Neonatal Unit
Paediatrics Surgical
High Malaria Prevalence Zone
H1 203 5 7 6 3 0 0 1 2 Renal Unit
H3 550 12 14 11 4 2 0 1 4 Psychiatry, Renal Unit, ENTa
H7 180 7 6 6 3 1 0 1 1 None H8 250 14 8 7 3 1 0 1 2 Renal Unit H14 165 5 5 5 1 3 0 1 0 None Low Malaria prevalence Zone
H2 594 26 16 12 5 1 1 1 4 ENTa,ICUb, Psychiatry, Renal
H4 216 8 7 7 3 1 0 1 2 None H5 231 7 9 8 3 1 1 1 2 Psychiatry
H6 383 17 10 9 3 2 1 1 2 Neurosurgery H9 550 19 18 14 4 2 1 2 5 ENTa,Renal,
Psychiatry, ICUb H10 131 24 6 6 2 1 1 1 1 None
H11 320 21 9 9 4 3 1 1 0 None H13 378 20 15 10 4 1 1 1 3 ENTa,Renal,
Psychiatry, ICUb, Eye H16 350 14 6 6 2 1 1 0 2 None Total 136 116 44 20 8 14 30 20
a Ear Nose and Throat b Intensive care unit

91
Performance-based on Facility-level scores
Based on the 65 indicators assessed spanning all four domains at the facility
level, we present overall performance in each hospital in Fig 2 (vertical bars).
Performance varied from 47% (H1) to 71% (H6) with a median of 61% IQR [56-
65]. The central grid in Fig 2 represents the performance of the four domains in
each hospital. Two hospitals (H4, H5) had an aggregate score of <40% in the
hygiene domain (represented by red tiles in the colour chart). The domain
scores for pooled hospital data are presented by the horizontal bars in Fig 2.
From these horizontal bars, we note the hygiene domain performed poorest at
57%, and all the overall four domain scores are below 80 %.
Fig 2. Overall WASH Performance. The overall WASH facility performance based on all 65
indicators in four domains is shown by the upper vertical bars. The right horizontal bars
summarise the performance of each domain across 14 hospitals. The tiles in the central grid are
coloured according to the performance classification of each domain in each hospital, as shown
in the colour legend.

92
Ward level Performance
The ward specific scores are represented by dots in the scatter plot in Fig 3. A
median within hospital ward score (blue vertical lines in Fig 3) based on an all
hospital’s ward specific scores was generated for each of the WASH domains.
These median domain scores were all less than 60% (water domain 59%,
IQR[48-67], sanitation 55%, IQR[46-59], hygiene 54%, IQR[41-62] and
organizational management 40%, IQR[30-60]). There was notable variability in
the ward performance within hospitals, most marked in the water domain in
hospital H9 in which 14 wards were assessed (range 40-90%). To compare this
ward level performance with the overall score in the same facility, we include
the overall facility level for each domain in each hospital (represented by non-
shaded circles in Fig 3). By arraying the individual ward performance within
each WASH domain for each hospital, we note clusters of under-performance
mainly in the sanitation and management domains, where variability is
substantial and outlier wards. The substantial differences between facility-level
performance and ward performance are attributed to the inclusion of
assessments spanning service areas in the overall facility score not captured in
ward-based scores. We provided as an appendix the individual ward level
performance (minimum and maximum score, mean, median and IQR) for each
of the 34 indicators (S1 Table).

93
Fig 3. Horizontal scatter plot of the aggregate ward level scores (black points) by domain. (O) is overall facility aggregate score for each hospital by domain.
blue vertical line (median ward score for that domain). The colour bars represent cut off values of red <40%, orange 41-60%, yellow 61-80% and green 81-
100%.

94
WASH Domain Performance
Here, we examine how the individual indicators in the domains performed at
the ward level. In Fig 4, for each specific indicator in the sanitation domain, we
present the mean performance for each hospital (colour chart in the central
grid). Also shown is the mean performance for each indicator across all the 116
wards (the horizontal bars in Fig 4) and the mean ward performance in the
sanitation domain for each hospital (vertical bars in Fig 4). The WASH indicators
that performed poorly in H11 (indicated by red tiles under H11 in the central
colour grid) are waste management standard operating procedures, waste
segregation, and availing toilet handwashing stations and cleaning records. We
provide similarly constructed figures for the water, hygiene and organisational
management domains in S4 File. Drawing from these additional figures, other
poorly performing areas were drinking water storage (8%) and ensuring a
minimum 2.5-metre distance between hospital beds in the hygiene domain
(11%).

95
Fig 4. WASH performance for sanitation domain at ward level. The vertical and horizontal bars summarise the performance of each indicator across the hospital wards. The tiles in the central grid are coloured according to the performance

96
Ward Level Performance by levels of responsibility
Ward level data are also presented based on levels of responsibility. At ward
level, we focus on two primary levels, indicators that need the action of senior
hospital managers (16 indicators) and those reflecting activities the
management can delegate to an infection prevention and control committee
(16 indicators). The overall hospital performance for the indicators under the
hospital management was between 44-65% with a median score of 56% IQR[36-
57]. Of the 16 indicators, 10 had a score below 60% with poor performance
noted on indicators that involved infrastructure (built environment). These
include the availability of hand hygiene stations at points of care(53%) and
service areas(51%), availability of connected taps(58%) and stations for drinking
water(34%)and storage(8%). For the indicators under the IPC committee, the
overall score ranged from 30-70% with a median score of 45% IQR[36-57].
There were 11 indicators with a score of less than 60%. The figures describing
these indicators are provided as a supplement( S 5 File)
2. Understanding Variation – Qualitative Analysis
1. Challenges with the built environment
Many of the facilities we surveyed are more than 40 years old and have not
been renovated or modernised, or if they have been, this has been done in a
partial way that affects only individual wards or areas of the hospital. This leads
to variation both between and within facilities. The newer hospitals and ward
units had more sinks, and toilets available, and their arrangement into cubicles
compared to an open floor plan improved bed spacing. The workers seemed to
take such arrangements as fixed and beyond their control, but health workers
recognised the importance of the built environment:

97
“The sinks like the ward I am in, and I have seen the other
ones as well, there are sinks in every cube, that is about eight
beds, there is a sink in every eight-bed a sink.” Health worker
“Right now, I talk of where I am working in the female ward
and the dressing room, we are missing the sink between the
beds. We need a sink for cleaning hands in that place. Right
now, there is no sink.” Health worker
The built environment and the quality of the facilities enable or retard progress
in WASH. For both facilities that scored red in ‘Hygiene’ (Fig 1), the facilities
were outdated and difficult to keep clean. Not having sinks available makes life
difficult for these facilities, and the results of the survey were reflected in
respondents’ comments on potential underperformance:
“But how we do it in [H5] we don’t really have, you know, a
tap everywhere and soap everywhere.” Nurse
In addition to the overall condition of some wards, the design and layout of
hospitals also seemed to play a part. Some of the buildings in these hospitals
were built more than 40 years ago at a time when essential IPC and WASH
standards were perhaps not prioritised and were constructed with small
populations in mind. Therefore, the regional governments and hospital
managers have inherited hospitals whose size and structure are indeed not
within their control. This was described by one of the regional government
leaders who highlights challenges with space for waste collection.
“Another challenge I want to say is space because you will find
that in a good set up, we need to have a space for collecting
the waste that is specifically labelled waste collection area.

98
Whereby the officers who transport the waste from the
generating area to the disposal area, should have a
designated area which is not in our hospital at the moment,
we are just improvising. But in most places, that are well
constructed, they are places you will even lock so that the
issue of contamination is minimal. In this county except for the
new lab that has a designated waste collection area.”
Regional government officer
2. Resource availability and allocation
The budgets available for IPC and WASH very much varied by region. Some of
the facilities in the survey reported challenges with budgetary allocation at the
county government level for provision of WASH materials leading to shortages
in supply or having sub-standard materials, as highlighted by one of the IPC
hospital leaders whose facility had to contend with ill-fitting personal protective
equipment.
“The challenge is inadequate funding now that you are given
some money that cannot meet your expectations then that
one comes as a challenge because perhaps you want to buy a
certain amount of material, but because of limited funding
you buy as per what is available.” Health Manager
Importantly, IPC rarely had a specific budget, and our respondents explained
how this made it challenging to ensure supplies:
“I would talk about maybe the sanitary requirement that we
need to help us do prevention but not IPC budget as per se.
There is nothing like that.” Frontline healthcare worker

99
This is important because it results in splitting the responsibilities for ensuring
regular supplies across several areas and individuals:
“You know normally we are told to itemise whatever we
require in the departments that we are working. Like now the
public health officer is the one who deals with the sanitation
and such issues. [But] chlorine it is under the pharmacy, it is
under non-pharmaceutical commodities, so we give her, the
pharmacist a figure or the requirements of the consumption in
the institution and he or she factors that.”
Frontline healthcare worker
This may also speak to some of the variations we see between wards in a single
facility where some individual ward managers are better at procuring funds for
IPC materials than others (see Fig 3).
3. Leadership at hospital and ward level
In some of the facilities, hospital managers did not appear to see WASH/IPC as
a priority area, and there was no institutional leadership or commitment to
tackle WASH challenges.
“you know change of the management brings a tug of war,
and people normally have their own ...there is what they
value. What I want basically to tell you people have not taken
infection prevention as a key concept in health sector they
take lightly ….when you come to certain managers, there are
those who don't value infection prevention they see it as by
the way.” IPC Lead

100
In facilities that focused more on WASH, attempts were sometimes made to get
better representation from the ward level leaders, such as hospital consultants
and senior nurses, to take leadership roles in IPC committees to mobilise
broader support for WASH. These doctors and senior nurses seemed vital in
improving WASH at the ward level.
“like now … we have a paediatrician who is now chair-
chairing our committee for infection prevention, but he’s
working in the paediatric unit. .. That is now what makes it
easier because now for the doctors… if there is something that
now the doctors needed to be communicated to, we use him.”
Ward Manager
Local leadership can also affect hospitals and result in variable performance
between wards, as seen in Fig 3. These wards were often those where patients
were understood to be vulnerable such as the NBU and had persons who
enforced improved IPC behaviour:
“I think it is because we have somebody who is very vocal. And
she is very strict. She will tell them you are not going to handle
any baby without having washed your hands.”
Health Manager
A manager in one of the better-performing facilities, noted the positive effects
of having such a “champion” at the facility level, leading the overall approach
and IPC committee:
“I think the nurse the in charge – the unit matron who is in
charge of that department [ IPC/ WASH] – is somebody very

101
passionate about the department, and more so you’ll find
even she keeps on pushing us.” Hospital Deputy director
3. Improving Wash – ideas from the field
In addition to the critical areas of facilities, budget and leadership, we also
identified other key insights from the qualitative interviews that affect WASH
performance at ward and facility levels. These would be key areas to consider
for intervention to improve WASH and IPC in hospitals
1. Outsourcing – a solution for general cleanliness?
With the approval of the county governments, to combat challenges of staff
shortages, supplies and poor accountability, some of the hospitals had begun
to outsource cleaning services. These companies, at a fixed price contract,
provided personnel and supplies and were responsible for ensuring these
facilities were clean at all times.
“the cleanliness in this place in comparison with most of the
other you know public institutions in this country is different
more so the people you see sweeping; cleaning are not
employees of the ministry they’re not employees of the
hospital we have outsourced it to somebody who has been
doing it in other various places.” Deputy Hospital Director
This strategy did not seem to work in all facilities as some of the poorly
performing hospitals like H11 also had outsourced cleaning services. It may still
come down to the hospital management to ensure these companies are
working well.

102
2. Improving personal and professional attitudes towards WASH
and IPC
Compared to other areas in the hospital, WASH and IPC are not taken as
seriously, mainly because these are not revenue-generating activities. These
have also been viewed historically as the premise of some particular cadres like
nurses. Therefore, doctors and other medical specialists have found it difficult
to take orders from WASH focal persons who may be junior to them.
“…sometimes when you go for this IPC meetings, and
something on IPC comes up you could feel some staff
complaining, especially the nurses that doctors don’t embrace
the issues of IPC. The other issue also is the attitude of people;
some people have very bad attitudes. They imagine I’m
being... it’s like you are bothering them.” Nurse Manager
The nurses we spoke to also noted that it was sometimes hard to persuade
other cadres of the importance of handwashing:
“I think they[Nurses]are more conversant with the infection
prevention issues, and they observe the protocols but the
other cadres, they don’t observe. I think they are not. Maybe
they are not updated as to why they should observe the
protocols and they, by the way, I would say, they don’t mind
about the way they do their things.” Nurse manager
In contrast, other hospitals, the perspective is different and more positive.
Some health workers see WASH and IPC as key to the provision of care in the
hospital.

103
“IPC is very important because I think to me it’s the heartbeat
of the hospital.” Frontline Health worker
3. Training and orientation of all cadres of staff on WASH
To correct some of the poor attitudes and challenges of WASH and IPC. Some
hospitals have taken up the training of all cadres to WASH and IPC as part of the
hospital orientation to ensure everyone is up to date.
“its routine that like now when you get posting all people
nurses and clinical officers and medical officers’ interns when
they come here now, it has become even before they get into
the ward that’s [orientation on IPC]the first place they step in
then they are taken through, and it has become very much
entrenched... in their absorption into this place.”
Deputy Medical Director
4. Partnerships to improve WASH offer partial improvement in
the sector
Some hospitals, due to constraints in funding, have linked with development
partners to provide training (e.g. H10 and H16), assist in the development of
standard operating procedures and promotional materials. Although these
partners have a positive effect, we noted in some hospitals, duplication of roles,
for example, multiple different partners engaged in promoting handwashing.
Like for the [partner X] they had the concept, they taught us
about their handwashing, the decontamination, the waste
segregation the storage and about the how to care for the
laundries and all that. All those steps were taught but [partner

104
Y] they came in the same, but they narrow to the
handwashing. Hospital manager
Discussion
Here we report the combined hospital performance of the four WASH domains
in 14 hospitals. Performance varied at hospital, ward and indicator level with
most being sub-optimal. Some of the themes explaining this variation and
performance included differences and challenges within the built environment,
resource allocation, leadership, training on WASH and health worker attitudes
towards WASH and IPC.
The JMP also assessed some of the indicators assessed in WASH-FAST in the
2016 global assessment of WASH in health facilities [4]. Although using different
methodologies, our results confirm and highlight similar issues. The main areas
showing the same poor performance with the JMP are the WASH infrastructure,
including water and toilet availability and health care waste management. The
JMP and other related WASH surveys have shown slow progress in the
improvement of WASH in most hospitals in resource-limited settings. This is
despite improving WASH in health care facilities being highlighted as one of the
sustainable development goals [13].
WASH in health facilities is a crucial intersection point for many hospital-based
interventions. These include IPC, control of antimicrobial resistance, improving
the safety and quality of care and health system strengthening interventions all
aimed towards improving efficiency and patient outcomes in hospitals. A focus
on improving WASH would, therefore, have a positive effect on multiple aspects
of health care. Some of the main inputs needed to improve WASH in health
facilities are political resources, financial/material resources and human
resources [2]. The leading players to provide these inputs are the national and

105
regional governments, policymakers and at hospital level the senior hospital
managers who may also delegate to specific committees.
Political resources include engagement from the national and county
governments and development partners. These provide national
standards/guidelines and accountability mechanisms to ensure that facilities
are meeting these national standards [14]. From our survey, the results and
findings that that would be relevant to national/regional governments are the
findings at the overall facility level. These show varied hospital performance
across the country. The role played by the government, in this case, would be
to ensure all hospital achieve a minimum standard for WASH. For example, a
directive from the national government on standards for building hospitals
would provide minimum standards for WASH infrastructure are present in
every facility especially for newer hospitals and in older hospitals that may be
undergoing renovation. These governments are also crucial in positioning
WASH on the national health agenda linked to the sustainable development
goals, universal health coverage [2] and the prevention of AMR to help make
WASH a priority for all.
Inadequate resource allocation was highlighted as a challenge affecting the
performance of WASH in these facilities. To improve WASH, there needs to be
resource allocation from the national/county government with budgets for
policy generation, assessments, upgrading of infrastructure and training for
WASH. At the hospital level, to improve and maintain the WASH infrastructure
and practices, resources are required for ongoing staff training supported by an
IPC/AMR committee, repairs need to be prioritised, and a constant supply of
quality materials should be ensured with regular assessments of all the wards
performance. Resources for WASH assessments and rewards to staff for best
performing wards may also need to be allocated [14, 15]. In some of the

106
hospitals, some challenges were overcome by partnering with development
agencies to provide extra resources to improve WASH in the hospitals. Hospital
and ward level WASH data as provided in this survey would be essential to
highlight the main areas or indicators within the hospital or wards that need to
be prioritised during resource allocation. We noted at ward level in these
hospitals that there was poor performance for some critical indicators that
would be quick and less costly to improve. These include; availing a cleaning
record in the wards (15%) and toilets (27%) and providing waste management
standard operating procedures (SOP) (30%) and hand hygiene promotion
materials(42%).
Human resource allocation within hospitals is also crucial to improving WASH.
When these staff, including cleaners and waste handling personnel, are well
trained and motivated, they will provide better service. All the workers,
whether employed or contracted need to be adequately trained and oriented
on WASH and IPC. In some of the hospitals we assessed, this process of training
and orientation was now routine. Training on WASH can be formal preservice
or in-service training and mentoring. To achieve these levels of training and
competence in these hospitals, there is a need for some trained WASH focal
persons to provide technical expertise in hospitals [2]. These focal persons
might be recognised through certification, as in the case in some African
countries [6]. In facilities with staff shortages, outsourcing of some of these
workers from cleaning companies could improve efficiency, help hospitals focus
on their core business of providing quality healthcare and may contain costs
[16]. The hospital managers are, however, ultimately responsible for the
performance of these outsourced services and therefore need to monitor the
services provided actively, tools such as WASH-FAST could help this process.

107
This survey also highlights the role of committed leadership in improving WASH.
Leadership at all levels of the health systems is an essential contributor to
improving WASH and averting AMR. National leadership provides a clear road
map for the country to follow and aligns all WASH/AMR efforts to achieve the
set targets. It should offer tools and approaches for assessment of WASH/AMR
in the country, which should be prioritised over those provided by other donor
partners to ensure coherence [14]. Leadership at the hospital level is also
critical in improving WASH/AMR. Hospital managers are vital to improving staff
morale and attitudes to embrace WASH as part of their core functions, for
example, by including these functions in the staff appraisal. Hospital
management can also delegate some of the WASH activities to committees
within the hospital. In this case, a well-constituted IPC committee would be
essential in offering training on WASH, IPC and AMR, and conducting periodic
assessments of the hospital and offering technical and budgetary
recommendations to the senior hospital managers[8]. Including senior doctors
and nurses who actively participate in these committees can enhance their and
effectiveness credibility and improve attitudes clinicians have towards
WASH[17]. Having champions of change (WASH champions) at the ward level
for activities like hand washing has previously been noted to generate positive
change [15]. This approach of using champions may also prove valuable in
improving the overall outlook of WASH in healthcare facilities, as shown in
some of the hospitals surveyed.
Financing for health in many countries, including Kenya remains a challenge.
The current budget for health below 8% of the total national budget, and this is
still below the global recommendations.[18]. This proportion has not increased
for several years despite new challenges like AMR emerging in recent years. In
Kenya with a devolved health system, the amount of money that would be set

108
aside for activities like buying IPC and WASH materials and other non-
pharmaceutical agents was only 5% of the budget with more than 70% of the
county budgets for health going to personnel costs.[18] Therefore, to improve
WASH, IPC and the AMR agenda, especially in public hospitals, there is a need
to examine other sources of funding for these activities. Public-private
partnerships, donor agencies may provide alternative ways to fund these
activities in limited-resource settings. In Kenya, the National hospital insurance
fund, which is the national health insurance provides reimbursement to public
and private facilities for some of the costs incurred by some of its members.
Pegging some of these reimbursements to the quality of care provided,
including the state of IPC and WASH in these hospitals may force these facilities
to improve[19].
From our work using the WASH-FAST tools, we demonstrate that; surveys can
be carried out at national level or regional levels to generate data on the state
of WASH in healthcare facilities in countries. These data have the potential for
use in priority setting for WASH interventions, policy generation and resource
allocation both at the national and hospital level. These data generated at the
hospital level can also be used by authorities for hospital accreditation and
benchmarking.
The main limitations of our survey were that the WASH-FAST assessment tool
provided for only three possible outcomes for each indicator. This may have
implications in the accuracy/objectivity of the score presented, to mitigate this,
we ensured all the clerks were well trained before the survey, and the data
collection team provided notes against every indicator to ensure the score
provided was as objective as possible. The other limitation in our approach was
conducting the surveys and interviews over almost the same period. Although
interviews were conducted after the survey teams shared their daily findings

109
with the social scientists and some of the social scientists were also present
during the surveys, a more sequential approach would have been preferable.
That is, after completing and analysing the quantitative data, more relevant
interview questions might have been formulated, tested, and interviews might
then have been conducted across most survey hospitals. Recruiting health
workers from participating hospitals to collect data was likely to introduce bias.
To mitigate, we ensured that these data collection teams were a mix of health
workers from the participating hospital and others from different hospitals and
included a study team leader. The indicator scores assigned were also arrived
at by team consensus. The main aim of including health workers from
participating hospitals was to build capacity for these facilities to carry out
similar surveys in future as part of their facility improvement strategies.
Future work using the WASH-FAST might explore how we could systematise
feedback to hospitals of survey results and recommended follow-up actions,
including the use of electronic dashboards. Currently, all the indicators have
equal weight, but we acknowledge some may be more critical for patient safety
or in the prevention of acquired infections. Future work would, therefore,
consider ways to give more weight to more critical indicators during surveys,
analysis, reporting and follow-up.
Conclusion
Significant differences and challenges exist in the state of WASH within and
across even large hospitals providing multi-speciality care. Whereas the senior
hospital management can make some improvements, input and support from
the national and county governments are essential to improve WASH as a
necessary foundation for safe, quality hospital care and to avert AMR in Kenya.

110
Acknowledgements
The authors thank the Kenyan Ministry of Health and the Council of Governors
who permitted this work to be carried out. The authors thank Dr Nancy Abuya
and all the clinicians who assisted in data collection. We also thank the hospital
management and clinical teams who supported the work in the survey
hospitals. The authors also thank Arabella Hayter and Margaret Montgomery
from the Water Sanitation, Hygiene and Health Unit, Department of Public
Health and the Environment, WHO for providing WASH training materials and
technical advice. This work is published with the permission of the Director of
KEMRI.
Author contributions
The roles of the contributors were as follows: MM, J.M, O.T, C.S and M.E
conceived the study. M.M, G.K and M.Z, collected data, P.M, O, T, J.M assisted
M.M in data analysis and interpretation. M.M drafted the manuscript. M.M,
J.M, O.T, C.S and M.E critically revised the manuscript for intellectual content.
All authors read and approved the final manuscript.
Data Availability
All summary data underlying the findings are freely available in the
manuscript and supplemental files. The raw data used for this manuscript are
hosted in a public repository Harvard Data verse. DOI
https://doi.org/10.7910/DVN/IJUWWR

111
References 1. Hans Jørn Kolmos. Health Care Associated Infections: Sources and Routes of
Transmission. In: Infection Control – Updates Croatia2012 [cited 2017 2nd November ]. Available
from: http://cdn.intechopen.com/pdfs-wm/28876.pdf.
2. Weber N, Patrick M, Hayter A, Martinsen AL, Gelting R. A conceptual evaluation
framework for the water and sanitation for health facility improvement tool (WASH FIT). Journal
of Water, Sanitation and Hygiene for Development. 2019. doi: 10.2166/washdev.2019.090.
3. World Health Organisation. Safe management of waste from health care activities
2014 [cited 2018 18th December ]. Available from:
http://www.who.int/water_sanitation_health/publications/wastemanag/en/.
4. World Health Organization & United Nations Childrens Fund (UNICEF) WASH in health
care facilities: global baseline report 2019. Geneva: 2019.
5. World Health Organization, UNICEF. Water and Sanitation for Health Facility
Improvement Tool (WASH FIT): a practical guide for improving quality of care through water,
sanitation and hygiene in health care facilities. Geneva: 2017 9241511699.
6. Adams J, Bartram J, Chartier Y. Essential environmental health standards in health care:
World Health Organization; 2008.
7. World Health Organization. Guidelines on core components of infection prevention and
control programmes at the national and acute health care facility level: World Health
Organization; 2016.
8. Maina M, McKnight J, Tosas-Auguet O, Zosi M, Kimemia G, Mwaniki P, et al. Extending
the use of the World Health Organisations’ Water Sanitation and Hygiene assessment tool for
surveys in hospitals – from WASH-Fit to WASH-FAST. 2019:Forthcoming.
9. English M, Ayieko P, Nyamai R, Were F, Githanga D, Irimu G. What do we think we are
doing? How might a clinical information network be promoting implementation of recommended
paediatric care practices in Kenyan hospitals? Health Research Policy and Systems. 2017;15(1):4.
doi: 10.1186/s12961-017-0172-1.
10. Weber Nicole, Martinsen Andrea L, Sani Amidou, Assigbley Elom Kokou Eric, Azzouz
Chedly, Hayter Arabella, et al. Strengthening Healthcare Facilities Through Water, Sanitation, and
Hygiene (WASH) Improvements: A Pilot Evaluation of “WASH FIT” in Togo. Health Security.
2018;16(S1):S-54-S-65. doi: 10.1089/hs.2018.0042.
11. R Core Team. R: A Language and Environment for Statistical Computing. Vienna,
Austria: 2017.
12. QSR International Pty Ltd. NVivo qualitative data analysis Software;. 12 ed2018.
13. United Nations General Assembly. Transforming our world: the 2030 Agenda for
Sustainable Development. New York: United Nations. 2015;(1).
14. World Health Organization. Water, sanitation and hygiene in health care facilities:
practical steps to achieve universal access to quality care. Geneva: 2019.
15. World Health Organisation. Global strategy, burden of disease, and evidence and action
priorities, Workshop Report. United Kingdom: 2016.
16. Ichoho JW. Implementation of outsourcing strategy at the Nairobi Hospital, Kenya.
[Unpublished MBA Project]. In press 2013.

112
17. Amirabadi Zadeh H, Maleki MR, Salehi M, Watankhah S. An Exploration of the Role of
Hospital Committees to Enhance Productivity. Global journal of health science. 2016;8(3):199-
209. Epub 2015/10/27. doi: 10.5539/gjhs.v8n3p199. PubMed PMID: 26493440; PubMed Central
PMCID: PMCPMC4804034.
18. Ministry of Health Kenya. National and county health budget analysis FY 2016/17. 2017.
19. Barasa E, Rogo K, Mwaura N, Chuma J. Kenya National Hospital Insurance Fund
Reforms: Implications and Lessons for Universal Health Coverage. Health Systems & Reform.
2018;4(4):346-61. doi: 10.1080/23288604.2018.1513267.
Supporting Information
S1 Table. WASH Aggregate Ward Indicator Scores
S2 File. WASH Data collection and Standard Operating procedures tool
S3 File. Consolidated criteria for reporting qualitative studies (COREQ): a 32-
item checklist
S4 File Ward level Aggregate by Domain for Water, Hygiene and Organisation
Management
S5 File Performance of Indicators under the infection prevention and control
committee and hospital management

113
S1 Table Aggregate Ward Indicator Scores
DOMAIN Indicator Description Minimum
Score
lower
IQR
Median
Score
Upper
IQR
Maximum
Score
Mean
Score
Water
Showers available 58.33 75.00 84.82 92.86 100 83.62
Shower lighting present 16.67 44.18 60.63 69.17 96.43 56.99
Water Services Available in quantity 63.64 92.71 100 100 100 93.12
Drinking water Station 0 0 17.14 72.57 100 34.05
Drinking Water Storage 0 0 3.13 13.49 28.57 7.96
End points(taps) connected 0 46.88 54.91 78.75 91.67 58.19
Sanitation
Waste collection bins 50 50 57.74 66.25 100 62.92
Waste segregation 0 12.50 50 72.92 94.44 45.32
Waste management SOP 3.57 13.54 21.88 42.56 80 29.98
Waste handling PPE 28.57 50 60.42 71.67 100 60.99
Toilets available in correct numbers 55.00 66.67 71.43 88.33 100 76.23
Toilets well lit 16.67 37.20 58.12 65.00 91.67 54.48
Toilets separate (Male/ Female,
Staff/Patients)
42.86 74.55 92.92 100 100 84.73
Toilet with Menstrual Hygiene services 20 64.88 83.33 89.38 100 73.28
Toilets for reduced Mobility 0 0 0 4.69 33.33 4.91

114
Toilet Hand wash station 28.57 42.86 50 53.13 75.00 49.20
Toilet cleaning record 0 0 0 50 95.00 26.64
Hygiene
Insecticide treated nets on beds 0 0 24.70 54.69 83.33 29.51
Mechanism for IPC supplies tracking 0 17.86 81.94 100 100 63.41
Cleaning records available 0 0 0 0 90 14.52
Natural ventilation available 65.00 94.27 100 100 100 95.14
2.5 Metre bed distance 0 0 4.17 18.85 41.67 11.31
General lighting adequate 58.33 95.55 100 100 100 95.44
Clean floors/surfaces 50 70.31 87.50 100 100 83.79
cleaning materials available 41.67 50 56.70 64.58 83.33 58.12
Hand Hygiene-Points of care 35.71 50 51.79 56.08 70 53.35
Hand Hygiene Promotion materials 0 33.33 43.30 50 90 41.67
Hand Hygiene-Service areas 18.75 50 50 50 77.78 50.88
Hand Hygiene compliance activities 0 0 45.00 53.41 80 34.99
Organisation
Management
Staff rewards for good performance 0 0 26.70 50 61.11 25.78
Ward based audits 0 21.97 36.61 48.96 70 35.28
New staff orientation 43.75 78.33 92.26 100 100 87.06
Staff IPC training 0 19.32 35.83 50 100 37.89
IPC Focal person 0 2.08 20.83 48.44 91.67 31.88

115
S2 File. WASH Data collection and Standard Operating procedures tool
WASH ASSESSMENT BOOKLET
WASH TEAM LIST
List all persons that have contributed to the assessment or have participated
in briefings/discussions during the WASH baseline assessment, each day
Date Name Job Title
/ Role
Role / Involvement During
WASH Baseline Assessment
Contact Details
(e.g. phone
Number and e-
mail if
available)

116
Additional Comments on Roles and Contributions during WASH Baseline Assessment

117
Notes from Initial Briefing
During the initial briefing, you must hand in appropriate approval letters, explain the purpose of the survey in the context of
the broader study, explain what the assessment will involve, and when and how feed-back will be provided. You must explain
that the assessment will involve taking pictures, to assist with the scoring of indicators in consultation with the research teams
operating in other hospitals. Pictures will NOT include patients or staff, or signs that can identify the hospital. They will be kept
in anonymised format and encrypted and will be destroyed as soon as the indicators are unequivocally scored. ONLY THE THREE
WASH TEAM SUPERVISORS (i.e. NOT the team leaders) ARE ALLOWED TO TAKE PICTURES. During the briefing, take the
opportunity to ask questions to help plan your visit: ask about numbers of wards, names of the wards, structure of the hospital,
and permanent and/or temporary local WASH and/or IPC improvement activities by NGOs or other, which may affect the
interpretation of your findings. Ask questions around hospital demographics and capacity, such as total number of beds (i.e.
hospital capacity), numbers of outpatients on a typical day, average number of surgical procedures daily or weekly, total number
of admissions daily or weekly, as well of average number of births in a day or week. You must write down the notes from the
meeting in the sections below. If you gather relevant details in subsequent days, which refer to hospital structure, capacity and
demographics, add the information here as well.

118
WARD-LEVEL
ASSESSMENT FORMS
Explanatory Notes for Ward-Level WASH Indicators
WATER
1.2 For an intermittent piped-water supply, e.g. available 8 hours per day.
1.3 Describe if drinking stations are provided with railings and a seat.
1.6 Describe how many sinks have functioning pipes for water coming in and going out and how many sinks have functioning pipes for
water coming in only.
SANITATION
2.1 Improved sanitation facilities include flush toilets into managed sewer or septic tank and soakaway pit, VIP latrines, pit latrines
with slab, and composting toilets.
To be considered usable, a toilet/latrine should have a door which is unlocked when not in use (or for which a key is available at
any time) and can be locked from the inside during use, there should be no major holes in the structure, the hole or pit should not
be blocked, water should be available for flush/pour flush toilets, and there should be no cracks, or leaks in the toilet structure. It
should be within the grounds of the facility and it should be clean as noted by absence of waste, visible dirt and excreta and
insects.
2.4 Toilets should have a bin for disposal of waste or an area for washing, with water available.

119
2.5 A toilet can be considered to meet the needs of people with reduced mobility if it meets the following conditions: can be accessed
without stairs or steps, handrails for support are attached either to the floor or sidewalls, the door is at least 80 cm wide, the
toilet has a raised seat (between 40-48 cm from the floor), a backrest and the cubicle has space for circulation/manoeuvring
(150x150 cm). The sink tap, and water outside should also be accessible and the top of the sink 75 cm from the floor (with knee
clearance). Switches for lights, where relevant, should also be at an accessible height (max 120 cm). All specifications are based on
ISO 21542:2011 – Building construction - Accessibility and usability of the built environment, available at:
http://www.iso.org/iso/home/store/catalogue_tc/catalogue_detail.htm?csnumber=50498
2.6 A functional hand hygiene station may consist of soap and water with a basin/pan for washing hands. Water should not be
chlorinated. Alcohol-based hand rub is not suitable for use at latrines.
2.7 For low literacy or illiterate cleaners, this should be adapted and simplified accordingly with recognizable pictures and illustrations.
2.10 Lighting for latrines is necessary in all facilities where night-time services are provided and where there is not sufficient natural
light to safely use the latrine during the day.
HEALTHCARE WASTE
2.12 Functional means containers should not be ¾ full, be leak-proof with a lid and clearly labelled (i.e. easily distinguishable according
to a colour, label or symbol).
2.22 Protective equipment for people handling waste management includes gloves, apron and tough rubber boots.
HAND HYGIENE
3.1 Point of care is where three elements come together: the patient, the health-care workers and care or treatment involving contact
with the patient or his/her surroundings. This may include consultation rooms, operating rooms, delivery rooms AND laboratory.
Hand hygiene stations should have a sink or bucket with tap and water with soap OR alcohol-based hand-rub. There should be at
least two hand hygiene stations in a ward with more than 20 beds. Verify that water is available from the tap.
3.2 Key places include at points of care and within 5 m of latrines. You may want to write down where stations are located (and were
they are missing) in your comments box.

120
3.3 Sink or bucket with tap and water with soap OR alcohol-based hand-rub. Service areas include sterilization room (where
applicable), laboratory (where applicable) and showers. (Toilets are included under 2.7)
3.4 Tap and water with soap.
ENVIRONMENT, CLEANLINESS AND DISINFECTION
3.8 Clean as noted by absence of waste, visible dirt and excreta and insects. Environmental surfaces or objects contaminated with
blood, other body fluids, secretions or excretions are cleaned and disinfected as soon as possible using standard hospital
detergents/disinfectants.
MANAGEMENT
N/A N/A

121
Ward Assessment - Notes
Before you begin your assessment and scoring, take the time to walk through the ward and observe all the details. Speak to
staff, take pictures where needed (no patients/staff/hospital identifying signs allowed in pictures. ONLY THE THREE WASH TEAM
SUPERVISORS (i.e. NOT the team leaders) ARE ALLOWED TO TAKE PICTURES), count numbers of functional toilets, beds, sinks,
bulbs, hand washing stations, soap dispensers, etc. Inspect bins, cleaning materials, etc. Write notes in the space below. Sit
with the team and try to score some of the indicators. If needed walk through the ward again to gather mode details which will
allow you to fine-tune the scoring. In the process, write down all your questions. You can then address all your queries with a
member of staff in one go. This should allow you to complete the assessment.
ENTER WARD NAME: _____________________________

122
Ward Name:
________________________
Facility
Code:________________________
BASELINE ASSESSMENT
(Clearly tick the box that best describes your findings) Assessment Date:
1 WATER
Meets
Target
(+++)
Partially Meets
Target
(++)
Does not
Meet Target
(+)
Explain the reasoning for your scoring and
comment as appropriate. For indicators with
an asterisk, read the notes before scoring.
1.2* Water services available at
all times and of sufficient
quantity for all uses (refers
to a typical average week).
□ Yes, every day
and of sufficient
quantity
□ More than 5
days per week or
every day but
not sufficient
quantity
□ Fewer than 5 days
per week
1.3* A reliable drinking water
station is present and
accessible for staff, patients
and carers at all times.
□ Yes, at all times
and accessible to
all
□ Sometimes, or
not available for
all users
□ Not available
1.4 Drinking water is safely
stored in a clean bucket/
tank with cover and tap.
□ Yes □ Only some
drinking water
points are safely
stored
□ Not safely stored in
any water points or
no drinking water
available
1.6* All end points (i.e. taps) are
connected to an available
and functioning water
supply.
□ Yes, all are
connected and
functioning
□ More than half
of all endpoints
are connected
and functioning
□ No, less than half
of all endpoints
connected and
functioning

123
1.13 At least one shower or
bathing area is available per
40 patients in inpatient
settings and is functioning
and accessible.
□ Yes □ Showers
available, but no
water or in
disrepair or
showers
available but
fewer than 1 per
40
□ No showers.
1.14 Shower(s) are adequately
lit, including at night.
□ Yes □ Lighting
infrastructure
exists, but not
functioning
□ Not adequately lit
or no lighting
infrastructure
Ward Name:
________________________
Facility
Code:________________________
BASELINE ASSESSMENT
(Clearly tick the box that best describes your
findings)
Assessment Date:
2.a SANITATION Meets
Target
(+++)
Partially Meets
Target
(++)
Does not
Meet Target
(+)
Explain the reasoning for your scoring and comment
as appropriate. For indicators with an asterisk, read
the notes before scoring.
2.1* Number of available and
usable toilets or improved
latrines for patients.
□ One for
every 20
inpatients.
□ Sufficient
number present
but not all
functioning or
insufficient
number.
□ Less than 50% of
required number
of latrines
available and
functioning.
2.2 Toilets or improved latrines in
the ward clearly separated for
staff and patients
□ Yes.
N/A
□ No separate
latrines.

124
2.4* At least one toilet or improved
latrine provides the means to
manage menstrual hygiene
needs.
□ Yes. □ Yes, but toilet
is not clean or
in disrepair.
□ No. (Score this question in female wards only)
2.5* At least one toilet in the ward
meets the needs of people
with reduced mobility.
□ Yes. □ Yes, but not
available or in
disrepair.
□ No toilet for
disabled users.
2.6* Functioning hand hygiene
stations within 5 m of latrines.
□ Yes. □ Present, not
functioning or
no water or
soap.
□ Not present.
2.7* Record of cleaning visible and
signed by the cleaners each
day.
□ Yes. □ Toilets
cleaned but not
recorded.
□ No record /
toilets cleaned less
than once a day.
2.10* Latrines are adequately lit,
including at night.
□ Yes □ Lighting
infrastructure
exists, but not
functioning.
□ Not adequately
lit or no lighting
infrastructure.
Ward Name:
________________________
Facility
Code:________________________
BASELINE ASSESSMENT
(Clearly tick the box that best describes your
findings)
Assessment Date:
2.b HEALTHCARE WASTE Meets
Target
(+++)
Partially Meets
Target
(++)
Does not
Meet Target
(+)
Explain the reasoning for your scoring and comment
as appropriate. For indicators with an asterisk, read
the notes before scoring.

125
2.12
*
Functional waste collection
containers for 1) non-infectious
(general) waste, 2) infectious
waste and 3) sharps waste in
close proximity to all waste
generation points.
□ Yes. □ Separate bins
present but lids
missing or more
than ¾ full; only
two bins (instead
of three); or at
some but not all
waste generation
points.
□ No bins or
separate sharps
disposal.
2.13 Waste correctly segregated at
all waste generation points.
□ Yes. □ Some sorting
but not all
correctly or not
practiced
throughout the
ward.
□ No sorting.
2.21 Protocol or SOP (Standard
Operating Procedure) for safe
management of healthcare
waste clearly visible and legible.
□ Yes,
visible and
implemen
ted.
□ Written but not
visible or
implemented.
□ No protocol/SOP
in place.
2.22
*
Appropriate protective
equipment for all staff in charge
of waste disposal.
□ Yes. □ Some
equipment
available, but not
for all staff, or
available but
damaged.
□ None available.

126
Ward Name:
________________________
Facility
Code:________________________
BASELINE ASSESSMENT
(Clearly tick the box that best describes your findings) Assessment Date:
3.a HAND HYGIENE
Meets
Target
(+++)
Partially Meets
Target
(++)
Does not
Meet Target
(+)
Explain the reasoning for your scoring and
comment as appropriate. For indicators with
an asterisk, read the notes before scoring.
3.1* Functioning hand hygiene
stations are available at all
points of care.
□ Yes. □ Stations
present, but no
water and/or
soap or alcohol
hand-rub
solution.
□ Not present.
3.2* Hand hygiene promotion
materials clearly visible and
understandable at key
places.
□ Yes. □ Some places
but not all.
□ None.
3.3* Functioning hand hygiene
stations are available in-
service areas.
□ Yes. □ Stations
present, but no
water and/or
soap or alcohol
hand-rub
solution.
□ Not present.
3.5 Hand hygiene compliance
activities are undertaken
regularly.
□ Yes. □ Compliance
activities in
policy, but not
carried out with
any regularity.
□ No compliance
activities.

127
Ward Name:
________________________
Facility
Code:________________________
BASELINE ASSESSMENT
(Clearly tick the box that best describes your findings) Assessment Date:
3.b ENVIRONMENT,
CLEANLINESS AND
DISINFECTION
Meets
Target
(+++)
Partially Meets
Target
(++)
Does not
Meet Target
(+)
Explain the reasoning for your scoring and
comment as appropriate. For indicators with
an asterisk, read the notes before scoring.
3.7 General lighting sufficiently
powered and adequate to
ensure safe provision of
healthcare including at night.
□ Yes, always. □ Yes,
sometimes.
□ Never.
3.8* Floors and horizontal work
surfaces appear clean.
□ Yes. □ Some floors
and work
surfaces appear
clean, but others
do not.
□ Most and/or all
floors and surfaces
are visibly dirty.
3.9 Appropriate and well-
maintained materials for
cleaning (i.e. detergent, mops,
buckets, etc.) are available.
□ Yes. □ Yes, available
but not well
maintained.
□ No materials
available.
3.12 Beds have insecticide treated
nets to protect patients from
mosquito-borne diseases.
□ Yes, on all
beds.
□ Available on
some but not all
beds, or available
but with rips and
or holes.
□ No bed nets
available.

128
3.13 A mechanism exists within the
ward to track supply of IPC-
related materials (such as
gloves and protective
equipment) to identify stock-
outs.
□ Yes. □ Mechanism
exists but is not
enforced.
□ No mechanism
exists.
3.14 Record of cleaning visible and
signed by the cleaners each
day.
□ Yes. □ Record exists
but is not
completed daily
or is outdated.
□ No record of floors
and surfaces being
cleaned.
3.16 The facility has sufficient
natural ventilation and where
the climate allows, large
opening windows, skylights
and other vents to optimize
natural ventilation.
□ Yes. □ Some
ventilation but
not well
maintained or
insufficient to
produce natural
ventilation.
□ No.
3.18 □ Beds for patients should be
separated by a distance of 2.5
metres from the centre of one
bed to the other and each bed
has only one patient.
□ Yes, all beds
meet this
guidance.
□ Some but not
all beds fit this
criteria.
□ No beds meet this
criteria.
Ward Name:
________________________
Facility
Code:________________________
BASELINE ASSESSMENT
(Clearly tick the box that best describes your findings) Assessment Date:

129
4 MANAGEMENT
Meets
Target
(+++)
Partially Meets
Target
(++)
Does not
Meet Target
(+)
Explain the reasoning for your scoring and
comment as appropriate. For indicators with
an asterisk, read the notes before scoring.
4.6 Regular ward-based audits by
external facility personnel (not
ward staff) are undertaken to
assess the availability of hand-
rub, soap, single use towels and
other hand hygiene resources.
□ Yes. □ Undertaken
less than once a
week or
assessment is
incomplete.
□ Not undertaken.
4.7 New healthcare personnel
receive IPC training as part of
their orientation program.
□ Yes. □ Some but not
all staff.
□ No training.
4.8 Healthcare staff are trained on
WASH/IPC each year.
□ Yes. □ Staff are
trained but not
every year or
only some staff
are trained.
□ No training.
4.9 The ward has a WASH or IPC
focal person.
□ Yes. □ Yes, but focal
point does not
have sufficient
time, resources
or motivation to
carry out duties.
□ No.
4.11 High performing staff in the
ward are recognized and
rewarded and those that do not
perform are dealt with
accordingly.
□ Yes. □ Either high or
low performers
addressed but
not both.
□ No action or
recognition of staff
based on
performance.

130
FACILITY
ASSESSMENT FORMS
Explanatory Notes for Facility-Level WASH Indicators
WATER
1.1 Improved water sources in healthcare settings include piped water, boreholes/tube wells, protected wells, protected springs,
rainwater, and packaged or delivered water.
This refers to the water supply for general purposes, including drinking, washing and cleaning.
1.2 For an intermittent piped-water supply, e.g. available 8 hours per day.
1.3 Describe if drinking water stations are provided with railings and a seat.
1.8 Water needs will vary depending on the type of facility and number of patients. To calculate the facility’s water requirements,
add up the following requirements (source: WHO 2008 Essential environmental standards in healthcare) or applicable national
standards.
Outpatients (5 litres/consultation) + Inpatients (40–60 litres/patient/day) + Operating theatre or maternity unit (100
litres/intervention) + Dry or supplementary feeding centre (0.5–5 litres/consultation depending on waiting time) + Cholera
treatment centre (60 litres/patient/day).
Acceptable storage methods include clean, covered and well-maintained containers which prevent contamination from
entering and are free from any cracks, leaks, etc. Such containers should also allow for water to be extracted without hands or
other potentially contaminated surfaces from touching the water (i.e. through use of a tap).

131
1.9 Such technologies should meet one of WHO’s Household Water Treatment and Safe Storage (HWTS) performance categories
and generally involve filters, boiling, solar, chlorine (for non-turbid water) or coagulation/flocculation. Higher performing
technologies (i.e. two- or three-stars including membrane filters, UV and coagulants/flocculants) are recommended for
vulnerable groups (i.e. those with HIV or young infants) and where the specific pathogen of concern is not known. A list can be
found here: http://www.who.int/household_water/scheme/products/en/ and further information found at the WHO
Household Water Treatment site: http://www.who.int/household_water/scheme/en/
Drinking water meets WHO Guidelines for drinking-water quality (2011) or national standards:
http://www.who.int/water_sanitation_health/publications/dwq-guidelines-4/en/
1.10 Evidence of documented chlorine residuals should be available from previous testing.
1.11 Drinking water meets WHO Guidelines for drinking-water quality (2011) or national standards:
http://www.who.int/water_sanitation_health/publications/dwq-guidelines-4/en/
SANITATION
2.1 At least four toilets per outpatient setting (one for staff, and for patients: one for females, one for males, one for disabled
users). More latrines may be needed depending on the size of the facility. Improved sanitation facilities include flush toilets
into managed sewer or septic tank and soakaway pit, VIP latrines, pit latrines with slab, and composting toilets. To be
considered usable, a toilet/latrine should have a door which is unlocked when not in use (or for which a key is available at any
time) and can be locked from the inside during use, there should be no major holes in the structure, the hole or pit should not
be blocked, water should be available for flush/pour flush toilets, and there should be no cracks, or leaks in the toilet
structure. It should be within the grounds of the facility and it should be clean as noted by absence of waste, visible dirt and
excreta and insects.
2.4 Toilets should have a bin for disposal of waste or an area for washing, with water available.

132
2.5 A toilet can be considered to meet the needs of people with reduced mobility if it meets the following conditions: can be
accessed without stairs or steps, handrails for support are attached either to the floor or sidewalls, the door is at least 80 cm
wide, the toilet has a raised seat (between 40-48cm from the floor), a backrest and the cubicle has space for
circulation/manoeuvrings (150x150 cm). The sink tap, and water outside should also be accessible and the top of the sink
75cm from the floor (with knee clearance). Switches for lights, where relevant, should also be at an accessible height (max 120
cm). All specifications are based on ISO 21542:2011 – Building construction - Accessibility and usability of the built
environment, available at: http://www.iso.org/iso/home/store/catalogue_tc/catalogue_detail.htm?csnumber=50498
2.6 A functional hand hygiene station may consist of soap and water with a basin/pan for washing hands. Water should not be
chlorinated. Alcohol-based hand rub is not suitable for use at latrines.
2.7 For low literacy or illiterate cleaners, this should be adapted and simplified accordingly with recognizable pictures and
illustrations.
2.8, 2.9 No leakage from pipes nor soakaway pit, and soakaway more than 30 m from water source, with grease trap and no visible
pool of stagnant water.
2.10 Lighting for latrines is necessary in all facilities where night-time services are provided and where there is not sufficient natural
light to safely use the latrine during the day.
HEALTHCARE WASTE
2.12 Functional means containers should not be ¾ full, be leak-proof with a lid and clearly labelled (i.e. easily distinguishable
according to a colour, label or symbol).
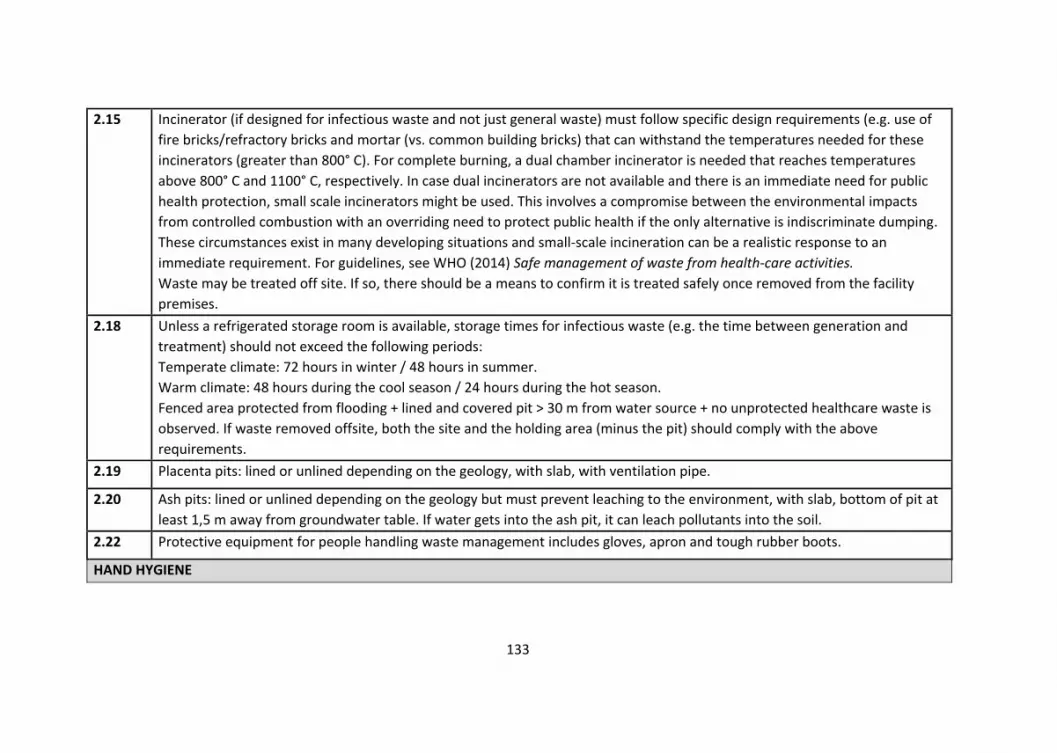
133
2.15 Incinerator (if designed for infectious waste and not just general waste) must follow specific design requirements (e.g. use of
fire bricks/refractory bricks and mortar (vs. common building bricks) that can withstand the temperatures needed for these
incinerators (greater than 800° C). For complete burning, a dual chamber incinerator is needed that reaches temperatures
above 800° C and 1100° C, respectively. In case dual incinerators are not available and there is an immediate need for public
health protection, small scale incinerators might be used. This involves a compromise between the environmental impacts
from controlled combustion with an overriding need to protect public health if the only alternative is indiscriminate dumping.
These circumstances exist in many developing situations and small-scale incineration can be a realistic response to an
immediate requirement. For guidelines, see WHO (2014) Safe management of waste from health-care activities.
Waste may be treated off site. If so, there should be a means to confirm it is treated safely once removed from the facility
premises.
2.18 Unless a refrigerated storage room is available, storage times for infectious waste (e.g. the time between generation and
treatment) should not exceed the following periods:
Temperate climate: 72 hours in winter / 48 hours in summer.
Warm climate: 48 hours during the cool season / 24 hours during the hot season.
Fenced area protected from flooding + lined and covered pit > 30 m from water source + no unprotected healthcare waste is
observed. If waste removed offsite, both the site and the holding area (minus the pit) should comply with the above
requirements.
2.19 Placenta pits: lined or unlined depending on the geology, with slab, with ventilation pipe.
2.20 Ash pits: lined or unlined depending on the geology but must prevent leaching to the environment, with slab, bottom of pit at
least 1,5 m away from groundwater table. If water gets into the ash pit, it can leach pollutants into the soil.
2.22 Protective equipment for people handling waste management includes gloves, apron and tough rubber boots.
HAND HYGIENE

134
3.1 Point of care is where three elements come together: the patient, the health-care workers and care or treatment involving
contact with the patient or his/her surroundings. This may include consultation rooms, operating rooms, delivery rooms AND
laboratory. Hand hygiene stations should have a sink or bucket with tap and water with soap OR alcohol-based hand-rub.
There should be at least two hand hygiene stations in a ward with more than 20 beds.
Verify that water is available from the tap.
3.2 Key places include at points of care, the waiting room, at the facility’s entrance and within 5 m of latrines.
3.3 Sink or bucket with tap and water with soap OR alcohol-based hand-rub. Service areas include sterilization, laboratory,
kitchen, laundry, showers, waste zone and mortuary. (Toilets are included under 2.7)
3.4 Tap and water with soap.
NOTES – ENVIRONMENT, CLEANLINESS AND DISINFECTION (FACILITY ASSESSMENT)
3.8 Clean as noted by absence of waste, visible dirt and excreta and insects. Environmental surfaces or objects contaminated with
blood, other body fluids, secretions or excretions are cleaned and disinfected as soon as possible using standard hospital
detergents/disinfectants.
3.10 Waste disposal staff who operate the incinerator should have an apron, gloves, goggles, face mask and boots.
NOTES – MANAGEMENT (FACILITY ASSESSMENT)
4.2 The budget refers to that used for capital and operational costs. It could be from the community-management group and/or
the government, according to the policies and practices in the country.

135
Facility Assessment - Notes
Finish assessing all the wards before you go on to assess the facility. Before you begin you assessment and scoring, take the
time to walk through all areas in the facility, including the outside area, the kitchen, the laundry… inspect the incinerator
facilities, water supply and management of waste, including grey water… and check availability and count numbers of functional
latrines, toilets, lightening, drinking water stations, hand washing stations, soap dispensers, bins, cleaning material, availability
of charts and signs in all the areas of the facility other than the wards. Speak to staff, take pictures where needed (no
patients/staff/hospital identifying signs allowed in pictures; ONLY THE THREE WASH TEAM SUPERVISORS (i.e. NOT the team
leaders) ARE ALLOWED TO TAKE PICTURES). Sit with the team and try to score some of the indicators. If needed walk through
the facility again to gather mode details which will allow you to fine-tune the scoring. In the process, write down all your
questions. You can then address all your queries with a member of staff in one go. This should allow you to complete the
assessment. The assessment refers to the OVERALL scoring for the facility after having observed all wards and all areas.
ENTER FACILITY CODE: _____________________________

136
OVERALL FACILITY ASSESSMENT
ENTER FACILITY
CODE:_________________
BASELINE ASSESSMENT
(Clearly tick the box that best describes your findings) Assessment Date:
1 WATER
Meets
Target
(+++)
Partially Meets
Target
(++)
Does not
Meet Target
(+)
Explain the reasoning for your scoring and
comment as appropriate. For indicators with
an asterisk, read the notes before scoring.
1.1* Improved water supply
piped into the facility or on
premises and available.
□ Yes, improved
water supply
within facility and
available
□ Improved
water supply on
premises,
(outside of
facility building)
and available
□ No improved water
source within facility
grounds, or improved
supply in place but
not available.
1.2* Water services available at
all times and of sufficient
quantity for all uses (refers
to a typical average week)
□ Yes, every day
and of sufficient
quantity
□ More than 5
days per week or
every day but not
sufficient
quantity
□ Fewer than 5 days
per week
1.3* A reliable drinking water
station is present and
accessible for staff, patients
and carers at all times and
in all locations/wards.
□ Yes, at all
times/wards and
accessible to all
□ Sometimes, or
only in some
places or not
available for all
users
□ Not available
1.4 Drinking water is safely
stored in a clean bucket/
tank with cover and tap.
□ Yes □ Only some
available drinking
water points are
safely stored
□ Not safely stored in
any water points or
no drinking water
available

137
1.5 Sanitary inspection risk
score (using Sanitary
Inspection Form).
□ Low risk □ Medium risk □ High or very high
risk
1.6 All end points (i.e. taps) are
connected to an available
and functioning water
supply.
□ Yes, all are
connected and
functioning
□ More than half
of all endpoints
are connected
and functioning
□ No, less than half of
all endpoints
connected and
functioning
1.7 Water services available
throughout the year (i.e.
not affected by seasonality,
climate change-related
extreme events or other
constraints). Refers to ‘in a
typical average year’.
□ Yes, throughout
the year
□ Water
shortages for 1-2
months
□ Water shortages
for 3 months or more
1.8* Water storage is sufficient
to meet the needs of the
facility for 2 days.
□ Yes □ More than 75%
of needs met
□ Less than 75% of
needs met
1.9* Water is treated and
collected for drinking with a
proven technology that
meets WHO performance
standards.
□ Yes □ Treated but
not regularly
□ Not treated

138
1.10* Drinking water has
appropriate chlorine
residual (0.2mg/l or 0.5mg/l
in emergencies) or 0
E.coli/100 ml and is not
turbid.
□ Yes □ Chlorine
residual exists
but is <0.2mg/l
□ Not treated / do
not know residual
/do not have capacity
to test residual/ no
drinking water
available
1.11* National water quality
standards exist, and the
facility water supply is
regulated according to
these standards.
□ Yes, and water
meets national
standards.
□ Yes, but no
regulation or
testing.
□ No standards exist.
1.12 Sufficient energy is available
for pumping and boiling
water (mark if not
applicable).
□ Yes, always □ Yes, sometimes □ Never
1.13 At least one shower or
bathing area is available per
40 patients in inpatient
settings and is functioning
and accessible.
□ Yes □ Showers
available, but no
water or in
disrepair or
showers
available but
fewer than1 per
40
□ No showers.
1.14 Shower(s) are adequately
lit, including at night.
□ Yes □ Lighting
infrastructure
exists, but not
functioning
□ Not adequately lit
or no lighting
infrastructure

139
OVERALL FACILITY ASSESSMENT
ENTER FACILITY
CODE:_________________
BASELINE ASSESSMENT
(Clearly tick the box that best describes your findings) Assessment Date:
2.a SANITATION Meets
Target
(+++)
Partially
Meets Target
(++)
Does not
Meet Target
(+)
Explain the reasoning for your scoring and
comment as appropriate. For indicators with an
asterisk, read the notes before scoring.
2.1* Number of available and
usable toilets or improved
latrines for patients.
□ 4 or more
(outpatients)
and one per
20 users
(inpatients).
□ Sufficient
number
present but
not all
functioning or
insufficient
number.
□ Less than 50% of
required number of
latrines available and
functioning.
2.2 Toilets or improved latrines
clearly separated for staff and
patients and visitors.
□ Yes. □ Some
separate
latrines but
not for all
three
categories
(staff, patients
and visitors).
□ No separate latrines.
2.3 Toilets or improved latrines
clearly separated for male and
female.
□ Yes.
N/A.
□ No indication of
gender separation.
2.4* At least one toilet or improved
latrine provides the means to
manage menstrual hygiene
needs.
□ Yes. □ Yes, but
toilet is not
clean or in
disrepair.
□ No.

140
2.5* At least one toilet meets the
needs of people with reduced
mobility.
□ Yes. □ Yes, but not
available or in
disrepair.
□ No toilets for disabled
users.
2.6* Functioning hand hygiene
stations within 5 m of latrines.
□ Yes. □ Present, not
functioning or
no water or
soap.
□ Not present.
2.7* Record of cleaning visible and
signed by the cleaners each
day.
□ Yes. □ Toilets
cleaned but
not recorded.
□ No record / toilets
cleaned less than once a
day.
2.8* Wastewater is safely managed
through use of on-site
treatment (i.e. septic tank
followed by drainage pit) or
sent to a functioning sewer
system.
□ Yes. □ Present but
not
functioning.
□ Not present.
2.9* Greywater (i.e. rainwater or
wash water) drainage system
is in place that diverts water
away from the facility (i.e. no
standing water) and also
protects nearby households.
□ Yes. □ Yes, but not
functioning
and obvious
pools of water.
□ Not present.
2.10
*
Latrines are adequately lit,
including at night.
□ Yes □ Lighting
infrastructure
exists, but not
functioning.
□ Not adequately lit or
no lighting
infrastructure.
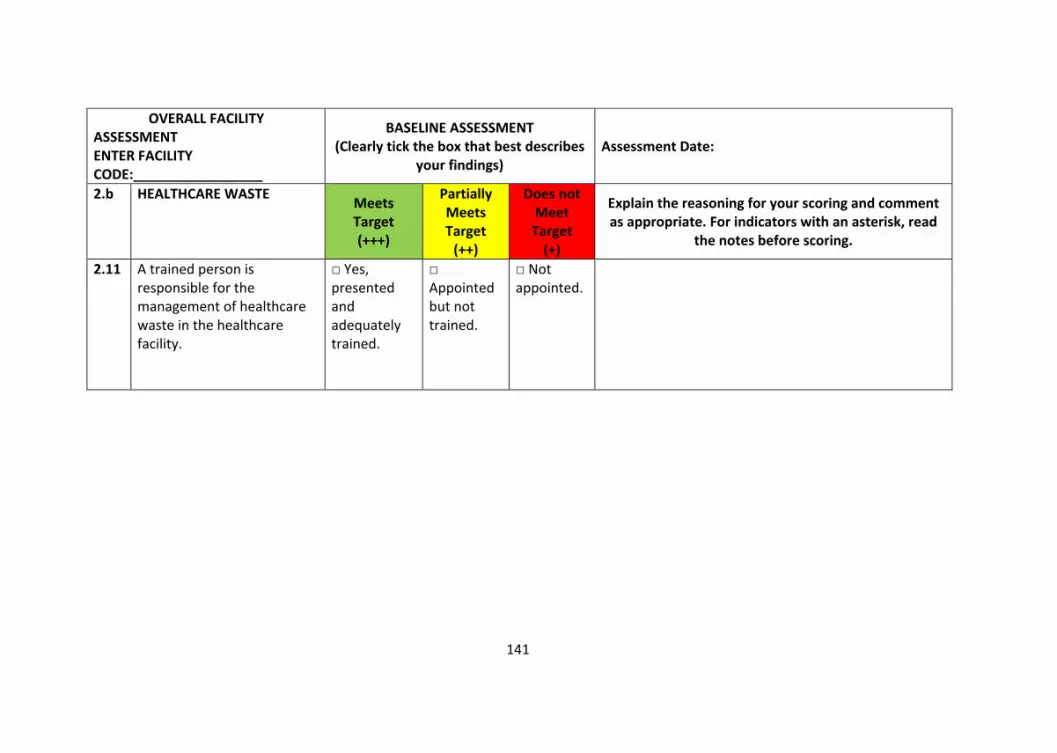
141
OVERALL FACILITY ASSESSMENT ENTER FACILITY CODE:_________________
BASELINE ASSESSMENT (Clearly tick the box that best describes
your findings) Assessment Date:
2.b HEALTHCARE WASTE Meets Target (+++)
Partially Meets Target
(++)
Does not Meet Target
(+)
Explain the reasoning for your scoring and comment as appropriate. For indicators with an asterisk, read
the notes before scoring.
2.11 A trained person is responsible for the management of healthcare waste in the healthcare facility.
□ Yes, presented and adequately trained.
□ Appointed but not trained.
□ Not appointed.

142
2.12*
Functional waste collection containers for 1) non-infectious (general) waste, 2) infectious waste and 3) sharps waste in close proximity to all waste generation points.
□ Yes. □ Separate bins present but lids missing or more than ¾ full; only two bins (instead of three); or at some but not all waste generation points.
□ No bins or separate sharps disposal.
2.13 Waste correctly segregated at all waste generation points.
□ Yes. □ Some sorting but not all correctly or not practiced throughout the facility.
□ No sorting.
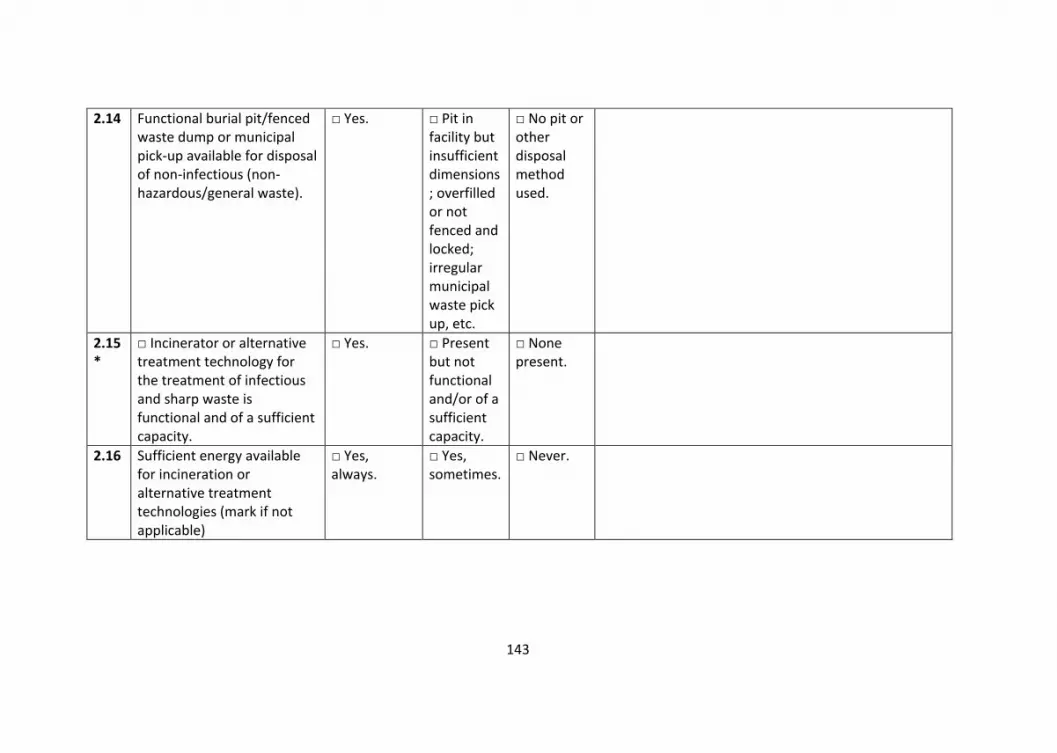
143
2.14 Functional burial pit/fenced waste dump or municipal pick-up available for disposal of non-infectious (non-hazardous/general waste).
□ Yes. □ Pit in facility but insufficient dimensions; overfilled or not fenced and locked; irregular municipal waste pick up, etc.
□ No pit or other disposal method used.
2.15*
□ Incinerator or alternative treatment technology for the treatment of infectious and sharp waste is functional and of a sufficient capacity.
□ Yes. □ Present but not functional and/or of a sufficient capacity.
□ None present.
2.16 Sufficient energy available for incineration or alternative treatment technologies (mark if not applicable)
□ Yes, always.
□ Yes, sometimes.
□ Never.

144
2.17 Hazardous and non-hazardous waste are stored separately before being treated/disposed of or moved off site.
□ Yes, separated storage areas available.
□ Separated storage areas are available but with insufficient capacity or overfilled.
□ No separated storage areas available.
2.18*
All infectious waste is stored in a protected area before treatment, for no longer than the default and safe time.
□ Yes. □ Treated between 24-48 hours.
□ Treated after 48 hours or not treated at all.
2.19*
Anatomical- pathological waste is put in a dedicated pathological waste/placenta pit, burnt in a crematory or buried in a cemetery. (mark if not applicable).
□ Yes. □ Pit is present but not used or functional or overfilled or not fenced and locked.
□ None present.

145
2.20*
Dedicated ash pits available for disposal of incineration ash (mark if not applicable).
□ Yes. □ Present but not functional or overfilled or not fenced and locked.
□ None present.
2.21 Protocol or SOP (Standard Operating Procedure) for safe management of healthcare waste clearly visible and legible.
□ Yes, visible and implemented
□ Written but not visible or implemented.
□ No protocol/SOP in place.
2.22*
Appropriate protective equipment for all staff in charge of waste treatment and disposal.
□ Yes. □ Some equipment available, but not for all staff, or available but damaged.
□ None available.

146
OVERALL FACILITY ASSESSMENT
ENTER FACILITY
CODE:_________________
BASELINE ASSESSMENT
(Clearly tick the box that best describes your findings) Assessment Date:
3.a HAND HYGIENE
Meets
Target
(+++)
Partially Meets
Target
(++)
Does not
Meet Target
(+)
Explain the reasoning for your scoring
and comment as appropriate. For
indicators with an asterisk, read the notes
before scoring.
3.1* Functioning hand hygiene
stations are available at
all points of care.
□ Yes. □ Stations
present, but no
water and/or
soap or alcohol
hand-rub
solution.
□ Not present.
3.2* Hand hygiene promotion
materials clearly visible
and understandable at
key places.
□ Yes. □ Some places
but not all.
□ None.
3.3* Functioning hand hygiene
stations are available in-
service areas.
□ Yes. □ Stations
present, but no
water and/or
soap or alcohol
hand-rub
solution.
□ Not present.

147
3.4* Functioning hand hygiene
stations available in
waste disposal area
□ Yes. □ Stations
present, but no
water and/or
soap.
□ Not present.
3.5 Hand hygiene compliance
activities are undertaken
regularly.
□ Yes. □ Compliance
activities in
policy, but not
carried out with
any regularity.
□ No compliance
activities.
OVERALL FACILITY
ASSESSMENT
ENTER FACILITY
CODE:_________________
BASELINE ASSESSMENT
(Clearly tick the box that best describes your findings) Assessment Date:
3.b ENVIRONMENT,
CLEANLINESS AND
DISINFECTION
Meets
Target
(+++)
Partially Meets
Target
(++)
Does not
Meet Target
(+)
Explain the reasoning for your scoring
and comment as appropriate. For
indicators with an asterisk, read the
notes before scoring.

148
3.6 The exterior of the
facility is well-fenced,
kept generally clean (free
from solid waste,
stagnant water, no
animal and human
faeces in or around the
facility premises, etc.).
□ Yes. □ Partly but
improvements
could be made.
Yes,
sometimes.
□ Not kept clean at
all.
3.7 General lighting
sufficiently powered and
adequate to ensure safe
provision of healthcare
including at night (mark
if not applicable).
□ Yes, always. □ Yes,
sometimes.
□ Never.
3.8* Floors and horizontal
work surfaces appear
clean.
□ Yes. □ Some floors
and work
surfaces
appear clean,
but others do
not.
□ Most and/or all
floors and surfaces
are visibly dirty.
3.9 Appropriate and well-
maintained materials for
cleaning (i.e. detergent,
mops, buckets, etc.) are
available.
□ Yes. □ Yes, available
but not well
maintained.
□ No materials
available.

149
3.10* At least two pairs of
household cleaning
gloves and one pair of
overalls or apron and
boots in a good state, for
each cleaning and waste
disposal staff member.
□ Yes. □ Available but
in poor
condition.
□ Not available.
3.11 At least one member of
staff can demonstrate
the correct procedures
for cleaning and
disinfection and apply
them as required to
maintain clean and safe
rooms.
□ Yes. □ Procedure is
known but not
applied.
□ Procedure not
known or applied.
3.12 Beds have insecticide
treated nets to protect
patients from mosquito-
borne diseases.
□ Yes, on all
beds.
□ Available on
some but not
all beds, or
available but
with rips and or
holes.
□ No bed nets
available.

150
3.13 A mechanism exists to
track supply of IPC-
related materials (such
as gloves and protective
equipment) to identify
stock-outs.
□ Yes. □ Mechanism
exists but is not
enforced.
□ No mechanism
exists.
3.14 Record of cleaning visible
and signed by the
cleaners each day.
□ Yes. □ Record exists
but is not
completed
daily or is
outdated.
□ No record of
floors and surfaces
being cleaned.
3.15 Laundry facilities are
available to wash linen
from patient beds
between each patient.
□ Yes. □ Facilities
exist but are
not working or
not being used.
□ No facilities,
and/or no linen.
3.16 The facility has sufficient
natural ventilation and
where the climate
allows, large opening
windows, skylights and
other vents to optimize
natural ventilation.
□ Yes. □ Some
ventilation but
not well
maintained or
insufficient to
produce
natural
ventilation.
□ No.

151
3.17 Kitchen stores and
prepared food is
protected from flies,
other insects or rats.
□ Yes.
N/A
□ No.
3.18 Beds for patients should
be separated by a
distance of 2.5 metres
from the centre of one
bed to the other and
each bed has only one
patient.
□ Yes, all beds
meet this
guidance.
□ Some but not
all beds fit this
criteria.
□ No beds meet
this criteria.
OVERALL FACILITY ASSESSMENT
ENTER FACILITY
CODE:_________________
BASELINE ASSESSMENT
(Clearly tick the box that best describes your
findings)
Assessment Date:
4 MANAGEMENT
Meets
Target
(+++)
Partially Meets
Target
(++)
Does not
Meet Target
(+)
Explain the reasoning for your scoring
and comment as appropriate. For
indicators with an asterisk, read the
notes before scoring.

152
4.1 WASH FIT or other quality
improvement/management
plan for the facility is in
place, implemented and
regularly monitored.
□ Yes.
□ Complete but
has not been
implemented
and/or is not
monitored, or
incomplete.
□ No plan.
4.2* An annual planned budget
for the facility is available
and includes funding for
WASH infrastructure,
services, personnel and the
continuous procurement of
WASH items (hand hygiene
products, minor supplies to
repair pipes, toilets, etc.)
which is enough to meet the
needs of the facility.
□ Yes. □ Yes, but
budget is
insufficient.
□ No budget.
4.3 An up-to-date diagram of the
facility management
structure is clearly visible
and legible.
□ Yes. □ Yes, but not
up to date.
□ Not available.
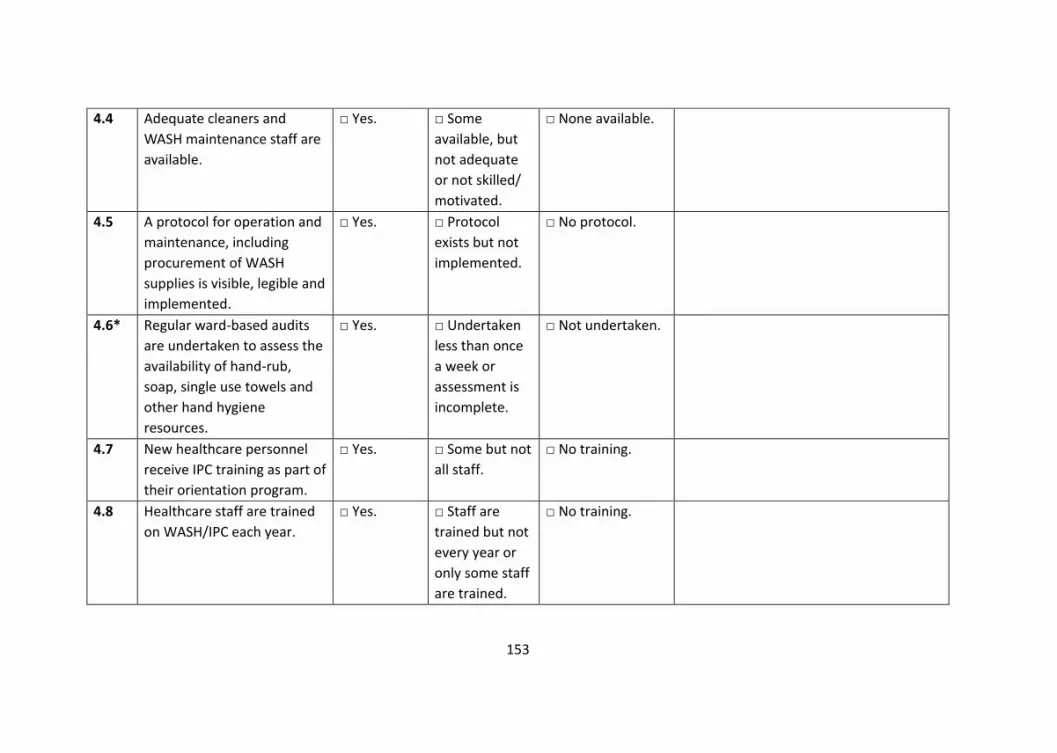
153
4.4 Adequate cleaners and
WASH maintenance staff are
available.
□ Yes. □ Some
available, but
not adequate
or not skilled/
motivated.
□ None available.
4.5 A protocol for operation and
maintenance, including
procurement of WASH
supplies is visible, legible and
implemented.
□ Yes. □ Protocol
exists but not
implemented.
□ No protocol.
4.6* Regular ward-based audits
are undertaken to assess the
availability of hand-rub,
soap, single use towels and
other hand hygiene
resources.
□ Yes. □ Undertaken
less than once
a week or
assessment is
incomplete.
□ Not undertaken.
4.7 New healthcare personnel
receive IPC training as part of
their orientation program.
□ Yes. □ Some but not
all staff.
□ No training.
4.8 Healthcare staff are trained
on WASH/IPC each year.
□ Yes. □ Staff are
trained but not
every year or
only some staff
are trained.
□ No training.

154
4.9 Facility has a dedicated
WASH or IPC focal person.
□ Yes. □ Yes, but focal
point does not
have sufficient
time, resources
or motivation
to carry out
duties.
□ No.
4.10 All staff have a job
description written clearly
and legibly, including WASH-
related responsibilities and
are regularly appraised on
their performance.
□ Yes. □ Some, but
not all, staff
have a job
description, or
their
performance is
not appraised.
□ No job
description
written.
4.11 High performing staff are
recognized and rewarded
and those that do not
perform are dealt with
accordingly.
□ Yes. □ Either high or
low performers
addressed but
not both.
□ No action or
recognition of staff
based on
performance.

155
Sanitary Inspection Form - Notes
Do your assessment with the public health officer on site. Always write the name of the company supplying water to the facility
(where applicable).
ENTER FACILITY CODE: _____________________________

156
SANITARY INSPECTION FORM 1: DUG WELL WITH HAND PUMP
I. General information
a. Code of facility: b. Location and/or name of dug well: c. Date of inspection: d. Weather conditions during inspection:
Note. If there is more than one dug well accessed by the facility, or if the facility uses other water sources (such as springs or boreholes), carry out sanitary inspections for these sources too.
II. Specific questions for assessment
1. Is the source located at an unsafe distance from an unsealed latrine (i.e. a latrine near is uphill or at a location where the groundwater gradient would flow from the latrine to the water source)? Y/N
2. Is the fence absent, inadequate or faulty? Y/N 3. Can animals have access within 30 metres (100 feet) of the well? Y/N 4. Is there any other source of pollution within 30 metres (100 feet) of the
well (such as animal breeding, farming, roads, healthcare waste, domestic garbage)? Y/N
5. Is there stagnant water within 3 metres of the well? Y/N 6. Is the drainage channel absent or cracked, broken or in need of
cleaning? Y/N 7. Is the cement floor or slab less than 2 metres in diameter around the
top of the well? Y/N 8. Are there cracks in the cement floor or slab? Y/N 9. Is the hand pump loose at the point of attachment or, for rope-washer
pumps, is the pump cover missing or damaged? Y/N
10. Is the well cover absent, cracked or insanitary? Y/N
Total score of risk factors as total number of “YES” answers: III. Results and comments
a. Sanitary inspection risk score (tick appropriate box):
Very high risk (risk score: 9–10)
High risk (risk score: 6–8)
Medium risk (risk score: 3–5)
Low risk (risk score: 0–2)

157
b. Important points of risk noted and reported on the reverse of this form:
• list according to question numbers 1–10
• additional comments.
IV. Names and signatures of assessors: ………………………………………………………………. SANITARY INSPECTION FORM 2: DEEP BOREHOLE WITH MOTORIZED PUMP
I. General information
a. Code of facility: b. Location and/or name of borehole: c. Date of inspection: d. Weather conditions during inspection:
Note. If there is more than one borehole accessed by the facility, or if the facility uses other water sources (such as springs or dug wells), carry out sanitary inspections for these sources too.
II. Specific questions for assessment 1. Is there a latrine or sewer within 15–20 m of the extraction site/well-head? Y/N 2. Is the nearest latrine a pit latrine that percolates to soil, i.e. not connected to a septic tank or sewer? Y/N 3. Is there any other source of pollution (e.g. animal excreta, rubbish, surface water) within 10 m of the borehole? Y/N 4. Is there an uncapped well within 15–20 m of the borehole? Y/N 5. Is the drainage area around the pump house faulty? Y/N 6. Is the fencing around the installation damaged in any way which would permit any unauthorized entry or allow animals access? Y/N 7. Is the floor of the pump house permeable to water? Y/N 8. Is the well seal unsanitary? Y/N 9. Is the chlorination functioning properly? Y/N

158
10. Is chlorine present at the sampling tap? Y/N Total score of risk factors as total number of “YES” answers: III. Results and comments
a. Sanitary inspection risk score (tick appropriate box):
Very high risk (risk score: 9–10)
High risk (risk score: 6–8)
Medium risk (risk score: 3–5)
Low risk (risk score: 0–2)
b. Important points of risk noted and reported on the reverse of this form:
• list according to question numbers 1–10
• additional comments.
IV. Names and signatures of assessors: ………………………………………………………………. SANITARY INSPECTION FORM 3: PUBLIC/YARD TAPS AND PIPED DISTRIBUTION I. General information
a. Code of facility: b. Date of inspection: c. Weather conditions during inspection: d. Location and/or name of water source(s) feeding the distribution system: e. Location and/or name of storage reservoir feeding the distribution system (if
any): Note. If the distribution system is served by a storage reservoir, also carry out a sanitary inspection using the form “Storage reservoirs”.
II. Specific questions for assessment
Note. Fill in one form per public or yard tap under inspection. In facilities with water piped directly into the building only questions 7–10 apply. Not all taps within the facility need to be inspected in every inspection round; a selected sample is enough.
Public or yard tap 1. Does the tap leak? Y/N 2. Is the tap or are attachments (such as hoses) insanitary? Y/N 3. Does spilt water accumulate around the tap stand? Y/N 4. Is the area around the tap stand polluted by waste, faeces or other
materials? Y/N

159
5. Is the area around the tap stand unfenced, allowing animals to access the area? Y/N
6. Is there a sewer or a latrine at an unsafe distance from the tap stand (generally 30 m but may be more or less depending on the gradient, geology and size of water or sewer infrastructure) Y/N
Piped distribution 7. Are there any signs of leaks in the inspection area (for example,
accumulating water)? Y/N 8. Are any of the pipes exposed above ground in the inspection area? Y/N 9. Have users report any pipe breaks within the last week? Y/N 10. Has there been discontinuity in the last 10 days? Y/N
Total score of risk factors as total number of “YES” answers: III. Results and comments
a. Sanitary inspection risk score (tick appropriate box): Note. In situations where, only questions 6–10 apply, the score below can be adapted as follows: “Very high” = 5; “High” = 3–4; “Medium” = 2; “Low” = 0–1.
Very high risk (risk score: 9–10)
High risk (risk score: 6–8)
Medium risk (risk score: 3–5)
Low risk (risk score: 0–2)
b. Important points of risk noted and reported on the reverse of this form:
• list according to question numbers 1–10
• additional comments.
IV. Names and signatures of assessors: ………………………………………………………………. SANITARY INSPECTION FORM 4: RAINWATER HARVESTING I. General information
a. Code of facility: b. Location and/or name of rainwater storage: c. Date of inspection: d. Weather conditions during inspection:
Note. If the facility uses other water sources (such as springs or boreholes), carry out sanitary inspections for these sources too.
II. Specific questions for assessment

160
1. Is there any visible contamination of the roof catchment area (plants, dirt, or excreta)? Y/N 2. Are the guttering channels that collect water dirty? Y/N 3. Is there any deficiency in the filter box at the tank inlet (e.g. lacks fine gravel)? Y/N 4. Is there any other point of entry to the tank that is not properly covered? Y/N 5. Is there any defect in the walls or top of the tank (e.g. cracks) that could let water in? Y/N 6. Is the tap leaking or otherwise defective? Y/N 7. Is the concrete floor under the tap defective or dirty? Y/N 8. Is the water collection area inadequately drained? Y/N 9. Is there any source of pollution around the tank or water collection area (e.g. excreta)? Y/N 10. Is a bucket in use and left in a place where it may become contaminated? Y/N Total score of risk factors as total number of “YES” answers: III. Results and comments
a. Sanitary inspection risk score (tick appropriate box):
Very high risk (risk score: 9–10)
High risk (risk score: 6–8)
Medium risk (risk score: 3–5)
Low risk (risk score: 0–2)
b. Important points of risk noted and reported on the reverse of this form:
• list according to question numbers 1–10
• additional comments. IV. Names and signatures of assessors: ……………………………………………………………….

161
SANITARY INSPECTION FORM 5: STORAGE RESERVOIRS I. General information
a. Code of facility: b. Location and/or name of storage reservoir: c. Date of inspection: d. Weather conditions during inspection: e. Location and/or name of water source(s) feeding the reservoir:
Note. If there is more than one storage reservoir used in your facility, use one form for each reservoir. Note. If the storage reservoir feeds a piped distribution system, also carry out a sanitary inspection using the form “Public/yard taps and piped distribution”. Note. If the storage reservoir is equipped with a tap for collecting water, also carry out a sanitary inspection using questions 1–5 of the form “Public/yard taps and piped distribution”.
II. Specific questions for assessment
1. Is there any point of leakage of the pipe between source and storage reservoir? Y/N
2. Is the physical infrastructure of the storage reservoir cracked or leaking? Y/N
3. Is the inspection cover of the storage reservoir absent or open? Y/N 4. Is the inspection cover faulty, corroded or is the concrete around the
cover damaged? Y/N 5. Is the inspection cover visibly dirty? Y/N 6. Are screens protecting the air vents on the storage reservoir missing or
damaged? Y/N 7. If there is an overflow pipe, is the screen protecting it missing or
damaged? Y/N 8. Is there any scum or foreign object in the storage reservoir? Y/N 9. Is the diversion ditch above the storage reservoir absent or non-
functional? Y/N 10. Is the area around the storage reservoir unfenced or is the fence
damaged, allowing animals to access the area? Y/N 11. Is the storage reservoir not regularly cleaned and disinfected? Y/N
Total score of risk factors as total number of “YES” answers:

162
III. Results and comments
a. Sanitary inspection risk score (tick appropriate box):
Very high risk (risk score: 9–11)
High risk (risk score: 6–8)
Medium risk (risk score: 3–5)
Low risk (risk score: 0–2)
b. Important points of risk noted and reported on the reverse of this form:
• list according to question numbers 1–11
• additional comments.
IV. Names and signatures of assessors:…………………………………………………………..

163
S3 File: Consolidated criteria for reporting qualitative studies (COREQ)
Manuscript: Evaluating the foundations that help avert antimicrobial resistance:
Performance of essential water sanitation and hygiene functions in hospitals
and requirements for action in Kenya
Consolidated criteria for reporting qualitative studies (COREQ): 32-item
checklist
Developed from:
Tong A, Sainsbury P, Craig J. Consolidated criteria for reporting qualitative research (COREQ): a 32-item checklist for interviews and focus groups. International Journal for Quality in Health Care. 2007. Volume 19, Number 6: pp. 349 – 357
No. Item
Guide questions/description Reported on
Page #
Domain 1: Research
team and reflexivity
Personal Characteristics
1. Interviewer/facilitator Which author/s conducted the
interview or focus group?
9
2. Credentials What were the researcher’s
credentials? E.g. PhD, MD
1
3. Occupation What was their occupation at the time
of the study?
9
4. Gender Was the researcher male or female? 1
5. Experience and
training
What experience or training did the
researcher have?
9
Relationship with
participants
6. Relationship
established
Was a relationship established prior to
study commencement?
Yes, 9
7. Participant knowledge
of the interviewer
What did the participants know about
the researcher? e.g. personal goals,
reasons for doing the research
9

164
8. Interviewer
characteristics
What characteristics were reported
about the interviewer/facilitator? e.g.
Bias, assumptions, reasons and
interests in the research topic
9
Domain 2: study design
Theoretical framework
9. Methodological
orientation and Theory
What methodological orientation was
stated to underpin the study? e.g.
grounded theory, discourse analysis,
ethnography, phenomenology,
content analysis
9
Participant selection
10. Sampling How were participants selected? e.g.
purposive, convenience, consecutive,
snowball
10
11. Method of approach How were participants approached?
e.g. face-to-face, telephone, mail,
8/9
12. Sample size How many participants were in the
study?
8
13. Non-participation How many people refused to
participate or dropped out? Reasons?
None, 9
Setting
14. Setting of data
collection
Where was the data collected? e.g.
home, clinic, workplace
9
15. Presence of non-
participants
Was anyone else present besides the
participants and researchers?
9
16. Description of sample What are the important characteristics
of the sample? e.g. demographic data,
date
8
Data collection
17. Interview guide Were questions, prompts, guides
provided by the authors? Was it pilot
tested?
8/9
18. Repeat interviews Were repeat interviews carried out? If
yes, how many?
No, 9
19. Audio/visual
recording
Did the research use audio or visual
recording to collect the data?
Yes, 9

165
20. Field notes Were field notes made during and/or
after the interview or focus group?
No
21. Duration What was the duration of the
interviews or focus group?
9
22. Data saturation Was data saturation discussed? Yes, 9
23. Transcripts returned Were transcripts returned to
participants for comment and/or
correction?
No,– 10
Domain 3: analysis and
findings
Data analysis
24. Number of data
coders
How many data coders coded the
data?
10
25. Description of the
coding tree
Did authors provide a description of
the coding tree?
Yes 10
26. Derivation of themes Were themes identified in advance or
derived from the data?
Yes, from
Data
27. Software What software, if applicable, was used
to manage the data?
10
28. Participant checking Did participants provide feedback on
the findings?
Yes, 9
Reporting
29. Quotations
presented
Were participant quotations presented
to illustrate the themes/findings? Was
each quotation identified? e.g.
participant number
Yes
30. Data and findings
consistent
Was there consistency between the
data presented and the findings?
Yes
31. Clarity of major
themes
Were major themes clearly presented
in the findings?
Yes
32. Clarity of minor
themes
Is there a description of diverse cases
or discussion of minor themes?
From page 17-
24

166
S 4 File. Ward level Aggregate by Domain for Water, Hygiene and Organisation Management
Multi-panel plot showing the mean service performance at ward level for all the water, hygiene and organisational management domain.

167
S5 File. Performance of Indicators under the infection prevention and control committee and
hospital management
Shows mean service performance at ward level for indicators under the infection prevention and
control and hospital management domains shown by the vertical bars. The horizontal bars
summarise the performance of each indicator across all the hospitals. The central tiles in the
central grid are coloured according to the performance classification of each indicator in each
hospital using % cut-offs.

168

169
Chapter 4
Infection prevention and control during
the COVID-19 pandemic: challenges and
opportunities for Kenyan public hospital
Michuki Maina, Olga Tosas-Auguet, Mike English, Constance
Schultsz and Jacob McKnight [version 1; peer review: 2
approved]. Wellcome Open Res 2020, 5:211
(https://doi.org/10.12688/wellcomeopenres.16222.1)

170
Abstract
Background
Infection prevention and control, and water sanitation and hygiene have an
essential role in ensuring the quality of care and patient outcomes in hospitals.
Using a modification of the World Health Organization’s water sanitation and
hygiene facility improvement tool, we undertook assessments in 14 public
hospitals in Kenya in 2018. The hospitals received written feedback on areas
where they could make improvements. Following the first confirmed cases of
COVID-19 in Kenya, we were drawn to ask whether the results of our pre-
pandemic survey had led to action, and whether or not the threat of COVID-19
had focused more attention on infection prevention and control and water
sanitation and hygiene.
Methods
Using a semi-structured interview guide, we carried out phone interviews with
key hospital leaders in 11 of the 14 hospitals. The data were transcribed and
coded into thematic areas. We draw on these interviews to describe the status
and awareness of infection prevention and control.
Results
The infection prevention and control committee members are training health
workers on infection prevention and control procedures and proper use of
personal protective equipment and in addition, providing technical support to
hospital managers. While some hospitals have also accessed additional funds
to improve infection prevention and control, they tended to be small amounts
of money. Long-standing challenges with supplies of infection prevention and
control materials and low staff morale persist. Crucially, the reduced supply of

171
personal protective equipment has led to fear and anxiety among health care
personnel.
Conclusions
As funds are mobilised to support care for COVID-19, we ask that funds
prioritise infection prevention and control measures. This would have a
profoundly positive effect on within hospital virus transmission, patient and
staff safety but also lasting benefits beyond the COVID-19 pandemic.
Key Words
Water Sanitation and Hygiene, Infection Prevention and Control, COVID- 19

172
Introduction
Improving water sanitation and hygiene (WASH) and infection prevention and
control (IPC) in medical facilities is crucial to the fight against COVID-19 in all
countries, but particularly so in those countries with long-standing problems in
maintaining effective infection control (1). Hospitals are now thought to have
been significant sites for COVID-19 infection spread in some of the countries
worst affected by the pandemic (2). Ensuring effective infection control in
hospitals protects patients and health workers, improving worker confidence
and morale. Maintaining a healthy workforce is essential to the COVID-19
response and the provision of all other health interventions(3).
We conducted a WASH survey of 14 Kenyan hospitals in 2018. We adapted the
World Health Organisation's WASH facility improvement tool to explore
performance differences between hospitals and between wards in individual
hospitals (4). We found a wide degree of performance variation and particular
problems in hand hygiene and waste management infrastructure. We also
proposed accountability structures to facilitate improvements in WASH (5, 6).
All the 14 original hospitals had an IPC focal person who was trained to conduct
WASH-FAST surveys and had surveyed at least four hospitals, including their
own; each hospital received detailed site-specific feedback on their results. We
hoped that this feedback and the training given to local focal points might
prompt local post-survey WASH and IPC improvement efforts.
The first confirmed case of COVID-19 in Kenya was announced on 12th March
2020. This was accompanied by extensive media coverage and citizen education
on COVID-19, including the importance of social distancing and proper hand
hygiene. At this point, the main policy measures implemented by the
government included quarantine of travellers returning to Kenya, the
suspension of public gatherings and the setting up of a national COVID-19

173
isolation unit in Nairobi (7). No restriction of movement or curfews were
executed at this point. Following the first confirmed cases, we were drawn to
ask what actions had occurred, and whether or not the threat of COVID-19 was
focusing more attention on IPC and WASH. On 2nd April 2020, we contacted the
hospital staff who previously led the WASH surveys. By this date, there were
110 confirmed cases around the country, and the main government
interventions included restriction of movement and a nationwide dusk to dawn
curfew. The government, through the regional governments, had embarked on
setting up COVID-19 isolation units in multiple county hospitals (8). As April
proceeded, Kenya requested World Bank funding for these isolation units, for
training and for the purchase of ventilators to improve intensive care capacity
(9).
Methods
Interview data collection
We conducted semi-structured phone interviews in April and May 2020. Each
interview lasted approximately 20-30 minutes, with the consent of 11
representatives of the original 14 hospitals, (the semi-structured interview
template can be found in the online data repository). The respondents were
medical officers, dentists, pharmacists, non-physician clinicians, nurses, and
public health officers. Of these, one was a hospital director, and another was in
charge of hospitals across the administrative region (sub-county). The
interviewees comprised a balanced mix of gender, age and experience. The
semi-structured interview instrument used was informed by data collected
from the previous surveys. The interview guide was prepared by all the authors
who consist of a mix of clinicians, epidemiologists, health system experts and
medical anthropologists. The authors are also very familiar with the Kenyan
health system and IPC context and were all actively involved in the previous

174
IPC/WASH surveys in 2018 (5, 6). The first author conducted the phone
interviews. The first author, who is a Kenya doctor, also led the original surveys
and is familiar with the health system context. Field notes were not taken.
Background information concerning the study and interview was availed to
these interviewees before consenting. All respondents gave verbal consent for
the interviews.
Analysis of data obtained from interviews
We sought to understand if any changes or improvements had occurred within
the hospital for each area we had previously analysed (5, 6). We then asked
how the present COVID-19 pandemic was affecting efforts to improve the
WASH infrastructure and IPC, how the facility was preparing for COVID- 19
patients and how the pandemic had affected hospital and health worker
activities. The audio files of each interview were transcribed and uploaded into
NVivo 12 and kept on an encrypted laptop. The first author coded the
transcripts independently before discussing the codes and agreeing on
combined axial codes and thematic areas with the last author. The findings from
these themes illustrated using quotes. No repeat interviews were conducted. A
Consolidated criteria for Reporting Qualitative research (COREQ) checklist was
completed and is included in the data repository.
Ethical approval
This study received approval from the Oxford Tropical research ethics
committee (OXTREC) from the University of Oxford (Ref: 525–17) and the
Kenyan Medical Research Institute (Ref: KEMRI/SERU/CGMR-C//086/3450).

175
Results
Infection control status and awareness improved
Our original survey had noted the low performance of WASH and infection
control. Previously, staff responsible for hygiene issues contrasted infection
control committees with those of more prestigious domains, such as the
medicines committee, and complained that members did not attend meetings.
Since the emergence of COVD-19, this has changed and the roles played by the
IPC committees have gained more focus and importance.
"Actually, right now people are more responsive, previously
you call people on things to do with IPC and all that people
used to take it for public health workers and all that. But now
we are even having the consultants attending."
IPC Committee Member
IPC committees are also now being asked to offer technical advice to managers.
"But now we also do have supervision. The committee does
the supervision within the hospital, and then reports whatever
we have agreed and seen to the CEO."
Hospital IPC coordinator
Hence, infection control has become an urgent priority, and the interviews
revealed hospital staff at all levels are now concerned about IPC best practice.
This may be due to the fear of contracting COVID-19 at work, and it was clear
that these concerns are leading to a great deal of anxiety:
"There is a lot of fear initially the time we were starting out.
And after the once who have gone through things change for

176
example initially, they could say they can't see patients
without an N95 mask, but after the training on which masks to
be worn where people become more confident. The element of
fear and anxiety is still there, but the ones who attend the
training it becomes less." IPC Leader
Positive changes
The interest in preparing for COVID-19 has resulted in positive actions in several
areas: In some of the facilities, this has offered an opportunity to increase the
IPC supplies and infrastructure including hand hygiene facilities in the hospital,
albeit some of these are temporary.
"I believe that after this we will go far, we never had sanitisers
before, these days we have sanitiser." Hospital IPC leader.
Where previously budgets for IPC activities were non-existent, in some
hospitals some funds are now available specifically for IPC activities.
"I don't know where the med sup [Medical Director] got some
little money. Almost USD 1500, he was telling us to come up
with a budget. We sat last week. And we have given the
proposal to him." IPC Committee Leader.
Some of the facilities reported an improvement in the cleanliness standards.
This was mainly through reallocation of cleaning staff and increased supervision
in critical areas of the hospitals to ensure these were regularly cleaned, and
waste management was improved.
"And then the cleanliness, we improved on the supervision.
Yeah, we got another public health officer. And we got at least

177
two supervisors for the cleaning company. And then with the
supervision, there is some, there is an improvement." IPC Lead.
Some of the facilities reported significant improvement in WASH infrastructure
including fixing of hand hygiene stations;
"The sinks even if they are not fully functional, maybe we are
over 90% there. Because at least you can repair one and it
gets spoilt. But I'm telling you we are very far. That one we
have done it." IPC Lead.
Ongoing IPC challenges
While the respondents noted areas of improvement, the overall assessment of
our respondents suggested that long-standing issues had not been adequately
resolved. These include challenges with waste management, infrastructure and
funding. Some of the areas where challenges persisted included in
infrastructure where, for example, poor quality fixtures of hand hygiene (taps
and pipes) led to frequent breakages and leaks. Other areas with long-standing
challenges were waste management and funding for IPC activities. All these
play a critical role in service delivery and staff morale.
"The other challenge is that currently, our incinerator is down.
So, we are not able to offer incineration services. Both in
house and even anyone from outside. So, what we are doing
right now we are disposing our waste off sight."
IPC Committee Leader.
"But of course, here, staff morale has gone down because of
the issue of salaries – it's so delayed. Like now, we have not
even got our salaries you can imagine." Hospital Manager.

178
Newer challenges have also emerged. Though some of the IPC supplies are
present, in some facilities, the supply diminishes rapidly due to theft and
misuse.
"Even the soap, you put it outside there, and the following day
even the container is not there. Yes, sometimes we put the
soap there and the relatives of the patients when they come
in, they think that maybe that is the soap they should be using
for washing clothes. They drain it all out in the basins when
they come across it. They are taking it away." IPC lead.
Health worker safety
In addition to these long-standing issues, a host of new issues related to the
pandemic response have been raised, and most prominent among these are
concerns about the safety of health workers. These include challenges in the
acquisition of personal protective equipment (PPE) for both clinical and support
staff.
"Right now, it's not adequate because we are yet to get the
gowns, the masks and the gloves we have. But the gowns
which I think we really need we don't have. But at the
designated areas they have some." IPC Leader.
The lack of PPE is strongly related to levels of anxiety and concerns about the
ability of the workforce to do its job:
"Yes, we are very, very anxious. We are so worried about
ourselves, our safety before even the patients because we
have families definitely. So, there is this sort of some attitude."
Doctor.

179
"Everybody is worried. Everybody, but if they provide people
with enough PPE'S, nobody is there to worry. People are ready
to work." IPC Leader.
Health seeking behaviour in the COVID-19 pandemic
In terms of patients seeking care for other ailments, we noted the numbers
have significantly reduced in the facilities. However, the hospitals that serve
large populations still have to contend with crowding. This is a challenge in
reducing hospital-acquired infections.
"The management had decided to halt outpatient clinics;
unfortunately, we still have a problem with that. like today is
our Gynaecology Outpatient Clinic, so we expected we
wouldn't have any patients, but apparently, we were so
disappointed when we found like about thirty patients and you
know they are all crammed together, there is no even social
distancing or anything" Medical Doctor
We contrast this to other facilities where numbers are worryingly low. The
concern is some of these patients will lack much-needed care. This may, in the
long run, affect the gains made in reducing the infant and maternal mortalities
in the region.
Key insights
Huge opportunity for improvements due to status change and interest.
The considerable importance of WASH and IPC in addressing COVID-19 provides
a real opportunity for improvement of IPC in health facilities. The existing
structure of IPC committees and coordinators, and public health officers, could
offer a real opportunity for highly efficient use of COVID-19 funds. A bottom-up

180
approach would ensure funds are allocated where they are needed. Some
hospitals have embraced this and are making positive changes, even with
limited resources.
"…I was given the responsibility of like a coordinator; I usually
go around on a daily basis. You decide today to go to the
medical department, maybe the following day you can go to
maternity, you can go to paediatrics. You look at the way they
are segregating you find that they are not doing it properly
you just correct them." IPC Lead.
Structural weaknesses, long-standing issues need to be prioritised and
dealt with urgently.
The issues of lack of crucial infrastructure still exist. These include poor waste
disposal, plumbing to guarantee water supply in the wards and proper
ventilation. Improving plumbing and access to appropriate sinks are some of
the interventions that can be effected quickly. Others may include long term
investments like improving ventilation within the hospitals by the installation
of exhaust fans. Other long-term investments would consist of setting
up/building fully-fledged isolation units.
However, these investments need to be prioritised in budget allocations as they
are essential for the appropriate management of COVID-19 and other infectious
conditions which are prevalent in our region. Investing in IPC and WASH would
greatly complement the efforts being put to improve the availability of oxygen
and critical care support in some of the hospitals in our survey and across the
country.

181
Health systems challenges
The greatest risk COVID-19 poses in our context is a health system collapse. In
most facilities, though the patient load has significantly reduced, there is still a
need to ensure the health system does not get overwhelmed by COVID-19.
Health system collapse and closure of services such as maternal and child health
would result in tragic increases in maternal and child mortality (10). There have
been numerous reports of frontline health workers globally contracting COVID-
19 in the line of duty and some due to lack of proper PPE (11, 12). If health
workers do not feel safe while offering services, some may choose to stay away
or take industrial action, including strikes. Strikes have been frequent in Kenya
and the region with devastating effects, and there are ongoing negotiations to
avert a looming health worker strike in the country (13, 14).
Motivating staff and ensuring safe working conditions, including PPE, training
and treatment if they fall ill needs to be a priority at this time. With already low
staff numbers, staff staying off work due to illness or fear of COVID-19 as a
result of weak IPC structures would easily overwhelm service delivery within
hospitals. We can seize this moment to make things better not only during this
pandemic but for years to come.
"but again, COVID- 19 is a blessing in disguise it's not the
right phrase to use but I think this COVID coming, it's a
wakeup call to all these people who were like taking things for
granted. Our health system is in trouble; it has been in trouble
all through, now at least they are seeing." Medical Doctor.
Conclusion
Effective treatment of COVID-19 relies on effective IPC and WASH and funds
must be immediately directed towards this in low- and middle-income
182
countries such as Kenya where performance is often poor. These gains could
have long-lasting positive effects for other huge issues facing hospitals such as
antimicrobial resistance and hospital-acquired infections. We believe that
investing in IPC should be prioritised in advance of setting up critical care units
as part of the COVID-19 response (9). If we wish to mitigate the effects of
COVID-19 on health systems and avert the collapse of an already stretched
health system, IPC and WASH should be recognised as a major policy priority.
Staff safety should be prioritised by availing proper PPE for health workers in
their line of duty and during procedures that are aerosol-generating to ensure
they remain disease-free.
Availability of Data and Materials
All summary data, questionnaires and the Consolidated criteria for reporting
qualitative studies (COREQ) from the surveys are hosted in a public repository
Harvard Data verse. DOI Information: https://doi.org/10.7910/DVN/IJUWWR.
Applications for access of the study transcripts can be made through the Data
Governance Committee with details available on www.kemri-wellcome.org, or
email to [email protected].
Reporting guidelines
The Consolidated criteria for reporting qualitative studies (COREQ) was used for
this report.
Competing interests
There are no conflicts of interest declared by the authors.
Funding
This work was supported by funds from the economic and social research
council ESRCS # ES/P004938/1, and a Senior Research Fellowship awarded to
M.E. by The Wellcome Trust (207522). MM is supported by a grant from by the

183
Initiative to Develop African Research Leaders (IDeAL) through the DELTAS
Africa Initiative [DEL-15-003], an independent funding scheme of the African
Academy of Sciences (AAS)'s Alliance for Accelerating Excellence in Science in
Africa (AESA) and supported by the New Partnership for Africa's Development
Planning and Coordinating Agency (NEPAD Agency) with funding from the
Wellcome Trust [107769] and the U.K. government. The funders had no role in
drafting nor the decision for submitting this manuscript.
Acknowledgements
The authors would like to thank all the hospitals that participated in the initial
surveys and follow up interviews. This work is published with the permission of
the director of KEMRI.

184
References
1. World Health Organization. Water, sanitation, hygiene, and waste management for the
COVID-19 virus: interim guidance, 23 April 2020. World Health Organization; 2020.
2. Nacoti M, Ciocca A, Giupponi A, Brambillasca P, Lussana F, Pisano M, et al. At the
Epicenter of the Covid-19 Pandemic and Humanitarian Crises in Italy: Changing Perspectives on
Preparation and Mitigation. Catalyst non-issue content. 2020;1(2).
3. Ministry of Health. Interim Infection Prevention and Control Recommendations for
Coronavirus Disease 2019 (COVID-19) in Health Care Settings. Nairobi Ministry of Health 2020.
4. World Health Organization, UNICEF. Water and Sanitation for Health Facility
Improvement Tool (WASH FIT): a practical guide for improving quality of care through water,
sanitation and hygiene in health care facilities. Geneva; 2017. Report No.: 9241511699.
5. Maina M, Tosas-Auguet O, McKnight J, Zosi M, Kimemia G, Mwaniki P, et al. Extending
the use of the World Health Organisations' water sanitation and hygiene assessment tool for
surveys in hospitals - from WASH-FIT to WASH-FAST. PLoS One. 2019;14(12):e0226548.
6. Maina M, Tosas-Auguet O, McKnight J, Zosi M, Kimemia G, Mwaniki P, et al. Evaluating
the foundations that help avert antimicrobial resistance: Performance of essential water
sanitation and hygiene functions in hospitals and requirements for action in Kenya. PLoS One.
2019;14(10):e0222922.
7. First Case of coronavirus confirmed in Kenya [press release]. Nairob, 13th March 2020
2020.
8. National Emergency response committee on coronavirus update of coronavirus in the
country and response measures as at 2nd April 2020 [press release]. 2nd April 2020 2020.
9. Zhao Y, McKnight J, English M. Low-income countries’ bids for World Bank funding raise
serious concerns about their coronavirus strategies: The Conversation 2020 [Available from:
https://theconversation.com/low-income-countries-bids-for-world-bank-funding-raise-serious-
concerns-about-their-coronavirus-strategies-138628.
10. Roberton T, Carter ED, Chou VB, Stegmuller AR, Jackson BD, Tam Y, et al. Early estimates
of the indirect effects of the COVID-19 pandemic on maternal and child mortality in low-income
and middle-income countries: a modelling study. The Lancet Global Health.
11. Herron JBT, Hay-David AGC, Gilliam AD, Brennan PA. Personal protective equipment
and Covid 19- a risk to healthcare staff? The British journal of oral & maxillofacial surgery. 2020.

185
12. Centers for Disease Control and Protection. Characteristics of Health Care Personnel
with COVID-19 — United States, February 12–April 9, 2020 2020 [MMWR Morb Mortal Wkly Rep
2020;69:477–481:[
13. Adam MB, Muma S, Modi JA, Steere M, Cook N, Ellis W, et al. Paediatric and obstetric
outcomes at a faith-based hospital during the 100-day public sector physician strike in Kenya.
BMJ Global Health. 2018;3(2):e000665.
14. Magdalne Saya. Crisis looms as health care workers issue 7-day strike notice. The Star
2020 23rd April 2020.

186

187
Addendum 1
COVID-19: an opportunity to improve infection
prevention and control in low-income and
middle-income countries
Michuki Maina, Olga Tosas- Auguet, Mike English, Constance Schultsz
and Jacob McKnight
The Lancet Global Health, Volume 8, Issue 10, e1261
https://doi.org/10.1016/S2214-109X(20)30352-1

188
CORRESPONDENCE
We congratulate Paul Sonenthal and colleagues (1), for the timely assessment
of COVID-19 preparedness in Malawi. The authors highlight clear gaps in
infection prevention and control, including the availability of personal
protective equipment, but cautiously suggest that these findings might not be
generalisable to other low-income and middle-income countries. We did
detailed surveys before the COVID-19 pandemic to evaluate water sanitation
and hygiene, and infection prevention and control preparedness at 14 Kenyan
public hospitals(2). From the surveys, we noted that, even for these large
facilities, there were challenges in providing adequately treated water.
Additionally, there were scarce resources available to install new hand hygiene
and waste disposal structures, especially in locations where they were absent
(2).
We found that the responsibility for water sanitation and hygiene, and infection
prevention and control in hospitals is often poorly defined. Working with
stakeholders, we developed a framework to assign responsibility to specific
groups within the hospital and regional governments on the basis of their
capacity for action. This framework allowed us to identify the specific groups
who were best placed to tackle the problems we had highlighted. One of the
important groups identified was the hospital's infection prevention and control
committee(3). Our pre-pandemic survey suggested that these committees
were inactive and poorly constituted(3). The low status and awareness of
infection prevention and control in the hospitals contributed to these
committees being largely dormant(2). However, from our interviews with
health-care workers done during the COVID-19 pandemic in April 2020, we
found that these infection prevention and control committees are playing a

189
crucial role in training medical staff on personal protective equipment use and
infection prevention and control procedures (4).
These committees can provide strategic leadership on the purchase of good
quality infection prevention and control materials and address any deficiencies
in the hand hygiene and waste management infrastructure. With infection
prevention and control playing a crucial role in the management of COVID-19,
it provides an opportunity for the proper training of all health workers on the
best infection prevention and control practices (4).
The COVID-19 pandemic provides an opportunity to strengthen crucial aspects
of the health-care system that have been previously overlooked (5). These
aspects include the infection prevention and control infrastructure and the
formation of active infection prevention and control committees to provide
much-needed leadership.
These improvements will prove to be valuable not only during the COVID-19
pandemic, but also in the fight against other infectious diseases and
antimicrobial resistance.
We declare no conflict of interest.

190
References
1. Sonenthal PD, Masiye J, Kasomekera N, et al. COVID-19 preparedness in Malawi: a
national facility-based critical care assessment. The Lancet Global Health 2020; 8(7): e890-e2.
2. Maina M, Tosas-Auguet O, McKnight J, et al. Evaluating the foundations that help avert
antimicrobial resistance: Performance of essential water sanitation and hygiene functions in
hospitals and requirements for action in Kenya. PLoS One 2019; 14(10): e0222922.
3. Maina M, Tosas-Auguet O, McKnight J, et al. Extending the use of the World Health
Organisations' water sanitation and hygiene assessment tool for surveys in hospitals - from
WASH-FIT to WASH-FAST. PLoS One 2019; 14(12): e0226548.
4. Maina M, Tosas-Auguet O, English M, Schultsz C, McKnight J. Infection prevention and
control during the COVID-19 pandemic: challenges and opportunities for Kenyan public hospitals.
Wellcome open research 2020; 5: 211.
5. Zhao Y MJ, English M. . Low-income countries’ bids for World Bank funding raise serious
concerns about their coronavirus strategies. 18th May 2020 2020.
https://theconversation.com/low-income-countries-bids-for-world-bank-funding-raise-serious-
concerns-about-their-coronavirus-strategies-138628.

191
Addendum 2
Performance in water sanitation and hygiene
and infection prevention and control in Kenyan
hospitals and relevance for the COVID- 19
pandemic
Policy Brief, KEMRI Wellcome Trust Research Programme
October 2020

192
Key Messages
PERFORMANCE IN WATER SANITATION AND HYGIENE AND INFECTION
PREVENTION AND CONTROL IN KENYAN HOSPITALS AND RELEVANCE
FOR THE COVID-19 PANDEMIC
1. Poor water sanitation and hygiene (WASH) and infection prevention
and control (IPC) in health facilities increase the risk of hospital-
acquired infections including COVID-19 among patients, health care
workers and the community which results in greater use of second-line
antibiotics and drives antimicrobial resistance.
1. There are significant differences in the state of WASH within hospitals
wards and across hospitals. The aggregate hospital scores ranged
between 47% and 71%.
2. With the emergence of the COVID- 19 pandemic in Kenya, the IPC
committees which were previously dormant, have stepped up to offer
leadership and technical support to hospital managers.
3. The overall status of IPC and WASH has markedly increased with
additional activities noted, but serious problems with supplies budgets
and material conditions remain.
4. COVID-19 pandemic offers an opportunity to strengthen WASH and IPC
in our hospitals with long term gains beyond the pandemic.

193
Background
Many countries, including Kenya, have noted challenges with Water Sanitation
and Hygiene. A recent global survey in 120 countries by the WHO and UNICEF
revealed that a quarter
of health facilities
assessed lacked water
from an improved
source on the premises
and almost half lacked hand hygiene facilities at the points where care is
provided. With the emergence of COVID-19, proper IPC and WASH have
become essential strategies to minimise the spread of the disease among
patients and health care workers. Recent research has shown that health
workers are at higher risk of contracting COVID-19 in the line of duty due to
inadequate IPC practices. We must adequately protect health workers to avoid
them being harmed and to enable the continuation of services by ensuring IPC
structures are in place in our hospitals.
In 2018, using a modified version of the WHO Water Sanitation and Hygiene
Facility improvement tool,
we conducted surveys of
WASH infrastructure and
organisation in 116 wards
in 14 public hospitals in
Kenya. The Level 4 and 5 hospitals are located in 11 counties in central, eastern
and western regions on Kenya. These surveys were conducted together with
hospital staff members drawn from the 14 hospitals to ensure the hospitals
were equipped to carry out subsequent surveys independently. In addition to
Water Sanitation and Hygiene (WASH): A series
of interdependent components that include the
provision of safe water, proper access to toilets
and waste disposal and hand hygiene facilities
Infection Prevention and Control (IPC): A
scientific approach aimed at preventing the
spread of infections between patients, health
care workers and the community

194
the surveys, in-depth interviews were conducted with hospital managers and
frontline health workers to understand the context better.
After the surveys, individualised written feedback was provided to all the
hospitals enabling them to prioritise necessary improvements. One month after
the first COVID-19 case, we contacted the survey team members to learn what
improvements had taken place and how these hospitals were preparing to deal
with COVID-19 from a WASH/IPC perspective.
Results
Our initial surveys reported marked differences in the performance of WASH
within and across the hospitals. Based on the 65 indicators assessed, spanning
four domains (water, sanitation, hygiene and organisational management) at
the facility level, overall hospital performance varied from 47% to 71% with five
of the 14 hospitals scoring below 60%. There were also significant differences
in performance between wards in the same hospital. Figure 1 illustrates WASH
performance at ward and overall hospital levels.
To improve accountability, we identified three primary levels of accountability
for WASH and IPC in the hospitals. These are IPC committees, hospital managers
and the county government.

195
Figure 1: Hospital and ward performance across the hospitals during the 2018 survey Scatter plot
of the aggregate ward level scores of 116 wards (black shaded points) across 14 hospitals by
domain. The Blue line for each hospital shows average performance in each area across all the
hospitals – this is typically less than 60%. The degree to which the black dots are spread indicates
how large the difference in performance is between wards in the same hospital – in some
hospitals dots are closer together. Hence, performance is more consistent; in others, they are
spread far apart, showing lots of difference.
Some of the poor performance in the hospitals was attributed to limited
resources and funding for IPC and WASH activities in the hospitals:
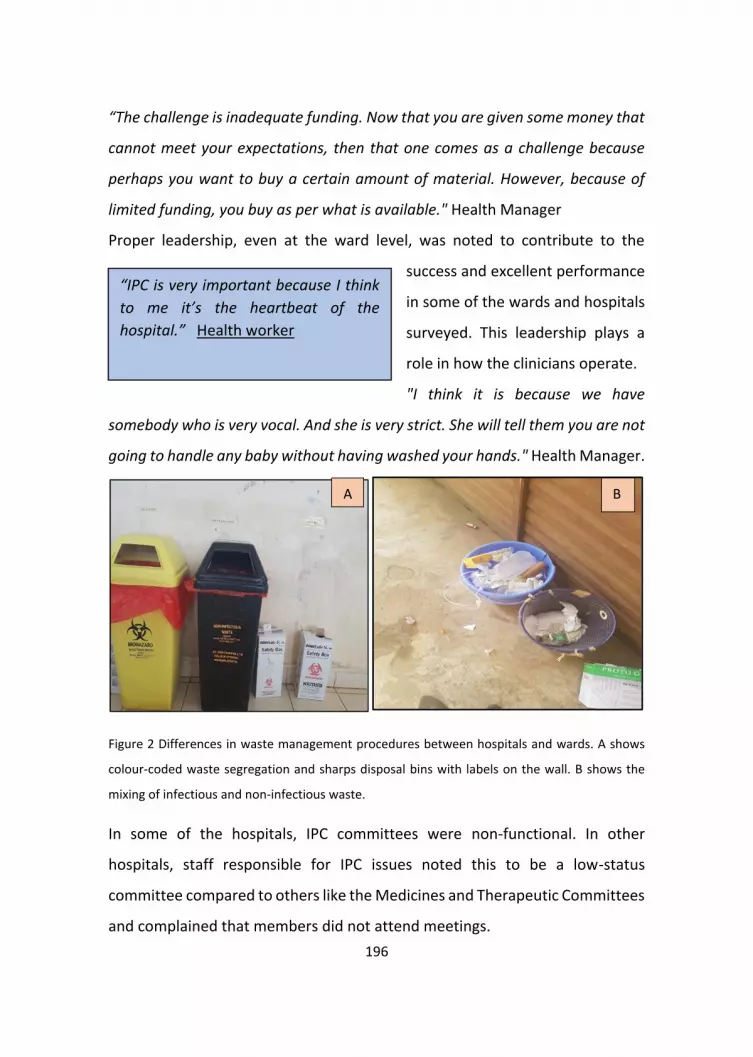
196
“The challenge is inadequate funding. Now that you are given some money that
cannot meet your expectations, then that one comes as a challenge because
perhaps you want to buy a certain amount of material. However, because of
limited funding, you buy as per what is available." Health Manager
Proper leadership, even at the ward level, was noted to contribute to the
success and excellent performance
in some of the wards and hospitals
surveyed. This leadership plays a
role in how the clinicians operate.
"I think it is because we have
somebody who is very vocal. And she is very strict. She will tell them you are not
going to handle any baby without having washed your hands." Health Manager.
Figure 2 Differences in waste management procedures between hospitals and wards. A shows
colour-coded waste segregation and sharps disposal bins with labels on the wall. B shows the
mixing of infectious and non-infectious waste.
In some of the hospitals, IPC committees were non-functional. In other
hospitals, staff responsible for IPC issues noted this to be a low-status
committee compared to others like the Medicines and Therapeutic Committees
and complained that members did not attend meetings.
A B
“IPC is very important because I think
to me it’s the heartbeat of the
hospital.” Health worker

197
There are some committees which are found to be more,
which are more do I say prestigious? They look better. So, if
I am in IPC, people will be thinking okay… so IPC will have
no one. I mean, what is the benefit of being in IPC, what is
there, how am I gaining being in IPC? Consultant
Other reasons that explained the variation noted in the 2018 survey included
differences in the built environment with some hospitals having a mix of old
and newer wards with better infrastructure. Support for WASH by development
partners in some of the hospitals may also have contributed to better
performance in some of the hospitals.
IPC /WASH in the COVID-19 Pandemic Since the emergence of COVD-19, there had been a sharp focus on IPC activities
from the national government with the issuance of new IPC guidelines to handle
COVID-19. Accordingly, the roles played by the IPC committees have changed
and have gained more importance. Hence, infection control has become an
urgent priority, and the interviews revealed hospital staff at all levels are now
concerned about IPC best practice
In some facilities, this has offered an opportunity to increase the IPC supplies
and infrastructure, including hand hygiene facilities in the hospital.
"I believe that after this we will go far, we never had sanitisers before, these
days we have sanitisers" Hospital IPC leader
Reduced supply of some of
the personal protective
equipment has, however,
increased fear and anxiety
Everybody is worried, but if they provide
people with enough PPE'S, nobody is there to
worry. People are ready to work" IPC Leader.

198
among some of the health care workers.
While there were areas of improvement, the overall assessment suggested that
some of the long-standing issues had not been adequately resolved. These
include challenges with waste management, e.g. broken-down incinerators,
hand hygiene with broken down taps, showers and sinks. Funding for IPC
activities in most hospitals is still inadequate.
Yes, the sinks are prone to blockages, so those were some of the issues we have
been making ways, but because we are given limited cash, they go for the
cheapest, and we have constant blockages. IPC Committee Leader.
Figure 3: Broken Hand hygiene station and hand hygiene posters in the 2018 surveys.
Conclusion
There is a need to prioritise WASH and IPC in public hospitals, especially in light
of the COVID-19 pandemic. Investing in WASH and IPC provides long term gains
beyond the pandemic. It contributes to improving quality of care, patient safety
and patient outcomes.

199
Recommendations
1. We propose frequent WASH surveys to assess, measure and monitor
the progress of WASH in hospitals in resource-limited settings,
providing useful data for decision and policy making and tracking
improvements over time.
2. Increased political engagement from national and county
governments, this provides national standards/guidelines and
accountability mechanisms to ensure that facilities are meeting these
national standards.
3. Health facility managers should also underscore the importance of
Infection Prevention and Control committees, and seek to make IPC
and WASH central to hospital and ward planning.
4. There is an urgent need for adequate resource allocation for WASH and
IPC activities within hospitals to address the COVID-19 pandemic,
including capital funds for the required infrastructure and ongoing
support for adequate PPE and sanitisation materials.
About this Research
Related Publications
This brief is adapted from three research papers published under the titles:
1. "Evaluating the foundations that help avert antimicrobial
resistance: Performance of essential water sanitation and hygiene
functions in hospitals and requirements for action in Kenya".
200
(https://journals.plos.org/plosone/article?id=10.1371/journal.pon
e.0222922),
2. "Extending the use of the World Health Organisations' water
sanitation and hygiene assessment tool for surveys in hospitals –
from WASH-FIT to WASH-FAST
(https://journals.plos.org/plosone/article?id=10.1371/journal.pon
e.0226548).
3. Infection prevention and control during the COVID 19 pandemic;
Challenges and opportunities for Kenyan public hospitals. ( In
Publication).

201
Section 2
Antibiotic use and stewardship in Kenyan
Hospitals

202

203
Chapter 5
Evaluating hospital performance in antibiotic
stewardship to guide action at national and
local levels in a lower-middle-income setting
Jacob McKnight, Michuki Maina, Mathias Zosi, Grace Kimemia,
Truphena Onyango, Constance Schultsz, Mike English and Olga Tosas-
Auguet
Global health action. 2019;12(sup1):1761657.
https://doi.org/10.1080/16549716.2020.1761657

204
ABSTRACT
Background
Inappropriate use of antibiotics can lead to the development of resistant
pathogens. Ensuring proper use of these important drugs in all healthcare
facilities is essential. Unfortunately, however, very little is known about how
antibiotics are used in LMIC clinical settings, nor to what degree antibiotic
stewardship programmes are in place and effective.
Objective
We aimed to record all Antibiotic Stewardship policies and structures in place
in 16 Kenyan hospitals. We also wanted to examine the context of antibiotic-
related practices in these hospitals.
Methods
We generated a set of questions intended to assess the knowledge and
application of antibiotic stewardship policies and practices in Kenya. Using a set
of 17 indicators grouped into four categories, we surveyed 16 public hospitals
across the country. Additionally, we conducted 31 semi-structured interviews
with frontline healthcare workers and hospital managers to explore the context
of and reasons for the results.
Results
Only one hospital had a resourced ABS policy in place. In all other hospitals, our
survey teams commonly identified structures, resources and processes that in
some way demonstrated partial or full control of antibiotic usage. This was
verified by the qualitative interviews that identified common underlying issues.

205
Most positively, we find evidence discipline-specific clinical guidelines have
been well accepted and have conditioned and restricted antibiotic use.
Conclusion
Only one hospital had an official ABS programme, but many facilities had
existing structures and resources that could be used to improve antibiotic use.
Thus, ABS Strategies should be built upon existing practices with national ABS
policies taking maximum advantage of existing structures to manage the supply
and prescription of antimicrobials. We conclude that ABS interventions that
build on established responsibilities, methods and practices would be more
efficient than interventions that presume a need to establish new ABS
apparatus.
KEYWORDS
Antibiotic stewardship; rational drug use; AMR; LMIC; resistance; hospitals

206
BACKGROUND
Antimicrobial Resistance (AMR) represents an existential threat to global
health. The reduction of overuse and improper use of antibiotics through
Antibiotic Stewardship (ABS) programmes is a cornerstone of WHO’s Global
Action Plan (GAP) [1]. The GAP recognises that regulation is weak, that usage
data is poor, and that the situation is made more difficult by a lack of evidence-
based diagnosis and the proliferation of sub-standard antibiotics [1, p. 10]. Poor
prescribing practices combine with low levels of infection prevention and
control to encourage a faster spread of resistant pathogens in Low and Middle-
Income Countries (LMICs) [2]. For example, 214,500 neonatal sepsis deaths
worldwide are thought to be attributable to resistant pathogens, 52% of which
are experienced in just five LMIC countries [3].
More positively, a recent review suggested that ABS interventions in LMICs can
have a positive effect [4]. However, in many cases, studies of interventions
were of low quality with a high degree of heterogeneity in results meaning that
it is difficult to draw direct conclusions from the analysed literature. Two
systematic reviews in higher-income settings also suggested that interventions
can have a positive effect on ABS, but again, the heterogeneity of approaches
makes it difficult to draw conclusions on what works best [5,6].
Few surveys have been conducted in LMIC contexts to show the level of
implementation and effectiveness of existing ABS structures, thinking, and
practices [7]. In addition to providing an important ‘baseline’ for future ABS
interventions, implementation science highlights the importance of
understanding context as a dynamic part of interventions [8]. If ABS is to
become what May calls ‘an ongoing achievement’, we need to understand not
only if an intervention can have an effect, but also why and what the contextual

207
mechanisms are that enable it. Here we report work helping us to understand
context and opportunities for intervention in Kenyan hospitals.
METHODS
Study setting
In Kenya, the Ministries responsible for Health and Agriculture appointed a
multi-sectoral Technical Working Group to develop national guidelines for the
prevention and containment of antimicrobial resistance [9]. Kenya has a
devolved system of government, however, and provision of healthcare falls to
the county governments who are responsible for any implementation of the
AMR policies and plans.
The survey and interviews covered 16 public hospitals in Kenya and were
conducted alongside related work investigating Infection Prevention and
Control [10]. The hospitals are part of the Clinical Information Network (CIN) of
the Kenya Ministry of Health. The CIN was set up to collate data from paediatric
inpatient units to promote development and adoption of evidence-based
clinical guidelines [11] and is coordinated by the Kenya Medical Research
Institute (KEMRI) Wellcome Trust Research Programme. Six of the 16 facilities
are located in areas of Kenya with a high malaria prevalence. The bed capacities
across the 15 county facilities range between 120–550 beds with between 6
and 18 separate inpatient wards and between 5–26 consultants in total across
all medical and surgical specialties [12]. The study hospitals are all public
facilities. Although there are many private hospitals in Kenya (282/724, 39%)
and missionary hospitals (93/724, 13%) public hospitals are thought to manage
a majority of the demand (348/724, 48%) [13]. In one of the facilities, which
acts as the national referral hospital, due to its size, we only assessed ABS
arrangements in the paediatric and neonatal units. These wards were chosen

208
because WASH should be a priority where there are particularly vulnerable
patients and because the research team has long-standing professional
relationships with the management of these wards.
Survey preparation
We sought to identify an ABS survey tool that would sufficiently capture
relevant aspects of ABS in the hospital context. We began with a desk review of
available ABS policies in Kenya and internationally drawing particularly on the
‘U.K.’s NICE guidance as it offered practical guidance at the hospital level. NICE’s
‘Antimicrobial stewardship: systems and processes for effective antimicrobial
medicine use’, was particularly useful in deriving a set of survey questions [14].
It promotes the use of prescription guidelines, a point further emphasised by
NICE’s Infection prevention and control quality standards [15].
The NICE ABS guidance provides a ‘Baseline Assessment Tool’, but this is
developed specifically for the UK NHS. We drew upon our experience in Kenya
to adapt the tool to evaluate extant processes and structures, rather than only
ABS/AMR specific ones. Table 1 (supplementary materials) shows the
references for each question asked. For each of the 17 questions, the surveyor
scores a facility as either fully, partially or not meeting recommended targets
as defined in the study’s standard operating procedures. An open text section
also allows the data collector to record the logic behind the scores assigned.
The ABS data collection tool (Supplementary Materials) was piloted in a hospital
similar to the study hospitals and revised before actual data collection.
Survey data collection
Data collection was conducted by 3 study teams each of 4–5 people in three
different regions of the country: central Kenya (4 hospitals), Western Kenya (5
hospitals), and around the capital city (5 hospitals). The 3 study teams’
members received training from the investigators prior to the data collection

209
process. For each hospital, upon receiving permission from the manager, the
teams approached the head pharmacist. Across the 16 facilities, these were
graduate pharmacists, some of whom had specialised post-graduate training in
clinical pharmacy. The pharmacist was taken through the survey providing
responses that were graded by the study data collection team into one of the
three possible levels.
Survey data analysis
Individual indicators were grouped within the five pre-specified ABS modules:
leadership; accountability and expert support; supplies; monitoring and
reporting; and policy and practice. For each of the 17 indicators ‘heat map’
colour codes were generated based on the indicator: does not meet (red);
partially meets (orange); meets (green). In addition, we compute aggregate
indicator scores by assigning numeric scores to each level. Does not meet the
target, partially meets and meets target were assigned numeric scores 0, 1, and
2 respectively. Percentage scores were derived as a proportion of the sum of
the numerators(individual indicator scores for each hospital) and dividing these
by 32 which is the sum of denominators representing the maximum possible
score if all hospitals met target for each of the indicators.
Qualitative approach
Semi-structured interviews were conducted with hospital managers (e.g.
medical directors, nursing and laboratory heads) and frontline health workers
(e.g. consultants, medical and nursing officers) during the survey visits, in 7 of
the 16 hospitals sampled to ensure spread across different geographical
locations represented by the study hospitals. The survey team included a team
member from each hospital visited, and these individuals made the
introductions and explained the research for each interview.
210
Interviews were conducted by the first, second, fourth and fifth authors in the
hospital setting, using a semi-structured interview instrument that consisted of
different, but strongly related questions to that of the survey [10,12]. All
authors have experience with medical research in Kenya, but the first author is
experienced in using qualitative methods and trained the others in the use of
the semi-structured tool and general interviewing techniques following the
‘long’ or ‘ethnographic’ technique [16]. We conducted 31 interviews between
November 2017 and March 2018 each lasting between 30 mins and 90 mins
with no one refusing to be interviewed or dropping out and no repeats. We
used both purposive and snowball sampling and were mindful of emerging
important issues such as training and managerial support, and experience and
aimed to reflect this diversity in our interviewee sampling strategy.
Responsibilities for drug use are rarely defined by formal rules at the hospital
level, but normative expectations around the roles of different staff are shared
across hospitals in Kenya and well understood by the research team. As such,
we targeted nurses and doctors but also spoke to pharmacists and laboratory
technicians.
The semi-structured interview process provided opportunities to investigate
emergent areas of interest, identified through discussions with the research
team and review of transcripts, and this allowed us to move beyond areas
where we had reached saturation and onto new areas. Interviews were
conducted in a quiet place near the place of work with one or two interviewers
and the interviewee. At the end of each interview, the respondent was asked
to raise any issues that they felt were important but not addressed. We did not
return transcripts to the respondents but did check our findings with some
hospital managers and the Ministry of Health and county stakeholders with
whom we are connected.

211
The audio files were transcribed and uploaded into NVivo 12. Our
methodological framing was exploratory and inductive, and though guided by
initial discussions between the team and the stakeholders, adopted a grounded
theory approach. Open codes were individually generated according to best
practice in qualitative research by the 1st, 2nd and 4th authors [17]. Then we
sought to match the findings of the survey with the themes that emerged from
the qualitative analysis. The analysis presented below is organised so as to allow
us to explore inductively derived issues within the broad categories used in the
survey. This approach allows us to add context and detail to each of the survey
questions.
All interview tools and information sheets are available on request. A
Consolidated Criteria for Reporting Qualitative research (COREQ) checklist was
completed and is included as an appendix, following a format provided by Tong
et al. [18].
RESULTS
The survey was carried out at all 16 hospitals. The most senior pharmacist
available during the visit was chosen to respond to the questions. For the
qualitative interviewing, 31 respondents were interviewed using the semi-
structured interview instrument that was adapted infection prevention
guidelines by ward throughout the research to reflect our growing
understanding of the key issues. Overall the indicator scores ranged between
28 and 69%. The indicator assessing the availability of local speciality-specific
antibiotic guidelines had the lowest overall performance. There was no
significant difference in indicator performance between the hospitals in the
high and low malaria-endemic zones.

212
Leadership
Seven indicators assess leadership for ABS. As can be seen in Figure 1, there was
mixed performance across the hospitals and the indicators, with H5 and H12
being low performers and H14 and H15 being highly compliant. Figure 1 also
indicates that it is unusual for a hospital to have an annual planned budget for
ABS.
Accountability and expert support for ABS
Figure 1 shows that while a person might be identified as being responsible for
ABS, this was far from universal. Additionally, while staff were given some time
to contribute to ABS activities, this was often not an official directive, but
instead a general part of individual workers’ roles. This is explored more
thoroughly in the qualitative section below.
Antibiotic Supply in Hospitals – this simple indicator shows that most hospitals,
experienced difficulties in maintaining a full stock of antibiotics. Encouragingly,
in 4 hospitals, antibiotic supply was not thought to be a problem.

213
Figure 1. Performance at hospital and indicator level across 16 hospitals. The tiles in the central grid are coloured according to the performance classification of each indicator in each hospital, as shown in the colour legend.
214
Monitoring and reporting for ABS activities
We aimed to understand if the pharmacists are able to track how specific
antibiotics are being prescribed across hospital departments or disease
conditions and also monitor the quality of prescriptions, e.g. posology,
duration, and route of administration. Only 1 facility achieved the set targets
for the two indicators assessed. The other facilities were deemed to partially
meet the target because the pharmacists regularly attended the ward rounds
within these departments and kept track of what and how antibiotics are being
prescribed using this informal mechanism.
Policy and practice of ABS
We assessed this through a set of five indicators. As can be seen in Figure 1, we
note significant challenges with guideline availability and use as evidenced by a
lack of speciality-specific guidelines.
Qualitative analysis
ABS leadership
Most of the respondents we spoke to had not heard the phrase Antibiotic
Stewardship. Thus, while they might understand the mechanism, they thought
of ABS as a principle rather than a particular programme or area of work:
“So far no, I think mostly, the majority of the people are yet to
be aware about ‘antimicrobial stewardship programme’. The
majority, even if you do the survey currently, they are not even
aware what this term means.” Nurse and IPC focal person
This general lack of awareness meant that there were no specific budgets for
ABS activities, and also that there was no specific training for ABS. However,
several hospitals demonstrated general leadership in the use of all drugs and
who had managed to fund Continuing Medical Education (CME), and other

215
forms of training focused on the use of antimicrobials. Pharmacists, while often
not familiar with the phrase ‘Antibiotic Stewardship’, were familiar with the
idea of ‘rational use’ of drugs in general and had sought to train other staff on
this issue.
“Usually, we have CMEs in Hospital, and it’s [‘rational use of
drugs’] an issue that is usually shared among hospital staffs.”
Pharmacist
While the interviews and survey identified a number of structures and
resources that could be used for further work in ABS, it is important to note
that leadership must attend to all problems, not just ABS. For example, where
clinical pharmacists do exist, they are well positioned to lead training on this
issue have other issues to deal with, such as intern clinical officers unsure of
general drug use:
“correcting outpatients prescriptions, that actually is the
largest challenge … because for the staff that’s there they
have a very high staff turnover, and patient, and especially
they have a new clinical officers who are on training, and they
rotate therefore I think a span of the three months, and they
are fresh, so there is a lot of hiccups on dosing, right
indications. That is our biggest challenge.” Pharmacist
Accountability and expert support for ABS
It is important to recognise potentially untapped resources and existing
organisational structures in place that could improve prescription practices. The
presence of clinical pharmacists was key because they understood the general
principle and could address inappropriate use of antibiotics where they

216
accepted this responsibility. Thus, in the more effective hospitals, we found
evidence of active and capable medicines and therapeutics committees.
“There’s also a committee in the hospital actually they have
formed that that group. And they normally actually with the …
they involve a lot of departments. So, in the lab we have one
person who normally attend those meetings where they’re
taught actually on how the drugs are supposed to be issued.”
Senior Nurse
But sometimes, even when a medicines and therapeutics committee is in place
and has good representation from different areas of the hospital,
underfunding, and organisational difficulties may mean that tight control of ABS
is beyond them.
“We don’t have a very healthy committee, like a stewardship
to follow up to see this patient has been on the antibiotics for
how long? Because sometimes you can have a prescription of
a patient who has been on ceftriaxone for more than ten days
to me, I don’t think it is proper” Pharmacist
It is also important to recognise the broader spectrum of prescribers working in
Kenyan hospitals. Some nurses, clinical pharmacists and most commonly,
clinical officers who influence prescribing or directly prescribe in Kenya appear
to be excluded from decision making and training.
“I think there are there are some meeting for the therapeutic
committee and maybe that is where they discuss these things.
And then, there’s another committee they call doctors
meetings. You know not everybody is a doctor in this hospital,

217
there are clinical officers, and they are prescribers, they have
pharmaceutical technologists who dispense medicine, and
they’re not doctors, so the, we feel that there’re a group that
are left without understanding what is going on in terms of
therapeutic committee reports they don’t get those reports.”
Lab Manager
A further governance issue detracting from standardised usage of antibiotics is
failure to restrict access of pharmaceutical salespeople who were obviously
successful at promoting the use of their drugs within certain hospitals:
“Maybe with the influence of the med rep and then the many
antibiotics they were prescribing. So, as a committee, we
thought maybe you could narrow these antibiotics”
Pharmacist
Qualitative analysis of antibiotic supplies
The interviews confirmed that the supply of antibiotics was sometimes broken
and though there were clear differences across the sites surveyed, most
respondents recognised this as a problem.
“Stockouts are very often. Specific antibiotics, like even now I
will tell you if a patient needs meropenem currently, we don’t
even have a single vile yeah … Sometimes it causes delay of
treatment because now if a patient needs maybe meropenem,
they will assume maybe they’ve given this patient maybe
ceftriaxone for a while and now the consultants or the
clinician are thinking maybe this patient needs to be changed
go get meropenem from the pharmacy. At that point, they will

218
not get, because at that point is when we initiate now to the
process of procuring meropenem. So that might delay
treatment for one, or two days, which is not good, yeah
because of the protocol also in procurement issues, yeah.”
Pharmacist
In one case, a respondent hinted that supply problems were related to deals
being done with improper or ineffective suppliers.
“They decided to award most of the tenders to the local
suppliers. So that had been the challenge because actually the
local suppliers, most of them don’t have the capacity to supply
the items and sometimes the quality of the drugs they are
supplying, we are not able to assure the quality. So,
sometimes it’s politics ehh? So yes, it’s beyond us.” Pharmacist
Such problems can lead to breaks and delays in treatment which may
contribute to the development of AMR.
“If you really need that drug, for example, if it is something
that I want to use like I have decided this patient have
meningitis and I want to use Ceftriaxone, now Ceftriaxone
runs out by day 2, so the patient buys, in a hospital the patient
buys …Yes, are you seeing the problems that we have. So, they
must have someone they are sending to go and bring. That
somebody might take two days to bring that drug or they tell
you they don’t have money because that is the other thing,
they just tell they don’t have money. And you can look at
them, and you can see clearly, they don’t have money.”
Paediatrician

219
A further important finding suggests that clinician prescribing behaviour
changes when faced with supply shortages. This has particular implications for
people who are adjudged to be unable to afford certain drugs
“Yes, that one you will do, that one you will definitely have to
do. I mean like now if you tell someone like I want to treat
someone, let me say someone has upper respiratory tract
infection and I want to give the Amoxil and I really want to, I
really … me I believe in the original, where I want them to get
the original Amoxil from GSK and the person has Ksh 200.
What are you going to do? You just tell them to go and buy
whatever, I mean with the money you have go and buy what
are they called? You know those bad generic and you let them
do that because what are you going to do? They don’t have
money, you cannot buy for them, and you are not giving them
a solution. So, you give them a solution according to what they
have.” Paediatrician
Hence, poorer patients seem to be more likely to be prescribed medicines that
are known to be less effective, to be unable to afford full treatment courses and
also to find drugs of limited or nil pharmaceutical utility.
ABS monitoring and reporting
As stated above, most structures and professionals that deal with ABS do so as
part of other work, and not due to a particular ABS programme in place in the
hospital. In many locations, there was a practice of the pharmacist advising
clinicians on drug use. This may involve occasional visits to the ward to provide
advice or seeking out particular doctors to discuss cases.

220
“Sometimes, we send the patient back, or sometimes we call
the clinician.” Clinical pharmacist
“But once in a while the pharmacist tends to come in the hall,
you know, they come to the ward sometimes and they will just
… ‘why are you giving this one, why are you not giving this?’…
Even simple things like dosages, they will always call you back
from the ward, you come to the pharmacy, you are told what
is supposed to be the right dosage, yeah.” Medical officer
In sum, however, the auditing practices were very weak, there was little use of
actual data and most processes in place were ad hoc, and involved pharmacists
reacting to particular cases rather than being systematic about usage.
Qualitative analysis of ABS policy and practice
We identified positive policies and practices in place that were not specifically
for ABS, but generally supported ABS. Firstly, the staff we spoke to understood
the usefulness of formularies and there seemed to be a history of attempts to
implement them. Secondly, the large-scale adoption and application of the
national paediatric guidelines show that it is possible to change and standardise
the use of antibiotics in this context. Our respondents identified formularies as
addressing the issues we raised concerning ABS:
“So, we, we have a ceiling from where you can choose which
antibiotics to prescribe, so we have a formulary.” Medical
Superintendent
However, in some locations, our respondents were not sure if they were
inactive use and suggested that their introduction had stalled:

221
“So yes, if it is formulary there is one that it is being
developed. Did they finish developing it? I am not sure. But
there is one that I had been called to actually develop. I am
not sure how far it went. ” Paediatrician
“I remember … actually from … a few years back because I’ve
been here for a while like almost five years, we started
developing a hospital formulary for a whole week, customised
hospital formulary.” Pharmacist
Additionally, we found evidence that where a formulary was not applied, there
was space for differential prescriptions, based not on the specific condition, but
rather on the patient’s insurance status:
“P: If you go to our pharmacies, you will realise that we have
separated patients, some NHIF clients and others. Essentially,
we should just have a uniform formulary that is working for all
of them.
I: You mean that if I got you right that if patient is under
insurance and others paying cash, you separate the formulary
they receive … ?
P: They are likely to get different products sometimes.”
Medical superintendent
The situation was similar with guidelines. Our respondents recognised the
importance of guidelines. They pointed to the success of the paediatric
guidelines, but most often suggested that other guidelines were not in use
anywhere else in the hospitals we visited.

222
“Yah that one would vary, I think it varies for example, we
have a paediatric protocol that have guidelines on how to use
antibiotics. Like this one should not be used in combination
with this one, use these number of days. Maybe that, maybe
that is what we have but in other wards no there is no
guideline. Maybe it is present in pharmacy, maybe pharmacy
have a copy of some sort, but I am not aware”. Medical officer
“No, it is not there but in paediatric wards those ones I know
they are there, but in the wards, I know there is none in the
surgery ward. I don’t know if they have the guideline, but they
use their phones to look at what to give for how many days.”
Nurse
In the absence of a formulary or guideline, clinicians had a variety of coping
mechanisms. Commonly, they searched the internet for answers, but it was not
clear precisely what resources they were drawing on when they did this:
“They use the internet and google” Nurse
Similarly, respondents also pointed to the importance of their training.
“Yes, there are guidelines in this hospital, there … I haven’t
seen a guideline but back at the medical school and our
training here, you need to have a justification for giving
antibiotics, you don’t give everybody antibiotic” Medical
officer
And of consultants to whom they are currently or previously ‘apprenticed’:

223
“No [we do not follow guidelines] but we have our consultant.
Our consultants who are really aggressive on when and what
antibiotics to be given. When to change from first-line
antibiotics when … how do you decide to go on to second-line
and when to go to on third-line or when to refer or when to do
culture? Yes, we have our consultants who are very keen, yes.”
Clinical officer
“Okay, for me like I can said, I still use the protocols for my
former, for my former institution” Medical officer
DISCUSSION
Recent work has highlighted the need to understand the state of antibiotic
stewardship in LMICs [2,3,19] and has sought to provide standardised ways of
approaching this important topic [7]. While evidence interventions can be
effective in LMIC contexts exists, we lack clear benchmarks on current practice
more broadly. Unfortunately, but perhaps not surprisingly, for all but one of the
hospitals we visited in Kenya, there was no official recognition of ABS nor a
specific programme in place to deal with this issue. Moreover, even senior
pharmacists were not familiar with the phrase, though they were familiar with
the more general idea of ‘rational use’ of drugs. Hence, given that the ABS
elements of the 2017–2022 Kenyan national AMR policy [9] are yet to be
implemented by county governments in regional hospitals, all survey questions
that sought specific ABS structures and practices were likely to be scored
negatively.
Despite this, our approach allowed us to understand the current ABS ‘lay of the
land’ and identify extant structures and resources that are being used or could
be used, to control the use of antibiotics. Our findings serve to remind those

224
interested in ABS, that antibiotics are well-established, crucial tools in all health
systems, and so even without a specific ABS programme, their supply and use
is already a matter of concern to a variety of health systems structures and
professionals. In essence, antibiotics have social lives [20] and in many ways,
can be seen as infrastructure [21]. Understanding and accepting the existing
culture of antibiotic use for different geographies is key to interventions in this
area [22].
Many of these issues we uncovered are linked not only to the specific supply
and use of antimicrobials but also to a wide range of health system failings. A
lack of effective human resources; a lack of auditable data; problems in
changing clinician behaviours; and shortages of supplies and budgets are all
chronic issues that undermine many aspects of healthcare with ABS being but
one of them. The origins and causes of these core issues are complex and
beyond the remit of any single ABS intervention but important to tackle if ABS
is to be effective.
Our work illuminates how the low ABS performance captured in our survey may
contribute to AMR. Firstly, inadequate supplies can lead to rationing of
medicines and stark choices regarding the patient’s ability to pay [23]. Clinicians
make value judgements based on class and their perception of a patient’s ability
to pay for drugs outside of the hospital. Secondly, where patients are adjudged
to be poor by a clinician, they may prescribe a cheaper, though possibly less
effective drug or a shorter course (A known behaviour for pharmacists [24]).
Thirdly, in sending patients out of the hospital to find medicines in the private
sector, the clinician understands that this may lead to delays in treatment and
doubts as to whether the drugs the patient or their carer procures are in fact
real and effective rather than fakes or cheap copies. Fourthly, we note a

225
converse effect where a clinician may be inclined to prescribe more expensive
medicines where a patient makes it known that they have national or private
insurance.
These issues are sometimes compounded by other long-standing health system
failings. For example, the regular supply of medicines of dubious quality leads
to a lack of trust in antibiotics, while the minimal availability of effective
microbiological diagnostics, even in large hospitals [25,26], means that doctors
cannot be sure what pathogen they are treating. This could result in a situation
where a clinician may decide that the reason a course of antibiotics has failed
to have the desired effect is due to drug quality rather than AMR.
This strong link to the private sector and doubts of the quality of medicines
reminds us that hospitals are not biomedical vacuums where we can assume
the actions of clinicians to be uniform across different geographies, but rather
organisations entwined in local social and cultural milieus [27] and that the use
of antibiotics in this setting is always connected to, rather than isolated from,
the complex, broad social system of antibiotic use and ‘misuse’ [28].
The survey and related interviews also illuminate opportunities for improved
ABS in Kenya’s hospitals. It was apparent that in paediatrics, the widely
disseminated national guidelines [29] were the dominant influence suggesting
discipline-specific guidelines can influence antibiotic use. Additionally, though
formulary processes were moribund in the hospitals we visited, this was a well-
recognised and potentially important way of guiding practice that could be
reinstated.
We also noted for the hospitals in which they were active, medicines and
therapeutics committees were powerful and influenced not only local
226
prescribing patterns but were also involved in procurement and ensuring the
regular supply of drugs to the facility. This is a particularly important point in
LMICs; more people die due to a lack of medication than to resistant pathogens
[3]. While recent work has sought to set targets for reducing the use of
antimicrobials, most LMICs are well below the new targets [2] suggesting we
should help the patients who need antibiotics to access them in addition to
reducing usage in those who do not.
Further, the study suggested that while few in number, clinical pharmacists are
respected for their ability to provide suitable advice to frontline prescribers on
the appropriate use of antibiotics and could play an important role in ABS
programmes [30].
Limitations
Our survey tool was derived from available U.K. documents but was not
formally validated and is not as comprehensive as the checklist recently derived
by Pulcini et al. [7] although the 4 section, 17 item checklist we used
significantly overlaps with these 7 section 29 item lists. Secondly, the selection
of the hospitals was defined by participation in a clinical information network,
and they may not be representative of all Kenyan hospitals. However, we feel
the combination of a survey tool and multiple interviews have enabled us to
provide important insights into the current status of ABS in Kenyan hospitals
that could inform more specific efforts to promote ABS practices that are suited
to this context.
CONCLUSION
Our findings perform three important functions: the survey offers a first
attempt at benchmarking existing ABS practice in Kenyan public hospitals; the

227
qualitative interviews provide detailed insights into the issues that affect
antibiotic prescribing; and our analysis finds that many existing structures could
be reinvigorated to improve ABS in Kenya. While there has rightly been a lot of
attention given to the importance of ABS in reducing AMR, we should recognise
that the use and misuse of antibiotics is determined by long-standing features
of health systems. Recognising these as a prelude to initiating ABS programmes
may be important to their success in limiting AMR in LMIC contexts.
ACKNOWLEDGEMENTS
We want to thank the Kenyan Ministry of Health and the council of governors
who permitted this work to be carried out. We also thank the hospital
management and clinical teams who supported the work in the survey
hospitals. This work is published with the permission of the Director of the
Kenyan Medical Research Institute (KEMRI).
AUTHOR CONTRIBUTIONS
Jacob McKnight PhD: conception; design; acquisition of data (interviewing);
analysis and interpretation; drafting; revisions.
Michuki Maina MD: conception; design; acquisition of data (interviewing,
survey); analysis and interpretation; drafting; revisions.
Mathias Zosi MSc. : acquisition of data (survey); analysis and interpretation.
Grace Kimemia MSc.: acquisition of data (interviewing); analysis and
interpretation; drafting.
Truphena Onyango MSc.: acquisition of data (interviewing).
Paul Mwaniki MSc.: analysis and interpretation; drafting;
Constance Schultsz PhD: conception; design; analysis and interpretation;
drafting; revisions.
228
Mike English PhD: conception; design; analysis and interpretation; drafting;
revisions.
Olga Tosas-Auguet PhD: conception; design; acquisition of data (survey);
analysis and interpretation; drafting; revisions.
All authors are employed as full-time researchers.
DISCLOSURE STATEMENT
We are aware of no conflicts of interest. The authors alone are responsible for
the views expressed in this publication, and they do not necessarily represent
the views, decisions or policies of their institutions.
ETHICS AND CONSENT
Ethics approval for the work was given by the Kenyan Medical Research
Institute’s (KEMRI) Scientific and Ethical Review Unit. Informed written consent
was secured for all interviewees, and considerable care was taken to ensure the
research did not interrupt work. All information received was handled
confidentially and stored on secure servers. All quotes from the study
respondents were anonymised. This study received approval from the Oxford
Tropical research ethics committee (OXTREC) from the University of Oxford
(Ref: 525–17) and from the Kenyan Medical Research Institute (Ref:
KEMRI/SERU/CGMR-C//086/3450).
FUNDING INFORMATION
MM, G.K., J.M., M.Z. and O.T. were supported by funds through a grant from
the Economic and Social Research Council ESRCS # ES/P004938/1 awarded to
ME A Senior Research Fellowship awarded to M.E. by The Wellcome Trust
(#207522) supported P.M. M Maina received additional support from a grant

229
to the Initiative to Develop African Research Leaders (IDeAL) through the
DELTAS Africa Initiative [DEL-15-003], an independent funding scheme of the
African Academy of Sciences (AAS)’s Alliance for Accelerating Excellence in
Science in Africa (AESA) and supported by the New Partnership for Africa’s
Development Planning and Coordinating Agency (NEPAD Agency) with funding
from the Wellcome Trust [107769/ Z/10/Z] and the U.K. government. The
funders had no role in study design, data collection and analysis, decision to
publish, or preparation of the manuscript
230
REFERENCES
[1] WHO. Global action plan on antimicrobial resistance 2015. Geneva: World Health
Organization; 2017.
[2] Laxminarayan R, Sridhar D, Blaser M, et al. Achieving global targets for antimicrobial
resistance. Science. 2016;353(6302):874–875.
[3] Laxminarayan R, Matsoso P, Pant S, et al. Access to effective antimicrobials: a
worldwide challenge. Lancet. 2016;387(10014):168–175.
[4] Van Dijck C, Vlieghe E, Cox JA. Antibiotic stewardship interventions in hospitals in low-
and middle-income countries: a systematic review. Bull World Health Organ. 2018;96(4):266.
[5] Davey P, Brown E, Charani E, et al. Interventions to improve antibiotic prescribing
practices for hospital inpatients. Cochrane Database Syst Rev. 2013;(4).
[6] Schuts EC, Hulscher ME, Mouton JW, et al. Current evidence on hospital antimicrobial
stewardship objectives: a systematic review and meta-analysis. Lancet Infect Dis.
2016;16(7):847–856.
[7] Pulcini C, Binda F, Lamkang AS, et al. Developing core elements and checklist items for
global hospital antimicrobial stewardship programmes: a consensus approach. Clin Microbiol
Infect. 2019;25(1):20–25.
[8] May CR, Johnson M, Finch T. Implementation, context and complexity. Implement Sci.
2016;11 (1):141.
[9] Kenya Go. National Action Plan on prevention and containment of antimicrobial
resistance 2017-2022. Nairobi, Kenya: Government of Kenya; 2017.
[10] Maina M, Tosas-Auguet O, McKnight J, et al. Extending the use of the world health
organisations’ water sanitation and hygiene assessment tool for surveys in hospitals – from
WASH-FIT to WASH-FAST. PLOS One. 2019;14 (12).
[11] English M, Ayieko P, Nyamai R, et al. What do we think we are doing? How might a
clinical information network be promoting implementation of recommended paediatric care
practices in Kenyan hospitals? Health Res Policy Syst. 2017;15(1):4.
[12] Maina M, Tosas-Auguet O, McKnight J, et al. Evaluating the foundations that help avert
antimicrobial resistance: performance of essential water sanitation and hygiene functions in
hospitals and requirements for action in Kenya. PLOS One. 2019; 14(10).
[13] Kenya, MoH. Nairobi, Kenya: Kenyan Ministry of Health; 2020 cited 2020 Mar 20.
Available from: http://kmhfl. health.go.ke/#/home
[14] NICE. Antimicrobial stewardship: systems and processes for effective antimicrobial
medicine use. London: National Institute for Health and Care Excellence; 2015.
[15] NICE. Infection prevention and control. London: National Institute for Health and Care
Excellence; 2014.
[16] McCracken G. The long interview. Sage; 1988.
[17] Gioia DA, Corley KG, Hamilton AL. Seeking qualitative rigor in inductive research: Notes
on the Gioia methodology. Organizational Res Methods. 2013;16 (1):15–31.
231
[18] Tong A, Sainsbury P, Craig J. Consolidated criteria for reporting qualitative research
(COREQ): a 32-item checklist for interviews and focus groups. Int J Qual Health Care.
2007;19(6):349–357.
[19] Cox J, Vlieghe E, Mendelson M, et al. Antibiotic stewardship in low-and middle-income
countries: the same but different? Clin Microbiol Infect. 2017;23 (11):812–818.
[20] Whyte SR, Van der Geest S, Hardon A. Social lives of medicines. Cambridge University
Press; 2002.
[21] Chandler CI. Current accounts of antimicrobial resistance: stabilisation,
individualisation and anti-biotics as infrastructure. Palgrave Commun. 2019;5 (1):53.
[22] Chandler C, Hutchinson E, Hutchison C Addressing antimicrobial resistance through
social theory: An anthropologically oriented report; 2016.
[23] Miljeteig I, Defaye FB, Wakim P, et al. Financial risk protection at the bedside: how
Ethiopian physicians try to minimize out-of-pocket health expenditures. PloS One.
2019;14(2):e0212129.
[24] Barker AK, Brown K, Ahsan M, et al. What drives inappropriate antibiotic dispensing?
A mixed-methods study of pharmacy employee perspectives in Haryana, India. BMJ Open.
2017;7(3): e013190.
[25] Seale AC, Hutchison C, Fernandes S, et al. Supporting surveillance capacity for
antimicrobial resistance: laboratory capacity strengthening for drug-resistant infections in low-
and middle-income countries. Wellcome Open Res. 2017;2:91. PubMed PMID: 29181453.
[26] Wilson ML, Fleming KA, Kuti MA, et al. Access to pathology and laboratory medicine
services: a crucial gap. Lancet. 2018;391(10133):1927–1938.
[27] Van der Geest S, Finkler K. Hospital ethnography: introduction. Soc Sci Med.
2004;59(10):1995–2001.
[28] Pearson M, Doble A, Glogowski R, et al. Antibiotic pre- scribing and resistance: views
from LMIC prescribing and dispensing professionals. Report to World Health Organisation AMR
Secretariat. 2018.
[29] Kenya, MoH. Basic paediatric protocols for ages up to 5 years. In: Health Mo, editor.
4th ed. Nairobi: Kenyan Ministry of Health; 2016. http://guidelines.health.go.ke/#/category/
27/266/meta
[30] Walia K, Ohri V, Mathai D. Antimicrobial stewardship programme (AMSP) practices in
India. Indian J Med Res. 2015;142(2):130.

232

233
Chapter 6
Antibiotic use in Kenyan public hospitals:
Prevalence, appropriateness and link to
guideline availability
Michuki Maina, Paul Mwaniki, Edwin Odira, Nduku Kiko, Jacob
McKnight, Constance Schultsz, Mike English and Olga Tosas- Auguet
International Journal of infectious diseases 2020. 99: p. 10-18.
https://doi.org/10.1016/j.ijid.2020.07.084

234
ABSTRACT
Objective
To examine prescription patterns and explore to what extent guidelines are
available and how they might influence treatment appropriateness among
hospitalised patients in Kenyan hospitals.
Methods
Data on antimicrobial usage were collected from hospitalised patients across
14 Kenyan public hospitals. For each prescription, appropriateness of treatment
was defined using available local and international treatment guidelines and
through consensus with local medical specialists. Association between
appropriate treatment, guideline availability and other possible explanatory
factors was explored using univariate and multiple regression analysis.
Results
There were 1675 (46.7%) of the 3590 hospitalised patients on antimicrobials
with 3145(94%) of the 3363 antimicrobial prescriptions being antibiotics. Two
patients (0.1%), had treatment based on available antibiotic susceptibility tests.
Appropriate treatment was assessed in 1502 patients who had a single
diagnosis. Of these, 805 (53.6%) received appropriate treatment. Physical
availability of treatment guidelines increased the odds of receiving appropriate
treatment Odds Ratio 6.44[95% CI 4.81-8.64].
Conclusion
Appropriate antibiotic prescription remains a challenge in Kenyan public
hospitals. This may be improved by the availability of context-specific, up-to-
date, and readily accessible treatment guidelines across all the departments,
and by providing better diagnostic support.

235
Keywords
Antimicrobial Resistance, Antibiotics, Point Prevalence Survey

236
BACKGROUND
Antimicrobial resistance (AMR) is an emerging global challenge that is thought to
account for more than 700,000 deaths annually [1]. Certain practices that are
common in resource-limited settings can fuel resistance. Inappropriate use of
antibiotics is highly problematic, especially where they are availed over the
counter without prescriptions. Similarly, the availability of falsified or substandard
drugs is a significant issue [1, 2]. In hospital settings, inappropriate use has been
fuelled by lack of surveillance and diagnostic capabilities, poor antibiotic
stewardship activities and lack of treatment guidelines [3-6].
Efforts to improve the appropriateness of antibiotic use rely on the availability of
relevant usage data. Unfortunately, there is a lack of data on antimicrobial use in
African countries compared to other regions [7, 8]. To measure antibiotic use and
quality of prescriptions at hospital and patient level, point prevalence surveys (PPS)
have been extensively used [9, 10]. They are easy to administer and, in addition to
generating data on antibiotic use, can highlight other problematic aspects of
quality of care, including the quality of prescription. They also offer a useful tool
for audit and feedback on antibiotic use in hospitals to improve decision making
and strengthen antibiotic stewardship activities.
The Government of Kenya in 2017 launched the national plan on prevention and
containment of antimicrobial resistance. One of the strategies is to optimise the
use of antimicrobials. This can be achieved through increasing compliance to
reporting of antimicrobial consumption across the country. [11]
Some studies in Kenya indicate a high prevalence of antibiotic use in both inpatient
and outpatient settings of more than 80%. Also highlighted in these studies are
challenges with the quality of prescriptions, including the use of proprietary drug
names and incomplete prescriptions [10, 12]. These studies were, however, from

237
single hospitals. We set out to conduct an antibiotic point prevalence survey across
14 public hospitals in Kenya, examine prescription quality and explore to what
extent guidelines are available and how they might influence treatment
appropriateness.
METHODS
This study took as its starting point the methods developed for the Global Point
Prevalence Survey of Antimicrobial Consumption and Resistance (GLOBAL-PPS),
which has been widely used and for which tools are freely available. [8] [13].
Setting
The point prevalence survey was carried out between February and April 2018
across 14 public hospitals in Kenya with a total bed capacity of 4152 [14]. These
hospitals are distributed across the central, eastern and western parts of the
country in high and low malaria prevalence regions. HIV prevalence ranges
between 2 and 16% across the counties where these hospitals are located. The bed
capacity, number of specialists, catchment population and the HIV prevalence, are
provided as a supplement. (Supplement 1). These hospitals provide multi-
speciality care and were selected purposively as part of a collaboration between
the Ministry of Health and the KEMRI Wellcome Trust Research Programme [15].
During the surveys, the months of March to May 2018, which are the long rains
period in Kenya experienced heavy rainfall and flooding in most parts of the
country [16]. This period sees increased hospitalisations due to malaria and
diarrhoeal diseases in Kenya [17, 18].

238
Data Collection
Ward-level
At ward level, data were collected on the department type, bed and patient
numbers. These data were used to compute bed occupancy. As a modification to
the global PPS, wards were grouped into five departments, namely adult medical,
adult surgical, paediatric medical, paediatric surgical or neonatal. In facilities with
more than one ward in these groupings, all were surveyed, and results pooled at
group level. The data collection tool is provided as a supplement (Supplement 2).
Patient-level
At the patient level, data were collected on the patients’ age, sex, date of
admission and diagnoses. For the diagnosis, a total of 46 possible options were
provided, 45 of these were categorised by the anatomical system involved. The last
category was when the prescription was not supported by documentation of any
diagnosis for which antibiotics are indicated. This category was labelled as
“Conditions for which antibiotics are not indicated”. Data were also collected on
the antimicrobial type, dose and duration of treatment. Microbiology, antibiotic
susceptibility and biomarker (C-reactive protein; procalcitonin) test results used to
inform the diagnosis and treatment, were also documented. Supplement 3
provides the patient-level data collection tool and the list of diagnoses.
Data Collection Process
Data were collected by clinicians trained on the study methodology. There were
three data collection teams, each with 5-6 members under the leadership of a
clinical pharmacist. The survey followed standard operating procedures and data
capture forms currently in use as part of the Global PPS with some context-
appropriate modifications. One modification included data collection on all

239
weekdays mainly due to logistical reasons. Data were not collected on weekends
and holidays. The survey procedures are given in Supplement 4.
Inclusion and Exclusion Criteria
Ward-level
All wards from paediatric (medical and surgical), adult (medical and surgical
including obstetrics and gynaecology) and neonatal were included in the study.
Psychiatric, Ear Nose and Throat (ENT), renal, neurosurgery, eye and intensive care
units, were not present in all hospitals and were excluded. One large hospital
included in the survey only provides maternal and neonatal care. Data from this
facility were included in relevant analyses.
Patient-level
Data were collected from all hospitalised patients on antimicrobial treatment or
prophylaxis, even if the drug was not administered on the day of the survey.
Outpatients and day-case admissions were excluded.
Electronic Data Entry
At each ward, de-identified data were entered from paper medical records into
REDCap using laptop computers. REDCap® (Research Electronic Data Capture) is a
secure, web-based application that supports data capture [19]. In-built range, error
and validity checks were employed at the point of data entry.
Data Analysis
At ward level, proportions were computed to establish bed occupancy and the
percentage of hospitalised patients on antimicrobial treatment. At the patient
level, since each patient was eligible for a maximum of five diagnoses, specific
diagnoses were computed as a proportion of the total number of diagnoses.

240
For analysis of antimicrobial agents, these were grouped into ten main groups
based on their Anatomical Therapeutic Chemical Classification System (ATC) [20].
In addition to the groups based on the ATC, we generated a new group that was a
combination of benzylpenicillin and gentamicin to capture all the prescriptions in
which this combination was used. This combination is the expected national first-
line treatment for many severe paediatric and neonatal infections in Kenya [21,
22].
Antibiotic treatment appropriateness
In this study, treatment appropriateness is defined as any prescription which is in
keeping with (i) treatment guidelines, (ii) consensus of local expert opinion or (iii)
bacterial speciation and antibiotic susceptibility tests.
To determine treatment appropriateness, we first searched for all available
Kenyan (hospital-based or national) guidelines for each of the 45 diagnostic
classifications in the Global-PPS. For the conditions without local guidance, we
searched for guidelines from the World Health Organisation, the Infectious
Diseases Society of America, the National Institute for Health and Care Excellence
and guidelines from international medical associations, e.g. The European Society
of Intensive Care Medicine. We chose the international guidelines through
consensus with local medical specialists since these guidelines are commonly used
in Kenya for teaching. We documented which of these local/international
guidelines were physically available in the relevant wards during the survey.
De-identified individual patient data including diagnoses and antibiotic
prescription, were then shared with a speciality consultant relevant to the ward
they were admitted to (either a surgeon, physician, obstetrician or a paediatrician).
None of the consultants worked in the participant hospitals, and all were blinded

241
as to the hospital source of the data. Based on the reference guidelines these
consultants reviewed the individual prescriptions and classified treatment as
inappropriate if it was not in keeping with the guidelines, or if it involved redundant
antibiotic combinations (where antibiotics have a similar spectrum of cover). The
principal investigator (PI), identified a sample of ten medical records from each of
the departments and independently assessed appropriateness using the same
approach. This independent, duplicate sample was used to check for congruency
with the decisions made by the specialists. In cases where the decision by the PI
and that of the specialists were not in agreement and consensus was not
forthcoming, the opinion of an infectious disease specialist was sought.
To establish the appropriateness by disease condition, a subset of the data was
used. The data were for those patients with only a single diagnosis that warranted
antibiotic treatment. These individuals were used to calculate the proportions of
appropriate treatment by disease condition.
Factors associated with treatment appropriateness
In keeping with our primary interest, we explored whether the physical availability
of treatment guidelines was associated with treatment appropriateness and
included the number of comorbidities, gender, and duration of hospital stay
(period between admission and day of survey) as additional explanatory factors.
Duration of hospital stay and comorbidities were included in following the
hypothesis that patients that spend longer in hospital are more likely to have a
more significant number of prescriptions, and likely to have more complex illness
[23]. The complexity of the illness and the number of prescriptions may influence
the appropriateness of the prescription choice. Duration of hospital stay was
centred and scaled to improve model stability and reduce the problems of model

242
convergence [24]. Frequency tables and graphs were used to present the data.
Statistical analysis was conducted in R [25].
RESULTS
Data are presented for 14 public hospitals in Kenya. Ten of the hospitals had five
departments (adult medical, adult surgical, paediatric medical, paediatric surgical
and neonatal unit). One hospital (H16) is a maternity hospital, therefore had no
paediatric and adult male units. Hospitals H9, H10 and H11 had no paediatric
surgical units. There were no adult surgical patients hospitalised in H10 during the
survey. A total of 3590 patients were hospitalised during the survey, with a median
of 230 patients, interquartile range (IQR)[137] across the hospitals. The bed
capacity varied across the hospitals with a median of 297 beds IQR[137]. The
median occupancy was 87% IQR[39]. Table 1 provides more description.

243
Adult Medical Adult Surgical Neonatal
Paediatric Medical Paediatric Surgical Total
Hospital Beds
Occupancy (%)
Patient No
No on Antimicrobial
s (%)
Beds Occupancy
(%)
Patient No
No on Antimicrobials
(%)
Beds Occupancy
(%)
Patient No
No on Antimicrobials
(%)
Beds Occupancy
(%)
Patient No
No on Antimicrobials
(%)
Beds Occupancy
(%)
Patient No
No on Antimicrobial
s (%)
Beds Occupancy
(%)
Patient No
No on Antimicrobials
(%)
H1 96 (53.1)
51 36 (70.6) 69 (108.7)
75 53 (70.7) 8 (212.5)
17 16 (94.1) 16 (131.2)
21 18 (85.7) 15 (73.3)
11 11 (100.0)
204 (85.8)
175 134 (76.6)
H2 233 (69.5)
162 48 (29.6) 147 (81.6)
120 24 (20.0) 109 (38.5)
42 17 (40.5) 70 (52.9)
37 17 (45.9) 24 (62.5)
15 3 (20.0) 583 (64.5)
376 109 (29.0)
H3 118 (50.0)
59 25 (42.4) 102 (89.2)
91 73 (80.2) 14 (207.1)
29 17 (58.6) 48 (37.5)
18 15 (83.3) 18 (61.1)
11 2 (18.2) 300 (69.3)
208 132 (63.5)
H4 72 (70.8)
51 15 (29.4) 120 (57.5)
69 21 (30.4) 58 (43.1)
25 1 (4.0) 27 (63.0)
17 12 (70.6) 24 (20.8)
5 3 (60.0) 301 (55.5)
167 52 (31.1)
H5 89 (101.1)
90 33 (36.7) 93 (78.5)
73 28 (38.4) 76 (67.1)
51 14 (27.5) 23 (121.7)
28 22 (78.6) 13 (115.4)
15 6 (40.0) 294 (87.4)
257 103 (40.1)
H6 184 (129.9)
239 52 (21.8) 95 (102.1)
97 34 (35.1) 45 (106.7)
48 15 (31.2) 50 (132.0)
66 53 (80.3) 39 (38.5)
15 3 (20.0) 413 (112.6)
465 157 (33.8)
H7 69 (88.4)
61 41 (67.2) 34 (111.8)
38 34 (89.5) 7 (228.6)
16 16 (100.0) 29 (72.4)
21 19 (90.5) 6 (100.0)
6 3 (50.0) 145 (97.9)
142 113 (79.6)
H8 99 (105.1)
104 47 (45.2) 39 (133.3)
52 39 (75.0) 31 (145.2)
45 20 (44.4) 33 (63.6)
21 18 (85.7) 26 (34.6)
9 8 (88.9) 228 (101.3)
231 132 (57.1)
H9 181 (67.4)
122 41 (33.6) 143 (86.7)
124 66 (53.2) 78 (62.8)
49 18 (36.7) 56 (58.9)
33 32 (97.0) NA NA NA 458 (71.6)
328 157 (47.9)
H10 81 (135.8)
110 47 (42.7) NA NA
NA 35 (105.7)
37 21 (56.8) 38 (176.3)
67 56 (83.6) NA NA
NA 154 (139.0)
214 124 (57.9)
H11 157 (110.2)
173 73 (42.2) 24 (129.2)
31 31 (100.0) 31 (125.8)
39 24 (61.5) 43 (120.9)
52 33 (63.5) NA NA NA 255 (115.7)
295 161 (54.6)
H13 108 (142.6)
154 51 (33.1) 97 (106.2)
103 35 (34.0) 106 (72.6)
77 11 (14.3) 28 (153.6)
43 30 (69.8) 20 (105.0)
21 4 (19.0) 359 (110.9)
398 131 (32.9)
H14 54 (53.7)
29 24 (82.8) 55 (98.2)
54 49 (90.7) 14 (57.1)
8 7 (87.5) 16 (37.5)
6 6 (100.0) 16 (50.0)
8 5 (62.5) 155 (67.7)
105 91 (86.7)
H16 171 (63.2)
108 5 (4.6) 62 (93.5)
58 41 (70.7) 84 (75.0)
63 33 (52.4) NA NA NA NA NA
NA 317 (72.2)
229 79 (34.5)
Total 1712 (88.4)
1513 538 (35.6)
1080 (91.2)
985 528 (53.3)
696 (78.4)
546 230 (42.1) 477 (90.1)
425 331 (77.9)
201 (57.7)
116 48 (41.4) 4166 (86.2)
3590 1675 (46.7)
Table 1: Hospital bed occupancy and antimicrobial prescription proportions
* NA- Indicates this department was absent

244
Overall Antimicrobial Usage
There were 1675 (47%) of the 3590 hospitalised patients on treatment with at least
one antimicrobial agent. Of all the hospital departments, the adult medical
departments had the highest number of hospitalised patients (1513). Of these, 538
(35.6%) were on at least one antimicrobial. In the adult surgical, neonatal,
paediatric medical and paediatric surgical wards there were 990, 546, 425 and 116
patients respectively with 528 (53.3%), 230 (42.1%), 331 (77.9%) and 48 (41.4%)
patients on antibiotics respectively.
Antimicrobial and Antibiotic Use
There were 3363 antimicrobial prescriptions (median 2 per patient). Of these, 3145
(94%) were antibiotic prescriptions, with 95 anti-parasitic agents (3%), 80
antivirals (2%) and 43 antifungal agents (1%) accounting for the remainder. This
report, therefore, focusses on antibiotic prescriptions as they were the most
common.
The 3145 antibiotic prescriptions were made for 1675 patients. These included a
total of 1078, 816, 305, 450 and 92 antibiotic prescriptions in the adult surgical,
adult medical, neonatal, paediatric medical and paediatric surgical units
respectively. Of these total prescriptions, 404 (13%) were a combination of
benzylpenicillin and gentamicin. Cephalosporins were the most common
prescriptions accounting for 772 (26%) of the remaining 2741 prescriptions. They
were followed by nitroimidazole derivatives, mainly metronidazole, with 585 (20%)
prescriptions. Combinations of benzylpenicillin and gentamicin were predominant
in the neonatal unit with 178 (58%) of the 305 prescriptions. The 3rd generation
cephalosporins in the adult medical units represented 263/816 (32%) of
prescriptions. Two (0.1%) of the 1675 patients in the study (one adult medical and

245
one paediatric medical) had treatment based on antibiotic susceptibility tests.
Figure 1 illustrates the proportion of prescriptions by department and hospital.
Figure 1. Bar charts denoting the proportions of drug prescriptions by drug ATC class across 14
hospitals by departments and overall.
Diagnoses warranting treatment
There were 2059 diagnoses (adult medical = 716, adult surgical = 599, paediatric
medical = 449, paediatric surgical = 54 and neonatal 241) recorded from the 1675
hospitalised patients. For adults in the medical units, the most frequent diagnostic
category was “conditions for which antibiotics are not indicated” accounting for
160/716 (21%) of the diagnoses in that department. In paediatrics, the most
common diagnosis was pneumonia or lower respiratory tract infections (148/449
[33%]). To give a clear picture of the disease patterns in these hospital
departments, Figure 2 presents the top ten diagnoses for each department
documented for the 1675 patients and therefore includes some parasitic (malaria)

246
and viral infections like HIV. All other diagnoses in a department are collapsed into
the category “other conditions needing antimicrobial treatment”. Where relevant
the viral and parasitic infections were excluded from the analysis on antibiotic use.

247
Figure 2. Bar Plot illustrating the top ten diagnoses and their proportions (%) for each department. n = total number of diagnoses in each department.
Central Nervous System, URTI; Upper Respiratory tract infection, OBGYN; Obstetrics and Gynaecology

248
Guideline availability and treatment appropriateness
We identified four major local guidelines. A guide on management of common
illnesses in level 4-6 hospitals[26], national guidelines for the treatment of
sexually transmitted illnesses [27], the basic paediatric protocol [22], and a local
hospital guideline for use in the national referral hospital [28]. Others were
from the British Thoracic Society(1 condition), Infectious Diseases Society of
America (10 conditions), the Surviving Sepsis Campaign(2 conditions) and the
National Institute for Health and Care Excellence (2 conditions). Full list is
provided in Supplement 5.
There were 1502( 90%) of the 1675 hospitalised patients,(Adult medical = 421;
adult surgical = 543; paediatric medical = 261; paediatric surgical = 53 and
neonatal = 224 patients), where we could ascertain a final diagnosis. This
allowed for assessment of the per-patient appropriateness of treatment by
condition. Overall, 805(53.6%) of the 1502 patients had appropriate treatment.
The highest percentage of appropriate treatment was in the neonatal
department at 80% [179/224]). Of the 224 patients in the adult medical unit
whose treatment was inappropriate, 140 (63%) prescriptions were for
conditions not requiring antibiotic treatment. This is shown in figure 3

249
Figure 3. Bar chart showing the proportion (%) of patients receiving appropriate treatment by
department based on 1502 patients with a single diagnosis.
Treatment appropriateness by disease conditions
We further explored the disease conditions that were treated appropriately by
the departments from these 1502 patients where a single final diagnosis was
assigned. In the adult medical department, 24 (26%) of the 94 patients with
pneumonia had inappropriate treatment. In the adult surgical unit, skin and soft
tissue infections formed a large proportion of patients, 93/135 (68%) received
inappropriate treatment. This is shown in Figure 4. Patients with a final
diagnosis of conditions where antibiotic treatment was not indicated are
presented as a proportion of the total number of patients.

250
Figure 4. Proportion of treatment inappropriateness by disease conditions. The number on brackets () is the total number of patients with the disease. Those on treatment for Conditions not requiring antibiotics are presented as a proportion of the total number of patients in the department. PUO- Pyrexia of unknown origin, UTI Urinary tract infection

251
Physical Availability of Guidelines
We assessed which treatment guidelines were physically available during the
survey (Supplement 6). The only physically available guideline was the basic
paediatric protocols. These guidelines cover ten conditions, five in each of the
paediatrics and neonates. The five conditions for which guidelines were
available in the neonatal and paediatric units accounted for 94% (210/224) and
56%(147/261) of the patients with a final diagnosis, respectively.
Factors associated with treatment appropriateness
We assessed the main factors that may be associated with treatment
appropriateness in both univariate models and a multiple regression model.
These were duration of hospital stay since admission, gender, physical
availability of guidelines and number of diagnoses.
We ran these models considering two possible outcomes, I. Overall treatment
appropriateness for all patients on antibiotics and II; appropriateness only for
patients with conditions requiring antibiotics.
Both outcomes resulted in the same general pattern of results. With overall
treatment appropriateness for all patients on antibiotics as the outcome, there
was evidence of a negative association of appropriateness of treatment with
increasing the duration of hospital stay. Quadratic terms for the duration of stay
were not statistically significant; hence a linear relationship was assumed.
Physical availability of treatment guidelines increased the odds of receiving
appropriate treatment. There was an increase in the odds of appropriate
treatment with an increase in the number of diagnoses for the population of
patients receiving antibiotics (Table 2).

252
Table 2: Univariate and multivariable models for factors influencing appropriate treatment for patients with conditions requiring antibiotic treatment and for all patients on antibiotics
Univariate Regression Multiple regression
Variable level
Appropriate treatment for
patients with conditions
requiring antibiotics
Appropriate treatment for all
patients receiving antibiotics
Appropriate treatment for
patients with conditions
requiring antibiotics
Appropriate treatment for all
patients receiving antibiotics
OR 95% CI p value OR 95% CI p value OR 95% CI p value OR 95% CI p value
Duration of hospital
Stay 0.63 0.55 0.71 <0.001 0.71 0.63 0.79 <0.001 0.65 0.57 0.74 <0.001 0.71 0.63 0.81 <0.001
Guidelines available
in Hospital Yes 3.73 2.79 4.99 <0.001 6.34 4.78 8.41 <0.001 3.65 2.7 4.95 <0.001 6.44 4.81 8.64 <0.001
Number of
Diagnoses
1 Ref Ref
2 1.12 0.8 1.57 0.671
1.33 0.99 1.8 0.013
1.08 0.76 1.55 0.334
1.28 0.92 1.79 0.005
>2 1.21 0.68 2.15 1.98 1.12 3.51 1.58 0.84 2.99 2.58 1.37 4.87
Gender Male 0.98 0.77 1.24 0.859 1.09 0.88 1.34 0.429 0.84 0.65 1.09 0.198 0.84 0.67 1.07 0.154

253
DISCUSSION
From this report about half the hospitalised patients were on antimicrobial
treatments, mainly antibiotics. The proportions of patients on antibiotics varied
across hospital departments with almost three-quarters of the admitted
paediatric medical patients on treatment. This prevalence of antibiotic use is
consistent with other studies in Africa, with some studies reporting proportions
higher than 70% among hospitalised patients. [12, 29]. Cephalosporins and
penicillins accounted for a substantial proportion of these prescriptions. A
significant increase in the use of penicillins and cephalosporins, particularly
ceftriaxone over the last decade was identified globally [30]. This has been
attributed to factors including economic growth, increased expenditure on
health and increased access to medicines [30]. The use of cephalosporins has
also been increased by its convenient frequency of administration which may
be advantageous on understaffed units and may have lower drug costs
(purchase, preparation and administration) compared to other antibiotics that
require multiple daily doses[31].
From this survey, less than 1% of the antibiotic prescriptions were supported
by laboratory data. Lack of laboratory support influences prescription patterns
and choice [32]. This results in most of the treatment being broad-spectrum,
also encouraging polypharmacy, and may fuel drug resistance [33]. Some
challenges identified in laboratories have been, the high cost of investigations,
long turnaround time and inaccurate results [34]. Improving laboratory capacity
to conduct tests like cultures and antibiotic susceptibility testing would
translate to increase costs of care for the patient. The use of regional referral
laboratories supported by governments to carry out such tests may mean lower
costs for patients due to economies of scale [35]. These extra laboratory costs

254
need to be viewed in light of the unnecessary costs incurred due to
unwarranted treatment and hospital stay in cases where treatment is not
supported by laboratory data.
Our data suggest an association between the physical availability of treatment
guidelines and appropriate treatment. It is striking that across 14 hospitals,
guidelines were only physically available on paediatric and neonatal units.
Better access to approved guidelines for common illnesses is imperative. We
note that the availability and use of the paediatric guidelines have been
supported by other interventions which include nationwide dissemination of
the guidelines by the Ministry of Health and the training of clinicians in hospitals
and universities on the use of these guidelines through the emergency triage
assessment and treatment programme [36, 37]. Adherence to locally relevant
treatment guidelines may improve patient outcomes reducing mortality, the
length of hospital stay and readmissions [38]. Although we assessed for
physical availability of guidelines, we acknowledge that some of the
international guidelines are also available electronically. Availing local
guidelines electronically may increase usage due to the extensive internet
coverage in Kenya.
In addition to the hospital level factors like laboratory and guideline availability,
clinician level factors may also affect antibiotic prescription. Level of training
and clinical experience is crucial in decision making and guideline adherence
[39]. Most of the hospitals in our study were internship training centres. Hence,
prescriptions were done by different cadres of clinicians with varying levels of
training. Though data on prescribers were not collected in this study, work in
similar settings indicates that more than 85% of prescriptions in the paediatric
units are done by junior clinicians mainly in the pre-registration period of

255
training [39]. Therefore, in addition to providing guidelines, improving
supervision of the junior clinicians is crucial[40]. Other interventions that could
enhance proper antibiotic use include functional antibiotic stewardship
committees that can audit antibiotic use and provide feedback to the clinicians
[41].
Our data collection included Mondays in deviation to the Global-PPS
recommendation, especially on surgical prophylaxis data [13]. This was because
patients in our hospitals were admitted for elective surgeries throughout the
week. Additional analysis showed no differences in the prescriptions patterns
and appropriateness by day of the week. Using the PPS approach has some
limitations. It does not capture seasonal variations in disease patterns,
treatment outcomes and does not establish which antibiotics were available in
the hospitals, which may influence the prescriptions. Additionally, other
investigations including, radiology and haematology, which may have informed
the antibiotic prescriptions are not considered in this PPS approach.
We acknowledge the clinical specialties used to assess appropriateness did not
include clinical microbiologists and pharmacists. While including them would
have been ideal, we consulted an infectious disease specialist to assist where
the decisions on appropriateness were not clear. Additionally, the guidelines
we included provided different treatment approaches for similar illnesses
hence accommodating the differences in antibiotic selection between the
prescribers.
Our assessment of appropriateness did not consider the doses and duration of
treatment. However, we note that in more than 96% of the prescriptions, the
dose and duration were documented. Finally, this study was performed in

256
public hospitals, although these are the majority, it does not inform about
appropriateness of prescription and usage in private hospitals in Kenya.
CONCLUSION
We report that 46.7% of all inpatients were on antimicrobial treatment, mainly
antibiotics. In <0.1% of patients, the antibiotic prescription was supported by
laboratory tests. Many patients did not have a recorded diagnosis that
warranted an antibiotic prescription, and there is a strong indication that
physical availability of guidelines may influence treatment appropriateness
positively. This situation may be improved by availing treatment guidelines
across all the departments and providing better diagnostic support and training
for clinicians.
Authors’ contributions
The roles of the contributors were as follows: M.M, J.M, O.T, C.S and M.E
conceived the study. M.M E.O and N.K reviewed the prescription data. M.M and
P.M conducted data analysis. M.M, J.M, O.T, C.S and M.E drafted and critically
revised the manuscript for intellectual content. All authors read and approved
the final manuscript.
Acknowledgements
The authors would like to thank all the hospitals that participated in the survey.
We also thank all the clinicians involved in data collection. This work is
published with the permission of the director of KEMRI.
Funding
This work was supported by funds from the economic and social research
council ESRCS # ES/P004938/1, and a Senior Research Fellowship awarded to
257
ME by The Wellcome Trust (#207522). MM is supported by a grant from by the
Initiative to Develop African Research Leaders (IDeAL) through the DELTAS
Africa Initiative [DEL-15-003], an independent funding scheme of the African
Academy of Sciences (AAS) ’s Alliance for Accelerating Excellence in Science in
Africa (AESA) and supported by the New Partnership for Africa’s Development
Planning and Coordinating Agency (NEPAD Agency) with funding from the
Wellcome Trust [107769/Z/10/Z] and the UK government. The funders had no
role in drafting nor the decision for submitting this manuscript.
Competing interests
There are no conflicts of interest declared by the authors.
Ethical approval
This study received approval from the Oxford Tropical research ethics
committee (OXTREC) from the University of Oxford (Ref: 525–17) and the
Kenyan Medical Research Institute (Ref: KEMRI/SERU/CGMR-C//086/3450).
Availability of data and materials
Data used for this manuscript are available in Harvard Dataverse at
https://dataverse.harvard.edu/dataset.xhtml?persistentId=doi:10.7910/DVN/
L7S8TK. Applications for access can be made through the Data Governance
Committee with details available on www.kemri-wellcome.org, or on email to

258
REFERENCES
1. O’neill, J., Antimicrobial resistance: tackling a crisis for the health and wealth of
nations. Review on antimicrobial resistance, 2014. 1(1): p. 1-16.
2. Ayukekbong, J.A., M. Ntemgwa, and A.N. Atabe, The threat of antimicrobial
resistance in developing countries: causes and control strategies. Antimicrob Resist
Infect Control, 2017. 6: p. 47.
3. Petti, C.A., et al., Laboratory Medicine in Africa: A Barrier to Effective Health Care.
Clinical Infectious Diseases, 2006. 42(3): p. 377-382.
4. Elbireer, A.M., et al., The Good, the Bad, and the Unknown: Quality of Clinical
Laboratories in Kampala, Uganda. PLOS ONE, 2013. 8(5): p. e64661.
5. Doron, S. and L.E. Davidson, Antimicrobial stewardship. Mayo Clin Proc, 2011.
86(11): p. 1113-23.
6. Paterson, D.L., The Role of Antimicrobial Management Programs in Optimizing
Antibiotic Prescribing within Hospitals. Clinical Infectious Diseases, 2006.
42(Supplement_2): p. S90-S95.
7. Ahoyo, T.A., et al., Prevalence of nosocomial infections and anti-infective therapy
in Benin: results of the first nationwide survey in 2012. Antimicrob Resist Infect
Control, 2014. 3: p. 17.
8. Versporten, A., et al., Antimicrobial consumption and resistance in adult hospital
inpatients in 53 countries: results of an internet-based global point prevalence
survey. The Lancet Global Health, 2018. 6(6): p. e619-e629.
9. Gharbi, M., et al., Using a simple point-prevalence survey to define appropriate
antibiotic prescribing in hospitalised children across the UK. BMJ Open, 2016. 6(11):
p. e012675.
10. Okoth, C., et al., Point prevalence survey of antibiotic use and resistance at a
referral hospital in Kenya: findings and implications. Hosp Pract (1995), 2018.
46(3): p. 128-136.
11. Republic of Kenya, National Policy for the Prevention and Containment of
Antimicrobial Resistance. 2017: Nairobi, Kenya.
12. Mulwa, N.C., et al., Patterns of Prescribing Practices in Makueni County Referral
Hospital, Kenya. African Journal of Pharmacology and Therapeutics, 2015. 4(4).
13. GLOBAL-PPS. Global Point Prevalence Survey of Antimicrobial Consumption and
Resistance 2015 [cited 2017 16th February]; Available from: http://www.global-
pps.com/.
14. Maina, M., et al., Evaluating the foundations that help avert antimicrobial
resistance: Performance of essential water sanitation and hygiene functions in
hospitals and requirements for action in Kenya. PLoS One, 2019. 14(10): p.
e0222922.

259
15. English, M., et al., What do we think we are doing? How might a clinical information
network be promoting implementation of recommended paediatric care practices
in Kenyan hospitals? Health Research Policy and Systems, 2017. 15(1): p. 4.
16. Ministry of Environment and Forestry, Review of rainfall during the March to May
2018 “Long rains”season and the outlook for the June-July-August (jja) 2018, State
Department of Environment, Editor. 2018, Kenya Meteriological Department,:
Nairobi.
17. Apat, D.O., et al., Temporal variation in confirmed diagnosis of fever-related
malarial cases among children under-5 years by community health workers and in
health facilities between years 2013 and 2015 in Siaya County, Kenya. Malaria
Journal, 2017. 16(1): p. 454.
18. Tornheim, J.A., et al., The epidemiology of hospitalization with diarrhea in rural
Kenya: the utility of existing health facility data in developing countries.
International Journal of Infectious Diseases, 2010. 14(6): p. e499-e505.
19. Harris, P.A., et al., Research electronic data capture (REDCap)--a metadata-driven
methodology and workflow process for providing translational research
informatics support. J Biomed Inform, 2009. 42(2): p. 377-81.
20. World Health Organization, Guidelines for ATC classification and DDD assigment.
2015.
21. World Health Organization, Pocket Book of Hospital Care for Children: Guidelines
for the Management of Common Childhood Illnesses. 2013, World Health
Organization Geneva.
22. Ministry of Health. Basic Paediatric Protocols for ages up to 5 years. . 2016 [cited
2019 12th July ]; Available from:
http://guidelines.health.go.ke/#/category/27/266/meta.
23. Nobili, A., et al., Polypharmacy, length of hospital stay, and in-hospital mortality
among elderly patients in internal medicine wards. The REPOSI study. European
Journal of Clinical Pharmacology, 2011. 67(5): p. 507-519.
24. Pinheiro, J.C., D.M. Bates, and M.J. Lindstrom, Model building for nonlinear mixed
effects models. 1995: University of Wisconsin, Department of Biostatistics
Madison, WI.
25. R Core Team, R: A language and environment for statistical computing. R
Foundation for Statistical Computing, Vienna, Austria. 2013.
26. Ministry of Medical Services and Ministry of Public Health and Sanitation, Clinical
Management and Referral Guidelines – Volume III: Clinical Guidelines for
Management and Referral of Common Conditions at Levels 4–6: Hospitals. 2009,
Ministry of Medical Services and Ministry of Public Health and Sanitation,: Nairobi.
27. Ministry of Health, Kenya National Guidelines for Prevention, Management and
Control of Sexually Transmitted Infections. 2018, National AIDS and STI Control
Programme: Nairobi.

260
28. Kenyatta National Hospital and University of Nairobi, The KNH guide to empiric
antimicrobial therapy 2018: Nairobi.
29. Chukwuani, C.M., M. Onifade, and K. Sumonu, Survey of drug use practices and
antibiotic prescribing pattern at a general hospital in Nigeria. Pharmacy world &
science : PWS, 2002. 24(5): p. 188-195.
30. Van Boeckel, T.P., et al., Global antibiotic consumption 2000 to 2010: an analysis
of national pharmaceutical sales data. The Lancet Infectious Diseases, 2014. 14(8):
p. 742-750.
31. Davis, R. and H.M. Bryson, Ceftriaxone. PharmacoEconomics, 1994. 6(3): p. 249-
269.
32. Chem, E.D., D.N. Anong, and J.K.T. Akoachere, Prescribing patterns and associated
factors of antibiotic prescription in primary health care facilities of Kumbo East and
Kumbo West Health Districts, North West Cameroon. PLoS One, 2018. 13(3): p.
e0193353.
33. Chokshi, A., et al., Global Contributors to Antibiotic Resistance. J Glob Infect Dis,
2019. 11(1): p. 36-42.
34. Alemnji, G.A., et al., Strengthening national health laboratories in sub-Saharan
Africa: a decade of remarkable progress. Trop Med Int Health, 2014. 19(4): p. 450-
8.
35. Ministry of Health, Kenya Health Sector Referral Strategy (2014–2018), Division of
Emergency Disaster Risk Management, Editor. 2014.
36. Irimu, G., et al., Developing and introducing evidence based clinical practice
guidelines for serious illness in Kenya. Arch Dis Child, 2008. 93(9): p. 799-804.
37. English, M., et al., Developing guidelines in low-income and middleincome
countries: Lessons from Kenya. Archives of Disease in Childhood, 2017. 102: p.
archdischild-2017.
38. Wathne, J.S., et al., The association between adherence to national antibiotic
guidelines and mortality, readmission and length of stay in hospital inpatients:
results from a Norwegian multicentre, observational cohort study. Antimicrobial
Resistance & Infection Control, 2019. 8(1): p. 63.
39. Ogero, M., et al., Examining which clinicians provide admission hospital care in a
high mortality setting and their adherence to guidelines: an observational study in
13 hospitals. Archives of Disease in Childhood, 2020: p. archdischild-2019-317256.
40. Papoutsi, C., et al., Social and professional influences on antimicrobial prescribing
for doctors-in-training: a realist review. Journal of Antimicrobial Chemotherapy,
2017. 72(9): p. 2418-2430.
41. Wei, X., et al., Effect of a training and educational intervention for physicians and
caregivers on antibiotic prescribing for upper respiratory tract infections in children
at primary care facilities in rural China: a cluster-randomised controlled trial. The
Lancet Global Health, 2017. 5(12): p. e1258-e1267.

261
Supplement 1: Hospital capacity and population demographics
a Kenyan Ministry of Health. "Kenya HIV estimates report 2018." (2018). b 2019 Kenya Population and Housing Census: Distribution of
Population by Administrative units http://www.knbs.or.ke
Facility Hospital Bed
capacity
Number of
specialist doctors
(consultants)
Number of
wards in the
facility
County HIV
Prevalence a
Catchment
population b
Wards Excluded by Specialty
High Malaria Prevalence Zone
H1 204 5 7 7.7% 142,408 Renal Unit
H3 550 12 14 4.5 188,212 Psychiatry, Renal Unit, ENT
H7 180 7 6 16.3% 220,997 None
H8 250 14 8 4.3% 147,992 Renal Unit
H14 165 5 5 5.4 95,292 None
Low Malaria prevalence Zone
H2 594 26 16 2.8 127,100 ENT, ICU, Psychiatry, Renal
H4 216 8 7 3.7 99,065 None
H5 231 7 9 3.1 122,740 Psychiatry
H6 383 17 10 4% 145,903 Neurosurgery
H9 550 19 18 3.8 170,606 ENT, Renal, Psychiatry, ICU
H10 131 24 6 6.1 988,808 None
H11 320 21 9 6.1 197,489 None
H13 378 20 15 3.7 140,338 ENT, Renal, Psychiatry, ICU, Eye
H16 350 14 6 6.1% 268,276 None

262
Supplement 2: Ward Level Data Collection Tool
Please fill in one form for each ward and department type identified within the ward
Unique ID ____________________________________
Date of survey (dd/mm/year) ___________/________/________________
Auditor code (Person completing
form) ____________________________________
Hospital name ____________________________________
Ward name □ Adult Medical (1-6) □ Orthopaedics (1-6) □ Gynaecology (1-6) □ Other:_____________________
□ Adult Surgical (1-6) □ Paediatrics (1-6) □ Maternity (1-6)
□ Surgical (1-6)
□ Neonatal (1-6) □ Post-Natal (1-6)
Does the ward have patients from
mixed departments?
□ Yes □ No
Choose department type: □ Adult Medical □ Paediatric Medical □ Neonatal
□ Adult Surgical □ Paediatric Surgical
Choose patient population for this
department type □ Male □ Female □ Paediatric / Neonatal
Total number of admitted patients present on this ward, for the selected department type, and who were admitted before 8 am: _
Total number of beds on this ward for the selected department type, which were present at 8 am on the day of the survey: _

263
NOTES
• Fill in one form for each ward and department type identified within the ward.
• Date of Survey refers to the date for the current data abstraction – click today on the calendar.
• 'Unique ID' is automatically generated by the REDCap when you click this field. This is a unique code used to identify each ward form record.
• If the name of the ward is other than those listed, choose 'other' and enter ward name and number (i.e. either 1, 2, 3 …6) to identify this ward
uniquely
• Include only inpatients "admitted before 08:00 o'clock" on the day of the survey
• For numerical fields, type -1 if the value is unknown
• Orthopaedic and neurosurgery patients correspond to the surgical department type
• DO NOT conduct a survey of the following wards: Amenity, Psychiatry, ENT, Renal, ICU, NICU (including in Kenyatta hospital), Neurosurgery and
Eye
• In the case of paediatrics and neonatal, beds may correspond to cots or incubators. Cots and incubators must be included in the total 'bed
count' where applicable.

264
Supplement 3: Patient-level data collection tool and diagnosis list
Please fill in one form per patient on antibiotic or other eligible antimicrobial treatment/prophylaxis—explanatory Notes I explains how to fill this form.
Unique Patient
IP Hospital
Name Ward Name Activity
Today's Date
Admission Date
Date of Surgery I
Date of Surgery II
Re-admission
ID 1 Number
2 Name/Code Name/Code
(Department Type) 3
--/--/----4
--/--/----5 --/--/---- 6 --/--/---- 7 Y □ / N □ / Empty □ 8
Is Patient’s age documented? 9
Patient Age 10 : ≥ 2 years □ / 1-23 months □/ <1 month □
Weight 11 Gender
12 Diagnosis (Explanatory
Note II) 13
Y □ / N □ Years
(if ≥ 2 years): ____________
Months (1-23 months): _____________
Days (if <1 month):
_____________
(in Kg; 1 decimal)
□ M □ F
□ Diagnosis 1
□ Diagnosis
4
□ Diagnosis 2
□ Diagnosis
5
□ Diagnosis 3
Treatment based on biomarker data? 14
Y □ / N □ If yes, which biomarker? 15 CRP □ / PCT □ / Other □ Number of antimicrobials
given 18
Type of biological fluid sample? 16
Blood □ / Urine □ / Other □
Most recent value of biomarker (mg/l)? 17
____________________ (from 0 to 5)

265
Antibiotic or other antimicrobial name: 19 _____________________________
Start Date: 20
__/__/____ Type of indication (Explanatory
note IV) 25 _____________________________
Single Unit Dose: 21
__________ Reason in notes 26 Y □ / N □
Unit: 22 g □ / mg □ / mega unit □ / tablet □/ IU □/ empty □
Guideline compliance 27 Y □ / N □ / NA □ / NI □
Doses per day: 23
OD □ / BD □ / TID □ / OID □/ empty □/ Other □:__________
Stop/Review date documented: 28
Y □ / N □
Route: 24 P □ / O □ / R □ / I □/ empty □/ Other □:__________
Duration: 29 _____________________________
Treatment (E: Empirical / T: Targeted) 30
E □ / T □
The next section is to be filled in only if the treatment of choice is based on microbiology data (i.e. treatment = targeted):
MRSA 31 Y □ / N □
MRConS 32 Y □ / N □
VRE 33 Y □ / N □
ESBL-producing enterobacteriaceae 34 Y □ / N □
Third generation cephalosporin resistant enterobacteriaceae / non-ESBL or ESBL status unknown 35
Y □ / N □
Carbapenem-resistant enterobacteriaceae 36 Y □ / N □
ESBL-producing non-fermenter Gram negative bacilli 37 Y □ / N □
Carbapenem-resistant non-fermenter Gram negative bacilli 38 Y □ / N □
Targeted treatment against other MDR organism 39 Y □ / N □

266
Explanatory Notes I – Patient Form Adapted from the Global Point Prevalence Survey (2017 GLOBAL-PPS):
http://www.global-pps.com/documents
1 Unique ID: This is a 'survey number', a unique non-identifiable number given
by the electronic system for each patient entered in the database. Note down
this number with the corresponding 'Patient IP Number' every time you enter
patient information in the database. This will allow you to retrieve the record
for this patient again; in the event, you need to amend information or record
additional information. You can only search patients in the database, using the
survey number. The unique ID is a seven-digit auto-generated and incremental
number. For example; Kiambu, the first record would read 5100001.
2 Patient IP Number: A unique inpatient identifier that allows linkage to
patient records at the local level for a more detailed audit. This unique identifier
will eventually be removed from the database after the data has been cleaned,
and before the analysis starts. Check all the medical record notes, including file
covers, for the IP number. 3 Activity: This is the department type. E.g. M=medicine, S=surgery (including
orthopaedics, and any other surgical patients in obstetrics or other), etc.
4 Today's Date: date when records are abstracted. Click on 'today' icon to
generate the date for today.
5 Admission Date: Please indicate the date of admission as indicated on the
ward clinical admission notes- it is the date when the patient is first seen by a
clinician. If not available check in other sections of the file (e.g. cardex) or ask
the ward staff.
6 Date of Surgery I: This question is only applicable for patients in a surgical
department. If a surgical department was indicated under activity, this section
will appear in the electronic system. Please indicate the date when the patient
first underwent surgery during the current admission, as indicated on any of
the clinical surgical notes. If not available check in other sections of the file (e.g.
cardex, theatre notes). If date of surgery is definitely missing, enter 01/01/1913
7 Date of Surgery II: As above, if a surgical department was indicated under
activity, this section will appear. Please indicate the date when the patient
underwent subsequent surgery during the current admission, as indicated on
any of the clinical surgical notes. If not available check in other sections of the
file (e.g. cardex, theatre notes). If the patient underwent subsequent surgery
but the date is definitely missing, enter 01/01/1913. If the patient did not
undergo subsequent surgery, enter 01/01/1914. This means 'not applicable'

267
8 Re-admission: Refers to re-admission to this hospital within the 6 months
preceding today's date. Please indicate yes if the patient has been admitted in
this hospital within the previous 6 months. You can check for this information
in the discharge summary for the previous admission. If not documented, enter
Empty.
9 Is patient's age documented? Enter yes or no. If yes, a drop box prompting
to specify the age group will appear in the system.
10 Patient's Age: Choose whether patient is <1 month; 1-23 months old or ≥ 2
years old. If the patient is 2 years old or older, the system will ask you to enter
age in years; if between 1 and 23 months you will be asked to enter the number
of months (e.g. 1 to 23), if less than 1 month you will be ask to enter the number
of days. To report age in years, round to the lowest number (e.g. 2 years and
one month = 2 years; 2 years and 11 months = 2 years). If the information is not
available, enter -1.
11 Weight: This refers to admission weight. Round off weight to the nearest one
decimal place e.g. 6.750 kg = 6.8 kg. Check from the admission notes. If missing,
check on the treatment sheet or nursing cardex. If two readings for the
admission day are different, enter the one on the treatment sheet. If the weight
is not documented, please indicate -1.
12 Gender: Please check from the admission notes. If not documented check
from the records registration form. Alternatively, you can ask a member of staff
to check on the gender of the patient, as he/she will be physically in the ward.
13 Diagnosis/ses: These are what clinicians aim to treat. See diagnoses groups
list in Explanatory Notes II. You may enter up to five diagnoses by order of
priority (i.e. diagnosis 1 would correspond to the main or most severe
condition). You must then select the diagnosis group (as shown in Explanatory
Notes II), that best describes the diagnosis recorded in the patient's clinical
notes.
14 Treatment based on biomarker data: Tick yes if CRP (C-reactive protein), PCT
(Procalcitonin) or culture results are available in clinical notes for this patient.
Click no if none of these laboratory tests were conducted for this patient.
15 If yes, which biomarker: If treatment based on biomarker, specify which one:
CRP (C-reactive protein), PCT (Procalcitonin) or Other (=lab-based culture and
sensitivity result from a relevant biological sample). You may choose more than
one option.

268
16 Type of biological fluid sample: Indicate which type of sample was used to
measure the biomarker (either blood, urine or other [e.g. cerebrospinal fluid,
pus, etc.]). You may choose more than one option.
17 Most recent value of biomarker (mg/l): If CRP (C-reactive protein) or PCT
(Procalcitonin) results are available, write the value of the latest test result in
mg/l.
18 Number of antimicrobials given: Enter the total number of antimicrobials
given to the patient, counting only those antimicrobial treatments that meet
the eligibility criteria described in the outline protocol. If no antimicrobials were
given to the patient, enter zero.
19 Antibiotic or other antimicrobial name: Select the generic antibiotic or
antimicrobial name from the dropdown list. Please note the dropdown list does
not display brand names. You must find out the generic name in case a brand
name is noted in the clinical files instead.
20 Start date: Indicate the date when the treatment started. If this is not
available, enter 01/01/1913
21 Single Unit Dose: Numeric value for dose per administration (in grams,
milligrams, megaunits, tablets or IU). Please see Explanatory Notes III for
reporting specific drug combinations. If dose is missing enter -1.
22 Unit: The unit for the dose (g, mg, mg, tablet or IU) as documented in the
treatment sheet. Indicate empty if not documented.
23 Doses per day: This is the number of times given per day as per the
dropdown list provided in the data capture system, and as documented by
clinicians in the treatment charts or clinical notes (e.g. OD/once a day/24hrly or
BD/twice a day/12hrly or TID/TDS/three times a day/8hrly or
QID/4quarterly/6hrly or STAT [i.e. once only]).If the doses are not as described
above choose 'other' from the dropdown list, and enter the dose as free text. If
necessary provide fractions of doses: (e.g., every 16h = 1.5 doses per day, every
36h = 0.67 doses per day, every 48h = 0.5 doses per day). If doses are not
documented at all choose empty.
24 Route: Indicate the route of administration as documented by the clinician.
Routes of administration are: Parenteral (P [e.g. iv, im]), Oral (O), Rectal (R),
Inhalation (I). Indicate empty if not documented. If route of administration is
none of the above choose 'other' from the dropdown list and enter route as
free text.
25 Type of Indication: Based on diagnosis and/or clinical signs and symptoms
documented in clinical notes, choose the indicator that best describes the

269
indication for the current antimicrobial treatment., See Indication codes in
Explanatory Notes IV.
26 Reason in Notes: Indicate whether the diagnosis / indication for treatment
is recorded in the patient's documentation (treatment chart, notes, etc.) at the
start of antibiotic or other antimicrobial treatment (Yes or No)
27 Guideline Compliance: Refers to whether the antibiotic or antimicrobial
choice (not route, dose, duration etc) follows local guidelines (Y: Yes; N: No; NA:
Not assessable because no local guidelines for the specific indication; NI: no
information because indication is unknown)
28 Stop/Review date documented: Choose 'Yes' if a stop review date is
documented or if the duration of the treatment is indicated in the treatment
sheet or the clinical notes. If the duration of treatment is indicated, this will be
indicated as number of days or weeks or in the following form: X/7, X/52, etc.
Choose 'No' if neither a stop/review date nor duration of treatment are
documented.
29 Duration: Corresponds to the number of days for which the treatment has
been prescribed, as shown by the number of days ticked on the treatment sheet
(i.e. intended duration), even if not all prescribed doses have been given or if
doses have been missed. If duration is not documented enter -1.
30 Treatment Type: Indicate whether the treatment of choice is supported by
microbiology data (i.e. culture results and drug susceptibility test [DST] results
available). If culture results and DST are available, indicate that the treatment
is Targeted (T), if not indicate the treatment is Empirical (E). If Targeted, a list of
organisms will appear, and you will need to indicate which of the organisms
were identified, by ticking 'Yes' or 'No' for each organism listed:
31 Methicillin-resistant Staphylococcus aureus (MRSA)
32 Methicillin-resistant coagulase negative staphylococci (MRCoNS)
33 Vancomycin-resistant enterococci (VRE)
34 Bacteria, producing extended-spectrum beta-lactamases (ESBL)
35 Third generation cephalosporin resistant enterobacteriaceae / non-ESBL or ESBL status unknown
36 Carbapenem-resistant Enterobacteriaceae (CRE) – enteric bacteria resistant to imipenem, meropenem or other carbapenems
37 Nonfermenters: Pseudomonas aeruginosa, Acinetobacter baumannii, Burkholderia spp., Stenotrophomonas maltophilia
38 Carbapenem-resistant Nonfermenters (CR-NF) – nonfermenters resistant to imipenem, meropenem or other carbapenems
39 Multi-drug resistant (MDR) pathogens, others than the listed above.

270
Explanatory Notes II – Diagnostic Codes
Adapted from the Global Point Prevalence Survey (2017 GLOBAL-PPS):
http://www.global-pps.com/documents
Diagnostic Codes (What the Clinician Aims at Treating)
Site Codes Examples
CNS Proph CNS Prophylaxis for CNS (neurosurgery, meningococcal)
CNS Infections of the Central Nervous System
EYE Proph EYE Prophylaxis for Eye operations
EYE Therapy for Eye infections e.g., Endophthalmitis
ENT Proph ENT Prophylaxis for Ear, Nose, Throat (Surgical or Medical
prophylaxis=SP/MP)
ENT Therapy for Ear, Nose, Throat infections including mouth,
sinuses, larynx
RESP Proph RESP Pulmonary surgery, prophylaxis for Respiratory pathogens e.g.
for aspergillosis
LUNG Lung abscess including aspergilloma
URTI Upper Respiratory Tract viral Infections including influenza but
not ENT
Bron Acute Bronchitis or exacerbations of chronic bronchitis
Pneu Pneumonia or LRTI (lower respiratory tract infections)
TB Pulmonary TB (Tuberculosis)
CVS Proph CVS Cardiac or Vascular Surgery, endocarditis prophylaxis
CVS CardioVascular System infections: endocarditis, endovascular
prosthesis or device e.g.
pacemaker, vascular graft
GI Proph GI Surgery of the Gastro-Intestinal tract, liver or biliary tree, GI
prophylaxis in neutropaenic
patients or hepatic failure
GI GI infections (salmonellosis, Campylobacter, parasitic,
C.difficile, etc.)
IA Intra-Abdominal sepsis including hepatobiliary, intra-
abdominal abscess etc.
SSTBJ Proph BJ Prophylaxis for SST, for plastic or orthopaedic surgery (Bone or
Joint)
SST Skin and Soft Tissue: Cellulitis, wound including surgical site
infection, deep soft tissue
not involving bone e.g., infected pressure or diabetic ulcer,
abscess

271
BJ Bone/Joint Infections: Septic arthritis (including prosthetic
joint), osteomyelitis
UTI Proph UTI Prophylaxis for urological surgery (SP) or recurrent Urinary
Tract Infection (MP)
Cys Lower UTI
Pye Upper UTI including catheter related urinary tract infection,
pyelonephritis
GUOB Proph OBGY Prophylaxis for OBstetric or GYnaecological surgery
OBGY Obstetric/Gynaecological infections, Sexual Transmitted
Diseases (STD) in women
GUM Genito-Urinary Males + Prostatitis, epididymo-orchitis, STD in
men
No
defined
site (NDS)
BAC Bacteraemia with no clear anatomic site and no shock
SEPSIS Sepsis, sepsis syndrome or septic shock with no clear anatomic
site
Malaria
HIV Human immunodeficiency virus
PUO Pyrexia of Unknown Origin - Fever syndrome with no identified
source or site of infection
PUO-HO Fever syndrome in the non-neutropaenic Haematology–
Oncolgy patient with no
identified source of pathogen
FN Fever in the Neutropenic patient
LYMPH Infection of the lymphatics as the primary source of infection
e.g. suppurative lymphadenitis
conditions
antibiotics
not required
Antibiotic prescribed with documentation for which there is no
above diagnosis group
MP-GEN Drug is used as Medical Prophylaxis in general, without
targeting a specific site, e.g.
antifungal prophylaxis during immunosuppression
PROK Antimicrobial (e.g. erythromycin) prescribed for Prokinetic use
Neonatal MP-MAT Drug is used as Medical Prophylaxis for MATERNAL risk factors
e.g. maternal prolonged rupture of membranes
NEO-MP Drug is used as Medical Prophylaxis for NEONATE risk factors
e.g. VLBW (Very Low
Birth Weight) and IUGR (Intrauterine Growth Restriction)

272
Explanatory Notes III – Patient Form
Adapted from the Global Point Prevalence Survey (2017 GLOBAL-PPS): http://www.global-pps.com/documents
1) Combinations of an antibiotic and an enzyme inhibitor
a) Ampicillin and enzyme inhibitor: report only ampicillin dose
(J01CR01) b) Amoxicillin and enzyme inhibitor: report only amoxicillin dose
(J01CR02) c) Ticarcillin and enzyme inhibitor: report only ticarcillin dose
(J01CR03) d) Piperacillin and enzyme inhibitor: report only piperacillin dose
(J01CR05) e) Imipenem and enzyme inhibitor: report only imipenem dose
(J01DH51) f) Panipenem and betamipron: report only panipenem (J01DH55)
Example:
• Augmentin® 1.2g IV: 1g (amoxicillin) + 200mg (clavulanic acid), report only 1 g
• Piperacillin® 4.5g IV: 4g (piperacillin) + 500mg (tazobactam), report only 4 g
2) Other combinations of multiple antimicrobial substances:
a) J01EE01 Sulfamethoxazole and Trimethoprim: report the total
amount of sulfamethoxazole and trimethoprim Example:
• Co-trimoxazole 960mg: (sulfamethoxazole. 800mg + trimethoprim 160mg), report 960mg
Further information on agents included for the Global-PPS is available in the antimicrobial list. Only antimicrobial substance name need to be written down, NOT the ATC codes (excel file - available at website under documents: Global-PPS_antimicrobial_list.xlsx) http://www.global-pps.com/

273
Explanatory Notes IV – Patient Form Adapted from the Global Point Prevalence Survey (2017 GLOBAL-PPS): http://www.global-
pps.com/documents
(Type of Indications: Select one for each antibiotic or other antimicrobial)
CAI: Community
acquired infection
CAI Symptoms start <48 hours from admission
to hospital (or present on admission).
HAI: Healthcare
associated infection
- Symptoms start ≥ 48 hours after admission
to hospital.
HAI1 Post-operative surgical site infection (within
30 days of surgery OR; 1 year after implant
surgery)
HAI2 Intervention related infections including CR-
BSI, VAP and C- UTI
HAI3 C. difficile associated diarrhoea (CDAD) (>48
h post- admission or <30 days after
discharge from previous admission
episode).
HAI4 Other hospital acquired infection (includes
HAP, etc)
HAI5 Infection present on admission from
another hospital (patient with infection
from another hospital)
HAI6 Infection present on admission from long-
term care facility (LTCF) or Nursing Home*.
SP: Surgical
prophylaxis
SP1 Single dose
SP2 One day
SP3 >1 day
MP: Medical
prophylaxis
MP For example, long term use to prevent UTI's
or use of antifungals in patients undergoing

274
chemotherapy or penicillin in asplenic
patients, etc.
OTH: Other OTH For example, erythromycin as a motility
agent (motilin agonist).
UNK: Unknown UNK Completely unknown indication
CR-BSI = Catheter Related-Blood Stream Infection; C-UTI = Catheter related-Urinary
Tract Infection; HAP = Hospital Acquired Pneumonia; VAP = Ventilator Associated
Pneumonia.
* Long-term care facilities represent a heterogeneous group of healthcare facilities,
with care ranging from social to medical care. These are places of collective living where
care and accommodation is provided as a package by a public-agency, non-profit or
private company (e.g. nursing homes, residential homes).
Supplement 4
Antibiotic consumption survey standard operating procedures and data
collection tools The Antimicrobial Consumption Survey – Study Details
Antimicrobial Consumption Survey
We will conduct a survey of antibiotic prescribing in relation to clinical diagnosis
in all hospitalized adults, children and neonates across 14 Kenyan hospitals.
The survey will collate data on drug, dose and indicators of antibiotic (and other
antimicrobial) prescribing across inpatients in the participant facilities, with the
aim of identifying targets to improving quality of prescribing.
Relevant data is generally held in clinical patient notes and treatment sheets;
the survey team will therefore work with medical record administrators and
clinical staff at each ward to collate relevant information.
The survey will involve reviewing all prescriptions of antibiotics and other
antimicrobials among hospitalized individuals, by inspecting treatment sheets,
and establishing the diagnosis and relevant investigations that would support
the prescription, by inspecting all other relevant clinical patient notes.

275
Participant hospitals are committed to facilitate the task of the survey team by
providing:
Access to - and support from - relevant ward staff,
Access to relevant patient notes,
Access to a room with tables, chairs and electricity.
The ACS will follow standard operating procedures and data capture forms
currently in use as part of the 'Global Point Prevalence Survey on Antimicrobial
Consumption and Resistance (Global PPS)' and will consequently collate data on
additional antimicrobials relevant to Global-PPS activities (i.e. antifungals,
antivirals, antimalarials). Data capture forms and details of how the survey will
be conducted are given in the following sections. The Global Point Prevalence
Survey (PPS) – Year 2017 protocol can be found at http://www.global-
pps.com/documents/
1. Outline Protocol
Key aspects of the protocol are described below:
1) Preparation of a hospital ward list;
2) What guidelines are being used to guide prescription of antibiotics and
other antimicrobials based on diagnosis or clinical condition. This
information may be available at the facility-level or at the ward-level.
3) Inclusion of all eligible hospital wards in the survey (except for the case
of Kenyatta National Hospital, where only neonatal wards will be
included in the hospital);
4) Survey of each ward only once on a single day. Different wards may be
surveyed on different dates;
5) Inclusion criteria:
a. All inpatients admitted on the ward before 8 o'clock in the
morning on the day of the survey, including all neonate healthy
infants in the case of maternity wards (denominator data);
b. All inpatients "on antibiotics or other eligible antimicrobials",
and who were admitted before 8 o'clock in the morning on the
day of the survey (numerator data). Patients "on antibiotics"
are those undergoing antibiotic treatment even if the drug is
not administered the day of the survey. The definition also
includes patients who received one or more doses of

276
antibiotics or other eligible anti-infective agents intended as
surgical prophylaxis in the 24 h prior to 8:00 am on the day of
the survey.
6) Exclusion criteria:
a. All day admissions and outpatients (denominator and
numerator). This includes all healthy mothers and babies in a
maternity ward, who will be discharged within 24 hours of
admission, following successful delivery. These patients should
be regarded as day patients even if present in the ward at the
time of the survey;
b. Patients discharged before or admitted after 8 o'clock in the
morning on the day of the survey (denominator and
numerator);
c. Inpatients on antibiotics or other eligible antimicrobials, where
treatment was no longer active/ongoing at 8 o'clock in the
morning on the day of the survey (numerator).
d. Amenity, Psychiatry, ENT, Renal, ICU, NICU (including in
Kenyatta hospital), Neurosurgery and Eye wards are excluded
from the survey, as these units are not present in all hospitals.
7) Denominator data:
a. Total number of admitted eligible patients (i.e. admitted before
8 am) in the ward surveyed;
b. Total number of available beds attributed to inpatients at 8 am
of the ward surveyed (i.e. number of total inpatient beds
[occupied plus empty] at the time of the survey).
8) Antibiotics and other eligible antimicrobial agents: Classification of
antibiotics and other antimicrobials will agree with the ATC/DDD Index
2017 of the WHO Collaborating Centre for Drug Statistics Methodology;
a. Inclusion criteria - Anti-infective agents within the following
ATC codes:
i. J01: Antibiotics for systemic use
ii. A07AA: Antibiotics used as intestinal anti-infectives
iii. P01AB: Antiprotozoals used as antibacterial agents,
nitroimidazole derivatives
iv. J04A: Antibiotics and other drugs used for treatment of
tuberculosis

277
v. J05AH: Antivirals used for influenza - Neuraminidase
inhibitors
vi. J02 and D01BA: Antimycotics and antifungals for
systemic use
vii. P01B: Antimalarials
b. Exclusion criteria: Antibiotics and other antimicrobials for
topical use.
9) Completion of data collection forms:
a. Ward form (denominator)
b. Patient form (numerator)
10) To complete 'Patient forms', the investigators will review all [medical,
nursing and drug prescription chart] patient records. If the information
available is not sufficient surveyor/s may request additional
information from nurses, pharmacists or doctors caring for the patient.
Searching for information from other sources such a laboratory
computer systems, phoning laboratories etc., is not required. At no
point shall there be any discussion about the appropriateness (or lack
thereof) of the prescribed medication. The ward staff MUST NOT feel
evaluated at the individual level.
11) Confidentiality:
a. Data stored for analysis WILL NOT bear the names of patients
or staff and neither patients, staff nor hospitals will be named
in any published reports. Inpatient numbers (i.e. Patient IP
number) will be removed from the database prior to analysis
and following data cleaning. It is not permissible to discuss the
information collected with anyone outside the research team.
12) Data entry conventions:
a. For numerical fields, enter -1 if the information is missing
(applicable but not available).
b. For date fields, enter 01/01/1913 if the information is missing
(applicable but not available)
c. For date fields, enter 01/01/1914 if not applicable
d. For drop down lists with the option 'empty', choosing 'empty'
means that the information requested is not available.
13) Data Entry and Synchronization
a. After data entry into REDCap, the data clerks will be expected
to synchronize the data daily. This is to ensure the data are

278
stored at the KEMRI/Wellcome Trust servers. You will be
provided with internet modems to allow synchronization of the
data over the internet.

279
Supplement 5: Table of available guidelines by disease Condition Adult/
Paediatric
Treatment Options Source Reference
1 Pneumonia Adult fluoroquinolone (moxifloxacin,
gemifloxacin, or levofloxacin
[750 mg])
Infectious Diseases
Society of America;
ATS: American
Thoracic Society
2019
Metlay JP, Waterer GW, Long AC, Anzueto A, Brozek J, Crothers K,
Cooley LA, Dean NC, Fine MJ, Flanders SA, Griffin MR. Diagnosis and
Treatment of Adults with Community-acquired Pneumonia. An Official
Clinical Practice Guideline of the American Thoracic Society and
Infectious Diseases Society of America. American Journal of
Respiratory and Critical Care Medicine. 2019 Oct 1;200(7):e45-67.
An antipneumococcal beta-
lactam (preferred agents:
cefotaxime, ceftriaxone, or
ampicillin-sulbactam; or
ertapenem for selected
patients) PLUS a macrolide
(azithromycin, clarithromycin, or
erythromycin)
Treat with benzyl penicillin 2
mega units IM IV 6 hourly +
gentamicin 240 mg IM IV once a
day 5 days OR IV ceftriaxone 2g
every 24 hours OR erythromycin
500mg 6 hourly for 5 days
Clinical
Management and
Referral Guidelines
– Volume III:
Clinical Guidelines
for Management
and Referral of
Common
Conditions at
Levels 4–6:
Hospitals.
Ministry of Medical Services and Ministry of Public Health and
Sanitation. Clinical Management and Referral Guidelines – Volume III:
Clinical Guidelines for Management and Referral of Common
Conditions at Levels 4–6: Hospitals. Nairobi: Ministry of Medical
Services and Ministry of Public Health and Sanitation; 2009.
Amoxicillin 500 mg orally three
times daily
2009 guideline
recommendations
Lim WS, Baudouin SV, George RC, et al. BTS guidelines for the
management of community-acquired pneumonia in adults: update

280
Amoxicillin 500 mg to 1 gram
orally three times
daily plus clarithromycin 500 mg
orally twice daily
of the British
Thoracic Society
2009. Thorax 2009; 64 Suppl 3:iii1. Copyright © 2009 BMJ Publishing
Group Ltd.
Doxycycline 200 mg loading dose
then 100 mg
orally or levofloxacin 500 mg
orally once daily or moxifloxacin
400 mg orally once daily
amoxicillin 500 mg IV three
times daily or benzylpenicillin
(penicillin G) 1.2 grams IV four
times daily plus clarithromycin
500 mg IV twice daily
Adult Amoxicillin/Clavulanic Acid/
cefuroxime or Ceftriaxone and
Macrolide
Kenyatta National
Hospital Kenya
The KNH Guide to Empiric Antimicrobial Therapy 2018
Children benzylpenicillin + gentamicin Basic Paediatric
Protocols for ages
up to 5 years.
2016
Ministry of Health. Basic Paediatric Protocols for ages up to 5 years.
2016 [Available from: http://idoc-
africa.org/images/documents/2016/Basic_Paediatric_Protocol_2016/
MAY%2023rd%20BPP%202016%20SA.pdf.
2 Skin and Soft
Tissue
Infections
Adult/
Children
Cloxacillin Clinical
Management and
Referral Guidelines
– Volume III:
Clinical Guidelines
for Management
and Referral of
Ministry of Medical Services and Ministry of Public Health and
Sanitation. Clinical Management and Referral Guidelines – Volume III:
Clinical Guidelines for Management and Referral of Common
Conditions at Levels 4–6: Hospitals. Nairobi: Ministry of Medical
Services and Ministry of Public Health and Sanitation; 2009.

281
Common
Conditions at
Levels 4–6:
Hospitals.
Adult Amoxicillin/Clavulanic Acid or
Clindamycin or Doxycycline
Kenyatta National
Hospital Kenya
The KNH Guide to Empiric Antimicrobial Therapy 2018
Adult
(extended
hospitalizat
ion with
invasive
procedure
Piperacillin/Tazobactam+
Amikacin or Cefipime +Amikacin
Adult/Child
ren
Vancomycin +piperacillin Infectious Diseases
Society of America
Dennis L. Stevens, Alan L. Bisno, Henry F. Chambers, E. Patchen
Dellinger, Ellie J. C. Goldstein, Sherwood L. Gorbach, Jan V.
Hirschmann, Sheldon L. Kaplan, Jose G. Montoya, James C. Wade,
Practice Guidelines for the Diagnosis and Management of Skin and
Soft Tissue Infections: 2014 Update by the Infectious Diseases Society
of America, Clinical Infectious Diseases, Volume 59, Issue 2, 15 July
2014, Pages e10–e52, https://doi.org/10.1093/cid/ciu296
Penicillin, Ceftriaxone,
Clindamycin, Cephazolin
Ampicillin - Sulbactam
Ceftriaxone+Metronidazole
Ciprofloxacin+Metronidazole
Levofloxacin+Metronidazole

282
National Institute
for Health and
Care Excellence
(NICE)
Guideline on cellulitis and erysipelas – Antimicrobial
prescribing (2019)--
https://www.nice.org.uk/guidance/ng141/resources/visual-summary-
pdf-6908401837
3 Urinary Tract
Infections
Adult-
Lower UTI
Cotrimoxazole Clinical
Management and
Referral Guidelines
– Volume III:
Clinical Guidelines
for Management
and Referral of
Common
Conditions at
Levels 4–6
Adult -
Upper UTI
Gentamicin, Ciprofloxacin Ministry of Medical Services and Ministry of Public Health and
Sanitation. Clinical Management and Referral Guidelines – Volume III:
Clinical Guidelines for Management and Referral of Common
Conditions at Levels 4–6: Hospitals. Nairobi: Ministry of Medical
Services and Ministry of Public Health and Sanitation; 2009.
Adult(
Category 1)
Nitrofurantoin or Cefuroxime or
Ciprofloxacin
Kenyatta National
Hospital Kenya
The KNH Guide to Empiric Antimicrobial Therapy 2018
Adult
(Category
2)
Nitrofurantoin or Etrapenem or
Piperacillin/Tazobactam
Adult
(Category
3)
Meropenem or Imipenem+
Amikacin or
Piperacillin/Tazobactam+Amikaci
n
Adult Ceftriaxone Infectious Diseases
Society of
America/NICE
Thomas M. Hooton, Suzanne F. Bradley, Diana D. Cardenas, Richard
Colgan, Suzanne E. Geerlings, James C. Rice, Sanjay Saint, Anthony J.
Schaeffer, Paul A. Tambayh, Peter Tenke, Lindsay E. Nicolle, Diagnosis,
Prevention, and Treatment of Catheter-Associated Urinary Tract Ciprofloxacin
Levofloxacin

283
Trimethoprim-Sulfamethoxazole Infection in Adults: 2009 International Clinical Practice Guidelines from
the Infectious Diseases Society of America, Clinical Infectious Diseases,
Volume 50, Issue 5, 1 March 2010, Pages 625–663,
https://doi.org/10.1086/650482
Amoxicillin Clavulanate
Children Co-amoxiclav Cefuroxime
Ceftriaxone Gentamicin
Amikacin
National Institute
for Health and
Care Excellence
(NICE)
Pyelonephritis (acute): antimicrobial prescribing
https://www.nice.org.uk/guidance/ng111/resources/visual-summary-
pdf-6544161037 UTI (catheter): antimicrobial prescribing
Adult Ceftriaxone, Ciprofloxacin,
Levofloxacin,
National Institute
for Health and
Care Excellence
(NICE)
UTI (catheter): antimicrobial prescribing
https://www.nice.org.uk/guidance/ng113/resources/visual-summary-
pdf-6599495053
Lower UTI Nitrofurantoin National Institute
for Health and
Care Excellence
(NICE)
UTI (lower): antimicrobial prescribing
https://www.nice.org.uk/guidance/ng109/resources/visual-summary-
pdf-6544021069
4 Intrabdominal
Infections
Adults
(Category
1)
Ceftriaxone+Metronidazole or
Ciprofloxacin+Metronidazole or
Tigecycline+ Metronidazole
Kenyatta National
Hospital Kenya
The KNH Guide to Empiric Antimicrobial Therapy 2018
Adults(Cate
gory 2)
Etrpenem or
Piperacillin/Tazobactam+
Aminoglycoside or
Ceftazidime+Aminoglycoside+
Metronidazole or Tigecycline+
Metronidazole
Adults(Cate
gory 2)
Imipenem+/-Aminoglycoside or
Meropenem +/- aminoglycoside

284
or cefipime+
aminoglycoside+metronidazole
Children Ceftriaxone, cefotaxime,
cefepime, or ceftazidime, each in
combination with
metronidazole; gentamicin or
tobramycin, each in combination
with metronidazole or
clindamycin, and with or without
ampicillin
Infectious Diseases
Society of America
Joseph S. Solomkin, John E. Mazuski, John S. Bradley, Keith A Rodvold,
Ellie J.C. Goldstein, Ellen J. Baron, Patrick J. O'Neill, Anthony W. Chow,
E. Patchen Dellinger, Soumitra R. Eachempati, Sherwood Gorbach,
Mary Hilfiker, Addison K. May, Avery B. Nathens, Robert G. Sawyer,
John G. Bartlett, Diagnosis and Management of Complicated Intra-
abdominal Infection in Adults and Children: Guidelines by the Surgical
Infection Society and the Infectious Diseases Society of America,
Clinical Infectious Diseases, Volume 50, Issue 2, 15 January 2010,
Pages 133–164, https://doi.org/10.1086/649554 Adults Cefazolin, cefuroxime,
ceftriaxone, cefotaxime,
ciprofloxacin, or levofloxacin,
each in combination with
metronidazole
5 CNS
Infections
Adults Benzylpenicillin 4 mega units IV 6
hourly for 14–
21 days OR chloramphenicol 1g
IV 6 hourly for 14 days, OR
ceftriaxone 24g/
day IV 12 hourly for 14–21 days,
Vancomycin 2g/day IV 8–12
hourly OR
meropenem 2g/day IV 8 hourly
Clinical
Management and
Referral Guidelines
– Volume III:
Clinical Guidelines
for Management
and Referral of
Common
Conditions at
Levels 4–6:
Ministry of Medical Services and Ministry of Public Health and
Sanitation. Clinical Management and Referral Guidelines – Volume III:
Clinical Guidelines for Management and Referral of Common
Conditions at Levels 4–6: Hospitals. Nairobi: Ministry of Medical
Services and Ministry of Public Health and Sanitation,; 2009.

285
Children Ceftriaxone Basic Paediatric
Protocols for ages
up to 5 years.
2016
Ministry of Health. Basic Paediatric Protocols for ages up to 5 years.
2016 [Available from: http://idoc-
africa.org/images/documents/2016/Basic_Paediatric_Protocol_2016/
MAY%2023rd%20BPP%202016%20SA.pdf.
Adults Vancomycin plus ampicillin plus
a third-generation cephalosporin
Infectious Disease
Society of America
Liu C, Bayer A, Cosgrove SE, et al. Clinical Practice Guidelines by the
Infectious Diseases Society of America for the Treatment of
Methicillin-Resistant Staphylococcus Aureus Infections in Adults and
Children: Executive Summary. Clin Infect Dis 2011; 52:285. Adults >50 Vancomycin plus ampicillin plus
a third-generation cephalosporin
Adults Post
Trauma
Vancomycin plus cefepime; OR
vancomycin plus ceftazidime; OR
vancomycin plus meropenem
6 Sepsis/Septic
Shock
Adults vancomycin with one of the
following:
3rd generation (e.g., ceftriaxone
or cefotaxime) or 4th generation
cephalosporin (cefepime), or
beta-lactam/beta-lactamase
inhibitor (eg, piperacillin-
tazobactam, ticarcillin-
clavulanate), or
carbapenem (e.g., imipenem or
meropenem)
Surviving Sepsis
Campaign
Rhodes A, Evans LE, Alhazzani W, Levy MM, Antonelli M, Ferrer R, et
al. Surviving Sepsis Campaign: International Guidelines for
Management of Sepsis and Septic Shock: 2016. Intensive Care
Medicine. 2017;43(3):304-77.

286
Children Vancomycin (15 mg/kg,
maximum 1 to 2 g, for the initial
dose) PLUS cefotaxime (100
mg/kg, maximum 2 g, for the
initial dose) OR ceftriaxone (75
mg/kg, maximum 2 g, for the
initial dose)
•Consider adding an
aminoglycoside (e.g.,
gentamicin) for possible GU
source and/or piperacillin with
tazobactam, clindamycin or
metronidazole for possible GI
source
Surviving Sepsis
Campaign
Rhodes A, Evans LE, Alhazzani W, et al. Surviving Sepsis Campaign:
International Guidelines for Management of Sepsis and Septic Shock:
2016. Intensive Care Med 2017; 43:304.
7 Bone and
Joint Infection
Adults/Chil
dren
Clindamycin( Adults),Cloxacillin +
chloramphenicol
Cloxacillin + gentamicin or
Amoxicillin + gentamicin for
septic arthritis
Clinical
Management and
Referral Guidelines
– Volume III:
Clinical Guidelines
for Management
and Referral of
Common
Conditions at
Levels 4–6:
Ministry of Medical Services and Ministry of Public Health and
Sanitation. Clinical Management and Referral Guidelines – Volume III:
Clinical Guidelines for Management and Referral of Common
Conditions at Levels 4–6: Hospitals. Nairobi: Ministry of Medical
Services and Ministry of Public Health and Sanitation; 2009.

287
Adults Vancomycin PLUS a third- or
fourth-generation cephalosporin
(such as ceftriaxone,
ceftazidime, or cefepime)
Infectious Disease
Society of America
Mader JT, Cantrell JS, Calhoun J. Oral ciprofloxacin compared with
standard parenteral antibiotic therapy for chronic osteomyelitis in
adults. J Bone Joint Surg Am 1990; 72:104.Davey PG, Rowley DR,
Phillips GA. Teicoplanin--home therapy for prosthetic joint infections.
Eur J Surg Suppl 1992; :23.Lazzarini L, Lipsky BA, Mader JT. Antibiotic
treatment of osteomyelitis: what have we learned from 30 years of
clinical trials? Int J Infect Dis 2005; 9:127.Black J, Hunt TL, Godley PJ,
Matthew E. Oral antimicrobial therapy for adults with osteomyelitis or
septic arthritis. J Infect Dis 1987; 155:968.Gentry LO, Rodriguez-Gomez
G. Ofloxacin versus parenteral therapy for chronic osteomyelitis.
Antimicrob Agents Chemother 1991; 35:538.Lew DP, Waldvogel FA.
Quinolones and osteomyelitis: state-of-the-art. Drugs 1995; 49 Suppl
2:100.
Children Vancomycin PLUS Nafcillin or
Ofloxacin PLUS a third- or
fourth-generation cephalosporin
(such as ceftriaxone,
ceftazidime, or cefepime) and
Clindamycin
8 Post
Caesarean
Section
Prophylaxis
Adults First Generation Cephalosporin
or Add metronidazole,
azithromycin, or doxycycline to a
first- or second-generation
cephalosporin
Infectious Disease
Society of America
Dale W. Bratzler, E. Patchen Dellinger, Keith M. Olsen, Trish M. Perl,
Paul G. Auwaerter, Maureen K. Bolon, Douglas N. Fish, Lena M.
Napolitano, Robert G. Sawyer, Douglas Slain, James P. Steinberg,
Robert A. Weinstein, Clinical practice guidelines for antimicrobial
prophylaxis in surgery, American Journal of Health-System Pharmacy,
Volume 70, Issue 3, 1 February 2013, Pages 195–283,
https://doi.org/10.2146/ajhp120568
9 Prophylaxis
for bone and
joint surgery
Adults Cephazolin, Clindamycin,
vancomycin
Infectious Disease
Society of America
Dale W. Bratzler, E. Patchen Dellinger, Keith M. Olsen, Trish M. Perl,
Paul G. Auwaerter, Maureen K. Bolon, Douglas N. Fish, Lena M.
Napolitano, Robert G. Sawyer, Douglas Slain, James P. Steinberg,
Robert A. Weinstein, Clinical practice guidelines for antimicrobial
prophylaxis in surgery, American Journal of Health-System Pharmacy,
Volume 70, Issue 3, 1 February 2013, Pages 195–283,
https://doi.org/10.2146/ajhp120568

288
10 Prophylaxis
for GIT
surgery
Adults Cefazolin, cefoxitin, cefotetan,
ceftriaxone,ampicillin–
sulbactam, Clindamycin or
vancomycin +aminoglycoside or
aztreonam orfluoroquinolone or
Metronidazole + aminoglycoside
or fluoroquinolone
Infectious Disease
Society of America
Dale W. Bratzler, E. Patchen Dellinger, Keith M. Olsen, Trish M. Perl,
Paul G. Auwaerter, Maureen K. Bolon, Douglas N. Fish, Lena M.
Napolitano, Robert G. Sawyer, Douglas Slain, James P. Steinberg,
Robert A. Weinstein, Clinical practice guidelines for antimicrobial
prophylaxis in surgery, American Journal of Health-System Pharmacy,
Volume 70, Issue 3, 1 February 2013, Pages 195–283,
https://doi.org/10.2146/ajhp120568
11 Prophylaxis
for Urological
Surgery
Adults Cefazolin ± aminoglycoside,
cefazolin ± aztreonam,
ampicillin–sulbactam,
Fluoroquinolone, trimethoprim–
sulfamethoxazole, Cefazolin +
metronidazole, cefoxitin,
aminoglycoside +
metronidazole or clindamycin
Infectious Disease
Society of America
Dale W. Bratzler, E. Patchen Dellinger, Keith M. Olsen, Trish M. Perl,
Paul G. Auwaerter, Maureen K. Bolon, Douglas N. Fish, Lena M.
Napolitano, Robert G. Sawyer, Douglas Slain, James P. Steinberg,
Robert A. Weinstein, Clinical practice guidelines for antimicrobial
prophylaxis in surgery, American Journal of Health-System Pharmacy,
Volume 70, Issue 3, 1 February 2013, Pages 195–283,
https://doi.org/10.2146/ajhp120568
12 Neonatal
Infections
Neonates Penicillin+ Gentamicin,
Ceftazidime, Metronidazole,
Ceftriaxone, Cefotaxime
Basic Paediatric
Protocols for ages
up to 5 years.
2016
Ministry of Health. Basic Paediatric Protocols for ages up to 5 years.
2016 [Available from: http://idoc-
africa.org/images/documents/2016/Basic_Paediatric_Protocol_2016/
MAY%2023rd%20BPP%202016%20SA.pdf.
13 Genitourinary
system
Ministry of Health
Kenya
Ministry of Health. Kenya National Guidelines for Prevention,
Management and Control of Sexually Transmitted Infections. Nairobi:
National AIDS and STI Control Programme; 2018.
Male STD IM ceftriaxone/Gentamicin and
Azithromycin
Cervicitis IM ceftriaxone/Gentamicin and
Azithromycin
Pelvic
Inflammato
ry Disease
Cefixime/Ceftriaxone/Gentamici
n and Doxycline and
Metronidazole

289
Supplement 6: Heat map showing the physical availability of guidelines by disease condition
across the departments

290

291
Chapter 7
Using treatment guidelines to improve
antibiotic use: Insights from an antibiotic
point prevalence survey in Kenyan public
hospitals
Michuki Maina, Jacob McKnight, Olga Tosas- Auguet,
Constance Schultsz and Mike English
In Press ( BMJ Global Health )

292
Improving antibiotic use in resource-limited regions; the
role of treatment guidelines
Key Words: Antimicrobial Resistance, Antibiotics, Treatment guidelines
Summary Box
• Clinical practice guidelines have the potential to improve quality of care
through improving decision making and antibiotic prescription. These
guidelines are particularly important in areas with limited laboratory
and specialist capacity.
• For some of the common conditions managed in the hospitals,
guidelines are not available or are outdated.
• To reduce irrational antibiotic use and contain the threat of
antimicrobial resistance, the process of guideline development should
prioritise the most common diseases.
• The process of developing context-appropriate clinical guidelines
requires input from all relevant stakeholders with leadership from the
Ministry of Health. This process needs to have a clear plan for
dissemination, training and future updates.

293
Background
Antimicrobial resistance (AMR) is a significant public health threat that is
expected to worsen as more drug-resistant organisms emerge [1]. This situation
is further exacerbated by the low rate of discovery of new antimicrobial agents
that could act against drug-resistant microorganisms. AMR could retard
economic growth in low-income countries and delay attainment of the
sustainable development goals [2].
There are multiple drivers of AMR, but one of the key drivers has been the
irrational use of antimicrobial agents [3]. In hospitals, lack of timely and
accurate diagnostic tests, including microbiology for bacterial speciation and
drug susceptibility testing, leads to unnecessary antimicrobial use, fueling
resistance and health care costs [4]. While countries must work to improve
diagnostic capabilities and increase laboratory capacity to enhance diagnostic
accuracy, it is also important to complement this new capacity with locally
relevant guidelines. Providing context-specific, applicable, and regularly
updated treatment guidelines to frontline doctors is an effective means to
improve antibiotic usage and clinical care [5].
Clinical practice guidelines (CPG) provide a standardised and systematic
approach to responding to disease, including the treatment. The guidelines are,
however, more effective in the context of a functioning health system with
adequate clinicians, drugs, diagnostics and a supportive environment to the
clinicians and patients[6]. This multifaceted approach of improving
antimicrobial usage is illustrated in Figure 1.

294
Figure 1 Improving antimicrobial usage requires clinicians, laboratory and radiological support in
an environment that provides treatment guidelines, training, feedback and patient
communication.
Here, we present data from an antibiotic point prevalence survey that
illustrates the continued importance of developing guidelines for improving
diagnosis and treatment. We propose that guidelines should be developed to
target common diseases in limited-resource settings as a priority and lastly, we
illustrate how guideline development and dissemination at scale can be
achieved using the example of Kenya’s Basic Paediatric Protocols (BPP).

295
Using guidelines to improve diagnosis and antibiotic use
A point prevalence survey was conducted across 14 public county hospitals
(formerly district hospitals) in Kenya. These hospitals, with varying bed
capacities, are located in urban and rural areas of Kenya with high and low
malaria endemicity. They provide multi-speciality inpatient care, which
includes; maternal, neonatal, adult and paediatric medical and surgical units.
Data from this survey conducted among hospitalised patients revealed that
large proportions of patients received antibiotic treatment for conditions that
did not warrant antibiotics [7]. However, this inappropriate use of antibiotics
was much less prevalent in the paediatric medical (14% [36/261) and neonatal
units (5% [11/224]) where treatment guidelines were physically available than
on adult medical units where treatment guidelines were absent, and 33%
[140/421] of the patients were inappropriately treated.
In addition to lack of guidelines, the literature on irrational antibiotic use
suggests that the level of training of the prescribers, the fear of the clinicians
missing an existing infection, fear of lawsuits, fear of being reprimanded by
more senior colleagues, and pressures from patients, nurses and other ward
staff can especially encourage overtreatment [8] [9]. Availing standard
guidelines can help address many of these factors and give confidence to the
clinicians on what comprises best practice while also improving the accuracy of
diagnoses and treatment [10].
The need for Guidelines
While it may be ideal to have guidelines for all diseases, immediate efforts
should be directed to the most common ailments. On the neonatal and
paediatric units we examined, the clinical practice guidelines available in the

296
wards [11] provided treatment advice that spanned 94% (211/224) and 55%
(143/261) of the admissions, respectively. There were guidelines for common
conditions in adults or on surgical units.
The main adult conditions for which antibiotics were prescribed among the
adult medical and surgical populations included; pneumonia, obstetric and
gynaecological infections, HIV associated infections, central nervous system
(CNS) infections, skin and soft tissue infections (SSTI), and antibiotics for
surgical prophylaxis. In the paediatric medical unit, the common conditions
included; pneumonia, CNS infections, gastrointestinal infections and sepsis [7].
Here we use the example of pneumonia and CNS infections in adults and SSTI
in surgical units to illustrate the need for guidelines.
In the adult medical wards, pneumonia and CNS infections accounted for 22%
[94/421] and 20% [50/421] of admissions, respectively. Based on predefined
criteria, 26% and 28% of these patients admitted with pneumonia and CNS
infections, respectively, received inappropriate treatment. In the surgical units,
SSTI which lack current local guidelines were a common cause of hospitalisation
in adults (25% [135/543]) and children (60% [32/53]). Of these patients with
SSTI, the documented antibiotic treatment was inappropriate in 69% and 43%
of the adults and children, respectively. The choice of antibiotics used to treat
these skin infections varied widely across the hospitals surveyed. Additionally,
there was a significantly higher use of nitroimidazole derivatives compared to
the preferred beta-lactam antibiotics [12].
Availing approved guidelines for these conditions could ensure their treatment
is standardised across hospitals. To reduce AMR, these guidelines should be in
line with the recommendations by the WHO essential medicines list that
encourages the use of the access group drugs (generally having a narrow

297
spectrum of activity) as first and second-line therapy under the Access, Watch
and Reserve (AWaRe) categorisation [13]. Treatment guidelines for adults in
medical and surgical units which cover these, and other common conditions
were developed in Kenya. However, they have not been updated for 12 years;
they were not disseminated in easy to use formats or at scale and were not
found in any of the hospitals visited [14]. Therefore, it is essential to update or
replace these guidelines in a format that can be widely and rapidly
disseminated. It would be advisable to draw on international guidelines,
including those from WHO [15-17] and include context-specific modifications
[18]. This process should be driven from the “bottom-up” by the professional
medical and surgical associations with strategic direction offered by the
Ministry of Health as the Ministry is mandated to generate health policies.
The potential for national guidelines
Unlike in high-income settings where guidelines may be hospital or region-
specific, in many low- and middle-income countries, guidelines tend to be for
national use, including the private sector. Key to the development process,
therefore, are the Ministries of Health who provide direction on what
guidelines need to be developed based on the local disease burden. The
Ministry also plays a role in ensuring adequate representation by all relevant
stakeholders in the development process that should be transparent and not
undermined by conflicts of interest or undue influence from specific individuals
or groups (including funders) [19]. Guideline development should specifically
extend to include plans for training and dissemination activities targeting all
relevant clinicians in pre-service training or practice in the public, not-for-profit
and private sectors. This includes availing the guidelines in electronic versions
for higher utilisation [20].

298
Other stakeholders, especially organisations such as WHO can play a vital role
by providing access to high-quality evidence syntheses and offering training and
technical support to the process of guideline development [21].
The Kenyan Basic Paediatric Protocols as an example of a national
guideline development process
Developing guidelines is a multidisciplinary effort that requires input from
expert clinicians, representatives from professional bodies and end-users,
economists and methodologists. These teams need to be responding to
relevant clinical needs that require the development of guidelines [21].
In Kenya, this approach was adopted to develop the Basic Paediatric Protocols
(BPP) first published in 2006. The development of these guidelines was initiated
and overseen by the Ministry of Health with input from the professional
paediatric association, universities and clinicians [22]. As the process evolved,
topics were identified in response to clinician queries for conditions that lacked
clear guidelines, and systematic reviews were conducted to generate context-
appropriate evidence. This evidence was presented to multiple stakeholders,
and guidelines were then developed through consensus. The BPP underwent
three updates in 2010, 2013 and 2016 to include new and emerging evidence
[11, 23].
Guideline availability, however, does not necessarily translate into their use. It
is, therefore, essential to include a plan for training and implementation as part
of the guideline development process [23]. The development of the BPP was
accompanied by the roll-out of the BPP-based Emergency Triage Assessment
and Treatment Plus Admission (ETAT+) training to clinicians in public and
private hospitals and medical students. Many thousands of health workers and
students have been trained since the guidelines were first rolled out, and

299
numerous low-cost, short guidelines booklets have been distributed [23]. Since
their introduction, better case definition and management of pneumonia and
diarrhoeal diseases, improved clinical documentation and a decline in the use
of inappropriate cough medications have been reported amongst other
benefits [10, 24, 25].
Conclusion
Availing up to date treatment guidelines to clinicians provides an opportunity
to reduce inappropriate antibiotic use in hospitals. There are apparent gaps in
guideline development and availability, especially for common adult medical
conditions and across all ages in surgical care. Guideline development can be
used to build consensus across a broad spectrum of the clinical community on
contextually appropriate treatments. Their development must be accompanied
by clear and adequate dissemination strategies to ensure all the clinicians
making decisions daily, understand the rationale for the recommended strategy
and have access to guidance at the point of care.
Authors’ contributions
The roles of the contributors were as follows: M.M, J.M, O.T, C.S and M.E
conceived the study. M.M conducted surveys and data collection. O.T and ME
assisted M.M in analysis and interpretation of the data. M.M, J.M, O.T, C.S and
M.E drafted and critically revised the manuscript for intellectual content. All
authors read and approved the final manuscript.

300
Acknowledgements
The authors would like to thank all the hospitals that participated in the initial
surveys and follow up interviews. This work is published with the permission of
the director of KEMRI.
Funding
This work was supported by funds from the economic and social research
council ESRCS # ES/P004938/1, and a Senior Research Fellowship awarded to
M.E by The Wellcome Trust (#207522). M.M is supported by a grant from by
the Initiative to Develop African Research Leaders (IDeAL) through the DELTAS
Africa Initiative [DEL-15-003], an independent funding scheme of the African
Academy of Sciences (AAS) ’s Alliance for Accelerating Excellence in Science in
Africa (AESA) and supported by the New Partnership for Africa’s Development
Planning and Coordinating Agency (NEPAD Agency) with funding from the
Wellcome Trust [107769/Z/10/Z] and the U.K. government. The funders had no
role in drafting nor the decision for submitting this manuscript.
Competing interests
There are no conflicts of interest declared by the authors.
Data Availability
Data used for this manuscript are available in Harvard Dataverse at
https://dataverse.harvard.edu/dataset.xhtml?persistentId=doi:10.7910/DVN/
L7S8TK. Access applications can be made through the Data Governance
Committee with details available on www.kemri-wellcome.org, or email to
301
Ethical approval
This study received approval from the Oxford Tropical research ethics
committee (OXTREC) from the University of Oxford (Ref: 525–17) and the
Kenyan Medical Research Institute (Ref: KEMRI/SERU/CGMR-C//086/3450).

302
References
1. World Health Organization, Antimicrobial resistance: global report on surveillance.
2014: World Health Organization.
2. Jonas, O.B., et al., Drug-resistant infections: a threat to our economic future. World
Bank Group, Washington, DC, 2017.
3. Holmes, A.H., et al., Understanding the mechanisms and drivers of antimicrobial
resistance. The Lancet, 2016. 387(10014): p. 176-187.
4. Okeke, I.N., Laboratory systems as an antibacterial resistance containment tool in
Africa. African journal of laboratory medicine, 2016. 5(3): p. 497-497.
5. World Health Organization, Step-by-step approach for development and
implementation of hospital and antibiotic policy and standard treatment guidelines.
2011, WHO Regional Office for South-East Asia.
6. Mendelson, M., et al., Maximising access to achieve appropriate human antimicrobial
use in low-income and middle-income countries. The Lancet, 2016. 387(10014): p. 188-
198.
7. Maina, M., et al., Antibiotic use in Kenyan public hospitals: Prevalence, appropriateness
and link to guideline availability. International Journal of Infectious Diseases, 2020. 99:
p. 10-18.
8. Livorsi, D., et al., Factors Influencing Antibiotic-Prescribing Decisions Among Inpatient
Physicians: A Qualitative Investigation. Infect Control Hosp Epidemiol, 2015. 36(9): p.
1065-72.
9. De Souza, V., et al., A qualitative study of factors influencing antimicrobial prescribing
by non-consultant hospital doctors. J Antimicrob Chemother, 2006. 58(4): p. 840-3.
10. Maina, M., et al., Inappropriate prescription of cough remedies among children
hospitalised with respiratory illness over the period 2002-2015 in Kenya. Trop Med Int
Health, 2017. 22(3): p. 363-369.
11. Ministry of Health. Basic Paediatric Protocols for ages up to 5 years. . 2016; Available
from: http://idoc-
africa.org/images/documents/2016/Basic_Paediatric_Protocol_2016/MAY%2023rd%
20BPP%202016%20SA.pdf.
12. Ramakrishnan, K., R.C. Salinas, and N.I.A. Higuita, Skin and soft tissue infections.
American family physician, 2015. 92(6): p. 474-483.
13. Organization, W.H., The selection and use of essential medicines: report of the WHO
Expert Committee, 2017 (including the 20th WHO Model List of Essential Medicines and
the 6th Model List of Essential Medicines for Children). 2017: World Health
Organization.

303
14. Ministry of Medical Services and Ministry of Public Health and Sanitation, Clinical
Management and Referral Guidelines – Volume III: Clinical Guidelines for Management
and Referral of Common Conditions at Levels 4–6: Hospitals. 2009, Ministry of Medical
Services and Ministry of Public Health and Sanitation,: Nairobi.
15. Kenyatta National Hospital and University of Nairobi, The KNH guide to empiric
antimicrobial therapy 2018: Nairobi.
16. Metlay, J.P., et al., Diagnosis and treatment of adults with community-acquired
pneumonia. An official clinical practice guideline of the American Thoracic Society and
Infectious Diseases Society of America. American journal of respiratory and critical care
medicine, 2019. 200(7): p. e45-e67.
17. Stevens, D.L., et al., Practice guidelines for the diagnosis and management of skin and
soft tissue infections: 2014 update by the Infectious Diseases Society of America. Clinical
infectious diseases, 2014. 59(2): p. e10-e52.
18. Penney, G.C., Adopting and adapting clinical guidelines for local use. The Obstetrician
& Gynaecologist, 2007. 9(1): p. 48-52.
19. Lo, B. and M. Field, Conflicts of interest and development of clinical practice guidelines.
Conflict of Interest in Medical Research, Education, and Practice, 2009.
20. Damiani, G., et al., The effectiveness of computerised clinical guidelines in the process
of care: a systematic review. BMC Health Services Research, 2010. 10(1): p. 2.
21. World Health Organization, WHO handbook for guideline development. Geneva: WHO;
2012. 2017.
22. Irimu, G., et al., Developing and introducing evidence based clinical practice guidelines
for serious illness in Kenya. Arch Dis Child, 2008. 93(9): p. 799-804.
23. English, M., et al., Developing guidelines in low-income and middle-income countries:
lessons from Kenya. Archives of Disease in Childhood, 2017. 102(9): p. 846-851.
24. Akech, S., et al., Magnitude and pattern of improvement in processes of care for
hospitalised children with diarrhoea and dehydration in Kenyan hospitals participating
in a clinical network. Tropical Medicine & International Health, 2019. 24(1): p. 73-80.
25. Gachau, S., et al., Prevalence, outcome and quality of care among children hospitalised
with severe acute malnutrition in Kenyan hospitals: A multi-site observational study.
PLOS ONE, 2018. 13(5): p. e0197607.

304
305
Chapter 8
Using a common data platform to facilitate
audit and feedback on the quality of hospital
care provided to sick newborns in Kenya
Michuki Maina, Jalemba Aluvaala, Paul Mwaniki, Olga Tosas-
Auguet, Catherine Mutinda, Beth Maina, Constance Schultsz
and Mike English BMJ Glob Health. 2018;3(5): e001027

306
ABSTRACT
Essential interventions to reduce neonatal deaths that can be effectively
delivered in hospitals have been identified. Improving information systems may
support routine monitoring of the delivery of these interventions and outcomes
at scale. We used cycles of audit and feedback (A&F) coupled with the use of a
standardised newborn admission record (NAR) form to explore the potential for
creating a common inpatient neonatal data platform and illustrate its potential
for monitoring prescribing accuracy. Revised NARs were introduced in a high
volume, neonatal unit in Kenya together with 13 A&F meetings over a period of
3 years from January 2014 to November 2016. Data were abstracted from
medical records for 15 months before introduction of the revised NAR and A&F,
and during the three years of A&F. We calculated, for each patient, the
percentage of documented items from among the total recommended for
documentation and trends calculated over time. Gentamicin prescribing
accuracy was also tracked over time. Records were examined for 827 and 7336
patients in the pre-A&F and post-A&F periods, respectively. Documentation
scores improved overall.
Documentation of gestational age improved from <15% in 2014 to >75% in
2016. For five recommended items, including temperature, documentation
remained <50%. 16.7% (n=1367; 95% CI 15.9 to 17.6) of the admitted babies
had a diagnosis of neonatal sepsis needing antibiotic treatment. In this group,
dosing accuracy of gentamicin improved over time for those under 2 kg from
60% (95%36.1 to 80.1) in 2013 to 83% (95% CI to 92.3) in 2016. We report that
it is possible to improve routine data collection in neonatal units using a
standardised neonatal record linked to relatively basic electronic data
collection tools and cycles of A&F. This can be useful in identifying potential
gaps in care and tracking outcomes with an aim of improving the quality of care.
307
Key Words: Neonatal Care, Audit and Feedback, Quality of care
Summary Box
• Improving information systems that support routine monitoring of
quality and outcomes at scale is an important part of efforts to
enhance neonatal care.
• We highlight clinical data elements that are poorly recorded by
practitioners in routine settings, findings that can help revise the
standardised record form.
• It is possible to improve routine data collection and prescribing
accuracy in neonatal units using a standardised neonatal record
linked to relatively basic electronic data collection tools and cycles of
audit and feedback to improve medical care.
308
INTRODUCTION
Newborn deaths account for approximately 44% of under-five deaths globally
[1] largely attributable to preterm birth, sepsis and intrapartum
complications.[2] Specific interventions such as newborn resuscitation, thermal
care, use of oxygen and early recognition and treatment of neonatal infections
have been identified as major interventions to reduce neonatal deaths that can
be effectively delivered as part of basic hospital services.[3] However, there are
few data on whether such interventions are delivered in routine settings in low
and middle-income countries (LMIC). Available evidence suggests that
adherence to recommended forms of care is poor.[4] For example looking at
treatment of neonatal infections, in a recent assessment of neonatal units in
Kenyan hospitals, more than 20% of the prescriptions of gentamicin were above
safe, recommended doses.[5]
An ability to monitor routine antibiotic prescribing is also aligned with
increasing concern over antimicrobial resistance (AMR). Neonatal units,
including intensive care units can be hotspots for development and
transmission of antimicrobial-resistant organisms. [6] This may be due to the
extensive empirical use of antimicrobial agents, inappropriate choice of
antibiotics, inappropriate dosing and extended duration of administration
coupled with poor infection prevention and control practices.[7-9] Spread of
antibiotic-resistant organisms amongst neonates may subsequently be
manifest in increased length of hospital stay, increased hospital costs and
greater morbidity and mortality.
Unfortunately, poor documentation, record keeping and information systems
[10] preclude effective monitoring of both the delivery of effective
interventions in general and the use of antibiotics in particular. This is worsened
by limited human resource capacity, equipment and supplies.[11] Improving

309
information systems that support routine monitoring of quality and outcomes
at scale is therefore, an important part of efforts to enhance neonatal care in
LMIC.[12]
To address the challenge of inadequate record keeping and routine monitoring,
we worked with a high volume, low-resource neonatal unit in Kenya using audit
and feedback (A&F). This was coupled with efforts to develop/update a
neonatal admission record (NAR) that could support a common inpatient
neonatal data platform for monitoring care and outcomes at scale. A&F is
based on the premise that if clinicians are informed of what is not consistent
with required practice, they will change behaviour. However, effects of audit
and feedback as an improvement strategy have been varied with some
reporting very modest or no effects. [13] A&F may be more effective if based
on data that are valid and timely [14] with recent and prior work suggesting
effectiveness is enhanced if coupled with other interventions such as the use of
standardised admission records. [15]
Here we report on the effects of repeated cycles of audit and feedback linked
to use of standardised record forms on the completeness of patient level
information in a LMIC neonatal unit. We illustrate the potential value of better
data for monitoring quality and prescribing accuracy and we identify which
clinical data elements are poorly recorded by practitioners in routine settings,
findings that can help revise the standardised record form.
Context: Pumwani Maternity Hospital
Pumwani Maternity Hospital, the largest public maternity hospital in Kenya, is
located in the capital city Nairobi. The hospital, which serves mainly the urban
poor population, conducts approximately 22, 000 deliveries annually; the
newborn unit has approximately 4500 admissions annually and holds close to
60 babies each day. Care is overseen by four consultant paediatricians

310
supervising a team of six medical officers and four clinical officers (non-
physician clinicians) typically working so that there are 2-3 clinicians in every
shift. Nursing care is provided by registered nursing officers a minority of whom
have specialised neonatal training. Typically, only 2-3 nurses are on duty per
shift assisted by trainee nurses. The research team had no role in patient care
but did support the provision of one clerk to collect data daily.
Description of routine data Collection using a newborn admission record
A NAR promoting documentation of key patient characteristics at the time of
admission was originally developed in 2006 as part of the Emergency Treatment
and Triage plus admission approach, which includes skill training in essential
inpatient newborn care.[16, 17] Adoption of this NAR has been at the discretion
of hospital teams with modest uptake but a suggestion that it can improve data
availability.[5] In Pumwani there was an effort to revise the NAR in 2014 with
the local team, so it might better capture important information, for example,
maternal human immunodeficiency virus (HIV) status, length of gestation and
mode of delivery. The NAR is divided into different sections which include: (1)
Relevant maternal history, (2) Babies’ biodata and clinical history, (3) Babies’
examination findings and admission vital signs, (4) the basic laboratory tests
ordered, and (5) primary and secondary diagnosis on admission. The clinical
variables included are based on the key signs and symptoms that national
guidelines recommend should be assessed for all sick newborns. [18, 19] A
minimum data set (used for the national reporting system) is collected on all
patients while a full data set including all clinical and treatment data is collected
on an automatically generated random sample of 60% of admitted newborns.
Table 1 shows the data collected from the NAR that were used for the analysis
in this report and some of the variables that were added after the modification
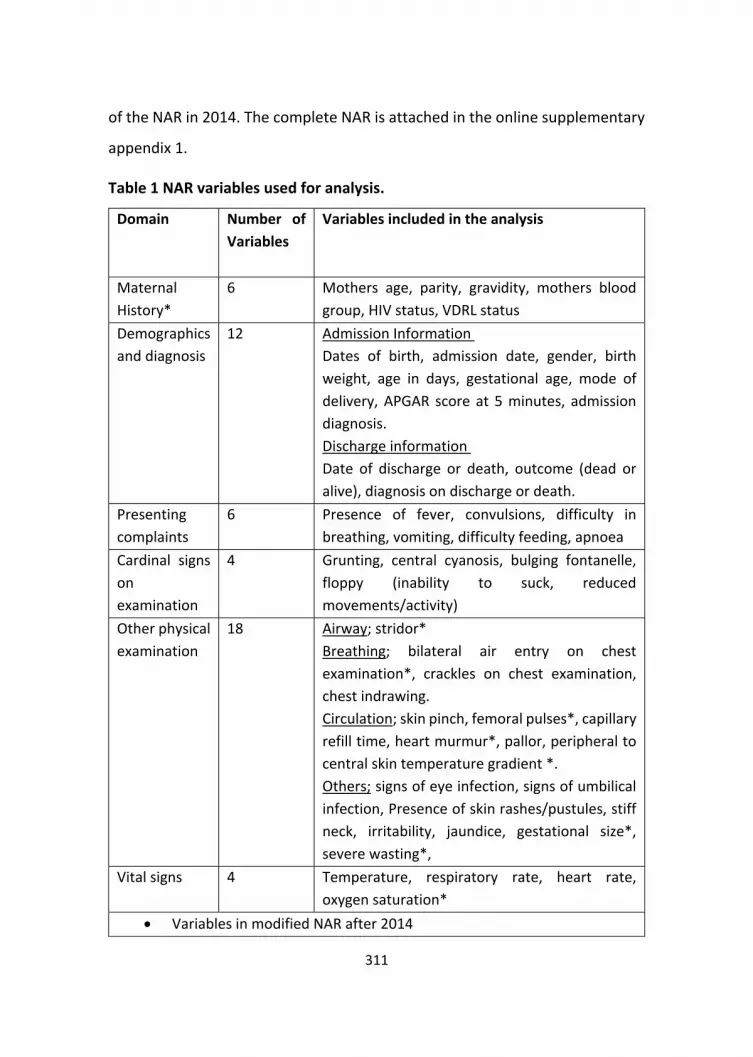
311
of the NAR in 2014. The complete NAR is attached in the online supplementary
appendix 1.
Table 1 NAR variables used for analysis.
Domain Number of
Variables
Variables included in the analysis
Maternal
History*
6 Mothers age, parity, gravidity, mothers blood
group, HIV status, VDRL status
Demographics
and diagnosis
12 Admission Information
Dates of birth, admission date, gender, birth
weight, age in days, gestational age, mode of
delivery, APGAR score at 5 minutes, admission
diagnosis.
Discharge information
Date of discharge or death, outcome (dead or
alive), diagnosis on discharge or death.
Presenting
complaints
6 Presence of fever, convulsions, difficulty in
breathing, vomiting, difficulty feeding, apnoea
Cardinal signs
on
examination
4 Grunting, central cyanosis, bulging fontanelle,
floppy (inability to suck, reduced
movements/activity)
Other physical
examination
18 Airway; stridor*
Breathing; bilateral air entry on chest
examination*, crackles on chest examination,
chest indrawing.
Circulation; skin pinch, femoral pulses*, capillary
refill time, heart murmur*, pallor, peripheral to
central skin temperature gradient *.
Others; signs of eye infection, signs of umbilical
infection, Presence of skin rashes/pustules, stiff
neck, irritability, jaundice, gestational size*,
severe wasting*,
Vital signs 4 Temperature, respiratory rate, heart rate,
oxygen saturation*
• Variables in modified NAR after 2014
312
Electronic data capture from the medical records which are in paper form (NAR,
treatment sheets,) occurs at discharge. Every working day data were collected
and managed using Research Electronic Data Capture (REDCap) electronic data
capture tools. REDCap® is a secure, web-based application designed to support
data capture for research studies.[20] These data are abstracted by a trained
clerk stationed at the health facility. To ensure data quality, built-in range and
validity checks are employed at the point of data entry, an automated error
checking procedure is run daily on site with corrections made. Further error
checks are performed by the data management team after de-identified data
are synchronised to a central server. A more comprehensive description of the
data cleaning and data quality assurance process is described elsewhere.[21]
Implementation activities
For a period of 15 months from January 2013 to March 2014, the period before
the A&F process, we collected baseline data in a retrospective survey. Data
were collected from records that included an earlier form of the NAR already in
use at the hospital. The records examined were from a random selection of
dates across the 15 months with the intention of capturing data on
approximately 55 admissions per month. From April 2014, the research team
worked with the neonatal unit clinical team to revise the NAR tailoring it to the
needs of the hospital a process resulting in the addition of further variables
(maternal history, addition of clinical signs and symptoms, addition of
admission diagnosis, table 1). The hospital team introduced the revised NAR
into its pre-printed medical files to make it a routine medical record filled for all
admissions. A&F was used to highlight documentation of key variables showing
how the NAR was used and the completeness of documentation. A&F was

313
integrated into existing monthly mortality meetings organised by the hospital
teams and attended by the clinical, nursing teams and hospital management
where these data were presented quarterly. Areas for improvement were
found and actions to promote change identified – with responsibility for leading
these left to the paediatricians and the clinical team.
Experience before and after A&F
The period for these data was divided into two phases, the baseline data
collection period January 2013 to 31 March 2014 and the period with feedback
from April 2014 to November 2016. We defined the 6-month periods, two pre-
A&F and six post A&F, to explore any effect of efforts to improve
documentation. For each patient, each variable within an analysis domain was
assigned a binary score denoting availability of documentation (i.e., 0= No; 1=
Yes). We then calculated, for each analysis domain, the percentage of
documented variables among the total number of variables that could be
documented for the patient population over the 6-month period. The
percentage of completed documentation was plotted with 95% (CI) to examine
changes and trends over time.
To understand what documentation tasks, remain difficult despite A&F, we
calculated, for each individual variable, the percentage of patients with missing
documentation for that variable over the last 6-month interval (i.e. April to
November 2016) and stratified items as poorly (25%-50%) or very poorly (<25%)
documented.
We provide documentation trends for individual variables that are
indispensable to delivering appropriate drug dosing to newborns-namely birth
weight and gestational age-and illustrate the impact of improved
documentation on trends of gentamicin posology over time to illustrate the

314
potential monitoring value of better data. The Kenyan guidelines recommend a
once daily gentamicin dose of 3 mg/kg for those babies <2 kg and 5 mg/kg for
those ≥ 2 kg in the first 7 days of life [19]. We considered a correct dose to be
within a ± 20% margin of error. Summary statistics and data visualisation were
conducted in R statistical software V. 1.0.136.
NARs were examined for 827 patients in the pre-A&F period (January 2013–
March 2014). The revised NAR was examined for 7336 patients in the A&F
period, over six consecutive 6-month intervals (n=1067 (Period 1, 2014),
n=1941 (Period 2, 2014), n=1144 (Period 1,2015), n=1103 (Period 2, 2015),
n=1230 (Period 1, 2016) and n=680 (Period 2, 2016)). The last 6-month period
in 2016 had lower patient numbers due to a 14-day doctors strike in the month
of October. Of the 7985 patients included, 46% (n=3656) were female, 78.3%
(n=6251;95% CI 77.6 to 79.4) were admitted on the date of birth, 90.5%
(n=7207; 95% CI 89.8 to 91.1) were admitted within 48 hours of delivery and
9% (n=712; 95% CI 8.3 to 9.6) of the admitted babies died. The mean birth
weight on admission was 2.88 kg (95% CI 2.86 to 2.90). There were 13 A&F
feedback meetings between January 2014 and November 2016, eight specific
to A&F feedback and five as part of monthly morbidity and mortality meetings.
Documentation across domains
The documentation across all domains showed improvement over time and
after introduction of the revised NAR, as shown in figure 1. The greatest
improvement was noted in the domains that had low baseline performance at
the onset. Thus, documentation of babies’ vital signs, maternal history and
other physical examination showed greatest improvement. Although
documentation of vital signs improved by more than 50% between 2014 and
2016 performance stagnated at less than 75%, as it did in another domain
‘other physical signs’ (table1).

315
In the variable-specific analysis over the last 6-month period (April-November
2016), we explored documentation of 57 variables in 680 patients. Variables
with poor (25%-50%) documentation were general examination of the skin
(other clinical signs) and admission temperature (vital signs). Those with very
poor documentation (<25%) were all under other physical examination; these
were; documentation of visible wasting (a possible indicator of intrauterine
growth retardation), skin pinch and skin temperature (signs of neonatal
dehydration,) and the presence of femoral pulses and eye discharge. This
variable specific analysis helps explain the plateauing seen in figure 1.
Figure 1 Trends in completeness of documentation of various parts of the neonatal admission
record, (NAR) over three years. The black shade around the trends is the 95% confidence intervals
around the estimates. The dotted line represents the introduction of prospective data collection
in April 2014.

316
Documentation of gestational age and birth weight
Documentation of birth weight and gestational age are important in feed and
antibiotic prescribing decisions and other aspects of newborn care. The
documentation of birth weight remained consistently high with >95%
documentation since 2013. Documentation of gestational age has shown
gradual improvement over the data collection period from < 15%
documentation in 2014 to >75% documentation in 2016, as shown in figure 2
below.
Figure 2 Shows the proportion of documentation of gestational age among hospitalised neonates
in six-month intervals with 95% confidence intervals around the estimates. The dotted line
represents the introduction of prospective data collection.
Dosing of gentamicin
There were 16.7% (n=1367; 95% CI 15.9 to 17.6) of the admitted babies with a
diagnosis of neonatal sepsis needing antibiotic treatment during the study

317
period. Of these neonates diagnosed with neonatal sepsis, 81.4% (n=1113; 95%
CI 79.2 to 83) were prescribed a combination of penicillin and gentamicin
(national first line). An additional 39.5% (n=2688; 95% CI 38.4 to 40.7) of
admitted neonates were put on antibiotic treatment without a clear diagnosis
of neonatal sepsis who typically had respiratory distress, prematurity or
asphyxia; these prescriptions were predominantly penicillin and gentamicin. Of
the neonates who received gentamicin, 4.4% (n=161;95% CI 3.8 to 5.1) received
an overdose and 2.4% (n=86;95% CI 1.9 to 2.9) were underdosed. By plotting
trends by weight, the major changes were noted in those <2 kg with a reduction
in the proportion of overdoses of gentamicin prescribed, as shown in figure 3
below.
Figure 3: Charts showing dosing trends of gentamicin over time in six-month intervals from
January 2013 for those under 2 kg (Upper panel) or over 2 kg (lower panel). The grey shade
indicates the 95% confidence intervals around the estimates. The dotted line represents the
introduction of prospective data collection.

318
Impact of introducing the NAR with A&F cycles
We set out to improve availability of clinical data on neonatal admissions in a
large Kenyan hospital. Here we report how repeated cycles of A&F were used
to improve availability of information, share lessons on information that is
difficult to collect in busy routine clinical settings and illustrate how such data
may be of potential value for monitoring quality of care, taking the example of
gentamicin dosing. We focused on reinforcing the use of a standardised
admission record as these have been associated with more thorough
documentation in some LMIC settings but not previously, to our knowledge, in
neonatal care.[22] We report good documentation in six domains that include
50 specific variables. However, five specific variables were typically poorly
documented by clinicians; examination of the skin (colour, bruising, pustules),
admission temperature, visible wasting, skin pinch and skin temperature.
Clinicians may feel some of these are less relevant to the babies’ clinical
condition on the day of birth (wasting, skin pinch and skin temperature) when
most admissions occur as these signs are typically associated with later onset
neonatal illnesses. With thermal care being an essential aspect of neonatal
care, we note that temperature is still recorded poorly with approximately 25%-
50% documentation. Documentation of gestation was noted to improve across
the period to >75% documentation. This is much better than previous reports
from Kenyan hospitals.[5] Here we also report some improvement in the
accuracy of gentamicin dosing for neonates under 2 kg. Dosing errors, including
antibiotics occur more among sick neonates compared to any other population.
These errors may have a more significant effect as neonates have little
physiological ability to buffer these errors. [23] Most of these errors occur in
the prescribing phase as compared with the dispensing and administration
phase. Internationally, various interventions have been instituted to reduce

319
these prescriptions errors. [24-26] Our data demonstrate it is possible to track
correctness of dosing over prolonged periods in a busy hospital setting.
A&F as an improvement tool has been widely used in clinical settings, but
evidence on its effects is mixed [13]. It may be more effective if the
performance targeted has large room for improvement. This was sometimes
the case in our setting where, for example, documentation of gestation was <
20% in the baseline period of our study. It has also been noted that A&F is more
effective when the targeted change is less complex (requiring no specific skills)
and compatible with clinician norms and values.[27] Having the organisational
buy in and involving the leadership in goal and target setting also makes the
process of A&F more effective.[28] The goal setting and feedback meetings in
our setting were attended by the heads of the units and hospital managers,
which ensured that the process was in line with overall hospital priorities.
Paucity of newborn data in terms of type of care provided, morbidity and
mortality is still a major challenge in many facilities.[29] The WHO names
actionable information systems as a key pillar in provision of quality maternal
and neonatal care. This allows clinicians to make timely and appropriate
decisions.[12] There is increasing interest at the global level in tracking quality
of care at scale, particularly care provided to the newborn[30]. A central
element of monitoring quality of care at scale is a common data set. Our work
demonstrates that clinicians providing care in a busy, routine hospital setting
can be encouraged to use standardised neonatal record forms with high levels
of documentation, especially for variables that are clinically meaningful to
them. Establishing an agreed and standard medical record could enable
neonatal networks to be formed with an aim of improving care provided to
patients. In such networks, colleagues may also share experiences and can
provide a ‘bottom up’ method of problem solving [31] helping improve clinical
320
outcomes at scale [32]. With the realisation that quality data may improve care
provision, many governments and hospitals in Africa are moving towards
electronic medical records (EMR).[33] This may provide an opportunity to
integrate agreed common data elements as part of an EMR as well as improve
the value of existing District Health Information systems.[34]
Limitations of this approach are that documentation only captures some
aspects of quality and that information can be documented incorrectly or
activities recorded but not done. However, data from case records remain the
most feasible form of information to collect on patients at scale. The accuracy
of data is also hard to verify for certain types of data. For example, most of the
documentation of gestation is still based only on maternal history rather than
ultrasound dating in Kenya. Other challenges to implementing better
information systems remain; the resources needed to support data capture and
analysis with better information are often given low priority in resource
allocation. While data collection for this project was partly supported by the
research team, this was limited to the A&F reports and the modest costs for
data collection (clerk costs). However, there are discussions with the ministry
of health and the national paediatric association on how best to transition and
expand these activities to ensure continuity beyond the current funding.
Despite this being a research project, outputs from this work feed into the
routine mortality and morbidity meetings and monthly health information
reports further reinforcing data use and institutionalisation of the activities
beyond the current funding cycle.

321
CONCLUSION
It is possible to improve routine data collection in neonatal units using a
standardised neonatal record linked to relatively basic electronic data
collection tools. These tools could collect data on significant presenting
complaints, maternal history, babies’ physical examination, investigations, and
treatment. Data collected on such a platform at wider scale can be useful in
identifying potential gaps in care with an aim of improving the quality of care
provided in facilities and tracking outcomes. Monitoring antibiotic use could be
especially valuable in the current era. Implementing such systems takes time
and needs significant support from clinicians, nurses and hospital managers.
Authors’ contributions
The roles of the contributors were as follows: M.M, J.A and M.E conceived the
study. P.M, OT assisted M.M in analysis and interpretation of these data. M.M,
J.A, O.T, C.S and M.E drafted the manuscript. J.A, O.T, C.S and M.E critically
revised the manuscript for intellectual content. All authors read and approved
the final manuscript.
Acknowledgements
The authors would like to thank the Pumwani Maternity Hospital who gave
permission for the study included in this paper. We also thank the hospital
paediatricians and clinical teams on newborn unit who provide care to the
neonates for whom this project is designed. This work is published with the
permission of the director of KEMRI.
Funding
This work was supported by funds from The Wellcome Trust (#097170)
awarded to ME to support M.M, P.M, J.A and O.T. M.M was also supported
through the DELTAS Africa Initiative [grant# DEL-15-003]. The DELTAS Africa

322
Initiative is an independent funding scheme of the African Academy of Sciences
(AAS)’s Alliance for Accelerating Excellence in Science in Africa (AESA) and
supported by the New Partnership for Africa’s Development Planning and
Coordinating Agency (NEPAD Agency) with funding from the Wellcome Trust
[grant # 107769/Z/10/Z] and the UK government. The funders had no role in
drafting or submitting this manuscript.
Competing interests
There are no conflicts of interest declared by the authors.
Ethical approval
The findings reported here come from a study that was approved by the KEMRI
Scientific and ethics review committee (Approval No SERU/3459).

323
References
1. UN Inter-agency Group for Child Mortality Estimation, Levels and trends in child
mortality 2014. 2014.
2. Black, R.E., et al., Global, regional, and national causes of child mortality in 2008: a
systematic analysis. Lancet, 2010. 375(9730): p. 1969-87.
3. Bhutta, Z.A., et al., Can available interventions end preventable deaths in mothers,
newborn babies, and stillbirths, and at what cost? Lancet, 2014. 384(9940): p. 347-70.
4. Wilunda, C., et al., Assessing Coverage, Equity and Quality Gaps in Maternal and
Neonatal Care in Sub-Saharan Africa: An Integrated Approach. PLOS ONE, 2015. 10(5):
p. e0127827.
5. Aluvaala, J., et al., Assessment of neonatal care in clinical training facilities in Kenya.
Archives of Disease in Childhood, 2015. 100(1): p. 42-47.
6. Russell, A.B., M. Sharland, and P.T. Heath, Improving antibiotic prescribing in neonatal
units: time to act. Archives of Disease in Childhood - Fetal and Neonatal Edition, 2012.
97(2): p. F141-F146.
7. Hsu, J.F., et al., Predictors of clinical and microbiological treatment failure in neonatal
bloodstream infections. Clin Microbiol Infect, 2015. 21(5): p. 482.e9-17.
8. Patel, S.J. and L. Saiman, Principles and strategies of antimicrobial stewardship in the
neonatal intensive care unit. Semin Perinatol, 2012. 36(6): p. 431-6.
9. Goldmann, D.A., et al., Strategies to Prevent and Control the Emergence and Spread of
Antimicrobial-Resistant Microorganisms in Hospitals. A challenge to hospital
leadership. Jama, 1996. 275(3): p. 234-40.
10. Aluvaala, J., et al., Delivery outcomes and patterns of morbidity and mortality for
neonatal admissions in five Kenyan hospitals. Journal of Tropical Pediatrics, 2015. 61(4):
p. 255-259.
11. English, M., et al., An intervention to improve paediatric and newborn care in Kenyan
district hospitals: understanding the context. Implement Sci, 2009. 4: p. 42.
12. World Health Organization, Standards for improving quality of maternal and newborn
care in health facilities. 2016, WHO: Geneva. p. 19-21.
13. Ivers, N., et al., Audit and feedback: effects on professional practice and healthcare
outcomes. Cochrane Database of Systematic Reviews, 2012(6).
14. Ivers, N.M., et al., No more ‘business as usual’ with audit and feedback interventions:
towards an agenda for a reinvigorated intervention. Implementation Science, 2014.
9(1): p. 14.

324
15. Gachau, S., et al., Does audit and feedback improve the adoption of recommended
practices? Evidence from a longitudinal observational study of an emerging clinical
network in Kenya. BMJ Global Health, 2017. 2(4).
16. Irimu, G., et al., Developing and introducing evidence based clinical practice guidelines
for serious illness in Kenya. Arch Dis Child, 2008. 93.
17. English, M., et al., Implementing locally appropriate guidelines and training to improve
care of serious illness in Kenyan hospitals: a story of scaling-up (and down and left and
right). Arch Dis Child, 2011. 96(3): p. 285-90.
18. World Health Organization, Pocket Book of Hospital Care for Children: Guidelines for
the Management of Common Childhood Illnesses. 2013, World Health Organization
Geneva.
19. Ministry of Health. Basic Paediatric Protocols for ages up to 5 years. 2016; 4:[Available
from: http://idoc-
africa.org/images/documents/2016/Basic_Paediatric_Protocol_2016/MAY%2023rd%
20BPP%202016%20SA.pdf.
20. Harris, P.A., et al., Research electronic data capture (REDCap)--a metadata-driven
methodology and workflow process for providing translational research informatics
support. J Biomed Inform, 2009. 42(2): p. 377-81.
21. Tuti, T., et al., Improving documentation of clinical care within a clinical information
network: an essential initial step in efforts to understand and improve care in Kenyan
hospitals. BMJ Glob Health, 2016. 1(1): p. e000028.
22. Mwakyusa, S., et al., Implementation of a structured paediatric admission record for
district hospitals in Kenya--results of a pilot study. BMC Int Health Hum Rights, 2006. 6:
p. 9.
23. Kaushal, R., et al., Medication errors and adverse drug events in pediatric inpatients.
Jama, 2001. 285(16): p. 2114-20.
24. Radley, D.C., et al., Reduction in medication errors in hospitals due to adoption of
computerized provider order entry systems. J Am Med Inform Assoc, 2013. 20(3): p.
470-6.
25. Leape, L.L., et al., Pharmacist participation on physician rounds and adverse drug events
in the intensive care unit. Jama, 1999. 282(3): p. 267-70.
26. Manias, E., A. Williams, and D. Liew, Interventions to reduce medication errors in adult
intensive care: a systematic review. Br J Clin Pharmacol, 2012. 74(3): p. 411-23.
27. Foy, R., et al., Attributes of clinical recommendations that influence change in practice
following audit and feedback. Journal of Clinical Epidemiology. 55(7): p. 717-722.
325
28. Ivers, N., et al., Feedback GAP: study protocol for a cluster-randomized trial of goal
setting and action plans to increase the effectiveness of audit and feedback
interventions in primary care. Implement Sci, 2013. 8.
29. Gathara, D., et al., Quality of hospital care for sick newborns and severely malnourished
children in Kenya: a two-year descriptive study in 8 hospitals. BMC Health Serv Res,
2011. 11: p. 307.
30. WHO. UNICEF, Every Newborn: an action plan to end preventable deaths, W.H.
Organization, Editor. 2014: Geneva.
31. Haines, M., et al., Determinants of successful clinical networks: the conceptual
framework and study protocol. Implementation Science, 2012. 7(1): p. 16.
32. Vermont Oxford Network. What is Vermont Oxford Network? [cited 2017 25th January
2017]; Available from: https://public.vtoxford.org/about-us/.
33. Akanbi, M.O., et al., Use of Electronic Health Records in sub-Saharan Africa: Progress
and challenges. J Med Trop, 2012. 14(1): p. 1-6.
34. Ministry of Health. Kenya Health information system. [cited 2018 10th April ]; Available
from: https://hiskenya.org/.

326
Supplementary Materials Neonatal Admission Record
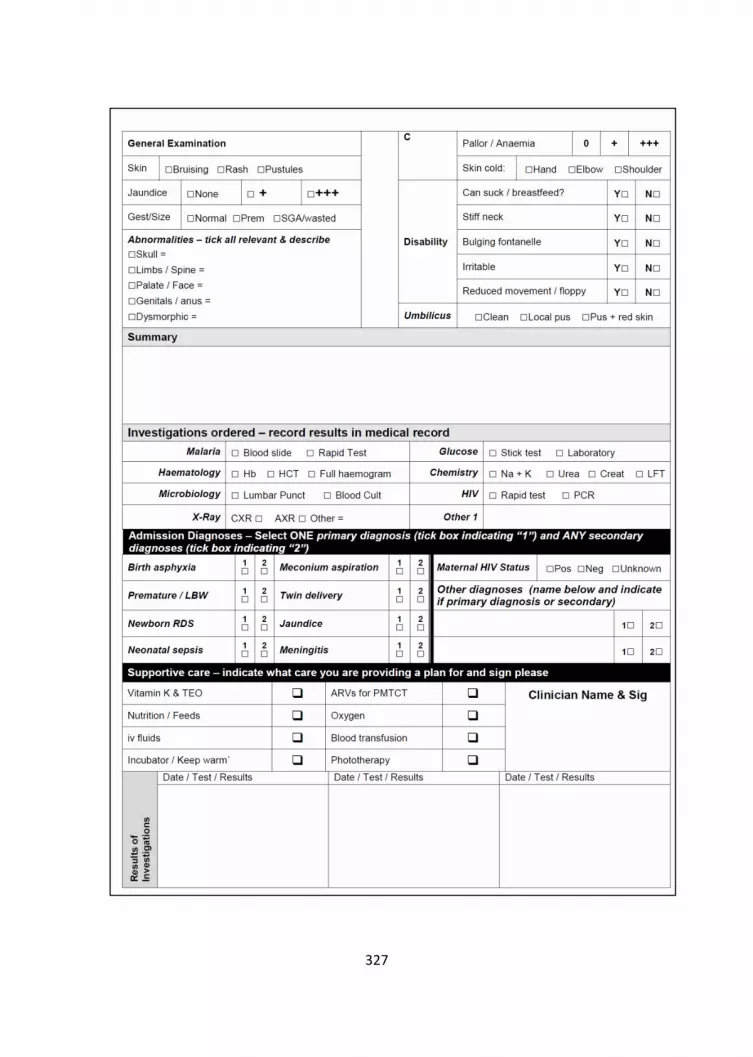
327

328

329
Chapter 9
Discussion

330
DISCUSSION
This thesis describes the infection prevention and control and antibiotic
stewardship capacities in Kenyan public hospitals. I sought to explore the
current status using surveys and additionally used qualitative approaches to
understand the context better. Though the findings are specific to Kenya, the
lessons learned herein apply to other low and middle-income countries with
similar health systems and facing similar challenges with IPC and ABS [1]. In
addition, this work generated a WASH Survey tool that can be used in other
countries to assess IPC and WASH.
Why this work is important
Whereas there have been some assessments of IPC carried out in Kenya in
some selected smaller health facilities [2], this work includes a larger sample of
hospitals with bed capacities ranging between 130 and 600 beds (Chapter 2
and 3 ). It, therefore, paints a broader picture of the status in Kenya as these
hospitals are also spread across the country, covering areas with differences in
the burden of various infectious diseases. The WASH-FAST, which was modified
from the original WASH facility assessment tool (WASH-FIT) offers a more
comprehensive approach to assessing WASH in large facilities since it provides
for assessment at both ward and facility levels (Chapter 2). The WASH-FAST
also offers an opportunity for audit and feedback. Through repeat assessments
in a facility, the IPC teams can identify what needs urgent intervention and
make recommendations to the hospital managers. This is particularly important
in settings with ongoing or emerging disease outbreaks such as COVID-19. In
such outbreaks, application of these tools can help identify in a systematic and
timely manner any shortcomings or breakdowns in IPC and/or WASH
infrastructure or practice, including poor hand hygiene facilities.

331
The original WASH surveys were carried out in 2018. After feedback to the
hospitals, some undertook improvements which have proved to be timely with
the emergence of the COVID-19 pandemic in 2020. The pivotal role played by
IPC including hand hygiene and the use of personal protective equipment in the
management of COVID-19 has been demonstrated by the numerous cases of
health care workers contracting COVID-19 in the line of duty globally [3]. The
pandemic has, therefore provided an opportunity to strengthen IPC structures
and leadership to deal with COVID-19 effectively. This was illustrated in the
follow-up phone interviews at the onset on the COVID -19 pandemic in Kenya.
From these interviews, some hospitals were better prepared to deal with
COVID-19 since they took action to improve WASH after the initial surveys
(Chapter 4). Nevertheless, these investments should be sustained beyond the
pandemic as IPC improves patient and health worker safety for all other
infectious diseases.
In settings like Kenya, where resources to run and improve hospitals are limited,
the WASH surveys allow for better decision making as these funds can be
directed to the most critical interventions. Additionally, with a comprehensive
understanding of the status of WASH in a hospital, the managers can justify
funding proposals to the county governments or development partners.
Improving accountability for most health system components remains a
challenge in many settings. The WASH-FAST addressed this by identifying those
responsible for making the necessary improvements making follow up possible
and enhancing accountability (chapter 2). To ensure these responsibilities are
taken seriously by the relevant staff, they should be included in the staff job
roles and performance appraisals. As part of improving accountability, the roles
played by the IPC committees and focal persons have also been highlighted in
this work (chapter 3). These roles have been vital during the COVID-19

332
pandemic for the provision of leadership and technical support to hospital
management (chapter 4). These teams and committees need to be formally
appointed, trained and well-resourced in all facilities to ensure proper IPC
management.
This work has also highlighted the gaps in leadership, training and funding for
antibiotic stewardship activities (chapter 5). The lack of up to date treatment
guidelines for clinicians to use, especially in the adult and surgical units, has also
been noted (chapter 6). The absence of guidelines was also reflected by the
different antibiotics used to treat similar conditions and the high proportion of
inappropriate treatments accorded to the hospitalised patients. These
inappropriate treatments in a background of limited laboratory support and
weak ABS structures have the potential to fuel antimicrobial resistance
significantly [4].
Additionally, I make a case for the development of clinical practice guidelines in
the units where these are absent or outdated. Priority should be for the most
common conditions that do not have guidelines, or the existing guidelines are
not up to date. The process of developing these guidelines should involve all
key stakeholders, including the Ministry of Health, professional bodies and
where possible patient groups. With lessons from the development of the basic
paediatric protocols in Kenya, any new guidelines should also include a training
and dissemination strategy (chapter 7).
The work also provides a perspective on the successful use of a relatively
inexpensive data capture platform. This platform collects data from routine
admission records. These data are useful for hospital audits and decision
making. This was shown to improve monitoring of antibiotic use, dosing
accuracy and clinical care in a busy neonatal unit (Chapter 8).

333
Key Insights
Funding for IPC activities
This work highlights persistent challenges in the funding of IPC activities in
public hospitals in Kenya. In some of the hospitals, there is no budget set out
for IPC activities, and these hospitals rely on funds from other hospital
departments to fund IPC activities. Even in the facilities where budgets for IPC
were prepared, minimal funds are actually allocated for these activities. This is
because the process of budget approval and allocation is done at the regional
government level. To put this into the broader Kenyan context, the devolution
of health services to the regional governments has not only reduced direct
funding to hospitals but also reduced the ability of hospitals to make the
necessary procurements [5]. Before devolution, the facilities were able to
operate hospital bank accounts from funds generated from the hospitals. These
funds were under the hospital management boards, and the hospitals were
allowed to incur expenditure and make necessary procurement. The process
was in some locations responsive to local needs and efficient, and hospitals
were able to fund activities like IPC, but this process was also riddled with
corruption and misappropriation not only in Kenya but in many countries that
use this model [6, 7]. The new constitution under the public finance
management Act in a bid to improve accountability directed that all funds at
county level be under the county finance teams[8]. This new financial
management system has reduced hospital autonomy and results in
procurement delays, and the county governments have the final say on what
can be procured. These checks and balances seek to reduce corruption and
misappropriation, but they result in unnecessary delays which affect service
delivery [5].

334
Low status and staff interest for IPC and related activities
The low status of IPC and related activities have also been highlighted. In the
survey hospitals, the staff members did not take an interest in learning about
or improving IPC. This was evidenced by the low turnout for IPC training
activities and the reluctance of senior clinicians to join the IPC committees. As
part of the WASH/IPC assessments (Chapter 3), we assessed for any rewards
systems or incentives for well-performing staff. These were absent in most of
the study hospitals. The lack of incentives and a reward system coupled with
poor staff remuneration and often high workloads may contribute to burnout
and be a significant contributor to this low morale and the perceived lack of
interest. Again, to put this in the context of the Kenyan health system, these
factors have also been reflected by the frequent health worker strikes
demanding better pay and working conditions. In 2017 there was a 100-day
doctors strike and 150-day nurses strikes[9]. Since then, there have been a
series of health worker strikes at the county level. To improve staff attitudes
and morale towards IPC and overall productivity, improving remuneration and
working conditions is crucial, indeed improving IPC is part of a key issue in
existing working conditions [10].
The ambiguity of IPC roles and responsibilities for health workers
As presented in chapter 3, in the hospital surveys, it was noted that staff did
not have IPC related activities in their job descriptions and appraisals. IPC roles
and responsibilities can be improved by including IPC related tasks on the staff
appraisal not only for the hospital managers but also for the other hospital staff.
From the available literature, the ambiguity of roles on IPC has been noted to
be a reason why some activities are not performed, and in many hospitals, has
resulted in hospital-acquired infections. With this ambiguity, the HAI's which

335
are primarily due to poor IPC are therefore perceived as unavoidable or
becomes a blame game with no one taking responsibility for their occurrence
[11] [12]. This is a situation that affects patient safety and best described by
Woods and colleagues as "the problem of many hands" [13]. This is where
multiple people or groups contribute to the success or failure of a situation, e.g.
IPC, but no one person can be held responsible. To mitigate this problem of
many hands in the setting of IPC, all hospital staff should have clear roles and
responsibilities as IPC concerns everyone, from the managers to the frontline
health workers.
As the roles and responsibilities for IPC are put in place in hospitals, there is a
need to be cognisant of how hierarchy across hospital staff would affect the
success of such an intervention. In hospitals with consultants, doctors, nurses
and other clinicians, it has been noted that the nurses are keener on the
practice of IPC. In chapter 3 of our work, this was confirmed by a nurse manager
reporting that nurses in her facility were more conversant with IPC than other
cadres. Although my work did not explore the reasons behind this, to explain
why this might be the case, previous work by Gilbert and colleagues seeking to
understand the ethics and politics of IPC, albeit in a high-income setting, noted
that senior clinicians perceive that some of the IPC policies are 'imposed' on
them and are a threat to their professional independence, power and
autonomy [11]. Since the IPC policies are meant to improve patient safety and
care, any clinician not keeping to these standards should be viewed as
unprofessional and not keeping to the ethics of doing no harm [11]. The
hospitals should provide mechanisms for all staff, including the juniors, to raise
their concerns about unprofessional behaviour, including inadequate infection
prevention and control practices by staff. Creating a team environment where

336
the seniors can learn and are also accountable to others can improve IPC
behaviour and status.
Hospitals outsourcing IPC services
In some of the hospitals we studied, the management had resorted to
contracting private companies to offer cleaning and waste disposal services as
described in chapter 3. From the available literature, this process of outsourcing
cleaning services is seen as not only a potentially cost-effective measure but
also a way to ensure that the hospital can focus on its core mandate of providing
care [14]. In the facilities where this was taking place, it was the prerogative of
the service provider to provide cleaning materials and staff and ensure the
facilities are clean at all times. However, these services need to be overseen by
hospital managers to ensure the cleaning companies provide excellent quality
services. The practice of outsourcing in hospitals has not always been
successful. Globally, in hospitals where outsourcing has failed, this has been
due to poor selection of providers and incomplete contracts that lead to poor
relations between the providers and the hospitals [14]. The hospitals,
therefore, need to select credible and experienced service providers and have
a clear contract on the roles and responsibilities. Hospitals cannot, however,
entirely abdicate the IPC responsibilities to contracted service providers.
Poor Antibiotic Stewardship leadership
A critical first step for hospitals in improving ABS in Kenyan hospitals, as
envisioned by the national ABS guidelines recently launched, is for hospitals to
constitute committees to provide leadership for ABS [15]. Just like in IPC, on
antibiotic stewardship, the gaps in leadership were also highlighted. From the
stewardship assessments (chapter 5), the hospitals lacked ABS committees. The

337
committee that was present in some of the facilities was the medicines and
therapeutics committees which was composed of clinicians, pharmacists and
hospital managers. The main aim of these therapeutic committees was to
provide direction on what medicines and technologies the hospital should
procure and did not focus on the stewardship of these treatments, including
antibiotics. With proper training, these therapeutics committees are a good
starting point for stewardship activities. Properly constituted stewardship
committees can ensure the clinicians are well trained on antibiotic stewardship
and prescribing. This can be done through routine continuous medical
education and staff orientation programmes. These committees are also able
to lobby for funding to carry out audit activities.
Pharmacists at the centre of stewardship activities
From interviews with the pharmacists in the participating hospitals, we noted
that most of these pharmacists were not actively involved in the hospital
stewardship activities and only a handful were involved in the clinical hospital
rounds and actively involved in patient care by advising the clinicians on the
antibiotic prescription choices, combinations and drug interactions (chapter 5).
To improve stewardship, the roles played by the pharmacists in public hospitals
need to go beyond drug dispensing. In Kenyan public hospitals, the bulk of the
prescriptions are done by the junior clinicians, some of whom are in training.
Involving the pharmacists in routine patient care, including training the junior
clinicians reduces dosing errors and improves prescription practices [16, 17].
In addition, we noted that the pharmacists in the survey hospitals have
opportunities to provide continuing medical education to the hospitals. These
opportunities can be used to promote antibiotic stewardship and rational
prescribing to all the clinicians.

338
Challenges with antibiotic supplies and quality
On drug supplies, there were noted frequent drug stockouts in the hospitals
(chapter 5). In some of the hospitals, the pharmacists blamed these stockouts
on the suppliers. From related literature, in Kenyan public hospitals, these
stockouts have been attributed to weak procurement structures where these
hospitals rely on the Kenya Medical Supplies Agency, which is the government
body mandated to supply drugs to the public hospitals. With these
arrangements, drugs are supplied at specific times of the year which often leads
to stockouts [18]. Poor forecasting and quantification of the hospital drug needs
also contribute to these stockouts [18].
From our surveys, as discussed in chapter 5, some of the clinicians were also
concerned about the quality of antibiotics available, especially those from the
private drug stores. In cases of antibiotic stockouts, where alternatives are not
available in the hospital, the patients have to source these drugs from private
pharmacies. Due to cost implications, these patients opt for the cheaper
options, some of which are poor quality antibiotics. From the broader
literature, the use of poor quality or falsified drugs, including antibiotics, may
lead to poor treatment outcomes and treatment failure [19].
Study Limitations
I present some limitations to this work. In the IPC surveys (chapter 3), all the 65
WASH indicators were provided with the same weight. Indeed, some indicators
are more critical to improving IPC, e.g. ensuring water is available in the
hospitals. Assigning different weights to these indicators would allow the
managers to prioritise the improvement of the critical indicators.
The original WASH-FIT and WASH-FAST offer a risk assessment activity as part
of the assessment. In this activity, the people conducting the survey are
provided with an opportunity to gauge through consensus the most critical
339
indicators that need urgent improvement. This risk assessment process is
tedious and therefore providing weights to the indicators beforehand might
make this process easier. Future work to improve the WASH FAST would include
weighting the indicators. A stakeholder engagement process similar to the one
previously carried out in our surveys can provide an excellent platform to assign
weights through consensus.
During the surveys , we excluded some wards that were not comparable across
the hospitals. These wards include critical care units where issues of IPC are
essential. For future surveys at the hospital level, including these wards is vital
for the government and hospital managers to have a good understanding of the
state of IPC in the facility. It also allows for accurate resource allocation to
improve IPC.
This work is based on a sample of 16 Kenyan public hospitals. Although these
hospitals provided a diverse range of public hospitals based on hospital size,
malaria and HIV prevalence, I acknowledge that these results may not be
representative of the IPC picture in private and faith-based hospitals. Future
work may consider including a larger sample of hospitals but also include
private and faith-based hospitals to have a more representative picture of the
exact state of IPC and ABS in Kenya
Behaviour is a crucial component to the success or failure of any intervention.
The surveys in chapter 3 to 6 did not assess or observe clinician behaviour which
is a pivotal contributor to the success of both IPC and ABS. The focus was more
on the infrastructure and organisational arrangements. Although the
interviews gave some insight into understanding behaviour, the observation of
practice would have complimented these findings. Future work would need to
factor in some observations of practices like hand washing, proper use of PPE
and waste segregation by the clinicians.

340
The use of a point prevalence approach (chapter 6 ) in assessing antibiotic use
also presented some limitations. Key to this is that the method does not allow
for the assessment of patient outcomes, which would be crucial in
understanding the effects of the inappropriate prescriptions. A longitudinal
survey would allow for the assessment of antibiotic consumption using the
recommended defined daily dose[20]. This approach, where time and
resources allow, provides a more comprehensive understanding of antibiotic
use and the costs of treatment. We focussed on antibiotic use in the inpatient
setting. I acknowledge that also understanding how the antibiotics are
prescribed in the ambulatory care settings and clinics in addition to the
inpatient units would provide a more holistic picture to help us understand
antibiotic use and stewardship. Review of outpatient antibiotic prescriptions
would also be a useful addition to the Global Point Prevalence Survey of
Antimicrobial Consumption and Resistance ( GLOBAL- PPS) approach that was
adapted for this work [21].
This work was focused on clinicians and hospitals and did not assess the patient
perceptions on IPC antibiotic use. Indeed as Sutton and colleagues correctly
state, IPC should be everybody's business and should encourage patient
involvement [22]. To ensure interventions on IPC and antibiotic use are
effective, a clear understanding of how patients perceive IPC, antibiotic use and
AMR is critical.
Utility and Next Steps
Policy generation and training
This work provides vital information for the policymakers in Kenya and other
settings with similar health systems. The Kenya national action plan for the
prevention and containment of AMR recommends the generation of local data

341
to track IPC and antibiotic use [23]. The WASH-FAST provides an excellent
starting point for hospitals to conduct IPC surveys for the audit of IPC structures.
These audits coupled with proper accountability as provided in the WASH-FAST
would potentially bring the desired improvements within the hospitals, and if
done at scale, these data are crucial for decision making and policy generation
at a national level.
These surveys involved collaboration with the Ministry of Health, and the
findings have been shared at national and regional government levels to assist
in policy generation work. Chapter five addendum provides a policy brief
prepared from the WASH surveys. For better policy generation and decision
making by the Ministry of Health, there is a need to scale up these surveys
across the country, including the private health facilities.
Our work highlights the need to further engage in training the health workers
to ensure all are conversant with IPC and antibiotic stewardship. I suggest the
design of an IPC/ABS training module for health workers which is accredited by
the Ministry of Health. This can be piloted and scaled up and become a
prerequisite for all health workers to receiving their practice licenses or
renewals. Such a course would ensure that all health workers are familiar with
the best practice. Such modules have been previously rolled out nationally
through open, and distance learning approaches to deal with HIV and more
recently with COVID-19 [24, 25]. Once the health workers are trained, the
hospital managers and county governments can include relevant IPC and ABS
roles and responsibilities on the staff job descriptions, which is currently lacking
in most hospitals.
342
Funding for IPC and ABS
In many low- and middle-income countries where resources are scarce, there
needs to be a clear intention to allocate funds towards IPC and ABS. For most
health managers, these interventions are not income-generating, and hence
the available funds are channelled to areas that will see a return on investment.
Whereas these interventions generate no direct income, the economic gains to
the patient and the health system, in general, are numerous. These include the
costs, time and effort related to treating hospital-acquired infections and the
social and economic effects of prolonged hospitalisation on the patient [26]. As
the funders of health care, the government through the Ministry of Health or
county governments and national health insurers have a role to play to ensure
laws and compel hospitals to earmark funds for IPC and ABS activities.
Improving IPC structures for hospital accreditation
Proper IPC structures need to be in place as part of the hospital accreditation
systems. In Kenya, adherence to key IPC policies is one of the criteria for the
accreditation of medical schools and teaching hospitals [27]. However, this
should be extended to all hospitals in Kenya. This process of IPC inspection can
be done regularly by an independent government body. The results of these
inspections can then be used for accreditation of hospitals by insurance
providers and also for licencing by the regulatory agencies [28]. In addition, to
improve accountability, including IPC roles and responsibilities on the staff, job
descriptions can be included as a criterion for hospital accreditation.
IPC and ABS guideline development and dissemination
Treatment guideline development is an area that needs more focus and input
from all stakeholders. From this work, we noted that outside the basic
paediatric protocols, there are few up to date guidelines for clinicians to rely on

343
in practice. More efforts need to focus on this process as a critical step in
improving antibiotic use and reducing AMR.
Looking at IPC, though there are national IPC guidelines in Kenya, we did not
find any efforts to provide training and dissemination to the hospitals. We
recommend wider dissemination and operationalisation to ensure they achieve
the desired effects.
Encouraging the use of data platforms and electronic medical records
Encouraging hospitals to adopt the use of electronic records can be a crucial
step to improve audit and feedback on drug utilisation, including antibiotics.
These platforms can generate antibiotic prescription data and may be
integrated with the pharmacy systems to improve drug ordering [29].
Currently, most public hospitals use electronic systems to monitor stocks on
antiretrovirals, tuberculosis medication and contraceptives [30]. This is because
most of these programmes are supported externally by development agents.
There is, therefore, need to expand these systems to include other standard
treatments and drugs, including antibiotics in the hospitals. Use of electronic
supply chain monitoring can improve the hospital drug procurement process to
ensure stockouts are limited, and drugs do not expire in the stores. These
systems can alert the pharmacist when the stocks are running out and can be
integrated to offer pharmacovigilance support to report adverse drug events as
required by the law [31]. For the clinicians, the platforms with clinical decision
support systems can prompt clinicians on wrong dosages and antibiotic
combinations. Electronic platforms need to be designed with input from clinical
teams who are the end-users. Input from users enhances usability and
adoption, which in turn improves sustainability [32].

344
Future research work
Behavioural research and ethnographic approaches are vital in understanding
the low status of IPC and staff attitudes towards IPC and antibiotic use. I
recommend further work to understand better what drives behaviour and
practice so that such work can help refine future interventions.
Once treatment guidelines are availed, operational, and implementation
research, including human factor engineering studies, are crucial to
understanding what improves guideline use and uptake in our setting. More
research on understanding the patient perspectives on IPC and ABS in resource-
limited settings is also welcome. This is especially key for understating antibiotic
use among the patients in ambulatory settings. Addition of pragmatic
randomised control trials to assess the impact of treatment guidelines on
patient care and outcomes may provide more robust evidence on the role and
value of guidelines on patient care.
Conclusion
Some infection prevention and control and antibiotic stewardship structures
are present in Kenyan hospitals. These are however poorly structured, poorly
led and grossly underfunded. The improvement of IPC and ABS needs to be seen
as part of strengthening the health systems to contain the looming threat of
antimicrobial resistance.

345
References
1. Cox, J.A., et al., Antibiotic stewardship in low- and middle-income countries: the same
but different? Clinical Microbiology and Infection, 2017. 23(11): p. 812-818.
2. Bedoya, G., et al., Observations of infection prevention and control practices in primary
health care, Kenya. Bulletin of the World health Organization, 2017. 95(7): p. 503.
3. Herron, J.B.T., et al., Personal protective equipment and Covid 19- a risk to healthcare
staff? Br J Oral Maxillofac Surg, 2020.
4. Laxminarayan, R., et al., Antibiotic resistance—the need for global solutions. The Lancet
Infectious Diseases, 2013. 13(12): p. 1057-1098.
5. Barasa, E.W., et al., Recentralization within decentralization: County hospital autonomy
under devolution in Kenya. PLOS ONE, 2017. 12(8): p. e0182440.
6. Kohler, J., Fighting corruption in the health sector: methods, tools and good practices.
New York: United Nations Development Programme, 2011.
7. Vian, T., Review of corruption in the health sector: theory, methods and interventions.
Health policy and planning, 2008. 23(2): p. 83-94.
8. Government of Kenya, Public Finance Management Act 2012. 2012, Government
Printer Nairobi.
9. Irimu, G., et al., Tackling health professionals' strikes: an essential part of health system
strengthening in Kenya. BMJ Global Health, 2018. 3(6): p. e001136.
10. Dieleman, M. and J.W. Harnmeijer, Improving health worker performance: in search of
promising practices. Geneva: World Health Organization, 2006: p. 5-34.
11. Gilbert, G.L. and I. Kerridge, The politics and ethics of hospital infection prevention and
control: a qualitative case study of senior clinicians' perceptions of professional and
cultural factors that influence doctors' attitudes and practices in a large Australian
hospital. BMC Health Services Research, 2019. 19(1): p. 212.
12. Shah, N., et al., Towards changing healthcare workers' behaviour: a qualitative study
exploring non-compliance through appraisals of infection prevention and control
practices. Journal of Hospital Infection, 2015. 90(2): p. 126-134.
13. Dixon-Woods, M. and P.J. Pronovost, Patient safety and the problem of many hands.
BMJ Quality & Safety, 2016. 25(7): p. 485-488.
14. yiğit, V., et al., Outsourcing and Its Implications for Hospital Organizations in Turkey.
Journal of health care finance, 2007. 33: p. 86-92.
15. Ministry of Health, The National Antimicrobial Stewardship Guidelines for the Health
Care Settings in Kenya. 2020: Nairobi

346
16. Khalili, H., et al., Role of clinical pharmacists' interventions in detection and prevention
of medication errors in a medical ward. International journal of clinical pharmacy, 2011.
33: p. 281-4.
17. Francis, J. and S. Abraham, Clinical pharmacists: Bridging the gap between patients and
physicians. Saudi Pharmaceutical Journal, 2014. 22(6): p. 600-602.
18. Muhia, J., L. Waithera, and R. Songole, Factors affecting the procurement of
pharmaceutical drugs: A case study of Narok County Referral Hospital, Kenya. Med Clin
Rev, 2017. 3(4): p. 20.
19. Koech, L.C., et al., Quality and Brands of Amoxicillin Formulations in Nairobi, Kenya.
BioMed Research International, 2020. 2020: p. 7091278.
20. Hutchinson, J.M., et al., Measurement of antibiotic consumption: A practical guide to
the use of the Anatomical Thgerapeutic Chemical classification and Definied Daily Dose
system methodology in Canada. The Canadian journal of infectious diseases = Journal
canadien des maladies infectieuses, 2004. 15(1): p. 29-35.
21. GLOBAL-PPS. Global Point Prevalence Survey of Antimicrobial Consumption and
Resistance 2015 [cited 2017 16th February]; Available from: http://www.global-
pps.com/.
22. Sutton, E., L. Brewster, and C. Tarrant, Making infection prevention and control
everyone's business? Hospital staff views on patient involvement. Health Expectations,
2019. 22(4): p. 650-656.
23. Government of Kenya, National Policy on prevention and containment of antimicrobial
resistance 2017: Nairobi.
24. Mutea, N. and D. Cullen, Kenya and distance education: A model to advance graduate
nursing. International Journal of Nursing Practice, 2012. 18(4): p. 417-422.
25. Africa Medical Research Foundation. COVID-19 Training for Health Care Workers
Training. 2020 [cited 2020 18th August ]; Available from:
https://ecampus.amref.org/course/view.php?id=143.
26. Dobkin, C., et al., The Economic Consequences of Hospital Admissions. Am Econ Rev,
2018. 102(2): p. 308-352.
27. Kenya Medical Practitioners and Dentists Board, National training & quality assurance
standards for medical schools & teaching hospitals in kenya. 2015 Nairobi.
28. Smits, H., A. Supachutikul, and K.S. Mate, Hospital accreditation: lessons from low- and
middle-income countries. Globalization and Health, 2014. 10(1): p. 65.
29. Muinga, N., et al., Digital health Systems in Kenyan Public Hospitals: a mixed-methods
survey. BMC Medical Informatics and Decision Making, 2020. 20(1): p. 2.
30. Aywak, D., et al., Pharmacy Practice in Kenya. The Canadian journal of hospital
pharmacy, 2017. 70(6): p. 456-462.

347
31. Ministry of Health Poison and Pharmacy Board. Pharmacovigilance Electronic
Reporting System. 2020 [cited 2020 24th August ]; Available from:
https://pv.pharmacyboardkenya.org/.
32. Muinga, N., et al., Implementing an Open Source Electronic Health Record System in
Kenyan Health Care Facilities: Case Study. JMIR medical informatics, 2018. 6(2): p.
e22-e22.

348

349
Chapter 10
Summary, Samenvatting, Acknowledgements,
Author Portfolio & Resume

350
SUMMARY
Infection prevention and control and antibiotic stewardship: two sides
of the same coin in the prevention of antimicrobial resistance
Infection prevention and control (IPC) and antibiotic stewardship (ABS) are two
major interventions that have been promoted to reduce antimicrobial
resistance. Little is known on the state of IPC and ABS in the Kenyan context,
which is a representation of many low and middle-income countries. Functional
Water sanitation and hygiene (WASH) structures in hospitals are crucial for the
success of IPC in hospitals. This work aimed to assess hospitals Infection
Prevention and Control (IPC) and Antibiotic Stewardship (ABS) capacity as part
of tracking and tackling efforts to limit antimicrobial resistance in Kenya. The
specific aims were;
1. To develop a survey tool that can be applied at the national or sub-
national level to monitor WASH and IPC performance in hospitals.
2. To evaluate the WASH and IPC arrangements in Kenyan county
hospitals and explore how these may vary within a single public health
system.
3. To evaluate the opportunities and challenges for IPC and WASH
implementation in Kenya, in the COVID-19 pandemic.
4. To evaluate antibiotic stewardship arrangements in Kenyan hospitals to
guide action at the regional and national level.
5. To examine patterns of antibiotic use and guideline availability across
hospitals and medical specialities in Kenyan public hospitals.
6. To make a case for further development and use of treatment
guidelines in improving antibiotic usage in hospitals in low and middle-
income countries.

351
7. To examine the feasibility of creating an inpatient data platform to
support the regular assessment of appropriate and correct treatment
in Kenyan hospitals, taking inpatient neonatal units as an example.
The focus on the first part of this work was Infection prevention and control,
encompassing Water sanitation and hygiene.
In chapter 2, this work presents the process of modifying the Water Sanitation
and Hygiene Facility Improvement Tool (WASH- FIT) into a Water Sanitation and
Hygiene facility survey tool (WASH-FAST) at ward and facility level, including
assigning responsibility for action. This process enabled for assessment of 34
WASH indicators at ward level and 65 WASH indicators at facility level in level 4
and 5 public hospitals with performance scores attached to each indicator.
Additionally, three levels of accountability (county government, hospital
management and IPC committees) are identified by the WASH-FAST through a
process that involved different stakeholders. The stakeholders included the
Ministry of Health representatives, hospital infection prevention and control
managers, faculty from the universities and nursing schools and
representatives from non-governmental organisations dealing with IPC and
WASH.
In Chapter 3, a mixed-methods approach which included cross-sectional
surveys and in-depth interviews, was used to assess WASH in 14 public hospitals
with 116 wards. The surveys revealed varying levels of performance within
hospital wards and across the hospitals. The overall hospital performance
ranged between 47 and 71% with IPC and WASH being a low-status activity in
most of the hospitals. In-depth interviews with hospital managers, health
officials from the county governments and frontline health workers were used
to understand the reasons behind these variations. The main findings from
these interviews were the existing differences in the built environment,

352
differences in availability and use of resources within hospitals to improve
WASH and variations in the effort the leadership puts into improving WASH.
Other new insights included the role of outsourcing of cleaning services by the
hospitals to external service providers and how this has helped hospitals focus
on their core mandate of care provision.
In chapter 4, I present how the IPC structures have been affected by the
emergence of COVID-19. Using phone interviews, I carried out 11 interviews
with key hospital leaders in the study hospitals. The pandemic exposed gaps in
the hospitals IPC capacity, including the broken-down hand hygiene and waste
management structures. This caused growing fear and anxiety among the
health care providers who felt exposed to contracting the disease. Conversely,
it led to the IPC committees stepping up and taking up leadership roles to offer
training to clinicians on IPC, including the use of personal protective equipment.
Additionally, in a commentary, I highlight the role played by the infection and
prevention committees in the leadership and accountability for IPC in the
hospitals.
This chapter concludes with a policy brief providing an overview and
recommendations from the WASH/IPC work in Kenya.
The second part of the thesis focussed on antibiotic use and stewardship in
Kenya public hospitals.
Chapter 5 presents the findings from the assessment of the antibiotic
stewardship arrangements. Using a combination surveys and in-depth
interviews, the antibiotic stewardship capacities were assessed from a set of 17
indicators with aggregate scores assigned to each indicator. From these
surveys, only one hospital in the survey had a functional antibiotic stewardship
programme in place. We noted the lack of funds for stewardship activities and
lack of antibiotic use guidelines in the hospitals with aggregate scores of 25 and

353
28% respectively. Five key themes were highlighted from the interviews. These
were leadership for ABS, accountability and expert support, supplies of drugs,
mechanisms for monitoring and reporting, and the policies and practices for
ABS.
Chapter 6 presents findings from data collected on antibiotic use and guideline
availability in the study hospitals. Data on antibiotic use was collected from
3590 hospitalised patients in the 14 hospitals using a point prevalence survey.
From the data, cephalosporins and penicillins were the most frequent
prescriptions. There was limited laboratory use with only two of the
hospitalised patients having bacteriological cultures to inform the antibiotic
therapy. From the survey, in only 53% of the patients was the treatment
deemed appropriate based on the predefined criteria. Treatment guidelines
were only available in the paediatric and neonatal units. The availability of these
treatment guidelines increased the odds of appropriate treatment Odds Ratio
6.44[95% CI 4.81-8.64].
The final part presents some practical solutions to improve antibiotic use and
stewardship in public hospitals.
Chapter 7 of the thesis demonstrates the role played by treatment guidelines
in improving diagnosis and treatment. In this section, I use data and findings
from the antibiotic point prevalence survey to highlight how availability of
guidelines improves treatment appropriateness and why treatment guidelines
need to be extended beyond the paediatric and neonatal units. Here I present
some insights into why policymakers and governments should urgently focus
the guideline development process on the most common diseases. I use the
example of the development of the Kenya basic protocols to present a
successful guideline development process in Kenya.

354
Chapter 8 demonstrates how to improve the use of antibiotics, using an
inexpensive electronic data collection tool and a routine neonatal admission
form. Using routine admission data collected from a neonatal unit in a clinical
information network, this work demonstrates how the review of these routine
data using cycles of audit and feedback improved dosing accuracy of gentamicin
improved overtime for those under 2 kg from 60% to 83% over three years.

355
SAMENVATTING
Infectiepreventie en -bestrijding en antibioticabeheer: twee kanten
van dezelfde medaille bij de preventie van antimicrobiële resistentie
Infectiepreventie en -bestrijding (IPC) en antibiotic stewardship (ABS) zijn twee
belangrijke interventies om antimicrobiële resistentie te verminderen. Er is
weinig bekend over de stand van zaken van IPC en ABS in de Keniaanse context,
die beschouwd kan worden als representatief voor veel lage- en
middeninkomenslanden. Schoon water, sanitaire voorzieningen en hygiene
(WASH) zijn cruciaal voor het succes van IPC in ziekenhuizen. Het onderzoek in
dit proefschrift heeft tot doel om de status van IPC, ABS en WASH in
ziekenhuizen in Kenia te beschrijven en te analyseren, ten behoeve van het
voorkómen en terugdringen van antimicrobiële resistentie. De specifieke
doelstellingen van het onderzoek waren als volgt.
1. Het ontwikkelen van een methode om WASH en IPC in ziekenhuizen te
monitoren die op nationaal of sub-nationaal niveau kan worden toegepast.
2. Het evalueren van de organisatie van WASH- en IPC in Keniaanse provinciale
ziekenhuizen en de variatie hierin binnen één enkel volksgezondheidssysteem.
3. Het beschrijven van de kansen en uitdagingen voor de implementatie van IPC
en WASH in de COVID-19-pandemie.
4. Het evalueren van ABS activiteiten in Keniaanse ziekenhuizen om
maatregelen op regionaal en nationaal niveau te sturen.
5. Het meten van antibioticagebruik en beschikbaarheid van richtlijnen voor
antibioticagebruik in Keniaanse ziekenhuizen.
6. Zich sterk maken voor de verdere ontwikkeling en toepassing van
behandelrichtlijnen voor het verbeteren van antibioticagebruik in ziekenhuizen
in lage- en middeninkomenslanden.

356
7. Onderzoeken van de haalbaarheid van een elektronisch dataplatform voor
de evaluatie van zorg voor intramurale patiënten in Keniaanse ziekenhuizen,
met als casus de afdeling neonatologie.
Het eerste deel van dit proefschrift richt zich op Infectiepreventie en WASH.
Hoofdstuk 2 beschrijft de aanpassing van de Water Sanitation and Hygiene
Facility Improvement Tool (WASH-FIT) naar een Water Sanitation and Hygiene
Facility Improvement Tool (WASH-FAST) dat toegepast wordt op afdeling- en
instellingsniveau, inclusief het toewijzen van verantwoordelijkheden. Deze
aanpassing omvat 34 WASH-indicatoren op afdelingsniveau en 65 WASH-
indicatoren op instellingsniveau ten behoeve van openbare ziekenhuizen
(niveau 4 en 5), met indicatoren waaraan prestatiescores zijn gekoppeld.
WASH-FAST omvat ook drie niveaus van verantwoording, die gezamenlijk zijn
opgesteld met diverse belanghebbenden onder wie vertegenwoordigers van
het Ministerie van Volksgezondheid, managers verantwoordelijk voor
ziekenhuisinfectiepreventie en -bestrijding, vertegenwoordigers van
kennisinstellingen en vertegenwoordigers van niet-gouvernementele
organisaties die zich bezighouden met IPC en WASH.
Hoofdstuk 3 beschrijft een studie, gebruik makend van een enquête en diepte-
interviews, waarin WASH status werd beoordeeld in 14 openbare ziekenhuizen
met 116 afdelingen. Uit de onderzoeken kwam variatie in WASH
prestatieniveaus naar voren tussen ziekenhuisafdelingen en tussen
ziekenhuizen. De algehele scores van de ziekenhuizen varieerden tussen 47%
en 71% van de maximale score, waarbij IPC en WASH in de meeste ziekenhuizen
activiteiten met een lage status bleken te zijn. Diepte-interviews met
ziekenhuismanagers, gezondheidsfunctionarissen van de provinciale
regeringen en eerstelijnsgezondheidswerkers werden gebruikt om deze
variaties te begrijpen. De belangrijkste bevindingen waren de verschillen in de

357
bouwstaat van de ziekenhuizen, verschillen tussen ziekenhuizen in
beschikbaarheid en gebruik van middelen om WASH te verbeteren en
verschillen in aansturing en leiderschap om WASH te verbeteren. Daarnaast
bleek dat de uitbesteding van schoonmaakdiensten aan externe
dienstverleners de ziekenhuizen beter in staat stelde hun kernopdracht van
zorgverlening uit te voeren.
In hoofdstuk 4 presenteer ik hoe de opkomst van COVID-19 van invloed is op
de IPC-structuren. Uit telefonische interviews met belangrijke leiders in de
ziekenhuizen die aan het eerdere onderzoek hebben deelgenomen blijkt dat de
pandemie hiaten in de IPC-capaciteit van de ziekenhuizen bloot legt, waaronder
gebrek aan handhygiëne en afvalbeheer. Deze hiaten veroorzaakten een
groeiende angst op het oplopen van de ziekte bij de zorgverleners die zich
blootgesteld voelden. Omgekeerd leidde het ertoe dat de IPC-comités meer en
meer het initiatief namen om clinici op IPC te trainen, inclusief het gebruik van
persoonlijke beschermingsmiddelen. Daarnaast belicht ik in een commentaar
de rol die de infectiepreventiecommissies spelen bij de leiding en
verantwoording van IPC in de ziekenhuizen.
Dit hoofdstuk wordt afgesloten met een beleidsnota die is gepresenteerd aan
het Ministerie van Volksgezondheid en andere belanghebbenden, met een
overzicht van en aanbevelingen voortkomend uit het WASH / IPC-werk in Kenia.
Het tweede deel van het proefschrift is gericht op antibioticagebruik en ABS in
openbare ziekenhuizen in Kenia.
Hoofdstuk 5 beschrijft de ABS activiteiten in de deelnemende ziekenhuizen aan
de hand van een reeks van 17 indicatoren die zijn getoetst met behulp van
enquêtes en diepte-interviews. Slechts één ziekenhuis rapporteerde een
functioneel ABS programma. Belangrijkste lacunes waren het gebrek aan
financiële middelen voor ABS activiteiten en het ontbreken van richtlijnen voor

358
antibioticagebruik in de ziekenhuizen (totale score van respectievelijk 25% en
28%). In de interviews kwamen vijf hoofdthema's aan bod. Dit waren
leiderschap voor ABS, verantwoordingsplicht en deskundige ondersteuning,
levering van antibiotica, mechanismen voor monitoring en rapportage, en het
beleid en uitvoering van ABS.
Hoofdstuk 6 presenteert bevindingen van het onderzoek naar
antibioticagebruik en de beschikbaarheid van richtlijnen in de deelnemende
ziekenhuizen. Van 3590 gehospitaliseerde patiënten in de 14 ziekenhuizen
werden gegevens over antibioticagebruik verzameld in een puntprevalentie-
onderzoek. Cefalosporines en penicillines bleken het meest voorgeschreven te
worden. Er werd zeer beperkt gebruik gemaakt van laboratorium diagnostiek,
waardoor voor slechts 2 van de gehospitaliseerde patiënten bacteriologische
kweken beschikbaar waren op basis waarvan antibiotica konden worden
voorgeschreven. Uit de enquête bleek dat bij slechts 53% van de patiënten de
behandeling passend werd geacht op basis van de vooraf gedefinieerde criteria.
Behandelrichtlijnen waren alleen beschikbaar op de pediatrische en neonatale
afdelingen. De beschikbaarheid van deze behandelrichtlijnen verhoogde de
kans op een passende behandeling, Odds Ratio 6,44 [95% BI 4,81-8,64].
Het laatste deel van het proefschrift presenteert enkele praktische oplossingen
om antibioticagebruik en ABS in openbare ziekenhuizen te verbeteren.
Hoofdstuk 9 van het proefschrift beschrijft de rol die behandelrichtlijnen spelen
bij het verbeteren van diagnose en behandeling. Dit is vooral belangrijk in
gebieden met beperkte laboratorium- en specialistische ondersteuning. Hier
geef ik een aantal inzichten waarom beleidsmakers en overheden het
richtlijnontwikkelingsproces dringend moeten richten op de meest
voorkomende ziekten. Het voorbeeld van de ontwikkeling van de Keniaanse
359
basisprotocollen in de neonatologie gebruik ik om het
richtlijnontwikkelingsproces in Kenia onder de aandacht te brengen.
Hoofdstuk 8 laat zien hoe het gebruik van antibiotica kan worden verbeterd met
behulp van een goedkope elektronische dataplatform en een standaard
opnameformulier op de afdeling neonatologie. Dit onderzoek laat zien hoe de
beoordeling van routine opnamegegevens met behulp van audit- en
feedbackcycli de nauwkeurigheid van de dosering van gentamicine bij neonaten
onder de 2 kg verbeterde van 60% tot 83% accuraat in een periode van drie
jaar.
360
Acknowledgements
The success of this PhD journey has been made possible by the excellent
support offered to me by several people.
To my promoters and co-promoters, thank you all for reading through
numerous drafts and offering valuable and timely feedback to ensure I give the
best. Prof Mike English; thank you for your patience and always being open to
help and offer direction whenever I needed it. It was a pleasure having you as
a promoter. Prof Constance Schultsz; I have had the honour of working with you
through this PhD, and I enjoyed it. Thank you for always assisting me to frame
the right research questions and for the encouraging me to keep going and keep
my eye on the goal. Dr Olga Tosas Auguet; thank you for the support through
the PhD, your attention to detail came in handy during the project preparation
and execution. The thorough manuscript reviews were critical for me to ensure
I excel. Thank you, Olga! Dr Jacob Mc Knight, your expertise and
encouragement through the PhD is much appreciated. Thank you for always
reminding me to take each day at a time and give my best. You taught me to
keep my head up even when things were not working as I had planned or
hoped. That is a lesson I will carry through life.
To all the co-authors and collaborators on this project, thank you for your time
and professional input to produce this work. I believe the findings from this
work will go a long way in improving infection prevention and antibiotic
stewardship in Kenya and beyond.
Thank you to IDeAL and the KEMRI Wellcome Trust Research Programme for
funding my PhD training and offering professional support through training and
mentorship. For my colleagues and fellow students at the programme, thank
you for always being available to offer your skills whenever I needed assistance.

361
A special thank you to Paul Mwaniki for teaching and supporting me through
the data analysis.
A special mention to my dear wife Nduku Michuki and our wonderful boys
Ethan and Ryan for being patient with me and encouraging me to keep going
even in the tough times. Thank you Nduku for reading through my work and for
ensuring all the commas and full stops were in the right places. Thank you, guys
for the love. This is a win for all of us!
To my parents, brothers and sisters, thank you for the prayers and kind words
through this PhD journey and the immense support through the years.
Without the support of the skilled health workers and hospital staff who work
tirelessly to provide high-quality care in our hospitals, this work would not have
been possible. I want to thank you all for the sacrifices you make to serve our
citizens.
I would also like to appreciate the defense committee for reviewing and
recommending this thesis for defense at the University of Amsterdam.
I may not be able to mention everyone who made this PhD possible; please
receive my sincere gratitude for the support.
To God almighty, thank you for life, opportunity, peace and a sound mind.

362
PhD Portfolio
PhD student: Jackson Michuki Maina
Period: May 2018 – October 2020
PhD supervisors: Prof Constance Schultsz, Prof Mike English, Dr Olga Tosas-
Auguet, Dr Jacob McKnight
1. PhD training
Year Workload
(Hours)
Courses
Writing in the sciences online course hosted by the
University of Stanford. 2018 80
Communication and consenting in research
workshop hosted by the ethics department, KEMRI
Wellcome Trust Research Programme. Kilifi, Kenya.
2018 32
Paediatric Advanced Life Support (PALS) offered by
the department of paediatrics, Aga Khan university
hospital. Nairobi, Kenya.
2018 25
Introduction to qualitative research methods and
data analysis by the KEMRI Wellcome Trust data
team. Nairobi, Kenya.
2018 32
Statistical analysis in R online training hosted by
the data camp group. 2018 100
Implementation science for diseases of online
poverty course offered by the WHO Special
Programme for Research and Training in Tropical
Diseases (TDR).
2018 80

363
Introduction to global health research online
course by the University of Melbourne. 2019 80
Advanced epidemiological analysis at the London
School of Hygiene and Tropical Medicine. London,
UK.
2019 85
Scientific writing and publication course by the
training department at the KEMRI Wellcome Trust
Research Programme. Nairobi, Kenya.
2019 16
Clinical leadership and management offered by the
Oxford executive coaching group. Nairobi, Kenya. 2019 15
Certificate in project management online course by
the University of Washington. 2020 90
Seminars, workshops and masterclasses
Weekly (4 Hrs/Month) scientific seminars and
journal clubs at the KEMRI Wellcome Trust
Research Programme. Nairobi, Kenya.
2018-
2020 144
KEMRI Wellcome Trust Research Programme,
social science group annual workshop. Theme:
Power and intersectionality. Nairobi, Kenya.
2019 15
PhD students day convened at the University of
Oxford. Oxford, UK.
2018
&19 16
KEMRI Wellcome Trust Research Programme, PhD
students, retreat. Kilifi, Kenya. 2019 25
KEMRI Wellcome Trust Research Programme, staff
workshop on disaster management. Nairobi,
Kenya.
2019 8
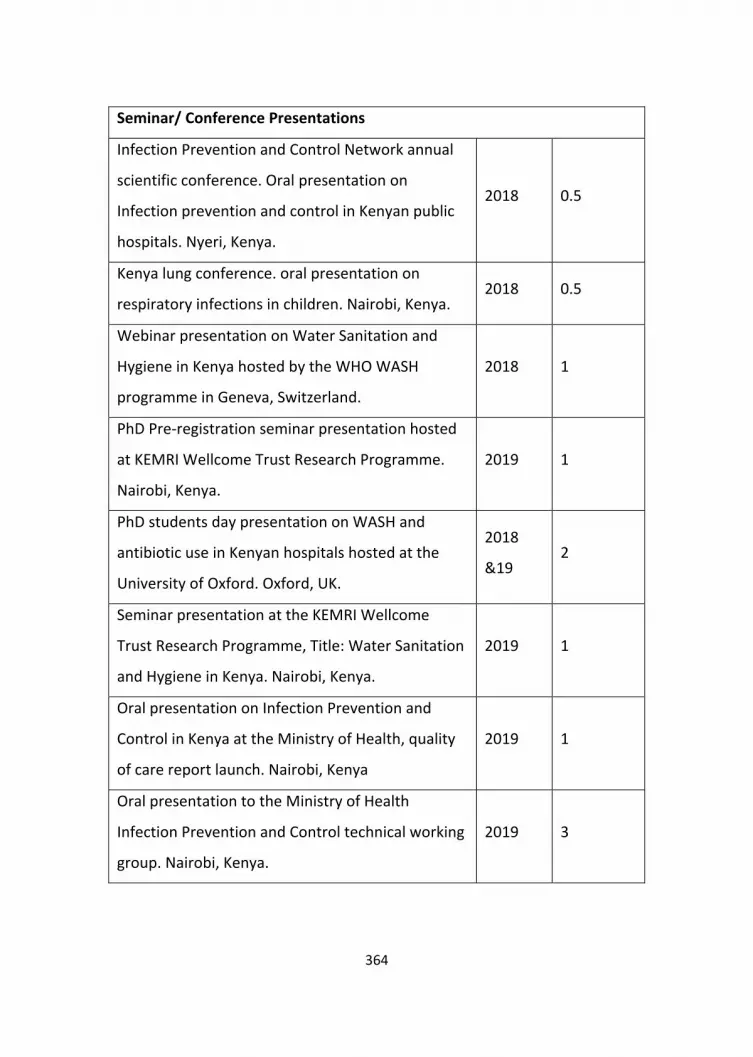
364
Seminar/ Conference Presentations
Infection Prevention and Control Network annual
scientific conference. Oral presentation on
Infection prevention and control in Kenyan public
hospitals. Nyeri, Kenya.
2018 0.5
Kenya lung conference. oral presentation on
respiratory infections in children. Nairobi, Kenya. 2018 0.5
Webinar presentation on Water Sanitation and
Hygiene in Kenya hosted by the WHO WASH
programme in Geneva, Switzerland.
2018 1
PhD Pre-registration seminar presentation hosted
at KEMRI Wellcome Trust Research Programme.
Nairobi, Kenya.
2019 1
PhD students day presentation on WASH and
antibiotic use in Kenyan hospitals hosted at the
University of Oxford. Oxford, UK.
2018
&19 2
Seminar presentation at the KEMRI Wellcome
Trust Research Programme, Title: Water Sanitation
and Hygiene in Kenya. Nairobi, Kenya.
2019 1
Oral presentation on Infection Prevention and
Control in Kenya at the Ministry of Health, quality
of care report launch. Nairobi, Kenya
2019 1
Oral presentation to the Ministry of Health
Infection Prevention and Control technical working
group. Nairobi, Kenya.
2019 3

365
Oral presentation/ webinar at the WHO quality of
care network, Geneva, Switzerland.
Webinar link:
http://www.qualityofcarenetwork.org/webinars/re
cording-and-materials-webinar-wash-quality-care-
kenyan-hospitals.
2020 1
(Inter)national conferences
Oral presentation and attendance at the crossing
boundaries conference at the University of Oxford.
Oxford, UK.
2018 15
Attended the Kenya Paediatric Association (KPA)
annual scientific conference and facilitated
breakout sessions on research in paediatrics.
Mombasa, Kenya.
2018 35
Poster presentation African Academy of Science
(AAS) international conference. Dakar, Senegal. 2019 25
Risk factors for neonatal sepsis in low resource
settings stakeholders technical meeting hosted by
the Centers for Disease Control (CDC). Atlanta,
USA.
2019 25
KEMRI annual scientific conference was in
attendance and gave an oral presentation on
Infection Prevention and Control strategies in
Kenyan hospitals. Nairobi, Kenya.
2020 25
Others – Policy Engagement

366
Member and attendee of the Ministry of Health,
Infection Prevention and Control technical working
group meetings.
2018
&19 18
Attended a meeting hosted by the Ministry of
Health to discuss strategies for sensitization of
health workers on antimicrobial resistance.
Nairobi, Kenya.
2019 8
2. Teaching Year Hours
Lecturing
Diploma in Tropical Medicine and Hygiene
(DTM&H). London School of Hygiene and Tropical
Medicine.
(Teaching ETAT+ and Newborn Care Scenarios).
Kampala, Uganda.
2017 &
19
40
The University of Nairobi, The Partnership for
Health Research Training in Kenya (P-HERT);
Systematic review course conducted yearly in
March-July. Nairobi, Kenya.
2018
&19 12
Faculty providing training for health care workers
on a programme to improve the safe use of oxygen
in public hospitals in Kenya under the Clinton
Health Access Initiative (CHAI). Nairobi, Kenya.
2019 &
20 122
Teaching University of Nairobi, paediatric residents
and faculty on systematic reviews on the weekly
journal club. Online teaching series in April 2020.
2020 2

367
Emergency Triage and Treatment (ETAT+) course
faculty. Nairobi, Kenya. 2019 25
Kenya Medical and Dentists Practitioners Council
(KMPDC), external examiner
(6 Days /Year). Nairobi, Kenya.
2018-
2020 50
3. Parameters of Esteem
Year
Awards and Prizes
Appointed into the Kenya Ministry of Health technical working
group on Infection Prevention and Control.
Best oral presentation KEMRI annual scientific conference.
Nairobi Kenya.
2019
2020
Leadership
PhD students representative- KEMRI Wellcome Trust
Programme. Nairobi, Kenya.
2019
4. Publications
Kebaya LMN, Kiruja J, Maina M, Kimani S, Kerubo C, McArthur
A, et al. Basic newborn resuscitation guidelines for healthcare
providers in Maragua District Hospital: a best practice
implementation project. JBI database of systematic reviews
and implementation reports. 2018;16(7):1564-81.
Maina M, Aluvaala J, Mwaniki P, Tosas-Auguet O, Mutinda C,
Maina B, et al. Using a common data platform to facilitate
audit and feedback on the quality of hospital care provided to
sick newborns in Kenya. BMJ Glob Health. 2018;3(5): e001027.
2018

368
Morgan MC, Maina B, Waiyego M, Mutinda C, Aluvaala J,
Maina M, et al. Pulse oximetry values of neonates admitted
for care and receiving routine oxygen therapy at a resource-
limited hospital in Kenya. Journal of paediatrics and child
health. 2018;54(3):260-6.
Maina M, Tosas-Auguet O, McKnight J, Zosi M, Kimemia G,
Mwaniki P, et al. Extending the use of the World Health
Organisations' water sanitation and hygiene assessment tool
for surveys in hospitals - from WASH-FIT to WASH-FAST. PLoS
One. 2019;14(12): e0226548.
Maina M, Tosas-Auguet O, McKnight J, Zosi M, Kimemia G,
Mwaniki P, et al. Evaluating the foundations that help avert
antimicrobial resistance: Performance of essential water
sanitation and hygiene functions in hospitals and
requirements for action in Kenya. PLoS One. 2019;14(10):
e0222922.
McKnight J, Maina M, Zosi M, Kimemia G, Onyango T, Schultsz
C, et al. Evaluating hospital performance in antibiotic
stewardship to guide action at national and local levels in a
lower-middle-income setting. Global health action.
2019;12(sup1):1761657.
Roberts DJ, Njuguna HN, Fields B, Fligner CL, Maina J, Zaki SR,
Keating MK, et al. Comparison of Minimally Invasive Tissue
Sampling with Conventional Autopsy to Detect Pulmonary
Pathology Among Respiratory Deaths in a Resource-Limited
2019

369
Setting. American journal of clinical pathology.
2019;152(1):36-49.
Njuguna HN, Zaki SR, Roberts DJ, Fligner CL, Maina J Keating
MK, Rogena E, et al. Determining the Cause of Death Among
Children Hospitalized with Respiratory Illness in Kenya:
Protocol for Pediatric Respiratory Etiology Surveillance Study
(PRESS). JMIR Res Protoc [Internet]. 2019 2019/01//; 8(1):
[e10854 p.]
Maina M, Mwaniki P, Odira E, Kiko N, McKnight J, Schultsz C,
et al. Antibiotic use in Kenyan public hospitals: Prevalence,
appropriateness and link to guideline availability.
International Journal of infectious diseases 2020. 99: p. 10-18.
Maina M, Tosas-Auguet O, English M, Schultsz C, McKnight J.
COVID-19: an opportunity to improve infection prevention
and control in LMICs. The Lancet Global Health
Maina M, Tosas-Auguet O, English M et al. Infection
prevention and control during the COVID-19 pandemic:
challenges and opportunities for Kenyan public hospitals
[version 1; peer review: 1 approved]. Wellcome Open
Res 2020, 5:211
(https://doi.org/10.12688/wellcomeopenres.16222.1)
2020
Other Publications
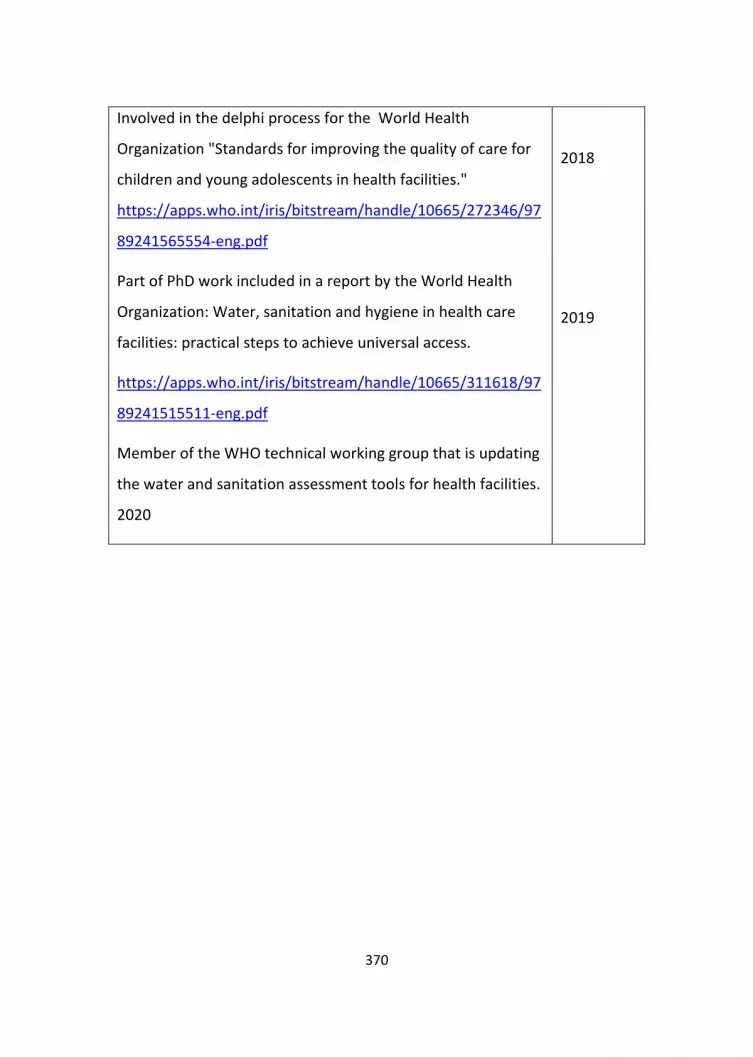
370
Involved in the delphi process for the World Health
Organization "Standards for improving the quality of care for
children and young adolescents in health facilities."
https://apps.who.int/iris/bitstream/handle/10665/272346/97
89241565554-eng.pdf
Part of PhD work included in a report by the World Health
Organization: Water, sanitation and hygiene in health care
facilities: practical steps to achieve universal access.
https://apps.who.int/iris/bitstream/handle/10665/311618/97
89241515511-eng.pdf
Member of the WHO technical working group that is updating
the water and sanitation assessment tools for health facilities.
2020
2018
2019
2020

371
RESUME
Biodata
Name: Dr Jackson Michuki Maina
Date of Birth: 29th July 1982
Personal Statement
Michuki is committed to professional and academic excellence that enables
him to participate in and undertake health research and teaching to improve
newborn, child and adolescent health in Kenya.
Academic Qualifications
Qualification Institution Year
PhD Candidate University of Amsterdam 2018 – Present
Master of Medicine (MMed) in Paediatrics and child health
University of Nairobi 2011-2014
Master of Public Health (MPH)
Moi University/ African Medical Research Foundation (AMREF) 2010-2014
Bachelor of Medicine and Surgery (M.B Ch.B.)
University of Nairobi, September
2002-2007
Professional Experience
Role Institution Year Research paediatrician/ PhD fellow
KEMRI/Wellcome Trust Research Programme
2014- Present
Consultant paediatrician
Maria Immaculate Hospital/ AAR Healthcare
2014-Present
Honorary consultant paediatrician
Kenyatta National Hospital 2015- 2017
Medical doctor AAR Healthcare November 2009-July 2014
Medical officer Ministry of Health- Embu Level 5 Hospital
January 2009 –October 2009

372
Additional Training
Instructor Emergency Treatment and Triage plus Admission (ETAT+), March
2015.
Paediatric Advanced Life Support (PALS), February 2018.
Qualitative research methods training KEMRI Wellcome Trust Research
Programme. February 2018.
Scientific writing and publication Course KEMRI Wellcome Trust Research
Programme February 2018.
Statistical analysis in R online training May 2018.
Introduction to global health research. University of Melbourne (Online 8
weeks course).
Advanced epidemiological analysis, London School of Hygiene and Tropical
Medicine 9th -20th September 2019.
Implementation science training by the World Health Organization 2019 (8
weeks).
University of Washington project management for global health online 11-
week course January – March 2020.
Teaching Experience
Part of the faculty that provides teaching on systematic reviews to faculty and
postgraduate students at the University of Nairobi school of medicine under
The Partnership for Health Research Training in Kenya (P-HERT) (Course
conducted yearly in March-July from 2017).
Faculty providing training for health care workers on a programme to improve
the safe use of oxygen in public hospitals in Kenya under the Clinton Health
Access Initiative ( October- November 2019).
Teaching on the London School of Hygiene and tropical medicine East Africa
Diploma in Tropical medicine in Uganda course in November since 2017.
Course director on the generic instructors course for the Emergency Triage and
Treatment Programme December 2017 – 2019.
Teaching paediatric residents and faculty on systematic reviews on the weekly journal
club. April 2020.

373
Research grants awarded
Initiative to Develop Research Leaders in Africa. Grant award for PhD training
amount GBP 100,000 by the Africa Academy of Science. October 2017.
Roles and Awards
Hillman award for outstanding leadership skills (the University of Nairobi,
Department of Paediatrics and Child Health 2014.
WHO global consultant on paediatric quality of care 2017.
Member on the national Ministry of Health Infection Prevention and Control
technical working group 2018- Present.
Kenya Medical and Dentists Practitioners Council external examiner -2015-
Present.
Best oral presentation KEMRI annual scientific conference February 2020.
Membership and Affiliations
Registered medical practitioner and consultant paediatrician by the medical
practitioners and dentist’s council Kenya.
Member Kenya paediatric association.
Member of the European Society of Paediatric Infectious Diseases (ESPID).
Medical Missions Africa- Volunteer paediatrician.
Interests and hobbies
Music- Guitar playing and sport-recreational runner.

374


