Embed Size (px)
Citation preview
JOURNAL OF GEOPHYSICAL RESEARCH, VOL. 106, NO. B3, PAGES 4079-4090, MARCH 10, 2001
Influence of pore fluid chemistry on the complex conductivity and induced polarization responses of Berea sandstone
David P. Lesmes and Kevin M. Frye 1 Department of Geology and Geophysics, Boston College, Chestnut Hill, Massachusetts
Abstract. The spectral induced-polarization (IP) response of rocks and soils is a complex function of pore solution chemistry, sample microgeometry, and surface chemical properties. We measure the complex conductivity and the time domain IP responses of Berea sandstone as a function of pore fluid ionic strength and pH. Complex conductivity is measured over the frequency range 10 -3 to 106 Hz, and chargeability is computed using a time window of 0.16 to 1.74 s. The field IP parameters: phase, percent frequency effect, and chargeability are functions of both the surface and bulk electrical properties of the sample and are observed to decrease with increasing solution conductivity. Dividing these parameters by the sample resistivity yields normalized IP parameters (quadrature conductivity, metal factor, normalized chargeability) that are proportional to the imaginary component of the complex surface conductivity. Normalized IP parameters increase with ionic strength up to concentrations of 10 -1 M NaC1 and show a reduced response at pH 3, the point of zero charge for quartz-dominated systems. For concentrations > 10 -1MNaC1, the normalized parameters decrease with increasing concentration. This decrease in surface polarization may indicate a decrease in the effective mobility of polarizing charges at high solution concentration. Our data indicate that normalized IP parameters are directly related to the physiochemical parameters that control the surface conductivity responses of rocks and soils. Normalization of IP measurements in environmental investigations should increase the effectiveness of IP surveys, especially in high-conductivity environments.
1. Introduction
Traditional "dc" resistivity surveys are primarily sensitive to the pore solution conductivity, the formation porosity, and the saturation. Resistivity surveys are used in environmental applications to map the distribution of contaminants and to characterize lithologic variations. However, resistivity methods often are not sensitive enough to detect small concentrations of toxic contaminants, and they are not very effective for predicting the hydraulic properties of the formation [Olhoefi, 1985; Ward, 1990].
Induced polarization (IP) methods are more sensitive to the surface chemical properties of rocks and soils. IP methods are often an effective means of mapping subsurface contamination in cases where dc resistivity methods are ineffective [Sadowski, 1988; Cahyna et al., 1990; B6rner et al., 1993]. Furthermore, IP methods can also be used to predict the hydraulic properties of subsurface formations [B6rner et al., 1996; Sturrock, 1999; Sturrock et al., 1999]ß Further advances in the application of IP methods to the characterization and quantification of geochemical and hydrological properties will rely on a better understanding of the physiochemical processes which control the IP response of rocks and soils [e.g., Ward e! al., 1995].
•Now at Department of Earth, Atmospheric, and Planetary Sciences, Massachusetts Institute of Technology, Cambridge.
Copyright 2001 by the American Geophysical Union.
Paper number 2000JB900392. 0148-0227/01/2000JB900392509.00
The IP response of rocks and soils is controlled by electrochemical polarization mechanisms that are a function of the surface chemical and the microgeometrical properties of the sample. In earth materials containing water, ions from the saturating solution are attracted to the mineral surface, which usually has negative net surface chargeß These ions form an electric double layer (EDL) that consists of a fixed layer of charge that is chemically adsorbed to the grain surface and a diffuse layer of charge that extends into the pore space. When an electric field is applied to the material, the ions in the EDL migrate tangentially to the grain surfaces and the grains become polarized. The polarization of the EDL leads to a frequency-dependent complex surface conductivityß This surface conductivity is a function of the surface charge density, the surface ionic mobility, and the grain size distribution [Lima and Sharma, 1992' Lesmes and Morgan, 2001]. The complex surface conductivity is usually assumed to add in parallel with the bulk electrical properties of the sample.
Commonly measured field IP parameters, such as phase, percent frequency effect, and chargeability, are dependent upon both the surface and bulk electrical properties of the material [Marshall and Madden, 1959; Collett and Katsube, 1973; Van Voorhis e! al., 1973; Vinegar and Waxman, 1984]. Dividing the field IP parameters by the formation resistivity, or multiplication by the formation conductivity, yields the r,,• .... ;*"• normalized TD parameters l%Jll%J ¾¾ Ill s
metal factor, and a normalized chargeability called "specific capacity" [Marshall and Madden, 1959; Keller, 1959]. These normalized IP parameters are more sensitive to the surface chemical properties of the sample and therefore are more
4079
4080 LESMES AND FRYE: PORE FLUID CHEMISTRY DEPENDENCE OF IP
effective for characterizing geochemical and lithological variability.
In this investigation we measure the time domain and broadband frequency domain IP responses of Berea sandstone as a function of the bulk solution ionic strength and pH. We verify the equivalence of the time domain and frequency domain data and argue that IP parameter normalization is necessary to isolate the surface conductivity effects, especially at high solution conductivity. We find that pH effects are secondary to ionic strength effects. Surface conduction increases with ionic strength to a maximum value at 10 -• M NaC1, then decreases at higher ionic strengths. We attribute this maximum in surface conductivity to a trade-off between increasing surface charge density and decreasing surface ionic mobility with increasing ionic strength.
2. Complex Conductivity
The conduction current density Jc and the electric displacement D are related to the applied electric field E by the constitutive equations
Jc =eeE (1)
D = xcoE, (2)
where Co is the permittivity of free space, x is relative permittivity, or dielectric constant, and cr is electrical conductivity. For time harmonic fields the displacement current density Jv may be expressed as
0D JD = • = iwX'•oE (3)
c•t '
where x' is the real component of complex relative permittivity, co is the angular frequency of the applied electric field, and i is ,•-. The total current density J*=Jc+Jv can be expressed as
J* = (ee'+iwtc'oco)E = (ee'+iee")E, (4) where ee* is the complex conductivity and ee' and ee" denote the real and imaginary (or in-phase and quadrature) components of conductivity, respectively. The complex conductivity can also be expressed in polar form as a magnitude (I ee*l) and a phase (•:
ee* =1 ee I exp(i0). (5) Alternatively, the intrinsic electrical properties can be
represented b• a complex resistivity rio*) or a complex permittivity (c):
* [ *
ee = -•-= iwz . (6)
Generally, the complex electrical properties of earth materials are frequency-dependent.
3. Complex Conductivity Models
Theoretically based effective medium theories can be used to model the complex electrical properties of porous media. These models are formulated in terms of the intrinsic
electrical properties of the mixture and the shape of the embedded particles. Two-phase mixing models consisting of dry mineral grains and pore fluid (e.g., quartz and brine) can be used to predict the low-frequency conductivity and the high-frequency permittivity of rocks and soils [Sen et al.,
1981; Mendelson and Cohen, 1982]. However, the migration and polarization of ions within the EDL control the frequency dependence of the complex conducti(,ity response. Therefore three-phase mixing models that account for the electrical properties of the surface phase are required to predict the large dispersions that are observed in the permittivity and conductivity responses of water saturated samples [Bussian, 1983; Knight and Endres, 1990; Samstag and Morgan, 1991 ].
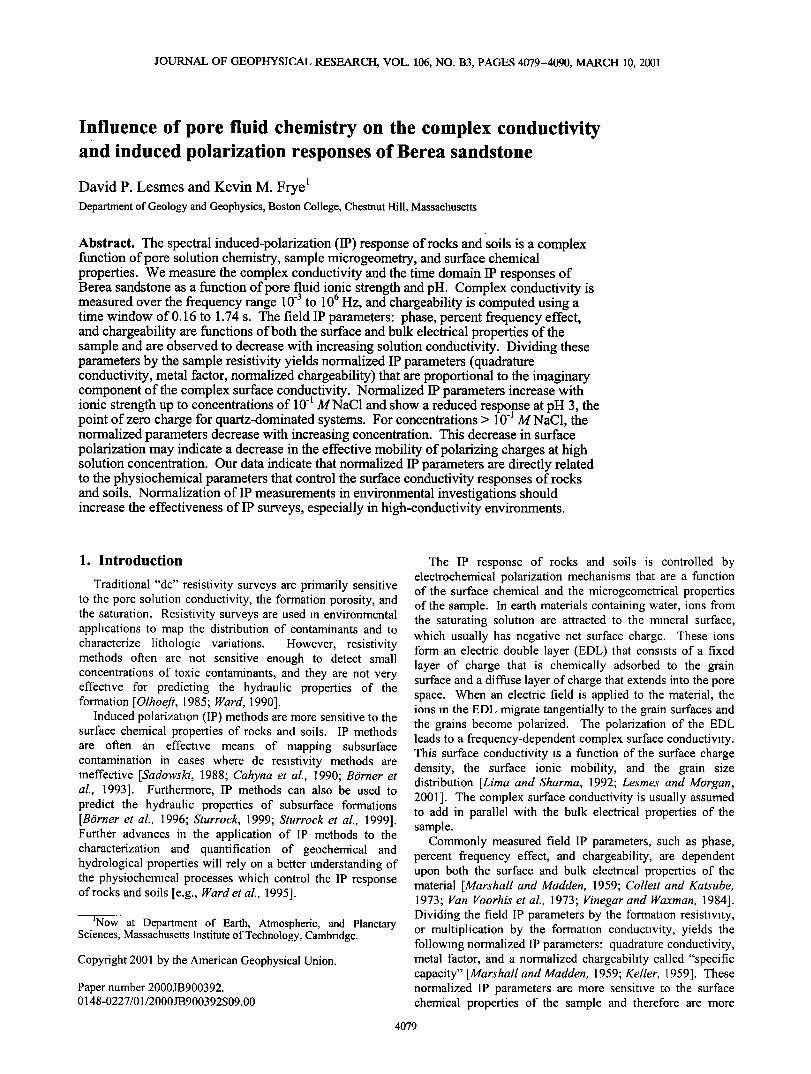
A more simplistic alternative is to model the bulk conductivity and surface conductivity mechanisms as parallel conduction paths [Wyllie and Southwick, 1954; Marshall and Madden, 1959; Waxman and Smits, 1968; Clavier et al., 1984; Vinegar and Waxman, 1984]. Using the parallel equivalent circuit shown in Figure l a, the complex conductivity response of the sample is given by
•: . II
ee = (O'bulk + ico•Coooc0)+ [Or'surf(co ) + teesurf(co)]. (7) In this model, eebu•k and n:© represent the low-frequency conductivity and the high-.frequency dielectric constant of the bulk rock sample, and O'surf(CO) and O:'surf(C0) are real and
a.) O'bulk
I I
b.)
Crbulk + Crsurf (co)
ii
Crsuf (co)
Olowfre q •'
i!
cr surf !
Crbulk + Crsurf (co)
Figure 1. (a) Equivalent circuit model for the electrical response of rocks and soils. Electrolytic conduction in the bulk pore fluid is assumed to be purely resistive, the high- frequency dielectric constant <© represents the capacitance of the system at high frequency, and the complex conductivity associated with "ee'surf (co)" accounts for low-frequency IP effects. (b) The relationship between the measured low- frequency phase (a) and the real and imaginary components of the complex conductivity [after Vinegar and Waxman, 1984].
LESMES AND FRYE: PORE FLUID CHEMISTRY DEPENDENCE OF IP 4081
quadrature surface conductivity terms. Combining the real and the imaginary components in (7) gives
O'* = [O'bulk + O"suff ((O)] +/[co•%oC0 + cr'•urf (co)]. (8) At low frequencies, where IP phe,,nomena are typically measured in the field, co a:ooc0<<O-s,rr(co) and the low- frequency complex conductivity response of the sample is given by
O'* = [O'bulk + O"suff((O)] +/O'surf(CO ). (9) The quadrature conductivity is only a function of the surface conductivity, whereas the in-phase conductivity is a function of both the bulk and surface conductivity mechanisms. The vector diagram in Figure lb shows how the sample phase is related to the real and imaginary components of the complex conductivity.
The bulk rock properties O-bulk and Woo are independent of frequency. These parameters can be derived from the Hanai- Bruggeman (HB) effective medium theory [Sen et al., 1981]. The low-frequency conductivity response of the HB model is given by
O. bulk = O.w½ •m, (10) where Crw is the solution conductivity, ½ is the porosity, and m is the cementation index which is a function of the effective
grain shape. This relationship is called Archie's law as it was first derived empirically by Archie [1942]. The high- frequency dielectric response of the HB model is given by
/ / m 1-Wg/W w K'øø = K'wOm 1-•Cg/Woo ' (l 1)
where Ww and wg are the dielectric constants of the pore solution and the mineral grains, respectively.
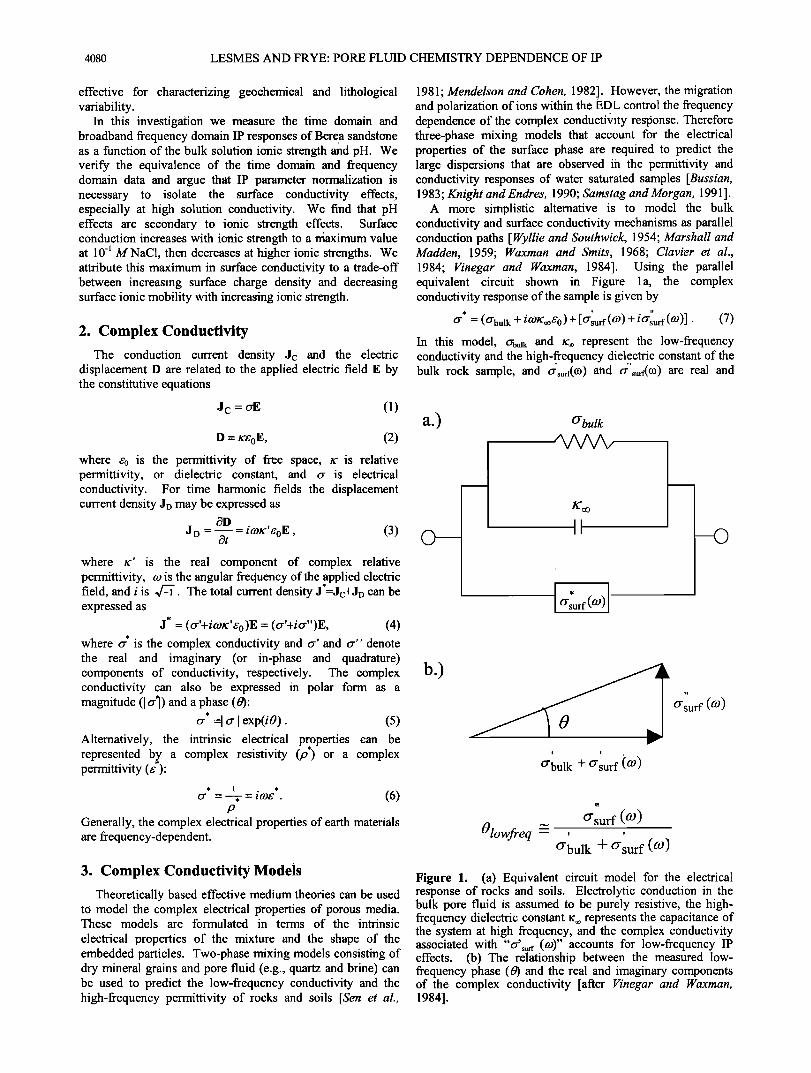
The complex surface conductivity term O'*s,rf(CO) iS frequency-dependent, and it arises from the electrochemical polarization of the water-wet rock matrix. At very low frequencies where the permittivity response approaches a constant value (/Cstat,c in Figure 2) the imaginary component of surface conductivity goes to zero, and the real component of surface conductivity approaches a constant value %,,-r(dc). The dc component of surface conductivity is given by
lim O-'surf (6o) = Crsurr(dc ) = e/tsEøSø (12) where e is the electronic charge, /ix is the effective surface ionic mobility, H0 the mineral surface charge density, So is a weighted surface-to-volume ratio, and f is a geometric factor that characterizes the "tortuosity" of the grain/pore interface [e.g., Johnson et al., 1986; Pride, 1994; Revil and Glover, 1998]. As frequency increases, the real and imaginary components of the surface conductivity also increase. The complex surface conductivity response can be represented by the product of the dc surface conductivity and a spectral response function 3 [co,g(r),/ts]'
* e/UsEøSø 3*[co, g(r),/ts]. (13) Crsurf (co) = f .7 [co,g(r),3ts]iS obtained by convolving the response of the electrochemical polarization of the fixed and diffuse parts of the EDL for a single grain/pore of radius r with the distribution of grain/pore sizes g(r) [Lesmes, 1993; Lesmes and Morgan, 2001; Lesmes et al., 2000]. The magnitude of the complex conductivity response is primarily determined by the product of So, H0, and/•. The frequency dependence of
the complex conductivity response is primarily a function of the grain/pore size distribution [Sturrock, 1999; Sturrock et al., 1999; Lesmes et al., 2000].
3.1. Field IP Parameters
The IP phenomenon measured in the field is essentially a low-frequency dispersion in the complex conductivity response. In the time domain this dispersion manifests itself as a transient secondary voltage that exists in the material after the interruption of an externally applied dc current. The dispersion in the electrical response is controlled by physiochemical polarization mechanisms that result in a broad distribution of relaxation times. Full characterization of the
electrical properties of a sample requires that the complex
0.080
0.079
0.078
0.077
0.076
0.075
0.074
10 -2
ß 4 electrode measurement system I /x 2 electrode measurement system
static
•---2 electrode----• -•----4 electrode •
, ,,,,,.,I , ,,,.,,,I , ,,,,,,,I . .,•,,.,1 • ,,•,,,,I , ,,,,.,.I •,,.,,,,I , .,,,,,,I , ,,,,M , •,,,,.1 ,,,,,,
10 -3
10 -4
10 9 (c.)
107 static -• 10 5 :
10 3
101 ........ , ......... 10 -4 10 '2 10
frequency (Hz)
Figure 2. Real component of (a) formation conductivity, (b) quadrature conductivity, and (c) dielectric constant of Berea sandstone saturated with pH 8, 10 -• M NaC1 solution. Low- frequency limits of dielectric constant and conductivity are labeled K'static and I•Ystatic. High-frequency limit of the dielectric constant is labeled
4082 LESMES AND FRYE: PORE FLUID CHEMISTRY DEPENDENCE OF IP
conductivity response be measured over a wide range of frequencies so that the entire distribution of relaxation times can be captured [Lesmes and Morgan, 2001 ]. The equivalent characterization in the time domain requires that the voltage decay be measured for a long duration with a very fast sampling rate. It is possible to make these broadband electrical impedance measurements in the laboratory [e.g., Olhoefi, 1986; Lesmes, 1993]; however, practical considerations and technical limitations such as
electromagnetic (EM) coupling make it essentially impossible to capture the full relaxation time distribution in the field [Pelton et al., 1978].
Field IP surveys can be conducted using complex resistivity (CR), frequency domain IP, or time domain IP measurement systems. All of these systems are operationally similar to the dc resistivity method. However, in addition to measuring the conductive properties of the media, IP systems also measure, either directly or indirectly, the surface chemical properties of the media.
CR instruments measure the resistivity amplitude and phase. CR measurements made as a function of frequency are called spectral induced polarization (SIP). SIP surveys characterize the dispersions in both the conductive and capacitive properties of the subsurface. The CR phase for earth materials is typically small, and it is given by
0 = tan-•(cr"/or ') • cr"/cr'. (14) The CR phase is essentially the ratio of the capacitive to conductive properties of a material.
Frequency domain IP methods measure the conductivity at two or more frequencies. A common frequency domain parameter is the percent frequency effect (PFE):
PFE = 100 or(col ) - or(co 0) (15) ß
(co0) PFE is the relative dispersion in the conductivity response measured between a low frequency (COo) and a higher frequency (col). The PFE values reported in this paper were calculated from conductivity measurements made at 1 and 10 Hz.
Time domain surveys measure the response of a sample to an applied direct current that is switched on and off. The apparent resistivity (,o,) is computed from the direct current measurements. Application of the current polarizes the material, and a decay voltage is observed when the current is removed. The voltage decay curve is used to quantify the IP response. One measure of the time domain IP response is the integral chargeability (M), which is defined as [e.g., Ward, 1990]:
tl
M = Vmax (q _ to) (t)dt. (16) to
V(t) is the potential difference measured at a time t after the current is shut off, Vmax is the maximum potential difference measured during current transmission, and to and t• define the time window over which the voltage decay curve is integrated. We sampled the voltage decay curve from 0.16 to 1.74 s after the current was switched off. This time window
represents a bandwidth similar to that of our frequency domain parameter, PFE, and is used as a default setting in the IRIS © ELREC T field IP system.
The proportionality between the CR phase, PFE, and M is both theoretically and experimentally well established [Seigel, 1959; Marshall and Madden, 1959; Madden and Cantwell,
1967; Collett and Katsube, 1973; Van Voorhis et al., 1973; $huey and Johnson, 1973; Bertin and Loeb, 1976; Wait, 1984; Vinegar and Waxman, 1984]. These field IP parameters effectively measure the ratio of the capacitive to conductive properties of the material at low frequencies. The low- frequency capacitive component is primarily controlled by electrochemical polarization mechanisms, whereas the low- frequency conductive component is primarily controlled by electrolytic conduction in the bulk pore solution. Therefore the field IP parameters are sensitive to the ratio of surface conductivity to bulk conductivity effects.
3.2. Normalized IP Parameters
To isolate the surface conductivity effects, the field IP parameters can be weighted by the measured formation conductivity. It is clear from (14) that multiplication of the sample phase by the measured conductivity yields the quadrature conductivity (or the imaginary component of the complex conductivity). Marshall and Madden [1959] observed that PFE was negligible in matehals saturated with high-conductivity pore fluids. They suggested a frequency domain IP parameter normalized for pore fluid resistivity, the metal factor (MF):
MF = 2ar103pFEcr(co0), (17) where the conductivity was to be measured in units of mhos per foot (S/foot). The MF is proportional to the conductivity dispersion measured between two frequencies:
ME = a[cr(coi ) - cr(COo ) ] , (18) where a=2rc 10 s if conductivity is measured in units of S/foot. However, if conductivity is measured in units of S/m, then a=2(0.305)rc10 s. To avoid this outdated and complicated nomenclature, we report our "metal factor" measurements as MF/a, which is equal to the conductivity dispersion measured in units of S/m. Keller [1959] proposed a similar normalization for the time domain chargeability parameter:
, M MN = Mcr • . (19)
Pa
Keller called this normalized chargeability the "specific capacity." We also report our normalized chargeability measurements in units of S/m. The normalized IP parameters help to isolate information about surface chemical processes, especially in samples with high pore fluid conductivity.
4. Experimental Procedure
Complex conductivity of Berea sandstone was measured from 10 -3 to 106 Hz. NaC1 brines were prepared with deionized, degassed water. The saturating solution was introduced to an evacuated chamber containing dried Berea sandstone in accordance with Society of Core Analysts (SCA) guidelines [Lerner et al., 1990; Maerefat et al., 1990; Worthington et al., 1990]. Low-frequency measurements (10 -3 to 103 Hz) were performed in a four-electrode sample holder, and high-frequency measurements (20 Hz to 106 Hz) were performed in a two-electrode sample holder. The two measurement systems provide sufficient overlap to characterize the entire range of frequencies.
4.1. Description of Apparatus
Two electrode measurements were performed with platinum-black electrodes and a Hewlett-Packard 4284A LCR impedance meter. Open and short circuit calibrations were
LESMES AND FRYE: PORE FLUID CHEMISTRY DEPENDENCE OF IP 4083
made with the impedance meter to compensate for stray impedance effects associated with the sample cell and the connecting wires. The instrument makes a logarithmic sweep through the frequency range and records values for impedance and phase.
When the electrodes are in contact with the electrolytic solution, an additional impedance is placed in series with the sample, such that
Ztota 1 = 2 s + Ze , (20)
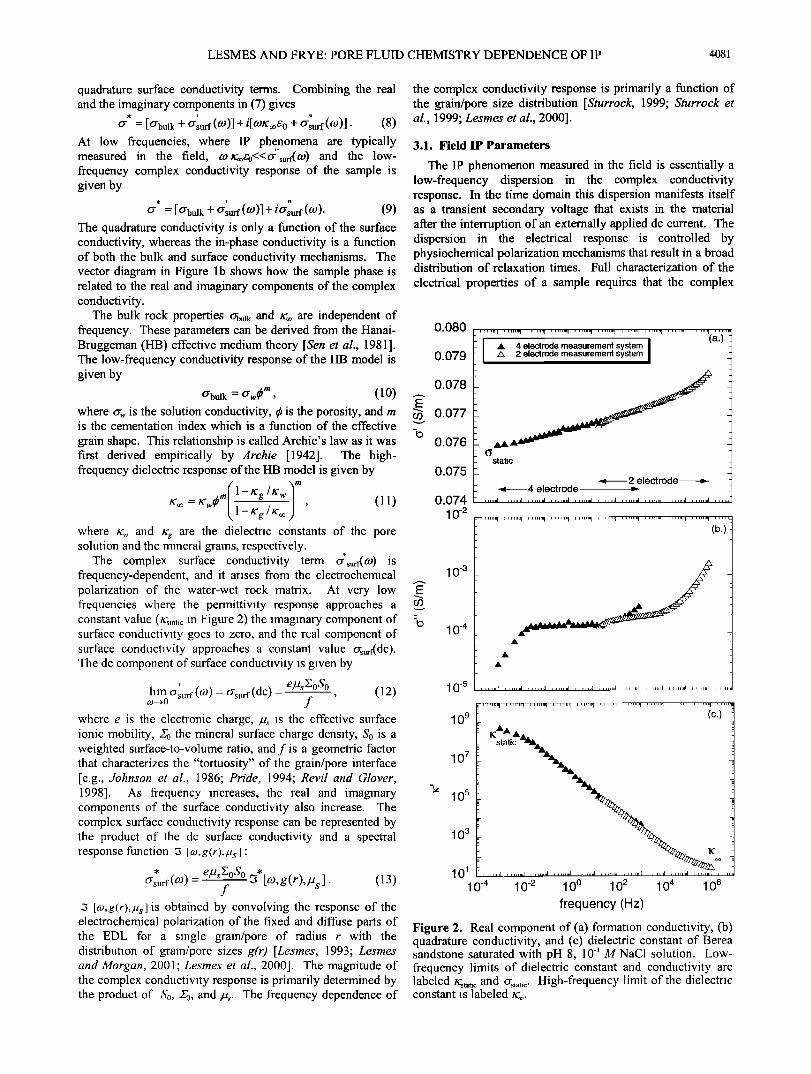
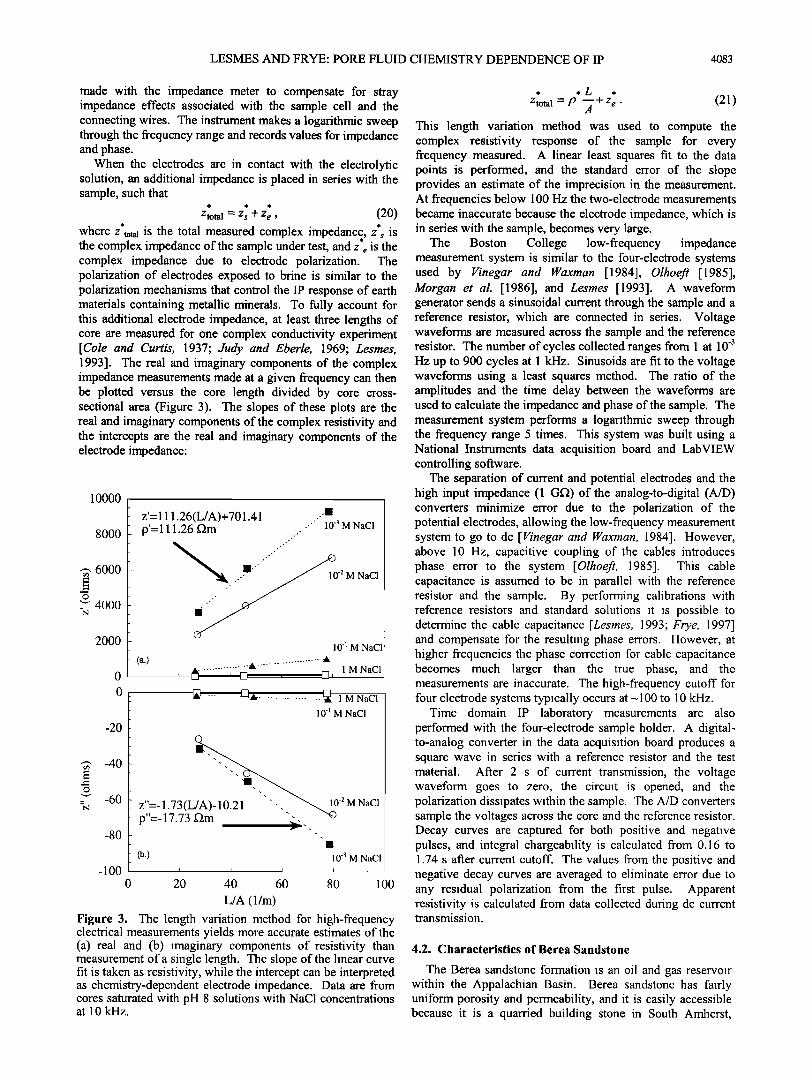
where Z*tota 1 is the total measured complex impedance, z*• is the complex impedance of the sample under test, and Z*e is the complex impedance due to electrode polarization. The polarization of electrodes exposed to brine is similar to the polarization mechanisms that control the IP response of earth materials containing metallic minerals. To fully account for this additional electrode impedance, at least three lengths of core are measured for one complex conductivity experiment [Cole and Curtis, 1937; Judy and Eberle, 1969; Lesmes, 1993]. The real and imaginary components of the complex impedance measurements made at a given frequency can then be plotted versus the core length divided by core cross- sectional area (Figure 3). The slopes of these plots are the real and imaginary components of the complex resistivity and the intercepts are the real and imaginary components of the electrode impedance:
10000
8000
6000
4000
2000
-20
-40
-60
-80
z'= 111.26(L/A)+701.41 .
p'= 111.26 f2m ,1
10 -• M NaC1
10 -2 M NaC1
10 -] M NaCI
1 M NaC1
• ........... []•- ...................... -• 1 M NaC1
z"=- 1.73(L/A)-I 0.21 p"=-17.73 f2m
10 'l M NaC1
(b.)
-100 ' 0 2O
1
10 4 M NaC1
40 60 80 100
L/A (1/m)
Figure 3. The length variation method for high-frequency electrical measurements yields more accurate estimates of the (a) real and (b) imaginary components of resistivity than measurement of a single length. The slope of the linear curve fit is taken as resistivity, while the intercept can be interpreted as chemistry-dependent electrode impedance. Data are from cores saturated with pH 8 solutions with NaC1 concentrations at 10 kHz.
ß ,L ß
Ztota I = p •-+ z e . (21) This length variation method was used to compute the complex resistivity response of the sample for every frequency measured. A linear least squares fit to the data points is performed, and the standard error of the slope provides an estimate of the imprecision in the measurement. At frequencies below 100 Hz the two-electrode measurements became inaccurate because the electrode impedance, which is in series with the sample, becomes very large.
The Boston College low-frequency impedance measurement system is similar to the four-electrode systems used by Vinegar and Waxman [1984], Olhoefi [1985], Morgan et al. [1986], and Lesmes [1993]. A waveform generator sends a sinusoidal current through the sample and a reference resistor, which are connected in series. Voltage waveforms are measured across the sample and the reference resistor. The number of cycles collected ranges from 1 at 10 -3 Hz up to 900 cycles at 1 kHz. Sinusoids are fit to the voltage waveforms using a least squares method. The ratio of the amplitudes and the time delay between the waveforms are used to calculate the impedance and phase of the sample. The measurement system performs a logarithmic sweep through the frequency range 5 times. This system was built using a National Instruments data acquisition board and LabVIEW controlling software.
The separation of current and potential electrodes and the high input impedance (1 GCZ) of the analog-to-digital (A/D) converters minimize error due to the polarization of the potential electrodes, allowing the low-frequency measurement system to go to dc [Vinegar and Waxman, 1984]. However, above 10 Hz, capacitive coupling of the cables introduces phase error to the system [Olhoefi, 1985]. This cable capacitance is assumed to be in parallel with the reference resistor and the sample. By performing calibrations with reference resistors and standard solutions it is possible to determine the cable capacitance [Lesrnes, 1993; Frye, 1997] and compensate for the resulting phase errors. However, at higher frequencies the phase correction for cable capacitance becomes much larger than the true phase, and the measurements are inaccurate. The high-frequency cutoff for four electrode systems typically occurs at-100 to 10 kHz.
Time domain IP laboratory measurements are also performed with the four-electrode sample holder. A digital- to-analog converter in the data acquisition board produces a square wave in series with a reference resistor and the test material. After 2 s of current transmission, the voltage waveform goes to zero, the circuit is opened, and the polarization dissipates within the sample. The A/D converters sample the voltages across the core and the reference resistor. Decay curves are captured for both positive and negative pulses, and integral chargeability is calculated from 0.16 to 1.74 s after current cutoff. The values from the positive and negative decay curves are averaged to eliminate error due to any residual polarization from the first pulse. Apparent resistivity is calculated from data collected during dc current transmission.
4.2. Characteristics of Berea Sandstone
The Berea sandstone formation is an oil and gas reservoir within the Appalachian Basin. Berea sandstone has fairly uniform porosity and permeability, and it is easily accessible because it is a quarried building stone in South Amherst,
4084 LESMES AND FRYE: PORE FLUID CHEMISTRY DEPENDENCE OF IP
Table 1. Petrophysical Properties and Associated Uncertainties of Berea Sandstone Used in This Study a
• k, F m Surface Spot, mdarcy Area, m2/l• cm -1
0.18 228 15.9 1.61 0.737 8.30x10⁴ +0.005 + 18 +0.4 +0.05 +0.005 + 102
aFrom Frye [1997] and Sturrock [1999].
Ohio. Therefore many rock physics experiments have been conducted using Berea sandstone and many of its physical and chemical properties are well characterized. The petrophysical properties of our Berea sandstone samples are listed in Table 1. The connected porosity • is measured using Archimedes method, the permeability k is measured in a steady state flow test, and the specific surface area is measured using BET nitrogen adsorption [Sturrock, 1999]. Measurement of the "instrinsic" formation factor F and the
cementation index m are described below. The mineralogical content of a Berea sandstone sample with similar petrophysical properties as our sample is listed in Table 2.
The formation factor (FF) is the ratio of the brine conductivity to the conductivity of the sample [Archie, 1942]:
FF = crw •. (22)
Surface conductivity effects, which are not accounted for in Archie's law (10), cause FF to increase with increasing solution conductivity. Surface conductivity effects are assumed to be negligible when FF approaches a relatively constant value at high salinity. In formations in which surface conductivity is negligible (i.e., high salinity and/or low surface area), Archie's law holds, and the formation factor is given by
F=• -m . (23) F is the intrinsic formation factor, which is characteristic of the grain shape and pore space topology (i.e., tortuousity). The cementation index m computed from F ranges from 1 to 3; for well-cemented sandstones, m•2 [Jackson et al., 1978; Schon, 1996]. For our Berea samples we obtained m=l.61, which was computed from F measured at 10 kHz when the sample is saturated with 1 M NaC1 (pH 8) pore solution. The formation factor response FF plotted throughout the paper is simply the ratio of the brine conductivity to the sample conductivity as defined by (22).
4.3. Accuracy and Precision
The imprecision (95% confidence interval) of the low- frequency measurement system, based on resistor tests, is
Table 2. Mineralogical Composition of Berea Sandstone a Mineral Weight Percent Quartz 68 Chert 1
Feldspar 7 Carbonates 1
Clay (kaolinite) 3 Lithics 8
Unidentified 12
aFrom Knight and Nur [ 1987]. Sample Berea 200 with 4=0.209, k=-372 mdarcy, and Spo•8.40xl 04 cm 4.
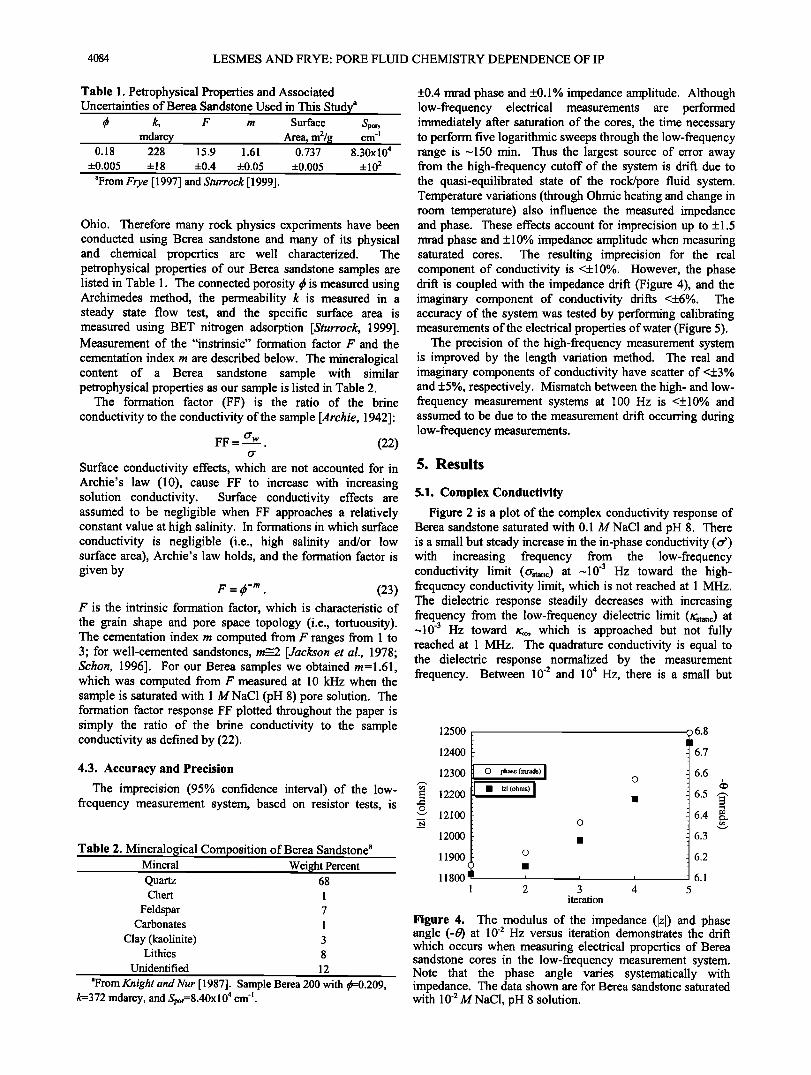
+0.4 mrad phase and +0.1% impedance amplitude. Although low-frequency electrical measurements are performed immediately after saturation of the cores, the time necessary to perform five logarithmic sweeps through the low-frequency range is -150 min. Thus the largest source of error away from the high-frequency cutoff of the system is drift due to the quasi-equilibrated state of the rock/pore fluid system. Temperature variations (through Ohmic heating and change in room temperature) also influence the measured impedance and phase. These effects account for imprecision up to +1.5 mrad phase and +10% impedance amplitude when measuring saturated cores. The resulting imprecision for the real component of conductivity is <+10%. However, the phase drift is coupled with the impedance drift (Figure 4), and the imaginary component of conductivity drifts <+6%. The accuracy of the system was tested by performing calibrating measurements of the electrical properties of water (Figure 5).
The precision of the high-frequency measurement system is improved by the length variation method. The real and imaginary components of conductivity have scatter of <+3% and +5%, respectively. Mismatch between the high- and low- frequency measurement systems at 100 Hz is <+10% and assumed to be due to the measurement drift occurring during low-frequency measurements.
5. Results
5.1. Complex Conductivity
Figure 2 is a plot of the complex conductivity response of Berea sandstone saturated with 0.1 M NaC1 and pH 8. There is a small but steady increase in the in-phase conductivity (o') with increasing frequency from the low-frequency conductivity limit (•tatic) at-10 -3 Hz toward the high- frequency conductivity limit, which is not reached at 1 MHz. The dielectric response steadily decreases with increasing frequency from the low-frequency dielectric limit (n:stati0 at -10 -3 Hz toward n:©, which is approached but not fully reached at 1 MHz. The quadrature conductivity is equal to the dielectric response normalized by the measurement frequency. Between 10 -2 and 10 4 Hz, there is a small but
12500
12400
12300
12200
12100
12000
¸ phase (mrads) ß [z[ (ohms)
11900 o
11800 1 2
I
3 4 iteration
6.8 6.7
6.6
6.4 •.
6.3
6.2
6.1
Figure 4. The modulus of the impedance (Izl) and phase angle (-0) at 10 -2 Hz versus iteration demonstrates the drift which occurs when measuring electrical properties of Berea sandstone cores in the low-frequency measurement system. Note that the phase angle varies systematically with impedance. The data shown are for Berea sandstone saturated with 10 -2 M NaC1, pH 8 solution.
LESMES AND FRYE: PORE FLUID CHEMISTRY DEPENDENCE OF IP 4085
steady increase in the quadrature conductivity with increasing 16 frequency. For frequencies <10 -2 Hz the quadrature conductivity rapidly goes to zero. Presumably, this frequency 14 is related to the relaxation time associated with the largest polarizing grains or aggregates of grains [Klein and Sill, 1982; 12 Lesmes and Morgan, 2001]. For frequencies >10 kHz the quadrature conductivity rapidly increases as the displacement currents begin to be controlled by the high-frequency 8 dielectric properties of the sample.
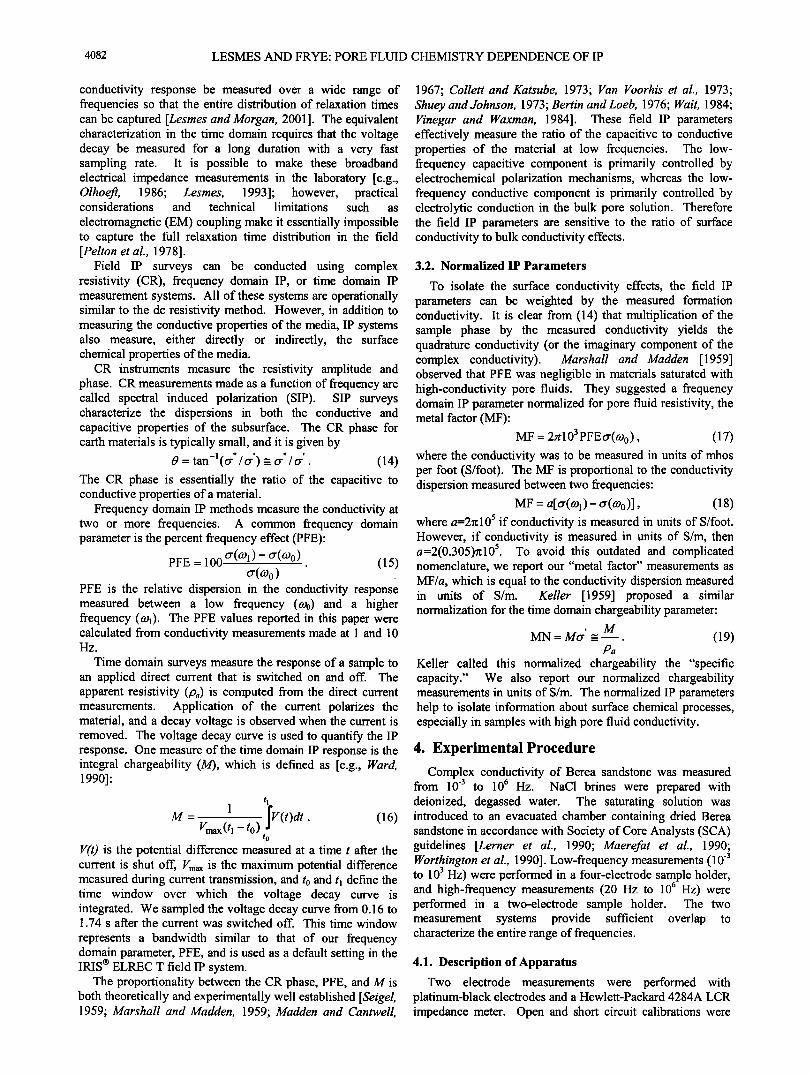
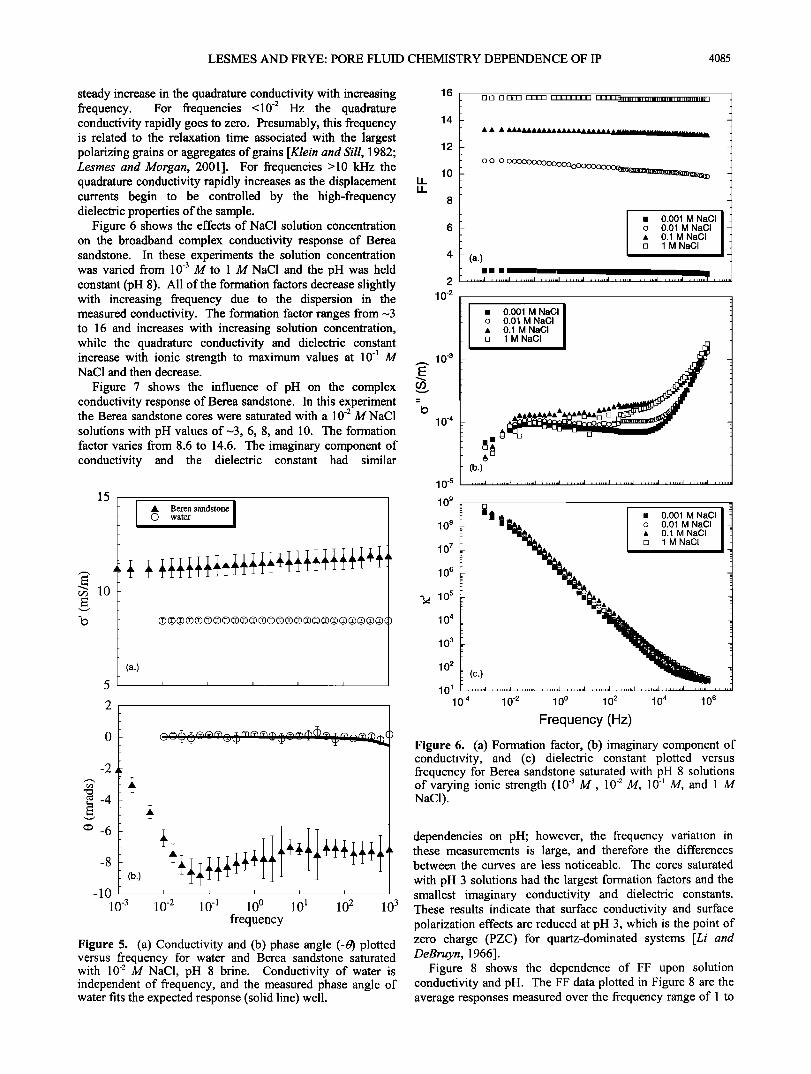
Figure 6 shows the effects of NaC1 solution concentration 6 on the broadband complex conductivity response of Berea sandstone. In these experiments the solution concentration 4 was varied from 10 -3 M to 1 M NaC1 and the pH was held constant (pH 8). All of the formation factors decrease slightly 2 with increasing frequency due to the dispersion in the 10'2 measured conductivity. The formation factor ranges from-3 to 16 and increases with increasing solution concentration, while the quadrature conductivity and dielectric constant increase with ionic strength to maximum values at 10 -• M 10 -3 NaC1 and then decrease. E
Figure 7 shows the influence of pH on the complex conductivity response of Berea sandstone. In this experiment - the Berea sandstone cores were saturated with a 10 -2 M NaC1 10 '4 solutions with pH values of-3, 6, 8, and 10. The formation factor varies from 8.6 to 14.6. The imaginary component of conductivity and the dielectric constant had similar
10 's
15 10 9 ß Berea sandstone I ¸ water
(a.)
o
(b.)
-10 10 -3 10 -2 10 -• 100 10 ] 102 103
frequency
Figure 5. (a) Conductivity and (b) phase angle (-0) plotted versus frequency for water and Berea sandstone saturated with 10 -2 M NaC1, pH 8 brine. Conductivity of water is independent of frequency, and the measured phase angle of water fits the expected response (solid line) well.
ß ß ß AAAAAAAAAAAAAAAAAAAAAA•
o o o øøøøOOOooooooooooooooo•••••
ß 0.001 M NaCI o 0.01 M NaCI ß 0.1 M NaCI [] 1 M NaCI
(a.)
ß ' '•=''=•,,,=•,.,,,,,,==• ,, ........ , • ,,.• •.,.,,1 .............. ,, ,,,,,,,, , .,,,,,, ,,,,,.,. ,,,•.,. ,,,,,,,, , ,,,,,. ,,,,,,,, , ,,,,,
ß 0.001 M NaCI o 0.01 M NaCI ß 0.1 M NaCI [] 1 M NaCI
(b.) , .,,.,,,I , .,,m,I •,•,,.d ,• ...... I ........ I ........ I ........ 1 ........ I ........ I ........ I ....
10 8
10 7
10 6
-• 10 5 10 4
10 3
10 2
101 10 '4
•h • ß 0.001 M NaCl -•u• o 0.01 M NaCI "ii•,,• ,, 0.1 M NaCI
"ill t. [] 1 M NaCI
(c.)
10 -2 10 ø 10 2 10 4 10 6
Frequency (Hz)
Figure 6. (a) Formation factor, (b) imaginary component of conductivity, and (c) dielectric constant plotted versus frequency for Berea sandstone saturated with pH 8 solutions of varying ionic strength (10 -3 M, 10 -2 M, 10 -! M, and 1 M NaC1).
dependencies on pH; however, the frequency variation in these measurements is large, and therefore the differences between the curves are less noticeable. The cores saturated
with pH 3 solutions had the largest formation factors and the smallest imaginary conductivity and dielectric constants. These results indicate that surface conductivity and surface polarization effects are reduced at pH 3, which is the point of zero charge (PZC) for quartz-dominated systems [Li and DeBruyn, 1966].
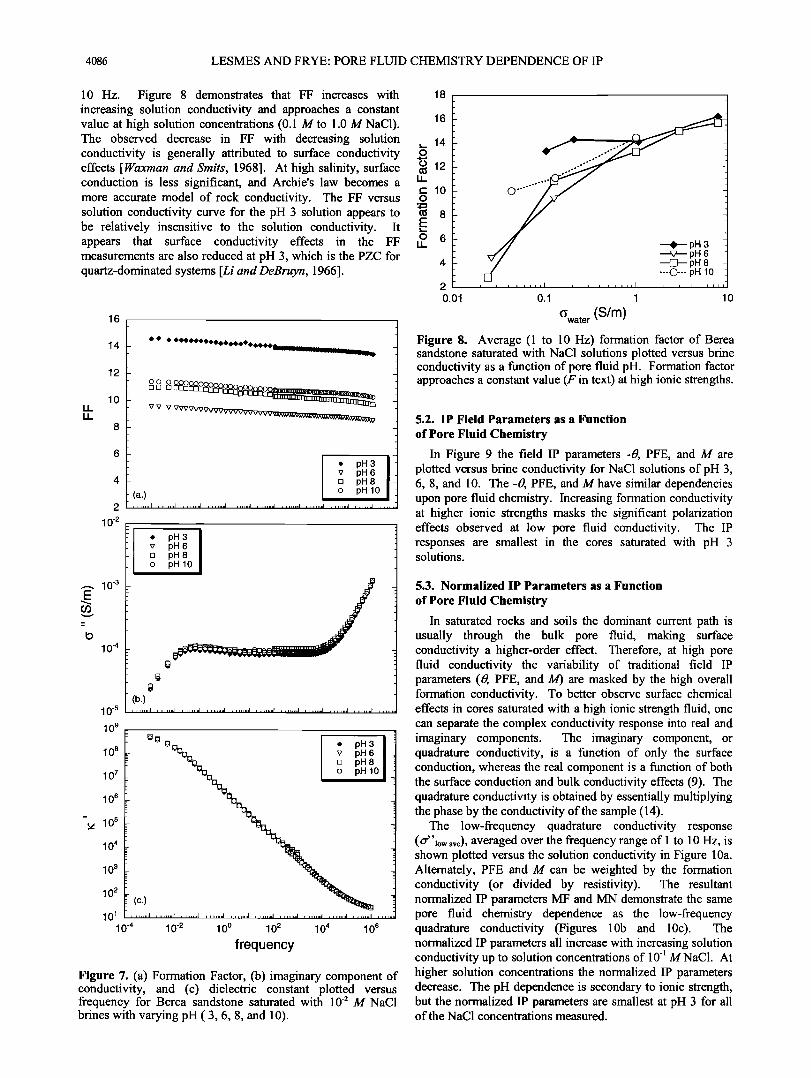
Figure 8 shows the dependence of FF upon solution conductivity and pH. The FF data plotted in Figure 8 are the average responses measured over the frequency range of 1 to
4086 LESMES AND FRYE' PORE FLUID CHEMISTRY DEPENDENCE OF IP
10 Hz. Figure 8 demonstrates that FF increases with 18 increasing solution conductivity and approaches a constant value at high solution concentrations (0.1 M to 1.0 M NaC1). 16 The observed decrease in FF with decreasing solution ,_ 14 conductivity is generally attributed to surface conductivity effects [Waxman and Smits, 1968]. At high salinity, surface • 12 conduction is less significant, and Archids law becomes a
r- 10 more accurate model of rock conductivity. The FF versus
-.•
solution conductivity curve for the pH 3 solution appears to m 8 be relatively insensitive to the solution conductivity. It appears that surface conductivity effects in the FF u. ¸ 6 measurements are also reduced at pH 3, which is the PZC for 4 quartz-dominated systems [Li and DeBruyn, 1966].
16
14
12
10
2
10 '2
o o ooo•...•_ (3O
(a.)
ß pH3 v pH 6 [] pH8 o pH 10
.
, ,,,,,,,I ....... ,I 1,1
•, 10 '3
10 '4
10 's
10 9
ß pH 3 v pH6 [] pH 8 o pH 10
(b.)
108
10 7
10 6 -
• 10 5
10 4
10 3
10 2
10'• 10 '4
• I v pH 6 '"'% I [] pH8
%%% I o pH 10
(c.) .
........ I ........ I ........ I ........ I ........ I ........ I , ,,•,,,,I ,, ...... I ........ I ........ I ,,
10 '2 10 ø 102 104 106
frequency
Figure 7. (a) Formation Factor, (b) imaginary component of conductivity, and (c) dielectric constant plotted versus frequency for Berea sandstone saturated with 10 -2 M NaC1 brines with varying pH ( 3, 6, 8, and 10).
2
0.01
• pH 3 ---•7--- pH 6 --C3-- pH 8 .--¸--- pH 10
, , , ,,,,I I
0,1 1 10
IJwate r (S/m) Figure 8. Average (1 to 10 Hz) formation factor of Berea sandstone saturated with NaC1 solutions plotted versus brine conductivity as a function of pore fluid pH. Formation factor approaches a constant value (F in text) at high ionic strengths.
5.2. IP Field Parameters as a Function
of Pore Fluid Chemistry
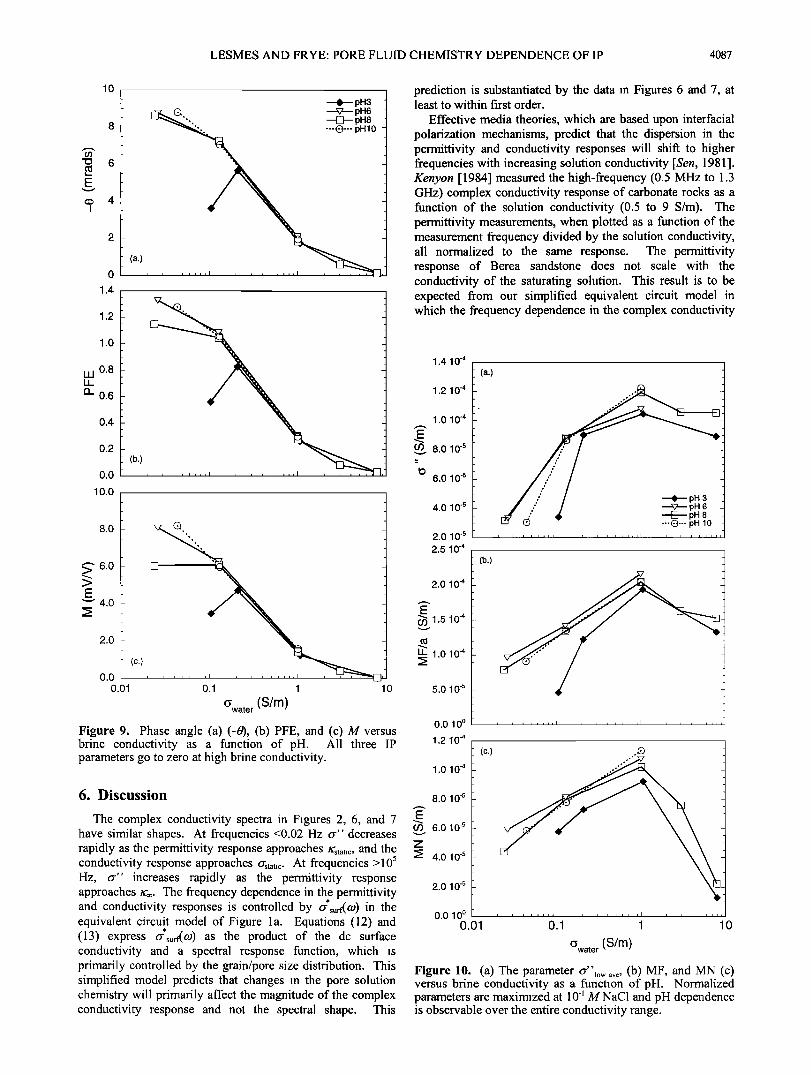
In Figure 9 the field IP parameters -0, PFE, and M are plotted versus brine conductivity for NaC1 solutions of pH 3, 6, 8, and 10. The -0, PFE, and M have similar dependencies upon pore fluid chemistry. Increasing formation conductivity at higher ionic strengths masks the significant polarization effects observed at low pore fluid conductivity. The IP responses are smallest in the cores saturated with pH 3 solutions.
5.3. Normalized IP Parameters as a Function
of Pore Fluid Chemistry
In saturated rocks and soils the dominant current path is usually through the bulk pore fluid, making surface conductivity a higher-order effect. Therefore, at high pore fluid conductivity the variability of traditional field IP parameters (0, PFE, and M) are masked by the high overall formation conductivity. To better observe surface chemical effects in cores saturated with a high ionic strength fluid, one can separate the complex conductivity response into real and imaginary components. The imaginary component, or quadrature conductivity, is a function of only the surface conduction, whereas the real component is a function of both the surface conduction and bulk conductivity effects (9). The quadrature conductivity is obtained by essentially multiplying the phase by the conductivity of the sample (14).
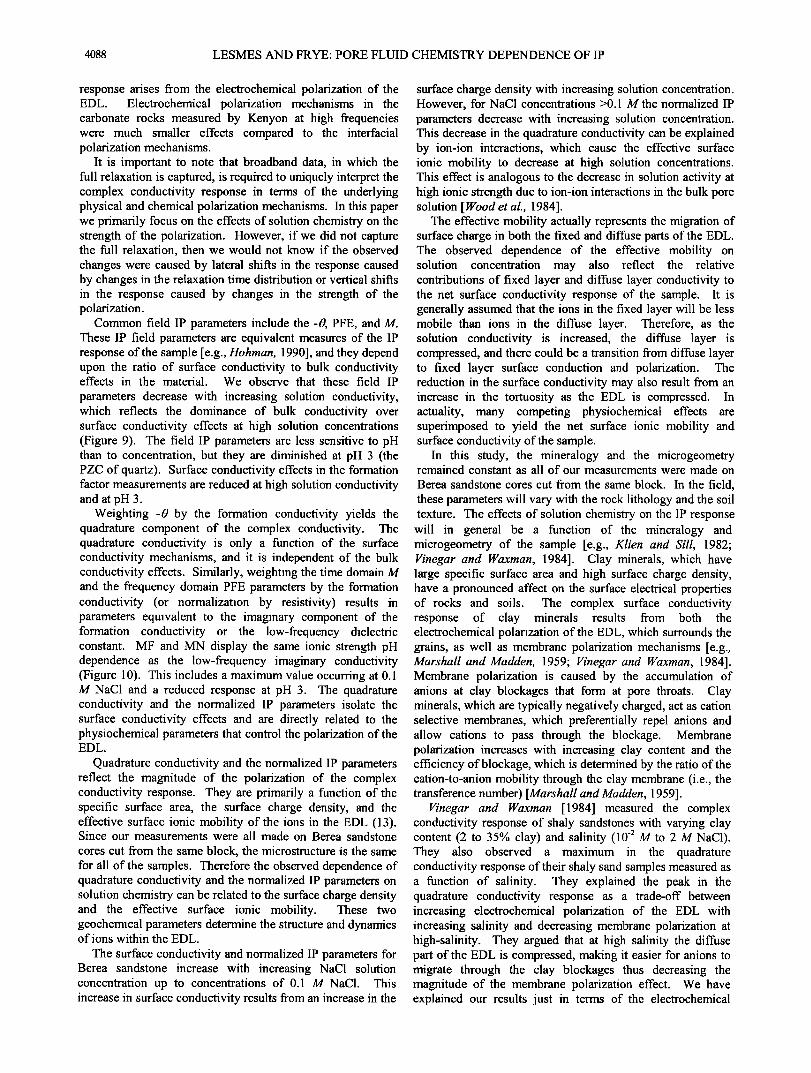
The low-frequency quadrature conductivity response (or' 'low ave), averaged over the frequency range of 1 to 10 Hz, is shown plotted versus the solution conductivity in Figure 10a. Alternately, PFE and M can be weighted by the formation conductivity (or divided by resistivity). The resultant normalized IP parameters MF and MN demonstrate the same pore fluid chemistry dependence as the low-frequency quadrature conductivity (Figures 10b and 10c). The normalized IP parameters all increase with increasing solution conductivity up to solution concentrations of 10 -• M NaC1. At higher solution concentrations the normalized IP parameters decrease. The pH dependence is secondary to ionic strength, but the normalized IP parameters are smallest at pH 3 for all of the NaC1 concentrations measured.
LESMES AND FRYE' PORE FLUID CHEMISTRY DEPENDENCE OF IP 4087
10
o
1.4
(a.)
• pH3 F57• (•. • pH6 1
-,,,, • pH8 1 .
1.2
1.0
0.8 LU
a_ 0.6
0.4
0.2
0.0
10.0
(b.)
8.0
6.0
2.0
0.0
0.01
(c.)
0.1 1 10
G'wate r (S/m)
Figure 9. Phase angle (a) (-•, (b) PFE, and (c) M versus brine conductivity as a function of pH. All three IP parameters go to zero at high brine conductivity.
6. Discussion
The complex conductivity spectra in Figures 2, 6, and 7 have similar shapes. At frequencies <0.02 Hz or" decreases rapidly as the permittivity response approaches /Cstatic , and the conductivity response approaches Crstatic. At frequencies >105 Hz, or" increases rapidly as the permittivity response approaches •c©. The frequency dependence in the permittivity and conductivity responses is controlled by rfsurr(CO) in the equivalent circuit model of Figure la. Equations (12) and (13) express rfsurr(CO) as the product of the dc surface conductivity and a spectral response function, which is primarily controlled by the grain/pore size distribution. This simplified model predicts that changes in the pore solution chemistry will primarily affect the magnitude of the complex conductivity response and not the spectral shape. This
prediction is substantiated by the data in Figures 6 and 7, at least to within first order.
Effective media theories, which are based upon interfacial polarization mechanisms, predict that the dispersion in the permittivity and conductivity responses will shift to higher frequencies with increasing solution conductivity [Sen, 1981 ]. Kenyon [1984] measured the high-frequency (0.5 MHz to 1.3 GHz) complex conductivity response of carbonate rocks as a function of the solution conductivity (0.5 to 9 S/m). The permittivity measurements, when plotted as a function of the measurement frequency divided by the solution conductivity, all normalized to the same response. The permittivity response of Berea sandstone does not scale with the conductivity of the saturating solution. This result is to be expected from our simplified equivalent circuit model in which the frequency dependence in the complex conductivity
1.4 10 '4
1.2 10 '4
1.0 10 '4
• 8.0 10 '5 -
-t2 6.0 10 '5
4.0 10 -5
2.0 10 '5 2.5 10 '4
(a.)
.'"" / • •H 6 ß [] pH 8 ---•---pH 10
i • i i iiiI I i i • i i i i [ I i i [ i ) i i
2.0 10 '4
1.5 10 -4
LL 1.0 10 '4
5.0 10 -5
0.0 10 o
1.2 10 -4
(b.)
1.0 10 '4
8.0 10 '5
09 6.010 -5
z
• 4.OLO -5
2.0 10 -5
(c.) .d)
0.0 10 ø 01 t 0.01 .1 1 10
G'wate r (S/m)
Figure 10. (a) The parameter O-•'1 ...... (b) MF, and MN (c) versus brine conductivity as a function of pH. Normalized parameters are maximized at 10 -• M NaC1 and pH dependence is observable over the entire conductivity range.
4088 LESMES AND FRYE: PORE FLUID CHEMISTRY DEPENDENCE OF IP
response arises from the electrochemical polarization of the EDL. Electrochemical polarization mechanisms in the carbonate rocks measured by Kenyon at high frequencies were much smaller effects compared to the interfacial polarization mechanisms.
It is important to note that broadband data, in which the full relaxation is captured, is required to uniquely interpret the complex conductivity response in terms of the underlying physical and chemical polarization mechanisms. In this paper we primarily focus on the effects of solution chemistry on the strength of the polarization. However, if we did not capture the full relaxation, then we would not know if the observed changes were caused by lateral shifts in the response caused by changes in the relaxation time distribution or vertical shifts in the response caused by changes in the strength of the polarization.
Common field IP parameters include the -0, PFE, and M. These IP field parameters are equivalent measures of the IP response of the sample [e.g., Hohman, 1990], and they depend upon the ratio of surface conductivity to bulk conductivity effects in the material. We observe that these field IP
parameters decrease with increasing solution conductivity, which reflects the dominance of bulk conductivity over surface conductivity effects at high solution concentrations (Figure 9). The field IP parameters are less sensitive to pH than to concentration, but they are diminished at pH 3 (the PZC of quartz). Surface conductivity effects in the formation factor measurements are reduced at high solution conductivity and at pH 3.
Weighting -0 by the formation conductivity yields the quadrature component of the complex conductivity. The quadrature conductivity is only a function of the surface conductivity mechanisms, and it is independent of the bulk conductivity effects. Similarly, weighting the time domain M and the frequency domain PFE parameters by the formation conductivity (or normalization by resistivity) results in parameters equivalent to the imaginary component of the formation conductivity or the low-frequency dielectric constant. MF and MN display the same ionic strength pH dependence as the low-frequency imaginary conductivity (Figure 10). This includes a maximum value occurring at 0.1 M NaC1 and a reduced response at pH 3. The quadrature conductivity and the normalized IP parameters isolate the surface conductivity effects and are directly related to the physiochemical parameters that control the polarization of the EDL.
Quadrature conductivity and the normalized IP parameters reflect the magnitude of the polarization of the complex conductivity response. They are primarily a function of the specific surface area, the surface charge density, and the effective surface ionic mobility of the ions in the EDL (13). Since our measurements were all made on Berea sandstone
cores cut from the same block, the microstructure is the same for all of the samples. Therefore the observed dependence of quadrature conductivity and the normalized IP parameters on solution chemistry can be related to the surface charge density and the effective surface ionic mobility. These two geochemical parameters determine the structure and dynamics of ions within the EDL.
The surface conductivity and normalized IP parameters for Berea sandstone increase with increasing NaC1 solution concentration up to concentrations of 0.1 M NaC1. This increase in surface conductivity results from an increase in the
surface charge density with increasing solution concentration. However, for NaC1 concentrations >0.1 M the normalized IP parameters decrease with increasing solution concentration. This decrease in the quadrature conductivity can be explained by ion-ion interactions, which cause the effective surface ionic mobility to decrease at high solution concentrations. This effect is analogous to the decrease in solution activity at high ionic strength due to ion-ion interactions in the bulk pore solution [Wood et al., 1984].
The effective mobility actually represents the migration of surface charge in both the fixed and diffuse parts of the EDL. The observed dependence of the effective mobility on solution concentration may also reflect the relative contributions of fixed layer and diffuse layer conductivity to the net surface conductivity response of the sample. It is generally assumed that the ions in the fixed layer will be less mobile than ions in the diffuse layer. Therefore, as the solution conductivity is increased, the diffuse layer is compressed, and there could be a transition from diffuse layer to fixed layer surface conduction and polarization. The reduction in the surface conductivity may also result from an increase in the tortuosity as the EDL is compressed. In actuality, many competing physiochemical effects are superimposed to yield the net surface ionic mobility and surface conductivity of the sample.
In this study, the mineralogy and the microgeometry remained constant as all of our measurements were made on
Berea sandstone cores cut from the same block. In the field, these parameters will vary with the rock lithology and the soil texture. The effects of solution chemistry on the IP response will in general be a function of the mineralogy and microgeometry of the sample [e.g., Klien and Sill, 1982; Vinegar and Waxman, 1984]. Clay minerals, which have large specific surface area and high surface charge density, have a pronounced affect on the surface electrical properties of rocks and soils. The complex surface conductivity response of clay minerals results from both the electrochemical polarization of the EDL, which surrounds the grains, as well as membrane polarization mechanisms [e.g., Marshall and Madden, 1959; Vinegar and Waxman, 1984]. Membrane polarization is caused by the accumulation of anions at clay blockages that form at pore throats. Clay minerals, which are typically negatively charged, act as cation selective membranes, which preferentially repel anions and allow cations to pass through the blockage. Membrane polarization increases with increasing clay content and the efficiency of blockage, which is determined by the ratio of the cation-to-anion mobility through the clay membrane (i.e., the transference number) [Marshall and Madden, 1959].
Vinegar and Waxman [1984] measured the complex conductivity response of shaly sandstones with varying clay content (2 to 35% clay) and salinity (10 -2 M to 2 M NaC1). They also observed a maximum in the quadrature conductivity response of their shaly sand samples measured as a function of salinity. They explained the peak in the quadrature conductivity response as a trade-off between increasing electrochemical polarization of the EDL with increasing salinity and decreasing membrane polarization at high-salinity. They argued that at high salinity the diffuse part of the EDL is compressed, making it easier for anions to migrate through the clay blockages thus decreasing the magnitude of the membrane polarization effect. We have explained our results just in terms of the electrochemical
LESMES AND FRYE: PORE FLUID CHEMISTRY DEPENDENCE OF IP 4089
polarization of the EDL. We argue that the decrease in polarization at high salinity is caused by a reduction in the effective mobility of the ions in the EDL. To test these two hypotheses, it may be useful to further analyze the surface conductivity contribution to the real part of the conductivity response. This surface conductivity term can be isolated using effective medium models [e.g., Bussian, 1983; Samstag and Morgan, 1991; Lesmes and Morgan, 2001 ]. If increased anion mobility through the clay blockages is responsible for the decrease in quadrature conductivity at high salinity, then the real part of the surface conductivity should increase at high salinity. Whereas if a reduction in surface ionic mobility in the EDL is responsible for the decrease in the quadrature conductivity at high salinity, then the real part of the surface conductivity should decrease at high salinity. Analysis of the broadband complex conductivity response of the samples and experiments on more uniform and well-characterized systems (e.g., silicate glasses) may also help to isolate and better understand the various surface conduction and polarization mechanisms.
7. Conclusions
SIP measurements are sensitive to surface chemical and
microgeometrical properties of rocks and soils. Capturing the entire relaxation time distribution, which characterizes the SIP response, requires that the complex conductivity of the sample be measured over a wide range of frequencies (e.g., 10 -3 to 109 Hz). This study investigates the effects of pore solution concentration and pH on the broadband complex conductivity response of Berea sandstone (10 -3 to 106 Hz). The results indicate that the shape of the conductivity response is similar for all tested pore fluid concentrations and pH values. As the specific surface area is constant in this experiment, the surface charge density and the effective mobility of the ions in the fixed and diffuse parts of the EDL primarily determine the magnitude of the complex surface conductivity response (i.e., surface polarization).
IP field instruments typically measure the ,on and one of the following field IP parameters: -t9, PFE, or M. These parameters are equivalent measures of the IP response and are proportional to the ratio of surface polarization to bulk conductivity within the sample. Weighting the field IP parameters by the sample conductivity yields the normalized IP parameters: quadrature conductivity, MF, and MN (or specific capacity). The normalized IP parameters are relatively independent of the bulk conductivity, and they are more directly related to the surface chemical properties of the porous media (i.e., specific surface area, surface charge density, and surface ionic mobility). Utilization of normalized IP parameters in field IP surveys should significantly improve the sensitivity of the IP measurements to the in situ geochemical and lithological properties of the formation. Therefore normalized IP parameters should improve the effectiveness of IP surveys in contaminant mapping and hydraulic parameter estimation.
Acknowledgments. The authors thank Dale Morgan for his encouragement and advice on this project. We also thank John Sturrock and John Ebel for their input, as well Associate Editor Kathy Whaler and two anonymous reviewers for their comments and criticisms. This work was funded by the Department of Energy (DOE grant DE-FG07-96ER14714) and Boston College.
References
Archie, G. E., The electrical resistivity log as an aid in determining some reservoir characteristics, Trans. Am. Inst. Min. Metall. Pet. Eng., 146, 54-62, 1942.
Bertin, J., and J. Loeb, Experimental and Theoretical Aspects of Induced Polarization, vols. I and II, Gebri•der Borntraeger, Stuttgart, Germany, 1976.
B6rner, F., M. Gruhne, and J. Sch6n, Contamination indications derived from electrical properties in the low frequency range, Geophys. Prospect., 41, 83-98, 1993.
B6rner, F. D., J. R. Schopper, and A. Weller, Evaluation of transport and storage properties in the soil and groundwater zone from induced polarization measurements, Geophys. Prospect., 44, 583- 601, 1996.
Bussian, A. E., Electrical conductance in a porous medium, Geophysics, 48, 1258-1268, 1983.
Cahyna, F, O. Mazac, and D. Venhodova, Determination of the extent of cyanide contamination by surface geoelectrical methods, in Geotechnical and Environmental Geophysics, vol. II, Environmental and Groundwater, Invest. Geophys. vol. 5, edited by S.H. Ward, pp. 97-99, Soc. of Explor. Geophys., Tulsa, Okla, 1990.
Clavier, C., G. Coates, and Dumanoir, Theoretical and experimental bases for the dual-water model for the interpretation of shaly sands, Soc. Pet. Eng. J., 24, 153-168, 1984.
Cole, K. S., and R. H. Cole, Dispersion and adsorption in dielectrics, I, Alternating current characteristics, J. Chem. Phys., 9, 341-351, 1941.
Cole, K. S., and H. J. Curtis, Wheatstone bridge and electrolytic resistor impedance measurements over a wide frequency range, Rev. Sci. Instrum., 8, 333, 1937.
Collett, L. S., and T. J. Katsube, Electrical parameters of rocks in developing geophysical techniques, Geophysics, 38, 76-91, 1973.
Frye, K. M., The effect of pore fluid chemistry on the spectral induced polarization response of Berea sandstone, M. S. thesis, Boston College, Chestnut Hill, Mass., 1997.
Glover P. W. J., P. G. Meredith, P. R. Sammonds and S. A. F. Murrell, Ionic surface electrical conductivity in sandstone, J. Geophys. Res., 99, 21635-21650, 1994.
Hohman, G. W., Three-dimensional IP models, in Induced Polarization: Applications and Case Histories, Invest. Geophys. vol. 4, edited by J. B. Fink et al., pp. 150-178, Soc. of Explor. Geophys., Tulsa, Okla., 1990.
Jackson, P. D., D. T. Smith, and P. N. Stanford, Resistivity-porosity- particle shape relationships for marine sands, Geophysics, 43, 1250-1268, 1978.
James, R. O., and G. A. Parks, Characterization of aqueous colloids by their electrical double layer and intrinsic surface chemical properties, Surf. Colloid Sci., 12, 199-216, 1982.
Johnson, D. L., J. Koplik, and Schwartz, New pore-size parameter characterizing transport in porous media, Phys. Rev. Lett., 57, 2564-2567, 1986.
Judy, M. M., and W. R. Eberle, A laboratory method for the measurement of the dielectric constant of rock and soil samples in the frequency range of 102-108 Hz, U.S. Dep. oflnter. Geol. Surv. Tech. Rep., AFWL-TR-69-41, 1969.
Keller, G. V., Analysis of some electrical transient measurements on igneous, sedimentary, and metamorphic rocks, in Overvoltage Research and Geophysical Applications, edited by J. R. Wait, pp. 92-111, Pergamon, Tarrytown, N.Y., 1959.
Kenyon, W. E., Texture effects on megahertz dielectric properties of calcite rock samples, d. Appl. Phys., 55, 3153-3159, 1984.
Klein, J. D., and W. R. Sill, Electrical properties of artificial clay- bearing sandstone, Geophysics, 4 7, 1593-1605, 1982.
Knight, R. J., and A. Endres, A new concept in modeling the dielectric response of sandstones: Defining a wetted rock and bulk water system, Geophysics, 55, 586-594, 1990.
Knight, R. J., and A. Nur, The dielectric constant of sandstones, 60 Hz to 4 MHz, Geophysics, 52, 644-654, 1987.
Lerner, D.B., J. M. Dacy, C. J. Raible, J. J. Rathmell, G. Swanson, and J. D. Walls, SCA guidelines for sample preparation and porosity measurement of electrical resistivity samples, part II, Sample preparation and porosity measurement, Log Anal., 31, 57- 63, 1990.
Lesmes, D. P., Electrical-impedance spectroscopy of sedimentary rocks, Ph.D. thesis, Texas A&M Univ., College Station, 1993.
4090 LESMES AND FRYE: PORE FLUID CHEMISTRY DEPENDENCE OF IP
Lesmes, D. P., and F. D. Morgan, Dielectric spectroscopy of sedimentary rocks, J. Geophys. Res., in press, 2001.
Lesmes, D. P., J. Sturrock, and K. M. Frye, A physiochemical interpretation of the Cole-Cole dielectric model, paper presented at the Symposium on the Application of Geophysics to Environmental and Engineering Problems (SAGEEP), The Environmental and Engineering Geophysical Society, Arlington, Va., 2000.
Li, H. C., and P. L. DeBruyn, Electrokinetic and adsorption studies on quartz, Surf Sci., 5, 203-220, 1966.
Lima, O. A. L. de, and M. M. Sharma, A generalized Maxwell- Wagner theory for membrane polarization in shaly sands, Geophysics, 5 7, 431-440, 1992.
Madden, T. R., and T. Cantwell, Induced polarization, a review, in Mining Geophysics, vol. II, pp. 373-400, Soc. of Explor. Geophys., Tulsa, Okla., 1967.
Maerefat, N.L., B. A. Baldwin, A. A. Chaves, G. A. La Torraca, and B. F. Swanson, SCA guidelines for sample preparation and porosity measurement of electrical resistivity samples, part IV, Guidelines for saturating and desaturating core plugs during electrical resistivity measurements, Log Anal., 31, 68-75, 1990.
Marshall, D. J., and T. R. Madden, Induced polarization: A study of its causes, Geophysics, 24, 790-816, 1959.
Mendelson, K. S., and M. H. Cohen, The effect of grain anisotropy on the electrical properties of sedimentary rocks, Geophysics, 47, 257-263, 1982.
Morgan, F. D., T. R. Madden, and B. R. Bennett, An instrument system for low-frequency (10-3-103 Hz) impedance measurements, IEEE Trans., Instrum. Meas., 35, 287-292, 1986.
Morgan, F. D., E. R. Williams, and T. R. Madden, Streaming potential properties of Westerly granite with applications, J. Geophys. Res., 94, 12,449-12,461, 1989.
Olhoeft, G. R., Low-frequency electrical properties, Geophysics, 50, 2492-2503, 1985.
Olhoeft, G. R., Electrical properties from 10 -3 to 109 Hz- physics and chemistry, in Physics and Chemistry of Porous Media, II, edited by J. R. Banavar, J. Koplik, and K. W. Winkler, AIP Conf. Proc., 154, pp. 775-786, 1986.
Pelton, W. H., L. Rijo, and C. M. Swift Jr., Inversion of two- dimensional resistivity and induced-polarization data, Geophysics, 43, 788-803, 1978.
Pride, S. R., Governing equations for the coupled electromagnetics and acoustic of porous media, Phys. Rev. B, 50, 15678-15696, 1994.
Revil, A., and P. W. J. Glover, Nature of surface electrical conductivity in natural sands, sandstones, and clays, Geophys. Res. Lett., 25, 691-694.1998.
Sadowski, R.M., Clay-organic interactions, M. Sc. thesis, Colo. Sch. of Mines, Golden, 1988.
Samstag, F. J., and F. D. Morgan, Induced polarization of shaly sands: Salinity domain modeling by double embedding of the effective medium theory, Geophysics, 56, 1749-1756, 1991.
Schon, J. H., Physical Properties of Rocks.' Fundamental and Principles of Petrophysics, Elsevier Sci., New York, 1996.
Seigel, H. O., Mathematical formulation and type curves for induced polarization, Geophysics, 24, 547-565, 1959.
Sen, P.N., Relation of certain geometrical features to the dielectric anomaly of rocks, Geophysics, 46, 1714-1720, 1981.
Sen, P.N., C. Scala, and M. H. Cohen, A self-similar model for sedimentary rocks with application to the dielectric constant of fused glass beads, Geophysics, 46, 781-795, 1981.
Shuey, R. T., and M. Johnson, On the phenomenology of electrical relaxation in rocks: The electrical parameters of rocks, Geophysics, 38, 37-48, 1973.
Sillars, R. W., The properties of a dielectric contaimng semi- conducting particles of various shapes, J. Inst. Electr. Eng., 80, 378-394, 1937.
Sturrock, J. T., Estimates of permeability from broadband (spectral) induced polarization measurements, M. S. thesis, Boston College, Chestnut Hill, Mass., 1999.
Sturrock, J. T., D. P. Lesmes, and F. D. Morgan, The influence of micro-geometry on the hydraulic permeability and the induced polarization response of sandstones, paper presented at the Symposium on the Application of Geophysics to Environmental and Engineering Problems (SAGEEP), The Environmental and Engineering Geophysical Society, Chicago, II1., 1998.
Sturrock, J. T., D. P. Lesmes and F. D. Morgan, Permeability estimation using spectral induced polarization measurements, paper presented at the Symposium on the Application of Geophysics to Environmental and Engineering Problems (SAGEEP), The Environmental and Engineering Geophysical Society, Oakland, Calif., 1999.
Tadros, T. F. and J. Lyklema, The electrical double layer on silica in the presence of bivalent counter-ions, J. Electroanal. Chem., 22, 1-7, 1968.
Van Voorhis, G. D., P H. Nelson, and T. L. Drake, Complex resistivity spectra of porphyry copper mineralization, Geophysics, 38, 49-60, 1973.
Vinegar, H. J., and M. H. Waxman, Induced polarization of shaly sands, Geophysics, 49, 1267-1287, 1984.
Wait, J. R., Relaxation phenomena and induced polarization, Geoexploration, 22, 107-127, 1984.
Ward, S. H., Resistivity and Induced Polarization Methods, in Geotechnical and Environmental Geophysics, vol. 1, Review and Tutorial, Invest. Geophys. vol 5, edited by S.H. Ward, pp. 141- 190, Soc. of Explor. Geophys., Tulsa, Okla., 1990.
Ward, S. H., B. K. Steinberg, D. J. LaBrecque and M. M. Poulton, Recommendations for IP research, Leading Edge, 14, 243-247, 1995.
Waxman, M. H., and L. J. M. Smits, Electrical conductivities in oil- bearing shaly sands, Soc. Pet. Eng. J., 243, 107-122, 1968.
Wood, S. A., D. A. Crerar, S. L. Brantley, and M. Borcsik, Mean molal stochiometric activity coefficients of alkali halides and related electrolytes, Am. J. Sci., 284, 668-705, 1984.
Worthington, A. E., J. H. Hedges, and N. Pallatt, SCA guidelines for sample preparation and porosity measurement of electrical resistivity samples, part I, Guidelines for preparation of brine and determination of brine resistivity for use in electrical resistivity measurements, Log Analyst, 31, 20-28, 1990.
Wyllie, M. R. J., and P. F. Southwick, An experimental investigation of the SP and resistivity phenomena in dirty sands, J. Pet. Technol., 6, 44-57, 1954.
K. M. Frye, Department of Earth, Atmospheric, and Planetary Sciences, Massachusetts Institute of Technology, Cambridge, MA 02139. (kfrye•mit.edu)
D. P. Lesmes, Department of Geology and Geophysics, Boston College, Chestnut Hill, MA 02167. (lesmes•bc.edu)
(Received November 30, 1999; revised October 18, 2000; accepted October 26, 2000.)


