Embed Size (px)
Citation preview

Influence of rodent abundance on nestingsuccess of prairie waterfowl
Rodney W. Brook, Maria Pasitschniak-Arts, David W. Howerter, andFrancois Messier
Abstract: Most waterfowl nesting failure in the prairie biome is attributed to predation. However, the contribution of smallmammal abundance to the prairie predator–prey cycle and how this affects waterfowl productivity is not known. We mod-elled seasonal variability of nesting success, including a number of habitat and nest-related variables, to quantify influenceof rodent abundance for prairie nesting waterfowl for six study sites in the Prairie Pothole Region of Canada, 1996–1998.We estimated there is a curvilinear relationship between the abundance of meadow voles (Microtus pennsylvanicus (Ord,1815)) and the nesting success of ducks. The relationship has characteristics of the alternate prey hypothesis at low voledensity and characteristics of the shared prey hypothesis at higher densities. At low vole densities, duck nests appear to bebuffered from predation by voles but, at higher densities, nesting success was affected negatively. We recommend thatpredator–prey dynamics should be included as an integral part of management plans for nesting waterfowl and suggest fur-ther research using rigorous experiment design to elucidate mechanisms and pathways responsible for this observed rela-tionship.
Resume : On attribue la plupart des echecs de la nidification des oiseaux aquatiques dans le biome des prairies a la preda-tion. Cependant, la contribution de l’abondance des petits mammiferes au cycle des predateurs–proies des prairies et soneffet sur la productivite des oiseaux aquatiques restent inconnus. Nous modelisons la variabilite saisonniere du succes dela nidification et incluant plusieurs variables reliees a l’habitat et au nid, afin de mesurer l’influence de l’abondance desrongeurs sur les oiseaux aquatiques pendant leur nidification dans les prairies a six sites d’etude dans la region des cuv-ettes des prairies canadiennes, en 1996–1998. Nous estimons qu’il y a une relation curviligne entre l’abondance des cam-pagnols de Pennsylvanie (Microtus pennsylvanicus (Ord, 1815)) et le succes de la nidification chez les canards. Cetterelation possede, aux faibles densites de campagnols, certains caracteres de l’hypothese des proies de rechange et, aux den-sites plus elevees, des caracteristiques de l’hypothese des proies partagees. Aux faibles densites de campagnols, les nids decanards semblent etre preserves de la predation par les campagnols, mais, aux densites plus fortes, le succes de la nidifica-tion est affecte negativement. Nous recommandons que la dynamique des predateurs–proies fasse partie integrante desplans d’amenagement des oiseaux aquatiques durant la nidification et nous proposons des recherches supplementaires avecun plan d’experience rigoureux pour elucider les mecanismes et les voies responsables de la relation que nous observons.
[Traduit par la Redaction]
Introduction
Waterfowl population growth rates are relatively sensitiveto nesting success compared with other demographic vitalrates (Johnson et al. 1989; Carlson et al. 1993; Hoekman etal. 2002), with predation implicated as the primary proxi-mate cause of failed nesting for prairie breeding waterfowl(Klett et al. 1988; Johnson et al. 1989; Greenwood et al.1995). Improving recruitment of breeding waterfowl by in-creasing nesting success is a commonly recommended man-agement technique used to increase numbers of NorthAmerican waterfowl (e.g., Lokemoen 1984; Krapu et al.
2000; see a review in Jimenez et al. 2001). The spatial andtemporal variation in nesting success is often relatively large(Klett and Johnson 1982; Johnson et al. 1989) and is af-fected by many variables (Johnson et al. 1989; Greenwoodet al. 1995; Drever et al. 2004), thus, making the consequen-ces of management actions difficult to predict.
Variation in predation rates of eggs and nesting femalesmay be described by complex interactions among numerousfactors, including habitat types (Emery et al. 2005), habitatquality (Drever et al. 2004), predator density (Greenwood etal. 1995), and abundance of coexisting prey (Ackerman2002). Untangling this complex of proximate factors is the
Received 9 September 2007. Accepted 31 January 2008. Published on the NRC Research Press Web site at cjz.nrc.ca on 9 May 2008.
R.W. Brook.1 Ontario Ministry of Natural Recourses, Wildlife Research and Development Section, DNA Building, Trent University,2140 East Bank Drive, Peterborough, ON K9J 7B8, Canada.M. Pasitschniak-Arts2 and F. Messier. Department of Biology, University of Saskatchewan, 112 Science Place, Saskatoon,SK S7N 5E2, Canada.D.W. Howerter. Institute for Wetland and Waterfowl Research, Ducks Unlimited Canada, P.O. Box 1160, Stonewall, MB R0C 2Z0,Canada.
1Corresponding author (e-mail: [email protected]).2Present address: Department of Chemistry and Biology, Ryerson University, 43 Gerrard Street East, Toronto, ON M5B 1G2, Canada.
497
Can. J. Zool. 86: 497–506 (2008) doi:10.1139/Z08-019 # 2008 NRC Canada

focus of much research (e.g., Greenwood et al. 1995; Emeryet al. 2005; for a review see Sargeant and Raveling 1992),but little is known about demographic interactions betweensmall mammals and other organisms on the prairies(Kaufman and Kaufman 1997).
Several researchers suggest that presence and density ofcoexisting prey (small mammals) have an indirect influenceon predation rates of nesting female ducks and their eggs(e.g., Greenwood et al. 1998; Reynolds et al. 2001; Emeryet al. 2005). Predators that prey on rodents, birds, eggs, in-sects, and amphibians could conceivably link fluctuations inthese coexisting prey. The abundance and types of prey mayinfluence predator densities (numerical response) and theirhunting behavior (functional response) (Holt 1977). Theshared prey hypothesis (SPH; Norrdahl and Korpimaki2000) predicts that increasing abundance of main prey(small mammals) may attract predators in large numbersthat could have a devastating effect on alternative prey(nesting ducks) even before main prey begin to decline(e.g., Kenward 1985; Brook et al. 2005). In contrast, ducksand their eggs may benefit from presence of coexisting preythrough a buffering effect. The alternative prey hypothesis(APH; Lack 1954; Byers 1974; Angelstam et al. 1984,1985) predicts that when high densities of primary or pre-ferred prey (small mammals) occur, predation pressure onalternative prey (ducks and their eggs) relaxes. When mainprey densities decline, the functional response toward alter-native prey increases through either increased encounterrates because of increased predator search times (Schmidt1999), from prey switching (Lack 1954; Angelstam et al.1984), or other intrinsic and extrinsic mechanisms (see Batzli1996). Lastly, the presence of coexisting prey may have littlenoticeable influence on predation rates on either prey type.
To evaluate these hypotheses we used data from a largenesting ecology study in prairie Canada to investigate withinseason variation in nesting success owing to, among otherthings, the contribution of rodent abundance. Nesting suc-cess and seasonal rodent abundance, along with other cova-riates, were measured on six study sites for one season eachbetween 1996 and 1998, inclusively. We evaluated evidencein candidate models for an indirect influence of main prey(rodents) on duck nesting success by including nest charac-teristics and habitat variables known to influence nestingsuccess.
Materials and methods
Study areaFrom 1996 to 1998, we located duck nests and estimated
rodent abundance on six study sites (approximately 65 km2
each) in the aspen parkland of Manitoba and Saskatchewan(Fig. 1). Each study site was studied for one season. Primaryland use on each site was agricultural and included produc-tion of cereal grains, oil seeds, forages, and pasture for cat-tle. Other habitats searched for nests included natural grass,deciduous trees, and wetlands (for details see Emery et al.2005). We classified duck nests and rodent sampling loca-tions into the following habitat types: woodland, wetland,dense nesting cover (DNC; a mixture of grasses and le-gumes planted specifically to provide nesting cover for
ducks and other birds), native grass, and cropland (AppendixTable A1).
Field methods
Duck nestsWe used ATVs and cable-chain drags (Klett et al. 1986),
hand-pulled rope drags, vehicle-mounted booms, and walk-ing and striking the vegetation with sticks to search fornests. We conducted three searches at each study site be-tween early May and early July on a random selection ofquarter sections (64.7 ha, 0.81 km � 0.81 km blocks). Weconducted searches between 0730 and 1330 (Gloutney et al.1993) at approximately 3 week intervals (Klett et al. 1986).We also located nests by radiotelemetry or incidentallywhile traveling through the study area to check other nests.For further details see Emery et al. (2005).
We recorded species, vegetation cover type, number ofeggs, and incubation stage for all nests (Emery et al. 2005)and visited nests every 6–10 days until nest fate was deter-mined. We monitored nests of radio-marked females viatelemetry until a female was absent from the nest for twoconsecutive telemetry locations, which prompted us to visitthe nest to determine its status. We classified nests as suc-cessful if at least one egg hatched (Klett et al. 1986).
Incubation stage was estimated according to Weller(1956) and initiation date was calculated by backdating as-suming a laying interval of one egg per day. We standar-dized nest initiation dates for each site–year by subtractingthe date of first nest initiated from the date of individualnests at that site. Research protocol was reviewed and ap-proved by the University of Saskatchewan Committee onAnimal Care and Supply (protocol No. 920007).
RodentsRodents were trapped in habitat types where we searched
for duck nests. Two fields of each habitat type were selectedrandomly and two trap lines (100 m) consisting of 10 stations(10 m apart) each were placed randomly in each field. Each
Fig. 1. Location of study sites in prairie Canada, 1996–1998. Studyareas: Allan Hills West (ALW), Baldur (BAL), Farrerdale (FAR),Jumping Deer Creek (JDC), Parkside (PAR), and Willowbrook(WIL).
498 Can. J. Zool. Vol. 86, 2008
# 2008 NRC Canada

station was set with two Museum Special snap traps (Wood-stream Corporation, Lititz, Pennsylvania). Traps were baitedwith peanut butter and visited each morning and afternoonfor 3 consecutive days. Trapping was conducted twice permonth in May (early range = 8–16 and late range = 12–23),June (early range = 5–13 and late range = 10–20), and July(early range = 3–11 and late range = 9–18). Animalcollection and handling was approved by the University ofSaskatchewan Committee on Animal Care and Supply(research protocol No. 960026). We estimated rodent abun-dance as the number of rodents captured per 100 trap-nights. We subtracted 0.5 trap-nights for each sprung trap(by any cause) to control for variation in sampling effort(Beauvais and Buskirk 1999).
Statistical analysesWe evaluated models describing the probability of duck
nesting success in two steps. We first evaluated candidatemodels developed from variables describing nest and habitatcharacteristics. These models were constructed using priorknowledge of the potential effect these variables had fromresults of previous research (e.g., Emery et al. 2005). Afterranking these models, we constructed a second set of modelsthat incorporated variables indexing rodent abundance andvariables interpreted as important from results of the modelselection for the first candidate set.
We constructed the first set of candidate models using sixvariables, a two-way interaction, and a polynomial form ofone of the variables (Table 1). We used study site, habitattype, and duck species as categorical explanatory variables,and relative initiation date, its quadratic form, and nest ageas continuous variables. We included the quadratic form of
relative initiation date to account for potential nonlinearity(Emery et al. 2005) and we included species as a variableto account for potential species-specific variation. We usedtwo forms of the habitat variables, considering them mutu-ally exclusive. The first included all habitats and the secondonly DNC (see Table 1) versus all other types together.
We modelled the probability of daily nest survival foreach candidate model using generalized linear logistic re-gression (Rotella et al. 2004; Emery et al. 2005) withPROC NLMIXED (SAS Institute Inc. 2000). We includedstudy area as a random effect in each candidate modelwhere it appeared (Littell et al. 2002). We did not separatenests of radio-marked mallards (Anas platyrhynchos L.,1758) from those not radio-marked as Emery et al. (2005)found no difference in probability of nesting survival be-tween them. After fitting each model, we comparedAkaike’s information criterion (AIC) values to select thebest approximating model (Burnham and Anderson 1998).The effective sample size for AIC calculation was found us-ing methods described in Rotella et al. (2004). We calcu-lated a variance inflation factor (bc) for the most saturatedmodel to account for potential nonindependence amongnests in daily survival probability. This model included allvariables used in the first candidate model set (using varia-ble HAB rather than DNC, see Table 1) and bc was calcu-lated by dividing the deviance by the degrees of freedom.We reranked models using QAICc corrected for small sam-ple sizes (Burnham and Anderson 1998). Our overdispersioncorrection may be overly conservative because McCullaghand Nelder (1989) demonstrated that estimates of bc arebiased high for Bernoulli data.
Models differing by <4.0 QAICc units from the best
Table 1. Variables describing variation in duck nesting success for ducks nesting in the Prairie Pothole Region (Fig. 1), 1996–1998.
Variable code Description
Nest characteristicsAGE Nest age in days (see Materials and methods)RI Relative nest initiation date standardized by study area and yearSPEC Duck species: mallard (Anas platyrhynchos), blue-winged teal (Anas discors), gadwall (Anas strepera), northern sho-
veler (Anas clypeata), and others (lesser scaup (Aythya affinis (Eyton, 1838)), American wigeon (Anas americanaGmelin, 1789), green-winged teal (Anas crecca L., 1758), and northern pintail (Anas acuta L., 1758))
SAR Study area (for names and locations see Fig. 1)HABa Dense nesting cover (DNC), native grassland (NATGR), wetland (WET), woodland (WOOD), and cropland (CROP)
(see Appendix Table A1)DNCa DNC versus other (other includes all others above)RI2 Square of relative nest initiation dateHAB � RI Habitat and relative initiation date interactionDNC � RI DNC and relative initiation date interaction
Rodent abundance indicesRBVhab or date Southern red-backed vole (Clethrionomys gapperi) habitat-specific average abundance index by study area or habitat-
and date-specific average abundance index by study areaDMhab or date Deer mouse (Peromyscus maniculatus) habitat-specific average index by study area or habitat- and date-specific
average index by study areaMVhab or date Meadow vole (Microtus pennsylvanicus) habitat-specific average index by study area or habitat- and date-specific
average index by study areaTOTALhab or date Total of red-backed vole, deer mouse, and meadow vole habitat-specific average index by study area or habitat- and
date-specific average index by study areaIndex � RI Each rodent abundance index has a corresponding interaction with relative initiation date
aHAB and DNC are mutually exclusive variables; both were never in the same model.
Brook et al. 499
# 2008 NRC Canada
model were considered as having some support from thedata. We used Akaike weights (wi) to further evaluate candi-date models as a measure of evidence of a particular modelbeing the best model (Burnham and Anderson 1998). Wheremodel ranking suggested support for the >1 model, we usedmultimodel inference techniques to average coefficient esti-
mates for variables in the top ranking models (Burnham andAnderson 1998).
We used the best model from the first set of candidatemodels as the basis for building the second set of candidatemodels where we added and substituted rodent abundanceindices. We created two types of variables to index the
Table 2. Number of duck nests monitored by habitat type and used to model the probability of nestingsuccess.
Study area YearNaturalgrassland DNC Crop Woodland Wetland Total
Allan Hills West (ALW) 1997 459 1678 12 39 17 2205Baldur (BAL) 1996 454 235 6 69 104 868Farrerdale (FAR) 1998 268 1 24 44 39 376Jumping Deer Creek (JDC) 1998 96 612 2 97 113 920Parkside (PAR) 1996 na na 8 98 62 168Willowbrook (WIL) 1997 199 97 17 135 151 599
Note: For study-area locations see Fig. 1. Dense nesting cover (for descriptions see Appendix Table A1). We excludednest data for PAR in natural grassland and DNC habitats because they were not surveyed for rodent abundance.
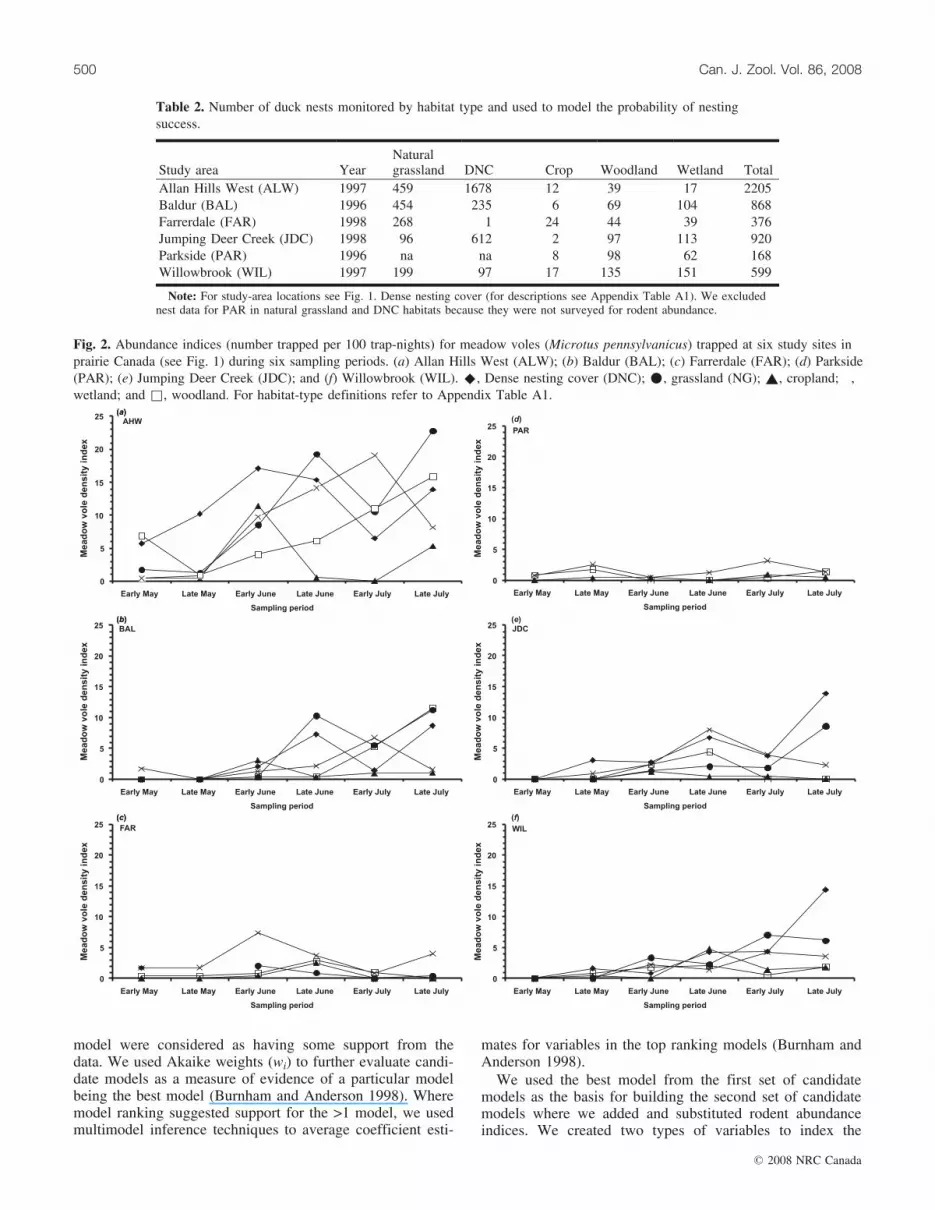
Fig. 2. Abundance indices (number trapped per 100 trap-nights) for meadow voles (Microtus pennsylvanicus) trapped at six study sites inprairie Canada (see Fig. 1) during six sampling periods. (a) Allan Hills West (ALW); (b) Baldur (BAL); (c) Farrerdale (FAR); (d) Parkside(PAR); (e) Jumping Deer Creek (JDC); and (f) Willowbrook (WIL). ^, Dense nesting cover (DNC); *, grassland (NG); ~, cropland; �,wetland; and &, woodland. For habitat-type definitions refer to Appendix Table A1.
500 Can. J. Zool. Vol. 86, 2008
# 2008 NRC Canada

abundance of each rodent species and their total. The firstvariable was an average annual abundance index based onall sampling periods specific to habitat type and study area.The second variable was time- and habitat-specific and wasthe average of each sample period index encompassedwithin the interval for each nest record. The second variablepartially accounts for within-season variation in rodentabundance and better reflects rodent abundance during thetime nests were at risk of predation. After examination ofresults, we decided to evaluate six additional models createda postori that included the curvilinear form of both themeadow vole abundance index (MVhab) and the meadowvole date-specific index (MVdate). These models includedcombinations of variables or new variables in an attempt tofurther explain patterns observed following model selection.
Results
Frequencies of nest intervals used to model nesting suc-cess were not distributed equally among habitat types orstudy areas (Table 2). We used a total of 7 056 nest expo-sure intervals, or 55 651 nest exposure days, to modelnesting-success probability. Mallard nests made up the larg-est component of nests used in the analyses (49.7%) with
blue-winged teal (Anas discors L., 1766), gadwall (Anasstrepera L., 1758), and northern shoveler (Anas clypeata L.,1758) making up 23.1%, 11.1%, and 8.2% of nests, respec-tively. The remaining 7.9% of nests were split among theremaining species (see Table 1). Mean relative nest initia-tion was 38.3 days (SE = 0.20, median = 39 days, and max-imum = 86 days).
We sampled rodent abundance in each of the five habitattypes in each of the six study areas for a total 240 trap-nights each with the exception of the Parkside site (PAR)where we did not sample DNC or natural grassland habitats(excluded nest records for these habitat types for this siteonly). The three most common rodent species trapped in-cluded meadow voles (Microtus pennsylvanicus (Ord,1815); 36.8%), deer mice (Peromyscus maniculatus(Wagner, 1845); 33.9%) and southern red-backed voles(Clethrionomys gapperi (Vigors, 1830); 17.4%) with otherspecies (n = 6) comprising 11.8% of all those trapped.Rodent relative abundance varied within season and betweenstudy sites (Fig. 2).
We ranked models of habitat association by Akaike’sinformation criterion corrected for overdispersion and smallsample sizes (QAICc). There was relatively little selectionuncertainty among the first candidate set (Table 3) wherethe best model (QAICc = 4842.556 and wi = 0.902)was >6.5 QAICc units better than its nearest competitor. Forthe best model, only relative initiation date was statisticallyambiguous, though the interaction between relative initiationdate and DNC was not (Table 4).
There was model selection uncertainty (see Table 3) inthe second set of models so, using multimodel inference,we calculated an aggregate average of each variable coeffi-cient estimate using wi (Table 5). The MVhab ranked thehighest of the rodent indices and had a relatively large aver-age coefficient estimate (b� = 0.147, SE = 0.017). The nextlargest coefficient for a rodent index was also statisticallyunambiguous and was the MVdate (b� = 0.093, SE = 0.042).
Table 3. Candidate models (two sets) describing seasonal effects of duck nesting success in prairieCanada, ranked by Akaike’s information criterion (AIC) and corrected for overdispersion and smallsample sizes (QAICc).
Explanatory variables K –2 log L �QAICca wi
Set 1AGE, RI, SAR, DNC, DNC � RI 6 15 703.2 0 0.902AGE, RI, SAR, DNC 5 15 731.0 6.55 0.034AGE, RI, SAR, HAB, HAB � RI 12 15 687.0 7.03 0.027
Set 2AGE, RI, MVdate, MVdate � RI 5 15 679.2 0.00 0.329AGE, RI, SAR, MVhab, MVhab � RI 6 15 674.1 0.44 0.264AGE, RI, SAR, DNC, DNC � RI, MVdate 7 15 669.4 0.98 0.201AGE, RI, MVhab, MVhab � RI 5 15 686.4 2.25 0.107AGE, RI, DNC, DNC � RI, MVdate 6 15 686.5 4.27 0.039AGE, RI, MVdate 5 15 700.0 6.42 0.013
Note: Set 1 models included habitat and nest characteristic variables, and set 2 models were based on the bestmodel from set 1 with the addition and substitution of rodent abundance indices. Only models with >95% cu-mulative Akaike’s weight (wi) for each set are presented. For variable descriptions see Table 1. Akaike’s modelweight (wi) is the relative likelihood that each model is the best model (of the 38 and 49 models evaluated forsets 1 and 2, respectively), given available data.
ac correction for overdispersion = 3.24 for both sets.
Table 4. Variable coefficient estimates for the bestmodel selected from the first set of candidate models.
Variable b� SE 95% CIIntercept 2.085 0.112 1..797–2.374AGE 0.037 0.002 0..031–0.043RI –0.001 0.002 –0..005 to 0.002DNC 0.719 0.103 0..454–0.983DNC � RI –0.012 0.002 –0..018 to –0.006SAR –1.519 0.300 –2..289 to –0.748
Note: The best model was more than 6.5 QAICc units betterthan the next best model and had over 90% of model weight.For variable descriptions see Table 1. CI, confidence interval.
Brook et al. 501
# 2008 NRC Canada

A plot based on these averaged coefficients for the non-ro-dent abundance indices and MVhab show evidence for a cur-vilinear relationship between predicted daily nest survivalprobability and meadow vole abundance (Fig. 3). The bestmodel (QAICc = 4831.582 and wi = 80.1) from the a postorimodel set was >22 QAICc units better than the best modelfrom the second candidate set with little apparent model se-lection uncertainty (Table 6). The best three a postori mod-els all included MVdate and all ranked better than similarmodels using MVhab. The best model shows unambiguousevidence for a curvilinear relationship between daily nestsurvival probability and MVdate (Table 7). Plotting the rela-
tionship between predicted daily nest survival probabilityand MVdate indicates a nonasymptotic relationship (Fig. 4).
Discussion
We observed a correlation between the indices of meadowvole abundance and nesting success, which suggests strongsupport for an indirect effect of meadow vole abundance onprairie duck nesting success. Our evidence is strengthenedby the fact that we simultaneously modeled other knownsources of variation in prairie duck nesting success andincorporated within-season variation in rodent abundanceusing date-specific indices. However, we could not fullyassess cross-seasonal effects because we had 1 year of datafrom each study site nor could we assess nest-specific habi-tat effects because data were not available for all nests.
Evidence for a curvilinear relationship between rodentabundance and nesting success revealed through a postorianalysis suggests there is a more complex relationshipamong alternative prey, predators, and duck nesting successthan proposed by the APH. The buffering capacity ofrodents for nesting success appears to increase as the rodentpopulation increases (Fig. 4). It then appears to peak andreverse with further increasing alternative prey abundance.
Possibly, duck nests are buffered from predation untilrodents increase to a specific density (about 10–12 meadowvoles / 100 trap-nights, in this instance). Beyond this, preydensities trigger a numerical and functional response inpredator populations causing nesting success to decline withfurther meadow vole density increases. The responsetriggered at higher prey densities may be a multipredatorresponse as numerous predators may respond simultaneouslyto the higher rodent densities. Many predators that prey onducks and duck eggs also prey on small mammals and otherbirds and their eggs (e.g., striped skunk (Mephitis mephitis(Schreber, 1776)), red fox (Vulpes vulpes L., 1758), andcoyote (Canis latrans Say, 1823); Jones et al. 1983;Sargeant et al. 1993). When rodents reach a specific density,
Table 5. Variable coefficients adjusted for model selection uncertaintyby Akaike’s weights (wi) for the second set of candidate models.
Variable b� SE 95% CI CVAGE 0.035 0.003 0..030–0.040 7.2MVhab 0.147 0.017 0..114–0.179 11.3Intercept 1.953 0.232 1..497–2.408 11.9MVhab � RI –0.002 0.000 –0..002 to –0.001 14.9DMdate � RI –0.003 0.001 –0..004 to –0.002 15.7MVdate � RI –0.001 0.000 –0..002 to –0.001 17.5SAR –2.169 0.413 –2..978 to –1.360 19.0DNC 0.558 0.115 0..333–0.783 20.6DNC � RI –0.010 0.002 –0..015 to –0.006 22.6DMhab –0.037 0.016 –0..068 to –0.005 43.8MVdate 0.093 0.042 0..010–0.175 45.4RBVhab –0.023 0.012 –0..047 to 0.001 52.2TOTALdate 0.010 0.005 –0..001 to 0.020 55.2DMdate 0.043 0.076 –0..107 to 0.193 178.0RI –0.003 0.005 –0..012 to 0.007 194.4
Note: Variables are ranked by coefficient of variation (CV) and only modelswith >99% cumulative weight were included. For variable descriptions seeTable 1. CI, confidence interval.
Fig. 3. Graph depicting the predicted relationship between nesting-success probability and an index of meadow vole (Microtus penn-sylvanicus) abundance (no. of voles / 100 trap-nights). Probabilitieswere estimated from an averaged model from the second candidateset (see Results) for six study sites in prairie Canada (see Fig. 1).Habitat types include dense nesting cover (DNC; solid line and95% CI) and other (broken line and 95% CI; for an aggregate of allother habitat types sampled including natural grassland, wetlands,woodlands. and croplands, see Appendix Table A1). Effect of sitewas included as a random variable.
502 Can. J. Zool. Vol. 86, 2008
# 2008 NRC Canada

more predators and predator species may be attracted to thearea and may hunt more intensely than they would at lowerrodent densities, thus increasing encounter rates with ducknests in the vicinity even though predators may not bespecifically hunting for them. Alternatively, relationshipsbetween rodent density and predators may be seasonal incharacter with a coincident increase from offspring produc-tion in both predators and prey later in the season; however,the increase in predators is still likely responsible for theapparent relationship between nesting success and rodentdensity.
We did not specifically identify mechanisms responsiblefor correlation between coexisting prey (rodents and ducknests), so could not rigorously analyze potential causes fora spurious correlation though other evidence allows us toevaluate them. Ackerman (2002) evaluated alternativehypotheses that may explain positive correlations betweenrodent densities and mallard nesting success in California.He suggested that habitat-related effects could be responsi-ble for the correlations. For example, predator hunting effi-ciency for both rodents and ducks nests may be similarlyimpeded by habitat type or quality. Thus, rodents may main-tain higher densities owing to a lack of predator efficiencyin these habitat types, whereas ducks may have lower nestpredation rates for similar reasons. We controlled for theeffect of habitat type in our nesting success models (at acourse scale), but this analysis alone may not explicitlyeliminate the possibility of a spurious correlation of thistype.
Density-dependent predation may cause a spurious corre-
lation between rodent abundance and nesting success. Thisalternate hypothesis similarly suggests a habitat-relatedcause for a correlation. Ackerman (2002) suggested theremay be higher nest predation rates where duck nests are athigher densities. Predators often increase search intensitywhere prey density is highest (Lariviere and Messier 1998).Coincidentally, rodent abundance may also be higher inareas of higher nest density because of superior or preferablehabitat quality. However, Ackerman (2002) found no corre-lation between mallard nesting success and nest density.Similarly, Drever et al. (2004) and Reynolds et al. (2001)found no evidence for a nest density effect on nesting suc-cess nor did Emery et al. (2005) for our data.
Although we cannot explicitly refute these alternativehypotheses (habitat related and density dependence), we dofind evidence supporting the causal mechanisms linkingfluctuations among coexisting prey. Emery et al. (2005)reported that most of the nest loss recorded on our studysites was due to predation (91%). Common nest predators
Table 6. Ranking of a postori models describing variation in probability of duck nesting successfor prairie Canada (see Fig. 1).
Explanatory variables K –2 log L �QAICca wi
AGE, RI, SAR, DNC, DNC � RI, MVdate, MVdate2 8 15 587.1 0.00 0.801
AGE, RI, MVdate, MVd � RI, MVd2 6 15 613.3 4.08 0.104
AGE, RI, MVdate, MVdate2 5 15 620.4 4.27 0.095
AGE, RI, MVdate, MVdate � RI 5 15 679.2 22.42 0.000AGE, RI, MVhab, MVhab � RI, MVhab
2 6 15 676.0 23.43 0.000AGE, RI, SAR, MVhab, MVhab � RI, MVhab
2 7 15 671.1 23.93 0.000
Note: Models were ranked by Akaike’s information criterion corrected for overdispersion and small samplesizes (QAICc). The set includes the best model from the second candidate model set to compare relativerankings (see Table 3). Akaike’s model weight (wi) is the relative likelihood that each model is the best modelgiven available data.
ac correction for overdispersion = 3.24.
Fig. 4. Predicted nesting success and an index of meadow vole(Microtus pennsylvanicus) abundance (no. of voles / 100 tap-nights)for six study sites in prairie Canada (see Fig. 1). Predictions arebased on the most parsimonious a postori model (see Table 6) andaverage relative initiation dates for 15-day-old nests. Habitat typesinclude dense nesting cover (DNC; solid line and 95% CI) andother (broken line and 95% CI; for an aggregate of all other habitattypes sampled including natural grassland, wetlands, woodlands, andcroplands, see Appendix Table A1). Effect of site was included as arandom variable.
Table 7. Variable coefficient estimates from the mostparsimonious model from those selected a postori.
Variable b� SE 95% CIIntercept 2.095 0.087 1..872–2.318AGE 0.031 0.002 0..037–0.002RI –0.009 0.002 –0..014 to –0.005DNC 0.437 0.106 0..166–0.712DNC � RI –0.009 0.002 –0..015 to –0.003SITE –2.043 0.361 –2..971 to –1.114MVdate 0.171 0.016 0..131–0.212MVdate
2 –0.008 0.001 –0..010 to –0.006
Note: For variable descriptions see Table 1. CI, confidenceinterval.
Brook et al. 503
# 2008 NRC Canada

on the study sites included coyote, red fox, striped skunk,and American crow (Corvus brachyrhynchos Brehm, 1822).The striped skunk was suspected as the main predator caus-ing the apparent correlation between vole density and nest-ing success in other studies of this type (Weller 1979;Crabtree and Wolfe 1988; Ackerman 2002). The stripedskunk is known to prey heavily on Microtus species(Pearson 1971; Crabtree and Wolfe 1988; Greenwood et al.1999), as well as on duck eggs (Sargeant et al. 1992; Lari-viere and Messier 1998), and is likely the predator to have apositive functional response to increasing rodent density.However, red fox (Voigt 1987) and coyote (for a review seeVoigt and Berg 1987) also prey on Microtus species andduck nests (Sargeant et al. 1993), therefore, they cannot beeliminated as candidates for linking fluctuations in thecoexisting prey types.
Most evidence for an effect of small mammal abundanceon duck nesting success comes from the relatively less com-plex systems in the arctic and subarctic ecozones (e.g.,Underhill et al. 1993; Bety et al. 2001; Wilson and Bromley2001). Evidence from more southerly latitudes is relativelyscant, but Byers (1974) found blue-winged teal nesting suc-cess to be positively correlated with abundance of meadowvoles at his study site in Iowa, which was typical of thesouthern Prairie Pothole Region. Also, Crabtree and Wolfe(1988) indicate that natural and experimental alternativefood sources directly affected skunk predation (bufferingeffect) on waterfowl nests at their study site in Utah andfound that skunks had a high proportion of Microtus speciesin their stomach contents. Weller (1979) also suggested thatbuffer prey may be important and higher buffer prey abun-dance was correlated with higher nest success at his studysite in Iowa. He found a negative correlation between blue-winged teal nesting density and nesting success.
There may be a causal relationship between alternativeprey (small mammals) and waterfowl nesting success insouthern latitudes (e.g., Greenwood et al. 1995; Drever etal. 2004; Emery et al. 2005) and some provide indirect evi-dence (Byers 1974; Weller 1979; Ackerman 2002) as we do;however, the critical experiments have not been done. Werecommend an experiment be conducted (e.g., Krebs et al.2001) in the Prairie Pothole Region to assess causal mecha-nisms and sources of variation for the apparent correlationbetween predator abundance and their alternate prey. Thefocus needs to be equally on all parts of ecosystem function(top-down and bottom-up regulation of the predator–preydynamics) with no specific focus on prey types (i.e., nestingsuccess). Regardless, the evidence presented herein and fromothers strongly suggests that predator–prey dynamics shouldbe considered in the management and conservation plans forwaterfowl and species of concern in this biome.
AcknowledgementsThis study was conducted as part of the Prairie Habitat
Joint Venture Assessment program of the North AmericanWaterfowl Management Plan. We thank site leadersR.B. Emery, P.E. Gudehus, B.L. Joynt, and G.G. Mack, aswell as the many crew leaders and research technicians, forassistance with data collection. Ducks Unlimited staff fromSaskatchewan and Manitoba provided valuable support dur-ing site selection, landowner contacts, decoy trapping, and at
various other times throughout the field seasons. We thankM.G. Anderson and two anonymous reviewers who com-mented on an earlier draft and greatly improved the manu-script. Financial support was provided by Ducks UnlimitedCanada, Ducks Unlimited Inc., the Canadian Wildlife Serv-ice, the National Fish and Wildlife Foundation, and theNorth American Wetlands Conservation Council throughthe Institute for Wetland and Waterfowl Research. Wegratefully acknowledge the cooperation of landowners inSaskatchewan and Manitoba for granting land access.
ReferencesAckerman, J.T. 2002. Of mice and mallards: positive indirect
effects of coexisting prey on waterfowl nest success. Oikos, 99:469–480. doi:10.1034/j.1600-0706.2002.11802.x.
Angelstam, P., Lindstrom, E., and Widen, P. 1984. Role of preda-tion in short-term population fluctuations of some birds andmammals in Fennoscandia. Oecologia (Berl.), 62: 199–208.doi:10.1007/BF00379014.
Angelstam, P., Lindstrom, E., and Widen, P. 1985. Synchronousshort-term population fluctuations of some birds and mammalsin Fennoscandia — occurrence and distribution. Holarct. Ecol.8: 285–298.
Batzli, G.O. 1996. Population cycles revisited. Trends Ecol. Evol.11: 488–489. doi:10.1016/S0169-5347(96)30053-0.
Beauvais, G.P., and Buskirk, S.W. 1999. Modifying estimates ofsampling effort to account for sprung traps. Wildl. Soc. Bull.27: 39–43.
Bety, J., Gauthier, G., Giroux, J.-F., and Korpimaki, E. 2001. Aregoose nesting success and lemming cycles linked? Interplaybetween nest density and predators. Oikos, 93: 388–400. doi:10.1034/j.1600-0706.2001.930304.x.
Brook, R.W., Duncan, D.C., Hines, J.E., Carriere, S., and Clark,R.G. 2005. Effects of small mammal cycles on productivityof boreal forest ducks. Wildl. Biol. 11: 3–12. doi:10.2981/0909-6396(2005)11[3:EOSMCO]2.0.CO;2.
Burnham, K.P., and Anderson, D.R. 1998. Model selection andinference: a practical information–theoretic approach. Springer-Verlag, New York.
Byers, S.M. 1974. Predator–prey relationships on an Iowa water-fowl nesting area. Trans. N. Am. Wildl. Nat. Resour. Conf. 39:223–229.
Carlson, J.D., Jr., Clark, W.R., and Klaas, E.E. 1993. A model ofthe productivity of the northern pintail. U.S. Fish Wildl. Serv.Biol. Rep. No. 7.
Cowardin, L.M., Carter, V.C., Golet, F.C., and Laroe, E.T. 1979.Classification of wetlands and deepwater habitats of the UnitedStates. U.S. Department of the Interior, Fish and Wildlife Ser-vice, Washington, D.C.
Crabtree, R.L., and Wolfe, M.L. 1988. Effects of alternative preyon skunk predation of waterfowl nests. Wildl. Soc. Bull. 16:163–169.
Drever, M.C., Wins-Purdy, A., Nudds, T.D., and Clark, R.G. 2004.Decline of duck nest success revisited: relationships with preda-tors and wetlands in dynamic prairie environments. Auk, 121:497–508. doi:10.1642/0004-8038(2004)121[0497:DODNSR]2.0.CO;2.
Emery, R.B., Howerter, D.W., Armstrong, L.M., Anderson, M.D.,Devries, J.H., and Joynt, B.L. 2005. Seasonal variation in water-fowl nesting success and its relation to habitat management inthe Canadian prairies. J. Wildl. Manag. 69: 1181–1193. doi:10.2193/0022-541X(2005)069[1181:SVIWNS]2.0.CO;2.
Gloutney, M.L., Clark, R.G., Afton, A.D., and Huff, G.J. 1993.
504 Can. J. Zool. Vol. 86, 2008
# 2008 NRC Canada

Timing of nest searches for upland nesting waterfowl. J. Wildl.Manag. 57: 597–601. doi:10.2307/3809288.
Greenwood, R.J., Sargeant, A.B., Johnson, D.H., Cowardin, L.M.,and Shaffer, T.L. 1995. Factors associated with duck nest suc-cess in the prairie pothole region of Canada. Wildl. Monogr.No. 128.
Greenwood, R.J., Pietruszewski, D.G., and Crawford, R.D. 1998.Effects of food supplementation on depredation of duck nests inupland habitat. Wildl. Soc. Bull. 26: 219–226.
Greenwood, R.J., Sargeant, A.B., Piehl, J.L., Buhl, D.A., and Han-son, B.A. 1999. Foods and foraging of prairie striped skunksduring the avian nesting season. Wildl. Soc. Bull. 27: 823–832.
Hoekman, S.T., Mills, L.S., Howerter, D.W., Devries, J.H., andBall, I.J. 2002. Sensitivity analysis of the life cycle of mid-continent mallards. J. Wildl. Manag. 66: 883–900. doi:10.2307/3803153.
Holt, R.D. 1977. Predation, apparent competition and the structureof prey communities. Theor. Popul. Biol. 12: 197–229. doi:10.1016/0040-5809(77)90042-9. PMID:929457.
Jimenez, J.E., Conover, M.R., and Messmer, T.A. 2001. Exclusion-ary methods to reduce predation on ground-nesting birds andtheir nests. Berryman Institute Publ. No. 20, Utah State Univer-sity, Logan.
Johnson, D.H., Sargeant, A.B., and Greenwood, R.J. 1989. Impor-tance of individual species of predators on nesting success ofducks in the Canadian prairie pothole region. Can. J. Zool. 67:291–297. doi:10.1139/z89-043.
Jones, J.K., Jr., Armstrong, D.M., Hoffmann, R.S., and Jones, C.1983. Mammals of the northern Great Plains. University ofNebraska Press, Lincoln.
Kaufman, G.A., and Kaufman, D.W. 1997. Ecology of small mam-mals in prairie landscapes. Ecological Studies 125. In Ecologyand conservation of Great Plains vertebrates. Edited byF.L. Knopf and F.B. Samson. Springer-Verlag, New York.pp. 207–243.
Kenward, R.E. 1985. Problems of goshawk predation on pigeonsand other game. Proc. Int. Ornithol. Congr. 18: 666–678.
Klett, A.T., and Johnson, D.H. 1982. Variability in nest survivalrates and implications to nesting studies. Auk, 99: 77–87.
Klett, A.T., Duebbert, H.F., Faanes, C.A., and Higgins, K.F. 1986.Techniques for studying nest success of ducks in upland habitatsin the prairie pothole region. U.S. Fish Wildl. Serv. Resour.Publ. No. 158.
Klett, A.T., Shaffer, T.L., and Johnson, D.H. 1988. Duck nest suc-cess in the prairie pothole region. J. Wildl. Manag. 52: 431–440.doi:10.2307/3801586.
Krapu, G.L., Pietz, P.J., Brandt, D.A., and Cox, R.R., Jr. 2000.Factors limiting mallard brood survival in Prairie Pothole Land-scapes. J. Wildl. Manag. 64: 553–561. doi:10.2307/3803253.
Krebs, C.J., Boutin, S., and Boonstra, R. 2001. Ecosystemdynamics of the boreal forest: the Kluane project. Oxford Uni-versity Press, New York.
Lack, D. 1954. The natural regulation of animal numbers. Claren-don Press, Oxford.
Lariviere, S., and Messier, F. 1998. Effect of density and nearestneighbours on simulated waterfowl nests: can predators recog-nize high-density nesting patches? Oikos, 83: 12–20. doi:10.2307/3546541.
Littell, R.C., Stroup, W.W., and Freund, R.J. 2002. SAS for linearmodels. 4th ed. SAS Institute Inc., Cary, N.C.
Lokemoen, J.T. 1984. Examining economic efficiency of manage-ment practices that enhance waterfowl production. Trans. N.Am. Wildl. Nat. Resour. Conf. 49: 584–607.
McCullagh, P., and Nelder, J.A. 1989. Generalized linear models.2nd ed. Chapman and Hall, New York.
Norrdahl, K., and Korpimaki, E. 2000. Do predators limit the abun-dance of alternative prey? Experiments with vole-eating avianand mammalian predators. Oikos, 91: 528–540. doi:10.1034/j.1600-0706.2000.910315.x.
Pearson, O.P. 1971. Additional measurements of the impact of car-nivores on California voles (Microtus californicus). J. Mammal.52: 41–49. doi:10.2307/1378430.
Reynolds, R.E., Shaffer, T.L., Renner, R.W., Newton, W.E., andBatt, B.D.J. 2001. Impact of the Conservation Reserve Programon duck recruitment in the U.S. Prairie Pothole region. J. Wildl.Manag. 65: 765–780. doi:10.2307/3803027.
Rotella, J.J., Dinsmore, S.J., and Shaffer, T.L. 2004. Modelingnest-survival data: a comparison of recently developed methodsthat can be implemented in MARK and SAS. Anim. Biodivers.Conserv. 27: 187–204.
Sargeant, A.B., and Raveling, D.G. 1992. Mortality during thebreeding season. In Ecology and management of breeding water-fowl. Edited by B.D.J. Batt, A.D. Afton, M.G. Anderson, C.D.Ankney, D.H. Johnson, J.A. Kadlec, and G.L. Krapu. Universityof Minnesota Press, Minneapolis. pp. 396–422.
Sargeant, A.B., Greenwood, R.J., Sovada, M.A., and Shaffer, T.L.1993. Distribution and abundance of predators that affect duckproduction: Prairie Pothole Region. U.S. Fish Wildl. Serv.Resour. Publ. No. 194.
SAS Institute Inc. 2000. SAS/STAT user’s guide. Version 8. SASInstitute Inc., Cary, N.C.
Schmidt, K.A. 1999. Foraging theory as a conceptual frameworkfor studying nest predation. Oikos, 85: 151–160. doi:10.2307/3546801.
Underhill, L.G., Prys-Jones, R.P., Syroechkovski, E.E., Groen,N.M., Karpov, V., Lappo, H.G., Van Roomen, M.W.J., Rybkin,A., Schekkerman, H., Spiekman, H., and Summers, R.W. 1993.Breeding of waders (Charadrii) and brent geese Branata berni-cla bernicla at Pronchishcheva Lake, northeastern Taimyr, Rus-sia, in a peak and a decreasing lemming year. Ibis, 135: 277–292. doi:10.1111/j.1474-919X.1993.tb02845.x.
Voigt, D.R. 1987. Red fox. In Wild furbearer management andconservation in North America. Edited by M. Novak, J.A. Ba-ker, M.E. Obbard, and B. Malloch. The Ontario Trappers Asso-ciation, Ministry of Natural Resources, Toronto. pp. 378–392.
Voigt, D.R., and Berg, W.E. 1987. Coyote. In Wild furbearer man-agement and conservation in North America. Edited by M. No-vak, J.A. Baker, M.E. Obbard, and B. Malloch. The OntarioTrappers Association, Ministry of Natural Resources, Toronto.pp. 344–357.
Weller, M.W. 1956. A simple field candler for waterfowl eggs. J.Wildl. Manag. 20: 111–113. doi:10.2307/3797414.
Weller, M.W. 1979. Density and habitat relationships of blue-winged teal nesting in Northwestern Iowa. J. Wildl. Manag. 43:367–374. doi:10.2307/3800345.
Wilson, D., and Bromley, R. 2001. Functional and numerical re-sponses of predators to cyclic lemming abundance: effects onloss of goose nests. Can. J. Zool. 79: 525–532. doi:10.1139/cjz-79-3-525.
Appendix ATable A1 appears on the following page.
Brook et al. 505
# 2008 NRC Canada

Table A1. Description of habitat types.
Nest cover type DescriptionCropland Areas that are tilled and planted to grain or row crops, that are ploughed
and left fallow, or contain crop residueGrassland Areas vegetated with various mixtures of native and (or) introduced grasses,
forbs, trees, and shrubs; grassland may be idled, grazed, or hayedWetland All areas, regardless of size, mapped as wetland according to definitions in
Cowardin et al. (1979)a; wetland may be idled, grazed, or hayedWoodland Areas of shrubs 0.5–6 m tall that have an aerial cover >30% or with woody
plants (trees or tall shrubs) >6 m in height having an aerial cover >30%;woodland may be idled or grazed
DNC Former cropland areas now seeded to native or introduced grasses and (or)forbs and then idled
Note: DNC, dense nesting cover.aL.M. Cowardin, V.C. Carter, F.C. Golet, and E.T. Laroe. 1979. Classification of wetlands and deepwater
habitats of the United States. U.S. Department of the Interior, Fish and Wildlife Service, Washington, D.C.
506 Can. J. Zool. Vol. 86, 2008
# 2008 NRC Canada


