Embed Size (px)
Citation preview

Influence of subsurface drainage on quantity and qualityof dissolved organic matter export from agricultural landscapes
Brent J. Dalzell,1 Jennifer Y. King,1,2 David J. Mulla,1 Jacques C. Finlay,3
and Gary R. Sands4
Received 1 September 2010; revised 17 March 2011; accepted 22 March 2011; published 16 June 2011.
[1] Despite its importance for aquatic ecosystem function and watershed carbon budgets,little is known about how land use influences dissolved organic matter (DOM) export. Weinvestigated the influence of subsurface soil drainage, widespread in the MidwesternUnited States, on DOM export from agricultural fields designed to drain water at either13 mm d−1 (conventional) or 51 mm d−1 (intense). Intense drainage exported 55% (±22%)more dissolved organic carbon (DOC) per year than conventional drainage due toboth increased concentration and water yield. DOC export from plots was stronglydependent on precipitation and showed considerable interannual variability. Mean DOCconcentrations in drainage water were low (1.62 and 1.87 mg L−1 for conventional andintense treatments), and fluorescence index (FI) measurements showed that it had amicrobial source with little evidence of terrestrially derived material, suggesting that flowthrough deeper, organic‐poor soil horizons is important in regulating DOC export fromthese plots. We compared DOM in subsurface drains with downstream ditch and streamsites. Increases in DOC concentration and molecular weight accompanied by decreasingFI values at downstream sites showed that streams gain a large amount of terrestriallyderived DOM during base flow transport through agricultural landscapes, probably fromriparian zones. These results show that DOM compositional characteristics change withcatchment area and that the relevant observation scale for DOM dynamics is likely to varyamong watersheds. This study also demonstrates that land management practices candirectly affect DOC via changes to water flow paths. These results are critical forimproving model estimates of DOM export from agricultural landscapes as well aspredicting how DOC export will respond to changing land use and climate.
Citation: Dalzell, B. J., J. Y. King, D. J. Mulla, J. C. Finlay, and G. R. Sands (2011), Influence of subsurface drainage onquantity and quality of dissolved organic matter export from agricultural landscapes, J. Geophys. Res., 116, G02023,doi:10.1029/2010JG001540.
1. Introduction
[2] The export of dissolved organic carbon (DOC) oftencomprises a small portion of local and regional carbon (C)budgets when compared against gaseous C efflux from soilrespiration. Global DOC flux is estimated at 0.36 Pg C yr−1
[Aitkenhead and McDowell, 2000] compared to 75 Pg C yr−1
for soil respiration [Schlesinger and Andrews, 2000]. How-ever, watershed scale DOC loss is comparable to net eco-system productivity [Cole and Caraco, 2001; Cole et al.,
2007], and it has been demonstrated that a portion ofthe DOC pool can be reactive over relatively short (daily tomonthly) timescales as a result of photochemical andmicrobial degradation [e.g., Moran et al., 2000; Seitzingeret al., 2005;Dalzell et al., 2009]. This degradation representsa source of atmospheric CO2 that can be nearly an order ofmagnitude greater than annual DOC export at the mouth oflarge rivers and therefore represents an important componentof regional C budgets [Frankignoulle et al., 1998; Richeyet al., 2002]. Further, the reactive portion of the DOC poolcan play an important role in supporting the base of theaquatic food web, and it has been shown that DOC sourceand quality can vary with watershed conditions of flow[Buffam et al., 2001; Dalzell et al., 2005; Vidon et al., 2008]and land use [Cronan et al., 1999; Wilson and Xenopoulos,2009] and that qualitative differences in DOC can impactrates of respiration by aquatic microbes [Amon and Benner,1996]. In addition to quantifying and characterizing DOCexport from larger streams and rivers [Aitkenhead andMcDowell, 2000; Bianchi et al., 2004], there is also a need
1Department of Soil, Water, and Climate, University of Minnesota–Twin Cities, St. Paul, Minnesota, USA.
2Now at Department of Geography, University of California, SantaBarbara, California, USA.
3Department of Ecology, Evolution, and Behavior, University ofMinnesota–Twin Cities, St. Paul, Minnesota, USA.
4Department of Bioproducts and Biosystems Engineering, University ofMinnesota–Twin Cities, St. Paul, Minnesota, USA.
Copyright 2011 by the American Geophysical Union.0148‐0227/11/2010JG001540
JOURNAL OF GEOPHYSICAL RESEARCH, VOL. 116, G02023, doi:10.1029/2010JG001540, 2011
G02023 1 of 13

to study smaller streams and rivers in order to capturehydrologic variability that influences DOC quantity, source,and transformations that occur over smaller spatial andtemporal scales [Dalzell et al., 2007; Saraceno et al., 2009].[3] In addition to broad changes in standing vegetation
and soil disturbance via cultivation, landscape conversionto agriculture is commonly accompanied by dramaticchanges in hydrology via construction of drainage ditchesand installation of subsurface drainage systems [Blann et al.,2009; Schilling et al., 2008]. Subsurface drainage is espe-cially common in the agriculturally dominated MidwesternUnited States [Zucker and Brown, 1998] where it can improvecrop yields and reduce interannual yield variability. In 1985,an average of 30% of cropland had been modified withdrainage (both surface ditches and subsurface drainage) inthe upper Midwest (Illinois, Indiana, Iowa, Ohio, Minnesota,Michigan, Missouri, Wisconsin) [Pavelis, 1987]. While theextent of new subsurface drainage installations is no longercompiled, private installation has continued in the form of newdrainage systems as well as improvements to existing systems.From a water quality standpoint, the presence of subsurfacedrainage tends to reduce overland flow, thereby reducingsediment and phosphorus losses from farm fields [Blann et al.,2009]. Conversely, subsurface drainage increases export ofexcess nitrogen from farm fields [Sands et al., 2008] and is astrong contributing factor to the zone of hypoxia in the Gulfof Mexico [Turner and Rabalais, 2003].[4] Dissolved organic matter (DOM) source, export, and
quality are affected by terrestrial vegetation sources [Aitkenheadand McDowell, 2000] as well as by physical and biologicalfactors that control decomposition and eventual incorpora-tion of decomposition products into soil organic matter[Essington, 2004]. Soil organic matter influence on streamchemistry is dependent on flow path, and it has been shownthat stream DOC is similar to concentrations found in soilwater from deeper soil horizons (B) despite high concen-trations observed in leachate from surface soil [McDowelland Wood, 1984]. However, organic‐rich surface soilsand wetlands have been shown contribute substantially tostream DOC when hydrologic conditions ensure connectiv-ity of these important DOC sources to their receivingwaterways [Finlay et al., 2006; Morel et al., 2009; Pacificet al., 2010].[5] In agricultural landscapes, management practices that
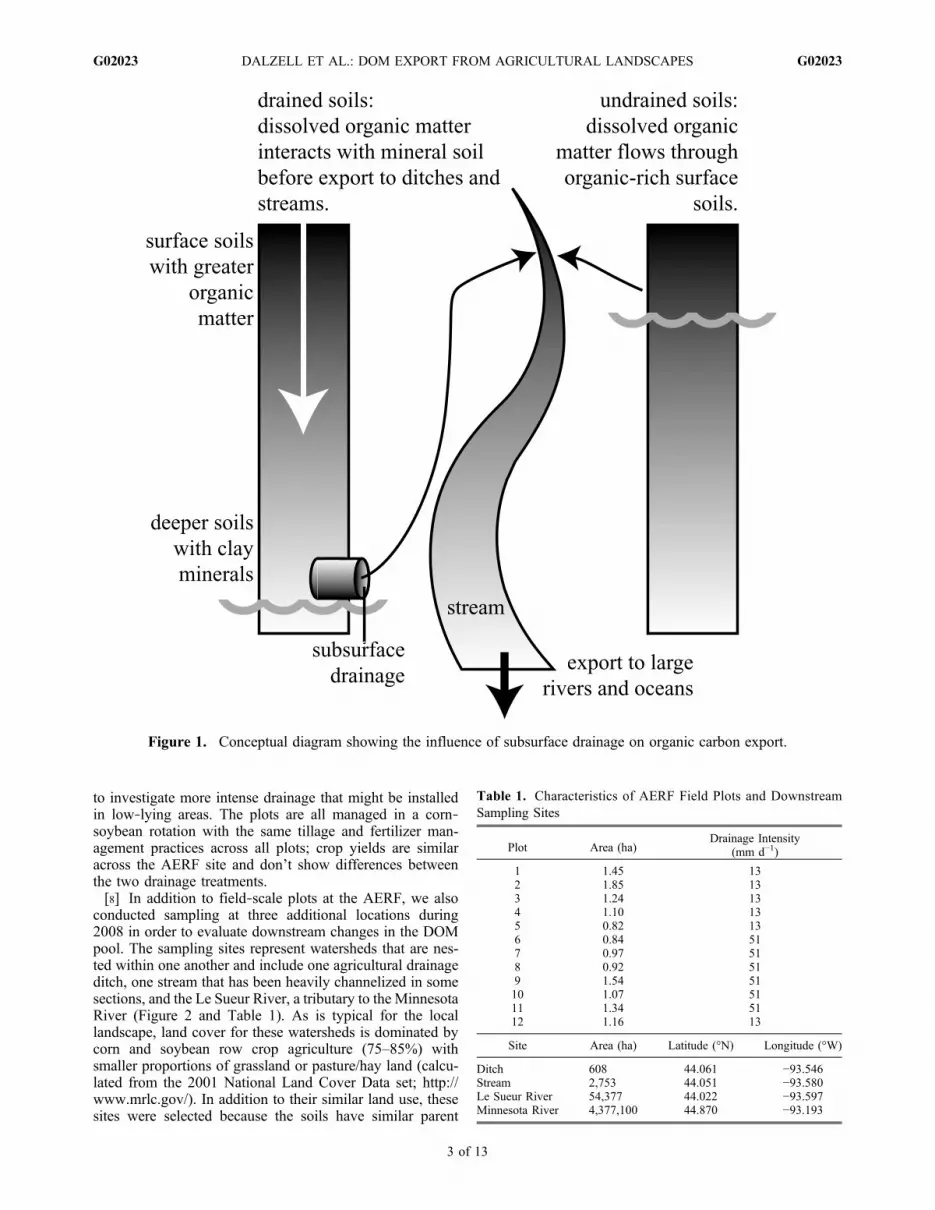
help to ensure consistent crop productivity will also influ-ence the physical and biological factors responsible forproduction and export of DOM. It remains poorly under-stood how subsurface drainage may influence the quantityand quality of DOC export from agriculturally dominatedlandscapes. In presettlement landscapes, high water tables(in low‐lying or poorly drained soils) are likely to haveresulted in larger fractions of flow that would have inter-acted with organic‐rich surface soils. In a similar landscapemodified with subsurface drainage, the majority of excesssoil water will infiltrate through deeper soil layers charac-terized by lower organic carbon content and elevated claymineral contents (Figure 1). In laboratory‐scale soil columnstudies, Guo and Chorover [2003] showed that soil leachingpreferentially removed compounds characterized by highmolecular weights and that a proportion of removed DOMformed a strong association with the soil matrix and wasresistant to desorption. In the agriculturally dominated por-
tions of the upper Midwest, changes to water flow paths dueto the installation of subsurface drainage systems funda-mentally change the movement of DOC in the landscape.Understanding these aspects of DOC source, export, andbioavailability is essential to predicting how the carboncycle will be influenced by increasing demands for agri-culture to provide food, fiber, and fuel for a growing pop-ulation against the backdrop of a changing climate. Thegoals of this study are to quantify and characterize theexport of DOC from fields that have been modified withsubsurface drainage systems and to quantify the persistenceof this signal at downstream locations. To address thesegoals, wemeasured flow andDOC concentrations in drainagewater from a suite of 12 experimental subsurface drainageplots located in south central Minnesota. Further, DOC fromthese plots was characterized (via molecular weight, opticalproperties, and microbial availability) and compared againstDOC from downstream sites to assess the persistenceof DOC export from field drainage relative to DOC exportin higher order streams in an agriculturally dominatedlandscape.
2. Materials and Methods
2.1. Study Area
[6] This study was performed from 2007 to 2009 withinthe Le Sueur River Basin located in south central Minnesota.The region is dominated by corn‐soybean row crop agri-culture, and over 85% of the local landscape is currentlyunder agricultural production. Within the Le Sueur RiverBasin lies the Agricultural Ecology Research Farm (AERF),part of the University of Minnesota Southern Research andOutreach Center located in Waseca, Minnesota (44.063°N,93.539°W). Average elevation of the site is 343 m abovesea level. The terrain is characterized as flat‐to‐undulatingwith slopes of field plots at the AERF ranging from 0 to 5%(average = 1.4%). Soils in the area are Mollisols (Clarion‐Nicollet‐Webster association) developed under tall grassprairies. They are generally poorly drained with texturesranging from silty clay loam to clay loam [Sands et al., 2008].These are agriculturally productive soils with organic carboncontent in the plow layer ranging from 2.9 to 5.8% and claycontent in all horizons ranging from 24 to 43% [Reuter andBell, 2003]. Average annual precipitation (1971–2000) forthe AERF is 881 mm, including 1390 mm as snow (139 mmequivalent water depth) [Sands et al., 2008]. The main periodof soil drainage occurs during late spring to early summerwhen soil water content is high from the combined effectof snowmelt, rainfall, and low rates of evapotranspiration[Jin and Sands, 2003].[7] The AERF contains a suite of experimental plots that
were designed to investigate the influence of the depth andspacing of subsurface drainage on export of water andnitrogen from agricultural landscapes [Luo et al., 2010; Sandset al., 2001, 2008]. Nine original plots were established in2001; in fall 2006, the site was modified to result in 12 plots,each of roughly 1 ha in area (Table 1). The subsurfacedrainage was installed with varying depth and spacingdesigned to remove either 13 or 51 mm of water depthequivalent per day [Sands et al., 2001]. The 13 mm drainagecoefficient (conventional) reflects typical design for theregion while the 51 mm treatment (intense) was designed
DALZELL ET AL.: DOM EXPORT FROM AGRICULTURAL LANDSCAPES G02023G02023
2 of 13
to investigate more intense drainage that might be installedin low‐lying areas. The plots are all managed in a corn‐soybean rotation with the same tillage and fertilizer man-agement practices across all plots; crop yields are similaracross the AERF site and don’t show differences betweenthe two drainage treatments.[8] In addition to field‐scale plots at the AERF, we also
conducted sampling at three additional locations during2008 in order to evaluate downstream changes in the DOMpool. The sampling sites represent watersheds that are nes-ted within one another and include one agricultural drainageditch, one stream that has been heavily channelized in somesections, and the Le Sueur River, a tributary to the MinnesotaRiver (Figure 2 and Table 1). As is typical for the locallandscape, land cover for these watersheds is dominated bycorn and soybean row crop agriculture (75–85%) withsmaller proportions of grassland or pasture/hay land (calcu-lated from the 2001 National Land Cover Data set; http://www.mrlc.gov/). In addition to their similar land use, thesesites were selected because the soils have similar parent
Figure 1. Conceptual diagram showing the influence of subsurface drainage on organic carbon export.
Table 1. Characteristics of AERF Field Plots and DownstreamSampling Sites
Plot Area (ha)Drainage Intensity
(mm d−1)
1 1.45 132 1.85 133 1.24 134 1.10 135 0.82 136 0.84 517 0.97 518 0.92 519 1.54 5110 1.07 5111 1.34 5112 1.16 13
Site Area (ha) Latitude (°N) Longitude (°W)
Ditch 608 44.061 −93.546Stream 2,753 44.051 −93.580Le Sueur River 54,377 44.022 −93.597Minnesota River 4,377,100 44.870 −93.193
DALZELL ET AL.: DOM EXPORT FROM AGRICULTURAL LANDSCAPES G02023G02023
3 of 13

material (calcareous loamy glacial till) and they are closeenough to minimize weather variability and facilitate samplecollection.
2.2. Flow Measurements
[9] Prior to 2007, flow was measured in all plots viacustom‐built tipping bucket gauges. During the summer of2007, tipping bucket gauges were replaced with electro-magnetic flowmeters (Seametrics EX80) to measure velocity,and flow volume was calculated based on the dimensions ofthe outlet pipe. The electromagnetic flowmeters wereexchanged during the peak of the growing season when flowwas not occurring from the plots. All flowmonitoring deviceswere calibrated in the laboratory before field deployment.There were intermittent problems with flow data collectiondue to failure of either batteries or data recording equip-ment. In those cases, flow values were substituted by linearregression equations developed against measured data fromother plot(s); r2 values between observed and regression‐predicted data ranged from 0.88 to 0.97. Regression‐predicted flow data amounts to approximately 12% of thetotal water yield from 2001 to 2008. In cases where flow wasbelow the detection limit (but visually observed in the fieldas a slow trickle of water), a flow value of half of the min-imum recorded flow value was used. Flow data from 2005 to2009 for the Minnesota River at Ft. Snelling were obtainedfrom the USGS National Water Information System (http://waterdata.usgs.gov/nwis/).
2.3. Sample Collection and Filtration
[10] Water samples were collected approximately weeklywhen drainage was present from April through October in2007–2008. Sampling was conducted more frequently dur-
ing periods of high flow, and sampling trips were timed tocapture flow resulting from rainfall events when possible. Ingeneral, manual grab samples were collected into acid‐washed HDPE or LDPE bottles and returned to the labo-ratory within 2–3 h for immediate processing and storageor analysis. For a small number of samples collected in2008, samples were collected via autosampler (ISCO) intoacid‐washed bottles that were prespiked with HCl [Kaplan,1994] or CuSO4 [Winslow et al., 2001] to inhibit microbialgrowth. While it is possible that the presence of Cu+2 canresult in DOC flocculation (particularly when DOC con-centrations are high), flocculation was not observed with thesamples in this study. Comparisons of samples that werecollected and processed immediately against samples thatwere simultaneously collected into autosampler bottles (andnot retrieved for up to 9 days) showed no differences in DOCconcentrations (paired t test, p = 0.19; n = 3). The data indi-cate that field preservation was effective or degradation ofDOC from subsurface drainage plots was not significant overthese time periods.[11] A comparison of DOC concentrations of whole water
versus 0.7 mm filtered samples showed no differences, sug-gesting that particulate organic carbon concentrations werenegligible in samples from subsurface drainage plots.Therefore, samples from 2007 (drainage plots only) were notfiltered. In 2008, when drainage plot samples were collectedin conjunction with samples from downstream ditch and riversites, all samples (including drainage plots) were 0.7 mmfiltered in order to ensure that all samples received equivalenttreatment. Glass fiber filters (Whatman GF/F, 47 mm, nom-inal pore size = 0.7 mm) were precombusted (>4 h at 450°C)prior to use. Samples were analyzed for DOC content eitherwithin 24 h of collection or stored frozen until analysis.
Figure 2. Study area map showing the location of the University of Minnesota Agricultural EcologyResearch Farm (AERF) and downstream sampling sites used in this study. Coordinates for sampling sitesare provided in Table 1.
DALZELL ET AL.: DOM EXPORT FROM AGRICULTURAL LANDSCAPES G02023G02023
4 of 13
2.4. Microbial Degradation Experiment
[12] One method to evaluate DOM bioavailability is totrack changes in concentration over time when exposed toassemblages of aquatic bacteria. DOC respired over thecourse of the experiment is assumed to be relatively labile,while the remaining DOC is assumed to be refractory overthe time period of interest. Differing time periods rangingfrom hours [Buffam et al., 2001] to months [Vahatalo andWetzel, 2004] have been applied depending on the DOMsource and expected lability. For this experiment, wetracked decline in DOC concentration over a 14 day period,similar to time periods used in other studies of stream, river,and estuarine water [Amon and Benner, 1996; Seitzingeret al., 2005]. Decomposition rates were estimated by fittingthe data to a simple exponential decay model:
DOCt ¼ DOC0e�kt
where DOC0 and DOCt are DOC concentrations (normal-ized to the starting concentration) at time 0 and time t,respectively; time is in days and k is the decay constant.Nonlinear regression on normalized DOC data were used toarrive at the best estimate of the decay constant, k, for eachreplicate.[13] Samples were collected on 27 April 2009 (the onset
of subsurface drainage at our field sites) along a transectranging from the field site to downstream ditch, stream, andLe Sueur River sites. Samples were immediately returned tothe laboratory and sterile filtered by passing them through a0.1 mm PES cartridge filter (Whatman Polycap 75). Prior touse, all cartridge filters were thoroughly rinsed with low‐DOC (<0.1 mg L−1) DI water, and blanks collected beforeintroducing the sample showed that the filters were not asource of DOC. Following filtration, filter cartridges fromall sites were back‐flushed into one common beaker in orderto collect an assemblage of microbes from all field samplingsites. This beaker was sonicated for 2.5 min in order toinhibit protists without affecting bacterial growth [Seitzingerand Sanders, 1997]. Sterile‐filtered samples were inoculatedwith bacteria from the common beaker to ensure that alltreatments started with the same bacterial assemblage. Inoc-ulated samples were divided into three 900 mL replicates foreach site and placed into 1 L Pyrex bottles (precombustedglass with acid‐washed caps) and placed on a roller table ina dark room at ambient temperature. Each replicate wassampled at day 0 and day 14 for optical characterization(UV/Vis and Fluorescence). Throughout the experiment,20 mL subsamples were collected after 1, 2, 4, 8, and 14 daysto track changes in DOC concentration.
2.5. DOC Measurements
[14] DOC concentrations were measured on a TOC ana-lyzer (Shimadzu TOC Vcpn, Shimadzu Corp., Kyoto,Japan) via high‐temperature combustion over a Pt catalyst.Each batch of samples was measured against a 5‐pointcalibration curve (including the blank) made from MilliQwater (>18.0 MW) and potassium hydrogen phthalate stan-dards. The best 2 of 3 replicate injections were used for eachsample, and the average coefficient of variation of allsamples and standards was 1.60% (range: 0.09 to 8.00%).Check standards were inserted throughout all runs, andaverage accuracy was within 0.10 mg L−1 of expected values
(range: −0.56 to 0.17 mg L−1). DOC concentration data forthe Minnesota River were obtained from the Twin CitiesMetropolitan Council (http://www.metrocouncil.org/). Datafrom 2002 to 2006 were used in this study to estimate typicalriver DOC concentrations for the current landscape (morerecent data were not available at the time of this study).
2.6. UV/Visible Absorbance Measurementsand SUVA254
[15] UV/Vis measurements were performed on samplesused in the microbial availability experiment (27 April 2009).Absorbance spectra were collected on a UV/Vis spectro-photometer (Varian Cary 50, Palo Alto, California). Sampleswere collected from l = 200 to 600 nm and blank corrected(Nanopure water).[16] UV/Vis spectra were used to determine whether to
correct for inner filter effects of excitation‐emission matri-ces (EEMs described below). UV/Vis spectra were also usedto calculate indices commonly applied to indicate DOMquality such as specific UV absorbance at l = 254 nm(SUVA254) which is the ratio of UV absorbance at 254 nm(m−1) to DOC concentration (mg C L−1); SUVA values arereported in units of L mg C−1 m−1. SUVA254 values havebeen shown to be strongly correlated to the aromaticity ofDOC [Weishaar et al., 2003]. Error for SUVA254 valueswas propagated based on standard deviations of replicatemeasurements of DOC and UV/Vis absorbance as describedby Skoog et al. [1998]. It has been shown that the presenceof dissolved iron can affect UV/Vis spectra and thatSUVA254 values may be affected at concentrations greaterthan 0.5 mg L−1 [Weishaar et al., 2003]. We measured totaldissolved iron from samples collected during spring flowconditions (April 2009) via inductively coupled plasma‐optical emission spectrometry (Perkin‐Elmer Optima 3000);concentrations at field, ditch, stream, and river sites were allbelow 0.016 mg L−1.
2.7. Fluorescence Index
[17] Excitation‐emission matrices (EEMs) were collectedon water samples before and after the microbial degradationexperiment with a fluorometer (HORIBA Jobin YvonFluoroMax‐3) following procedures of Cory and McKnight[2005]. Spectra were collected over an excitation range of240–400 nm (every 5 nm) and an emission range of 320–550 nm (every 2 nm). MilliQ water spectra were subtractedfrom sample spectra and corrected for internal instrumenteffects according to correction files generated by the man-ufacturer. Intensities of resulting spectra were normalizedto the area under the Raman peak (emission l = 350 nm).Corrected EEMs were used to calculate the FluorescenceIndex (FI) of each sample as the ratio of emission intensity470/520 nm with an excitation of 370 nm [Cory andMcKnight, 2005; Cory et al., 2010; McKnight et al., 2001].
2.8. Molecular Weight
[18] Periodic additional samples were collected during2007–2008 field sampling for determination of molecularweight (MW). Filtered samples (GF/F, 0.7 mm) were frozenand then freeze‐dried to recover DOM for analysis. Molec-ular weight of DOMwas measured via high performance sizeexclusion chromatography (HP‐SEC) on a Waters Protein‐Pak 125 column (preceded by a guard column) on a HPLC
DALZELL ET AL.: DOM EXPORT FROM AGRICULTURAL LANDSCAPES G02023G02023
5 of 13

(Spectra Physics 8800) with autosampler (Thermo SeparationProducts Spectra Series AS100). The HP‐SEC column wasmaintained at 30°C for all samples, and peak intensity wasmeasured with a UV/Vis detector at l = 250 nm [cf.O’Loughlin and Chin, 2001]. Absorbance data were collectedwith a Peak Simple chromatography data system and soft-ware (Torrance, California). Relative to maximum peakintensity, raw absorbance data were baseline corrected; a 1%cutoff value was used for high MW and a 2% or 50 Dalton(whichever was greater) cutoff was used for low MW [Zhouet al., 2000].[19] The mobile phase was MilliQ (18 MW) water buff-
ered to pH = 6.8 (phosphate buffer, 4 mM) with 0.10 MNaCl added as a swamping electrolyte [Chin and Gschwend,1991]. Molecular weight calculations were based on a suiteof polystyrenesulfonate (PSS) standards (Polysciences Inc.,Warrington, Pennsylvania). PSS standards used were: 780K(to determine void volume), 18K, 8K, 4.6K and 3.6KDaltons; acetone (MW = 54) was also used as a low MWstandard and to measure the permeation volume. A linearregression was developed between the MW of standards(log‐transformed) and elution volume (r2 > 0.99), and theresulting equation was used to determine the MW of theanalyte at a given elution volume. While PSS standards areroutinely used as calibration materials for studies of naturalorganic matter, it is important to note that humic substancesare heterogeneous mixtures which make accurate MWassignment tenuous, and greater emphasis should be placed
on MW differences between samples than actual MW.Number‐averaged molecular weights (MWn) were calcu-lated using [Yau et al., 1979]
MWn ¼PN
i¼1 hiPNi¼1 hi=Mi
where hi and Mi are the HP‐SEC chromatogram peak heightand calibrated MW, respectively, eluted at volume i.
2.9. Statistical Analyses
[20] Statistical tests were performed with the JMP soft-ware package (SAS Institute Inc.). In general, analysis ofcovariance (ANCOVA) was used to explore the relation-ship between a response variable and drainage intensity(fixed factor) and precipitation or flow (covariate). In anANCOVA that included DOC concentration and flow data,DOC data were Box‐Cox transformed (l = −1.6) and flowdata were ln transformed in order to achieve residuals thatapproximated a normal distribution. Details about specificanalyses are provided in the text where appropriate. In caseswhere error propagation was necessary, we followed pro-cedures described by Skoog et al. [1998].
3. Results
3.1. Water Export From Field Scale Plots
[21] Hydrographs from the field drainage plots generallyshow long periods of low‐ to no‐flow interrupted by briefperiods of high flow following precipitation events. Thedrainage efficiency (water removed by drainage divided byannual precipitation) was significantly influenced by drain-age treatment (p = 0.0001) and by total annual precipitation(p = 0.0029; r2 = 0.26). For all flow data from 2001 to 2008,drainage efficiency averaged 13.0% and 18.1% for conven-tional and intense drainage treatments, respectively (Figure 3).
3.2. Effect of Conventional and Intense Drainageon DOC Concentrations in Field Plots
[22] In general, DOC concentrations from field scaledrainage plots were low during most sampling periods(Figure 4). Elevated concentrations (above 3.0 mg L−1) onlyoccurred during low flow conditions (less than 5m3 ha−1 d−1),but low DOC concentrations were also most abundantduring low flow. Mean DOC concentrations were 1.62(±0.91) (±SD) mg L−1 and 1.87 (±1.27) mg L−1 for con-ventional and intense drainage treatments, respectively.Prior to ANCOVA, DOC data were Box‐Cox transformedand flow data were ln transformed as described above.Results revealed that plots with intense drainage coefficientshad greater mean DOC concentrations than plots with con-ventional drainage treatments (p < 0.0001). Additionally,DOC concentrations were negatively correlated with flow(p = 0.0002). It is important to note that DOC concentrationswere quite constant over a range of flow conditions. Despitestatistical significance, flow and drainage intensity are not astrong predictors of DOC concentration (r2 = 0.07). They doexplain more variability than the simple mean value, how-ever, and we applied these regressions to estimate DOCconcentrations from flow data for these sites.
Figure 3. Drainage efficiencies for field‐scale plots at theAERF based on rainfall and drainage data from 2001 to2008. The lines are linear best fit lines for conventionaland intense drainage treatments. For all data, the meandrainage efficiency was 13.0% and 18.1% for conventionaland intense treatments, respectively. The shaded regionrepresents the 95% confidence interval of the regressionlines.
DALZELL ET AL.: DOM EXPORT FROM AGRICULTURAL LANDSCAPES G02023G02023
6 of 13

3.3. DOC Concentrations at Surface Water Sites
[23] The differences between mean DOC concentrationsin conventional and intense drainage plots (0.25 mg L−1)were small compared to differences between field scale plotsand downstream sites. The mean DOC concentration for allfield samples (both treatments) was 1.77 (±1.14) mg L−1.Mean DOC concentrations increased to 3.38 (±0.95) mg L−1
for the ditch site and 4.78 (±1.55) mg L−1 for the stream site.Mean DOC concentrations for the Le Sueur River were4.77 (±0.68) mg L−1, comparable to the stream site. Forcomparison to a large river, DOC data were also obtainedfrom the Twin Cities Metropolitan Council for the MinnesotaRiver near its confluence with the Mississippi River (basinarea = 4.38 × 10⁶ ha); from 2002 to 2006, the mean DOCconcentration was 6.12 (±1.28) mg L−1. While each siteshowed a range of DOC values, mean DOC increased withwatershed area (ln transformed; Figure 5).
3.4. Scale Effects on DOC Export
[24] Downstream increases in DOC concentrations cor-respond with increases in area‐normalized DOC export. Forthe fields modified with subsurface drainage systems, theprimary factor controlling mass export of DOC is simply theavailability of water. The DOC‐flow relationships deter-mined from this study were applied to water yield data fromall plots dating back to 2001 in order to assess area‐normalized DOC export. The average annual export for allplots was 1.9 kg C ha−1 yr−1. There was a significant dif-ference between drainage treatments (p < 0.0001) andcovariation with rainfall (p < 0.0001; r2 = 0.51) for predictingaverage annual DOC export. Conventional drainage treat-ments had an average DOC export of 1.5 kg C ha−1 yr−1,while plots with intense drainage treatments had an averageexport of 2.4 kg C ha−1 yr−1. There was considerable inter-
annual variability in C export during the study, from 0.1 to5.1 kg C ha−1 yr−1, due to the timing and nature of drainageevents (Figure 6). Based on average DOC concentrations ofthe Minnesota River at Ft. Snelling and available annualwater yield data from 2005 to 2009 (http://waterdata.usgs.gov/nwis/), area‐normalized DOC export for the MinnesotaRiver basin is estimated at about 7.5 kg C ha−1 yr−1 (range:4.4 to 10.4); this is 5 and 3.1 times greater than the con-ventional and intensely drained plots, respectively.
3.5. Molecular Weight Distribution
[25] Inspection of the chromatograms from size exclusionchromatography (SEC) measurements showed that themolecular weight of DOM (as measured at l = 250 nm)changed with sampling location. There were no obvious orconsistent differences in molecular weight of DOM from thedifferent field plots. There were, however, systematic dif-ferences in molecular weights of DOM in samples collectedat downstream sites with increasing distance downstreamand with increasing DOC concentrations. In general, SECchromatograms from the field sites were comprised of2 pools of DOM: one pool of homogenous low MWmaterial and a less abundant pool of more heterogeneoushigh MW material. The relative proportion of the high MWDOM increased with downstream sampling locations to theextent that the low MW peak (dominant in the field sitesamples) was reduced in samples from the large ditch andriver sites (Figure 7). DOC concentrations were morestrongly correlated to molecular weight distributions thandrainage area (Figure 8).
Figure 4. Relationship between DOC concentration andflow from field plots at the AERF.While DOC concentrationsare relatively constant over a wide range of flow conditions,there were significant effects of drainage intensity (p <0.0001) and flow (p = 0.0002). The regression equations indi-cated by the lines were used to predict daily DOC concentra-tions based on flow data.
Figure 5. Box and whisker plots showing DOC concentra-tions for nested sites within the Minnesota River Basin. Datapoints from the Minnesota River were provided by the TwinCities Metropolitan Council and represent samples collectedfrom 2002 through 2006 from all seasons. All other pointsrepresent samples collected for this study (spring, summer,and fall). The box represents the median and interquartilerange. The whiskers represent values beyond the interquar-tile range, and data points denote outliers.
DALZELL ET AL.: DOM EXPORT FROM AGRICULTURAL LANDSCAPES G02023G02023
7 of 13

3.6. Microbial Degradation Experiment
[26] DOC from each sampling location showed slightdecreases over the course of the 14 day microbial degra-dation experiment (Table 2) with an average loss of 9.6%for all sites and all replicates. There was a relationshipbetween initial DOC concentration and % DOC loss; DOC
concentrations in samples from the stream site (greater ini-tial DOC) declined by 12.9% while DOC concentrationsfrom the field site (low initial DOC) declined by 6.8% onaverage (n = 3). This trend was not significant, however.[27] Decay constants were not different between sites (one
way ANOVA, p = 0.84); the mean decay constant value forall sites and replicates (k = 0.0093) corresponds to a DOChalf‐life of 75 days, indicating that DOC in these samplesis not likely to undergo rapid transformations in the localenvironment.[28] At the onset of the microbial degradation experiment,
SUVA254 values corresponded with drainage area andranged from 2.39 (field site) to 3.05 L mg C−1 m−1 (streamand river sites; Table 2). These values are consistent witharomatic content ranging from approximately 19.2 to 23.5%[Weishaar et al., 2003]. SUVA254 values observed in thisstudy are slightly greater than those reported for agriculturalwatersheds in Indiana [Vidon et al., 2008] and Illinois[Warrner et al., 2009] but comparable to values reported foran agricultural watershed in northern California [Saracenoet al., 2009] and a range of watersheds with mixed landuse in Southern Ontario [Williams et al., 2010]. Followingthe 14 day incubation, SUVA254 values ranged from 2.69(field site) to 3.46 L mg C−1 m−1 (Table 2), corresponding toaromatic content from 21.2 to 26.3%. On average, DOCfollowing microbial degradation had 1.9% greater aromaticcontent (range: 1.3 to 2.7%) than the initial DOC (p = 0.003;paired t test).
3.7. Fluorescence Index
[29] FI values in this study ranged from 1.35 (stream site)to 1.54 (field drainage; Table 2). FI values from the fieldsite are consistent with a microbial end‐member [Cory andMcKnight, 2005] while the stream and river sites are com-
Figure 6. Effect of drainage intensity and precipitation onannual DOC export from agricultural fields. The DOC con-centration‐flow relationship (refer to text and Figure 4) wasapplied to all flow data from 2001 to 2008 in order togenerate 8 years of DOC export estimates for experimentalfields at the AERF. The shaded region represents the 95%confidence interval of the regression lines.
Figure 7. Representative HP‐SEC spectra from differentsampling sites. The field site is characterized by largeamounts of low molecular weight material, while the ditchand river sites have greater relative amounts of high molec-ular weight material. HP‐SEC chromatogram of water‐extractable soil organic matter is shown for comparison.
Figure 8. Relationship between DOC concentrations andnumber‐averaged molecular weight for water samples inthe Le Sueur River watershed. Downstream increases inDOC concentration and molecular weight show preferentialaddition of high molecular weight material in ditch, stream,and river sites. The shaded region represents the 95% confi-dence interval of the regression line.
DALZELL ET AL.: DOM EXPORT FROM AGRICULTURAL LANDSCAPES G02023G02023
8 of 13

parable to values reported for Midwestern agriculturalwatersheds [Vidon et al., 2008]. The FI values measured inthis study did not change over the course of the microbialdegradation experiment but did show a strong negative cor-relation with DOC concentrations (Table 2 and Figure 9).
4. Discussion
4.1. Effect of Subsurface Drainage on DOC ExportFrom Agricultural Fields
[30] Relatively low concentrations measured at the sub-surface drainage outlets indicate that soil water DOC con-centrations are relatively uniform by the time excess soilwater has percolated to the depth of subsurface tile drains.This is similar to results of McDowell and Wood [1984]which showed that stream DOC concentrations were mostsimilar to DOC concentrations measured in the soil Bhorizon (and much less than concentrations measured insoil water from the A horizon). The decrease in DOC con-centrations during periods of high flow (Figure 4) suggest arelatively constant supply of DOC that becomes diluted withincreasing water availability. The same trend was observedin a field study by Ruark et al. [2009] and appears similarto results from a soil column leaching study by Guo andChorover [2003]. These results confirm that at the fieldscale, DOC export is determined by processes occurringwithin the soil profile. The small‐but‐significant differencebetween DOC concentrations in conventional versus intensedrainage plots may be a consequence of the extent of soildrying and rewetting effects on increasing soil respiration[Orchard and Cook, 1983; Van Veen et al., 1985] which canproduce DOC through degradation of soil organic matterinto smaller, more mobile, compounds. It is also possiblethat variability in soil organic matter could explain some ofthe difference in DOC concentration between plots. Wecurrently lack detailed soil organic matter data to performthis analysis, however.[31] DOC export at the field scale was very episodic but
clearly influenced by drainage intensity. On average, 90% oftotal annual flow occurred during just 15% of the time,meaning that the large volumes of water mobilized duringspring runoff or rainfall events are the dominant factorcontrolling DOC export from these agricultural fields. AnnualDOC export was influenced by the intensity of subsurfacedrainage systems. This is primarily due to drainage intensityimpacts on water yield with secondary impact based ondrainage intensity effects on DOC concentration. Underaverage annual precipitation conditions, field plots withintense drainage coefficients export about 55% (±22%) moreDOC annually than plots with conventional drainage (errorpropagated from the 95% confidence interval of regressionlines in Figure 6).
[32] These results are important because they demonstratethat DOC export from agricultural fields is sensitive to boththe intensity of the drainage practice and variability in pre-cipitation. Updates of old drainage systems and installation ofnew subsurface drainage are ongoing, and possibly intensi-fying, practices in the upper Midwest. Together, these prac-tices effectively increase the drainage intensity in agriculturallandscapes. Although the rate of new drainage installation ispoorly known, it is likely that export of DOM from agricul-tural landscapes with artificial drainage will increase over thecoming century due to both expansion in drainage and toclimate change. In particular, theMidwestern United States ispredicted to experience a 5–15% increase in wintertimeprecipitation by 2099 [Christensen et al., 2007] with greaterincreases (15–40%) predicted for Minnesota [Kling et al.,2003]. Based on the relationship between precipitation andDOC export (Figure 6), the predicted increases in precipita-tion during the nongrowing season are likely to contribute tosubsurface drainage in agricultural landscapes with subse-quent increases in DOC export.
4.2. Relationships of Catchment Area on DOM Source,Quantity, and Quality
[33] The overall range of field‐scale DOC export observedin this study (0.1 to 5.1 kg C ha−1 yr−1) is comparable to
Table 2. DOC Concentration, FI, and SUVA Values of Water Samples From Four Sampling Locations at the Beginning and End of a14 day Microbial Degradation Experiment
SiteDOC (mg L−1) (±SD) FI (±SD) SUVA (± Error) (L mg C−1 m−1)
Day 0 Day 14 Day 0 Day 14 Day 0 Day 14
Field 2.53 (0.52) 2.29 (0.13) 1.54 (0.008) 1.53 (0.002) 2.39 (0.58) 2.69 (0.18)Ditch 4.59 (0.12) 4.20 (0.10) 1.45 (0.003) 1.46 (0.007) 2.91 (0.11) 3.16 (0.13)Stream 9.34 (0.41) 8.12 (0.24) 1.35 (0.006) 1.36 (0.004) 3.05 (0.15) 3.46 (0.10)LeSueur River 8.36 (0.24) 7.50 (0.06) 1.38 (0.000) 1.37 (0.004) 3.05 (0.11) 3.26 (0.06)
Figure 9. Effect of DOC concentration on fluorescenceindex (FI) values. Increasing DOC concentrations arestrongly correlated to FI values, suggesting additions of ter-restrial DOC sources at downstream locations. The shadedregion represents the 95% confidence interval of the regres-sion line.
DALZELL ET AL.: DOM EXPORT FROM AGRICULTURAL LANDSCAPES G02023G02023
9 of 13

values reported for a study conducted by Ruark et al. [2009]for a series of experimental plots located in west centralIndiana (1.8 to 8.6 kg C ha−1 yr−1) and slightly less thanthose reported by Kovacic et al. [2000] for east centralIllinois (3.5 to 17.6 kg C ha−1 yr−1). This similarity betweenstudies suggests that DOC export via subsurface drainagecould be fairly uniform across the corn and soybean pro-duction area of the Midwestern United States with higherprecipitation responsible for greater area‐normalized DOCyields in the east.[34] Field‐scale DOC export rates reported here and in
prior studies (above) are generally less than watershed‐scaleDOC export for comparable landscapes with a dominanceof agricultural land use and subsurface drainage. Annualwatershed‐scale export estimates have been reported from14.1 to 19.5 kg C ha−1 yr−1 for Indiana [Dalzell et al., 2007],from 3.2 to 22.3 kg C ha−1 yr−1 for Illinois [Royer andDavid, 2005], and from 4.4 to 10.4 kg C ha−1 yr−1 (thisstudy). These values are similar to the range shown byAitkenhead and McDowell [2000] for rivers draining coolgrassland and cool deciduous forest biomes (3.86 and19.27 kg C ha−1 yr−1, respectively).[35] These differences between field‐scale estimates of
DOC export and large‐watershed scale estimates of DOCexport show (Figure 5) that additional DOC sources arecontributing to the DOC pool that are not reflected at thefield scale. While autochthonous C is undoubtedly added tothe dissolved pool, the MW and FI data suggest that addi-tional terrestrial sources of DOM account for the differencesbetween field‐scale and watershed‐scale export of DOC.These sources, while not identified in this study, likelyinclude leachate from fresh plant detritus in riparian zonesduring periods of recharge from shallow groundwater[Butturini and Sabater, 2000; Findlay et al., 2001] or poorlydrained soils [Wilson and Xenopoulos, 2008]. Sources ofterrestrially derived DOC are likely to vary with samplinglocation and hydrologic conditions. It is interesting to notethat, among the Ditch, Stream, and Le Sueur River samples,the highest DOC concentrations (and lowest FI values)occurred in the large ditch site, not the Le Sueur River. Inthis agriculturally dominated landscape with the ubiquitousdrainage ditches and subsurface drainage systems that dis-charge directly into the river, it is plausible that DOM atthe river site is being diluted from another source with lowDOC concentrations and higher FI values. Our measure-ments suggest that the characteristics of riverine DOC morestrongly reflect its source rather than changes imparted as aresult of in‐stream degradation. It is also possible that someDOM loss is occurring within the main river channel viamicrobial or photochemical degradation or sorption ontofine sediments. If these processes are occurring, they pref-erentially remove microbially derived compounds from thewater column so that DOM from field sites does not retainits characteristic FI values during transport. This explanationseems unlikely in this case, however, because FI valueswere relatively constant over the course of the 14 daydegradation experiment (heterotrophic respiration in theabsence of photochemical degradation) showing that het-erotrophic degradation did not change the overall char-acteristics of the chromophoric DOM pool (as measured byFI; Table 2).
[36] Increases in watershed area correspond to increases inDOC concentrations, especially over drainage areas fromroughly 100 to 103 ha. As mean DOC concentrationsincrease over this spatial scale, the MW also increases(Figure 8) suggesting an additional source of DOM that ischaracterized by more heterogeneous high MW compoundsthan DOM that is exported via subsurface drainage. Thesequalitative changes are also corroborated by FI values thatshow downstream increases in terrestrial (i.e., plant and soil‐derived) DOM relative to microbially derived DOM. Thesedata demonstrate that additional sources of DOM (presum-ably floodplain soils and/or autochthonous organic matter)make important contributions to the stream DOM pool.These changes that occur from 100 to 103 ha are in contrastto the relatively similar DOC concentrations, MW distribu-tions, and FI values in samples collected from the stream site(2.7 × 10³ ha) and the river site (5.4 × 10⁴ ha; Figures 8 and 9).Contrasts between field scale and watershed scale DOMcharacteristics observed in this study agree with findingsfrom other studies of multiple watersheds reflecting a gradi-ent of agricultural land use. Specifically,Cronan et al. [1999]and Wilson and Xenopoulos [2009] showed that increasingagricultural land use was associated with a greater proportionof lowMWDOM and elevated FI values, respectively. Whilethe presence of subsurface drainage was not documented inthose studies, the similarities in DOM qualitative character-istic between this study and the work of Cronan et al. [1999]andWilson and Xenopoulos [2009] suggest that conversion toagricultural land use results in export of DOM that is moremicrobially derived and characterized by lower MW thanwould have been found previously.[37] In this agricultural landscape with abundant nutrients,
mean DOC concentration increases most rapidly oversmaller catchment areas up to 2,750 ha. In contrast, for aseries of forested watersheds with low nutrient availability,Finlay et al. [2011] showed that dramatic changes in streamDOC concentration and character (inferred from d13Cvalues) did not occur until watershed area exceeded roughly10,000 ha, when channel width increased and light avail-ability became sufficient to drive primary productivity.These contrasting results suggest that the mechanismsresponsible for DOM source and in‐stream dynamics areinfluenced by land cover, hydrology, and nutrient and lightavailability and that they can vary broadly between differentecosystems. In this landscape, the source and character ofthe aquatic DOM pool is primarily determined at the scale ofthe small watershed. At scales larger than the stream site(second‐order stream), additional contributions do notappear to alter the composition of the DOM pool. Theseresults from two contrasting ecosystems (each with rela-tively homogenous land use) are important because theyhelp to identify the scales at which in‐stream DOM char-acteristics are most sensitive to changes in allochthonous andautochthonous sources. Future studies of DOM dynamics viaupland source contributions or in‐stream processing shouldconsider that the range of relevant scales is likely to varywith respect to differences in land cover and nutrient avail-ability among ecosystems.[38] Despite differences in MW, FI, and SUVA254 values
at different sampling sites (field, ditch, stream, river), resultsfrom the incubation experiment showed that the DOM was a
DALZELL ET AL.: DOM EXPORT FROM AGRICULTURAL LANDSCAPES G02023G02023
10 of 13
similar quality substrate for aquatic microbes at all sites andthe majority of the DOM was not readily bioavailable. The9.6% DOC loss observed in this study falls within the rangeof values observed by Warrner et al. [2009] for drainagewater from sites in western Indiana; under similar experi-mental conditions, they observed DOM bioavailability thatranged from undetectable (February samples) to about 27%loss (June samples). The DOM bioavailability reported byWarrner et al. [2009] and shown in this study is in contrastto work by Seitzinger et al. [2005] who measured 45–50%losses in DOC from streams draining primarily residentialwatersheds in New Jersey. Sickman et al. [2007] showedthat urbanization can lead to substantial increases in DOCexport relative to agriculture and other land cover, indicatingthat DOC sources, processing, and delivery to streams aredifferent between agricultural and urban watersheds. Theseresults suggest that DOM exported from agricultural land-scapes is of relatively poor quality as a microbial substrateand likely to be transported greater distances to larger rivers.This may have important implications for understanding therole of small watersheds in supporting the base of theaquatic food web in larger rivers or lakes. It is importantto note, however, that other sources of DOM may be lessbioavailable than DOM from drainage water. In particular,Williams et al. [2010] demonstrated that DOM fromwetland‐influenced streams supported lower microbial activity thanDOM from agricultural landscapes.[39] Biodegradability is likely to vary with watershed
conditions. It has been demonstrated that stream/river DOMcan change dramatically with storm events [Dalzell et al.,2005; Saraceno et al., 2009; Vidon et al., 2008] and thataquatic microbial abundance increases in the presence ofstorm‐mobilized DOM [Buffam et al., 2001]. DOC decom-position at all sites resulted in an increase in SUVA254 values,showing that microbial decomposition preferentially removesnonaromatic compounds from the bulk DOM pool. Thispreferential enrichment of aromatic compounds is not sur-prising given that carbohydrates and other nonaromaticcompounds are the preferred substrate of microbes [Kalbitzet al., 2003; Marschner and Kalbitz, 2003].[40] It is unknown how DOC characteristics and microbial
availability of DOM change at the ditch, stream, and riversampling sites during different seasons or periods of increasedflow. Future work should include increased focus on changesin DOM quality and microbial availability over varyingwatershed scales while also including a paired watershedapproach to evaluate how land use conversion may influenceaquatic microbial communities via changes in DOM export.
4.3. Implications for C Cycling in AgriculturalLandscapes
[41] Recently,Wilson and Xenopoulos [2008] showed thatpoorly drained soils were a strong predictor of watershedDOC concentrations while Jencso et al. [2009] and Pacificet al. [2010] showed that upland accumulating area wasimportant for establishing hydrologic and biogeochemicalcommunication between the stream channel and adjacentlandscape. Further, the studies by Jencso et al. [2009] andPacific et al. [2010] demonstrated that riparian zones withlarger upland accumulating areas delivered flow and DOCto the stream more frequently and more continuously thanriparian zones with small upland accumulating areas. If
these general relationships between upland accumulatingarea and streamflow and biogeochemistry can be applied toagricultural watersheds with modified hydrology, then theimpacts of subsurface drainage have important implicationsfor relative importance of different DOC sources in thiswatershed. In watersheds with extensive subsurface drain-age, many riparian zones may be disconnected from theirupland accumulating areas by drainage outlets and ditches,effectively limiting the potential of soil water to mobilizeriparian DOC into stream channels. If this is true, thenwatersheds with subsurface drainage will export loweramounts of more refractory DOM than comparable water-sheds with unmodified drainage. This idea is supported byDOC concentration data for multiple watersheds with vary-ing land use [Cronan et al., 1999].[42] The presence of subsurface drainage is also likely to
influence the timing of organic matter delivery to streamsand rivers. Subsurface drainage accelerates the delivery ofwater from the landscape to receiving waterways. Riparianconnections between upland areas and the stream channelare likely to have a shorter duration in a landscape with sub-surface drainage. This means that the mechanisms responsiblefor controlling DOM export from upland to aquatic systemswill be more episodic than in a comparable undrained land-scape. This should be taken into consideration for samplingschemes intended to capture the range of DOM source andquantity in agricultural landscapes. These controls on DOMexport will be exacerbated by predicted increases in theoccurrence of extreme precipitation events in Minnesota overthe coming century [Kling et al., 2003].
5. Conclusions
[43] In the agricultural upper Midwest where landscapedrainage practices are common, it is likely that the presenceof agricultural drainage has served to reduce the concen-tration of DOC exported at the field‐scale when comparedto undrained fields which are more likely to contribute tosurface runoff or flow through more organic‐rich surfacesoil horizons. Based on results from this work, we concludethat the intensity of agricultural subsurface drainage influ-ences annual DOC export primarily via differences in annualwater yield with secondary effects due to differences inDOC concentration. Regardless of drainage intensity, area‐normalized DOC export measured at the field scale is lessthan export calculated based on measurements made at thelarge watershed scale, showing that additional sources ofDOC are contributed to streams and rivers in excess of theamounts needed to support the net heterotrophy of thesesystems.[44] Despite relatively homogenous land use, DOC con-
centration and DOM characteristics vary between differentsampling locations. DOM at downstream (stream and river)sites is characterized by greater amounts of terrestriallyderived organic matter with higher MW and greater aromaticcontent than DOM from the field and ditch sites. Despitedownstream differences in DOM characteristics, there was nota significant difference between collection sites in microbialdegradability of DOC from different sites over a 14 day darkincubation. DOM from the stream site showed the greatestvariability in DOC concentrations and molecular weightdistribution. This suggests that, for this landscape, streams
DALZELL ET AL.: DOM EXPORT FROM AGRICULTURAL LANDSCAPES G02023G02023
11 of 13
draining small watersheds (∼103 ha) may be the most relevantscale for examining the linkage between watershed char-acteristics and stream DOM characteristics. The scale that ismost relevant for determiningDOMcharacteristics is likely tovary as the relative influence of watershed characteristics andin‐stream processing varies among different ecosystems.[45] Taken together, our results show that increasing the
intensity of subsurface drainage will result in greater annualamounts of DOC export via differences in both DOC con-centrations and annual water yield. Relative to watershedswith native vegetation, landscapes with agricultural land useare likely to export DOM characterized by lower molecularweight, potentially providing a different quality substrate foraquatic microbes. Despite relatively homogenous land usethroughout the study area, downstream differences in thequantity and quality of DOM suggest that small proportionsof the watershed (likely undrained fields and/or floodplainsoils) exert a disproportionately large influence on the char-acteristics of DOM in the stream and river network. Thus,nonagricultural parts of the landscape must be consideredwhen modeling watershed‐scale DOM export. As landowners improve and expand existing drainage systems,especially in response to predicted increases in precipitationin the Midwestern United States, increasing intensification ofdrainage in agricultural landscapes will increase export ofDOM relative to current conditions. This could mean thatDOM from subsurface drainage systems will assume a moreprominent role in stream biogeochemistry under future cli-mate and land management scenarios. These aspects of field‐to watershed‐scale influences on DOM should be consideredin studies of aquatic ecology and biogeochemical cycling inagricultural ecosystems.
[46] Acknowledgments. This work was supported in part by theUSGS (06HQGR0093) and by the Minnesota Water Resources Center.The authors thank three anonymous reviewers for their helpful commentson an earlier version of this manuscript. We thank James Cotner for useof his UV/Vis spectrophotometer and fluorometer and Meghan Jacobsonfor her assistance and guidance with these instruments. We thank DeborahAllan for use of her HPLC. We also thank Katrina Hill and Anthony Devriesfor their assistance with field and laboratory work and the University ofMinnesota Statistical Consulting Service for their help with statisticalanalyses.
ReferencesAitkenhead, J. A., and W. H. McDowell (2000), Soil C:N ratio as a pre-dictor of annual riverine DOC flux at local and global scales, GlobalBiogeochem. Cycles, 14(1), 127–138, doi:10.1029/1999GB900083.
Amon, R. M. W., and R. Benner (1996), Bacterial utilization of differentsize classes of dissolved organic matter, Limnol. Oceanogr., 41(1), 41–51,doi:10.4319/lo.1996.41.1.0041.
Bianchi, T. S., T. Filley, K. Dria, and P. G. Hatcher (2004), Temporal var-iability in sources of dissolved organic carbon in the lower MississippiRiver, Geochim. Cosmochim. Acta, 68(5), 959–967, doi:10.1016/j.gca.2003.07.011.
Blann, K. L., J. L. Anderson, G. R. Sands, and B. Vondracek (2009), Effectsof agricultural drainage on aquatic ecosystems: A review, Crit. Rev. Envi-ron. Sci. Technol., 39(11), 909–1001, doi:10.1080/10643380801977966.
Buffam, I., J. N. Galloway, L. K. Blum, and K. J. McGlathery (2001), Astormflow/baseflow comparison of dissolved organic matter concentra-tions and bioavailability in an Appalachian stream, Biogeochemistry,53(3), 269–306, doi:10.1023/A:1010643432253.
Butturini, A., and F. Sabater (2000), Seasonal variability of dissolvedorganic carbon in a Mediterranean stream, Biogeochemistry, 51(3),303–321, doi:10.1023/A:1006420229411.
Chin, Y. P., and P. M. Gschwend (1991), The abundance, distribution, andconfiguration of porewater organic colloids in recent sediments, Geochim.Cosmochim. Acta, 55(5), 1309–1317, doi:10.1016/0016-7037(91)90309-S.
Christensen, J. H., et al. (2007), Regional climate projections, in ClimateChange 2007: The Physical Science Basis. Contribution of WorkingGroup I to the Fourth Assessment Report of the Intergovernmental Panelon Climate Change, edited by S. Solomon et al., pp. 847–940, CambridgeUniv. Press, New York.
Cole, J. J., and N. F. Caraco (2001), Carbon in catchments: Connecting ter-restrial carbon losses with aquatic metabolism, Mar. Freshwater Res.,52(1), 101–110, doi:10.1071/MF00084.
Cole, J. J., et al. (2007), Plumbing the global carbon cycle: Integratinginland waters into the terrestrial carbon budget, Ecosystems, 10(1),172–185, doi:10.1007/s10021-006-9013-8.
Cory, R.M., andD.M.McKnight (2005), Fluorescence spectroscopy revealsubiquitous presence of oxidized and reduced quinones in dissolved organicmatter, Environ. Sci. Technol., 39(21), 8142–8149, doi:10.1021/es0506962.
Cory, R. M., M. O. Miller, D. M. McKnight, J. J. Guerard, and P. L. Miller(2010), Effect of instrument‐specific response on the analysis of fulvicacid fluorescence spectra, Limnol. Oceanogr. Methods, 8, 67–78,doi:10.4319/lom.2010.8.0067.
Cronan, C. S., J. T. Piampiano, and H. H. Patterson (1999), Influence ofland use and hydrology on exports of carbon and nitrogen in a Maineriver basin, J. Environ. Qual., 28(3), 953–961, doi:10.2134/jeq1999.00472425002800030028x.
Dalzell, B. J., T. R. Filley, and J. M. Harbor (2005), Flood pulse influenceson terrestrial organic matter export from an agricultural watershed,J. Geophys. Res., 110, G02011, doi:10.1029/2005JG000043.
Dalzell, B. J., T. R. Filley, and J. M. Harbor (2007), The role of hydrologyin annual organic carbon loads and terrestrial organic matter export froma Midwestern agricultural watershed, Geochim. Cosmochim. Acta, 71(6),1448–1462, doi:10.1016/j.gca.2006.12.009.
Dalzell, B. J., E. C. Minor, and K. M. Mopper (2009), Photodegradationof estuarine dissolved organic matter: A multi‐method assessment ofDOM transformation, Org. Geochem., 40(2), 243–257, doi:10.1016/j.orggeochem.2008.10.003.
Essington, M. E. (2004), Soil and Water Chemistry: An IntegrativeApproach, 534 pp., CRC Press, Boca Raton, Fla.
Findlay, S., J. M. Quinn, C. W. Hickey, G. Burrell, and M. Downes (2001),Effects of land use and riparian flowpath on delivery of dissolved organiccarbon to streams, Limnol. Oceanogr., 46(2), 345–355, doi:10.4319/lo.2001.46.2.0345.
Finlay, J., J.Neff,S.Zimov,A.Davydova, andS.Davydov(2006),Snowmeltdominanceofdissolvedorganiccarboninhigh‐latitudewatersheds:Implica-tions for characterization and flux of riverDOC,Geophys. Res. Lett.,33,L10401,doi:10.1029/2006GL025754.
Finlay, J. C., J. M. Hood, M. Limm, M. E. Power, J. D. Schade, and J. R.Welter (2011), Light‐mediated thresholds in stream water nutrientcomposition in a river network, Ecology, 92, 140–150, doi:10.1890/09-2243.1.
Frankignoulle, M., G. Abril, A. Borges, I. Bourge, C. Canon, B. DeLille,E. Libert, and J. M. Theate (1998), Carbon dioxide emission from Europeanestuaries, Science, 282(5388), 434–436, doi:10.1126/science.282.5388.434.
Guo, M. X., and J. Chorover (2003), Transport and fractionation of dis-solved organic matter in soil columns, Soil Sci., 168(2), 108–118,doi:10.1097/00010694-200302000-00005.
Jencso, K. G., B. L. McGlynn, M. N. Gooseff, S. M.Wondzell, K. E. Bencala,and L. A.Marshall (2009), Hydrologic connectivity between landscapes andstreams: Transferring reach‐ and plot‐scale understanding to the catchmentscale, Water Resour. Res., 45, W04428, doi:10.1029/2008WR007225.
Jin, C. X., and G. R. Sands (2003), The long‐term field‐scale hydrology ofsubsurface drainage systems in a cold climate, Trans. ASAE, 46(4),1011–1021.
Kalbitz, K., D. Schwesig, J. Schmerwitz, K. Kaiser, L. Haumaier, B. Glaser,R. Ellerbrock, and P. Leinweber (2003), Changes in properties of soil‐derived dissolved organic matter induced by biodegradation, Soil Biol.Biochem., 35(8), 1129–1142, doi:10.1016/S0038-0717(03)00165-2.
Kaplan, L. A. (1994), A field and laboratory procedure to collect, process,and preserve fresh‐water samples for dissolved organic carbon analysis,Limnol. Oceanogr., 39(6), 1470–1476, doi:10.4319/lo.1994.39.6.1470.
Kling, G. W., Union of Concerned Scientists, and Ecological Society ofAmerica (2003), Confronting climate change in the Great Lakes region:Impacts on our communities and ecosystems, report, 92 pp., Union ofConcerned Sci., Ecol. Soc. of Am., Cambridge, Mass.
Kovacic, D. A., M. B. David, L. E. Gentry, K. M. Starks, and R. A. Cooke(2000), Effectiveness of constructed wetlands in reducing nitrogen andphosphorus export from agricultural tile drainage, J. Environ. Qual., 29(4),1262–1274, doi:10.2134/jeq2000.00472425002900040033x.
Luo, W., G. R. Sands, M. Youssef, J. S. Strock, I. Song, and D. Canelon(2010), Modeling the impact of alternative drainage practices in thenorthern corn‐belt with DRAINMOD‐NII, Agric. Water Manage., 97(3),389–398, doi:10.1016/j.agwat.2009.10.009.
DALZELL ET AL.: DOM EXPORT FROM AGRICULTURAL LANDSCAPES G02023G02023
12 of 13

Marschner, B., and K. Kalbitz (2003), Controls of bioavailability and bio-degradability of dissolved organic matter in soils, Geoderma, 113(3–4),211–235, doi:10.1016/S0016-7061(02)00362-2.
McDowell, W. H., and T. Wood (1984), Podzolization–soil processes con-trol dissolved organic carbon concentrations in stream water, Soil Sci.,137(1), 23–32, doi:10.1097/00010694-198401000-00004.
McKnight, D. M., E. W. Boyer, P. K. Westerhoff, P. T. Doran, T. Kulbe,and D. T. Andersen (2001), Spectrofluorometric characterization of dis-solved organic matter for indication of precursor organic materialand aromaticity, Limnol. Oceanogr., 46(1), 38–48, doi:10.4319/lo.2001.46.1.0038.
Moran, M. A., W. M. Sheldon, and R. G. Zepp (2000), Carbon loss andoptical property changes during long‐term photochemical and biologicaldegradation of estuarine dissolved organic matter, Limnol. Oceanogr.,45(6), 1254–1264, doi:10.4319/lo.2000.45.6.1254.
Morel, B., P. Durand, A. Jaffrezic, G. Gruau, and J. Molenat (2009),Sources of dissolved organic carbon during stormflow in a headwateragricultural catchment, Hydrol. Processes, 23(20), 2888–2901,doi:10.1002/hyp.7379.
O’Loughlin, E., and Y. P. Chin (2001), Effect of detector wavelengthon the determination of the molecular weight of humic substancesby high‐pressure size exclusion chromatography, Water Res., 35(1),333–338, doi:10.1016/S0043-1354(00)00228-1.
Orchard, V. A., and F. J. Cook (1983), Relationship between soil respira-tion and soil moisture, Soil Biol. Biochem., 15(4), 447–453, doi:10.1016/0038-0717(83)90010-X.
Pacific, V. J., K. G. Jencso, and B. L. McGlynn (2010), Variable flushingmechanisms and landscape structure control stream DOC export duringsnowmelt in a set of nested catchments, Biogeochemistry, 99, 193–211,doi:10.1007/s10533-009-9401-1.
Pavelis, G. A. (1987), Economic survey of farm drainage, in Farm Drain-age in the United States; History, Status, and Prospects, edited by G. A.Pavelis, pp. 110–136, U.S. Dep. of Agric., Econ. Res. Serv., Washington,D. C.
Reuter, R. J., and J. C. Bell (2003), Hillslope hydrology and soil morphol-ogy for a wetland basin in south‐central Minnesota, Soil Sci. Soc. Am. J.,67(1), 365–372, doi:10.2136/sssaj2003.0365.
Richey, J. E., J. M. Melack, A. K. Aufdenkampe, V. M. Ballester, and L. L.Hess (2002), Outgassing from Amazonian rivers and wetlands as a largetropical source of atmospheric CO2, Nature, 416(6881), 617–620,doi:10.1038/416617a.
Royer, T. V., and M. B. David (2005), Export of dissolved organic carbonfrom agricultural streams in Illinois, USA, Aquat. Sci., 67(4), 465–471.
Ruark, M. D., S. M. Brouder, and R. F. Turco (2009), Dissolved organiccarbon losses from tile drained agroecosystems, J. Environ. Qual.,38(3), 1205–1215, doi:10.2134/jeq2008.0121.
Sands, G. R., K. B. Householder, and L. M. Busman (2001), Design of asubsurface drainage research facility with LANDRAIN and SEDCAD4, Appl. Eng. Agric., 17(3), 309–314.
Sands, G. R., I. Song, L. M. Busman, and B. J. Hansen (2008), The effectsof subsurface drainage depth and intensity on nitrate loads in the northerncornbelt, Trans. ASAE, 51(3), 937–946.
Saraceno, J. F., B. A. Pellerin, B. D. Downing, E. Boss, P. A. M. Bachand,and B. A. Bergamaschi (2009), High‐frequency in situ optical measure-ments during a storm event: Assessing relationships between dissolvedorganic matter, sediment concentrations, and hydrologic processes,J. Geophys. Res., 114, G00F09, doi:10.1029/2009JG000989.
Schilling, K. E., M. K. Jha, Y. K. Zhang, P. W. Gassman, and C. F. Wolter(2008), Impact of land use and land cover change on the water balance ofa large agricultural watershed: Historical effects and future directions,Water Resour. Res., 44, W00A09, doi:10.1029/2007WR006644.
Schlesinger, W. H., and J. A. Andrews (2000), Soil respiration and theglobal carbon cycle, Biogeochemistry, 48(1), 7–20, doi:10.1023/A:1006247623877.
Seitzinger, S. P., and R. W. Sanders (1997), Contribution of dissolvedorganic nitrogen from rivers to estuarine eutrophication,Mar. Ecol. Prog.Ser., 159, 1–12, doi:10.3354/meps159001.
Seitzinger, S. P., H. Hartnett, R. Lauck, M. Mazurek, T. Minegishi,G. Spyres, and R. Styles (2005), Molecular‐level chemical characteriza-
tion and bioavailability of dissolved organic matter in stream water usingelectrospray‐ionization mass spectrometry, Limnol. Oceanogr., 50(1), 1–12,doi:10.4319/lo.2005.50.1.0001.
Sickman, J. O., M. J. Zanoli, and H. L. Mann (2007), Effects of urbaniza-tion on organic carbon loads in the Sacramento River, California, WaterResour. Res., 43, W11422, doi:10.1029/2007WR005954.
Skoog, D. A., F. J. Holler, and T. A. Nieman (1998), Principles of Instru-mental Analysis, 5th ed., 849 pp., Harcourt Brace, Philadelphia, Pa.
Turner, R. E., and N. N. Rabalais (2003), Linking landscape and waterquality in the Mississippi river basin for 200 years, BioScience, 53(6),563–572, doi:10.1641/0006-3568(2003)053[0563:LLAWQI]2.0.CO;2.
Vahatalo, A. V., and R. G. Wetzel (2004), Photochemical and microbialdecomposition of chromophoric dissolved organic matter duringlong (months‐years) exposures, Mar. Chem., 89(1–4), 313–326,doi:10.1016/j.marchem.2004.03.010.
Van Veen, J. A., J. N. Ladd, and M. Amato (1985), Turnover of carbon andnitrogen through the microbial biomass in a sandy loam and a clay soilincubated with [14C(U)]glucose and [15N](NH4)2SO4 under differentmoisture regimes, Soil Biol. Biochem., 17(6), 747–756, doi:10.1016/0038-0717(85)90128-2.
Vidon, P., L. E. Wagner, and E. Soyeux (2008), Changes in the character ofDOC in streams during storms in two Midwestern watersheds with con-trasting land uses, Biogeochemistry, 88(3), 257–270, doi:10.1007/s10533-008-9207-6.
Warrner, T. J., T. V. Royer, J. L. Tank, N. A. Griffiths, E. J. Rosi‐Marshall,and M. R. Whiles (2009), Dissolved organic carbon in streams from arti-ficially drained and intensively farmed watersheds in Indiana, USA,Biogeochemistry, 95(2–3), 295–307, doi:10.1007/s10533-009-9337-5.
Weishaar, J. L., G. R. Aiken, B. A. Bergamaschi, M. S. Fram, R. Fujii, andK. Mopper (2003), Evaluation of specific ultraviolet absorbance as anindicator of the chemical composition and reactivity of dissolved organiccarbon, Environ. Sci. Technol., 37(20), 4702–4708, doi:10.1021/es030360x.
Williams, C. J., Y. Yamashita, H. F.Wilson, R. Jaffe, andM. A. Xenopoulos(2010), Unraveling the role of land use and microbial activity in shapingdissolved organic matter characteristics in stream ecosystems, Limnol.Oceanogr., 55(3), 1159–1171, doi:10.4319/lo.2010.55.3.1159.
Wilson, H. F., and M. A. Xenopoulos (2008), Ecosystem and seasonal controlof stream dissolved organic carbon along a gradient of land use, Ecosystems(N. Y.), 11(4), 555–568, doi:10.1007/s10021-008-9142-3.
Wilson, H. F., and M. A. Xenopoulos (2009), Effects of agricultural landuse on the composition of fluvial dissolved organic matter, Nat. Geosci.,2(1), 37–41, doi:10.1038/ngeo391.
Winslow, S. D., B. V. Pepich, M. V. Bassett, and S. C. Wendelken (2001),Microbial inhibitors for US EPA drinking water methods for the determi-nation of organic compounds, Environ. Sci. Technol., 35(20), 4103–4110,doi:10.1021/es010661b.
Yau, W. W., J. J. Kirkland, and D. D. Bly (1979), Modern Size‐ExclusionChromatography, John Wiley, New York.
Zhou, Q. H., S. E. Cabaniss, and P. A. Maurice (2000), Considerations inthe use of high‐pressure size exclusion chromatography (HPSEC) fordetermining molecular weights of aquatic humic substances, WaterRes., 34(14), 3505–3514, doi:10.1016/S0043-1354(00)00115-9.
Zucker, L. A., and L. C. Brown (Eds.) (1998), Agricultural drainage: Waterquality impacts and subsurface drainage studies in the Midwest, OhioState Univ. Ext. Bull. 871, Ohio State Univ., Columbus.
B. J. Dalzell and D. J. Mulla, Department of Soil, Water, and Climate,University of Minnesota–Twin Cities, 1991 Upper Buford Circle, 439Borlaug Hall, St. Paul, MN 55108‐6028, USA. ([email protected])J. C. Finlay, Department of Ecology, Evolution, and Behavior,
University of Minnesota–Twin Cities, St. Paul, MN 55108‐6098, USA.J. Y. King, Department of Geography, University of California, Santa
Barbara, CA 93106‐4060, USA.G. R. Sands, Department of Bioproducts and Biosystems Engineering,
University of Minnesota–Twin Cities, St. Paul, MN 55108‐6005, USA.
DALZELL ET AL.: DOM EXPORT FROM AGRICULTURAL LANDSCAPES G02023G02023
13 of 13


