Embed Size (px)
Citation preview

Information Targeting and Coordination: An Experimental Study
Matthew J. Hashim Sandra Maximiano Karthik N. Kannan
[email protected] [email protected] [email protected]
Krannert School of Management, Purdue University
This Draft: June 6, 2011
Abstract
In this study we explore the role of information targeting and its effect on coordination in a
multi-threshold public goods game. We consider four treatments, three in which we give
feedback about other members‟ contributions to a subsample of group members and another
treatment in which feedback is not provided at all. Our three information treatments vary in
whom receives the information, which can be given randomly, to those whose contributions are
below the average of their group, or to those whose contributions are above the average of their
group. Results show improvements in coordination when information targeting is used, resulting
in an increased allocation to the public good. In contrast, providing information randomly does
not improve cooperation and coordination in a higher quality good as compared to the no
information treatment. Moreover, randomly information strategy eventually degrades towards
free-riding over time. Our random information treatment approximates strategies currently used
in practice for educating consumers about digital piracy, as well as other situations where
information targeting may be useful. Our findings provide insights that may be used in practice
to develop consumer education and marketing strategies for reducing the digital piracy problem.
The implications of this research may also be employed by management in other contexts where
positively or negatively affecting coordination between consumers is of interest.
Acknowledgements: The authors thank Timothy Cason, Stephen Martin, and participants of the Vernon Smith
Experimental Economics Workshop at Purdue University, as well as seminar participants at the University of
Arizona for their helpful comments and suggestions.

1
Information Targeting and Coordination: An Experimental Study
1. Introduction
Piracy is becoming an increasingly important issue for content developers and policy
makers. In 2009, the estimated value of unlicensed business software by the Business Software
Alliance is $51.4 billion dollars1, providing evidence of the magnitude of the piracy problem and
the readily apparent private and social costs. The Recording Industry Association of America
(RIAA) and other industry groups point out that piracy has implications on the welfare of the
music industry as a whole with lost jobs, lost taxable income for the government, etc. Other than
using technological solutions such as digital rights management (DRM) to deal with piracy,
firms also engage in educational strategies (2D Boy 2008; Graft 2010; RIAA 2010). One
interesting aspect of educational strategies is they deliver information pointing to the large piracy
rates observed for digital goods, and present evidence of economic implications of piracy on
firms, jobs and consumers themselves (Smith and Benoit 2010).
Our interest in this paper is on the role of information in influencing consumer behavior
in a free-riding context. Because consumers are not homogenous regarding their purchasing /
pirating behavior, should all types of consumers be targeted for information equally? For
example, if we inform paying customers of a high piracy rate, does a high piracy rate embolden
them to become pirates as well? Does a high piracy rate justify the decisions of those that always
pirate? Or does it encourage them to adopt the social norm and convert to a paying customer?
Answers to these questions will provide us with practicable insights to deliver information for
piracy education. This issue has not been investigated in the literature to the best of our
1 A common complaint with industry statistics such as those is that it assumes consumer‟s inelastic demand. All
those that pirate would not necessarily buy the good in case the price would be higher or different than “free”.

2
knowledge. In this paper, we address this question from a behavioral economics perspective
through the use of a controlled laboratory environment.
We investigate the impact of feedback on consumers‟ purchasing/pirating behavior in this
paper. Since we are concerned with the piracy of a digital good, we base our literature and
theoretical development on the characteristics inherent to information goods. Making a pirated
copy of a digital good does not diminish the availability or utility that other consumers may
obtain from the good. Further, the absence of “perfect” DRM technology ensures that a pirated
digital good is non-exclusive. Stated simply, an information good is both non-rival and non-
exclusive. We therefore adopt Varian‟s (1998) assertion that information goods may be treated
like public goods, and build our experimental setup from that perspective.
In particular we use a modified version of a threshold public good implemented in an
abstract frame.2 We compare behavior among subjects by developing a no feedback treatment, a
random feedback treatment, and targeted (above / below) feedback treatments. We develop
several thresholds distinguished by the quality of good that a firm delivers to the group of
consumers, dependent on the rate of contribution to the good. We use several thresholds because
the threat of piracy may deter firms from investing in additional product development, increasing
product quality, investing in support, and other product utility related consequences. Our setup
allows us to determine which feedback treatment leads to the most efficient provision of quality
for the good, resulting in implications for information targeting strategies.
The experimental framework is highly suitable in this case. On one hand, since piracy is
an illegal behavior, naturally occurring data is hard to obtain and not reliable. On the other hand,
randomization into treatments allows us to tightly control possible confounding and selection
2 Abbink and Hennig-Schmidt (2006) find that careful experimental design yields consistent results across context-
specific and abstract framing of laboratory experiments. Rather than implement a loaded context, we implement an
abstract frame in our design due to our desire to focus entirely on the role of targeted information across any context.

3
effects that are typical with naturally occurring data (e.g. firms may only get a selective sample
of consumers when providing information about piracy rates).
The remainder of this paper is organized as follows. We review the literature in section
two. Section three defines our setup and experimental design. Section four discusses behavioral
predictions. Section five presents the procedures used to implement our study. Results are
provided in section six, followed by a discussion and conclusion in section seven.
2. Literature Review
Our paper relates to different streams of research on piracy and economics. We review
the literature relevant to building the experimental framework of our study in the following sub-
sections.
2.1 Selected Piracy Literature
The relative cost of a digital good has the potential to play an important role in pirate vs.
purchase decisions (Chellappa and Shivendu 2005; Gopal and Sanders 1997). In particular, the
cost of the software in addition to the consumer‟s desire to sample instead of purchase the good,
influence their decision to pirate (Cheng et al. 1997). Analytical models support this finding by
exploring when DRM protection strategies and bundling of goods should be implemented to
reduce piracy (Bhattacharjee et al. 2003; Bhattacharjee et al. 2009; Chellappa and Shivendu
2005; Sundararajan 2004). Interestingly, the investment in DRM to limit piracy should be based
on the quality of the digital good as it is contingent on the quality of the digital good (Chellappa
and Shivendu 2005). Lower quality goods require extensive DRM while higher quality goods do
not since consumers will not convert to a paying customer if the good is of poor quality. In

4
addition, strategies have been suggested to enhance customer retention by addressing their
intentions to use legal software. These strategies include pricing, communication, and legal,
among others (Chiu et al. 2008).
Given that potential confounds have been identified in the piracy literature, future
projects should ensure these concerns have been sufficiently addressed. Since we employ an
experimental setting, we can eliminate these confounds with a careful experimental setup and
design, and focus entirely on utility derived by consumption. Further, the exploration of the link
between quality of the good and protection strategies employed in the analytical literature,
provides motivation for employing the importance of various quality levels of a good being
offered. This is particularly important since protection strategies such as DRM are largely
unsuccessful. The combination of a consumer‟s motivation to consume digital goods due to the
utility derived from consumption, in addition to the parallels between piracy and free-riding in
public goods, presents a novel opportunity for our research. We discuss how we utilize and
contribute to the literature in the following sections.
2.2 Public Goods
There has been a long tradition in the economics literature of studying public goods and
the associated implications of this game. Public goods may be described as being non-rival and
non-exclusive, and therefore cannot be diminished by individual consumption. Public goods rely
on the contribution of some consumers, but not necessarily all of them. This results in a Pareto
optimal equilibrium of voluntary contributors and free-riders (Marwell and Ames 1979; Marwell
and Ames 1981; Sugden 1984). The dominant strategy in a public goods game is to free-ride,
potentially resulting in the loss of the public good in the future due to lack of funding from

5
voluntary contribution. The same can be said for a digital goods producer under the threat of
piracy. If the producer desires to maximize revenue, and sales of the good generate revenue, why
give away the good for free to pirates? This is not a sustainable situation, thus requiring a
strategy to reduce this problem of free-riding.
2.3 Common-Pool Dilemmas and Threshold Public Goods
The producers of digital goods are generally motivated and sustained by sales revenue.
Therefore, a lack – or substantial loss – of sales revenue certainly results in failure. In this regard,
digital goods producers are presented with challenges that are not unlike those of a common-pool
dilemma. In particular, if a common-pool resource (such as a fishery) is overused, it is destroyed
and falls to the tragedy of the commons. We extend this concept to a firm that cannot cover its
development costs and other investments if subjected to a high level of piracy. Experimental
evidence suggests that common-pool resources with a given safe threshold eventually result in
destruction of the resource (Walker and Gardner 1992). This result parallels the free-riding
strategy dominant in typical public goods games.
If the firm is able to survive by providing a basic level of functionality when faced with
high piracy, might the firm introduce a higher quality good if they are likely to be compensated
for their efforts under low piracy? Consider the case where a firm is willing to invest in
comprehensive support solutions or other efforts that a consumer would derive utility from. This
situation is quite similar to the provision of a threshold public good. However, the presence of
uncertainty about the provision of a public good (or high quality good), results in lower
contributions to the public good (Dickinson 1998; Isaac et al. 1989). Further, if the threshold is
too difficult for the consumers to reach, provision of the public good again fails (Cadsby and

6
Maynes 1999). However, if the step return defining the payoffs associated with a particular
threshold is relatively high, it is possible to maintain equilibrium at the threshold (Croson and
Marks 2000). Success in finding the equilibrium at the threshold is not always guaranteed, but
the probability of success strictly increases as payoffs increase. However, although a threshold
may be an efficient Nash equilibrium, the lack of a coordination mechanism may result in
inefficient allocation amongst group members to the public good. We therefore employ
information as a mechanism in our paper to explore potential coordinating effects under a
multiple threshold public good.
2.4 The Role of Information on Coordination in Games
We implement coordinating strategies in our design as they have been shown to decrease
the free-rider problem and fit with our desire to test the role of information on piracy decision-
making. Given the opportunity to coordinate through information, it may be possible for the firm
to provide a high quality good while extracting the necessary rate of contribution from the
consumers. If a firm is capable of providing differentiated goods in which consumer‟s utility
varies significantly, it may be possible to coordinate and provide a higher quality of good. The
threat of defecting to the low-quality good if contributions fall below a certain threshold
represents a credible threat to the consumers, and may result in the ability to maintain a Pareto
optimal strategy for the firm and consumers. In a similar vein, Fehr and Gächter (2000) show
that maintaining a high level of contributions under the threat of punishment is possible and
mitigates the free-riding problem.
Our paper is novel as we explore the role of information targeting as a coordination
mechanism in a public goods context, which to the best of our knowledge has not been explored

7
in the literature. Coordination as a mechanism due to communication amongst subjects improves
group optimality, whereas no communication increases free-riding as expected since subjects
will play the Nash equilibrium (Isaac and Walker 1988). Croson and Marks (1998) explore the
role of anonymous and identifiable information on contribution to a threshold public good. Our
paper differs from their work as we focus on the role of targeted information, rather than the role
of identifiable information. Also, whether or not a particular type of information is complete or
incomplete does not matter (such as heterogeneous valuations or endowments), rather the critical
piece is the fact that some level of useful information is made available to the subjects (Marks
and Croson 1999). Further, conditional cooperation as a coordination mechanism (Fischbacher et
al. 2001) is quite applicable to the piracy context. In particular, 50% of subjects vary their
contributions according to the average group contribution when contribution information is made
available to them. This effect is greater when the subjects know they are matched as partners
rather than strangers (Keser and van Winden 2000). As we would expect, the strangers play Nash
while the partners coordinate to higher contributions, generally matching the contributions of the
other players (Croson et al. 2005).
Lastly, conditional cooperation is observed in the field in addition to the laboratory (Frey
and Meier 2004), extending the validity of utilizing information to produce pro-social outcomes
in a real world environment. These finding parallel what we might expect to observe under
piracy if subjects are aware of other consumer‟s behavior through some type of communication
from a firm, the press, or other industry source, with increased interest on the targeting
information to particular recipients. The use of information as a coordination mechanism has also
been shown to invoke pro-social outcomes in a dictator game (Krupka and Weber 2009). This is

8
important to note as the prior literature focuses primarily on public goods or minimal effort
games that do not have the pro-social element concern for the subjects.
3. The Multi-Provision Point Threshold Public Good
Our setting considers a modified version of a threshold public good. Specifically, we use
a multi-provision point mechanism with different step returns in the thresholds to elicit the
quality of a public good. In our game there are homogenous consumers, each of them endowed
with an amount which can either be used to buy a private good or a public good. The public
good can be of different qualities,
provided in a threshold setting with cost . If at least units of the private good are
contributed then one unity of the public good is provided with quality . Costs are increasing in
quality, with and the next quality level as compared to . Our
setting does not contemplate refunds or rebates. More specifically, contributions are not returned
to their contributors when the provision point is not met. Also, contributions are not returned
when they exceed a certain threshold but are still insufficient to provide the next quality level.
Consumers submit simultaneous and independent contributions. Call the contribution by
consumer for the public good . The price of the private good is normalized to . The
individual‟s earnings from the consumption of the private good are . The individual
earnings from consumption of the public good are dependent upon the quality which is delivered
based on the quality threshold reached. Consumers always prefer high-quality good to low-
quality good. Individuals care only about the total public and private provision level. The utility
function of consumer is linear and given by:

9
( )
∑
where
refers to the strictly positive value derived by consuming a good characterized by
quality level . Utility derived for each quality level increases in , with
.
In equilibrium, the individual decision on how much to contribute to the public good
depends on how much her contribution is crucial for the provision of a certain quality level.
Denote by the sum of all individuals‟ contributions except the one of individual . Given ,
individual‟s contribution is crucial if and only if . Being crucial is a
necessary but not sufficient condition for contributing. No individual contributes more to a
certain quality public good than her individual gain from extra quality, i.e., the individual
rationality constraint,
has to hold. It follows that the decision rule for each
individual is:
{
There is a continuum of pure Nash equilibria3 consisting of all possible situations where
quality thresholds are met. In particular these equilibria consist of all vectors of satisfying the
efficiency constraint: ∑ and the individual rationality constraint:
. These
equilibria can be symmetric and asymmetric depending on the cost-sharing rule. In a symmetric
equilibrium , in an asymmetric equilibrium at least . In the multi-provision
point threshold public good the symmetric equilibria are not necessarily payoff equivalent.
Consider the step return which gives the ratio of an individual‟s value of a certain quality public
3 In this game there are both pure and mixed equilibria. Our theoretical predictions focus exclusively on pure Nash
equilibrium.

10
good to their share of the cost
. The Pareto-efficient symmetric equilibria
maximizes the step return.
4. Experimental Setup
4.1 Experimental Design and Parameters
The experimental design implements our multi-provision point mechanism with 5
symmetric players4 randomly re-matched every period. This reassignment minimizes direct
reciprocity and reputation effects.5 We first elicit an expectation about the average contribution
the subject believes the other participants will contribute to the public good. The subjects then
decide how much they would like to contribute to the public good, with the knowledge that the
combined group contributions will dictate a particular quality level of the good provided. After
submitting their decision, each subject learns the quality level attained and the profit earned for
the period.
The individual contribution level depends on her subjective probability of being crucial in
providing a certain quality level for the public good. Therefore, information about the
contribution behavior of others in the group may affect individual‟s contribution decision. As
such, we consider four information treatments. In three of our four treatments, a subset of
subjects in the group is informed about the average contribution of their actual group members
before they make their individual contribution decisions. The average contribution of their
4 Public good experiments generally consider between four to ten subjects per group (see for example Croson 2007),
with coordination being more difficult as the number of subjects increases (Engelmann and Norman 2010, Knez and
Camerer 1994). 5 Even in randomly matched settings, information feedback can work as a reputation building device. In a repeated
random-matching prisoners‟ dilemma game information on the current partner‟s past actions can theoretically be
enough to sustain any level of cooperation (Takahashi 2010). However, reputation through information seems less
likely in our setting as we have a five-player game and individual behavior counts for 1/5 of the information.

11
actual group is computed using individual allocation decisions from the previous round. We
implement three information treatments that vary with respect to whom receives information: In
the random feedback treatment (random info) randomly selected consumers receive
information; in the target below feedback treatment (target below) consumers whose
contribution in the previous round is below the average contribution of their actual group receive
information; and in the target above feedback treatment (target above) consumers whose
contribution in the previous round is above the average contribution receive information. Our
fourth treatment considers the no feedback treatment (no info) that implements our multi-
provision point mechanism with no feedback.6
Each of our sessions consists of three blocks of 15 rounds each, with the exception of the
first block which has 16 rounds (46 total rounds across all three blocks). The first block contains
one extra round to allow for the same number of rounds with information as the second and third
blocks. Table 1 shows the four different lineups of our sessions. In sessions B, C, and D subjects
play one of the three information treatments for the first 16 rounds. From round 17 until 30 they
play the no info treatment. After round 31 until the end of the session subjects play the info
treatment they had played in the first 16 rounds. In session A subjects start with no info
treatment, then play the random info treatment followed by the no info treatment again.
Therefore, each subject only plays two treatments, one of the information treatments, and the no
information treatment.
Our design allows us to analyze the impact of information both within- and between-
subjects. Our primary interest is in contrasting the feedback treatment effects on coordination,
for which a between-subject analysis is preferred for avoiding learning effects. Further, the
6 In our experiment subjects are never informed about their group members‟ contribution for the public good after
they made their decision. They are never informed about their earnings after each round.

12
within-subject aspect allows us to infer whether the effect of receiving information about others
contributions as well as targeting the receivers has an effect that lasts even when information
ceases to be received. The last block of rounds for sessions B, C, D, when one of the info
treatments is played again, allows us to compare the impact of giving information for the first
time with the impact of re-implementing it. Comparing with the 17-31 rounds of no info we can
somehow infer about the marginal returns of information.
Table 1: Experimental Sessions
Rounds 1-16 Rounds 17-31 Rounds 32-46
A No info Random info No info
B Random info No info Random info
C Target below No Info Target below
D Target above No Info Target above
In our setting, each of the five players receives an endowment of 50 tokens every period7
which they can allocate to a purchase of a private good and a public good. Each token allocated
to a private good earns 1 token. Subjects may choose any integer between to allocate to
the public good. If less than 50 tokens are invested in the public good the quality provided will
be poor; If at least 50 tokens, but less than 100 are invested in the public good the quality
provided will be medium; If at least 100 tokens, but less than 150 the quality provided will be
good; If at least 150 tokens, but less than 200 are invested the quality provided will be very
good; If more than 200 tokens are invested in the public good the quality provided will be
excellent. Table 2 provides a summary of the parameters.
7 The purpose for providing the endowment each period is to avoid exposure to potential risk due to the subject‟s
prior performance, as well as maintain the non-repeated design in our game.

13
Table 2: Experimental Parameters
Quality
Contribution
threshold, (% of endowment)
Group payoff (
) for
the digital good Step return
% of the
threshold to be
able to contribute
Poor 0 (0%) 0 (0) Indeterminate 0%
Medium 50 (20%) 92.5 (18.5) 1.850 63.0%
Good 100 (40%) 227.5 (45.5) 2.275 73.0%
Very Good 150 (60%) 405 (81) 2.700 76.3%
Excellent 200 (80%) 625 (125) 3.125 78.0%
We utilize an increasing step return and an increasing percentage of the threshold for the
subject to be interested in contributing to the public good. These parameters require each subject
to expect that the other subjects are providing a greater allocation towards the group account in
order to meet the next higher threshold.
4.2 Experimental Procedures and Implementation
The experiment was conducted at the Vernon Smith Experimental Economics Laboratory
(VSEEL) at Purdue University in February of 2010.8 Subjects were recruited by email using the
laboratory‟s online recruitment system, and subject participation was limited to a single session.
The computerized experimental environment was implemented using the z-Tree v.3.3.6 software
package (Fischbacher 2007). Subjects were randomly assigned to individual computers and
communication was not allowed during the session. Copies of the experiment instructions were
provided to each subject and were read aloud by the experiment administrator. A copy of the
instructions used to conduct the experiment is available in Appendix A. Completion of control
8 VSEEL contains 28 computers with flat-panel displays on partitioned desks for the subjects, and one administrator
server computer. The partitioned layout makes it quite difficult for subjects to coordinate by glancing at another
screen or otherwise discussing the experiment. Further, an observation room with one-way glass is used to monitor
subject behavior throughout the experiment.

14
questions was required to ensure each subject understands the experimental procedures prior to
starting the actual experiment. Any subject that fails to answer the control questions after three
attempts was personally assisted by the experiment administrator.
A $5 US dollars show-up fee was paid to the subjects that were excused from the
experiment if more than 25 subjects arrived at each session. To avoid wealth effects, we
randomly choose three of the forty-six periods for payment, and pay each subject their total
profit over these periods at conversion rate of 20 tokens per dollar. The experiment lasted on
average 1 hour and subjects earned on average $12.6. All subjects were paid in cash privately
and individually at the conclusion of the experiment after completing a short demographic
questionnaire.
Each period the subjects were re-matched using a random draw by the computer and
assigned to a new group for that period. It is possible but not likely that subjects may be in the
same group each period, but this information in never communicated to them. Subjects were
never informed of who is in their group or the specific decisions that other subjects make during
the experiment. At the beginning of each round subjects were first asked about their beliefs about
the average contribution in their group. We do not incentivize beliefs since we would prefer to
not have the elicitation result in behavioral changes by the subjects (Gächter and Renner 2010).
Then subjects had to type their individual contribution into a text box. Input was validated by the
computer and subjects were shown a warning message if they attempt to violate the interval
provided. Validation also includes entering a negative integer or non-integer value. After
submitting their decision, the quality level attained and the profit earned for the period is
displayed to each subject.

15
Subjects were explicitly notified of a restart when the experiment moves to the next block
of the experiment (e.g. change in the information treatment). They did not know ex ante if or
when a restart would occur. The restart included the distribution of supplemental instructions on-
screen and read aloud by the experimenter. The subjects were never informed about the random
vs. targeted information treatments. In the information treatments, some subjects are presented
with an information stock that includes the average token allocation rate for the subjects that are
in the group for the current period. The allocation rate is obtained from the prior period for each
subject. This feedback allows some subjects to obtain some information about what they might
expect their group members to do in the current period. Subjects are also reminded of their own
allocation rate from the prior period.
In order to achieve the same amount of information each period, we use the same
algorithm for determining how many subjects will receive the information. This technique allows
for direct comparison of results between the information treatments. In the targeted rounds the
specific below or above average subjects receive information. We use this algorithm for
determining the number of participants that will receive information in the non-targeted rounds.
In particular, we count the number of subjects that would have been targeted and then randomly
select the same number of subjects for non-targeted information.
5. Discussion of Behavioral Predictions
Recall that our game has a continuum of pure Nash equilibria consisting of all possible
situations where quality thresholds are met. These equilibria can be symmetric and asymmetric
depending on the cost-sharing rule. The Pareto-efficient symmetric equilibrium is the one that
maximizes the step return (see Figure 1). As in any coordination game played in the lab subjects

16
may experience difficulty in playing a Nash Equilibrium, which is true in our game as well. In
our setting no refund is given for overfunded or underfunded contributions, therefore an
individual is only willing to contribute if the probability that her contribution is crucial for
providing a certain quality level is sufficiently large. More specifically, if an individual believes
that others‟ contributions are enough such that jointly with her own contribution a certain quality
level is provided, the individual is willing to contribute with the remaining amount to reach the
threshold (assuming that the rationality constraint is satisfied). As beliefs about others‟
contributions may not be correct and as consumers are randomly re-matched after each round,
the scope for coordination is limited and the convergence towards a more efficient Nash
equilibrium may not happen over time.
If subjects receive information and use it to correctly update their beliefs about others‟
contributions, we suspect that they will coordinate to a higher quality level with minimal costs.
However, we do not expect that targeting information to those either below or above the average
contribution of others in their group will make a difference in the individual‟s ability to
coordinate to a more efficient equilibrium, as compared to what may happen in the random
information treatment.
The above predictions are derived assuming individuals are homogenous and purely
money maximizers. However, consumers are likely to be heterogeneous regarding their social
preferences. For instance, they may have outcome-oriented social preferences, considering not
only their own payoff but others‟ payoffs as well. Or, consumers may have preferences for
conformity and decide to follow others in their choices. In any of these cases, not only
information would play a role, but targeting information can influence subject‟s decisions
differently.
17
Let us consider that individual consumers are influenced by inequity aversion and care
about an equitable outcome between themselves and another.9 A consumer may experience
disutility if their own outcome is not equitable compared to the average outcome for the other
consumers (Bolton and Ockenfels 2000). This is the appropriate model of inequity aversion for
our game since the players will receive feedback based upon an average contribution.10
Consider
the -player motivation function that illustrates the inequity aversion caused by differences
between player and the mean payoff of the other players (i.e. consumers). The utility function is
characterized by
∑
where player desires for their own payoff to equal the
average payoff for the group. As before, if a player is concerned about inequity aversion, the
player will adjust their decisions one way or the other to equalize their own share with the
average share from the group.
It is quite realistic to utilize this model of inequity aversion for studying coordination
between consumers since they may have some expectation or information about how they are
doing in comparison with their peers. Further, comparison of inequity amongst other consumers
may increase feelings of guilt or fairness if the particular consumer has a lower than average
contribution rate. In contrast, if the contribution rate is higher than another player‟s, the
consumer may feel emboldened by the group‟s behavior, resulting in a decrease in contribution
rate. Therefore, given the Bolton and Ockenfels (2000) motivation function, we expect the
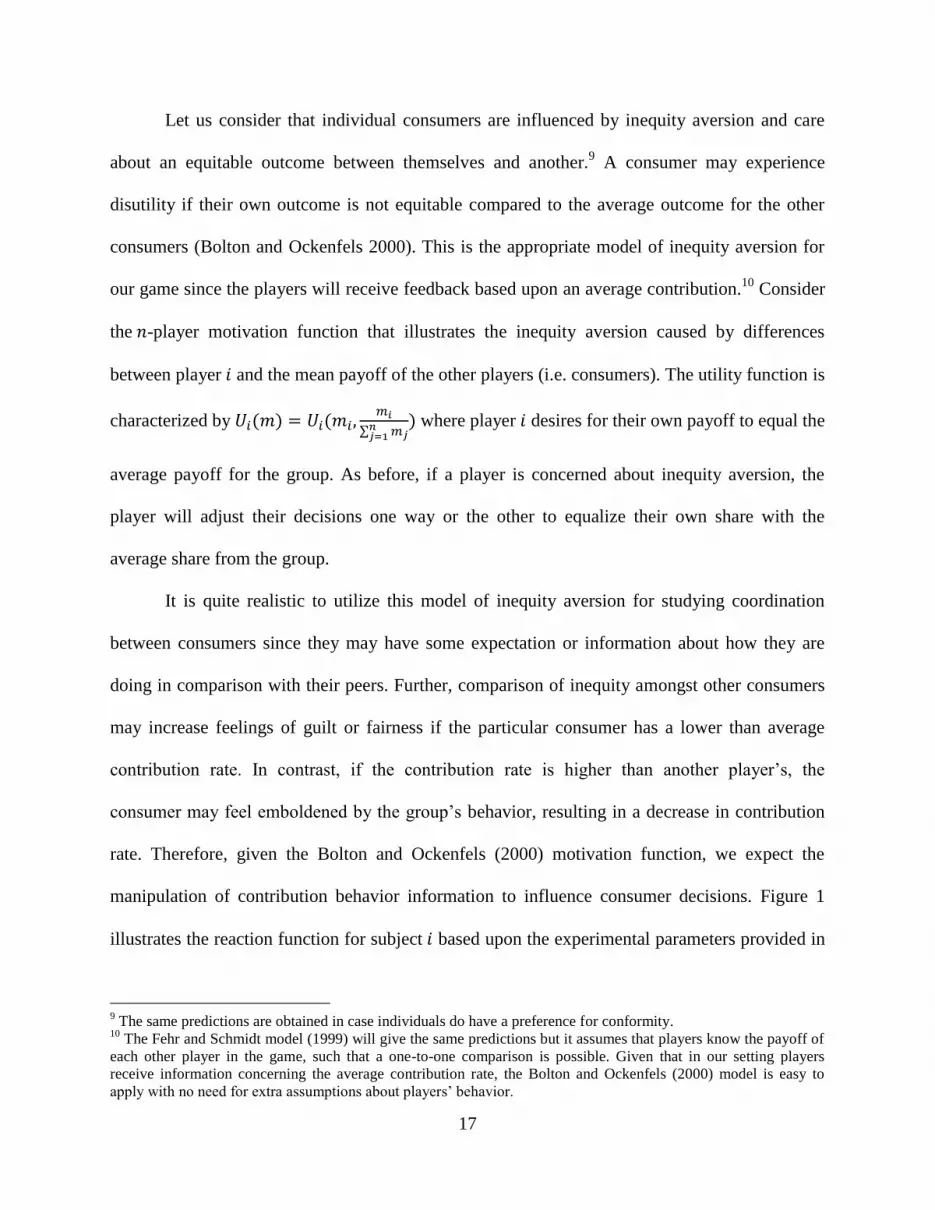
manipulation of contribution behavior information to influence consumer decisions. Figure 1
illustrates the reaction function for subject based upon the experimental parameters provided in
9 The same predictions are obtained in case individuals do have a preference for conformity.
10 The Fehr and Schmidt model (1999) will give the same predictions but it assumes that players know the payoff of
each other player in the game, such that a one-to-one comparison is possible. Given that in our setting players
receive information concerning the average contribution rate, the Bolton and Ockenfels (2000) model is easy to
apply with no need for extra assumptions about players‟ behavior.

18
Table 2. The solid black lines refer to the equilibria where the combined allocation of tokens for
the group account exactly satisfies a given threshold. If the subject is inequity averse in any way,
the subject strives to meet the symmetric equilibria where all subjects receive the same utility. If
for example, as Bolton and Ockenfels (2000) model predicts, the subject dislikes being behind
the average utility for the group, the subject allocates tokens at or below the symmetric equilibria
for a given threshold. Regardless of type, subject should never allocate more than 44 tokens to
the group account, otherwise the threshold for the Excellent quality level will be exceeded,
resulting in an inefficient outcome.
Figure 1: Graph of the Reaction Function for Subject
50 100 150 200
50
40
30
20
10
0
xi
x-i
Maximum Contribution Ei
Efficient Equilibria
Inequity Averse (all types)
Inequity Averse (dislike being behind)
4031.5 8073
18.5
27
114.5
35.5
120
156
160
44
Poor
Medium
Good
Very Good
Excellent

19
Since our focus is on targeted information, we expect the targeted feedback to result in a
different level of coordination to the random feedback treatment. If a consumer observes a low
average contribution rate in the random feedback treatment, the consumer may encounter
disutility from other consumers doing better than they are, resulting in a decrease in their own
contribution rate. In contrast, if a consumer observes a high average contribution rate in the
random feedback treatment, the consumer may encounter disutility from other consumers doing
worse than they are, resulting in an increase in their own contribution rate. Overall, we expect
subjects in the random information treatment to converge at symmetric contribution levels since
adjustments will be simultaneously made up and down by the players. It is not clear though that
feedback will help consumers to coordinate on a more efficient equilibrium.
In contrast, we believe the targeted feedback treatments will reach more efficient
equilibria. Consider the targeted below treatment where only those subjects that contribute below
the average will receive feedback. In this case, these below average subjects will move along the
solid black threshold lines shown in Figure 1 to a more asymmetric rate of contribution by the
subjects. This will eventually lead to the below average subjects contributing more than the
above average subjects, resulting in a change of roles between the below and above average
contributors. As this process continues, we expect to see continual increases in contributions
since there will not be feedback that will drive the contribution rate down as in the prior
prediction for random feedback. We expect the opposite result for the targeted above treatment.
The random feedback treatment may increase coordination amongst the players towards
the symmetric equilibrium. This is due to subjects being targeted with below / above information
about the average contribution of the players in the group, potentially driving their contributions
upwards and downwards simultaneously. We expect the no feedback information treatment to

20
have more difficulty with coordination and in fact expect to see a failure of coordination towards
lower thresholds, if not complete free-riding by all subjects. All of these predictions of course
rely to some extent on the homogeneity of social preferences, as a heterogeneous preference
towards selfish (or altruistic) behavior will certainly increase the difficulty of coordination
amongst the subjects.
6. Experimental Results
Analyses presented in this section are from data collected during four independent
sessions in the VSEEL lab at Purdue University, one for each of the treatments listed in Table 1.
A total of 90 subjects participated in our experiments (treatment A: n=20, treatment B: n=25,
treatment C: n=25, treatment D: n=20). Subjects were compensated between $8.25 and $16.75
for experiments lasting between 1 and 1.5 hours.
We first present the aggregate data for all four treatments. Graphical views of the
aggregate data provide initial insight into overall patterns and discrepancies that will be
disentangled as our deeper analysis unfolds. Mean allocations for all subjects in each treatment
are provided in Figure 2 and median allocations for all subjects are provided in Figure 3. As
expected, the mean allocations in the first round for all sessions follow the stylized fact that
subjects allocate approximately half of their endowment to the public good in the beginning
rounds (Ledyard 1995). These initial allocations of course begin to change as subjects develop
expectations by learning about the game, as well as the consequences / rewards of their actions
during successive rounds of play. However, as described in Section 4.1, our design ensures direct
reciprocity and reputation effects are kept to a minimum because each round is played as a one-
shot game due to our random re-matching of subjects.

21
In regards to mean allocation at an aggregate level (Figure 2), subjects in both of the
targeted treatments appear to coordinate to higher thresholds across all periods in comparison to
the no information and random information treatments. Further, coordination appears to remain
stable in the targeted treatments when moving to the second block of rounds (i.e. rounds 17-31)
when subjects are restarted with the no information treatment. In contrast, the treatments
beginning with the no information or random information feedback treatments are not able to
coordinate as effectively as the targeted treatments.
Figure 2: Mean Allocation per Round
0
5
10
15
20
25
30
35
40
45
1 3 5 7 9 11 13 15 17 19 21 23 25 27 29 31 33 35 37 39 41 43 45
Me
an A
lloca
tio
n (
in t
oke
ns)
Round
No Info / Random / No Info
Random / No Info / Random
Target Below / No Info / Target Below
Target Above / No Info / Target Above

22
Similar patterns are observed for the median allocation at an aggregate level (Figure 3).
The targeted above feedback treatment appears to enable and maintain coordination around the
40 token threshold, whereas the targeted below feedback treatment is less efficient yet still above
the 30 token threshold. There is considerable noise for the no information treatment, with
medians ranging from approximately 18 – 35 tokens across feedback treatments. The median
allocation for the random information treatment appears to consistently degrade over time to a
free-riding state in later rounds.
Figure 3: Median Allocation per Round
0
5
10
15
20
25
30
35
40
45
1 3 5 7 9 11 13 15 17 19 21 23 25 27 29 31 33 35 37 39 41 43 45
Me
dia
n A
lloca
tio
n (
in t
oke
ns)
Round
No Info / Random / No Info
Random / No Info / Random
Target Below / No Info / Target Below
Target Above / No Info / Target Above

23
Given the aggregate patterns of allocations just described for each of the treatments, we
now desire to carefully analyze and compare feedback treatments. We can then determine if
there are significant differences in the ability for subjects to coordinate amongst the various
information treatments, providing insight into the approach that should be used in practice to
deter piracy.
The no information feedback treatment represents a baseline which is consistent with the
prior literature. We therefore conduct our initial comparisons between the baseline (no
information) and the random information feedback treatment. The random information treatment
is our representation of complete information (although clearly incomplete in our case), which is
typically the information approach used by the literature (i.e. no information vs. complete
information). Once this comparison is made, we may then compare the targeted feedback
treatments to the random feedback treatments. We gradually step into the comparisons of
feedback treatments because we desire to compare similar levels of information stock between
the random and targeted feedback treatments. As described in Section 5, we use the same
algorithm for determining how many subjects receive information in the random and targeted
information treatments. Because we use the same algorithm, the information stock are expected
to be comparable, thus direct comparisons can be made.
6.1 No Information Treatment vs. Random Information
Table 3 includes the mean and median values for the various blocks of rounds across the
four treatments in our experiment. We begin our analysis of the mean allocation by using non-
parametric statistical procedures such as the Wilcoxon signed-rank test for within-subject
analysis, and the Mann-Whitney U test for between-subject analysis. For the first treatment (no

24
information / random information / no information), there is not a significant difference between
the first and second blocks of rounds. Although the mean is slightly smaller in the second block
(23.09) compared to the first block (24.96), subjects generally appear to be maintaining the same
level of allocations after moving to the random information treatment. However, when we
compare the first block to the third block, we do find a statistical difference between the means
(two-sided Wilcoxon signed-rank, z = 2.478, p < 0.05). This result suggests that the subjects are
having difficulty maintaining the same level of coordination in the third block of rounds, in
comparison to the first two blocks of rounds. We would expect this result since the subjects are
not receiving any information about the average contribution to the good, therefore the subjects
will converge to a lower threshold (in this case, approximately 20 tokens), or perhaps ultimately
to a free-riding equilibrium.
Table 3: Mean and Median Allocation per Block of Rounds
Rounds 2 - 16 Rounds 17 - 31 Rounds 32 - 46
Treatment Mean Median Mean Median Mean Median
No Info / Random / No Info 24.96 25 23.09 25 21.21 22
Random / No Info / Random 24.50 27 19.37 20 11.46 5.5
Target Below / No Info / Target Below 32.09 36 31.05 35 28.58 31
Target Above / No Info / Target Above 37.13 40 38.86 40 36.74 40
For the second treatment (random information / no information / random information),
we find the subjects degrade quite rapidly in their ability to coordinate. This is an unexpected
and counterintuitive result as the availability of information is generally considered a
coordination mechanism. However, in our design, we do not provide information to all subjects,
limiting the ability to coordinate effectively. We observe significant differences between the
means from the first block (24.50) to the second block (19.37) (two-sided Wilcoxon signed-rank,

25
z = 6.409, p < 0.001), as well as the first block to the third block (11.46) (two-sided Wilcoxon
signed-rank, z = 12.656, p < 0.001). We observe in this treatment a quick degradation in
coordination during the random feedback treatments, whereas the second block (no information
treatment) provides evidence of some ability to maintain a threshold around 20 tokens. Clearly
there is a discrepancy in allocation behavior between those subjects that receive information
above and below the mean contribution rate from the prior round, thereby driving the mean
allocation rate downwards.
When we compare the mean allocation rates between the first block of rounds for the first
two treatments, we do not find a significant difference between the no information treatment
(24.96) and the random information treatment (24.50) (Mann-Whitney U test, z = 0.437).
However, if we compare the no information treatment in the first block to the no information
treatment in the second block (19.37), we do observe a significant difference between the means
(Mann-Whitney U test, z = 3.980, p < 0.001). The same result does not hold true for comparing
the random feedback treatments between the first two treatments (Mann-Whitney U test, z =
1.091). These results suggest that history matters to the subjects, particularly if they received
random information prior to the no information treatment. However, if the subjects never
received information about the mean allocation in the first block of rounds, the subjects did not
degrade significantly in their ability to coordinate around a stable threshold.
6.2 Target (Below or Above) Information Treatments vs. Random Information
Next we consider the means for the targeted information treatments in the third and
fourth row in Table 3 to each other as well as the random information treatment. In regards to the
target below treatment, there is a significant difference between the first block (32.09) and the

26
second block (31.05) (two-sided Wilcoxon signed-rank, z = 2.605, p < 0.01), as well as the first
block and the third block (28.58) (two-sided Wilcoxon signed-rank, z = 5.405, p < 0.001). The
mean allocation is degrading slightly over time and changes of information in this treatment. The
subjects approach the equilibrium at 30 tokens in the first two blocks. In the latter rounds in the
third block the subjects fail to maintain the threshold at 30 tokens and instead degrade into the
next lower threshold level. Although the allocations decrease over time, the subjects are still able
to maintain median allocation levels at or above 30 tokens. This is in stark contrast to the random
information treatment. There is a significant difference between the mean for the targeted below
information treatment (32.09) and the random information treatment (24.50), with the targeted
below information treatment reaching a higher level of mean allocation (Mann-Whitney U test, z
= 6.699, p < 0.001).
In regards to the targeted above information treatment, there is a significant difference
between the first (37.13) and second block (38.86) of rounds (two-sided Wilcoxon signed-rank, z
= 3.144, p < 0.01), however there is not a significant difference between the first and third block
(36.74) of rounds. Therefore, the target above information treatment appears to be able to
recover from a slight degradation in coordination during the middle block of rounds (no
information treatment), to the prior level of coordination (target above treatment). If we compare
between treatments for the first block of rounds, the targeted above information treatment
reaches a mean allocation (37.13) that is significantly higher than that of the below information
treatment (32.09) (Mann-Whitney U test, z = 4.312, p < 0.001). Further, as with the targeted
below information treatment, there is a significant difference between the means for the targeted
above information treatment and the random information treatment (24.50) (Mann-Whitney U
test, z = 10.471, p < 0.001).

27
To summarize the non-parametric results just discussed, it is clear that the targeted
information treatments allow subjects to coordinate at higher allocation levels than when
compared to the random information treatment. The random information treatment and the no
information treatment perform similarly, at least in the initial blocks of rounds. The targeted
information treatments appear to maintain a stable rate of allocation whereas the random
information treatment degrades rapidly to free-riding.
We also conduct parametric regressions to provide insight into how the availability of
information is affecting the subject‟s decisions. The regressions for the first block of rounds are
shown in Table 4 and are organized in columns by each information treatment. We focus on the
first block of rounds because we wish to compare decisions between the information treatments,
without allowing history to affect future decisions (e.g. the restarting of information treatments
when switching to a new block of rounds). The first variable listed is a dummy that is assigned a
1 if the particular subject received information in a particular round. If the subject did not receive
information, this dummy is assigned a 0. The second variable captures the beliefs that are elicited
from each subject prior to any information being provided. We include fixed effects for each
round to control for any learning that may occur over time. The coefficients on the information
dummy reinforce the non-parametric results provided earlier. The signs on these coefficients are
consistent with the mean allocation pattern for each of these information treatments, with the
random and targeted below treatments degrading over time. In contrast, the allocations under the
targeted above information treatment are stable and/or increase slightly over time, and therefore
the information dummy has a positive sign.
Table 4: Regression by Information Type for the First Block of Rounds (2 – 16)

28
Information Type
DV: Allocation Amount Random Below Above
Information Dummy -2.768* -11.441*** 2.794*
(1.298) (1.443) (1.151)
Beliefs 0.763*** 0.560*** 0.414**
(0.058) (0.080) (0.120)
Constant 9.405*** 19.552*** 21.613***
(2.659) (4.185) (4.724)
Rounds Fixed Effects Yes Yes Yes
Observations 375 375 300
R-squared 0.3719 0.4282 0.1887
*** p < 0.001, ** p < 0.01, * p < 0.05 Robust standard errors shown in parentheses
Given the results presented thus far, it is apparent that the targeted above information
treatment reaches the highest mean allocation level, followed by the targeted below information
treatment, with the no information and random information treatments performing similarly.
These results do not suggest inequity aversion as the only mechanism for coordination amongst
the subjects, as otherwise the targeted below information treatment would perform the best,
followed by the random information treatment, the targeted below information treatment, and the
no information treatment. Instead, it appears that another behavioral mechanism may be affecting
the decisions made by the subjects in our experiment instead of, or in conjunction with, inequity
aversion.
6.3 Categorization of Subjects by Conditional Cooperation Type
Recall that the subjects in our experiment observe the following independent steps per
each round: (1) belief elicitation, (2) information provided about average group allocation
(depends on the information treatment and whether or not the subject receives information in the
current round), and (3) the subject makes an allocation decision for the current round. Our

29
approach allows us to capture any discrepancies between the subject‟s beliefs – which are based
upon learning the outcomes from previous rounds – and the use of information to update beliefs.
Therefore, the receipt of information by the subject has the potential effect of influencing their
allocation decision in the current round. Although the subjects learn about group allocations over
time, there is no reason ex ante why the new group would be better, worse, or otherwise different
than a prior group.
Given our approach and the data we have collected, it is possible to categorize subjects
based upon the effect that information has on their allocation decision. Specifically, since
inequity aversion does not appear to be the dominant driving factor as discussed in the prior sub-
section, it is possible that various types of conditional cooperation may be influencing subject
behavior. We distinguish between three types of cooperators in our analysis: (1) unconditional
cooperators, (2) conditional cooperators, and (3) unconditionally selfish subjects. When
information is received in a round, unconditional cooperators will likely allocate more than the
expected average rate to the group account. Conditional cooperators will switch between
allocating more or less than the average allocation rate. Unconditionally selfish subjects will
always allocate below the average allocation rate. Table 5 describes the percentage of subjects in
each information treatment that are categorized as each type. Categorizations decisions are made
by counting the number of allocation decisions made above and below the expected allocation
rate for the new group. Note, we use 75% as a threshold for the unconditional classifications to
allow for noise and /or error in the subject‟s allocation (e.g. if a subject allocates below the
average allocation rate at least 6 of 8 times information is received, the subject would be
classified as unconditionally selfish).

30
Table 5: Subject‟s Conditional Cooperation Type when Information is Observed
Information
Treatment Unconditional
Cooperators Conditional
Cooperators Unconditionally
Selfish
Random 28.0% 48.0% 24.0%
Target Below 21.7% 17.4% 60.9%
Target Above 45.0% 50.0% 5.0%
As shown in Table 5, the random information treatment is relatively balanced between
cooperator types. The majority of subjects are considered conditional cooperators for this
information treatment. In regards to the target below information treatment, 60.9% of the
subjects are classified as unconditionally selfish. Therefore informing pirates of their bad
behavior may actually reinforce their decision, encouraging them to continue allocating less to
the public good. The target below information treatment does have a large percentage of subjects
categorized as unconditional and conditional cooperators, which could offset the selfish player‟s
decisions to some extent. In regards to the target above information treatment, all but 5% of
subjects are conditional or unconditional cooperators. Therefore, information given to non-
pirates about the average group allocation rate does not appear embolden more piracy. Instead,
the non-pirates use this information to increase their allocations to the public good, thereby
encouraging coordination towards a higher quality threshold.
7. Conclusion
The overall goal of this study is to study the role of information targeting on coordination
between subjects in an experimental setting. We motivate our study using the phenomenon of
digital piracy and provide evidence that piracy may be modeled like a public good. We
implement an abstract framework of a multiple-threshold public good game, and develop

31
information treatments based upon strategies used in the real-world for informing consumers of
piracy rates faced by digital goods producers.
We find that randomly providing consumers with information about the contribution rate
results in the same level of coordination as not providing any information at all, particularly over
the short-term. In the long-term, random information performs worse than no information at all.
In contrast, the ability to target information to specific consumer groups increases the ability for
coordination to occur. In particular, informing those consumers who are currently not pirating
the public good encourages them to continue their good behavior, thus maintaining a high level
of quality for the good. Targeting those consumers that are currently pirating the good has the
opposite effect of encouraging more piracy of the good, perhaps by reinforcing their bad
behavior. Although targeting pirates with information does not perform as well as targeting non-
pirates, this strategy still allows for better coordination than the random information approach.
Perhaps the random information approach reaches more conditional cooperators, which allows
those types of consumers to be drawn downwards by the allocation decisions made by the
pirates. In contrast, conditional cooperators may be pulled upwards by unconditional cooperators
when non-pirates are targeted with information. Overall, our research provides new insights into
the role of information in a public goods setting, allowing for useful implications to mitigate the
piracy problem in practice.

32
References
2D Boy. 2008. “90%,” November 13, (available from http://www.2dboy.com/category/
uncategorized/page/10/; accessed September 19, 2010).
Abbink, K., and Hennig-Schmidt, H. 2006. “Neutral versus Loaded Instructions in a Bribery
Experiment,” Experimental Economics (9), pp. 103-121.
Bhattacharjee, S., Gopal, R., Marsden, J.R., Sankaranarayanan, R., and Telang, R. 2009. “To
Theme or Not to Theme: Can Theme Strength be the Music Industry's “Killer App”?,”
Decision Support Systems (48:1), pp. 141-149.
Bhattacharjee, S., Gopal, R.D., and Sanders, G.L. 2003. “Digital Music and Online Sharing:
Software Piracy 2.0?,” Communications of the ACM (46:7) 2003, pp. 107-111.
Bolton, G.E., and Ockenfels, A. 2000. “ERC: A Theory of Equity, Reciprocity, and
Competition,” American Economic Review (90:1), March, pp. 166-193.
Business Software Alliance. 2010. “Seventh Annual BSA/IDC Global Software: 09 Piracy
Study,” (available from http://www.bsa.org; accessed September 19, 2010).
Cadsby, C.B., and Maynes, E. 1999. “Voluntary Provision of Threshold Public Goods with
Continuous Contributions: Experimental Evidence," Journal of Public Economics (71:1),
pp. 53-73.
Carroll, R. 2008. “Casual Games and Piracy: The Truth,” Gamasutra, February 12, (available
from http://www.gamasutra.com/php-bin/news_index.php?story=17350; accessed
September 19, 2010).
Chellappa, R.K., and Shivendu, S. 2005. “Managing Piracy: Pricing and Sampling Strategies for
Digital Experience Goods in Vertically Segmented Markets,” Information Systems
Research (16:4), December, pp. 400-417.
Cheng, H.K., Sims, R.R., and Teegen, H. 1997. “To Purchase or to Pirate Software: An

33
Empirical Study,” Journal of Management Information Systems (13:4), pp. 49-60.
Chiu, H.C., Hsieh, Y.C., and Wang, M.C. 2008. “How to Encourage Customers to Use Legal
Software,” Journal of Business Ethics (80:3), July, pp. 583-595.
Croson, R. 2007. “Theories of Commitment, Altruism and Reciprocity: Evidence from Linear
Public Goods Games,” Economic Inquiry (45:2), April, pp. 199-216.
Croson, R., Fatas, E., and Neugebauer, T. 2005. “Reciprocity, Matching and Conditional
Cooperation in Two Public Goods Games,” Economics Letters (87:1), pp. 95-101.
Croson, R., and Marks, M. 1998. “Identifiability of Individual Contributions in a Threshold
Public Goods Experiment,” Journal of Mathematical Psychology (42), pp. 167-190.
Croson, R., and Marks, M. 2000. “Step Returns in Threshold Public Goods: A Meta- and
Experimental Analysis,” Experimental Economics (2), pp.239-259.
Dickinson, D.L. 1998. “The Voluntary Contributions Mechanism with Uncertain Group
Payoffs,” Journal of Economic Behavior & Organization (35:4), pp. 517-533.
Engelmann, D., and Norman, H.T. 2010. “Maximum Effort in the Minimum-Effort Game,”
Experimental Economics (13), pp. 249-259.
Erat, S., and Gneezy, U. 2010. “White Lies,” Proceedings of the Behavioral and Quantitative
Game Theory: Conference on Future Directions, ACM, Newport Beach, California.
Fehr, E., and Gächter, S. 2000. “Cooperation and Punishment in Public Goods Experiments,”
The American Economic Review (90:4), pp. 980-994.
Fehr, E., and Schmidt, K.M. 1999. “A Theory of Fairness, Competition, and Cooperation,” The
Quarterly Journal of Economics (114:3), August, pp. 817-868.

34
Fischbacher, U. 2007. “z-Tree: Zurich Toolbox for Ready-Made Economic Experiments,”
Experimental Economics (10:2), pp. 171-178.
Fischbacher, U., Gächter, S., and Fehr, E. 2001. “Are People Conditionally Cooperative?
Evidence from a Public Goods Experiment,” Economics Letters (71:3), pp. 397-404.
Frey, B.S., and Meier, S. 2004. “Social Comparisons and Pro-Social Behavior: Testing
“Conditional Cooperation” in a Field Experiment,” The American Economic Review
(94:5), pp. 1717-1722.
Gächter, S., and Renner, E. 2010. “The Effects of (Incentivized) Belief Elicitation in Public
Goods Experiments,” Experimental Economics (13), pp. 364-377.
Gopal, R., and Sanders, G. 1997. “Preventive and Deterrent Controls for Software Piracy,”
Journal of Management Information Systems (13:4), pp. 29-47.
Graft, K. 2010. “Machinarium Dev Saw up to 95% Piracy Rate,” Gamasutra, August 5,
(available from http://www.gamasutra.com/view/news/29768/Machinarium_Dev_Saw
_Up_To_95_Piracy_Rate.php; accessed September 19, 2010).
Isaac, R.M., and Walker, J.M. 1988. “Communication and Free-Riding Behavior: The Voluntary
Contribution Mechanism,” Economic Inquiry (26:4), pp. 585-608.
Isaac, R.M., Schmidtz, D., and Walker, J.M. 1989. “The Assurance Problem in a Laboratory
Market,” Public Choice (62:3), pp. 217-236.
Keser, C., and van Winden, F. 2000. “Conditional Cooperation and Voluntary Contributions to
Public Goods,” The Scandinavian Journal of Economics (102:1), pp. 23-39.
Knez, M., and Camerer, C. 1994. “Creating Expectational Assets in the Laboratory:
Coordination in „Weakest- Link‟ Games,” Strategic Management Journal (15), Winter,
pp. 101-119.

35
Krupka, E., and Weber, R.A. 2009. “The Focusing and Informational Effects of Norms on Pro-
Social Behavior,” Journal of Economic Psychology (30:3), pp. 307-320.
Ledyard, J.O. 1995. “Public Goods: A Survey of Experimental Research,” in: The Handbook of
Experimental Economics, J. Kagel and A. Roth (eds.), Princeton University Press,
Princeton, NJ, pp. 111-194.
Marks, M., and Croson, R. 1999. “The Effect of Incomplete Information in a Threshold Public
Goods Experiment," Public Choice (99:1), pp. 103-118.
Marwell, G., and Ames, R.E. 1979. “Experiments on the Provision of Public Goods. I.
Resources, Interest, Group Size, and the Free-Rider Problem,” The American Journal of
Sociology (84:6), pp. 1335-1360.
Marwell, G., and Ames, R.E. 1981. “Economists Free Ride, does Anyone Else?: Experiments on
the Provision of Public Goods, IV,” Journal of Public Economics (15:3), pp. 295-310.
Recording Industry Association of America. 2010. “Piracy: Online and on the Street,” (available
from http://www.riaa.com/physicalpiracy.php; accessed July 29, 2010).
Shin, S.K., Gopal, R.D., Sanders, G.L., and Whinston, A.B. 2004. “Global Software Piracy
Revisited,” Communications of the ACM (47:1), pp. 103-107.
Smith, E., and Benoit, D. 2010. “Nine Movie Sites Busted in Pirating Crackdown,” The Wall
Street Journal, July 1, (available from http://online.wsj.com/article/SB10001424052748
703426004575339120611859094.html; accessed September 19, 2010).
Sugden, R. 1984. “Reciprocity: The Supply of Public Goods through Voluntary Contributions,”
The Economic Journal (94:376), pp. 772-787.
Sundararajan, A. 2004. “Managing Digital Piracy: Pricing and Protection,” Information Systems
Research (15:3), pp. 287-308.

36
Takahashi, S., 2010. “Community Enforcement when Players Observe Partners‟ Past Play,”
Journal of Economic Theory (145:1), pp. 42-62.
Varian, H.R. 1998. “Markets for Information Goods,” Working Paper.
Walker, J.M., and Gardner, R. 1992. “Probabilistic Destruction of Common-Pool Resources:
Experimental Evidence,” Economic Journal (102:414), pp. 1149-1161.

37
Appendix A: Experiment Instructions
This is an economic experiment about decision making under uncertainty. Listening carefully to
these instructions will help you to earn a significant amount of money, which you will receive in
cash privately at the end of the experiment. Your earnings in this experiment will depend on your
performance in the individual rounds. Your final payout will be determined by three random
draws done by the computer at the conclusion of the experiment. The three draws will
correspond to three rounds during the experimental session. The total earnings over these three
randomly selected rounds will be taken to calculate your final payout. All earnings in this
experiment will be presented to you in tokens and converted to US dollars at the conclusion of
the experiment. The conversion rate is: 20 tokens per 1 US dollar. The conversion rate is
identical for everyone.
You are welcome to ask questions at any time by raising your hand. Please wait for an
experimenter to come to your seat before asking your question. While the experiment is in
progress, please do not speak or in any other way communicate with other participants. This is
important to the validity of the study.
Specific Guidelines:
You will participate in 46 rounds in a group with four other participants. Participants are re-
matched randomly at the beginning of each round to a new group of five participants. You
will not know who is in your group. In each round you will receive an endowment of 50 tokens.
The endowment is identical for everyone. You and every member in your group have to
individually decide how much of this endowment to allocate to a group account. This allocation

38
must be a whole number, between 0 and 50 tokens. All decisions are made simultaneously and
without communication. No other group member will ever know how much you choose to
allocate to the group account.
Your earnings in each round are determined by combining what is left of your endowment after
the allocation, plus the consumption of a product. The earnings equation is presented below.
Your earnings = endowment – your allocation + product quality value
The value from the product depends on the total group allocation. If the group allocation is
between 0 and 49, the quality of the product is Poor and the product quality value for you is 0
tokens. If the group allocation is between 50 and 99, the quality of the product is Medium and
your product quality value is 18.5. If the group allocation is between 100 and 149, the quality of
the product is Good and your product quality value is 45.5. If the group allocation is between
150 and 199, the quality of the product is Very Good and your product quality value is 81.
Lastly, if the group allocation is greater than 200, the quality of the product is Excellent and your
product quality value is 125. These are summarized in the table below.
If your Total Group
Allocation is:
Then your Product
Quality is:
And your Product
Quality Value is:
0 - 49 Poor 0
50 - 99 Medium 18.5
100 – 149 Good 45.5
150 - 199 Very Good 81
200 + Excellent 125

39
Examples:
If your combined group account for a round is 70 tokens, the quality of the product
delivered to your group in that round is Medium. This will result in 18.5 tokens added as
your Product Quality Value.
If your total payout for the three randomly chosen rounds is 232 tokens, you will earn
$11.60. In this case the experimenter will pay you a total of $11.75 in cash at the
conclusion of the experiment.
Are there any questions?

40
Appendix B: Supplemental Experiment Instructions
This page shows the supplemental instructions that subjects receive if their session begins with
an information condition.
IMPORTANT:
Some participants in each group might receive information at the beginning of each round. If
you receive information, you will see the average number of tokens the participants in your
current group allocated to their prior group accounts in the previous round. The average number
of tokens is presented as if you were in the same group last round.
For example,
If every participant in your current group chose to allocate 10 tokens to the group account
last round, the average allocation presented to you in the current round is 10 tokens.
If two participants in your current group chose to allocate 10 tokens to the group account
last round, and three participants chose to allocate 20 tokens to the group account last
round, the average token allocation presented to you in the current round is 16 [ = (10 +
10 + 20 + 20 + 20) / 5 ] tokens.

41
This page shows the supplemental instructions that subjects receive after a restart if their session
begins with a no feedback information treatment.
Supplemental Experiment Instructions
IMPORTANT:
Some participants in each group might receive information at the beginning of each round. If
you receive information, you will see the average number of tokens the participants in your
current group allocated to their prior group accounts in the previous round. The average number
of tokens is presented as if you were in the same group last round.
For example,
If every participant in your current group chose to allocate 10 tokens to the group account
last round, the average allocation presented to you in the current round is 10 tokens.
If two participants in your current group chose to allocate 10 tokens to the group account
last round, and three participants chose to allocate 20 tokens to the group account last
round, the average token allocation presented to you in the current round is 16 [ = (10 +
10 + 20 + 20 + 20) / 5 ] tokens.

42
Appendix C: Experiment Screenshots
Figure C-1: Elicit Beliefs Screenshot
Figure C-2: No Information Feedback Allocation Decision Screenshot

43
Figure C-3: Targeted Below Information Feedback Allocation Decision Screenshot
Figure C-4: Results Screenshot


