Embed Size (px)
Citation preview

Draft of April 2, 2004; currently under revision. Please do not cite without permission.
Information Technology Trade and Asia-Pacific Interdependence
Byron Gangnes1 University of Hawaii at Manoa,
Visiting Singapore Management University
Ari Van Assche and Carl Bonham University of Hawaii at Manoa
Abstract
Over the past two decades, East Asian economies have become centers of world production and export for Information Technology (IT) products. Growth in global IT demand and cost-saving outsourcing of labor-intensive production has fueled rapid expansion of industrial production, wealth and trade. At the same time, the dramatically increased specialization in IT production has increased vulnerability of these economies to industry cycles and dependence on broader business cycle fluctuations in the dominant North American market. In this paper we study the growth and determinants of IT trade in the Asia-Pacific region. We argue that the rise of IT trade must be understood within the context of increasing vertical fragmentation of production processes that has occurred in the last two decades. This has implications for the appropriate specification of empirical trade equations for IT products. We present preliminary results of pooled bilateral export equations for East-Asian IT exports. We conclude with some observations on how micro data could help to inform out understanding of these issues. JEL Classification: C33, F14, F23.
1 School of Economics and Social Sciences, Singapore Management University, 469 Bukit Timah Road Singapore 259756; email: [email protected] or [email protected]. Thanks to participants in the Fall 2002 Project LINK meeting, Bologna, Italy, and the International Conference on the New Development in the Asia Pacific Region: Economic Analysis using Micro-Data, Yokohama National University, February 2003. We would like to thank Singapore Management University and the University of Hawaii New Economy Research Grant program for financial support.

1
1. Introduction Over the past two decades, East Asian economies have become centers of world
production and export for Information Technology (IT) products. Growth in global IT demand and cost-saving outsourcing of labor-intensive production has fueled rapid expansion of industrial production, wealth and intra-regional trade.
The growing role of East Asia in IT production ultimately derives from changes in technology and the environment of business that have made it profitable for multinational enterprises (MNEs) to fragment their production process internationally. Declines in transportation, communication and other coordination costs have permitted U.S. and Japanese MNEs in particular to outsource labor-intensive component production to East Asia in order to take advantage of lower factor prices abroad.
The international production fragmentation and resulting production networks has created a web of trade, investment and financial linkages among the U.S., Japan and East Asian developing countries. At the same time, East Asian economies have become increasingly specialized in IT production. Together, these developments may have significantly increased the vulnerability of East Asia to IT industry cycles and its overall dependence on broader business cycle fluctuations in the dominant North American market.
In this paper we study the growth and determinants of IT trade in the Asia-Pacific region with the goal of identifying a robust empirical model of IT trade relationships. We begin in section 2 by reviewing the evolution of East Asian IT trade and patterns of specialization. Then in Section 3 we describe the phenomenon of international vertical fragmentation of production and discuss how this process has shaped IT trade and investment relationships for East Asia. In Section 4 we turn to empirical trade analysis and present a model of IT trade that incorporates the influence of foreign direct investment. In Section 5 we discuss data issues and present preliminary results of a pooled time series-cross section estimation of IT trade equations. Finally, in Section 6 we comment briefly on the role that micro data might play in illuminating these and related issues.
2. East Asia and the Growth of Information Technology
The information technology sector plays an increasingly important role in the world economy.2 The world share of IT exports in total exports has increased from 4 percent in 1980 to 14 percent in 1999. On average, they have grown 14 percent per year whereas world exports has grown only 6 percent per year.
Over the last two decades, East Asia (Asian NIEs, ASEAN4 and China) has developed into a dominant global manufacturing base of the IT industry. While East
2 Throughout this paper, Information Technology trade data is taken to include merchandise classified in SITC (rev. 2) 75, 76 and 776.

2
Asia’s share of world IT production was negligible in the 1970s, it reached 21 percent in 1998 at a value of 211.74 billion U.S. dollars (Ohki, 2001).
Figure 1: East-Asia’s Share of Global IT Exports
0%
5%
10%
15%
20%
25%
30%
35%
40%
1980 1985 1990 1995 1999
Years
0
50
100
150
200
250
300
350
Billions of U
S$
East-Asia share of global IT exports Total East-Asia IT Exports
Source: Statistics Canada World Trade Database
The growth in IT production is not solely the consequence of increased demand in the East Asian “miracle” markets. A study by the International Monetary Fund (IMF, 2001) shows that while IT production is increasingly concentrated in East Asia, IT expenditure is spread relatively evenly across countries (Table 1). This provides a first indication that East Asia has changed into a world production platform.

3
Aggregate trade figures strengthen the assertion that East Asia has evolved into a global supply platform. East Asia’s IT trade in the last two decades has taken off at a rate substantially higher than the rest of the world. Between 1980 and 1999 East Asia’s IT exports and imports grew by 20 and 19 percent a year, while global IT exports and imports both grew at an annualized rate of 14 percent. As a result, East Asia’s share of world IT exports has risen from 14 percent in 1980 to 36 percent in 1999 (Figure 1). East Asia as a whole is now the world’s largest exporter for IT-related goods, surpassing the United States and Japan (Table 2).3
3 East Asia’s share of exports remains higher than that of the United States even if we exclude intraregional East Asian trade, since nearly two-thirds of East Asia’s IT-related exports are interregional (Table 3).
Table 1. IT Expenditure and Production Relative to GDP Country IT Expenditure/GDP IT Production/GDP
Germany 7.9 1.1 France 8.7 1.4 United Kingdom 9.1 2.0 United States 8.1 1.9 Japan 8.3 3.0 Hong Kong 8.8 1.9 Korea 6.6 10.5 Singapore 9.7 32.8 Indonesia 2.2 2.0 Malaysia 6.8 29.1 Philippines 3.8 9.3 Thailand 3.6 7.6 PR China 5.4 - Taiwan - 9.4
Source: IT Expenditure data: World Development Indicators; IT Production from Reed Electronics Research; GDP: International Financial Indicators
Notes: IT expenditure data not available for Taiwan; IT production data not available for China.

4
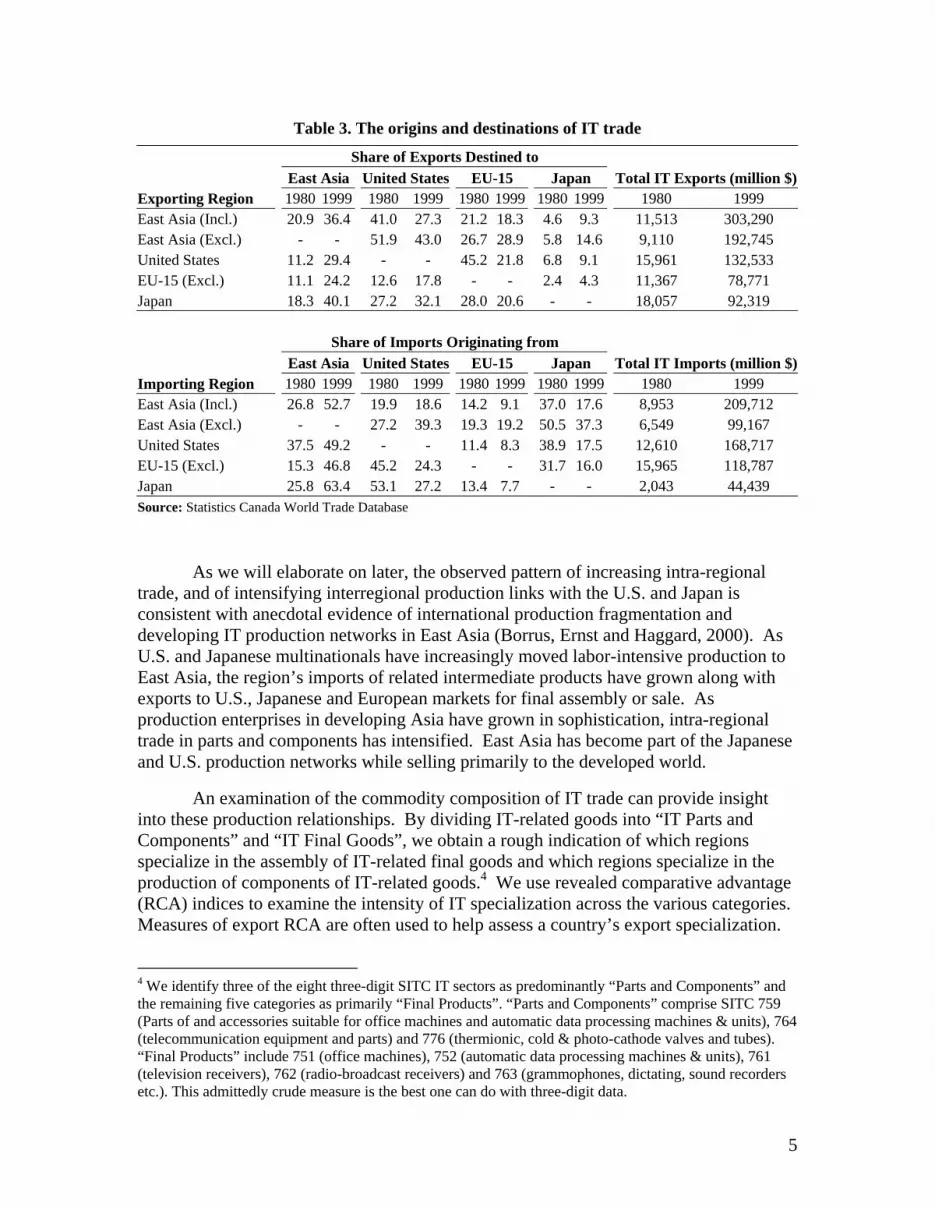
Source and destination market shares of East Asian IT trade provide further insights into the dynamics behind East Asia’s IT trade patterns (Table 3). Intraregional trade in East Asia has risen substantially over the years, reaching 36 percent of its IT exports and more than 50 percent of its IT imports in 1999. The fact that intra-East Asian trade is more important as a source of imports than a destination of exports indicates a trading pattern in which East Asian economies procure imports within the region and sell exports outside the region. Interregionally, the United States remains East Asia’s primary IT destination market. 43 percent of East Asia’s interregional IT exports are destined for the U.S., while 29 percent is destined to the European Union and 15 percent is destined to Japan. Japan plays a more important role as a source of IT imports than as a destination of IT exports. Japan’s share of East Asia’s IT imports is similar to the share of the U.S.
Table 2. Developments in Information Technology Trade IT Exports Export IT Imports Import Growth Rate ($ Mill) Share ($ Mill) Share 1980-1999
Country 1980 1999 1980 1999 1980 1999 1980 1999 Exports ImportsEast Asia (Incl.)* 11,513 303,290 14 36 8,953 209,713 11 25 20 19
East Asia (Excl.) 9,110 192,745 11 23 6,549 99,167 8 12 18 16
NIEs 10,011 196,939 12 24 6,349 124,652 8 15 18 18
Hong Kong 2,493 38,435 3 5 2,047 34,536 2 4 16 17
Korea 1,797 44,807 2 5 1,131 24,083 1 3 20 19
Singapore 2,826 62,677 3 8 1,915 39,184 2 5 19 18
Taiwan 2,895 51,020 4 6 1,256 26,849 2 3 17 19
ASEAN4 1,438 74,797 2 9 2,031 48,158 2 6 25 19
Indonesia 102 3,145 0 0 308 882 0 0 21 6 Malaysia 1,252 46,489 2 6 1,006 28,483 1 3 22 20
Philippines 71 9,356 0 1 372 8,616 0 1 31 19
Thailand 13 15,807 0 2 345 10,177 0 1 48 21 China 64 31,553 0 4 573 36,903 1 4 41 26 United States 15,961 132,533 19 16 12,610 168,717 15 20 12 15 EU 15 (Excl.) 11,367 78,771 14 9 15,965 118,787 19 14 11 12
Japan 18,057 92,319 22 11 2,043 44,439 2 5 9 19
Total Market 82,483 831,355 100 100 82,483 831,355 100 100 14 14 Source: Statistics Canada World Trade Database Notes: * Incl. means intraregional trade is included; Excl. means that intraregional trade is excluded.
5
As we will elaborate on later, the observed pattern of increasing intra-regional trade, and of intensifying interregional production links with the U.S. and Japan is consistent with anecdotal evidence of international production fragmentation and developing IT production networks in East Asia (Borrus, Ernst and Haggard, 2000). As U.S. and Japanese multinationals have increasingly moved labor-intensive production to East Asia, the region’s imports of related intermediate products have grown along with exports to U.S., Japanese and European markets for final assembly or sale. As production enterprises in developing Asia have grown in sophistication, intra-regional trade in parts and components has intensified. East Asia has become part of the Japanese and U.S. production networks while selling primarily to the developed world.
An examination of the commodity composition of IT trade can provide insight into these production relationships. By dividing IT-related goods into “IT Parts and Components” and “IT Final Goods”, we obtain a rough indication of which regions specialize in the assembly of IT-related final goods and which regions specialize in the production of components of IT-related goods.4 We use revealed comparative advantage (RCA) indices to examine the intensity of IT specialization across the various categories. Measures of export RCA are often used to help assess a country’s export specialization.
4 We identify three of the eight three-digit SITC IT sectors as predominantly “Parts and Components” and the remaining five categories as primarily “Final Products”. “Parts and Components” comprise SITC 759 (Parts of and accessories suitable for office machines and automatic data processing machines & units), 764 (telecommunication equipment and parts) and 776 (thermionic, cold & photo-cathode valves and tubes). “Final Products” include 751 (office machines), 752 (automatic data processing machines & units), 761 (television receivers), 762 (radio-broadcast receivers) and 763 (grammophones, dictating, sound recorders etc.). This admittedly crude measure is the best one can do with three-digit data.
Table 3. The origins and destinations of IT trade
Share of Exports Destined to East Asia United States EU-15 Japan Total IT Exports (million $)Exporting Region 1980 1999 1980 1999 1980 1999 1980 1999 1980 1999 East Asia (Incl.) 20.9 36.4 41.0 27.3 21.2 18.3 4.6 9.3 11,513 303,290 East Asia (Excl.) - - 51.9 43.0 26.7 28.9 5.8 14.6 9,110 192,745 United States 11.2 29.4 - - 45.2 21.8 6.8 9.1 15,961 132,533 EU-15 (Excl.) 11.1 24.2 12.6 17.8 - - 2.4 4.3 11,367 78,771 Japan 18.3 40.1 27.2 32.1 28.0 20.6 - - 18,057 92,319 Share of Imports Originating from East Asia United States EU-15 Japan Total IT Imports (million $)Importing Region 1980 1999 1980 1999 1980 1999 1980 1999 1980 1999 East Asia (Incl.) 26.8 52.7 19.9 18.6 14.2 9.1 37.0 17.6 8,953 209,712 East Asia (Excl.) - - 27.2 39.3 19.3 19.2 50.5 37.3 6,549 99,167 United States 37.5 49.2 - - 11.4 8.3 38.9 17.5 12,610 168,717 EU-15 (Excl.) 15.3 46.8 45.2 24.3 - - 31.7 16.0 15,965 118,787 Japan 25.8 63.4 53.1 27.2 13.4 7.7 - - 2,043 44,439 Source: Statistics Canada World Trade Database

6
A value that exceeds unity implies that the country has a greater than average share of IT exports in that category.5 Ng and Yeats (1999) argue that a similar import RCA index can be used as a reliable predictor of specialization in final product assembly. A country that specializes in the export of final assembly is likely to import more than proportionately parts and components in that sector. It follows that countries with above average import shares for components in a sector are relatively heavily specialized in assembly operation.
5 The RCA index is calculated as the ratio of two ratios, the ratio of exports for each subsection of IT in an economy to that economy’s total IT exports, relative to the ratio of world exports for each corresponding section to world total IT exports. The index reveals the pattern of export specialization for an economy relative to worldwide patterns. The greater a sector’s RCA, the more an economy specializes in that sector’s exports relative to world specialization patterns. While such indices by definition measure the degree of specialization of exports in product categories, the term “revealed comparative advantage” is an unfortunate misnomer. Because trade may be highly distorted by trade barriers and implicit or explicit domestic taxes and subsidies, such measures may “reveal” little about the actual comparative advantage of countries.
Table 4. East Asian RCA Indices: Exports
Product Group Total
Market Europe USA Japan East Asia
IT Parts and Components 0.9 0.8 0.9 0.9 0.9 759 - Parts of and accessories suitable for 751-752 0.4 0.3 0.2 1.1 0.9 764 - Telecommunications equipment and parts 0.7 0.6 0.7 0.9 1.0 776 - Thermionic, cold & photo-cathode valves, tubes, parts 1.2 1.3 1.2 0.9 0.9 IT Final Goods 1.1 1.1 1.1 1.1 1.2 751 - Office machines 1.2 1.3 1.1 1 1.3 752 - Automatic data processing machines & units 1.0 1.0 1.2 1.1 1.0 761 - Television receivers 0.7 0.3 0.4 1.5 1.0 762 - Radio-broadcast receivers 1.5 2.0 1.2 1.5 1.7
Source: Statistics Canada World Trade Database
Table 5. East Asian RCA Indices: Imports
Product Group Total
Market Europe USA Japan East Asia
IT Parts and Components 1.3 1.6 1.3 1.2 0.9 759 - Parts of and accessories suitable for 751-752 0.6 0.5 0.2 0.4 0.9 764 - Telecommunications equipment and parts 0.7 1.1 0.5 0.6 1.0 776 - Thermionic, cold & photo-cathode valves, tubes, parts 1.9 2.5 1.7 1.7 0.9 IT Final Goods 0.6 0.3 0.6 0.6 1.2 751 – Office machines 1.0 0.6 0.6 1.0 1.3 752 - Automatic data processing machines & units 0.4 0.2 0.6 0.4 1.0 761 - Television receivers 0.3 0.2 0.2 0.5 1.0 762 – Radio-broadcast receivers 0.3 0.1 0.1 0.2 1.7
Source: Statistics Canada World Trade Database

7
The export RCA indices presented in Table 4 suggest that East Asia’s IT sector is relatively specialized in the export of final goods and relatively less involved in the export of IT parts and components. The import RCA indices in Table 5 indicate that East Asia imports proportionately more parts and components in the IT sector than the rest of the world and proportionately fewer final goods. The indices in both tables are consistent with the idea developing East Asia specializes in the labor-intensive assembly of final IT products while the developed world—Japan, the United States and Europe—specialize in the production of components, in particular semiconductors.
3. International Production Fragmentation and the Trade-FDI Nexus In the previous section, we have presented some evidence documenting the extent
to which East Asia has gradually become a global production platform for labor-intensive IT products. International production fragmentation by American and Japanese IT firms played a major role in building up East Asia’s IT industry. In a moment that East Asia’s electronics sector was virtually non-existent, U.S. and Japanese IT firms established their first affiliates for the sole purpose of export production. As the presence of foreign affiliates in the 1980s mushroomed in the wake of the electronics sector’s increasingly competitive climate and stronger relations were built with non-affiliated host country firms, East Asia was gradually integrated into the worldwide networks of IT production (Lowe and Kenney, 1999; Borrus, Ernst and Haggard, 2000).
The theory of fragmentation (Jones and Kierzkowski 1990, 2001) and vertical FDI (Helpman 1984, 1985) helps to explain why firms in one country decide to move stages of their production process to another country. If different stages of the production process are separable and have varying factor intensities, then firms in labor-scarce developed countries have an incentive to relocate the production of their labor-intensive production blocks into low-wage countries through FDI. Firms will only do so, however, if the benefits of fragmenting their production process exceed the extra costs of coordinating activities across borders. Such coordination costs include trade and investment barriers, transportation costs, communication costs and governance costs. International Production Fragmentation
A necessary condition for fragmentation is separability of production stages. If it is technically impossible to perform two or more stages in a production process separately, then the activities must remain within a single firm at a single location. Separability was significantly enhanced in the IT sector with the arrival of the IBM Personal Computer in the early 1980s (Ernst, 2002). Before the PC, electronics companies generally built computers with a fully closed proprietary architecture. The closed system implied a high cost of coordinating interoperability between components and induced firms to produce almost all necessary components—semiconductors, hardware and operating systems—in-house and principally within one country (Dedrick and Kraemer, 1998; Chandler, 2001). The IBM PC with its modular structure

8
permanently altered the structure of production by reducing the cost of coordinating activities across stages. The key feature of the modular system was that the standards of compatibility and interoperability among components were fixed and publicly known (Langlois and Robertson, 1995). This allowed the makers of components to concentrate their capabilities at a reduced coordination cost and thus to improve their piece of the system independently from others. As a result, separability was enhanced and fragmentation was induced.
The modular structure of the PC also induced fragmentation through another channel. Once the de facto standards of interoperability and compatibility were set, barriers to entry into the industry were substantially lowered and thousands of IBM clones and component producers entered into the various niches of the computer business. The resulting competition drove down prices in almost all areas (Langlois and Robertson, 1995). In order to survive in the highly competitive environment, electronics producers were seeking to reduce production costs by moving labor-intensive production blocks to East Asian (Dedrick and Kraemer, 1998).
The change in industry structure also altered the factor intensities of production stages over time. As a consequence of the falling component prices, labor costs became a bigger share of PC production costs (Curry and Kenney, 1999). Therefore, more pressure arose to take advantage of lower-cost labor or to improve labor productivity through international fragmentation.
East Asia was initially seen as a favorable place to move labor-intensive IT production blocks for several reasons. First, the East Asian countries were known to have not only an abundant supply of low-wage labor but also a large and growing pool of high-skilled engineers. In addition, East Asia had a relatively stable political and macroeconomic environment, conducive to long-term investment projects and business relations (Yusuf, 2001). Finally, East Asia had already entered the more prosaic consumer electronics industry during the late 1960s (Lowe and Kenney, 1999).
There were a number of favorable factors that further stimulated the fragmentation process into East Asia. First, in the early 1980s, East Asian countries generally changed their policy stance from import substitution to export promotion, thus providing an improved environment for international business linkages. Barriers to trade and investment were reduced, and domestic economic activities such as insurance, banking and transportation were deregulated. These reductions in barriers to trade are particularly conducive toward international production fragmentation because, in a fragmented world, a good need to cross multiple occasions during the production process (Hummels, Rapoport and Yi, 1998).
Second, global transportation costs for distant travel and time-sensitive goods have declined in the last few decades (Hummels, 2000). The precipitous drop in air shipping prices and the increase in the quality and speed of ocean freighters have significantly reduced the cost of time-sensitive goods. This has benefited the international trade of goods produced in internationally fragmented production processes were just-in-time linkages are important. At the same time, there has been an important decline in the cost of distant relative to proximate shipping transport, thus providing an extra motivation for trade between East Asia and the United States.

9
Third, the dramatic reduction in the cost of communication enhanced the coordination, management and monitoring of activities in different locations. In the last few decades, the cost of making phone calls has reduced precipitously; computers have allowed virtually costless means of communication via e-mail and Internet; the use of fax machines has decreased the need for courier services and sped up the communication of important documents. These reductions in communication costs have made it easier for firms to coordinate and monitor production in diverse countries. The FDI-Trade Nexus
The shift in the IT sector’s organization of production through international
fragmentation has had an important impact on the trade structure between the U.S., Japan and East Asian economies. Foreign direct investment (FDI) by multinationals may have set the stage for export promotion, import substitution or greater trade in intermediate inputs. These trade implications of foreign direct investment may be observed between the host and source country or with a set of third country markets. Over the years, there has been considerable discussion in the trade literature about whether FDI and trade are complements or substitutes (Markusen and Maskus, 2001). The modern theory of FDI acknowledges that the relationship critically depends on the nature of the FDI. The literature distinguishes between horizontal and vertical FDI.
FDI designed to serve local markets is often called horizontal FDI, since it typically involves duplicating parts of the production process as additional plants are established to supply different locations. This form of FDI usually substitutes for trade, since parent firms replace exports with local production.
In contrast, FDI in search of low-cost inputs is often called vertical FDI since it involves the relocation of a part of the production process in a low-cost location. Vertical FDI is usually trade creating, since the reallocation of a production block to a host country is likely to induce an increase in imports of intermediate goods from an upstream production stage in the source country and an increase in exports to a downstream production stage in the source country.
The importance of international production fragmentation in the build-up of Developing East Asia’s IT sector through vertical FDI allows us to expect a positive relationship between FDI inflows into the IT sector and IT trade for Developing East Asian countries.6 Over the years a number of empirical studies have focused on the question whether trade and FDI are complements or substitutes in East Asia. Urata (2001) uses country-level aggregate trade and investment data and finds that inward FDI stock promotes trade. Head and Ries (2001) use firm-level data for Japanese manufacturing firms and find a net complementary effect between trade and FDI, with substitution effects occurring for firms that do not export intermediate inputs. Ramstetter (1999,
6 In a multi-country setting, the sign of the bilateral relationship between trade and vertical FDI is ambiguous. An increase in FDI from source country i into host country j, for example, can induce an increase in total IT exports from host country j, but at the same time reduce its bilateral IT exports to source country i. This will occur if the increase in IT exports directed to the rest of the world more than offsets the reduction in IT exports to the source country i.

10
2002), finally, uses plant-level data and finds that foreign plants have higher trade propensities than local plants in Indonesian, Thai and Singapore manufacturing. In conclusion, there is fairly compelling evidence that inward FDI promotes trade expansion in East Asia’s vertically related industries. 4. Empirical trade equations for IT exports
Following the standard imperfect substitutes trade model, the quantity of exports demanded can be expressed as a function of income in the destination market, own product price, and prices of competing products.7
( ), , , ,i j j j i j j k kx f Y e PX P e= P e (1)
where xi,j is the quantity of exports from country i to country j, Yj is income in country j nominal foreign currency, PXi is the export price, Pj is the price in country j, Pk is a vector of prices of other competing exporters and ej and ek are exchange rates appropriate for expressing foreign currency values in units of home currency.
If we assume that demand is homogenous in prices and that foreign consumers choose between country i goods and a composite of all other countries’ goods, we can write (1) as a function of real foreign income and two “real exchange rates” capturing the relative prices of home to foreign goods and third country to foreign goods.
( ), , ,i j jj j
PX e POP Pi j j jx f y e= (2)
Following popular practice, we estimate this trade model in log-linear form.8
Available bilateral trade data are reported in current dollar values for all countries, and there do not exist reliable time series of prices with which to deflate information technology exports. Because of this, we have chosen to specify the model in nominal dollar terms,9
, , , , , , ,ln $ ln $ ln lni j i j i j j i j i j i j i jX Y RPX RPOα β γ δ= + + + (3)
7 This specification derives from the workhorse Armington (1969) model, which views domestic and imported varieties as imperfectly substitutable in consumption. The notation here loosely follows Goldstein and Khan (1985). Because we are modeling demand for a specific sub-group of commodities, ideally we would like to include prices of all goods entering the foreign consumption basket. As a practical matter, we do not have reliable time series of prices for IT products, and so restrict our attention to aggregate price deflators, specifically consumer (or overall export) prices. 8 The choice of the log linear form also imposes extremely strong restrictions on the demand function, by requiring constant elasticities. See Marquez (1994) for a critique of the assumption of constant elasticities. 9 Branson (1968) as cited in Goldstein and Khan (1985). But note that the interpretation of price elasticities for exports are different with this specification, since a rise in domestic export prices will raise the value of a given export volume one-for-one. So, at least for a price change originating in the exporting country, value elasticity = volume elasticity + 1.

11
The “own” relative price is calculated as the relative price between source and destination countries, expressed in common-currency. Following Bayoumi (1999), the relative “other” price RPO, is constructed as the IT import-weighted relative price of other exporters to the destination market, expressed in common currency. See the Data Appendix for details.
As discussed above, there is good reason to think that East Asian exports of IT products will be influenced by the extent of inward foreign direct investment they have received. A model that neglects this determinant of export flows may produce biased estimates of the underlying parameters. We allow for such influences rather casually by appending a term measuring the dollar stock of inward FDI in the destination market. Note that because of data limitations, this measure is overall inward FDI without regard to industry or source country.
, , , , , , , ,ln $ ln $ ln ln lni j i j i j j i j i j i j i j i j jX Y RPX RPO FDIINα β γ δ ω= + + + + (4)
The addition of this FDI term may serve an additional useful purpose by proxying for omitted supply factors. We comment further on this issue below.
We would like to estimate a time series model of this export demand behavior. However, the available time series of bilateral IT trade are very limited—the longest series in the Statistics Canada database run from 1980 to 1999, and price and foreign investment series are also limited. This makes it extremely difficult to estimate model parameters with any precision, or to identify model dynamics. Bayoumi (1997 and 1999) addresses this problem by estimating a panel regression of bilateral trade equations. If model parameters are homogenous across bilateral country pairs, this approach significantly increases the number of data points and precision with which parameters may be estimated.
Many, if not all, of the time series variables in (4) are likely to be non-stationary, so that estimating the panel in levels may not be appropriate. The solution adopted here is to estimate the following model in difference form:10
, , , , , ,
, , , , ,
ln $ ( ) ln $ ( ) ln
( ) ln ( ) lni j t i j j t i j t
i j t j t i j t
d X L d Y L d RPX
L d RPO L d FDIIN
α β γ
δ ω µ
= + +
+ + + (5)
where Z(L) is a polynomial in the lag operator, L, representing a distributed lag sufficiently long to capture important model dynamics. Notice that we have retained the (possibly differing) constant terms in this difference regression to reflect possible difference in deterministic trend rates of growth of exports across bilateral traded flows.
Implicit in the independent estimation of trade equations such as (5) is the notion that demand can be estimated separately from supply influences. If supply elasticities are infinite—as is often assumed in applied trade analysis, then this does not present a
10 While this solves the econometric problem posed by non-stationarity, it discards information about potential long-run relationships in levels. A forthcoming revision of this paper will report estimates of the levels regression based on a panel fully modified least squares estimator due to Pedroni (1996).

12
problem. If, however, supply responses are finite, independent estimation of (5) may introduce simultaneity bias. The addition of supply influences, such as the FDI stock, may help to identify demand parameters,11 although FDI itself poses additional endogeneity concerns.12 Instrumental variables approaches may be used to address these biases econometrically.
5. Data and Preliminary Results
We model bilateral trade in information technology products among seven East Asian developing countries—Korea, Malaysia, Indonesia, Thailand, Singapore, the Philippines, and Taiwan—and the U.S., Japan, and the European Union. Data for Hong Kong and China were also collected but the absence of appropriate price deflators and, in the case of China a very short sample period, precludes their inclusion in this analysis.13 Bilateral export values in current dollars are taken from the Statistics Canada World Trade Database. (See Appendix 1 for details.) We define information technology trade as the sum of eight three-digit SITC rev. 2 categories (see footnote 2).
For the destination-market activity variable, we use nominal dollar gross domestic product series from the International Monetary Fund International Financial Statistics online database. Arguably it would be better to specify IT export demands as a function of an IT-specific market demand measure. While such series can be constructed for the leading developed economies, to our knowledge this data does not exist for most developing economies. Nominal exchange rates are from International Financial Statistics. Consumer prices are from The World Bank’s World Development Indicators Database, 2001. The construction of trade-weighted average relative competitor prices from exchange rates and CPIs is explained in Appendix 1.
For the European Union, we use an aggregate dollar GDP series from OECD. We construct EU-15 consumer price and exchange rate indices by weighting country series by total trade (aggregate imports plus exports).
FDI inflow stock data are from the UNCTAD Handbook of Statistics On-Line.
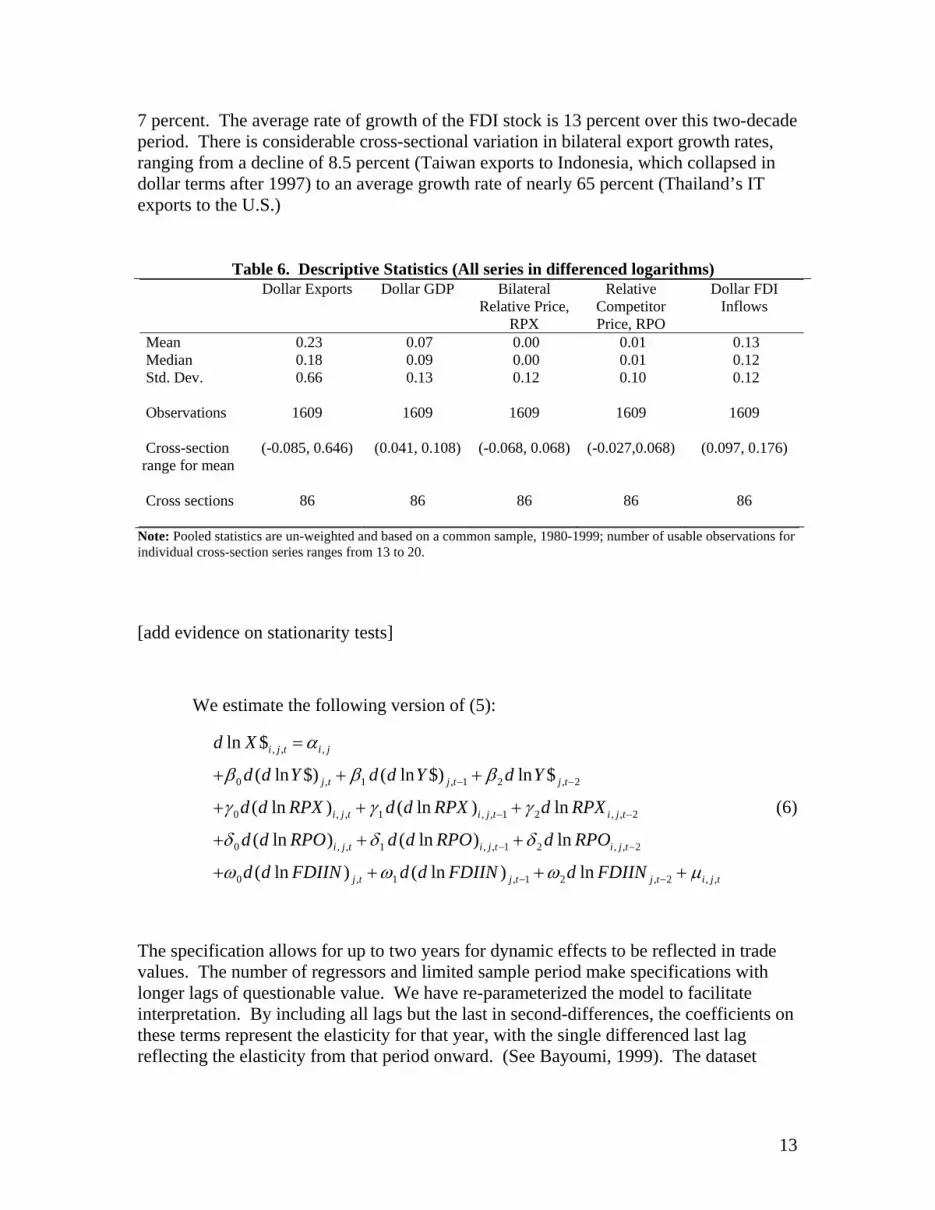
Descriptive statistics for the pooled series are given in Table 6. Note that the cross-sectional average rate of growth of IT exports is very high—23 percent for the complete pool—and considerably higher than the rate of growth of nominal dollar output,
11 Helkie and Hooper (1988) include the capital stock. Bayoumi (1999) includes export-country real GDP as a proxy for supply. 12 There are good theoretical reasons to expect trade levels to influence FDI. Investments may be made in response to anticipated trade opportunities, or trade may initially open a market for a firm, which may later have an incentive to move production into the market once scale economies are realized. OECD (1998) finds significant evidence that trade-FDI causation runs in both directions. In addition, common actors, such as per capita income levels, appear to explain both trade and FDI in cross-sectional analyses (Eaton and Tamura, 1994) 13 For our primary regressions, we have omitted four bilateral flows because of very short samples: Indonesian exports to Korea, the Philippines, and Taiwan, and Philippines exports to Indonesia. We have also interpolated the missing 1989 values for trade between the Philippines and Taiwan.
13
7 percent. The average rate of growth of the FDI stock is 13 percent over this two-decade period. There is considerable cross-sectional variation in bilateral export growth rates, ranging from a decline of 8.5 percent (Taiwan exports to Indonesia, which collapsed in dollar terms after 1997) to an average growth rate of nearly 65 percent (Thailand’s IT exports to the U.S.)
Note: Pooled statistics are un-weighted and based on a common sample, 1980-1999; number of usable observations for individual cross-section series ranges from 13 to 20.
[add evidence on stationarity tests]
We estimate the following version of (5):
, , ,
0 , 1 , 1 2 , 2
0 , , 1 , , 1 2 , , 2
0 , , 1 , , 1 2 , , 2
0 , 1 , 1
ln $
( ln $) ( ln $) ln $
( ln ) ( ln ) ln
( ln ) ( ln ) ln
( ln ) ( ln )
i j t i j
j t j t j t
i j t i j t i j t
i j t i j t i j t
j t j t
d X
d d Y d d Y d Y
d d RPX d d RPX d RPX
d d RPO d d RPO d RPO
d d FDIIN d d FDIIN
α
β β β
γ γ γ
δ δ δ
ω ω ω
− −
− −
− −
−
=
+ + +
+ + +
+ + +
+ + + 2 , 2 , ,ln j t i j td FDIIN µ− +
(6)
The specification allows for up to two years for dynamic effects to be reflected in trade values. The number of regressors and limited sample period make specifications with longer lags of questionable value. We have re-parameterized the model to facilitate interpretation. By including all lags but the last in second-differences, the coefficients on these terms represent the elasticity for that year, with the single differenced last lag reflecting the elasticity from that period onward. (See Bayoumi, 1999). The dataset
Table 6. Descriptive Statistics (All series in differenced logarithms) Dollar Exports Dollar GDP Bilateral
Relative Price, RPX
Relative Competitor Price, RPO
Dollar FDI Inflows
Mean 0.23 0.07 0.00 0.01 0.13 Median 0.18 0.09 0.00 0.01 0.12 Std. Dev. 0.66 0.13 0.12 0.10 0.12
Observations 1609 1609 1609 1609 1609 Cross-section range for mean
(-0.085, 0.646) (0.041, 0.108) (-0.068, 0.068) (-0.027,0.068) (0.097, 0.176)
Cross sections 86 86 86 86 86

14
underlying (6) is an unbalanced panel, with the number of usable observations ranges from 13 to 19 across bilateral pairs.
The estimation results are given in Table 7. Unsurprisingly, the overall fit of the pooled regression is rather poor, with an adjusted R2 of 8 percent and unadjusted R2 of just 9 percent.14 While this may be due in part to an inappropriate specification, it may also reflect the use of inadequate proxies for activity and relative price effects. An IT-specific measure of activity would presumably have higher explanatory power for export flows, and weighted average consumer prices are an admittedly poor proxy for relative IT prices. Given the difficulty measuring technology prices, we would prefer to use relative unit labor costs in this analysis, but these data are simply not available for most of the targeted countries.15
The first column of Table 7 reports the pooled regression parameters. Despite the poor fit, coefficient signs are generally in concert with our expectations. The coefficients on destination market GDP are large in the short run, peaking at 2.2 in the second year before falling back below 1 in the “long run”. The bilateral relative export price has the expected negative sign, and a value that approached 1 in the long-run. In fact, because we have specified the equations in nominal terms, this “value elasticity” implies a larger “volume elasticity” (See footnote 10). Relative competitor prices also have substantial short-run effects on bilateral export flows, with a one percent increase in competitors’ prices raising exports by 1.4 percent after one year.
The model confirms a role for FDI inflows in stimulating exports. Changes in the inward FDI stock have significant and persistent effects on exports. Finally note that the common intercept term is significantly positive, and suggests a deterministic trend rate of growth of IT exports of more than 10 percent per year.
We cannot reject the null hypothesis that all coefficients are equal across the panel. In fact, it is not possible to perform this specification test with the two-lag model of equation (6) because some unrestricted bilateral equations do not have enough data points. Instead, we have conducted the tests using a model with contemporaneous and one lag of each right hand side variable. The F statistic of the hypothesis of common coefficients against the fully unrestricted alternative model is F(850, 669) = 0.90 which is of course not significant. A test for common intercepts against the fully unrestricted alternative is F(85, 1453) = 0.56 which is also not significant.
A similar result was found by Bayoumi (1999) in his modeling of aggregate bilateral trade among 21 industrial countries. However, the extremely short time dimension of our panel leaves few degrees of freedom when estimating the unrestricted alternative model, so we view these results tentatively, and we report a fixed effects model with cross-section specific trend growth rates for comparison. This model, given in the second set of Table 7 columns, yields very similar results, although own price effects become insignificantly different from zero. Other effects are nearly the same as in the fully-pooled regression.
14 [Add evidence on the size of within-sample residuals.] 15 A version using relative export prices is under construction.

15
The regressions discussed so far include exports by all 11 countries to all 10 partner countries. However, it seems likely that because of differences in commodity composition and differing roles of FDI inflows, the behavior of exports may differ significantly between developed and developing countries. In the final set of columns in Table 7, we report a pooled regression that includes exports from only the 8 East Asian developing economies to the 11 destination markets. The results are not markedly different from the regressions that include all 11 countries. Because of the higher average rate of export growth for these economies, both activity coefficients and the common intercept are larger, although the latter is no longer significantly different from zero.
Table 7. Pooled Regression Results
Dependent Variable: Bilateral IT Exports All Exporters Non-JA Asian All Exporters Fixed Effects Exporters Only Coefficient Prob. Coefficient Prob. Coefficient Prob. Intercept 0.104 0.021 --- --- 0.121 0.073 Importer's GDP Lag 0 1.177 0.000 1.195 0.000 1.356 0.000
1 2.213 0.000 2.269 0.000 2.956 0.000 2 0.771 0.016 0.736 0.047 1.070 0.028 Relative Export Price Lag 0 -0.317 0.083 -0.072 0.706 -0.417 0.111 1 -0.801 0.003 -0.275 0.353 -0.890 0.038 2 -0.940 0.006 -0.223 0.556 -0.494 0.361 Relative Competitor Price Lag 0 0.596 0.038 0.428 0.157 0.765 0.079 1 1.432 0.000 1.083 0.007 2.146 0.000 2 0.278 0.542 -0.248 0.631 0.245 0.736 Exporters' FDI Inflows Lag 0 0.288 0.050 0.260 0.083 0.326 0.141 1 0.492 0.018 0.352 0.104 0.622 0.037 2 0.821 0.001 0.624 0.016 0.886 0.006 R-squared 0.086 0.134 0.086 Adjusted R-squared 0.079 0.072 0.075 Sample(adjusted): 1983-1999 1983-1999 1983-1999 Included observations, after adjusting endpoints 17 17 17 Number of cross-sections used: 86 86 59 Total panel (unbalanced) observations: 1447 1447 988 Note: Estimation by ordinary least squares. All variables enter as differenced logarithms.

16
As a comparison, we have run a comparable pooled regression for total manufacturing imports among these 11 countries. This model (see Appendix 2) has a much better overall fit to the data, but yields much the same qualitative results: small but significant price effects and a significant impact of FDI inflows. Of course to the extent that IT exports represent significant shares of overall manufactured exports for many of the developing Asian economies, these similar results may not be surprising. Consistent with the slower growth of non-IT exports, activity elasticities for the manufactured exports regression are closer to one, and there is no significant deterministic trend detected.
6. Summary and Extensions
This paper uses semi-aggregate data to explore the determinants of East Asia’s trade in IT products. In the first part of the paper, we have provided descriptive evidence that international fragmentation of production processes has played an important role in shaping East Asia’s IT trade patterns. In the second half, we have attempted to capture the impact of such fragmentation on the trade patterns by including aggregate FDI inflows as an explanatory variable in IT trade equations. The results support a positive role for FDI, demonstrating the importance of incorporating data on foreign investment patterns in successful empirical modeling of trade flows in the IT sector.
The IT regressions we have reported here are limited to modeling overall IT trade. Since demand for intermediate goods likely depends on different factors than the demand for final goods, separate modeling of components and final goods exports may be instructive. In addition, because of data limitations, we have looked only at overall measures of FDI inflows, without regard to the source country of those inflows. While there are difficulties with bilateral FDI data (see below), some data do exit for U.S. and Japanese source countries. We intend to look at both of these issues in continuing work.
However, there are clearly limits to the usefulness of aggregative analysis alone in studying the IT interrelationships among countries. There are several specific areas where access to appropriate firm- or industry-level data would permit important extensions to our research.
One area of difficulty in the current analysis is in determining the end use for goods in specific bilateral IT flows. In our analysis, we have used 3-digit SITC codes to make a fairly crude division of IT-related goods into “IT Parts and Components” and “IT Final Goods” Ideally, firm- and industry-level data on the sourcing of inputs and the commodity composition of outputs would provide a more accurate division between trade in IT parts and components and IT final goods. This would permit a more detailed analysis of the extent of production networks and allow for a firmer basis for empirical modeling of trade flows.
A second area of difficulty lies in obtaining appropriately detailed FDI data that reflects the nature of international fragmentation. Ideally, we would rely on bilateral FDI data disaggregated to the industry level. Unfortunately, there does not exist a multi-

17
country panel data set on multinational activity at that level of disaggregation (Ramstetter, 2000). Clearly there is a need for development of an internationally consistent set of FDI indicators to support the study of international production fragmentation.
A third area of difficulty is data on relative prices in the IT sector. It is particularly difficult to construct price series for IT exports and imports because of the rapid technological change in semiconductor and computer manufacturing. Because IT-related goods keep improving, the prices charged over time are, in a sense, for different products. Appropriate micro-level data could permit creation of hedonic price indices such as the computer price series created by the U.S. Bureau of Labor Statistics.
Outside the present context, there are a number of aspects of the international fragmentation phenomenon that may be informed by analyses using micro data. One set of issues involves the dynamics of trade in response to fragmentation. As mentioned above, one can expect that international fragmentation initially leads to trade expansion between the source and the host country as the reallocation of a production block to a host country is likely to induce an increase in imports of intermediate goods from an upstream production stage in the source country and an increase in exports to a downstream production stage in the source country. Over time, however, the complementary relationship between trade and vertical FDI might diminish and even turn negative if domestic or third-country components start to be used instead of source country components. Firm or industry level data on the composition and patterns of imports and exports would help understand the persistence of trade relationships that emerge between home countries, host countries and third countries in production networks.
A more fundamental problem is evaluating the determinants of production fragmentation itself, i.e. the production and investment decisions made by existing firms and new entrants. For this, we would need detailed industry data on factor costs and content, trade and investment barriers and incentives, transportation costs, industry structure characteristics, and other factors. Finally, firm-level information on employment, trade and sourcing practices of firms would inform the larger questions of welfare impacts the fragmentation process on home and host countries.
18
References
Armington, Paul S. (1969), “A Theory of Demand for Products Distinguished by Place of Production,” IMF Staff Papers 26, 159-178.
Bayoumi, Tamim (1997), “Japanese Foreign Direct Investment and Regional Trade,” IMF Working Paper WP/97/103.
Bayoumi, Tamim (1999), “Estimating Trade Equations from Aggregate Bilateral Data,” IMF Working Paper WP/99/74.
Borrus, Michael, Dieter Ernst and Stephen Haggard (2000), eds., International Production Networks in Asia: Rivalry or Riches?, London, Routledge.
Branson (1968), “A Disaggregated Model of the U.S. Balance of Trade,” Staff Economic Studies No. 44, Board of Governors of the Federal Reserve System, February, as cited in Goldstein and Kahn (1995).
Curry, James and Martin Kenney (1999), “Beating the Clock: Corporate Responses to Rapid Change in the PC Industry”, California Management Review 42:1, pp. 8-36.
Chandler, Alfred (2001), Inventing the Electronic Century: the Epic Story of the Consumer Electronics and Computer Industries, New York, The Free Press.
Dedrick, Jason and Kenneth Kraemer (1998), Asia’s Computer Challenge: Threat or Opportunity for the United States & the World?, Oxford, Oxford University Press.
Eaton, Jonathan. & Akiko Tamura (1994), “ Bilateralism and Regionalism in Japanese and US Trade and Direct Foreign Investment Patterns”, NBER Working Paper No. 4758.
Ernst, Dieter (2002), “Digital Information Systems and Global Flagship Networks: How Mobile is Knowledge in the Global Network Economy”, East-West Center Working Paper, Honolulu.
Feenstra, Robert, Robert Lipsey, and Harry Bowen (1997), “World Trade Flows, 1970-1992, with Production and Tariff Data,” NBER Working Paper 5910.
Goldstein, Morris and Mohsin Khan (1985), “Income and Price Elasticities in Foreign Trade”, Chapter 20 in Ronald Jones and Peter Kenen, eds., Handbook of International Economics, Vol. 2, Amsterdam, Elsevier, pp. 1041-1105.
Head, Keith and John Ries (2001), “Overseas Investment and Firm Exports”, Review of International Economics 9, pp. 108-122.
Helkie, William and Peter Hooper (1988), “An Empirical Analysis of the External Deficit”, Chapter 2 in Ralph Bryant, Gerald. Holtham and Peter Hooper, eds., External Deficits and the Dollar: the Pit and Pendulum, Washington D.C., Brookings Institution.
Helpman, Elhanan (1984), “A Simple Theory of International Trade with Multinational Corporations”, Journal of Political Economy 92, pp. 451-471.
Helpman, Elhanan (1985), “Multinational Corporations and Trade Structure”, Review of
Economic Studies 52, pp. 443-457.

19
Hummels, David (2000), “Have International Transportation Costs Declined?”, Working Paper.
Hummels, David, Dana Rapaport and Kei-Mu Yi (1998), “Vertical Specialization and the Changing Nature of World Trade”, FRBNY Economic Policy Review, pp. 79-99.
International Monetary Fund (2001), “The IT Revolution”, Chapter 3 of World Economic Outlook: October 200, Washington DC, International Monetary Fund, pp. 105-144.
Jones, Ronald and Henryk Kierzkowski (1990), “The Role of Services in Production and International Trade: A Theoretical Framework”, in Ronald Jones and Anne Krueger, eds., The Political Economy of International Trade, Oxford, Basil Blackwell.
Jones, Ronald and Henryk Kierzkowski (2001), “A Framework for Fragmentation”, Chapter 2 in Sven Arndt and Henryk Kierzkowski, eds., Fragmentation: New Production Patterns in the World Economy, Oxford, Oxford University Press, pp. 17-34.
Langlois, Richard and Paul Robertson, Firms, Markets, and Economic Change: A Dynamic Theory of Business Institutions . London: Routledge, 1995.
Lowe, Nichola & Martin Kenney (1999), “Foreign Investment and the Global Geography of
Production: Why the Mexican Consumer Electronics Industry Failed”, World Development 27:8, pp. 1427-1443.
Markusen, James & Keith Maskus (2001), “General Equilibrium Approaches to the Multinational Firm”, NBER Working Paper 8334.
Marquez, Jaime (1994), “The Econometrics of Elasticities or the Elasticities of Econometrics: An Empirical Analysis of the Behavior of U.S. Imports,” The Review of Economics and Statistics 76:3, pp. 471-481.
Ng, Francis & Alexander Yeats (2001), “Production Sharing in East Asia: Who Does What for Whom and Why?” in Cheng & Henryk Kierzkowski, eds, Global Production and Trade in East Asia, Boston, Kluwer Academic Publishers.
Ohki, Hiromi (2001), “International Division of Labor in East Asia’s IT Industry” in Mitsuhiro Kagami & Masatsugu Kagami, eds., The IT Revolution and Developing Countries: Late-Comer Advantage?, JETRO.
Pedroni, Peter (1996) "Fully Modified OLS for Heterogeneous Cointegrated Panels and the Case of Purchasing Power Parity," Indiana University Working Papers in Economics, No. 96-020.
Reed Electronics Research (2001), Yearbook of World Electronics Data 2001, Sutton, Reed Business Information.
Ramstetter, Eric (1999), “Trade Propensities and Foreign Ownership Shares in Indonesian Manufacturing in the Early 1990s”, Bulletin of Indonesian Economic Studies 35:2, pp. 43-66.
Ramstetter, Eric (2000), “Recent Trends in Foreign Direct Investment in Asia: The Aftermath of the Crisis to Late 1999”, ICSEAD Working Paper Series Vol. 2000-02.
Ramstetter, Eric (2002), “Trade Propensities and Foreign Ownership Shares in Thai Manufacturing, 1996”, ICSEAD Working Paper Series Vol. 2002-03.

20
Urata, Shujiro (2001), “Emergence of an FDI-Trade Nexus and Economic Growth in East Asia”, Chapter 11 in Joseph Stiglitz and Shahid Yusuf, eds., Rethinking the East Asian Miracle, Oxford, Oxford University Press, pp. 409-459.
World Information Technology Services Alliance (WITSA) (2001), Digital Planet.
Yeats, Alexander (2001), “Just How Big is Global Production Sharing?” in Sven Arndt & Henryk Kierzkowski, eds., Fragmentation: New Production Patterns in the World Economy, Oxford, Oxford University Press.
Yusuf, Shahid (2001), “The East Asian Miracle at the Milennium”, Chapter 1 in Joseph Stiglitz and Shahid Yusuf, eds., Rethinking the East Asian Miracle, Oxford, Oxford University Press, pp. 1-53.

21
Appendix 1. Data
Trade data are taken from Statistics Canada World Trade Database, which provide bilateral trade flows for all countries and commodities, reported (where available) at the 4-digit SITC (Revision 2) level. Additional details on this data can be found in Feenstra, Lipsey and Bowen (1997). Trade data are reported on a dollar CIF basis??. We define Information Technology (IT) trade as encompassing
SITC 75 Office Machines & Automatic Data Processing Equipment 76 Telecommunications & Sound Recording Apparatus 776 Thermionic, Cold & Photo-Cathode Valves, Tubes, Parts
The countries included in East Asia are the four NIEs (Hong Kong, Korea, Singapore and Taiwan), ASEAN4 (Indonesia, Malaysia, Philippines and Thailand) and China. The developed economies included the U.S., Japan, and EU-15. In the estimation, we do not include Hong Kong and China.
Data on GDP were taken from IMF’s International Financial Statistics (http://imf.largo.apdi.net). EU-15 GDP numbers are estimated by OECD (http://www.oecd.org/EN/document/0,,EN-document-20-nodirectorate-no-1-30531-20,00.html).
CPI data were taken from World Bank, World Development Indicators 2001. For the EU-15, we constructed a European Union weighted average CPI, using national CPI indices weighted by total merchandise trade (exports plus imports) from the Statistics Canada dataset. Exchange rates for this purpose were taken from International Financial Statistics, as described below. We extended the national currency exchange rate series up to 1999 for this purpose.
Nominal exchange rates were taken from IMF, International Financial Statistics (see link above), using the period average rate.
FDI inflow stock data were taken from UNCTAD Handbook of Statistics On-Line (http://stats.unctad.org/fdi/eng/ReportFolders/Rfview/Explorerp.asp?CS_referer=).
Following Bayoumi (1999), the relative price of competitors products in each destination market (RPO) were calculated as the import-weighted average of common-currency relative prices:
, , ,, ,
N Ni k
j k i k i ki j i ji US k US
P PRPO X Xe e≠ ≠
⎛ ⎞= ⎜ ⎟⎜ ⎟⎝ ⎠∑ ∑
The exporters own relative price in the destination market is given by:
,, ,
j kj k
j US k US
P PRPXe e
=
here Pi are prices in local currency, ei,k are local currency per dollar exchange rates, and Xi,k are dollar bilateral exports from country i to country k.

22
Appendix 2. Manufacturing Imports Regression Dependent Variable: Bilateral Manufactured Exports Ordinary Least Squares All Exporters Coefficient Prob. Intercept -0.001 0.970 Importer's GDP Lag 0 1.066 0.000 1 1.381 0.000 2 1.067 0.000 Relative Export Price Lag 0 -0.044 0.482 1 -0.172 0.064 2 -0.430 0.000 Relative Competitor Price Lag 0 0.517 0.000 1 0.603 0.000 2 0.565 0.000 Exporters' FDI Inflows Lag 0 0.197 0.000 1 0.313 0.000 2 0.489 0.000 R-squared 0.257 Adjusted R-squared 0.250 Sample(adjusted): 1983-1999 Included observations, after adjusting endpoints 17 Number of cross-sections used: 86 Total panel (unbalanced) observations: 1462


