Embed Size (px)
Citation preview
HAL Id: hal-03073766https://hal.archives-ouvertes.fr/hal-03073766
Submitted on 4 Jan 2021
HAL is a multi-disciplinary open accessarchive for the deposit and dissemination of sci-entific research documents, whether they are pub-lished or not. The documents may come fromteaching and research institutions in France orabroad, or from public or private research centers.
L’archive ouverte pluridisciplinaire HAL, estdestinée au dépôt et à la diffusion de documentsscientifiques de niveau recherche, publiés ou non,émanant des établissements d’enseignement et derecherche français ou étrangers, des laboratoirespublics ou privés.
Infrared Signature Prediction for Low Observable AirVehicles
Eric Coiro, Sidonie Lefebvre, Romain Ceolato
To cite this version:Eric Coiro, Sidonie Lefebvre, Romain Ceolato. Infrared Signature Prediction for Low ObservableAir Vehicles. AVT-324 Specialists’ Meeting on Multi-disciplinary design approaches and perfor-mance assessment of future combat aircraft, NATO, Sep 2020, Online, Canada. pp.MP-AVT-324-08,�10.14339/STO-MP-AVT-324-08�. �hal-03073766�
STO-MP-AVT-324 8 - 1
Infrared Signature Prediction for Low Observable Air Vehicles
Eric Coiro Onera, The French Aerospace Lab
Optics Department FRANCE
Sidonie Lefebvre Onera, The French Aerospace Lab
Optics Department FRANCE
Romain Ceolato Onera, The French Aerospace Lab
Optics Department FRANCE
Keywords: Future Combat Aircraft, Signature Prediction, Infrared, Multi-fidelity Model
ABSTRACT Infrared Stealth is an important aspect in the design and performance assessment of the future combat aircraft. In this paper, we propose a statistical approach based on an aircraft signature code to assess the impact of different technology choices. As simulations can be computationally demanding, we set-up and validate a multifidelity surrogate model, close to the real one but faster to compute, in order to estimate sensitivity indices and to perform dispersion analysis. The value of our approach is illustrated for a typical air-to-ground scenario based on the UCAV Muldicon test case defined in the AVT-281 group. The first part of this paper describes the models used to compute the infrared signature of the Muldicon as part of the in-house code CRIRA for the skin, air intake, nozzles and plumes, in the surrounding environment. The statistical approach is then discussed through different steps: building a surrogate model and identifying influential inputs. The statistical analysis is performed for a stabilized flight (fixed altitude, Mach and engine thrust). We finally obtain dispersion of the infrared signature, with a hierarchy from the most to the less influent parameter, for different observer locations.
1. INTRODUCTION
There is an increasing need of infrared signatures of aerospace vehicles for defence applications. Various models have been developed for this purpose by aircraft or sensor manufacturers and state research laboratories as well, in order to predict the infrared signature of an aircraft in the specific fields investigated. Simulation tools are valuable to predict infrared signature and explore technical choices for new platforms. Infrared Stealth is an important aspect in the design and performance assessment of the future combat aircraft and it is therefore mandatory to employ simulation tools that are well adapted to the specificities of the new generation of low observable aircraft. The infrared signature of an aircraft is highly scenario dependant, and varies depending on
Infrared Signature Prediction for Low Observable Air Vehicles
8 - 2 STO-MP-AVT-324
the observer location, the spectral band, the date, the atmospheric conditions… For the former generation of aircraft, the signature is generally overwhelmed by one or more of the following contributors: the hot surfaces of the airframe such as the aircraft's rear parts, the nozzle and the air intakes and the exhaust hot gases (plume). Low observable aircraft present specific characteristics to lower their intrinsic signature (Mahulikar, Sonawane and Rao, 2007). The major contributors to the infrared signature of a low observable platform tend to be the skin emission, comprising self-emission and reflections of the environment, and the residual emission of masked hot parts located inside the body, indirectly seen after multiple bounces of light inside ducts (Rutten and Karl, 2014), whereas plumes emission is lower. As a result, the signature prediction tools have to focus on complex reflections from hot parts and the background (Lindermeir, 2012).
In this context, it becomes much more difficult to clearly identify the impact of technical choices on the infrared signature, as several contributors may be involved. Tens of input data are typically to be considered, and each data or a combination of them could have an impact on the resulting signature. This assessment led us to develop a statistical approach based on infrared signature calculations that may be applied to a design process for a new platform but also to specify a sensor for a given situation, in order to identify the most influential data on the infrared signature (Maire and Lefebvre, 2015).
Some previous works in the open literature focused on the impact of emissivity and reflectivity on the infrared signature of aircraft. Emissivity optimization has been studied by Mahulikar, Rao and Kolhe (2006) for low flying aircraft against a surface to air threat, whereas Wei and Honghu (2017) investigated the effect of emissivity and BRDF (Bi-directional Reflectance Function) on infrared signature of typical turbofan engine exhaust system, in the MWIR band. Yong and Xue (2016) showed that choosing carefully an optimal directional emissivity can enhance or reduce the infrared signature for typical fighters in specific aspect angles. Aircraft signature is strongly dependent of the environment. The effects of sunshine, skyshine and earthshine have been studied for the detection of a typical fighter (Mahulikar, K.P. and Rao, 2009), and Huang & Ji (2016) investigated the impact of the background on the infrared signature of a fighter at high altitude. Few authors address modern platforms. Wu et al. (2020) has published a recent study on skin coating design of stealth aircraft but the paper lacks of details on the statistical approach.
We propose in this work to introduce variability in the skin optical properties of an UCAV and evaluate the relevant infrared signature for several platform headings, times of the day, clear or cloudy sky, and different observer locations, in the SWIR, MWIR and LWIR bands.
The first main section of this document deals with the CRIRA aircraft signature code used in this study to produce results as inputs to the statistical analysis (Coiro et al., 2012). Uncertainties are introduced in some input data of the Muldicon test case defined in the AVT-281 group. Other input data are fixed in this study : aircraft altitude, speed, engine thrust, and as a consequence, the plume flowfield, aircraft skin temperature, and flight conditions do not vary and are identical to the Muldicon test case. This section describes input data in CRIRA and the models used to compute the outdoor environment, the infrared signature of the skin, the hot parts (nozzles and air intake) and the two 3D plumes of the UCAV.
The second main section is dedicated to the statistical approach used in a design process. The latter requires introducing variability in the model, in order to assess the impact of different technology choices for a set of scenarii. This section describes a statistical approach based on the infrared signature code results, which makes it possible to obtain the dispersion of the infrared signature of an aircraft illustrated for a typical air-to-ground scenario.
Infrared Signature Prediction for Low Observable Air Vehicles
STO-MP-AVT-324 8 - 3
2. SIGNATURE MODELING
2.1 Introduction The CRIRA code has been developed for many years at Onera (The French Aerospace lab) to compute the infrared signature of different kinds of aircraft: fighters (Mirage III, Mirage 2000, F16, Alpha jet), commercial aircraft (B737), and more recently low observable platforms (UCAV). The main application field of this tool is to assess future detection concepts but it may also be valuable for the design process of new platforms. After a brief overview of the CRIRA code, this chapter describes more specifically data and models used to perform the signature calculation of the Muldicon. This generic UCAV model was developed by the NATO STO AVT-251 Task Group (Multi-Disciplinary Design and Performance Assessment of Effective, Agile NATO Air Vehicles - Summary Report of the NATO STO AVT-251 Task Group), it includes an intake and an exhaust ducts both with S-shapes. A single flight point test case was selected by the NATO STO AVT-281 Task Group in order to benchmark infrared signature modelling tools. A technical note (AVT-281 Muldicon Test Case, 2018) describes the test case on which the variability study is built.
2.2 CRIRA code overview The main contributors to the aircraft infrared signature are taken into account: • the airframe, composed of the fuselage, the wings, empennage, heated by aerodynamic flow field, • the inlet, a cavity composed of a duct and the first stage of the engine low pressure compressor, • the internal and external parts of the nozzle, heated by the combustion gases, • the exhaust plume.
The engine is modeled to initialize the plume calculation and to determine the temperature at the entrance of the compressor stage and in the nozzle. The air vehicle is surrounded by the natural environment composed of the atmosphere, clouds, the sun and the ground. The radiance emitted by each of these components is calculated either with MODTRAN (Berk, 1998) or MATISSE (Labarre et al., 2016) codes, and stored in a spherical environmental map. The radiance of the environment is partly reflected by the airframe, depending on the surface optical properties, and added to the self-emission of the platform linked to the emissivity and the skin temperature. The background located behind the aircraft is seen through the plume, and is used to obtain the signature in contrast if desired. The IR signature is calculated at the air vehicle location, and through the atmosphere at the observer location (Figure 1).
Infrared Signature Prediction for Low Observable Air Vehicles
8 - 4 STO-MP-AVT-324
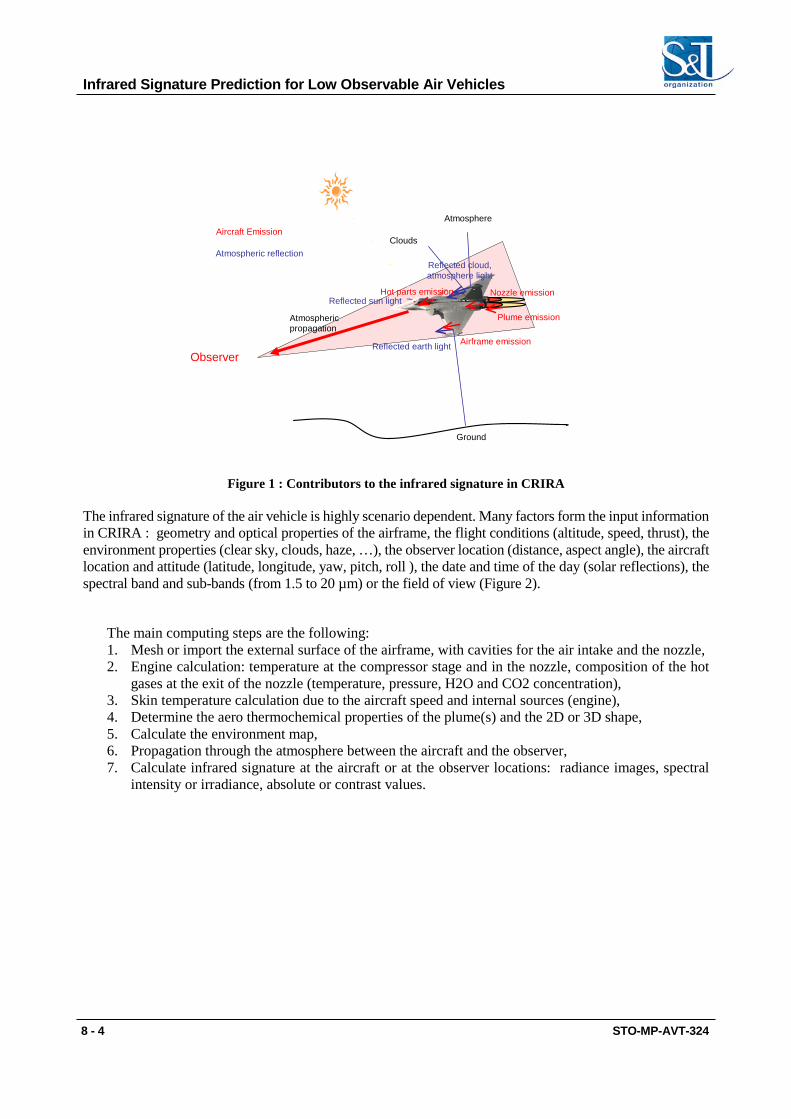
Figure 1 : Contributors to the infrared signature in CRIRA The infrared signature of the air vehicle is highly scenario dependent. Many factors form the input information in CRIRA : geometry and optical properties of the airframe, the flight conditions (altitude, speed, thrust), the environment properties (clear sky, clouds, haze, …), the observer location (distance, aspect angle), the aircraft location and attitude (latitude, longitude, yaw, pitch, roll ), the date and time of the day (solar reflections), the spectral band and sub-bands (from 1.5 to 20 µm) or the field of view (Figure 2).
The main computing steps are the following: 1. Mesh or import the external surface of the airframe, with cavities for the air intake and the nozzle, 2. Engine calculation: temperature at the compressor stage and in the nozzle, composition of the hot
gases at the exit of the nozzle (temperature, pressure, H2O and CO2 concentration), 3. Skin temperature calculation due to the aircraft speed and internal sources (engine), 4. Determine the aero thermochemical properties of the plume(s) and the 2D or 3D shape, 5. Calculate the environment map, 6. Propagation through the atmosphere between the aircraft and the observer, 7. Calculate infrared signature at the aircraft or at the observer locations: radiance images, spectral
intensity or irradiance, absolute or contrast values.
Atmospheric propagation
Observer Reflected earth light
Reflected sun light
Reflected cloud, atmosphere light
Ground
Clouds
Atmosphere
Plume emission
Airframe emission
Nozzle emission Hot parts emission
Aircraft Emission
Atmospheric reflection
Infrared Signature Prediction for Low Observable Air Vehicles
STO-MP-AVT-324 8 - 5
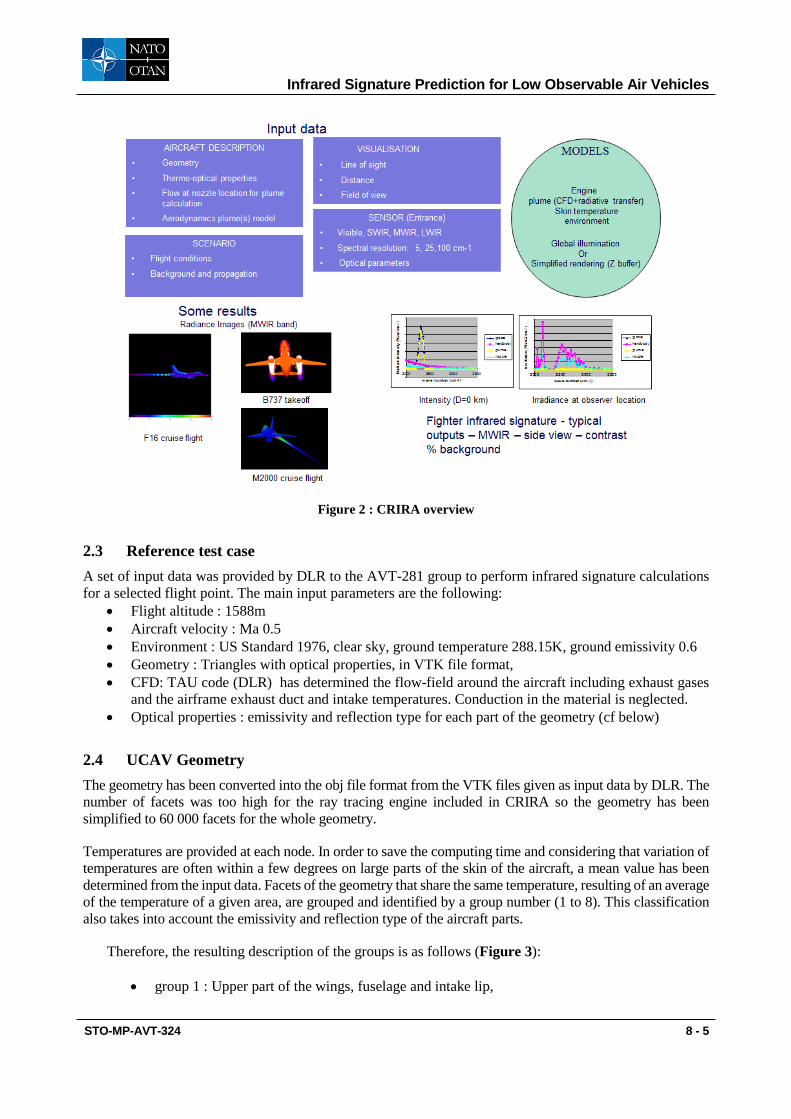
Figure 2 : CRIRA overview
2.3 Reference test case A set of input data was provided by DLR to the AVT-281 group to perform infrared signature calculations for a selected flight point. The main input parameters are the following:
• Flight altitude : 1588m • Aircraft velocity : Ma 0.5 • Environment : US Standard 1976, clear sky, ground temperature 288.15K, ground emissivity 0.6 • Geometry : Triangles with optical properties, in VTK file format, • CFD: TAU code (DLR) has determined the flow-field around the aircraft including exhaust gases
and the airframe exhaust duct and intake temperatures. Conduction in the material is neglected. • Optical properties : emissivity and reflection type for each part of the geometry (cf below)
2.4 UCAV Geometry The geometry has been converted into the obj file format from the VTK files given as input data by DLR. The number of facets was too high for the ray tracing engine included in CRIRA so the geometry has been simplified to 60 000 facets for the whole geometry.
Temperatures are provided at each node. In order to save the computing time and considering that variation of temperatures are often within a few degrees on large parts of the skin of the aircraft, a mean value has been determined from the input data. Facets of the geometry that share the same temperature, resulting of an average of the temperature of a given area, are grouped and identified by a group number (1 to 8). This classification also takes into account the emissivity and reflection type of the aircraft parts.
Therefore, the resulting description of the groups is as follows (Figure 3):
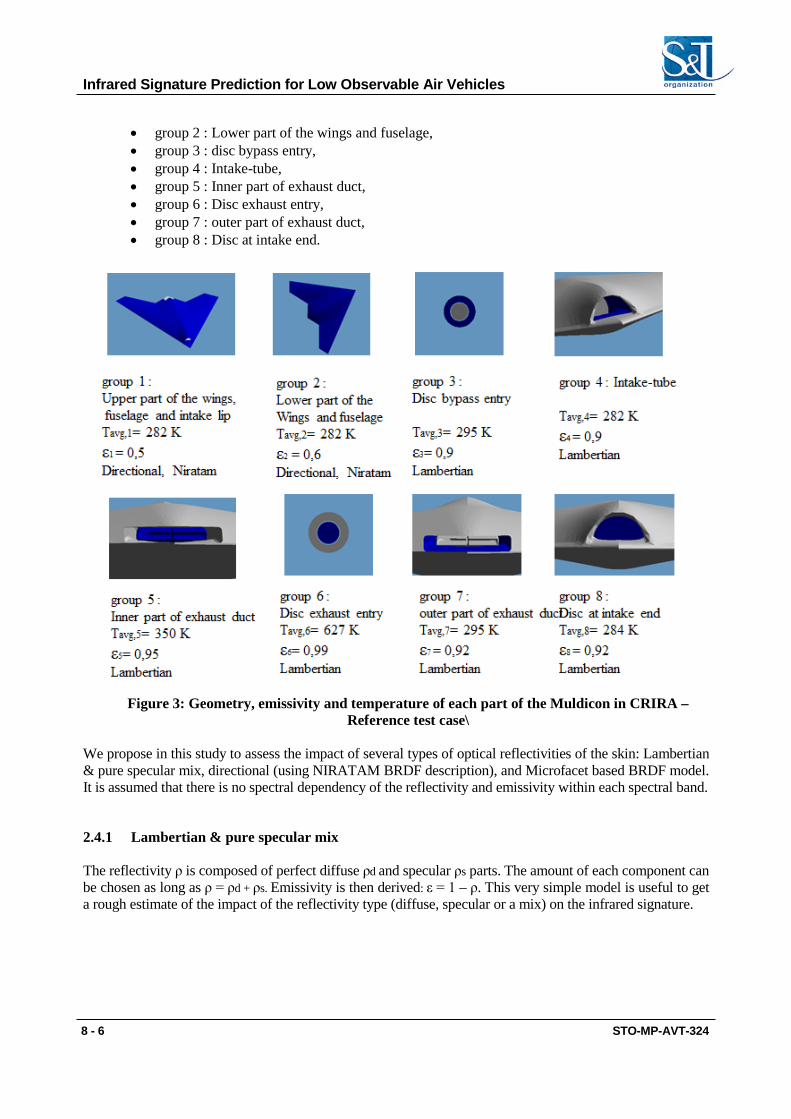
• group 1 : Upper part of the wings, fuselage and intake lip,
Infrared Signature Prediction for Low Observable Air Vehicles
8 - 6 STO-MP-AVT-324
• group 2 : Lower part of the wings and fuselage, • group 3 : disc bypass entry, • group 4 : Intake-tube, • group 5 : Inner part of exhaust duct, • group 6 : Disc exhaust entry, • group 7 : outer part of exhaust duct, • group 8 : Disc at intake end.
Figure 3: Geometry, emissivity and temperature of each part of the Muldicon in CRIRA –
Reference test case\
We propose in this study to assess the impact of several types of optical reflectivities of the skin: Lambertian & pure specular mix, directional (using NIRATAM BRDF description), and Microfacet based BRDF model. It is assumed that there is no spectral dependency of the reflectivity and emissivity within each spectral band.
2.4.1 Lambertian & pure specular mix The reflectivity ρ is composed of perfect diffuse ρd and specular ρs parts. The amount of each component can be chosen as long as ρ = ρd + ρs. Emissivity is then derived: ε = 1 – ρ. This very simple model is useful to get a rough estimate of the impact of the reflectivity type (diffuse, specular or a mix) on the infrared signature.
Infrared Signature Prediction for Low Observable Air Vehicles
STO-MP-AVT-324 8 - 7
2.4.2 Directional: NIRATAM model The refection type is described using NIRATAM formulation. The BRDF depends only on the emissivity ε and the angle θ between the surface normal and the out-going direction in which the radiation is reflected (Eqn. 1).
[ ]5)cos1()1(1),( θεεπ
θε −+−=BRDF (1)
2.4.3 Microfacet based BRDF model
Microfacet theory has proven very successful for modelling the bi-directional reflectance of rough isotropic and anisotropic surfaces. A five-term wave-optic model (Riviere, Ceolato and Hespel, 2012) based on the microfacet theory was developed and implemented in CRIRA. It provides an improved physical insight by accounting additional scattering phenomena such as first-surface, subsurface scattering, and absorption. On the one hand, the surface scattering is composed of two parts: (i) a surface directional (or mirror-like) part due to surface reflection, which is related to Fresnel coefficients and to the surface roughness; (ii) a surface diffuse (or self-shadowing) part due to multiple scattering by the microfacets. On the other hand, subsurface or volume scattering is also composed of two parts: (i) a subsurface directional part; (ii) a subsurface diffuse part resulting from multiple scattering inside the material. Both surface and subsurface scattering phenomena result from single and multiple scattering.
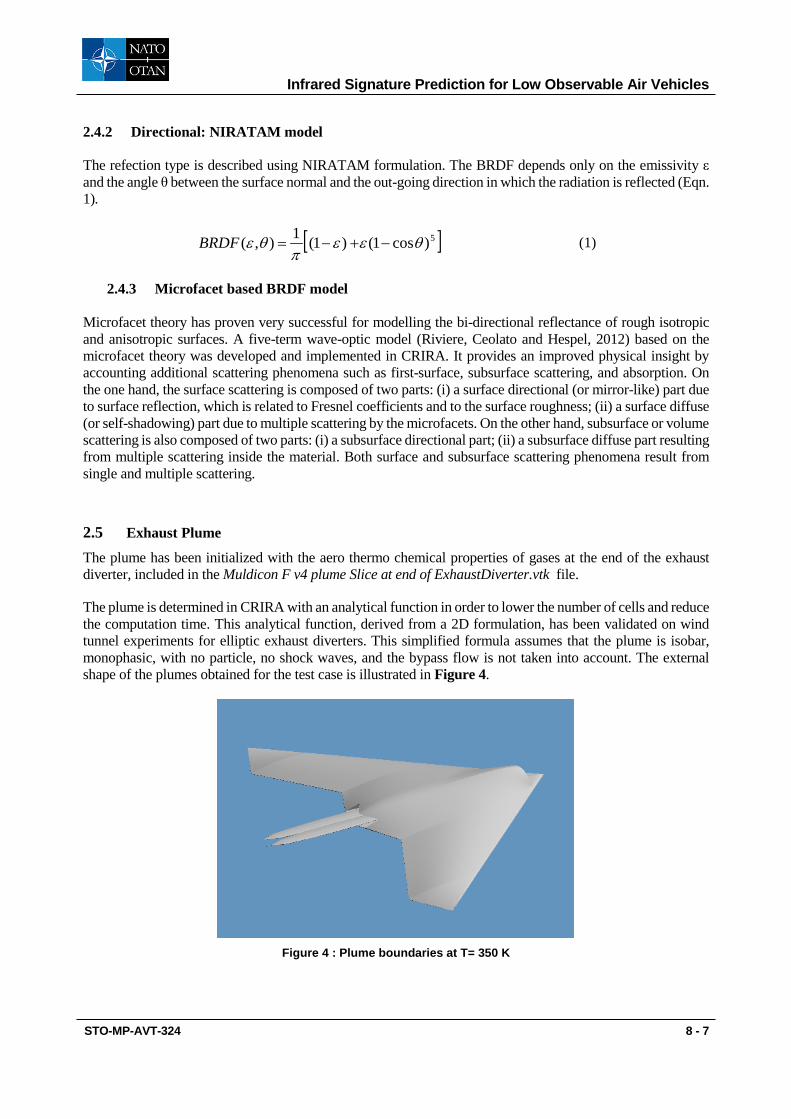
2.5 Exhaust Plume The plume has been initialized with the aero thermo chemical properties of gases at the end of the exhaust diverter, included in the Muldicon F v4 plume Slice at end of ExhaustDiverter.vtk file.
The plume is determined in CRIRA with an analytical function in order to lower the number of cells and reduce the computation time. This analytical function, derived from a 2D formulation, has been validated on wind tunnel experiments for elliptic exhaust diverters. This simplified formula assumes that the plume is isobar, monophasic, with no particle, no shock waves, and the bypass flow is not taken into account. The external shape of the plumes obtained for the test case is illustrated in Figure 4.
Figure 4 : Plume boundaries at T= 350 K
Infrared Signature Prediction for Low Observable Air Vehicles
8 - 8 STO-MP-AVT-324
2.6 Plume Emissions & Attenuation A statistical band model performs the radiance calculation of the plumes; the data-base is self-generated according to Perez et al. (2007). Data was recalculated from HITEMP 2010 for H2O, CO2 and CO; HITRAN 2008 was used to update HCl parameters. The spectral resolution is 5 cm-1, the temperature ranges from 150 to 2950 K. This formulation uses a curve of growth according to Malkmus, and inhomogeneous gases are treated according Curtis-Godson method. It accounts Lorentz and Doppler broadening. We assume that there are no soot particles, as we may be expecting in modern engines.
2.7 Background and atmospheric propagation
MATISSE 3.0 has been used to perform the calculations of the backgrounds and the propagation from the UCAV to the observer, with US standard profile, at the resolution of 5cm-1.
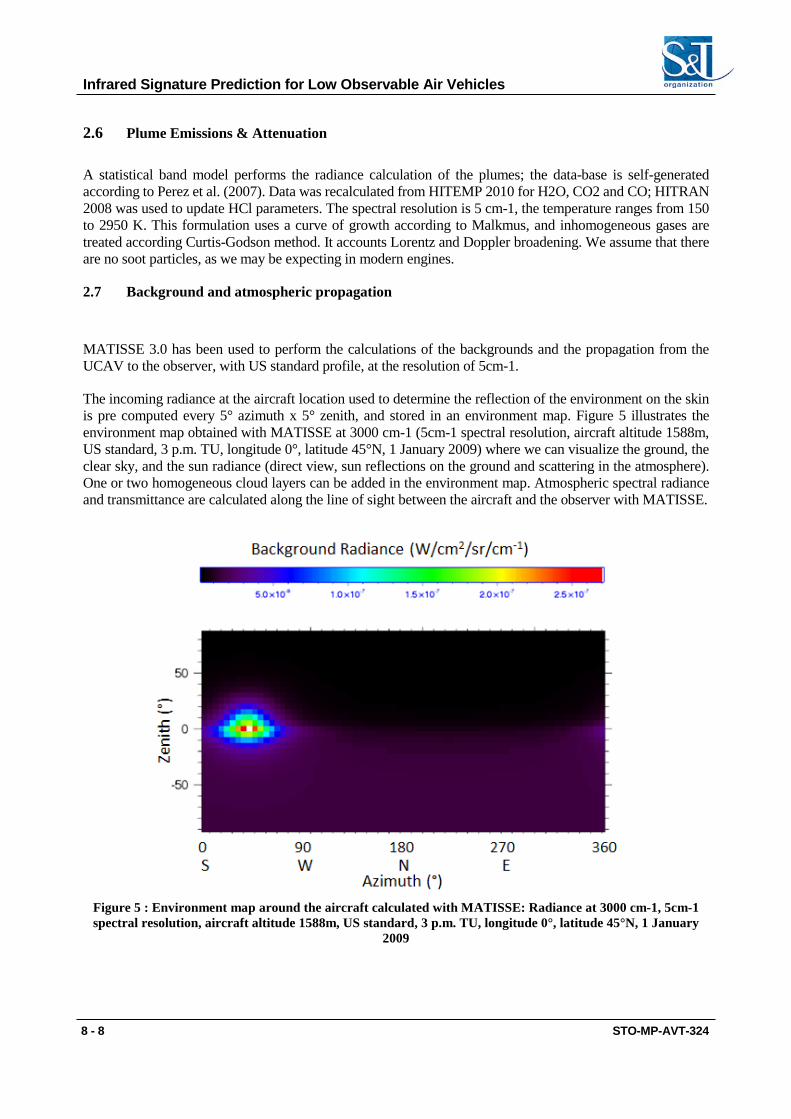
The incoming radiance at the aircraft location used to determine the reflection of the environment on the skin is pre computed every 5° azimuth x 5° zenith, and stored in an environment map. Figure 5 illustrates the environment map obtained with MATISSE at 3000 cm-1 (5cm-1 spectral resolution, aircraft altitude 1588m, US standard, 3 p.m. TU, longitude 0°, latitude 45°N, 1 January 2009) where we can visualize the ground, the clear sky, and the sun radiance (direct view, sun reflections on the ground and scattering in the atmosphere). One or two homogeneous cloud layers can be added in the environment map. Atmospheric spectral radiance and transmittance are calculated along the line of sight between the aircraft and the observer with MATISSE.
Figure 5 : Environment map around the aircraft calculated with MATISSE: Radiance at 3000 cm-1, 5cm-1 spectral resolution, aircraft altitude 1588m, US standard, 3 p.m. TU, longitude 0°, latitude 45°N, 1 January
2009
Infrared Signature Prediction for Low Observable Air Vehicles
STO-MP-AVT-324 8 - 9
2.8 Infrared signature calculation It is mandatory to model precisely light reflections inside ducts and also on the airframe for low observable aircraft. A global illumination method is used to perform the infrared calculation of the UCAV. The path tracing technique is employed in CRIRA, in association with image preprocessing, space partitioning, and direct solar identification to speed up the rendering (Coiro, 2013). The first optimization selects the effective pixels that require ray tracing (airframe and plume), the background being treated differently. The second acceleration technique reduces the intersecting cost with the use of a non uniform spatial subdivision method (octree). The last one is a strategy employed to accelerate the ray tracing with sampling techniques for the Monte Carlo integration.
Light reflections on the skin are taken into account by the Monte Carlo Ray Tracer in casting rays in random directions, according to a probability density function fitted on the BRDF. The final step consists in the images generation in the appropriate resolution, in particular bands or sub-bands. Then, the radiance integration is performed spectrally or spatially in order to produce the infrared signature of the aircraft.
2.9 Input data for the sensibility analysis
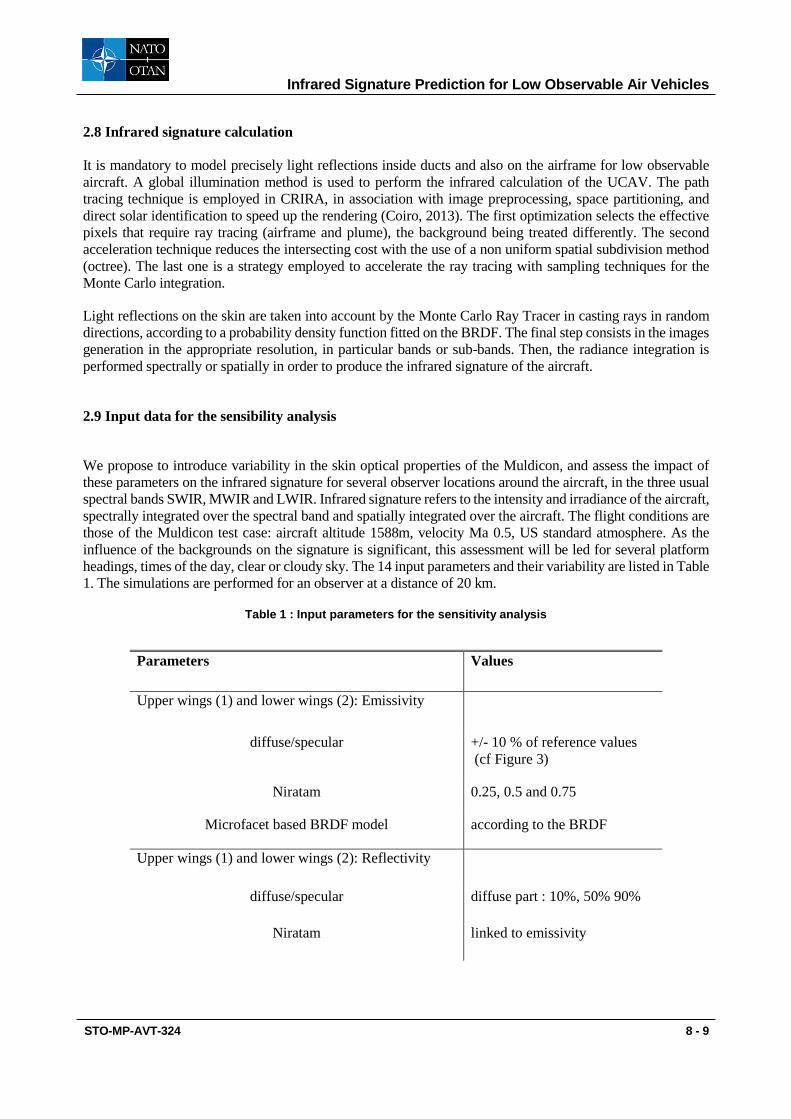
We propose to introduce variability in the skin optical properties of the Muldicon, and assess the impact of these parameters on the infrared signature for several observer locations around the aircraft, in the three usual spectral bands SWIR, MWIR and LWIR. Infrared signature refers to the intensity and irradiance of the aircraft, spectrally integrated over the spectral band and spatially integrated over the aircraft. The flight conditions are those of the Muldicon test case: aircraft altitude 1588m, velocity Ma 0.5, US standard atmosphere. As the influence of the backgrounds on the signature is significant, this assessment will be led for several platform headings, times of the day, clear or cloudy sky. The 14 input parameters and their variability are listed in Table 1. The simulations are performed for an observer at a distance of 20 km.
Table 1 : Input parameters for the sensitivity analysis
Parameters Values
Upper wings (1) and lower wings (2): Emissivity
diffuse/specular +/- 10 % of reference values (cf Figure 3)
Niratam 0.25, 0.5 and 0.75
Microfacet based BRDF model according to the BRDF
Upper wings (1) and lower wings (2): Reflectivity
diffuse/specular diffuse part : 10%, 50% 90%
Niratam linked to emissivity
Infrared Signature Prediction for Low Observable Air Vehicles
8 - 10 STO-MP-AVT-324
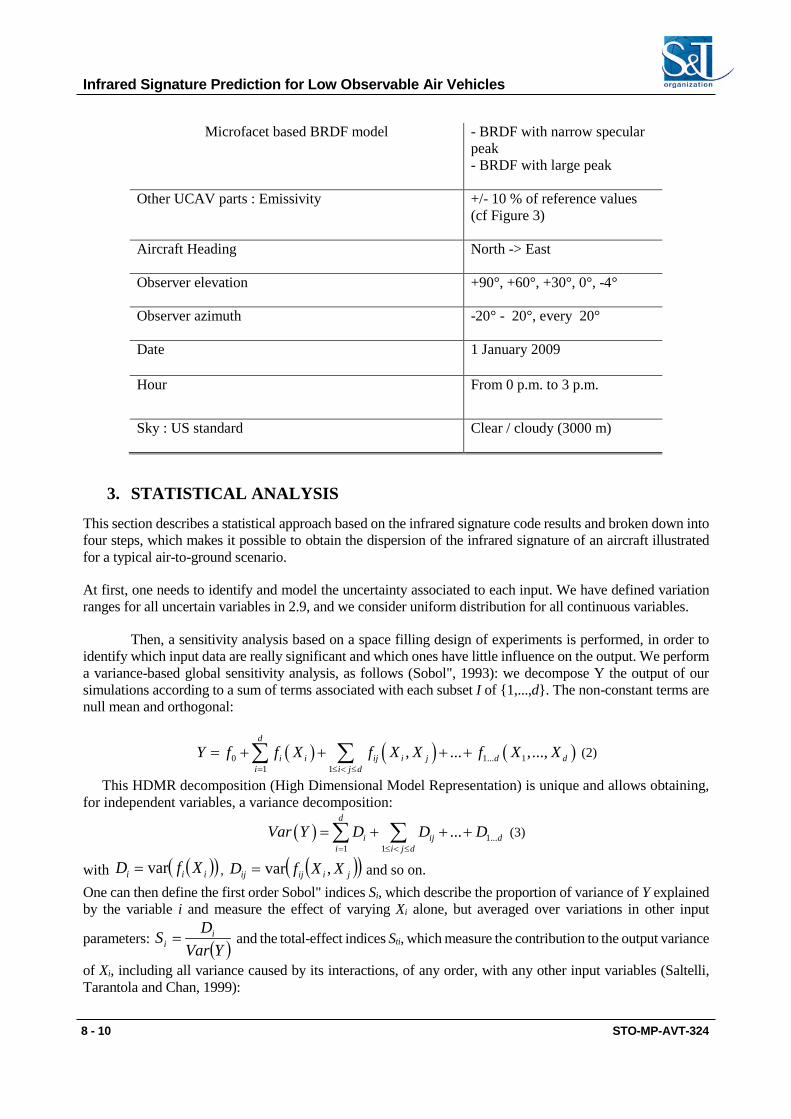
Microfacet based BRDF model - BRDF with narrow specular peak - BRDF with large peak
Other UCAV parts : Emissivity +/- 10 % of reference values (cf Figure 3)
Aircraft Heading North -> East
Observer elevation +90°, +60°, +30°, 0°, -4°
Observer azimuth -20° - 20°, every 20°
Date 1 January 2009
Hour From 0 p.m. to 3 p.m.
Sky : US standard Clear / cloudy (3000 m)
3. STATISTICAL ANALYSIS
This section describes a statistical approach based on the infrared signature code results and broken down into four steps, which makes it possible to obtain the dispersion of the infrared signature of an aircraft illustrated for a typical air-to-ground scenario.
At first, one needs to identify and model the uncertainty associated to each input. We have defined variation ranges for all uncertain variables in 2.9, and we consider uniform distribution for all continuous variables.
Then, a sensitivity analysis based on a space filling design of experiments is performed, in order to identify which input data are really significant and which ones have little influence on the output. We perform a variance-based global sensitivity analysis, as follows (Sobol", 1993): we decompose Y the output of our simulations according to a sum of terms associated with each subset I of {1,...,d}. The non-constant terms are null mean and orthogonal:
(2)
This HDMR decomposition (High Dimensional Model Representation) is unique and allows obtaining, for independent variables, a variance decomposition:
(3)
with , and so on. One can then define the first order Sobol" indices Si, which describe the proportion of variance of Y explained by the variable i and measure the effect of varying Xi alone, but averaged over variations in other input
parameters: ( )YVarDS i
i = and the total-effect indices Sti, which measure the contribution to the output variance
of Xi, including all variance caused by its interactions, of any order, with any other input variables (Saltelli, Tarantola and Chan, 1999):
( ) ( ) ( )0 1... 11 1
, ... ,...,d
i i ij i j d di i j d
Y f f X f X X f X X= ≤ < ≤
= + + + +∑ ∑
( ) 1...1 1
...d
i ij di i j d
Var Y D D D= ≤ < ≤
= + + +∑ ∑( )( )iii XfD var= ( )( )jiijij XXfD ,var=
Infrared Signature Prediction for Low Observable Air Vehicles
STO-MP-AVT-324 8 - 11
(4)
where D-i is the proportion of variance explained by all factors except Xi..
As one simulation can be computationally demanding, we set-up and validate a multifidelity surrogate model of the infrared signature simulation, close to the real one, but faster to compute in order to estimate the sensitivity indices and to perform Quasi Monte Carlo dispersion analysis. This surrogate model is built on simulations of two levels of fidelity. The high-fidelity simulations provide the most accurate results but, because of their high cost, the associated database is small. On the other hand, the low-fidelity simulations are computationally cheap, so the associated database can be richer. The multifidelity approach makes it possible to obtain a high-fidelity surrogate model as the sum of a low-fidelity-trained surrogate model and the surrogate model of the difference (error) between high and low-fidelity simulations. Here we consider two image resolutions in number of pixels, one low for the low-fidelity simulations and one larger, to perform some high-fidelity simulations.
In this study, we will use Latin Hypercube (McKay, Beckman and Conover, 1979) space filling designs of n points in dimension d to learn our surrogate model. A Latin Hypercube plane is designed so that each column from 1 to d is a permutation of the set of integers from 1 to n. An interesting property is that the projection on a subspace of dimension r ≤ d of a Latin Hypercube keeps a Latin Hypercube structure, which ensures the non-redundancy of the information. Random Latin Hypercubes have very disparate space-filling properties. Here we use a Latin Hypercube optimized by a stochastic optimization algorithm, "Enhanced Stochastic Evolutionary Algorithm" (Jin, Chen and Sudjianto, 2005), according to a discrepancy criterion.
The Quasi Monte Carlo survey of the code output dispersion can then be performed by taking into account only influential inputs. The Quasi-Monte Carlo method makes use of a slightly different kind of sampling than the Monte Carlo one, as described in (Tuffin, 1997): the pseudo-random numbers are replaced with uniformly distributed determinist sequences, the low discrepancy sequences, to improve the accuracy of approximations for a fixed number N of simulation runs. The discrepancy DN* is a measure of the uniformity of the points
dispersion. A low discrepancy sequence is characterized by a
NNO
n)log( discrepancy, where n is the
problem's dimension, that is to say the number of significant variables in this paper. Here, we make use of Sobol sequences (Sobol', 1967).
4. RESULTS
We have built a space filling design for all the 14 uncertain variables but the diffuse part and the clouds presence, and considered all combinations of the 3 and 2 values of these two variables. We thus obtained: 720 low fidelity simulations, with a 175 x 175 pixels resolution, for the diffuse/specular case and extracted 200 runs to launch high fidelity simulations, with a 750 x 750 pixels resolution, but only 240 high fidelity simulations for the Niratam and the microfacet based BRDF model. We have estimated spectrally integrated detector irradiance in SWIR (1.5-2.5 µm), MWIR (3-5 µm) and LWIR (8-12 µm) with CRIRA.
As a first step, we have tried different metamodels to predict low fidelity infrared signatures (IRS): linear regression, kriging and multilayer perceptron (MLP). All the models are learned on the neperian logarithm of the IRS, and the results obtained with scikit learn for metamodels fitting and OpenTURNS (Baudain, 2015) for sensitivity analysis. Best results have been obtained with 500 learning data for the diffuse/specular simple model, MLP with 11 hidden neurons in MWIR and LWIR and 9 in SWIR, hyperbolic tangent activation function and a 0.01 L2 regularization penalty for the diffuse/specular simple model . The R2 on the 220 test
{ } ( )1,...,1 i
ti II di I
DS SVar Y
−
⊂∈
= = −∑
Infrared Signature Prediction for Low Observable Air Vehicles
8 - 12 STO-MP-AVT-324
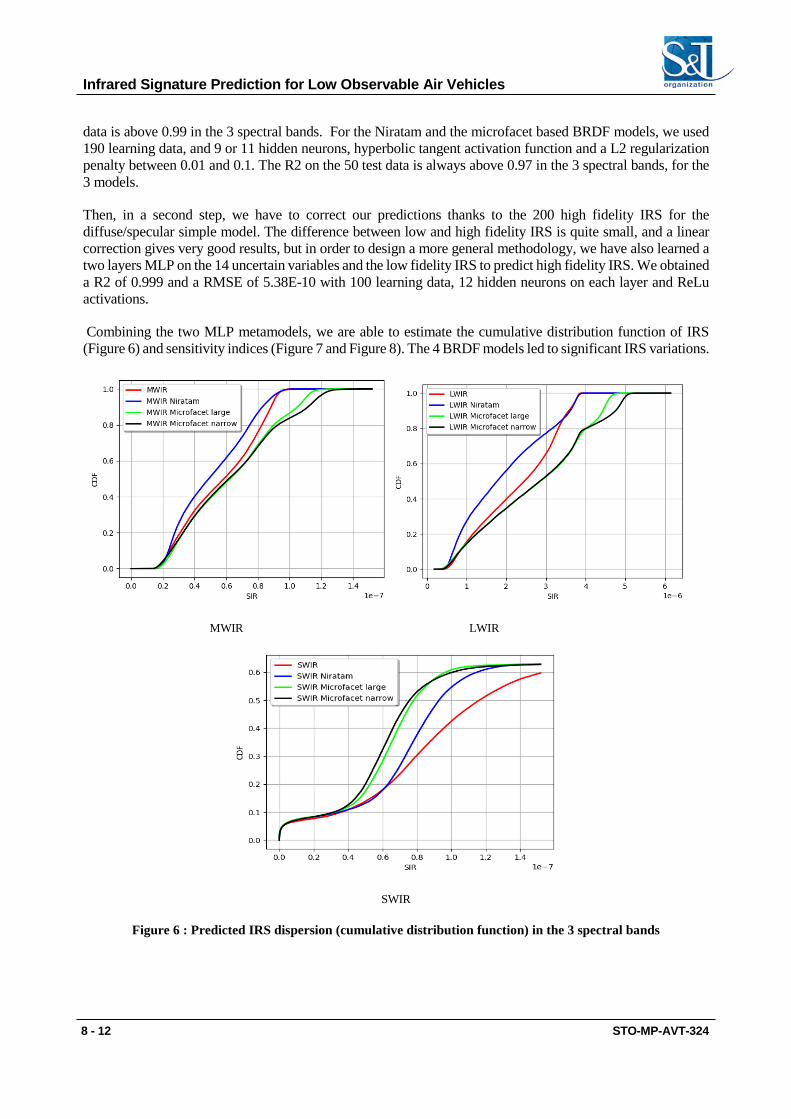
data is above 0.99 in the 3 spectral bands. For the Niratam and the microfacet based BRDF models, we used 190 learning data, and 9 or 11 hidden neurons, hyperbolic tangent activation function and a L2 regularization penalty between 0.01 and 0.1. The R2 on the 50 test data is always above 0.97 in the 3 spectral bands, for the 3 models.
Then, in a second step, we have to correct our predictions thanks to the 200 high fidelity IRS for the diffuse/specular simple model. The difference between low and high fidelity IRS is quite small, and a linear correction gives very good results, but in order to design a more general methodology, we have also learned a two layers MLP on the 14 uncertain variables and the low fidelity IRS to predict high fidelity IRS. We obtained a R2 of 0.999 and a RMSE of 5.38E-10 with 100 learning data, 12 hidden neurons on each layer and ReLu activations.
Combining the two MLP metamodels, we are able to estimate the cumulative distribution function of IRS (Figure 6) and sensitivity indices (Figure 7 and Figure 8). The 4 BRDF models led to significant IRS variations.
MWIR LWIR
SWIR
Figure 6 : Predicted IRS dispersion (cumulative distribution function) in the 3 spectral bands
Infrared Signature Prediction for Low Observable Air Vehicles
STO-MP-AVT-324 8 - 13
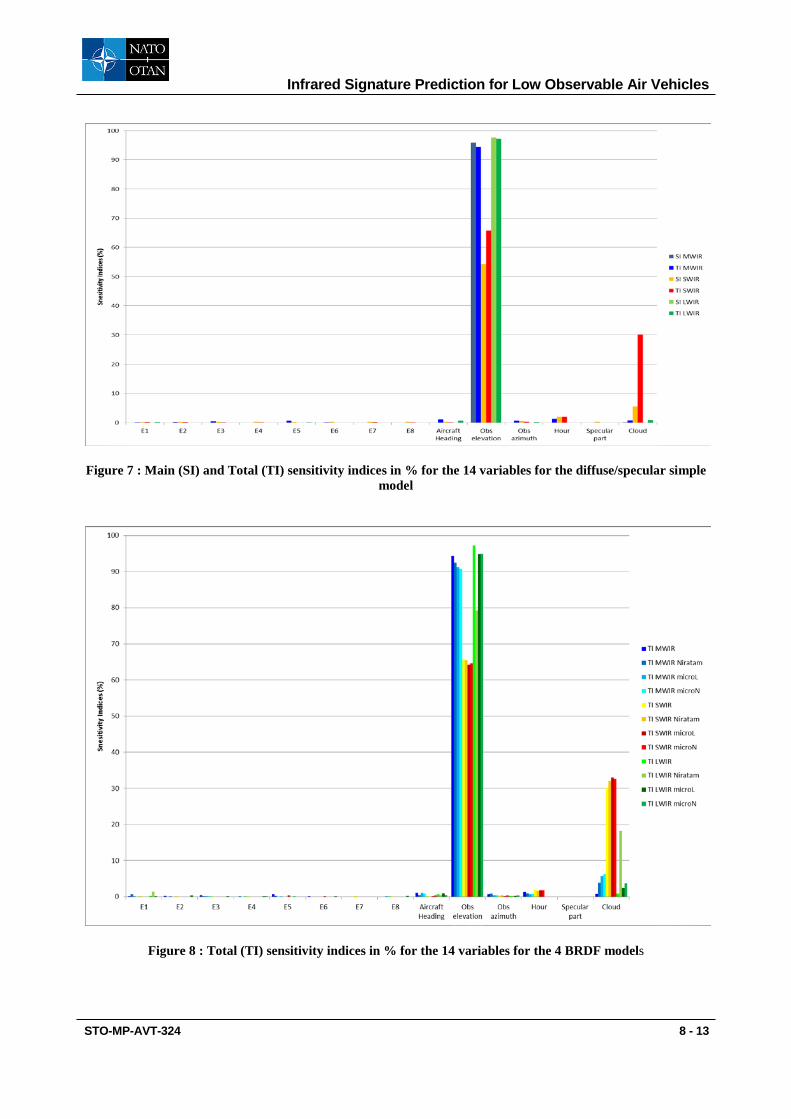
Figure 7 : Main (SI) and Total (TI) sensitivity indices in % for the 14 variables for the diffuse/specular simple model
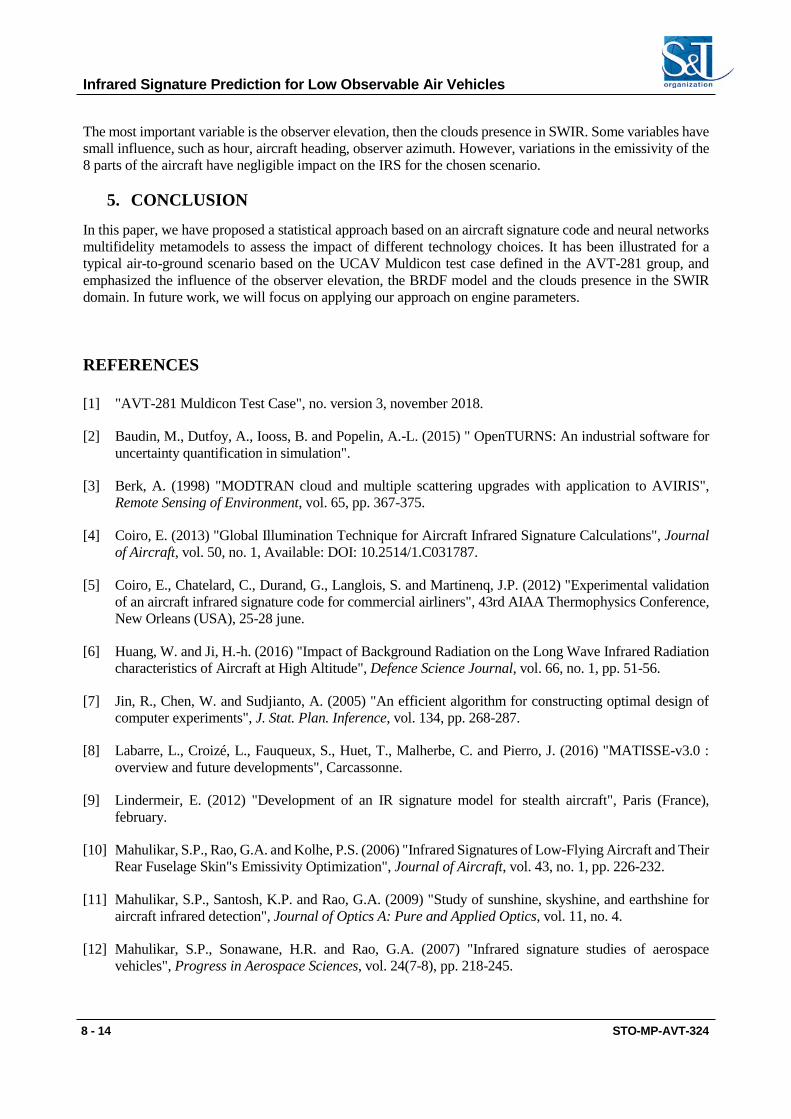
Figure 8 : Total (TI) sensitivity indices in % for the 14 variables for the 4 BRDF models
Infrared Signature Prediction for Low Observable Air Vehicles
8 - 14 STO-MP-AVT-324
The most important variable is the observer elevation, then the clouds presence in SWIR. Some variables have small influence, such as hour, aircraft heading, observer azimuth. However, variations in the emissivity of the 8 parts of the aircraft have negligible impact on the IRS for the chosen scenario.
5. CONCLUSION
In this paper, we have proposed a statistical approach based on an aircraft signature code and neural networks multifidelity metamodels to assess the impact of different technology choices. It has been illustrated for a typical air-to-ground scenario based on the UCAV Muldicon test case defined in the AVT-281 group, and emphasized the influence of the observer elevation, the BRDF model and the clouds presence in the SWIR domain. In future work, we will focus on applying our approach on engine parameters.
REFERENCES [1] "AVT-281 Muldicon Test Case", no. version 3, november 2018.
[2] Baudin, M., Dutfoy, A., Iooss, B. and Popelin, A.-L. (2015) " OpenTURNS: An industrial software for uncertainty quantification in simulation".
[3] Berk, A. (1998) "MODTRAN cloud and multiple scattering upgrades with application to AVIRIS", Remote Sensing of Environment, vol. 65, pp. 367-375.
[4] Coiro, E. (2013) "Global Illumination Technique for Aircraft Infrared Signature Calculations", Journal of Aircraft, vol. 50, no. 1, Available: DOI: 10.2514/1.C031787.
[5] Coiro, E., Chatelard, C., Durand, G., Langlois, S. and Martinenq, J.P. (2012) "Experimental validation of an aircraft infrared signature code for commercial airliners", 43rd AIAA Thermophysics Conference, New Orleans (USA), 25-28 june.
[6] Huang, W. and Ji, H.-h. (2016) "Impact of Background Radiation on the Long Wave Infrared Radiation characteristics of Aircraft at High Altitude", Defence Science Journal, vol. 66, no. 1, pp. 51-56.
[7] Jin, R., Chen, W. and Sudjianto, A. (2005) "An efficient algorithm for constructing optimal design of computer experiments", J. Stat. Plan. Inference, vol. 134, pp. 268-287.
[8] Labarre, L., Croizé, L., Fauqueux, S., Huet, T., Malherbe, C. and Pierro, J. (2016) "MATISSE-v3.0 : overview and future developments", Carcassonne.
[9] Lindermeir, E. (2012) "Development of an IR signature model for stealth aircraft", Paris (France), february.
[10] Mahulikar, S.P., Rao, G.A. and Kolhe, P.S. (2006) "Infrared Signatures of Low-Flying Aircraft and Their Rear Fuselage Skin"s Emissivity Optimization", Journal of Aircraft, vol. 43, no. 1, pp. 226-232.
[11] Mahulikar, S.P., Santosh, K.P. and Rao, G.A. (2009) "Study of sunshine, skyshine, and earthshine for aircraft infrared detection", Journal of Optics A: Pure and Applied Optics, vol. 11, no. 4.
[12] Mahulikar, S.P., Sonawane, H.R. and Rao, G.A. (2007) "Infrared signature studies of aerospace vehicles", Progress in Aerospace Sciences, vol. 24(7-8), pp. 218-245.
Infrared Signature Prediction for Low Observable Air Vehicles
STO-MP-AVT-324 8 - 15
[13] Maire, F. and Lefebvre, S. (2015) "Detecting Aircraft in Low-Resolution Multispectral Images: Specification of Relevant IR Wavelength Bands", IEEE Journal of Selected Topics in Applied Earth Observations and Remote Sensing, vol. 8, pp. 1-15.
[14] McKay, M.D., Beckman, R.J. and Conover, W.J. (1979) "A comparison of three methods for selecting values of input variables in the analysis of output from a computer code", Technometrics, vol. 21, p. 239—245.
[15] "Multi-Disciplinary Design and Performance Assessment of Effective, Agile NATO Air Vehicles - Summary Report of the NATO STO AVT-251 Task Group ", Pre-Released STO Technical Report STO-TR-AVT-251.
[16] Perez, P., Boischot, A., Ibgui, L. and Roblin, A. (2007) "A spectroscopic database for water vapor adapted to spectral properties at high temperature, and moderate resolution", JQSRT, vol. 103, pp. 231-244.
[17] Riviere, N., Ceolato, R. and Hespel, L. (2012) "Multispectral polarized BRDF: design of a highly resolved reflectometer and development of a data inversion method", Optica Applicata, vol. 42, no. 1, Available: 10.5277/oa120101.
[18] Rutten, M. and Karl, S. (2014) "Numerical Investigation of Engine Exhaust Plume Characteristics of Unmanned Combat Air Vehicles", 32nd AIAA Applied Aerodynamics Conference.
[19] Saltelli, A., Tarantola, S. and Chan, K. (1999) "A quantitative model-independent method for global sensitivity analysis of model output", Technometrics, vol. 41, p. 39—56.
[20] Sobol", I.M. (1967) "On the distribution of points in a cube and the approximate evaluation of Integrals", USSR Comput.Math. Math. Phys., vol. 7, no. 4, pp. 86–112.
[21] Sobol", I.M. (1993) "Sensitivity estimates for nonlinear mathematical models", Math. Model. Comput. Exp., vol. 1, pp. 407-414.
[22] Tuffin, B. (1997) "Simulation accélérée par les méthodes de Monte Carlo et Quasi-Monte Carlo : théorie et application", PhD in Applied Mathematics, University of Rennes 1.
[23] Wei, H. and Honghu, J. (2017) "Effect of Emissivity and Reflectance on Infrared Radiation Signature of Turbofan Engine", Journal of Thermophysics and Heat Transfer, vol. 31, no. 1, pp. 39-47.
[24] Wu, K.F., Zhou, Y., Ma, J. and Lin, J. (2020) "Skin Coating Design of Stealth Aircraft Based on Infrared Characteristic Analysis", Materials Science Forum, vol. 976, pp. 50–54, Available: //doi.org/10.4028/www.scientific.net/msf.976.50.
[25] Yong, H. and Xue, C. (2016) "Modulation of Directionality of Infrared Signatures Based on Anisotropic Emission Behavior", Journal of Thermophysics and Heat Transfer, vol. 30, no. 4, pp. 804-813.
Infrared Signature Prediction for Low Observable Air Vehicles
8 - 16 STO-MP-AVT-324


