Embed Size (px)
Citation preview

Bull. Mater. Sci., Vol. 34, No. 4, July 2011, pp. 873–881. © Indian Academy of Sciences.
873
Infrared spectra, Raman laser, XRD, DSC/TGA and SEM investigations on the preparations of selenium metal, (Sb2O3, Ga2O3, SnO and HgO) oxides and lead carbonate with pure grade using acetamide precursors
MOAMEN S REFAT†,* and KHALED M ELSABAWY
††
Department of Chemistry, Faculty of Science, Taif University, 888 Taif, Kingdom of Saudi Arabia †Department of Chemistry, Faculty of Science, Port Said University, Port Said, Egypt ††Materials Science Unit, Chemistry Department, Faculty of Science, Tanta University, Tanta 31725, Egypt
MS received 22 April 2010; revised 27 May 2010
Abstract. Ga2O3, Se metal, SnO, Sb2O3, HgO and PbCO3 are formed upon the reaction of acetamide aqueous
solutions with Ga(NO3)3, SeO2, SnCl2, SbCl3, HgCl2 and Pb(NO3)2, respectively, at 90°C. Different amorphous
or crystalline phases can be obtained depending upon the experimental conditions (molar ratios, metal salts
and temperature). The chemical mechanisms for the formations of this metal, oxides or carbonate are dis-
cussed and the X-ray diffraction, scanning electron microscopy (SEM) and atomic force microscope (AFM)
are described. The type of metal ions plays an important role in the decomposition of acetamide, leading to
the formation of solid stable (metal, oxides or carbonate), soluble and gases species. These new precursors are
more stable preventing the rapid precipitation of metal, oxides or carbonate. Furthermore, this route allows
the formation of pure compounds in solutions.
Keywords. Oxides; carbonate; XRD; SEM; infrared spectra.
1. Introduction
Acetamide is used as a plasticizer and in the synthesis of many other organic and inorganic compounds. It is used as a starting material for the synthesis of many applied compounds (Pailloux et al 2009; Pollmann et al 2009; Zhan et al 2009; Ma et al 2010). The literature revels that acetamide and its derivatives are forming coordinate bonds with many metal ions at room temperature in aqueous and nonaqueous media through its oxygen (C=O group) or nitrogen atoms (NH2 group) depending on the type of metal ion used (Paul et al 1966; Dunstan 2002; Ağırtaş and Sait Izgi 2009; Chen et al 2009). From the chemical viewpoint, the reaction of metal salts with acetamide as a simple organic compound at high tempera-ture has less attention and it is not highlighted in the sci-entific literature. The nature of the reaction products depend strongly on the type of metal ions and also the metal salt used. In our previous studies (Nour et al 1997; Refat 2004; Refat et al 2004a, b; Sadeek et al 2004; Teleb et al 2004; Sadeek and Refat 2005; Refat and Sadeek 2005; Refat et al 2005; Teleb and Refat 2006) concerning the reaction of urea (which contain amido group similar to acetamide)
and also simple organic ligand with different metals such as Co(III), Pb(II), Sn(II), Cr(III), Fe(III), Au(III), Sn(IV), V(V) and Mo(IV) at high temperature demon-strate that the types of metal ions beside their anions have a pronounced effect on the nature of the reac-tion products. The published papers were trended for the reaction of urea with different metal salts at high tempe-rature which lead to identify a novel method for prepara-tion of pbCO3 and CoCO3 (Refat et al 2004a), lanthanide carbonates (Refat 2004; Teleb and Refat 2006), limonite, FeO(OH) (Sadeek et al 2004), 2ZnCO3⋅3Zn(OH)2 (Sadeek and Refat 2005), SnOCl2⋅2H2O (Teleb et al 2004), (Cr2O3, MnO2, MoO3 and WO3) oxides resulted from a novel oxidation reduction reaction between (K2CrO4 or K2Cr2O7), KMnO4, Na2MoO4 and Na2WO4, respectively, with urea in an aqueous solution at ~ 85°C (Teleb and Refat 2006). The aim of this publication is to report the synthesis and characterization study of the resulting compounds formed from the reactions of acetamide with Ga(NO3)3, SeO2, SnCl2, SbCl3, HgCl2 and Pb(NO3)2 at high tempera-ture in aqueous media.
2. Experimental
All chemicals used throughout this study were Analar or extra pure grade. The Ga2O3, Se metal, SnO, Sb2O3, HgO
*Author for correspondence ([email protected])

Moamen S Refat and Khaled M Elsabawy
874
and PbCO3 compounds were prepared by mixing equal volumes of aqueous solutions of 0⋅01 M of Ga(NO3)3, SeO2, SnCl2, SbCl3, HgCl2 and Pb(NO3)2 with 0⋅1 M of acetamide. The mixtures were heated on a water bath to approximately 90°C for about ~ 24 h. The precipitate filtered off, washed several times with bidistilled water and dried in vacuo over CaCl2. The six-products com-pounds were received in powder solid form. The elemental analysis for the obtained products shows the absence of carbon and nitrogen elements except for Pb(II) product. The percentage of gallium, selenium, tin, antimony, mer-cury and lead were determined by gravimetric method in suitable fixed feature. The infrared spectra of the solid products obtained were recorded from KBr discs using a Shimadzu FT–IR spectrophotometer. The X-ray diffraction patterns for the three compounds under investigation were recorded on Bruker AXS configuration X-ray powder diffraction in National Research Centre, Cairo, Egypt. Samples were scanned on analytical scanning electron microscopy for the Jeol JSM-63OLA and VEECO INNOVA AFM with multi-modes function USA. Raman laser of samples were measured on the Bruker FT Raman with laser 50 mW. DSC thermograms of the new compounds were obtained on a SCINCO DSC 1500 STA, which was cali-brated with indium metal. Sample of 6⋅40 mg in solid form were placed in aluminum pans with a pierced lid, and heated rate of 10°C min–1 under a nitrogen flow. TGA was carried out on a SCINCO TGA 1500 STA apparatus at a heating rate of 10°C min–1 under nitrogen atmosphere.
3. Results and discussion
The reaction of aqueous solutions of acetamide with Ga(NO3)3, SeO2, SnCl2, SbCl3, HgCl2 and Pb(NO3)2 pro-duces uncoloured solid products, Ga2O3, SnO, Sb2O3, HgO and PbCO3 compounds except selenium metal. The forma-tion of these compounds upon the heating of an aqueous mixture of Ga(NO3)3, SeO2, SnCl2, SbCl3, HgCl2 and Pb(NO3)2 with acetamide may be understood as follows
(i) Ga(NO3)3+CH3CONH2 + H2O
o
90 C⎯⎯⎯→
Ga2O3 + 3HNO3 + 2CO + NH3 + 0⋅5H2,
(ii) SeO2 + CH3CONH2 + H2Oo
90 C⎯⎯⎯→
Se + 2CO + NH3 + 2H2O,
(iii) SnCl2 + CH3CONH2 + H2Oo
90 C⎯⎯⎯→
SnO + 2CO + NH3 + 2HCl + H2,
(iv) SbCl3 + CH3CONH2 + H2Oo
90 C⎯⎯⎯→
Sb2O3 + 3HCl + 2CO + NH3 + 0⋅5H2,
(v) HgCl2 + CH3CONH2 + H2Oo
90 C⎯⎯⎯→
HgO + 2CO + NH3 + 2HCl + H2,
(vi) Pb(NO3)2+ CH3CONH2+3H2Oo
90 C⎯⎯⎯→
PbCO3 + CO + 2HNO3 + 9/2H2.
From the above six reactions, liberation of different gases (HCl, CO, NH3 and H2) and soluble oxidizing products HNO3 besides different oxide, metal or carbonate solid products occurs during the decomposition of acetamide according to the type of metals and the important role of their metal on the decomposition process via aqueous media.
3.1 Infrared spectra
The infrared spectra of the six products are shown in figure 1. Infrared spectra have been widely used as a powerful means of distinguishing between the two possi-ble donation sites of acetamide. A shift in the carbonyl stretching vibration to lower wavenumbers is usually taken to indicate a metal–oxygen bond, while a shift in ν(CO) to higher wavenumbers indicates a metal–nitrogen bond. However, the majority of the evidences indicate that the oxygen atom is the preferred coordination site. The infrared spectra of the obtained products show no bands due to characteristic groups of acetamide (carbonyl and amide groups), but the bands associated to presence of new products observed. The νas(CN) of acetamide is observed at around 1400–1500 cm–1 (Nakamoto 1978), while, the bending vibration associated with the –NH2 of acetamide is observed as expected as a very strong absorption around 1630 cm–1. The C–N bond symmetric stretching vibration, νas(CN), is observed at 1000–1100 cm–1 for acetamide. The rocking, twisting and wagging modes associated with the –NH2 group are observed around 900 cm–1. The bending mo-tions δ (NCO) is observed in the spectrum of acetamide near to 600 cm–1. The assignments of these bands are due to free acetamide ligand, these bands are absent in the spectra of the three new compounds with appearing new bands. For the Ga2O3, SnO, Sb2O3 and HgO compounds, there are many bands (Ga2O3 = 1132, 885, 571, 514 and 451 cm–1; SnO = 1044, 929, 610 and 504 cm–1; Sb2O3 = 839, 772, 689, 608, 506, 477 and 451 cm–1; HgO = 1177, 1038, 922, 495, 469 and 440 cm–1) refer to the stretching vibration motions of the ν(M–O). The OH stretching motions of the H2O molecule are observed in its expected region at 3450–3530 cm–1. Although it is difficult to dif-ferentiate between H2O molecule and –OH group, the former is associated with other modes such as rocking, twisting and ν(M–O) vibrations. The bands observed at 900, 700 and 400–500 cm–1 can be assigned to these motions, respectively (Nakamoto 1978).

Acetamide as plasticizer in synthesis of organic and inorganic compounds
875
Figure 1. Infrared spectra of (a) acetamide as a free ligand, (b) Ga2O3, (c) Se metal, (d) SnO, (e) Sb2O3, (f) HgO and (g) PbCO3 compounds.
Finally, the infrared spectrum of PbCO3 compound can be attributed to formed CO2
3–- ion in planar geometry, and
therefore belongs to the D3h symmetry. It is expected to display four modes of vibrations, A′1 + A″2 + 2E′ (E′ is a
doubly degenerate motion). The vibration A′1 is only Raman-active, while the other ν2, ν3 and ν4 are infrared-active. The stretching vibrations of the type, ν(C–O); ν3(E′) is observed as a strong broad band at 1388 cm–1

Moamen S Refat and Khaled M Elsabawy
876
Figure 2. TG/DTG/DSC curve of PbCO3 compound.
while the stretching vibration ν(C–O); ν1(A′1) is observed in the region ~ 1030 cm–1 as a medium-to-weak band. It should be indicated here that this motion (A′1) should be infrared inactive, its weak appearance in the spectrum of MCO3⋅nH2O could be related to weak solid–solid interac-tions causing the symmetry of CO2
3– to be lowered than
D3h. The out-of-plane of vibration, δ (OCO), ν2(A″2) is observed in the range of ~ 822 cm–1 as a medium strong band, while the angle deformation bending vibration δ
(OCO), ν4(E′) appear at 714 cm–1 as a medium weak. The infrared spectra of Pb(II) carbonate, PbCO3⋅nH2O, show that some of these products clearly have an uncoor-dinated water. The band related to the stretching vibration ν(O–H) of uncoordinated H2O is observed as expected in the range of ~ 3000 cm–1.
3.2 Thermal analysis TG–DTG
The TG/DSC curve of PbCO3 compound is shown in fig-ure 2. Synthetic lead carbonate was prepared from inter-action of lead(II) nitrate and acetamide in aqueous media at high temperature and subjected to thermal analysis studies. The decomposition product was subjected to infrared analysis and was found to be a Pb2O3. From the TG/DSC plot of synthetic PbCO3 seen in figure 3 there is a large sequential mass loss equating to approximately 13⋅70% of the total mass. The combined large mass loss started at 160°C and was complete by 580°C. There was no evidence in the accompanying curves of water; this confirmed that water did not exist in the sample. The theoretical decomposition reaction for synthetic PbCO3 is as follows
2PbCO3(s) → Pb2O3(s) + CO2(g) + CO(g).
The expected mass loss should be equivalent to 13⋅50% of the total mass, the analysis resulted in an actual
mass loss of 13⋅70% overall mass loss which is very close to that of the theoretical calculated percentage loss.
3.3 Phase identification and XRD spectra
The XRD patterns of Ga2O3, Se metal and Sb2O3 are shown in figures 3a–c. All detectable peaks of Ga2O3, Se metal and Sb2O3 are indexed as Ga2O3, Se metal and Sb2O3 structures, which are matched and compared with the ASTM standard cards and ICSD-data bank (Karles-ruhe-Germany). As clear in figure 3a–c the dominating phases for sele-nium metal, gallium oxide and antimony oxide that assigned by S, G and A-letters are found to be typical to the single crystal data recorded in ICSD-data bank for those oxides. Many investigators (Barber and Menke 1984; Boris 1999; DeCamps et al 1972; Bonnhomme et al 1993; Elsabawy et al 2009; Elsabawy 2009) studied the applica-tions of these oxides as individual, binary and ternary mixed system in catalysis, photochemical degradation and environmental issues due to their huge surface area and cations centres existed on its surface layers. From this point of view, others (Boris 1999; DeCamps et al 1972) investigated more complicated systems such as binding of oxides with polymeric materials or organic substrates to increase or promote the catalytic activity of these materials. Confirmation of synthesized oxides structures were performed through theoretical treatment by visualizing of structures of both (HgO and SnO) as model of synthesized materials via Diamond Impact Crystal Molecular Structure Version 3.2-Visulizer. Figures 3d–e display the experimental XRD recorded for samples (HgO and SnO) in the range (2θ = 10–30°) the red circles and blue arrows are as follows.

Acetamide as plasticizer in synthesis of organic and inorganic compounds
877
The indexed assignments for each mercuric and tin oxides phases, while figure 4 shows the visualized XRD-constructed for mercuric oxides. The matching and com-parison between XRD-profile of experimental data and visualized XRD-profile data indicated that synthesized HgO was nearly identical with visualized structure with ratio higher than 85%. Figure 6 describes the high resolu-tion zoom in zone of experimental XRD-profile recorded in the specific range (2θ = 60–70°) which compared with the same region in figure 4 was observed
Figure 3a–e. X-ray diffraction patterns recorded for (a) Se metal (b) Ga2O3 and (c) Sb2O3 compounds. X-ray diffraction patterns recorded for (d) SnO and (e) HgO.
Figure 4. Visualized XRD of HgO prepared via acetamide precursor.
that the principal three lines located in figure 4 are pre-sent nearly in the same positions in figure 5 with some more extra peaks due to impurity phases in minor. Figures 5a, b are the molecular structures drawn for HgO and SnO depending up on the crystal structure data evaluated from experimental XRD of both HgO and SnO oxides in which HgO crystallized in orthorhombic phase with Imm2 space group and lattice parameters a = 3⋅3113, b = 3⋅5288 and c = 3⋅688 Å, while SnO crystallized in tetragonal unit cell with P4/nmms space group. A visu-alization study made is concerned by matching and com-parison of calculated theoretical data as bond distances, oxidation states and bond torsion on the crystal structure formed. The study exhibited good fitting between experimental and theoretical data.
3.4 Scanning electron and atomic force microscopy
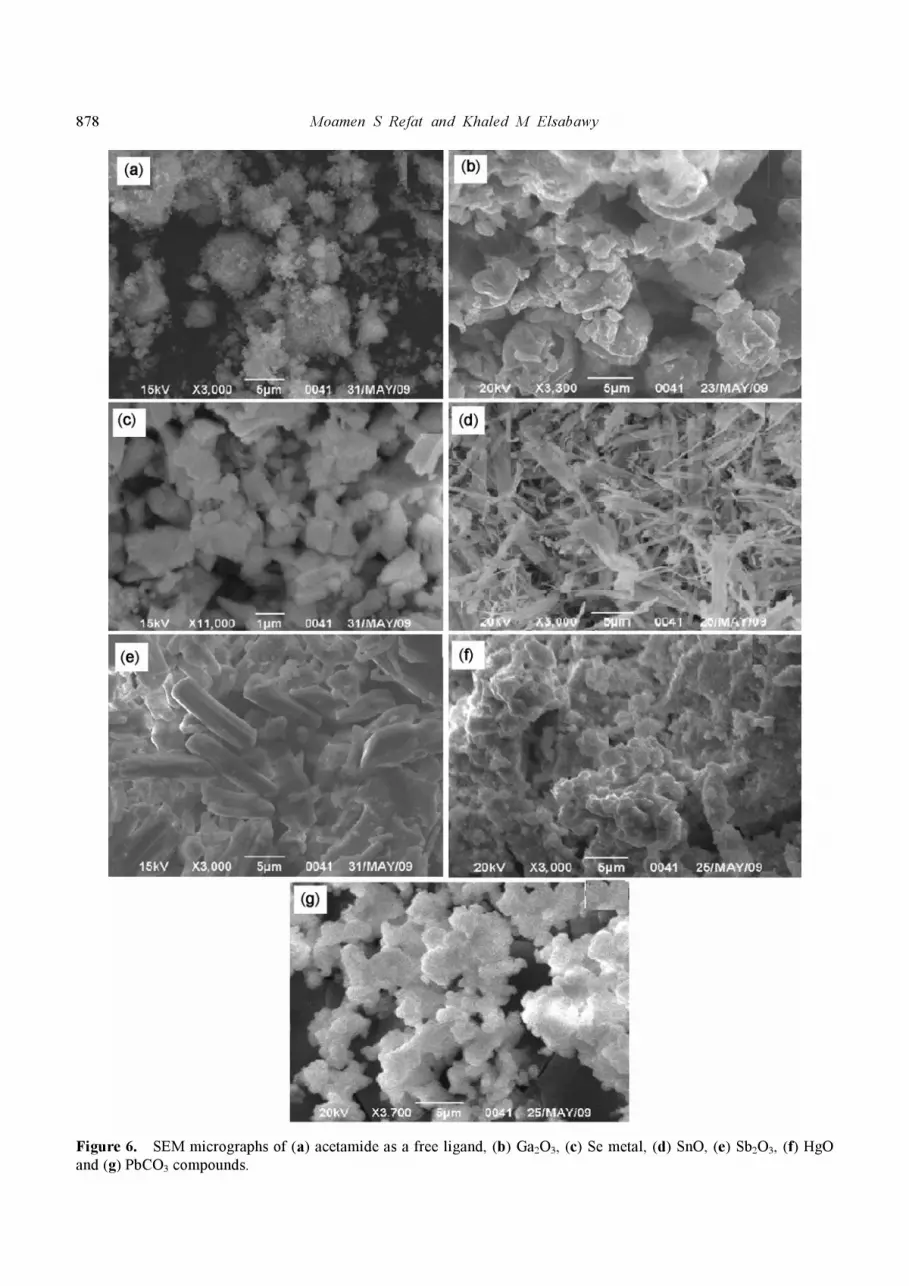
The SEM micrographs of the prepared Ga2O3, Se, SnO, Sb2O3, HgO and PbCO3 compounds are shown in figure 6. The average grain size were calculated and found in between 2⋅75 μm for Ge2O3, 0⋅65 μm for selenium metal, 0⋅9 μm for tin oxide (SnO), 2⋅2 μm for Sb2O3, 0⋅85 μm for mercuric oxide and finally 2⋅3 μm for lead carbonate sample, respectively. The EDX examinations for random spots in the same sample confirmed and are consistent with our XRD analysis. From figure 6 it is difficult to observe inhomogeneity within the same micrograph due to the solution route synthesis with acetamide precursor and is very fine and the particle size must be in nano-
Figure 5. High resolution XRD recorded for HgO-oxide. (a) Tetragonal molecular structure of SnO and (b) orthohombic molecular structure of HgO.
Moamen S Refat and Khaled M Elsabawy
878
Figure 6. SEM micrographs of (a) acetamide as a free ligand, (b) Ga2O3, (c) Se metal, (d) SnO, (e) Sb2O3, (f) HgO and (g) PbCO3 compounds.

Acetamide as plasticizer in synthesis of organic and inorganic compounds
879
range specially for selenium-metal and mercuric oxide samples. The grain size for nano-oxides were calculated according to ‘Scherrer’s formula’ (Scherrer 1918; Van-derzee et al 1974; Li et al 1997; Jenkins and Snyder 1996; Locha et al 2002)
B = 0⋅87λ/D cosθ,
where D is the crystalline grain size in nm, θ is half of the diffraction angle in degree, λ the wavelength of X-ray source (Cu-K
α) in nm, and B is degree of widening of
diffraction peak which is equal to the difference of full width at half maximum (FWHM) of the peak at the same diffraction angle between the measured sample and stan-dard one. From SEM-maping, the estimated average grain size was found to be lower than those calculated applying Scherrer’s formula for the same compounds. This indicates that the actual grain size in the material bulk is smaller than that detected on the surface morophology. Similar behaviour of grains size calculations differences between bulk and material surface was recorded by many authors (Sekkina and Elsabawy 2002; Sekkina et al 2004; Elsa-bawy 2005) due to ambient processing temperature and applied experimental condition. Figure 7 shows the variation of calculated grain size from SE-micrograph according to ionic size of each syn-thesized oxides of reactant materials. Synthesized oxides were arranged according to the sequences as is clear in figure 7 with minimum grain size 0⋅65 μm for selenium metal and maximum 2⋅75 μm for gallium oxide. Many researchers (Fayette et al 2000; Tschöpe 2001; Pérez
Figure 7. Synthesized compounds versus calculated grain size.
Figure 8. 3D-AFM-tapping mode imaging captured for Se-metal prepared via acetamide precursor.
2002) reported that grain size can be affected by many parameters such as reactant counter ions and grain orien-tations that could make a noticeable change in the physical properties of synthesized product as thermal, ionic con-ductivity and corrosion behaviour (Pérez 2002). For accurate particle size calculations and morphological properties of selenium surface, AFM-microscopy tapping mode was applied on the solid pellet of selenium metal as model of different yields produced through ignition of metal-acetamide precursors to evaluate nanometric features of the resultant materials. Figure 8 shows the three-dimensional image for sele-nium-metal through tapping mode; it was observed that movement of the tip through the z-axis not similar which means that the up and down zones of the surface is not homogeneous through the scanned area which is too small (2 × 2 μm). The analysis of the SEM images and AFM shown in figure 9 indicate that the average particle size for selenium sample is between 15–35 nm which confirm that acetamide synthesis technique yields to nano-product. Peng et al (2007) reported that 36 nm of Se metal has lower toxicity than selenite or selenomethionine with higher particle sizes, but all of these forms of (Se) possess similar ability to increase selenoenzyme levels. They deduced also that the size of nanoparticles play an important role in their biological activity: as expected, from range 5–200 nm for Se which can be directly scav-enge free radicals in vitro in a size-dependent fashion. Accordingly the present techniques of synthesizing sele-nium metal within the range 15–35 nm is a unique and pioneer technique to increase the validity for selenium in biological reaction and leading new trends to decrease toxicity of selenium of higher particle size as reported in (Peng et al 2007).
3.5 Raman laser spectra
The Raman laser spectra of the six compounds were recorded and assigned. The Raman spectrum of the
Figure 9. AFM-image captured for selenium-metal surface.

Moamen S Refat and Khaled M Elsabawy
880
Figure 10. Raman spectra of (a) acetamide as a free ligand, (b) Ga2O3, (c) Se metal, (d) SnO, (e) Sb2O3, (f) HgO and (g) PbCO3 compounds.
acetamide, Ga2O3, Se, SnO, Sb2O3, HgO and PbCO3 compounds are shown in figures 8a–f. Raman spectrum of the Ga2O3 is shown in figure 8a. The band at 717 cm–1 is assigned to the ν1 symmetric stretching bands of Ga–O units. The band at 643 cm–1 is assigned to O–Ga–O bend-ing modes of the Ga2O3 units. According to Gao et al (2002) and Rao et al (2005) the wavenumbers of Ga2O3 materials found Raman bands at 160, 194, 332, 409, 641 and 742 cm–1. The results of both these papers are matched with the data in this paper. The Raman bands reported in this study are at 237, 528, 643 and 717 cm–1. The Raman spectrum of Se metal is reported in figure 8b. For the pure selenium sample, the spectrum is character-ized by a strong band at 237 cm–1 which is attributed to the vibrational mode of –Se–Se–Se– chains (40, 41). Additional weaker features can be revealed at 141 cm–1 which are assigned to the presence of Se8 rings and to the bending modes of Se units (Kovanda et al 2003; Iovu et al 2005). Figure 8c shows Raman spectra of SnO within frequency range (0⋅0–1500 cm–1). The Raman spectrum of pure SnO show the same behaviour of ZnO which shows several bands which include 565 and 324 cm–1. The most intense band can be seen at 565 cm–1 (Mikla 1997; Wang et al 2004), as shown in figure 8c, which confirm the presence of SnO in pure form. Sb2O3 Raman spectrum (figure 8d) contains several bands at 457, 369, 328, 270, 209 and 141 cm–1 which are assigned to Sb–O stretching and O–Sb–O bending motions. These identical bands are in good agreement with data in literature (Cody et al
1979; Mestl et al 1994; Terashima et al 1996). The Raman spectrum of the HgO is represented in figure 8e with clearly obvious two detectable bands at 311 and 135 cm–1 due to Hg–O stretching frequency. Under ambi-ent conditions, lead carbonate (PbCO3) have 30 Raman active (9A1g + 6B1g + 6B2g + 9B3g) and 18 IR active (8B1u + 5B2u + 5B3u) vibrational modes. We observed 14 Raman modes in the range 100–1600 cm–1, in good agreement with the findings of Lin and Liu (1997). These modes can be divided into four main regions as follows:
646 cm–1 B3g + A1g + B2g + B1g 707 cm–1 (ν4-in-plane band of CO3 group) 809 + 907 cm–1 A1g (ν2-out-of-plane band of CO3 group) 1046 cm–1 A1g (ν1-symmetric C–O stretching of CO3 groups) 1399 + 1303 cm–1 A1g (ν3-asymmetric C–O stretching of CO3 groups)
4. Conclusions
The available experimental work suggest that the acetamide compound play an important role as precursor in the preparation of Ga2O3, selenium metal, SnO, Sb2O3, HgO and PbCO3 compounds. The types of metals and metal salts also have the significant effect on the decom-position process of acetamide in aqueous media. Differ-ent tools of analyses are used in the interpretative of the resulted compounds like infrared and Raman spectra,
Acetamide as plasticizer in synthesis of organic and inorganic compounds
881
thermal analysis, XRD and scanning electron micro-scopy.
References
Ağırtaş M S and Sait Izgi M 2009 J. Mol. Struct. 927 126
Barber T E and Menke R D 1984 The Am. J. Emergency Med. 2
500
Bonnhomme C, Henryand M and Livage J 1993 J. Non-Cryst.
Solids 159 22
Boris L’vov V 1999 Thermochim. Acta 333 21
Chen S -C, Hsueh H -H, Chen C -H, Lee C S, Liu F -C, Lin I J
B, Lee G H and Peng S -M 2009 Inorg. Chim. Acta 362 3343
Cody C A, DiCarlo L and Darlington R K 1979 Inorg. Chem.
18 1572
DeCamps E A, Durand M, Marqueton Y and Ayrault B 1972
Optics Commun. 4 358
Dunstan P O 2002 Thermochim. Acta 389 25
Elsabawy K M 2005 Physica C 432 263
Elsabawy K M 2009 Mens Agitate 4 (in press)
Elsabawy K M, Sekkina M M and Bediwy M M 2009 Int.
J. Pure & Appl. Chem. 4 265
Fayette S, Smith D S, Smith A and Martin C 2000 J. Eur.
Ceramic Soc. 20 297
Gao Y H, Bando Y, Sato T, Zhang Y F and Gao X Q 2002
Appl. Phy. Lett. 81 2267
Iovu M S, Kamitsos E I, Varsamis C P E, Boolchand P and
Popescu M 2005 Chalcogenide Lett. 2 21
Jenkins R and Snyder R L 1996 Introduction to X-ray powder
diffractometry (John Wiley & Sons Inc) pp 89–91
Kovanda V, Vlček M and Jain H 2003 J. Non-Cryst. Solids
326&327 88
Li Q, Yuan X, Zeng G and Xi S 1997 Mat. Chem. & Phys. 47
239
Lin C C and Liu L G 1997 J. Phys. Chem. Sol. 58 977
Locha V, Machek J and Tichý J 2002 Appl. Catalysis A228 95
Ma Z, Han S, Kravtsov V C and Moulton B 2010 Inorg. Chim.
Acta 363 387
Mestl G, Ruiz P, Delmon B and Knözinger H 1994 J. Phys.
Chem. 98 11276
Mikla V I 1997 J. Phys., Condens. Matter. 9 9209
Nakamoto K 1978 Infrared and Raman spectra of inorganic
and coordination compounds (New York: Wiley Inter-
science) 3rd edn
Nour E M, Teleb S M, Al-Khososy N A and Refat M S 1997
Synth. React. Inorg. Met-Org. Chem. 27 505
Pailloux S, Binyamin I, Deck L M, Hay B P, Duesler E N,
Zakharov L N, Kassel W S, Rheingold A L and Paine R T
2009 Polyhedron 28 3979
Paul R C, Sreenathan B R and Chadha S L 1966 J. Inorg. Nucl.
Chem. 28 1225
Peng D, Zhang J, Liu Q and Taylor E W 2007 J. Inorg. Bio-
chem. 101 1457
Pérez P 2002 Corrosion Sci. 44 1793
Pollmann S, Düchting P and Weiler E W 2009 Phytochemistry
70 523
Rao R, Rao A M, Xu B, Dong J, Sharma S and Sunkara M K
2005 J. Appl. Phys. 98 943
Refat M S 2004 Synth. React. Inorg. Met.-Org. Chem. 34
1605
Refat M S and Sadeek S A 2005 Latvian J. Chem. 4 343
Refat M S, Sadeek S A and Nasr D E 2005 Bull. Chem. Tech-
nolog. Maced. 24 153
Refat M S, Sadeek S A and Teleb S M 2004a J. Argen. Chem.
Soc. 92 23
Refat M S, Teleb S M and Sadeek S A 2004b Spectrochim. Acta
A60 2803
Sadeek S A and Refat M S 2005 J. Coord. Chem. 58
1727
Sadeek S A, Refat M S and Teleb S M 2004 J. Korea, Chem.
Soc. 48 358
Scherrer P 1918 Göttinger Nachrichten Gesell. 2 98
Sekkina M M A and Elsabawy K M 2002 Solid State Commun.
123 1
Sekkina M M A, Eldaly H A and Elsabawy K M 2004 Super-
cond. Sci. Technol. 17 93
Teleb S M and Refat M S 2006 Bull. Chem. Technolog. Maced.
25 57
Teleb S M, Refat M S and Sadeek S A 2004 Ukrainian Chem.
J. 68 35
Terashima K, Hashimoto T, Uchino T, Kim S -H and Yoko T
1996 J. Ceram. Soc. Japan 104 1008
Tschöpe A 2001 Solid State Ionics 139 267
Vanderzee C E, Rodenburg M L N and Berg R L 1974 J. Chem.
Thermodynamics 6 17
Wang R P, Xu G and Jin P 2004 Phys. Rev. B: Condens. Matter
Mater. Phys. 69 113303
Zhan P, Liu X, Fang Z, Li Z, Pannecouque C and De Clercq E
2009 Eur. J. Med. Chem. 44 4648


