Embed Size (px)
Citation preview
Innovation Dynamism of Material Technology:
Empirical Analysis of Lithium Ion Battery Industry
By
Yosuke Shibata 08D46044
Submitted in partial fulfillment of the requirement for the Degree of
DOCTOR OF MANAGEMENT OF TECHNOLOGY
Advised by Professor Tomoko Saiki
Graduate School of Innovation Management Tokyo Institute of Technology
2011
1
Table of contents Table of contents 1 Abstract 5 List of Tables 6 List of Figures 8 Chapter I Introduction 10
1.1 Innovation of material technology in an information society 11 1.2 Lithium ion battery industry 12
1.2.1 Technological performance of LIB 12 1.2.2 Trends in LIB market in the world 13 1.2.3 Trends in domestic LIB market 15
1.3 Trends in the number of patent applications in the LIB industry 16 1.3.1 Trends in the number of patent applications in Japan 16 1.3.2 Trends in the number of patents and paper publications
in each country 17 1.4 Technological structure of LIB 19
1.4.1 Composition of LIB 19 1.4.2 Composition of electrode 20 1.4.3 Conceptual model of technological composition of LIB 21
1.5 Development of material technology in LIB 22 1.5.1 Development of energy density 22 1.5.2 Development of materials used in a cathode 23
1.6 Previous works 25 1.7 Structure of the dissertation 27 References 28
Chapter II Diffusion of Innovation in the Lithium Ion Battery Industry : Comparative Analysis between Sony and Panasonic 32
2.1 Introduction 34 2.1.1 Diffusion of Innovation 34
2.2 Comparison of business performance between Sony and Panasonic 36 2.2.1 Trends in the number of patent applications in the world 36
2
2.2.2 Trends in the number of patent applications in Japan 37 2.2.3 Trends in market shares and sales 39 2.2.4 Trends in news paper articles 41
2.3 Interpretation 42 2.4 Analysis of the diffusion of innovation 43
2.4.1 Methodology to classify technologies 43 2.4.2 Data construction 45 2.4.3 Numerical model of diffusion trajectory 47 2.4.4 Numerical results of epidemic behavior 50 2.4.5 Timing of inflection points 57
2.5 Analysis of chronology of material patents 58 2.5.1 Methodology to define patents 58 2.5.2 Methodology to group the development of materials 59 2.5.3 Data construction 63 2.5.4 The results of analysis 70 2.5.5 Trends in the number of patent applications of primary battery 71
2.6 Discussion 72 2.7 Conclusion 73 Appendix A. Articles about LIB of Sony 74 Appendix B. Articles about LIB of Panasonic 75 Appendix C. List of IPC 76 References 77
Chapter III Technology Spillover in Innovation of Material Technology : A Case Study of Lithium Ion Battery in Sony and Panasonic 81
3.1 Introduction 83 3.1.1 Knowledge management 83 3.1.2 Technology spillover 84
3.2 Two-dimensional model of technology spillover 86 3.3 Hypothetical view 87 3.4 Analysis of technology spillover in material technology 88
3.4.1 Methodology to define patents and materials 88 3.4.2 Data construction about inventors of material technology 90 3.4.3 Methodology to analyze technology spillover 93 3.4.4 Data construction about technology spillover structure 96
3
3.4.5 The results of analysis 101 3.4.6 Patent strategy of material technology 103
3.5 Discussion 107 3.6 Conclusion 108 Appendix A. Index of material patents obtained by Sony 109 Appendix B. Index of material patents obtained by Panasonic 112 Appendix C. Index of material patents referred by patents in Figure 3-4. 115 Appendix D. Index of material patents referred by patents in Figure 3-5. 116 References 121
Chapter IV Trends in Diversification of Technologies : Empirical Analysis of Lithium Ion Battery Industry in Japan 126
4.1 Introduction 128 4.1.1 Knowledge spillover 128 4.1.2 Diversification of technology in acoustic industry 130
4.2 Two periods in the LIB innovation process 132 4.3 Hypothetical view 133 4.4 Analysis of trends in diversification of technologies 134
4.4.1 Methodology to classify technologies 134 4.4.2 Data construction 136 4.4.3 Numerical model to analyze diversification of technologies 139 4.4.4 Numerical results of multiple regression analysis 141
4.5 Discussion 143 4.6 Conclusion 144 Appendix A. List of IPC 145 References 148
Chapter V Conclusion 151 5.1 General summary 152 5.2 Innovation dynamism of material technology 153 5.3 Implication 154 5.4 New findings in each chapter 155 5.5 Future works 156
4
Chapter VI Addendum :A case study of R&D management of material technology in Panasonic 157
6.1 Historical view in reforms at Panasonic 158 6.2 Trends in the number of joint patent applications with universities 160 6.3 Trends in the number of joint patent applications of LIB 161 6.4 Trends in the relations among inventors 162 6.5 Trends in the move of inventors in Panasonic 165 6.6 R&D management in Panasonic 167 6.7 R&D management of material technology 168 References 170
5
Abstract The main purpose of this study is to reveal the innovation dynamism of material
technology, because the development of materials plays a significant role in driving the innovation process. In this study, we focus on Lithium Ion Battery (LIB) as an essential energy device in an information society and analyze the development of materials used in a cathode.
In Chapter I, background of this study is introduced; market trends in the LIB
industry, technological structure of LIB, and technological characteristics of materials. Additionally, the relations between previous works and this study, and structure of this dissertation are noted.
In Chapter II, we compare diffusion trajectories of electrode technology in Sony and Panasonic by utilizing patent data, and analyze chronologies of material patents obtained by these firms. On the basis of observation, it was revealed that diffusion trajectories of electrode technology had two waves in both firms. The 2nd wave was initiated by the development of composite materials used in a cathode.
In Chapter III, analyzing the LIB innovation process, we group technologies composing a LIB into ‘simple technology’ and ‘complex technology' by the combination of International Patent Classification (IPC). Based on this model, LIB innovation process in Sony and Panasonic was compared as a model. In conclusion, it was revealed that technologies composing a LIB have diversified from simple technology to complex technology when material technology developed to process, component, and product technologies in both firms. It was also revealed that both simple materials and composite materials traced a similar diversification process in both firms.
In Chapter IV, we analyze trends in the number of patent applications of LIB filed in Japan patent office. It was shown that technologies composing a LIB have diversified from simple technology to complex technology in the LIB industry, and then technology leading the LIB innovation process was replaced from simple technology to complex technology with the development of materials used in a cathode.
In Chapter V, as the total conclusion in this study, it was revealed that technologies composing a LIB have diversified from simple technology to complex technology in the LIB innovation process, and then the combination of IPC has been complicated.
In Chapter VI, R&D management in Panasonic is discussed as addendum. It is considered that ‘cross-industrial associations’ and ‘platform structure’ in R&D system can contribute to promote the technological integrations.
6
List of Tables Chapter I
Table 1-1 Rank for world patent application of LIB in 2009. 18 Table 1-2 Rank for the number of LIB researchers in the world in 2009. 18 Table 1-3 Rank for patent application of LIB in each patent office in 2009. 18
Chapter II Table 2-1 Rank for world patent application of LIB in 2009. 36 Table 2-2 Rank for patent application of LIB in each patent office in 2009. 36 Table 2-3 Comparison of the number of each article on LIB
during 1991-2007. 41 Table 2-4 The results of correlation analysis among seven technology groups. 45 Table 2-5 Comparison of the numerical results by the simple logistic function model. 51 Table 2-6 Comparison of the numerical results by the bi-logistic function model. 52 Table 2-7 Inflection points of two waves in the diffusion trajectory. 57 Table 2-8 Chronology of material patents obtained by Sony. 64 Table 2-9 Chronology of material patents obtained by Panasonic. 67
Chapter III Table 3-1 Two-dimensional model of technology spillover. 86 Table 3-2 The development of material technology used in a cathode. 89 Table 3-3 Chronology about patents of cathode materials obtained by Sony. 91 Table 3-4 Chronology about patents of cathode materials obtained by Panasonic. 92 Table 3-5 Trends in the changes of technology spillover structure in Sony. 97 Table 3-6 Trends in the changes of technology spillover structure in Panasonic. 99

7
Chapter IV Table 4-1 The results of correlation analysis among seven technology groups. 136 Table 4-2 The results of the multiple regression analysis. 142
Chapter VI Table 6-1 Trends in the number of joint patent applications. 161
8
List of Figures Chapter I
Figure 1-1. World LIB market share in 2008. 13 Figure 1-2. Trends in total sales amount of LIB in the world. 14 Figure 1-3. Trends in total sales of LIB in the world. 14 Figure 1-4. Trends in total sales amount of cathode in the world. 14 Figure 1-5. Trends in total sales amount of secondary LIB in Japan. 15 Figure 1-6. Trends in total sales of secondary LIB in Japan. 15 Figure 1-7. Trends in the number of patent applications of LIB in JPO. 16 Figure 1-8. Technological structure of LIB. 19 Figure 1-9. Technological structure of an electrode. 20 Figure 1-10. Conceptual model of grouping technologies composing a battery. 21 Figure 1-11. Trends in energy density per unit volume of materials 22 Figure 1-12. Development of materials used in a cathode. 24
Chapter II Figure 2-1. Trends in the number of patent applications of LIB in JPO during 1991-2008. 38 Figure 2-2. Trends in the number of patent applications of LIB filed by Sony and Panasonic during 1991-2008. 38 Figure 2-3. Trends in world market shares of LIB. 40 Figure 2-4. Trends in OIS of department regarding LIB. 40 Figure 2-5. Conceptual model of technologies composing a LIB. 44 Figure 2-6. Trends in the number of patent applications in Sony. 46 Figure 2-7. Trends in the number of patent applications in Panasonic. 46 Figure 2-8. Level and timing of inflection in a diffusion trajectory. 49 Figure 2-9. Comparison of diffusion trajectories of simple logistic function. 51 Figure 2-10. Comparison of diffusion trajectories of bi-logistic function. 52 Figure 2-11. Diffusion trajectory of ‘Structure and Electrode’ in Sony. 53 Figure 2-12. Diffusion trajectory of ‘Structure and Electrode’ in Panasonic. 54 Figure 2-13. Comparison of the 1st wave between Sony and Panasonic. 55 Figure 2-14. Comparison of the 2nd wave between Sony and Panasonic. 56 Figure 2-15. Relations between IPC and FI about electrode. 58
9
Figure 2-16. Development of materials used in a cathode. 61 Figure 2-17. Trends in the number of patent applications of primary LIB. 71
Chapter III Figure 3-1. Schematic diagram of technology spillovers. 94 Figure 3-2. Matrix of technology spillovers in Sony. 102 Figure 3-3. Matrix of technology spillovers in Panasonic. 102 Figure 3-4. Patent map of diffusion process regarding simple material 105 Figure 3-5. Patent map of diffusion process regarding composite material. 106
Chapter IV
Figure 4-1. Composition of IPC relating to speaker technologies. 131 Figure 4-2. Trends in patent applications of LIB in JPO. 132 Figure 4-3. Trends in patent applications share of each simple technology. 138 Figure 4-4. Trends in patent applications share of each complex technology. 138 Figure 4-5. Trends in the diversification of electrode technology. 141
Chapter V Figure 5-1. Innovation dynamism of material technology. 153
Chapter VI
Figure 6-1. Trends in the number of joint patent applications with universities. 160
Figure 6-2. Relations between inventors and patents in Sony. 163 Figure 6-3. Relations between inventors and patents in Panasonic. 164 Figure 6-4. Two stages of technology spillover in Panasonic. 166 Figure 6-5. R&D management of material technology. 169

10
Chapter I Introduction
11
1.1 Innovation of material technology in an information society
Innovation is undoubtedly recognized as a significant driving force in sustaining economic growth. As emphasized in numerous studies, innovation of information technology (IT) can dramatically change socioeconomic structures such as people’s daily life, organizational activities, and society itself. Service innovations like Google and You Tube were built on the infrastructure of IT, and this IT infrastructure depends on the diffusion of electric device such as cellular phones and laptop PCs.
Most of these electric devices include a battery as a main energy device, and the
battery is a key component in the development of functionalities in an electric device. For instance, the development of batteries with high energy density make it possible to expand the functionality of cellular phones for not only talking and e-mail, but also one-seg, music player, TV phone, GPS, movie camera and others. Generally, energy is generated in an electrode, and technological performance of energy devices depends on the material characteristics used in an electrode. Thus, material innovation plays a significant role in driving the development of energy devices and the growth of IT infrastructure.
This fact suggests that material innovation has a strong relationship with the service
innovation in an information society. Material innovation has supported service innovation, and service innovation has boosted material innovation. Therefore, it is important to understand the mechanism of material innovation to survive in the world of mega competition.
The development of IT has accelerated the diffusion of digital equipment in the world since the early 1990s. With the diffusion of digital equipment, Lithium Ion Battery (LIB) market also expanded, because the LIB is an essential energy device which can provide higher energy density than other energy devices. Today, many products contain LIB, for example, cellular phones, laptop PCs, and PDAs (personal digital assistant) around the world. LIB was first put into practical use and released to the market by Sony in 1991, and since then Japanese firms have occupied the largest market share for the last 20 years. Therefore, we focus on the LIB innovation process as a model of material innovation, and analyze the development process of material technology used in an electrode in this study.
12
1.2 Lithium ion battery industry 1.2.1 Technological performance of LIB
Many kinds of digital equipment contain LIB as energy device, and the diffusion of digital equipment has accelerated the expansion of LIB market since the early 1990s. It is because lithium is capable of generating higher energy density than other elements such as nickel, alkaline, and manganese. LIB can be categorized into primary LIB and secondary LIB. Electric power is only discharged in a primary LIB, and it is discharged and recharged in a secondary LIB. The secondary LIB is used in most kinds of digital equipment to recharge energy. Technological characteristics of secondary LIB are summarized like follows. [Technological characteristics of secondary LIB]
1. Energy density can be generated higher than that of other batteries. 2. Usable duration per charge is longer than that of other batteries. 3. Memory effect is better than that of other batteries in recharging. 4. Charging capacity is hardly deteriorated with the duration of use. 5. Dendrites are hardly precipitated on the electrode. The material generally used in an anode is carbon, so that lithium has to be used as
the main material in a cathode to occur a chemical reaction between cathode and anode. This chemical reaction is considered as the fundamental in the functioning of LIB. The chemical reaction occurs on the electrodes, and then the transfer of lithium-ions on the electrode generates electric power.
The materials generally used in a cathode are lithium-metal oxides; lithium-cobalt
oxide (LiCoO2), lithium-nickel oxide (LiNiO2), and lithium-manganese oxide (LiMn2O4) are especially popular materials, because these materials are superior to other materials in terms of their potential characteristics and cycle characteristics (Ohzuku et al., 1995). These materials have been used in a cathode since the practical use of LIB started in 1991, and the same materials are still being used even now. These materials are essential for generating electric energy, therefore it can be said that the technological functionality of LIB depends on how characteristics of these cathode materials is developed. In this study, since the development of materials plays a significant role in driving the LIB innovation process, we focus on the development of cathode materials as a core technology in LIB.
13
1.2.2 Trends in LIB market in the world
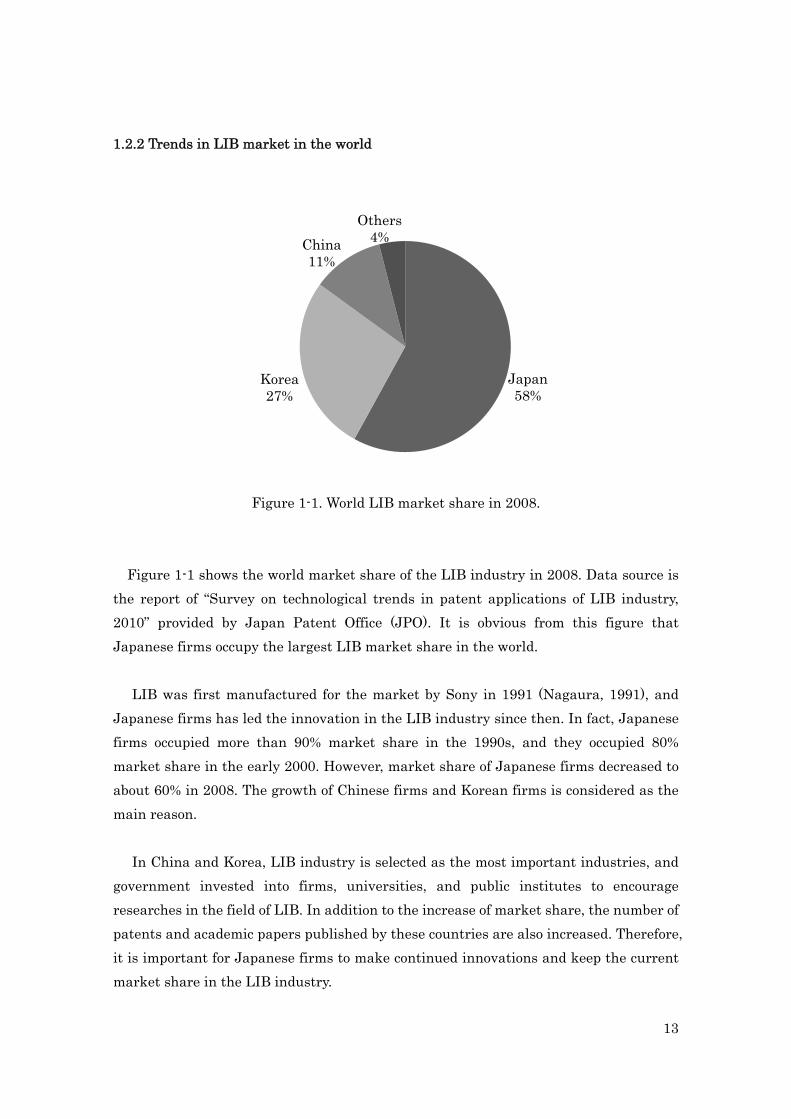
Figure 1-1. World LIB market share in 2008.
Figure 1-1 shows the world market share of the LIB industry in 2008. Data source is the report of “Survey on technological trends in patent applications of LIB industry, 2010” provided by Japan Patent Office (JPO). It is obvious from this figure that Japanese firms occupy the largest LIB market share in the world.
LIB was first manufactured for the market by Sony in 1991 (Nagaura, 1991), and Japanese firms has led the innovation in the LIB industry since then. In fact, Japanese firms occupied more than 90% market share in the 1990s, and they occupied 80% market share in the early 2000. However, market share of Japanese firms decreased to about 60% in 2008. The growth of Chinese firms and Korean firms is considered as the main reason.
In China and Korea, LIB industry is selected as the most important industries, and
government invested into firms, universities, and public institutes to encourage researches in the field of LIB. In addition to the increase of market share, the number of patents and academic papers published by these countries are also increased. Therefore, it is important for Japanese firms to make continued innovations and keep the current market share in the LIB industry.
Japan58%
Korea27%
China11%
Others4%
14
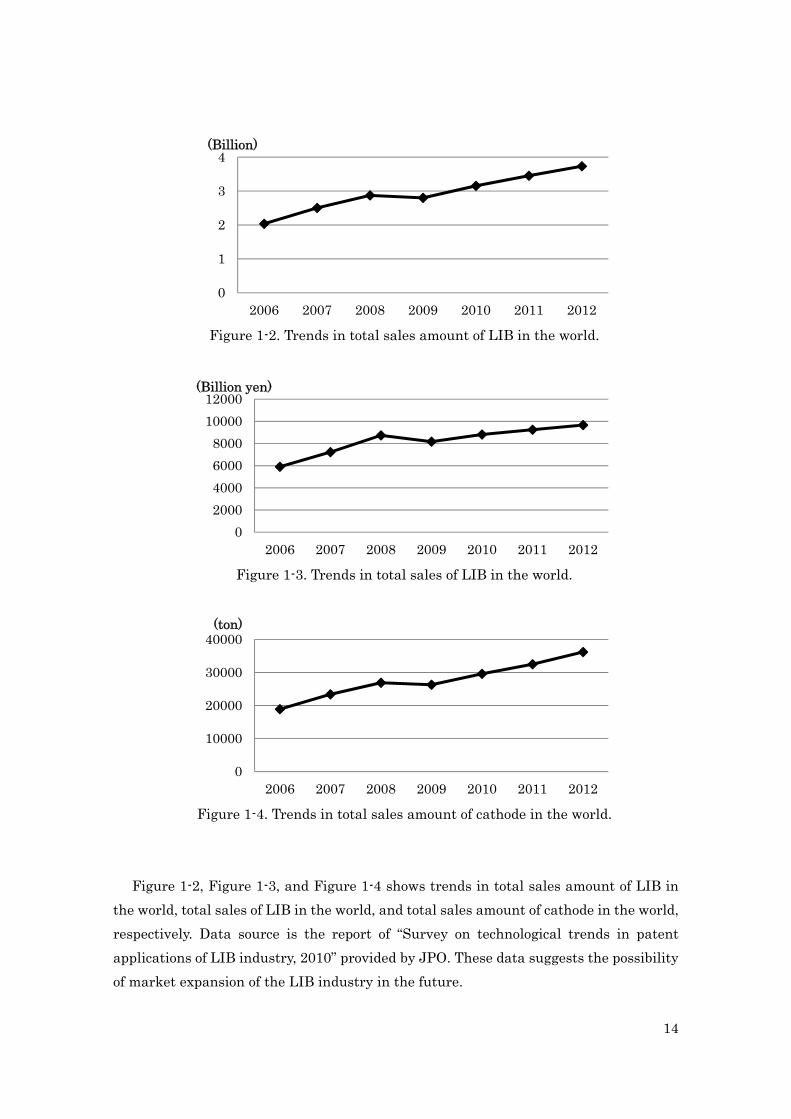
Figure 1-2. Trends in total sales amount of LIB in the world.
Figure 1-3. Trends in total sales of LIB in the world.
Figure 1-4. Trends in total sales amount of cathode in the world.
Figure 1-2, Figure 1-3, and Figure 1-4 shows trends in total sales amount of LIB in the world, total sales of LIB in the world, and total sales amount of cathode in the world, respectively. Data source is the report of “Survey on technological trends in patent applications of LIB industry, 2010” provided by JPO. These data suggests the possibility of market expansion of the LIB industry in the future.
0
1
2
3
4
2006 2007 2008 2009 2010 2011 2012
(Billion)
02000400060008000
1000012000
2006 2007 2008 2009 2010 2011 2012
(Billion yen)
0
10000
20000
30000
40000
2006 2007 2008 2009 2010 2011 2012
(ton)
15
1.2.3 Trends in domestic LIB market
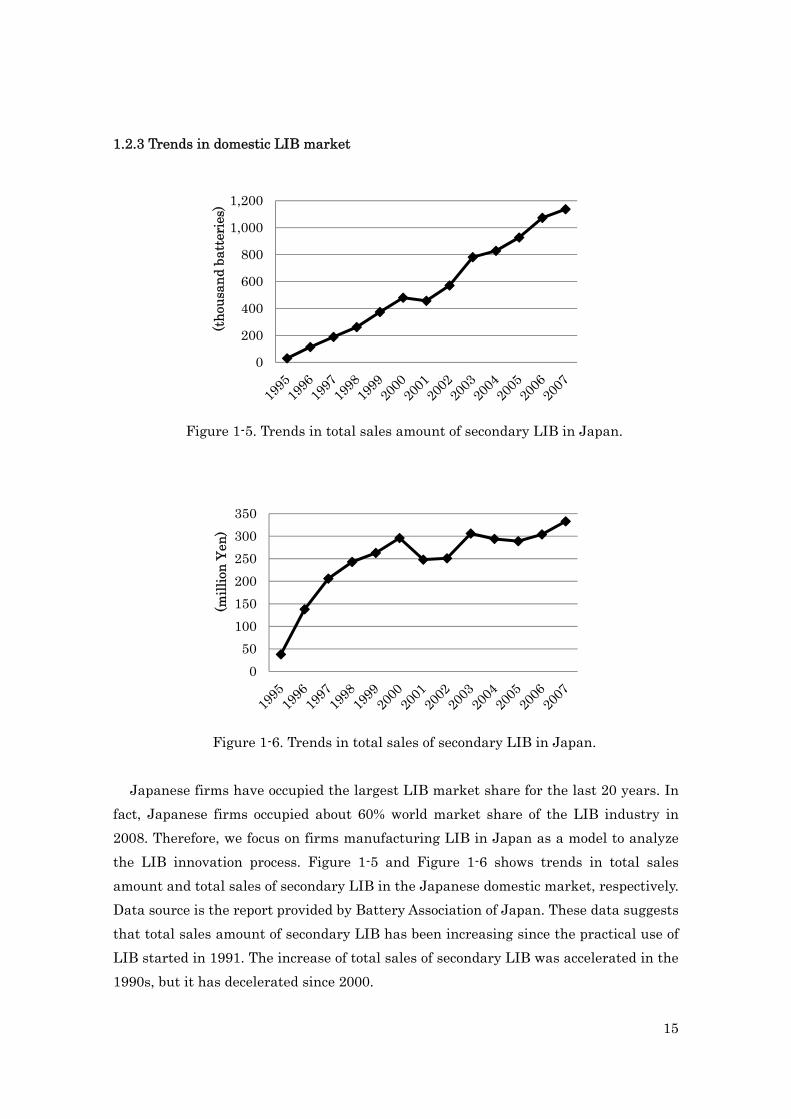
Figure 1-5. Trends in total sales amount of secondary LIB in Japan.
Figure 1-6. Trends in total sales of secondary LIB in Japan.
Japanese firms have occupied the largest LIB market share for the last 20 years. In
fact, Japanese firms occupied about 60% world market share of the LIB industry in 2008. Therefore, we focus on firms manufacturing LIB in Japan as a model to analyze the LIB innovation process. Figure 1-5 and Figure 1-6 shows trends in total sales amount and total sales of secondary LIB in the Japanese domestic market, respectively. Data source is the report provided by Battery Association of Japan. These data suggests that total sales amount of secondary LIB has been increasing since the practical use of LIB started in 1991. The increase of total sales of secondary LIB was accelerated in the 1990s, but it has decelerated since 2000.
0
200
400
600
800
1,000
1,200(t
hous
and
batt
erie
s)
050
100150200250300350
(mill
ion
Yen)
16
1.3 Trends in the number of patent applications in the LIB industry 1.3.1 Trends in the number of patent applications in Japan
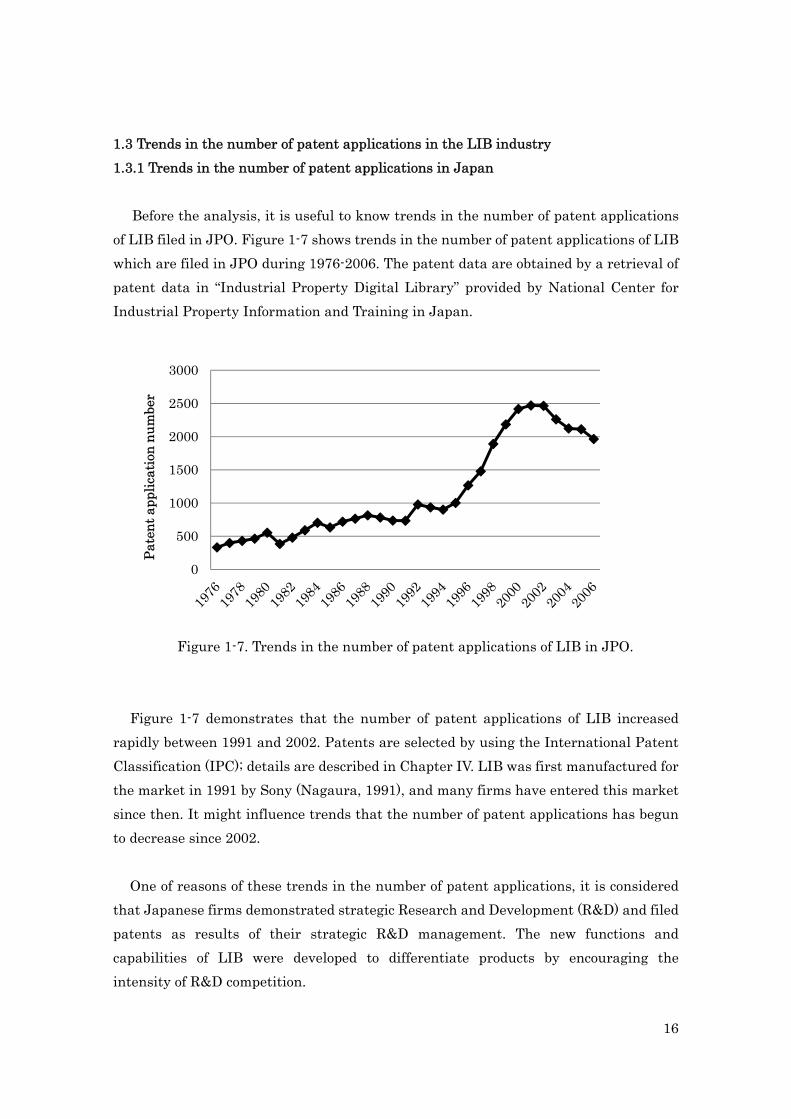
Before the analysis, it is useful to know trends in the number of patent applications
of LIB filed in JPO. Figure 1-7 shows trends in the number of patent applications of LIB which are filed in JPO during 1976-2006. The patent data are obtained by a retrieval of patent data in “Industrial Property Digital Library” provided by National Center for Industrial Property Information and Training in Japan.
Figure 1-7. Trends in the number of patent applications of LIB in JPO.
Figure 1-7 demonstrates that the number of patent applications of LIB increased rapidly between 1991 and 2002. Patents are selected by using the International Patent Classification (IPC); details are described in Chapter IV. LIB was first manufactured for the market in 1991 by Sony (Nagaura, 1991), and many firms have entered this market since then. It might influence trends that the number of patent applications has begun to decrease since 2002.
One of reasons of these trends in the number of patent applications, it is considered
that Japanese firms demonstrated strategic Research and Development (R&D) and filed patents as results of their strategic R&D management. The new functions and capabilities of LIB were developed to differentiate products by encouraging the intensity of R&D competition.
0
500
1000
1500
2000
2500
3000
Pate
nt a
pplic
atio
n nu
mbe
r
17
1.3.2 Trends in the number of patents and paper publications in each country
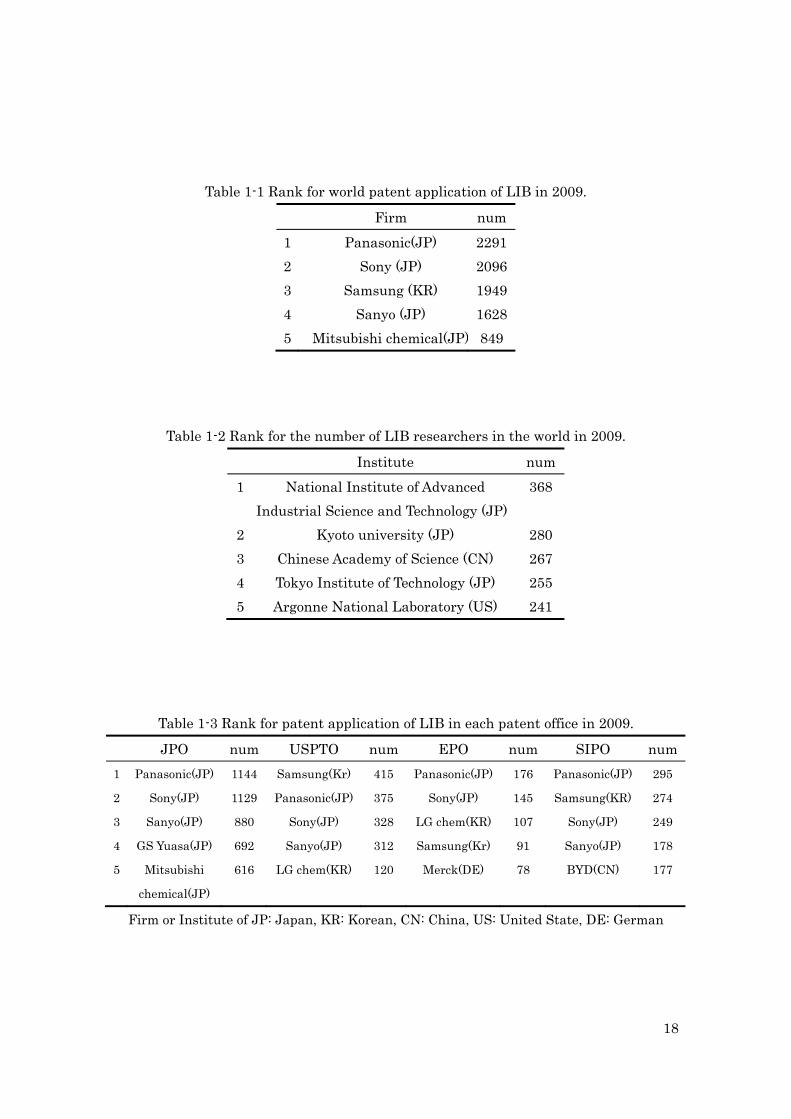
It is also useful to compare the world ranking about the number of patents and papers regarding LIB provided by firms, universities, and public institutes. Data source of Table 1-1, Table 1-2, and Table 1-3 is the report of “Survey on technological trends in patent applications of LIB industry, 2010” provided by JPO.
Table 1-1 shows world ranking about the number of patent applications of LIB in 2009. Table 1-1 demonstrates that four Japanese firms were ranked among the world’s top five firms. Panasonic took the first place, and Sony took the second one.
Table 1-2 shows world ranking about the number of researchers who published papers in journals regarding LIB which are selected by committee in JPO; for instance, Power Sources, Journal of the electrochemical society, Electrochemical acta and so on. Table 1-2 demonstrates that one Japanese public institute, National Institute of Advanced Industrial Science and Technology, took the first place. Additionally, two universities, Kyoto university and Tokyo Institute of Technology, took the second and fourth place, respectively.
Table 1-3 shows ranking about the number of patent applications of LIB which were filed in the four world patent offices in 2009; Japan Patent Office (JPO), United State Patent and Trademark Office (USPTO), European Patent Office (EPO), State Intellectual Property Office of China (SIPO). Table 1-3 demonstrates that Sony and Panasonic were ranked among the top three firms in every patent office. Panasonic took the first place in Japan, Europe, and China. This table suggests that Sony and Panasonic have some effective R&D system for leading the innovation. Therefore, we focus on the LIB department in Sony and Panasonic.
These data suggest that Japanese firms conduct strategic R&D management, which contribute to increase the number of patent applications. It also can be said that the level of basic research conducted in Japanese universities and public institutes are much advanced in the world.
In this study, we focus on the Japanese top two leading firms, Sony and Panasonic,
and compare the LIB innovation process by analyzing patent data filed by these two firms.
18
Table 1-1 Rank for world patent application of LIB in 2009.
Firm num1 Panasonic(JP) 22912 Sony (JP) 20963 Samsung (KR) 19494 Sanyo (JP) 16285 Mitsubishi chemical(JP) 849
Table 1-2 Rank for the number of LIB researchers in the world in 2009.
Table 1-3 Rank for patent application of LIB in each patent office in 2009.
JPO num USPTO num EPO num SIPO num1 Panasonic(JP) 1144 Samsung(Kr) 415 Panasonic(JP) 176 Panasonic(JP) 295
2 Sony(JP) 1129 Panasonic(JP) 375 Sony(JP) 145 Samsung(KR) 274
3 Sanyo(JP) 880 Sony(JP) 328 LG chem(KR) 107 Sony(JP) 249
4 GS Yuasa(JP) 692 Sanyo(JP) 312 Samsung(Kr) 91 Sanyo(JP) 178
5 Mitsubishi
chemical(JP)
616 LG chem(KR) 120 Merck(DE) 78 BYD(CN) 177
Firm or Institute of JP: Japan, KR: Korean, CN: China, US: United State, DE: German
Institute num1 National Institute of Advanced
Industrial Science and Technology (JP)368
2 Kyoto university (JP) 280 3 Chinese Academy of Science (CN) 267 4 Tokyo Institute of Technology (JP) 255 5 Argonne National Laboratory (US) 241
19
1.4 Technological structure of LIB 1.4.1 Composition of LIB
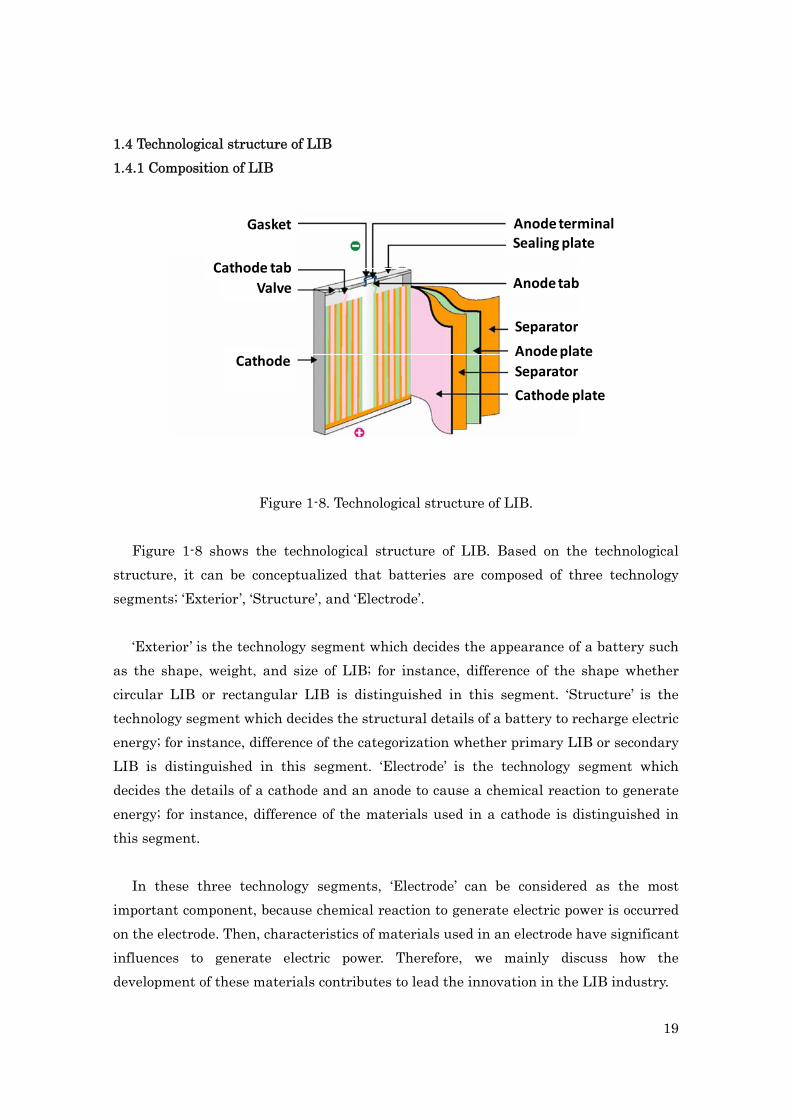
Figure 1-8. Technological structure of LIB.
Figure 1-8 shows the technological structure of LIB. Based on the technological structure, it can be conceptualized that batteries are composed of three technology segments; ‘Exterior’, ‘Structure’, and ‘Electrode’.
‘Exterior’ is the technology segment which decides the appearance of a battery such
as the shape, weight, and size of LIB; for instance, difference of the shape whether circular LIB or rectangular LIB is distinguished in this segment. ‘Structure’ is the technology segment which decides the structural details of a battery to recharge electric energy; for instance, difference of the categorization whether primary LIB or secondary LIB is distinguished in this segment. ‘Electrode’ is the technology segment which decides the details of a cathode and an anode to cause a chemical reaction to generate energy; for instance, difference of the materials used in a cathode is distinguished in this segment.
In these three technology segments, ‘Electrode’ can be considered as the most
important component, because chemical reaction to generate electric power is occurred on the electrode. Then, characteristics of materials used in an electrode have significant influences to generate electric power. Therefore, we mainly discuss how the development of these materials contributes to lead the innovation in the LIB industry.
Cathode plate
Separator
Separator
Anode plate
Anode tabCathode tab
Cathode
Valve
Gasket Anode terminalSealing plate
20
1.4.2 Composition of electrode
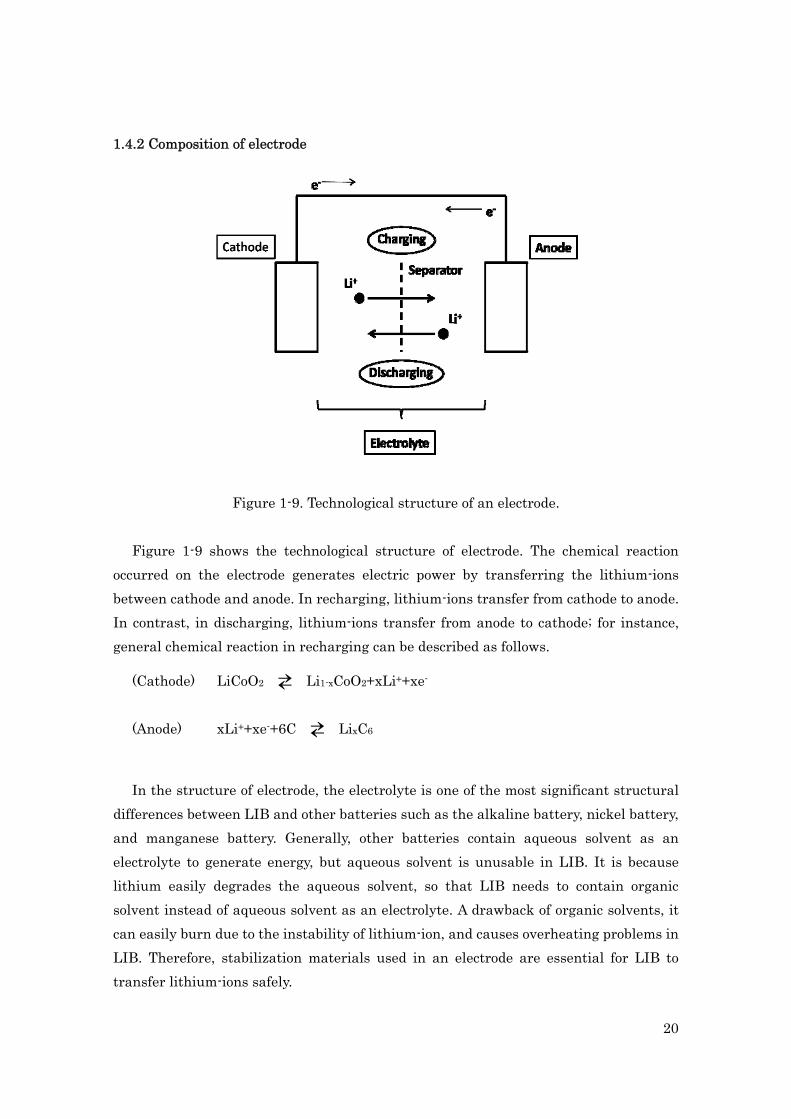
Figure 1-9. Technological structure of an electrode.
Figure 1-9 shows the technological structure of electrode. The chemical reaction
occurred on the electrode generates electric power by transferring the lithium-ions between cathode and anode. In recharging, lithium-ions transfer from cathode to anode. In contrast, in discharging, lithium-ions transfer from anode to cathode; for instance, general chemical reaction in recharging can be described as follows.
(Cathode) LiCoO2 ⇄ Li1-xCoO2+xLi++xe-
(Anode) xLi++xe-+6C ⇄ LixC6
In the structure of electrode, the electrolyte is one of the most significant structural
differences between LIB and other batteries such as the alkaline battery, nickel battery, and manganese battery. Generally, other batteries contain aqueous solvent as an electrolyte to generate energy, but aqueous solvent is unusable in LIB. It is because lithium easily degrades the aqueous solvent, so that LIB needs to contain organic solvent instead of aqueous solvent as an electrolyte. A drawback of organic solvents, it can easily burn due to the instability of lithium-ion, and causes overheating problems in LIB. Therefore, stabilization materials used in an electrode are essential for LIB to transfer lithium-ions safely.
21
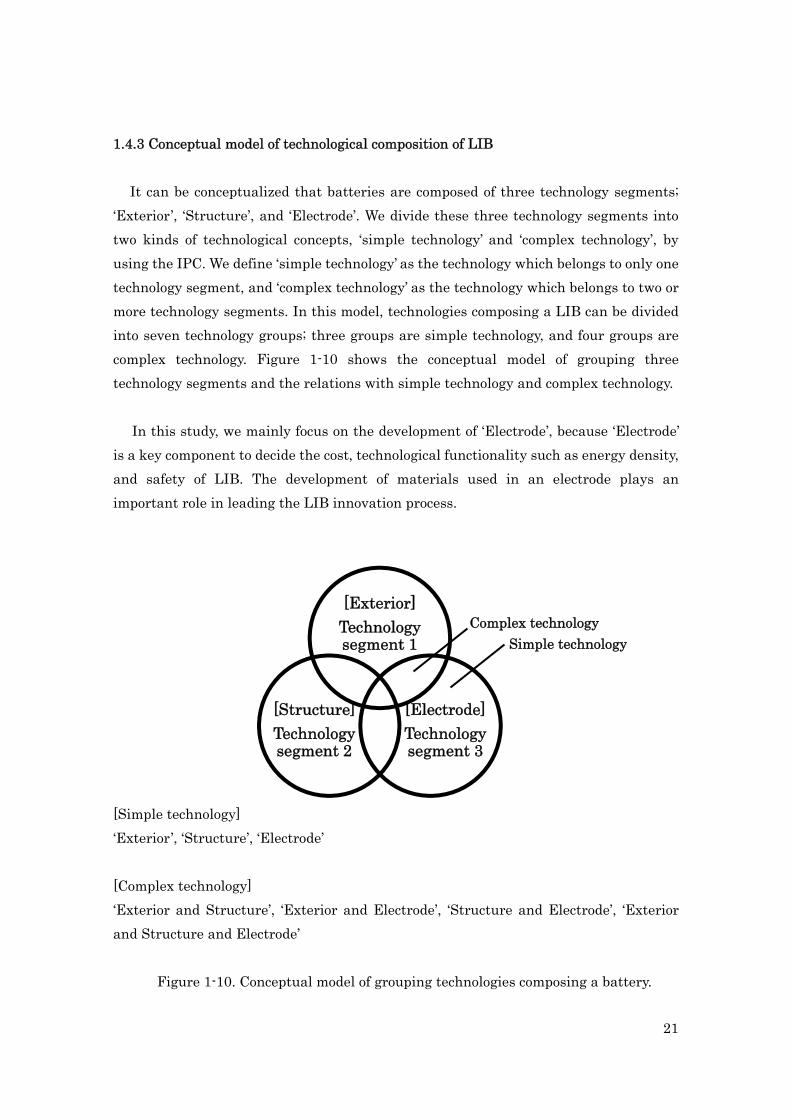
1.4.3 Conceptual model of technological composition of LIB
It can be conceptualized that batteries are composed of three technology segments; ‘Exterior’, ‘Structure’, and ‘Electrode’. We divide these three technology segments into two kinds of technological concepts, ‘simple technology’ and ‘complex technology’, by using the IPC. We define ‘simple technology’ as the technology which belongs to only one technology segment, and ‘complex technology’ as the technology which belongs to two or more technology segments. In this model, technologies composing a LIB can be divided into seven technology groups; three groups are simple technology, and four groups are complex technology. Figure 1-10 shows the conceptual model of grouping three technology segments and the relations with simple technology and complex technology.
In this study, we mainly focus on the development of ‘Electrode’, because ‘Electrode’ is a key component to decide the cost, technological functionality such as energy density, and safety of LIB. The development of materials used in an electrode plays an important role in leading the LIB innovation process.
[Simple technology] ‘Exterior’, ‘Structure’, ‘Electrode’ [Complex technology] ‘Exterior and Structure’, ‘Exterior and Electrode’, ‘Structure and Electrode’, ‘Exterior and Structure and Electrode’
Figure 1-10. Conceptual model of grouping technologies composing a battery.
[Exterior]Technology segment 1
[Electrode]Technology segment 3
[Structure]Technology segment 2
Complex technology Simple technology
22
1.5 Development of material technology in LIB 1.5.1 Development of energy density
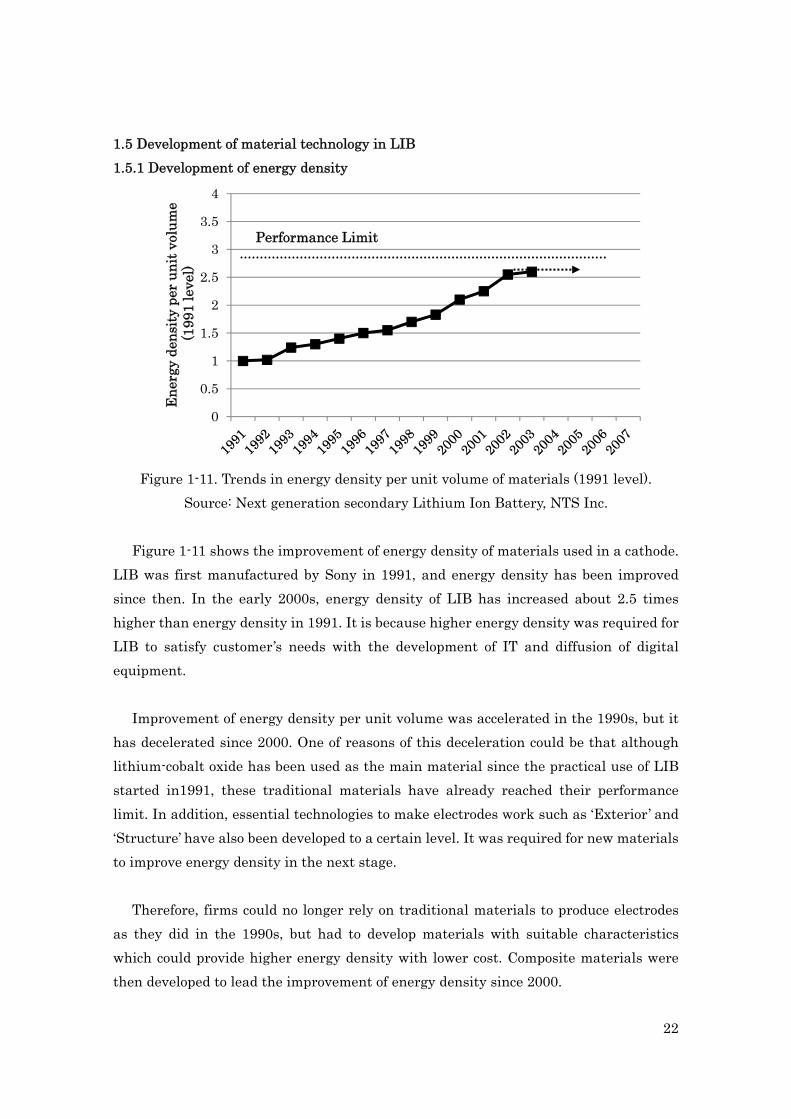
Figure 1-11. Trends in energy density per unit volume of materials (1991 level).
Source: Next generation secondary Lithium Ion Battery, NTS Inc.
Figure 1-11 shows the improvement of energy density of materials used in a cathode. LIB was first manufactured by Sony in 1991, and energy density has been improved since then. In the early 2000s, energy density of LIB has increased about 2.5 times higher than energy density in 1991. It is because higher energy density was required for LIB to satisfy customer’s needs with the development of IT and diffusion of digital equipment.
Improvement of energy density per unit volume was accelerated in the 1990s, but it
has decelerated since 2000. One of reasons of this deceleration could be that although lithium-cobalt oxide has been used as the main material since the practical use of LIB started in1991, these traditional materials have already reached their performance limit. In addition, essential technologies to make electrodes work such as ‘Exterior’ and ‘Structure’ have also been developed to a certain level. It was required for new materials to improve energy density in the next stage.
Therefore, firms could no longer rely on traditional materials to produce electrodes
as they did in the 1990s, but had to develop materials with suitable characteristics which could provide higher energy density with lower cost. Composite materials were then developed to lead the improvement of energy density since 2000.
0
0.5
1
1.5
2
2.5
3
3.5
4E
nerg
y de
nsity
per
uni
t vol
ume
(199
1 le
vel)
Performance Limit
23
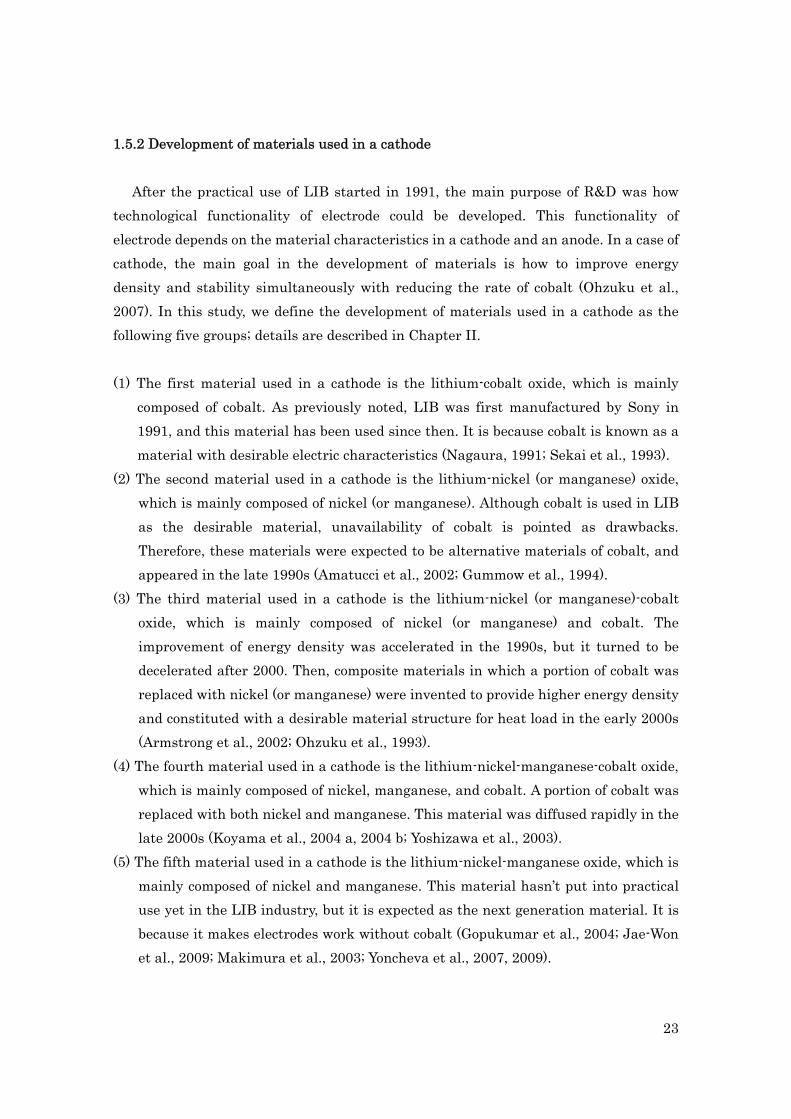
1.5.2 Development of materials used in a cathode After the practical use of LIB started in 1991, the main purpose of R&D was how
technological functionality of electrode could be developed. This functionality of electrode depends on the material characteristics in a cathode and an anode. In a case of cathode, the main goal in the development of materials is how to improve energy density and stability simultaneously with reducing the rate of cobalt (Ohzuku et al., 2007). In this study, we define the development of materials used in a cathode as the following five groups; details are described in Chapter II. (1) The first material used in a cathode is the lithium-cobalt oxide, which is mainly
composed of cobalt. As previously noted, LIB was first manufactured by Sony in 1991, and this material has been used since then. It is because cobalt is known as a material with desirable electric characteristics (Nagaura, 1991; Sekai et al., 1993).
(2) The second material used in a cathode is the lithium-nickel (or manganese) oxide, which is mainly composed of nickel (or manganese). Although cobalt is used in LIB as the desirable material, unavailability of cobalt is pointed as drawbacks. Therefore, these materials were expected to be alternative materials of cobalt, and appeared in the late 1990s (Amatucci et al., 2002; Gummow et al., 1994).
(3) The third material used in a cathode is the lithium-nickel (or manganese)-cobalt oxide, which is mainly composed of nickel (or manganese) and cobalt. The improvement of energy density was accelerated in the 1990s, but it turned to be decelerated after 2000. Then, composite materials in which a portion of cobalt was replaced with nickel (or manganese) were invented to provide higher energy density and constituted with a desirable material structure for heat load in the early 2000s (Armstrong et al., 2002; Ohzuku et al., 1993).
(4) The fourth material used in a cathode is the lithium-nickel-manganese-cobalt oxide, which is mainly composed of nickel, manganese, and cobalt. A portion of cobalt was replaced with both nickel and manganese. This material was diffused rapidly in the late 2000s (Koyama et al., 2004 a, 2004 b; Yoshizawa et al., 2003).
(5) The fifth material used in a cathode is the lithium-nickel-manganese oxide, which is mainly composed of nickel and manganese. This material hasn’t put into practical use yet in the LIB industry, but it is expected as the next generation material. It is because it makes electrodes work without cobalt (Gopukumar et al., 2004; Jae-Won et al., 2009; Makimura et al., 2003; Yoncheva et al., 2007, 2009).
24
(5) 5th material: LiNixMnyO2
(4) 4th material: LiNixMnyCozO2
(3) 3rd material: LiNixCoyO2, LiMnxCoyO4
(2) 2nd material: LiNixO2, LiMnxO4
(1) 1st material: LiCoxO2
Low High Energy density
(1) 1st material: lithium-cobalt oxide (2) 2nd material: lithium-nickel (or manganese) oxide (3) 3rd material: lithium-nickel (or manganese)-cobalt oxide (4) 4th material: lithium-nickel-manganese-cobalt oxide (5) 5th material: lithium-nickel-manganese oxide Figure 1-12. Development of materials used in a cathode.
Based on this material classification, Figure 1-12 shows the development process of materials defined as 1st ~ 5th materials. The main goal in the development of materials is how to invent composite materials with high energy density and stability simultaneously with reducing the rate of cobalt.
In this classification of materials, 1st and 2nd materials can be called ‘simple material’,
which is mainly composed of only one element other than lithium and oxygen. In contrast, 3rd, 4th, and 5th materials can be called ‘composite material’, which is mainly composed of two or more elements other than lithium and oxygen.
Hig
h
Reducing cobalt
Compositematerials
Stab
ility
Lo
w
Simple materials
25
1.6 Previous works Many studies demonstrated that technology spillover could play an important role in
leading innovations. As Griliches (1979) suggested, the level of productivity achieved by one firm or industry depends on not only its own R&D efforts but also general knowledge spilled over from other firms and industries.
Additionally, many papers discussing the significant role of technology spillover to
encourage the development of technologies have been published. For example, technology spillover has influences on R&D strategy (Watanabe et al., 2001). Firms with a well-developed assimilation capacity succeeded in effectively utilizing of technology spillover (Watanabe et al., 2002). The importance of relationships between university and industry in the management of basic researches has been discussed (Audretsch and Lehmann, 2005; Kelly and Nakosteen, 2005; Tanabe and Watanabe, 2005; Millson and Wielmon, 2006). Cross-functional spillover could be a survival strategy for ceramics industry (Ohmura et al., 2005). The differences of firm’s size are one of important factors for technology spillovers (Ornaghi, 2006). Furthermore, other studies also demonstrated that technology developments could be attributed to technology spillover (Griliches and Lichtenberg, 1984; Jaffe, 1986; Bernstein and Nadiri, 1988, 1989; Goto and Suzuki, 1989; Kwang and Watanabe, 2001; Nakanishi, 2002; Watanabe and Ane, 2003; Watanabe and Tokumasu, 2003; Nieto and Quevedo, 2005). However, most of these studies mainly discussed mechanism of technology spillover between firms.
As Geroski (1995) suggested, since the process of technology spillover depends on the maturity of technologies, industrial features and technological characteristics should be taken into consideration when we discuss the technology spillover. Therefore, we focus on how such features and characteristics can be reflected into the analysis of technology spillover in this study.
Two-dimensional technology spillover mechanism is introduced, and the role of technology spillover is discussed from two aspects in this study, organizational point of view and technological point of view. Combining these two types of technology spillovers, we classify technology spillover into four types; (1) intra-firm, intra-technology spillover, (2) intra-firm, inter-technology spillover, (3) inter-firm, intra-technology spillover, (4) inter-firm, inter-technology spillover. Based on this model, we discuss the technology spillover not only between firms but also between technologies.
26
In this study, we focus on the significant role of LIB in an information society, because LIB is used in digital equipments as the main energy device such as cellular phones, laptop PCs, digital cameras and so on. Since Japanese firms has occupied the largest market share and filed the largest number of patent applications in the world since the practical use of LIB started, the LIB industry in Japan can be an excellent case study in analyzing the LIB innovation process.
In a mature economy, new finding of materials plays a significant role in driving
innovations. In fact, material technology has supported service and device innovations in incorporating new functions into new devices. It can be said that the functionality in digital equipments depends on the characteristics of cathode materials. For instance, improvement of energy density of cathode materials makes it possible to expand the functionality of cellular phones for not only talking and e-mail but also one-seg, music player, TV phone, GPS, movie camera and others. Therefore, it is important to understand the mechanism of material innovation.
Some papers suggested that technology spillover plays a significant role in driving the development of materials. For instance, the effect of technology spillover in fine ceramics industry was analyzed (Ohmura et al., 2003, 2006). The effect of technology spillover in the nonferrous metal industry was also analyzed (Nakagawa et al., 2007, 2009). We observed the technology spillover effect in the acoustic industry and suggested that the development of material technology was a key to improve the functionalities in a product (Shibata and Saiki, 2009). Thus, on the aspect of technology spillover, the importance of how to innovate materials were discussed so far. Therefore, we mainly focus on following points in this study.
i) How development of material technology has contributed to drive the diffusion of innovation in the LIB industry in Chapter II.
ii) How development of material technology has contributed to encourage the
technology spillover among technologies composing a LIB in Chapter III. iii) How development of material technology has contributed to advance the
diversification of technologies in the LIB innovation process in Chapter IV.
27
1.7 Structure of the dissertation
In Chapter I, background of this study is introduced; market trends in the LIB industry, technological structure of LIB, technological characteristics of materials, and the relations between previous works and this study are noted.
In Chapter II, trends in diffusion trajectories of electrode technology are analyzed between leading two firms in Japan, Sony and Panasonic. Numerical analysis is conducted by utilizing the bi-logistic function model based on patent data. The development of cathode materials is classified into five groups by the combination of elements, and the timing of when patents of these cathode materials are obtained by these firms is compared.
In Chapter III, based on the results in Chapter II, trends in technology spillover in Sony and Panasonic are analyzed on the aspect of organizational point of view and technological point of view as a case study. The changes of technology spillover structure are compared based on the patents obtained by these firms. In this analysis, we focus on the development process of simple materials and composite materials in these firms by observing the references to patents.
In Chapter IV, based on the results in Chapter III, trends in the diversification process of electrode technology are analyzed by focusing on the combination of IPC of patents filed in JPO. Technologies composing a LIB are grouped into simple technology and complex technology by using the IPC, and technologies composing a LIB are classified into seven technology groups. We compare the number of patent applications among seven technology groups to analyze the contribution of each technology group for innovation, and demonstrate a multiple regression analysis to investigate the most influential technology group leading the LIB innovation process.
In Chapter V, new findings in each chapter are summarized. Finally, as a total
conclusion of this study, it is suggested that technologies composing a LIB have diversified with the development of material technology in the LIB innovation process.
In Chapter VI, R&D management in Panasonic is discussed as addendum. It is
considered that ‘cross-industrial associations’ and ‘platform structure’ in R&D system can contribute to promote the technological integrations.
28
References Amatucci, G and Tarascon, J.M. (2002), “Optimization of Insertion Compounds Such as
LiMn2O4 for Li-Ion Batteries”, J. lectrochem. Soc, 149(12), pp. K31-K46. Armstrong, A.R., Paterson, A.J., Robertson, A.D., Bruce, P.G. (2002) “Nonstoichiometric
Layered LixMnyO2 with a High Capacity for Lithium Intercalation/Deintercalation”, Chemistry of Materials, 14 , pp. 710-719.
Audretsch, D. B., Lehmann, E.E. (2005). “Does the knowledge spillover theory of entrepreneurship” hold for regions ?”, Research Policy, 34, pp. 1191-1201.
Bernstein, J.I., Nadiri, M.I. (1988). “Interindustry R&D spillovers: rates of return, and production in high-tech industries”, The American Economic Review, 78 (2), pp. 9–434.
Bernstein, J.I., Nadiri, M.I. (1989). “Research and development and intra-industry spillovers: an empirical application of dynamic duality”, Review of Economic Studies, 56, pp. 249–269.
Geroski, P. (1995). “Markets for Technology: Knowledge, Innovation, and Appropriability, Stoneman”, Handbook of the Economic Innovation and technological Change, p.90.
Gopukumar, S., Kyung Yoon, C., Kwang Bum, K. (2004). “Novel synthesis of layered LiNi1/2Mn1/2O2 as cathode material for lithium rechargeable cells”, Electrochimica Acta, 49(5), pp. 803-810.
Goto, A., Suzuki, K. (1989). “R&D Capital, rate of return on R&D investment and spillover of R&D in Japanese manufacturing industries”, Review of Economics and Statistics, 71 (4), pp. 555–564.
Griliches, Z. (1979). “Issues in Assessing the Contribution of R&D to Productivity Growth”, Bell Journal of Economics, 10, p.92 .
Griliches, Z., Lichtenberg, F. (1984). “Inter-industry technology flows and productivity growth: a reexamination”, Review of Economics and Statistics, 66 (2), pp. 324–329.
Gummow, R.J., de Kock, A., Thackeray, M.M. (1994). “Improved capacity retention in rechargeable 4 V lithium/lithium-manganese oxide (spinel) cells”, Solid State Ionics, 69(1), pp. 59-67.
Jae-Won, L., Sun-Min, P., Hae-Jin, K. (2009). “Effect of LiNi1/2Mn1/2O2 coating on the electrochemical performance of Li–Mn spinel”, Electrochemistry Communications, 11(6), pp. 1101-1104.
Jaffe, A.B. (1986). “Technological opportunity and spillovers of R&D: evidence from
29
firms patents, profits and market value”, American Economic Review, 76 (5), pp. 984–1001.
Japan Patent Office (2010). “Survey on technological trends in patent applications (fiscal year 2009): Lithium Ion Battery”, Japan Patent Office, Tokyo.
Japanese government, “The second science and technology basic plan”, 2001. Japanese government, “The third science and technology basic plan”, 2006. Kelly, D. J., Nakosteen, R. A. (2005). “Technology resources, alliances, and sustained
growth in new, technology based-firms”, IEEE Transactions on Engineering Management, 52 (3), pp. 292-300.
Koyama, Y., Yabuuchi, N., Tanaka, I., Adachi, H., Ohzuku, T. (2004 a). “Solid-State Chemistry and Electrochemistry of LiCo1/3Ni1/3Mn1/3O2 for Advanced Lithium-Ion Batteries”, J. Electrochem. Soc, 151(10), pp. A1545-A1551.
Koyama, Y., Makimura, Y., Tanaka, I., Adachi, H., Ohzuku, T. (2004 b). “Systematic Research on Insertion Materials Based on Superlattice Models in a Phase Triangle of LiCoO2-LiNiO2-LiMnO2”, J. Electrochem. Soc, 151(9), pp. A1499-A1506.
Kwang, I.H., Watanabe, C. (2001). “Unintentional technology spillover between two sectors: kinetic approach”, Technovation, 21, pp. 227–235.
Makimura, Y., Ohzuku, T. (2003). “Lithium insertion material of LiNi1/2Mn1/2O2 for advanced lithium-ion batteries”, Journal of Power Sources, 119-221, p.156.
Millson, M.R., Wielmon, D. (2006). “Driving new product success in the electrical equipment manufacturing industry”, Technovation, 26, pp. 1268–1286.
Nagaura, T. (1991). Prog. Batteries Solar Cells, 10, p.209. Nakagawa, M., Watanabe, C. (2007). “Moving beyond organizational inertia as a
survival strategy for resources-based industry in a service-oriented economy: lessons from cross-sector technology spillover in the nonferrous metal industry”, Journal of Service Research, 7(1), pp. 7-35.
Nakagawa, M., Watanabe, C., Griffy-Brown, C. (2009). “Changes in the technology spillover structure due to economic paradigm shifts: A driver of the economic revival in Japan’s materials industry beyond the year 2000”, Technovation, 29, pp. 5-22.
Nakanishi, Y. (2002). “Empirical evidence of inter-industry R&D spillover in Japan”, Journal of Economic Research, 7, pp. 91–94.
NTS Inc, Next generation secondary Lithium Ion Battery. NTS Inc, Tokyo. Nieto, M., Quevedo, P. (2005). “Absorptive capacity, technological opportunity,
knowledge spillovers, and innovative effort”, Technovation, 25, pp. 1141–1157.
30
Ohmura, A., Ouchi, N., Morisaki, S., Watanabe, C. (2003). “Functionality development as a survival strategy for fine ceramics”, Technovation, 23 (10), pp. 833–842.
Ohmura, A., Watanabe, C. (2005). “Inside the black box of cross-functional spillover: a lesson from the functionality development of fine ceramics”, Journal of Advances in Management Research, 2 (2), pp. 7–23.
Ohmura, A., Watanabe, C. (2006). “Cross-products technology spillover in inducing a self-propagating dynamism for the shift to a service oriented economy: lessons from high-performance fine ceramics”, Journal of Services Research, 6 (2), pp. 145–159.
Ohzuku, T., Ueda, A., Nagayama, M., Iwakoshi, Y., Komori, H. (1993). “Comparative study of LiCoO2, LiNi 1/2Co1/2O2 and LiNiO2 for 4 volt secondary lithium cells”, Electrochima Acta, 38, pp. 1159-1167.
Ohzuku, T., Ueda, A., Yamamoto, N., Iwakoshi, Y. (1995). “Factor affecting the capacity retention of lithium-ion cells”, Journal of Power Sources, 54, p.99.
Ohzuku, T., Brodd, R. (2007). “An overview of positive-electrode materials for advanced lithium-ion batteries”, Journal of Power sources, 174, p.449.
Ornaghi, C. (2006). “Spillovers in product and process innovation: evidence from manufacturing firms”, International Journal of Industrial Organization, 24, pp. 349-380.
Sekai, K., Azuma, H., Omaru, A., Fujita, S., Imoto, H., Endo, T., Yamaura, K., Nishi, Y. (1993). “Lithium-ion rechargeable cells with LiCoO, and carbon electrodes”, Journal of Power Sources, 43-44, pp. 241-244.
Shibata, Y., Saiki, T. (2009). “The dynamics of Knowledge Spillover for functionality development in Japanese Acoustic Equipment”. [CD-ROM]. VIPSI-Amalfi, VIPSI 2009 conference.
Tanabe, K., Watanabe, C. (2005). “Soft policy instruments for inducing industrial innovation in a service oriented economy: a comparative analysis of the vision system and university system”, Journal of services research, 5 (1), pp. 123-154.
Watanabe, C., Ane, B.K. (2003). “Co-evolution of manufacturing and service industry functions”, Journal of Services Research, 3 (1), pp. 110–118.
Watanabe, C., Takayama, M., Nagamatsu, A., Tagami, T. (2002). “Technology spillover as a complement for high-level R&D intensity in the pharmaceutical industry”, Technovation, 22 (4), pp. 245-258.
Watanabe, C., Tokumasu, S. (2003). “Optimal timing of R&D for effective utilization of potential resources in innovation”, Journal of Advances in Management Research, 1 (1), pp. 11–27.
31
Watanabe, C., Zhu, B., Griffy-Brown, C., Asgari, B. (2001). “Global technology spillover of and its impact on industry’s R&D strategies”, Technovation, 21, pp. 281-291.
Yoncheva, M., Stoyanova, R., Zhecheva, E., Alcántara, R., Ortiz, G., Tirado, J. L. (2007). “Effect of the high pressure on the structure and intercalation properties of lithium–nickel–manganese oxides Original Research Article”, Journal of Solid State Chemistry, 180( 6), pp. 1816-1825.
Yoncheva, M., Stoyanova, R., Zhecheva, E., Alcántara, R., Ortiz, G., Tirado, J. L. (2009). “Electrochemical performance and local cationic distribution in layered LiNi1/2Mn1/2O2 electrodes for lithium ion batteries Original Research Article”, Electrochimica Acta, 54(6), pp. 1694-1701.
Yoshizawa, H and Ohzuku, T. (2003). “Prismatic Lithium-Ion Batteries of LiCo1/3Ni 1/3Mn1/3O2 with Graphite”, Electrochemistry, 71, pp. 1177–1181.
32
Chapter II Diffusion of Innovation
in the Lithium Ion Battery Industry: Comparative Analysis between
Sony and Panasonic
33
Abstract In this Chapter II, diffusion of innovation regarding the Lithium Ion Battery (LIB) is
analyzed by using patent data. We compare trends in patent applications of electrode technology between Sony and Panasonic. First, diffusion trajectories of electrode technology in Sony and Panasonic are compared. Numerical analysis is conducted by utilizing the bi-logistic function model and patent data which is grouped by International Patent Classification (IPC). Next, we classify the development of materials used in a cathode into five groups, and compare chronologies of material patents obtained by Sony and Panasonic.
On the basis of observation of patent statistics, it was revealed that their diffusion trajectories of electrode technology had two waves, and Panasonic succeeded in prompt undertaking in the 2nd wave on their diffusion trajectory. It was also revealed that Panasonic obtained patents of composite materials earlier than Sony. In conclusion, the results show that Panasonic’s prompt undertaking in the 2nd wave earlier than Sony was initiated by the development of composite materials. Key words Cathode materials; Diffusion of innovation; International patent classification; Lithium ion battery; Patent.
34
2.1 Introduction
The development of new technologies is undoubtedly recognized as a significant driving force in sustaining economic growth. As emphasized in numerous studies, the development of information technology (IT) is a driving force transforming the existing socioeconomic structure by permeating people’s daily life, organizational activities, and society itself (Ruttan, 2001; Cairncross, 1997).
As introduced in Chapter I, with the development of IT and diffusion of digital
equipment, Lithium Ion Battery (LIB) market also expanded, because LIB is required as an essential energy device which can provide high energy density. In the LIB industry, Japanese firms have occupied the largest market share for the last 20 years since the practical use of LIB started in1991. Therefore, we focus on the LIB innovation process of Japanese two leading firms, Sony and Panasonic. 2.1.1 Diffusion of Innovation
Research on the diffusion of innovation has been undertaken in many previous studies. Rogers (1962) attempted to systematize these works in his pioneer work in “Diffusion of Innovations”. In his research, Diffusion is defined as “the process by which an innovation is communicated through certain channels over time among the members of a social system”. It is also suggested that there are four main elements in the diffusion of innovations; innovation features, communication channels, time, and social system. All of Rogers’ postulates support the contention that technological functionality can be developed during the diffusion process.
Following this work, it is pointed that adopters who adopt earlier than others are
likely to have more gain from the use of products and hence have a greater usage propensity. Additionally, adoption of complex products such as personal computers depends on buyers’ ability to develop new knowledge and new patterns of experiences (Mahajan et al., 1990).
Griliches (1957) noted that diffusion process is actually quite similar to the contagion
process of epidemic disease, and it can be exhibited as S-shaped growth. Verhulst (1845) first introduced the simple logistic growth function as an epidemic function to model the
35
diffusion process. In a number of previous studies, this logistic growth function has proved to be useful in modeling the wide range of innovation processes, so that this epidemic function is used in analyzing the diffusion process of innovations (Meyer and Ausbel, 1999; Modis, 1992).
Meyer (1994) extended the analysis of this simple logistic growth function to cases
where dual processes operate by referring to an example when cars first replaced the population of horses, but then took on a further diffusion trajectory of their own. He postulated bi-logistic function model in an attempt to deal with the diffusion process containing complex growth processes which were not well modeled by the single logistic growth function. The bi-logistic function model is utilized in tracing a diffusion trajectory initiated by two co-existing innovations, and it is generally postulated that growth patterns of successive innovations are sum of successive simple logistic growth function models.
Anderson (1999) demonstrated that technological growth also follows an S-shaped
growth curve, and the logistic growth functions are an appropriate approximation to describe the path of evolution by using accumulated patent stock. It is also suggested that the development of functionality plays a significant role in driving the diffusion of innovation.
Additionally, contribution of technology spillover to the technological growth depicted as logistic growth function has been discussed (Watanabe et al., 2003, 2005). It is suggested that technological functionality can be depicted by patent stock which is consists of own technology stock and assimilated technology spillover.
In this chapter, prompted by the foregoing observation of LIB industry, we demonstrate the comparative analysis between Sony and Panasonic. We use patent data as a proxy to evaluate the technological growth, and use the International Patent Classification (IPC) to classify technologies. The difference of business structure between these two firms is introduced in (2.2). The role of this chapter is described in (2.3). Trends in the diffusion trajectories of electrode technology are analyzed by using a bi-logistic function model in (2.4). Patents of cathode materials obtained by these two firms are compared in (2.5). Results are discussed in (2.6). Conclusion in this chapter is remarked in (2.7).
36
2.2 Comparison of business performance between Sony and Panasonic 2.2.1 Trends in the number of patent applications in the world
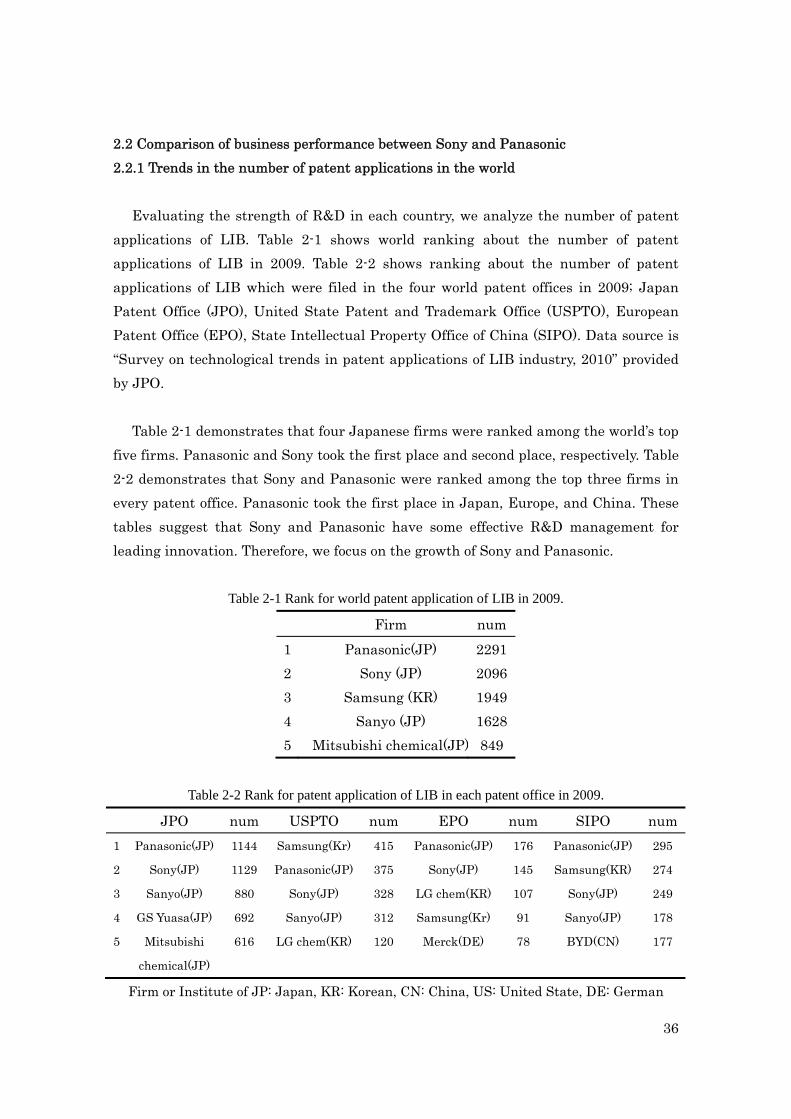
Evaluating the strength of R&D in each country, we analyze the number of patent
applications of LIB. Table 2-1 shows world ranking about the number of patent applications of LIB in 2009. Table 2-2 shows ranking about the number of patent applications of LIB which were filed in the four world patent offices in 2009; Japan Patent Office (JPO), United State Patent and Trademark Office (USPTO), European Patent Office (EPO), State Intellectual Property Office of China (SIPO). Data source is “Survey on technological trends in patent applications of LIB industry, 2010” provided by JPO.
Table 2-1 demonstrates that four Japanese firms were ranked among the world’s top
five firms. Panasonic and Sony took the first place and second place, respectively. Table 2-2 demonstrates that Sony and Panasonic were ranked among the top three firms in every patent office. Panasonic took the first place in Japan, Europe, and China. These tables suggest that Sony and Panasonic have some effective R&D management for leading innovation. Therefore, we focus on the growth of Sony and Panasonic.
Table 2-1 Rank for world patent application of LIB in 2009.
Firm num1 Panasonic(JP) 22912 Sony (JP) 20963 Samsung (KR) 19494 Sanyo (JP) 16285 Mitsubishi chemical(JP) 849
Table 2-2 Rank for patent application of LIB in each patent office in 2009.
JPO num USPTO num EPO num SIPO num1 Panasonic(JP) 1144 Samsung(Kr) 415 Panasonic(JP) 176 Panasonic(JP) 295
2 Sony(JP) 1129 Panasonic(JP) 375 Sony(JP) 145 Samsung(KR) 274
3 Sanyo(JP) 880 Sony(JP) 328 LG chem(KR) 107 Sony(JP) 249
4 GS Yuasa(JP) 692 Sanyo(JP) 312 Samsung(Kr) 91 Sanyo(JP) 178
5 Mitsubishi
chemical(JP)
616 LG chem(KR) 120 Merck(DE) 78 BYD(CN) 177
Firm or Institute of JP: Japan, KR: Korean, CN: China, US: United State, DE: German
37
2.2.2 Trends in the number of patent applications in Japan
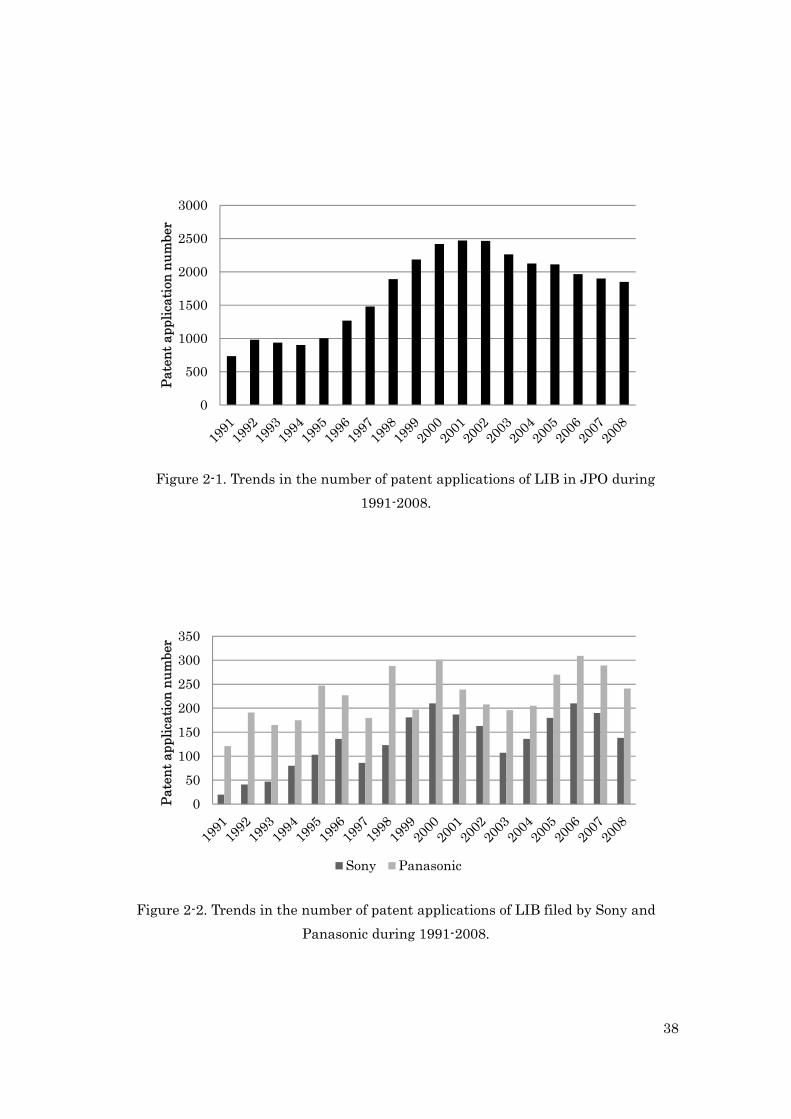
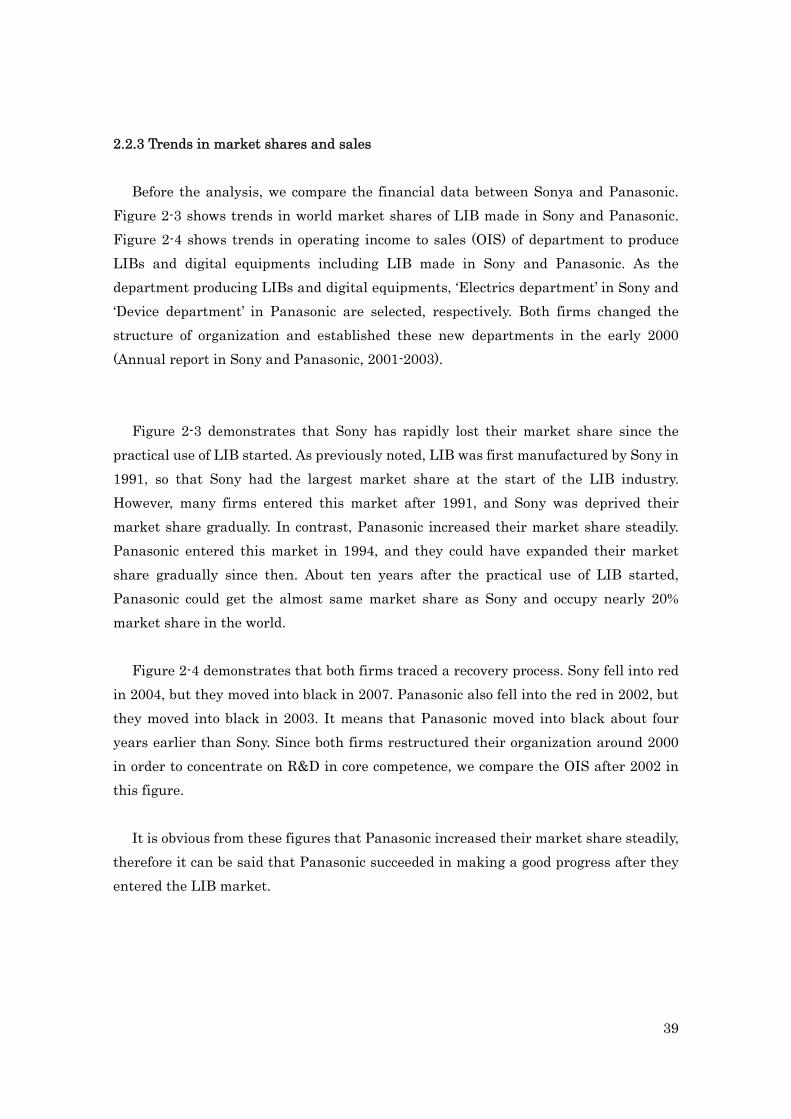
Through the observation of trends in the number of patent applications in the world, it can be said that Sony and Panasonic has led the innovation in the LIB industry. Figure 2-1 shows trends in the number of patent applications of LIB filed in JPO during 1991-2008. Figure 2-2 shows trends in the number of patent applications of LIB filed by Sony and Panasonic during 1991-2008. The data of patent applications are obtained by a retrieval of patent data in “Industrial Property Digital Library” provided by National Center for Industrial Property Information and Training in Japan.
Figure 2-1 demonstrates that the number of patent applications has increased rapidly during 1991-2002. This fact suggests that innovation in the LIB industry occurred during this period. LIB was first manufactured for the market by Sony in 1991 (Nagaura, 1991), and many firms have entered this market since then. It seems that this highly competition leads the decrease of the number of patent applications after 2000. Thus, it is obvious from Figure 2-1 that only one inflection point is included in this figure in the early 2000s. This growth trajectory can be illustrated as the S-curve, which can be exhibited as the simple logistic function model.
Figure 2-2 also demonstrates that the number of patent applications filed by Sony
and Panasonic has turned to decrease since 2000. This decline might be caused by the same reason as discussed above. However, as a difference between Figure 2-1 and Figure 2-2, the number of patent applications has turned to increase again since the middle 2000s in Figure 2-2. Thus, it is obvious from Figure 2-2 that Sony and Panasonic has different trends in the number of patent applications from the general trends expressed in Figure 2-1, because two inflection points are included in this figure. First point is the early 2000s, and second point is the middle 2000s. This growth trajectory is considered as the sum of two S-curves. Therefore, we analyze the data of this figure by using the bi-logistic function model in order to divide the LIB innovation process into first wave and second wave.
It could be one of reasons of the strength of Sony and Panasonic that they developed
the functionality of LIB in the 1990s and stepped up to the next generation LIB since 2000. Therefore, we focus on the relations between the change of trends in the number of patent applications from first wave to second wave and the development of material technology used in a cathode.
38
Figure 2-1. Trends in the number of patent applications of LIB in JPO during 1991-2008.
Figure 2-2. Trends in the number of patent applications of LIB filed by Sony and Panasonic during 1991-2008.
0
500
1000
1500
2000
2500
3000
Pate
nt a
pplic
atio
n nu
mbe
r
0
50
100
150
200
250
300
350
Pate
nt a
pplic
atio
n nu
mbe
r
Sony Panasonic
39
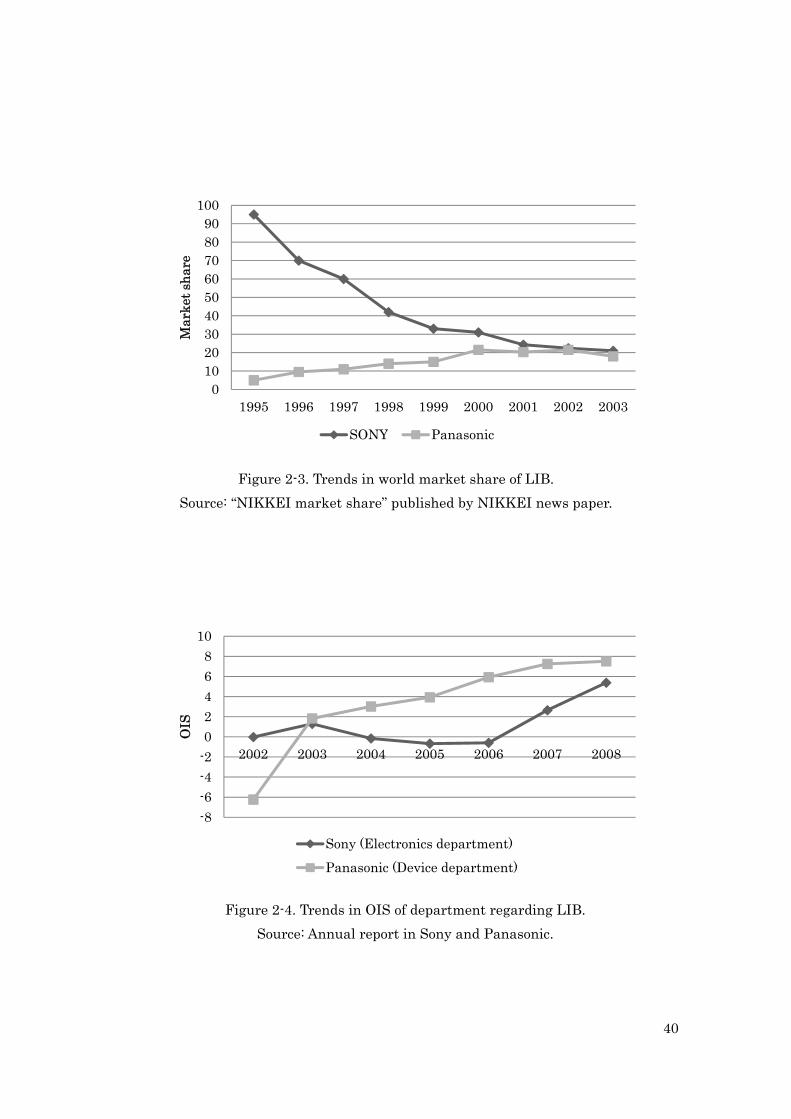
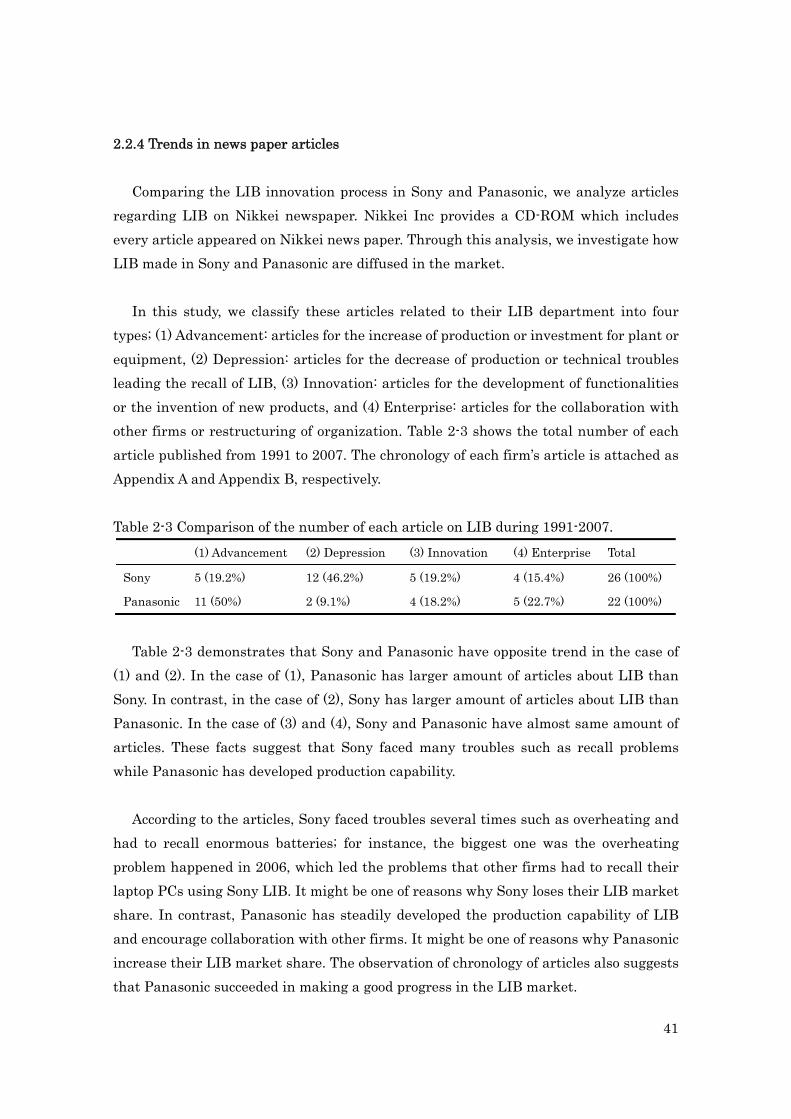
2.2.3 Trends in market shares and sales
Before the analysis, we compare the financial data between Sonya and Panasonic. Figure 2-3 shows trends in world market shares of LIB made in Sony and Panasonic. Figure 2-4 shows trends in operating income to sales (OIS) of department to produce LIBs and digital equipments including LIB made in Sony and Panasonic. As the department producing LIBs and digital equipments, ‘Electrics department’ in Sony and ‘Device department’ in Panasonic are selected, respectively. Both firms changed the structure of organization and established these new departments in the early 2000 (Annual report in Sony and Panasonic, 2001-2003).
Figure 2-3 demonstrates that Sony has rapidly lost their market share since the practical use of LIB started. As previously noted, LIB was first manufactured by Sony in 1991, so that Sony had the largest market share at the start of the LIB industry. However, many firms entered this market after 1991, and Sony was deprived their market share gradually. In contrast, Panasonic increased their market share steadily. Panasonic entered this market in 1994, and they could have expanded their market share gradually since then. About ten years after the practical use of LIB started, Panasonic could get the almost same market share as Sony and occupy nearly 20% market share in the world.
Figure 2-4 demonstrates that both firms traced a recovery process. Sony fell into red
in 2004, but they moved into black in 2007. Panasonic also fell into the red in 2002, but they moved into black in 2003. It means that Panasonic moved into black about four years earlier than Sony. Since both firms restructured their organization around 2000 in order to concentrate on R&D in core competence, we compare the OIS after 2002 in this figure.
It is obvious from these figures that Panasonic increased their market share steadily,
therefore it can be said that Panasonic succeeded in making a good progress after they entered the LIB market.
40
Figure 2-3. Trends in world market share of LIB. Source: “NIKKEI market share” published by NIKKEI news paper.
Figure 2-4. Trends in OIS of department regarding LIB. Source: Annual report in Sony and Panasonic.
0102030405060708090
100
1995 1996 1997 1998 1999 2000 2001 2002 2003
Mar
ket s
hare
SONY Panasonic
-8-6-4-202468
10
2002 2003 2004 2005 2006 2007 2008
OIS
Sony (Electronics department)Panasonic (Device department)
41
2.2.4 Trends in news paper articles Comparing the LIB innovation process in Sony and Panasonic, we analyze articles
regarding LIB on Nikkei newspaper. Nikkei Inc provides a CD-ROM which includes every article appeared on Nikkei news paper. Through this analysis, we investigate how LIB made in Sony and Panasonic are diffused in the market.
In this study, we classify these articles related to their LIB department into four
types; (1) Advancement: articles for the increase of production or investment for plant or equipment, (2) Depression: articles for the decrease of production or technical troubles leading the recall of LIB, (3) Innovation: articles for the development of functionalities or the invention of new products, and (4) Enterprise: articles for the collaboration with other firms or restructuring of organization. Table 2-3 shows the total number of each article published from 1991 to 2007. The chronology of each firm’s article is attached as Appendix A and Appendix B, respectively. Table 2-3 Comparison of the number of each article on LIB during 1991-2007.
(1) Advancement (2) Depression (3) Innovation (4) Enterprise Total
Sony 5 (19.2%) 12 (46.2%) 5 (19.2%) 4 (15.4%) 26 (100%)
Panasonic 11 (50%) 2 (9.1%) 4 (18.2%) 5 (22.7%) 22 (100%)
Table 2-3 demonstrates that Sony and Panasonic have opposite trend in the case of
(1) and (2). In the case of (1), Panasonic has larger amount of articles about LIB than Sony. In contrast, in the case of (2), Sony has larger amount of articles about LIB than Panasonic. In the case of (3) and (4), Sony and Panasonic have almost same amount of articles. These facts suggest that Sony faced many troubles such as recall problems while Panasonic has developed production capability.
According to the articles, Sony faced troubles several times such as overheating and
had to recall enormous batteries; for instance, the biggest one was the overheating problem happened in 2006, which led the problems that other firms had to recall their laptop PCs using Sony LIB. It might be one of reasons why Sony loses their LIB market share. In contrast, Panasonic has steadily developed the production capability of LIB and encourage collaboration with other firms. It might be one of reasons why Panasonic increase their LIB market share. The observation of chronology of articles also suggests that Panasonic succeeded in making a good progress in the LIB market.
42
2.3 Interpretation In the Chapter I, it is suggested that electrode technology plays an important role in
developing the functionality of LIB, because the chemical reaction to generate electric power is occurred on the electrode as the physical fundamental. This chemical reaction depends on the material characteristics used in a cathode.
In the 1990s, simple materials such as lithium-cobalt oxide were mainly used in a
cathode (Ohzuku et al., 1995). However, in the 2000s, composite materials were required which could provide higher energy density and constitute a desirable material structure for heat load with less cobalt. In fact, current digital equipments use composite materials such as lithium-nickel-cobalt oxide as a main material, because these materials are superior to other materials in terms of energy density and stability (Ohzuku et al., 2007). Thus, it can be said that the prompt development of material technology is a key to lead the innovation in the LIB industry.
In this chapter, we compare the development process of cathode materials between
Sony and Panasonic by using logistic function model. Panasonic entered the LIB market in 1994, and they have maintained a good progress since then. Prompted by the forgoing observations, it seems that prompt development of material technology has encouraged Panasonic’s growth. It is because the technological performance of LIB depends on the development of material characteristics. It is considered that Panasonic took the initiative in the LIB industry by the prompt development of material technology, and the timely emergence of composite materials encouraged the growth of LIB department in Panasonic. Therefore, timely undertaking of R&D to develop material technology can be one of Panasonic’s strengths.
In the previous works, it is pointed that the early development of functionalities in a product and strategies to create such developments are essential for firms to survive the mega competition. The logistic growth function has proved to be a useful function in modeling an innovation process. Innovation process can be described as S-shaped growth curve, and, and then patent data can be a useful parameter (Anderson, 1999). By using this model, we compare the diffusion trajectories of electrode technology and the chronology of material technology between Sony and Panasonic to analyze the LIB innovation process.
43
2.4 Analysis of the diffusion of innovation 2.4.1 Methodology to classify technologies
Comparing the LIB innovation process between Sony and Panasonic, we use patent data as an indicator of the innovation. It is demonstrated by numerical analysis that there is a close relationship between R&D and patents (Griliches et al., 1984) and patent can be a useful economic indicator to analyze the innovation. Anderson (1999) also suggested that accumulated patent stock can be an appropriate approximation to describe the evolution of technologies.
As suggested in Chapter I, it can be conceptualized that batteries are composed of
three technology segments; ‘Exterior’ (the shape or the appearance of a battery), ‘Structure’ (the structural details of a battery), and ‘Electrode’ (the details of a cathode and an anode to cause a chemical reaction to generate energy).
Generally, every patent application is classified by IPC. According to the IPC,
‘Processors or means relating to electric elements such as batteries for the direct conversion of chemical energy into electrical energy’ are classified into [H01M]. Therefore, We select technologies regarding LIB from technologies which are classified as this [H01M], and group technologies into three simple technologies and four complex technologies by using the IPC. Finally, technologies composing a LIB can be grouped into seven technology groups like follows. Detail meanings of each IPC are summarized in the Appendix C. [Simple technology] We classify technologies composing a LIB into three technology segments; ‘Exterior’, ‘Structure’, and ‘Electrode’. Technology group which belongs to only one technology segment is defined as ‘simple technology’. These technology groups are defined like follows by the sub group level of IPC.
i) Exterior: We classify technologies which belong to only (H01M2) as ‘Exterior’.
We use the following IPC groups to define inventions which belong to ‘Exterior’. H01M2/00, H01M2/02, H01M2/04, H01M2/06, H01M2/08, H01M2/14, H01M2/16, H01M2/18
44
ii) Structure: We classify technologies which belong to only (H01M10) as ‘Structure’. We use the following IPC groups to define inventions which belong to ‘Structure’. H01M10/00, H01M10/36, H01M10/40
iii) Electrode: We classify technologies which belong to only (H01M4) as ‘Electrode’.
We use the following IPC groups to define inventions which belong to ‘Electrode’. H01M4/00, H01M4/02, H01M4/04, H01M4/36, H01M4/38, H01M4/48, H01M4/50, H01M4/52, H01M4/58, H01M4/62, H01M4/64, H01M4/66
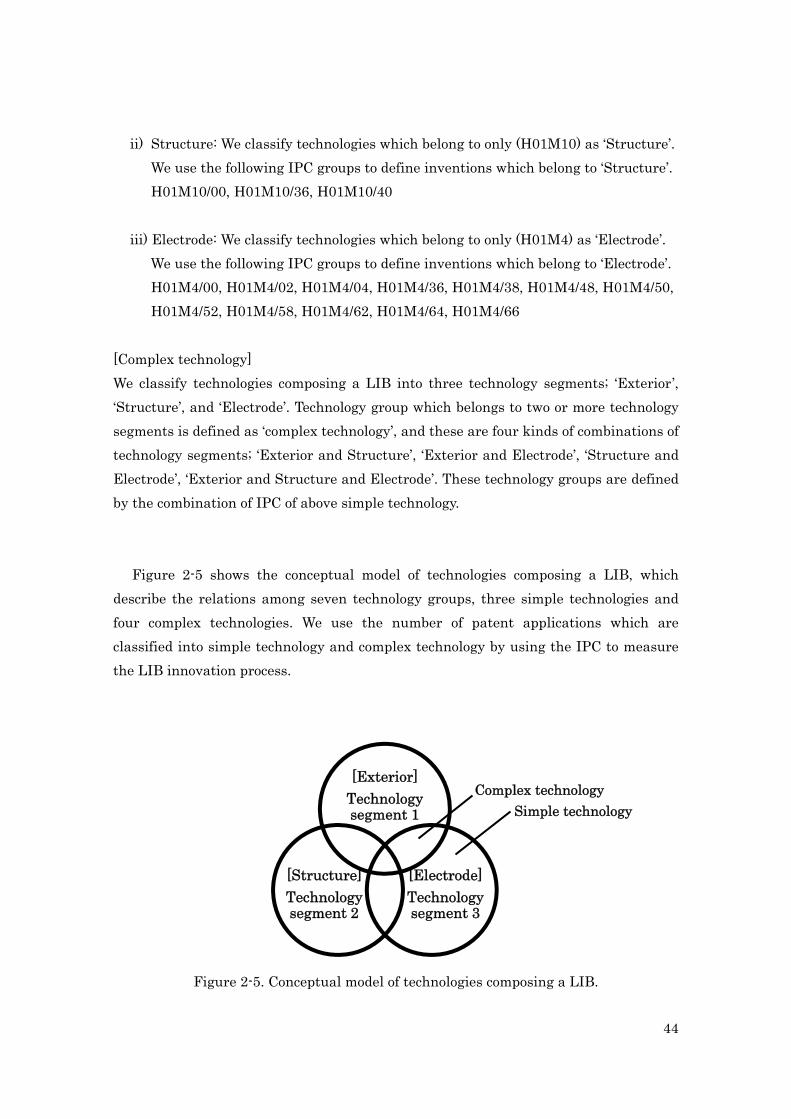
[Complex technology] We classify technologies composing a LIB into three technology segments; ‘Exterior’, ‘Structure’, and ‘Electrode’. Technology group which belongs to two or more technology segments is defined as ‘complex technology’, and these are four kinds of combinations of technology segments; ‘Exterior and Structure’, ‘Exterior and Electrode’, ‘Structure and Electrode’, ‘Exterior and Structure and Electrode’. These technology groups are defined by the combination of IPC of above simple technology.
Figure 2-5 shows the conceptual model of technologies composing a LIB, which describe the relations among seven technology groups, three simple technologies and four complex technologies. We use the number of patent applications which are classified into simple technology and complex technology by using the IPC to measure the LIB innovation process.
Figure 2-5. Conceptual model of technologies composing a LIB.
[Exterior]Technology segment 1
[Electrode]Technology segment 3
[Structure]Technology segment 2
Complex technology Simple technology
45
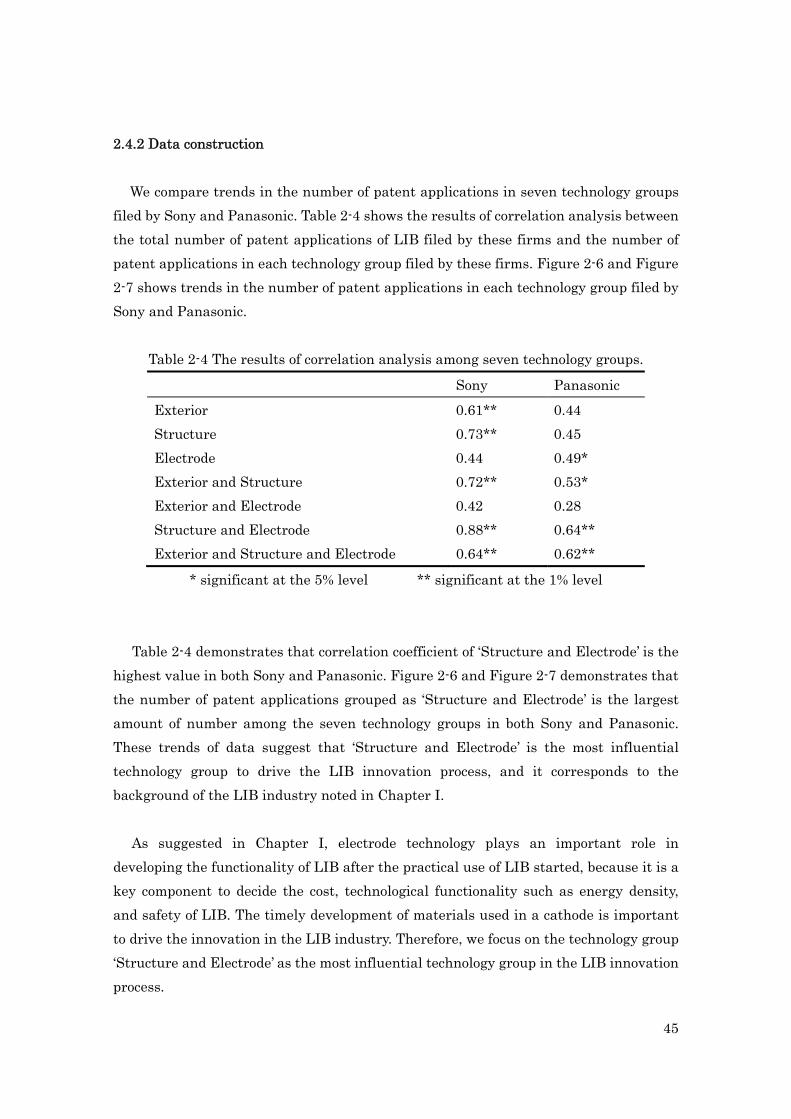
2.4.2 Data construction We compare trends in the number of patent applications in seven technology groups
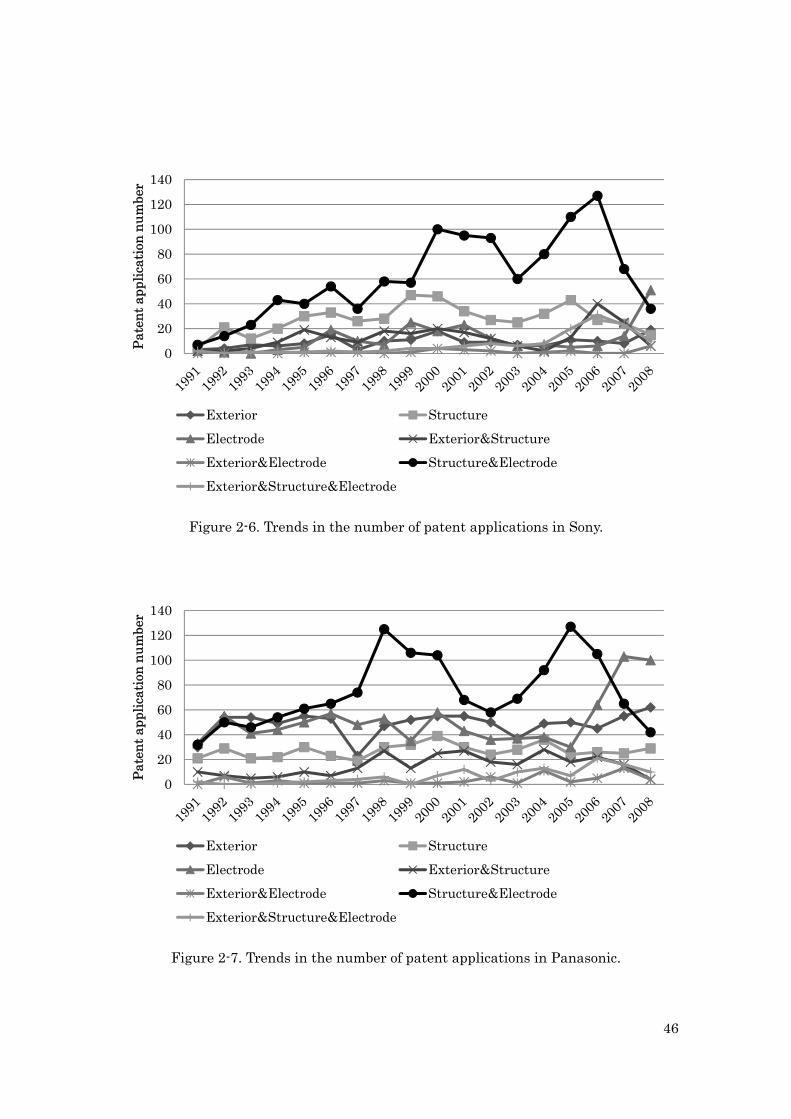
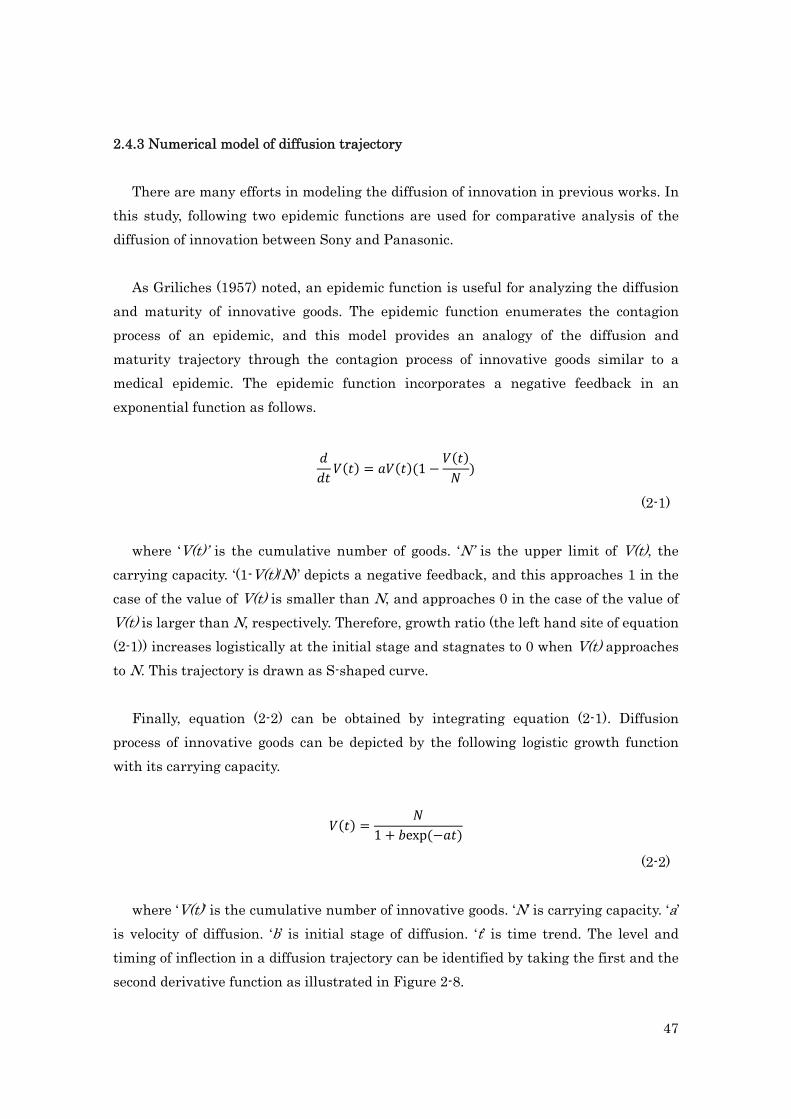
filed by Sony and Panasonic. Table 2-4 shows the results of correlation analysis between the total number of patent applications of LIB filed by these firms and the number of patent applications in each technology group filed by these firms. Figure 2-6 and Figure 2-7 shows trends in the number of patent applications in each technology group filed by Sony and Panasonic.
Table 2-4 The results of correlation analysis among seven technology groups.
Sony Panasonic Exterior 0.61** 0.44 Structure 0.73** 0.45 Electrode 0.44 0.49* Exterior and Structure 0.72** 0.53* Exterior and Electrode 0.42 0.28 Structure and Electrode 0.88** 0.64** Exterior and Structure and Electrode 0.64** 0.62**
* significant at the 5% level ** significant at the 1% level
Table 2-4 demonstrates that correlation coefficient of ‘Structure and Electrode’ is the highest value in both Sony and Panasonic. Figure 2-6 and Figure 2-7 demonstrates that the number of patent applications grouped as ‘Structure and Electrode’ is the largest amount of number among the seven technology groups in both Sony and Panasonic. These trends of data suggest that ‘Structure and Electrode’ is the most influential technology group to drive the LIB innovation process, and it corresponds to the background of the LIB industry noted in Chapter I.
As suggested in Chapter I, electrode technology plays an important role in developing the functionality of LIB after the practical use of LIB started, because it is a key component to decide the cost, technological functionality such as energy density, and safety of LIB. The timely development of materials used in a cathode is important to drive the innovation in the LIB industry. Therefore, we focus on the technology group ‘Structure and Electrode’ as the most influential technology group in the LIB innovation process.
46
Figure 2-6. Trends in the number of patent applications in Sony.
Figure 2-7. Trends in the number of patent applications in Panasonic.
0
20
40
60
80
100
120
140
Pate
nt a
pplic
atio
n nu
mbe
r
Exterior StructureElectrode Exterior&StructureExterior&Electrode Structure&ElectrodeExterior&Structure&Electrode
0
20
40
60
80
100
120
140
Pate
nt a
pplic
atio
n nu
mbe
r
Exterior StructureElectrode Exterior&StructureExterior&Electrode Structure&ElectrodeExterior&Structure&Electrode
47
2.4.3 Numerical model of diffusion trajectory There are many efforts in modeling the diffusion of innovation in previous works. In
this study, following two epidemic functions are used for comparative analysis of the diffusion of innovation between Sony and Panasonic.
As Griliches (1957) noted, an epidemic function is useful for analyzing the diffusion
and maturity of innovative goods. The epidemic function enumerates the contagion process of an epidemic, and this model provides an analogy of the diffusion and maturity trajectory through the contagion process of innovative goods similar to a medical epidemic. The epidemic function incorporates a negative feedback in an exponential function as follows.
1
(2-1)
where ‘V(t)’ is the cumulative number of goods. ‘N’ is the upper limit of V(t), the carrying capacity. ‘(1-V(t)/N)’ depicts a negative feedback, and this approaches 1 in the case of the value of V(t) is smaller than N, and approaches 0 in the case of the value of V(t) is larger than N, respectively. Therefore, growth ratio (the left hand site of equation (2-1)) increases logistically at the initial stage and stagnates to 0 when V(t) approaches to N. This trajectory is drawn as S-shaped curve.
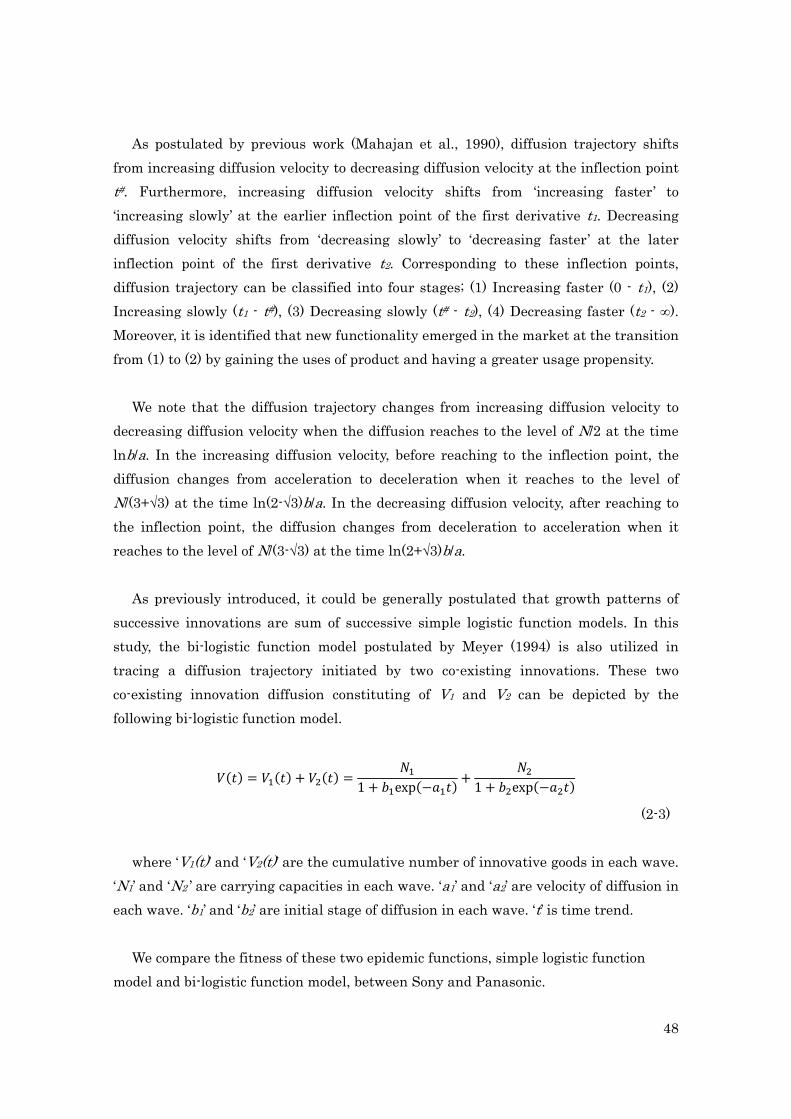
Finally, equation (2-2) can be obtained by integrating equation (2-1). Diffusion process of innovative goods can be depicted by the following logistic growth function with its carrying capacity.
1 exp
(2-2)
where ‘V(t)’ is the cumulative number of innovative goods. ‘N’ is carrying capacity. ‘a’ is velocity of diffusion. ‘b’ is initial stage of diffusion. ‘t’ is time trend. The level and timing of inflection in a diffusion trajectory can be identified by taking the first and the second derivative function as illustrated in Figure 2-8.
48
As postulated by previous work (Mahajan et al., 1990), diffusion trajectory shifts from increasing diffusion velocity to decreasing diffusion velocity at the inflection point t#. Furthermore, increasing diffusion velocity shifts from ‘increasing faster’ to ‘increasing slowly’ at the earlier inflection point of the first derivative t1. Decreasing diffusion velocity shifts from ‘decreasing slowly’ to ‘decreasing faster’ at the later inflection point of the first derivative t2. Corresponding to these inflection points, diffusion trajectory can be classified into four stages; (1) Increasing faster (0 - t1), (2) Increasing slowly (t1 - t#), (3) Decreasing slowly (t# - t2), (4) Decreasing faster (t2 - ∞). Moreover, it is identified that new functionality emerged in the market at the transition from (1) to (2) by gaining the uses of product and having a greater usage propensity.
We note that the diffusion trajectory changes from increasing diffusion velocity to
decreasing diffusion velocity when the diffusion reaches to the level of N/2 at the time lnb/a. In the increasing diffusion velocity, before reaching to the inflection point, the diffusion changes from acceleration to deceleration when it reaches to the level of N/(3+√3) at the time ln(2-√3)b/a. In the decreasing diffusion velocity, after reaching to the inflection point, the diffusion changes from deceleration to acceleration when it reaches to the level of N/(3-√3) at the time ln(2+√3)b/a.
As previously introduced, it could be generally postulated that growth patterns of successive innovations are sum of successive simple logistic function models. In this study, the bi-logistic function model postulated by Meyer (1994) is also utilized in tracing a diffusion trajectory initiated by two co-existing innovations. These two co-existing innovation diffusion constituting of V1 and V2 can be depicted by the following bi-logistic function model.
1 exp 1 exp
(2-3) where ‘V1(t)’ and ‘V2(t)’ are the cumulative number of innovative goods in each wave.
‘N1’ and ‘N2 ’ are carrying capacities in each wave. ‘a1’ and ‘a2’ are velocity of diffusion in each wave. ‘b1’ and ‘b2’ are initial stage of diffusion in each wave. ‘t’ is time trend.
We compare the fitness of these two epidemic functions, simple logistic function
model and bi-logistic function model, between Sony and Panasonic.
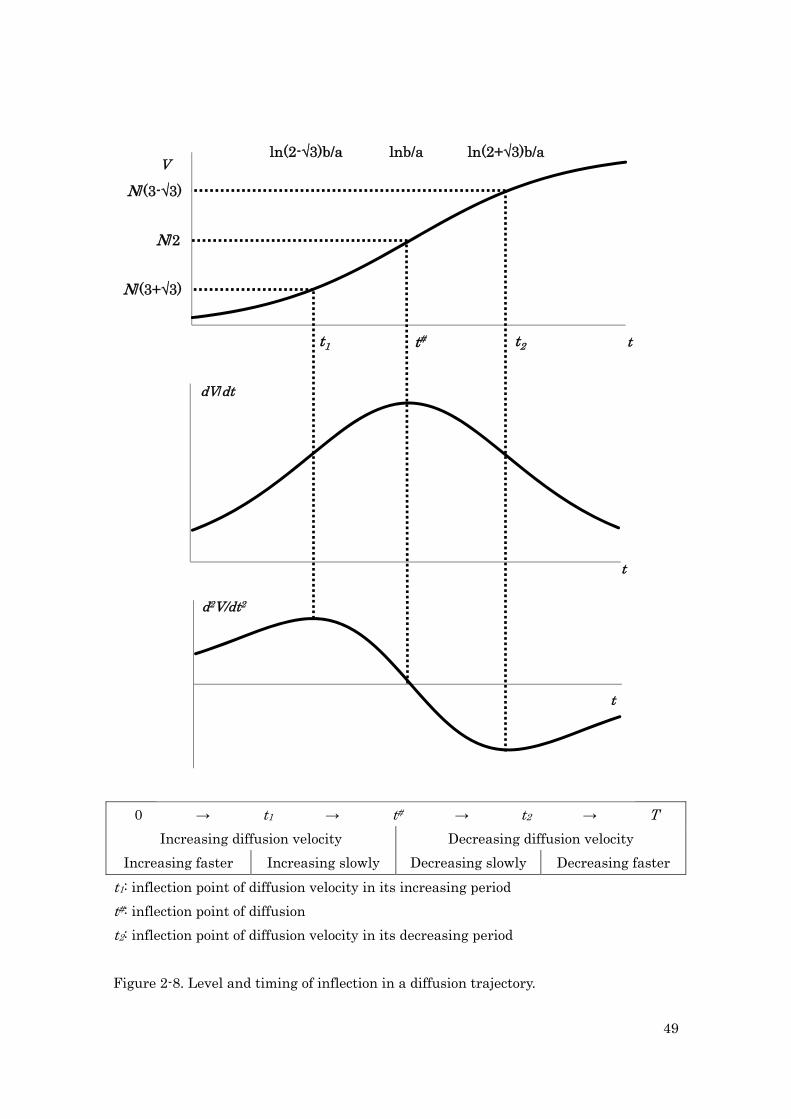
49
0 → t1 → t# → t2 → T
Increasing diffusion velocity Decreasing diffusion velocity Increasing faster Increasing slowly Decreasing slowly Decreasing faster
t1: inflection point of diffusion velocity in its increasing period t#: inflection point of diffusion t2: inflection point of diffusion velocity in its decreasing period Figure 2-8. Level and timing of inflection in a diffusion trajectory.
V
tt1 t2t#
ln(2-√3)b/a lnb/a ln(2+√3)b/a
N/(3+√3)
N/(3-√3)
N/2
dV/dt
t
d2V/dt2
t
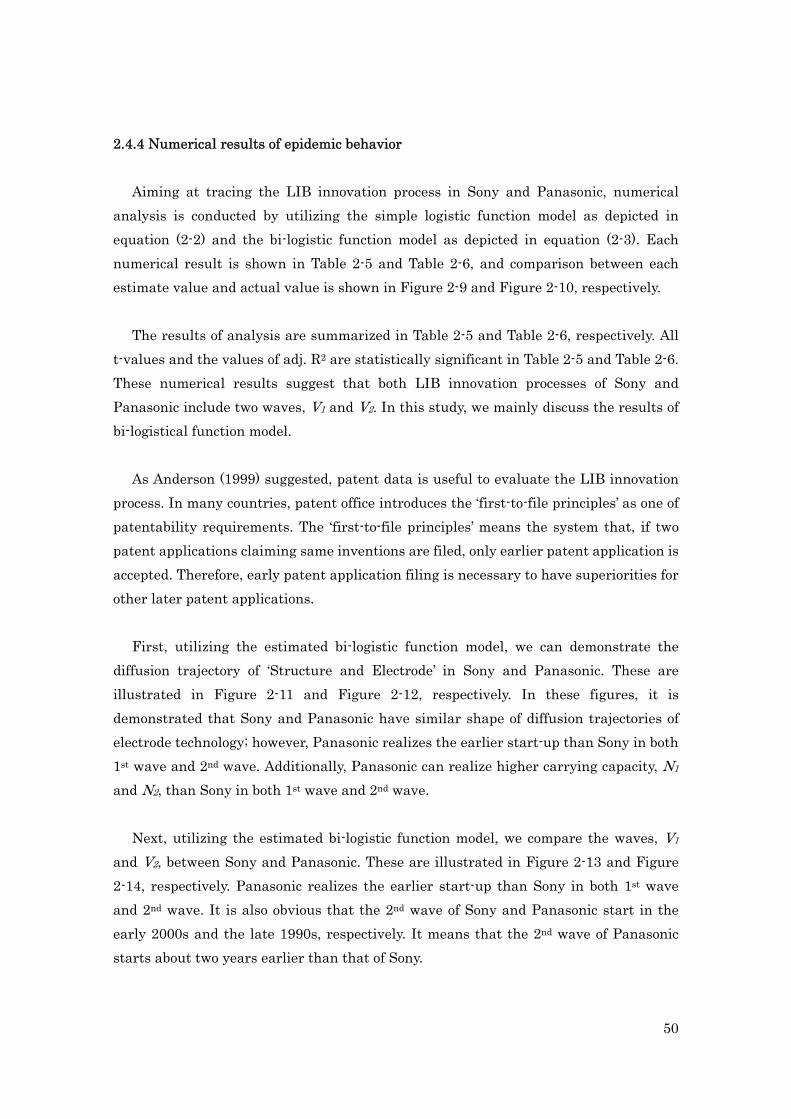
50
2.4.4 Numerical results of epidemic behavior Aiming at tracing the LIB innovation process in Sony and Panasonic, numerical
analysis is conducted by utilizing the simple logistic function model as depicted in equation (2-2) and the bi-logistic function model as depicted in equation (2-3). Each numerical result is shown in Table 2-5 and Table 2-6, and comparison between each estimate value and actual value is shown in Figure 2-9 and Figure 2-10, respectively.
The results of analysis are summarized in Table 2-5 and Table 2-6, respectively. All
t-values and the values of adj. R2 are statistically significant in Table 2-5 and Table 2-6. These numerical results suggest that both LIB innovation processes of Sony and Panasonic include two waves, V1 and V2. In this study, we mainly discuss the results of bi-logistical function model.
As Anderson (1999) suggested, patent data is useful to evaluate the LIB innovation
process. In many countries, patent office introduces the ‘first-to-file principles’ as one of patentability requirements. The ‘first-to-file principles’ means the system that, if two patent applications claiming same inventions are filed, only earlier patent application is accepted. Therefore, early patent application filing is necessary to have superiorities for other later patent applications.
First, utilizing the estimated bi-logistic function model, we can demonstrate the
diffusion trajectory of ‘Structure and Electrode’ in Sony and Panasonic. These are illustrated in Figure 2-11 and Figure 2-12, respectively. In these figures, it is demonstrated that Sony and Panasonic have similar shape of diffusion trajectories of electrode technology; however, Panasonic realizes the earlier start-up than Sony in both 1st wave and 2nd wave. Additionally, Panasonic can realize higher carrying capacity, N1 and N2, than Sony in both 1st wave and 2nd wave.
Next, utilizing the estimated bi-logistic function model, we compare the waves, V1
and V2, between Sony and Panasonic. These are illustrated in Figure 2-13 and Figure 2-14, respectively. Panasonic realizes the earlier start-up than Sony in both 1st wave and 2nd wave. It is also obvious that the 2nd wave of Sony and Panasonic start in the early 2000s and the late 1990s, respectively. It means that the 2nd wave of Panasonic starts about two years earlier than that of Sony.
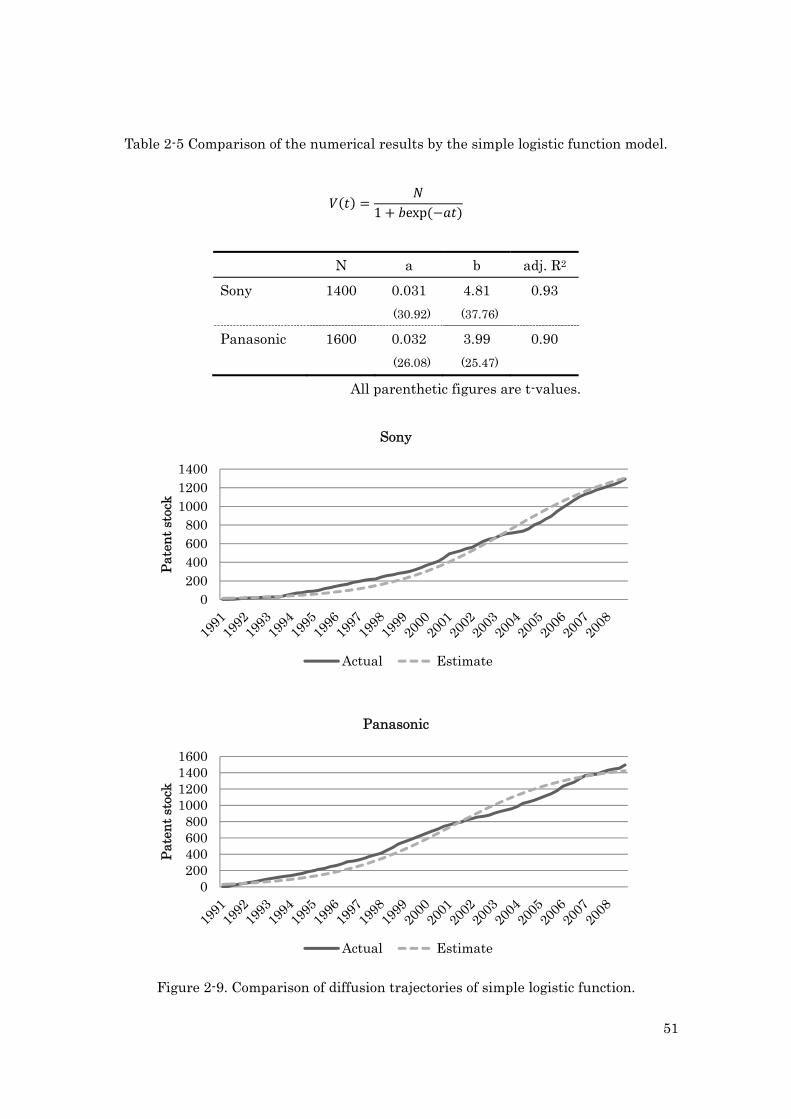
51
Table 2-5 Comparison of the numerical results by the simple logistic function model.
1 exp
N a b adj. R2 Sony 1400 0.031 4.81 0.93 (30.92) (37.76) Panasonic 1600 0.032 3.99 0.90 (26.08) (25.47)
All parenthetic figures are t-values.
Sony
Panasonic
Figure 2-9. Comparison of diffusion trajectories of simple logistic function.
0200400600800
100012001400
Pate
nt s
tock
Actual Estimate
0200400600800
1000120014001600
Pate
nt s
tock
Actual Estimate
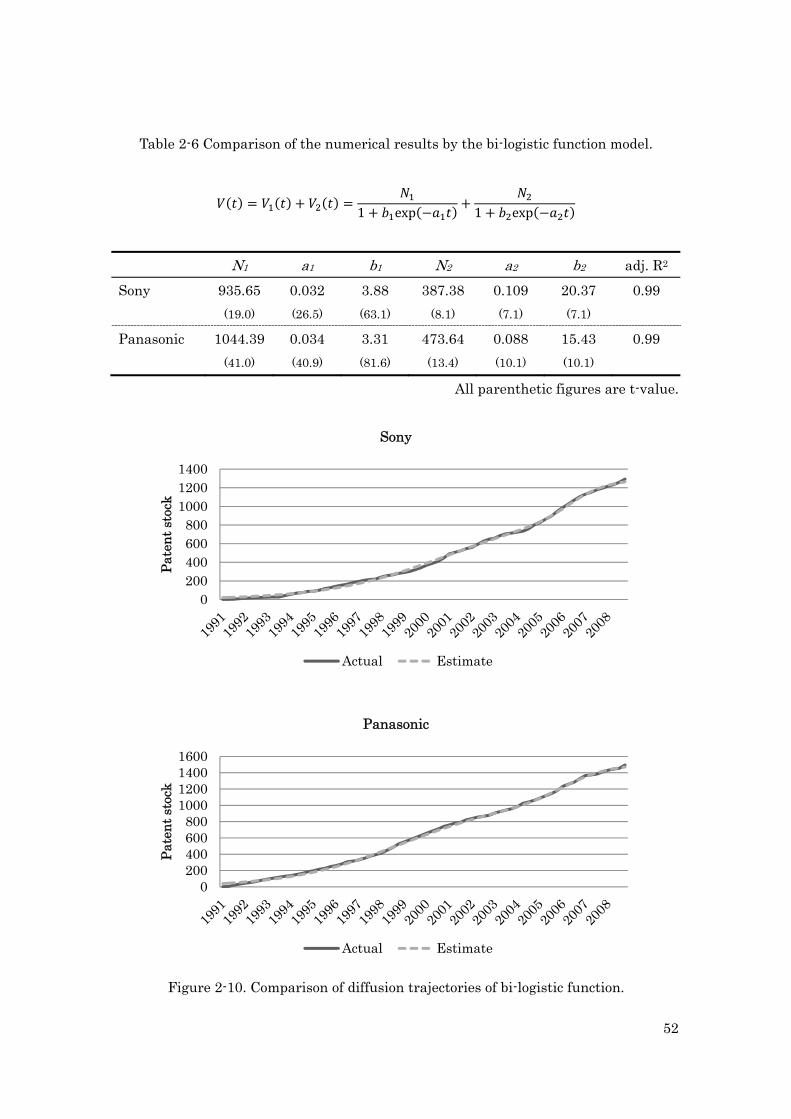
52
Table 2-6 Comparison of the numerical results by the bi-logistic function model.
1 exp 1 exp
N1 a1 b1 N2 a2 b2 adj. R2 Sony 935.65 0.032 3.88 387.38 0.109 20.37 0.99 (19.0) (26.5) (63.1) (8.1) (7.1) (7.1)
Panasonic 1044.39 0.034 3.31 473.64 0.088 15.43 0.99 (41.0) (40.9) (81.6) (13.4) (10.1) (10.1)
All parenthetic figures are t-value.
Sony
Panasonic
Figure 2-10. Comparison of diffusion trajectories of bi-logistic function.
0200400600800
100012001400
Pate
nt s
tock
Actual Estimate
0200400600800
1000120014001600
Pate
nt s
tock
Actual Estimate
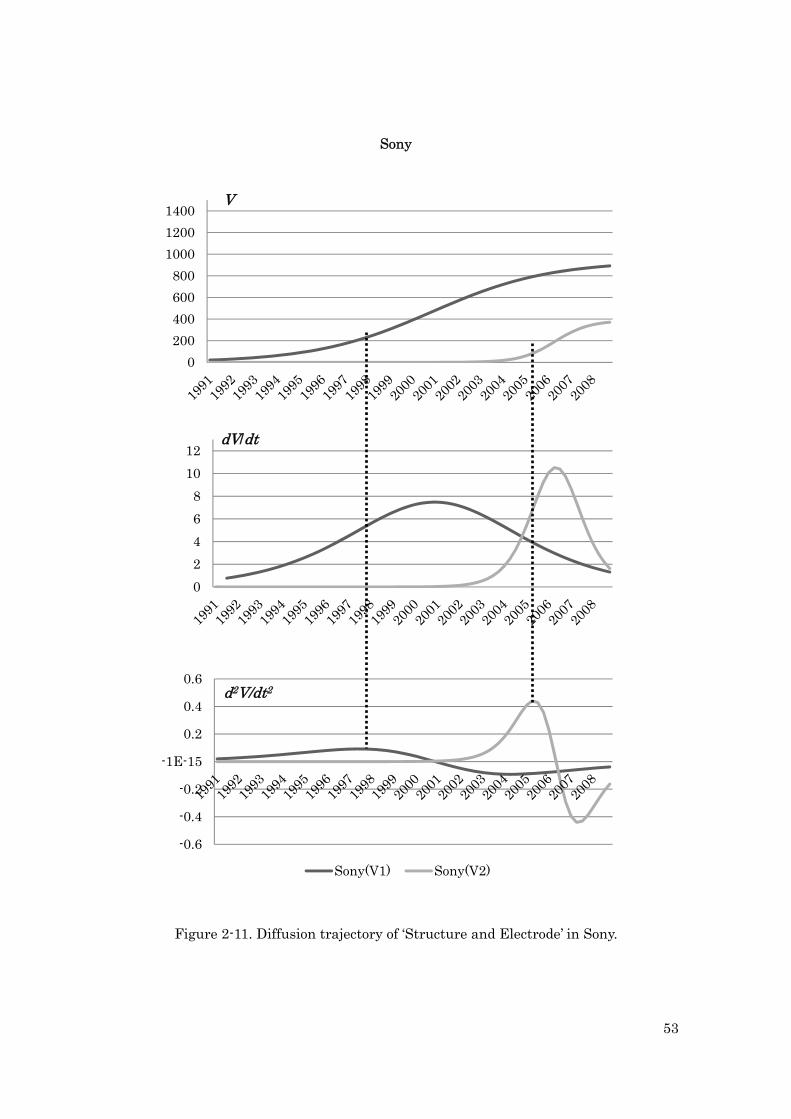
53
Sony
Figure 2-11. Diffusion trajectory of ‘Structure and Electrode’ in Sony.
0200400600800
100012001400
V
02468
1012
dV/dt
-0.6
-0.4
-0.2
-1E-15
0.2
0.4
0.6
Sony(V1) Sony(V2)
d2V/dt2
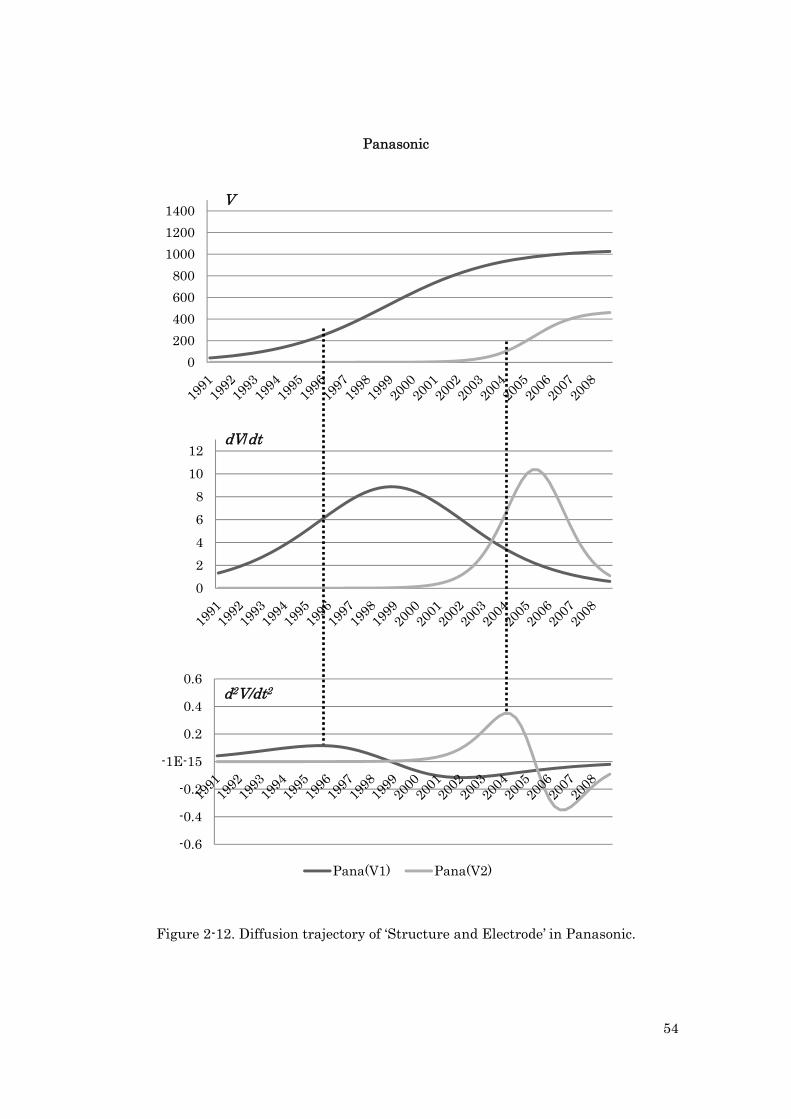
54
Panasonic
Figure 2-12. Diffusion trajectory of ‘Structure and Electrode’ in Panasonic.
0200400600800
100012001400
V
02468
1012
dV/dt
-0.6
-0.4
-0.2
-1E-15
0.2
0.4
0.6
Pana(V1) Pana(V2)
d2V/dt2
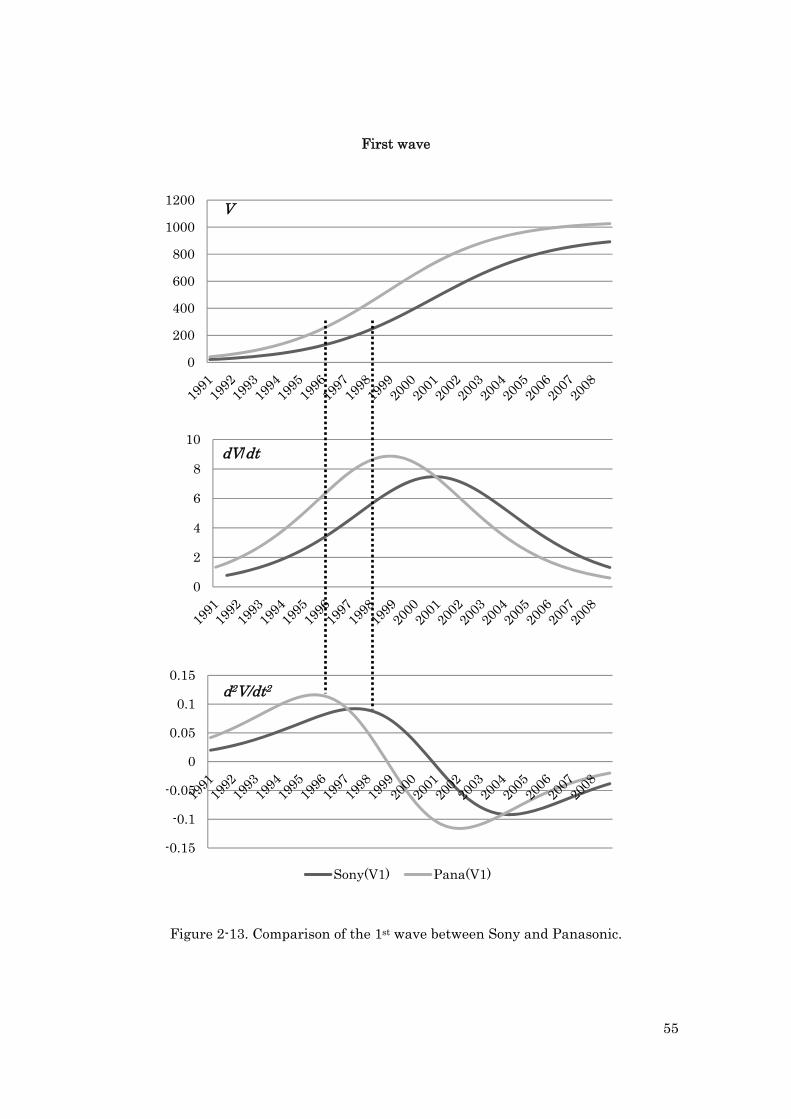
55
First wave
Figure 2-13. Comparison of the 1st wave between Sony and Panasonic.
0
200
400
600
800
1000
1200 V
0
2
4
6
8
10dV/dt
-0.15
-0.1
-0.05
0
0.05
0.1
0.15
Sony(V1) Pana(V1)
d2V/dt2
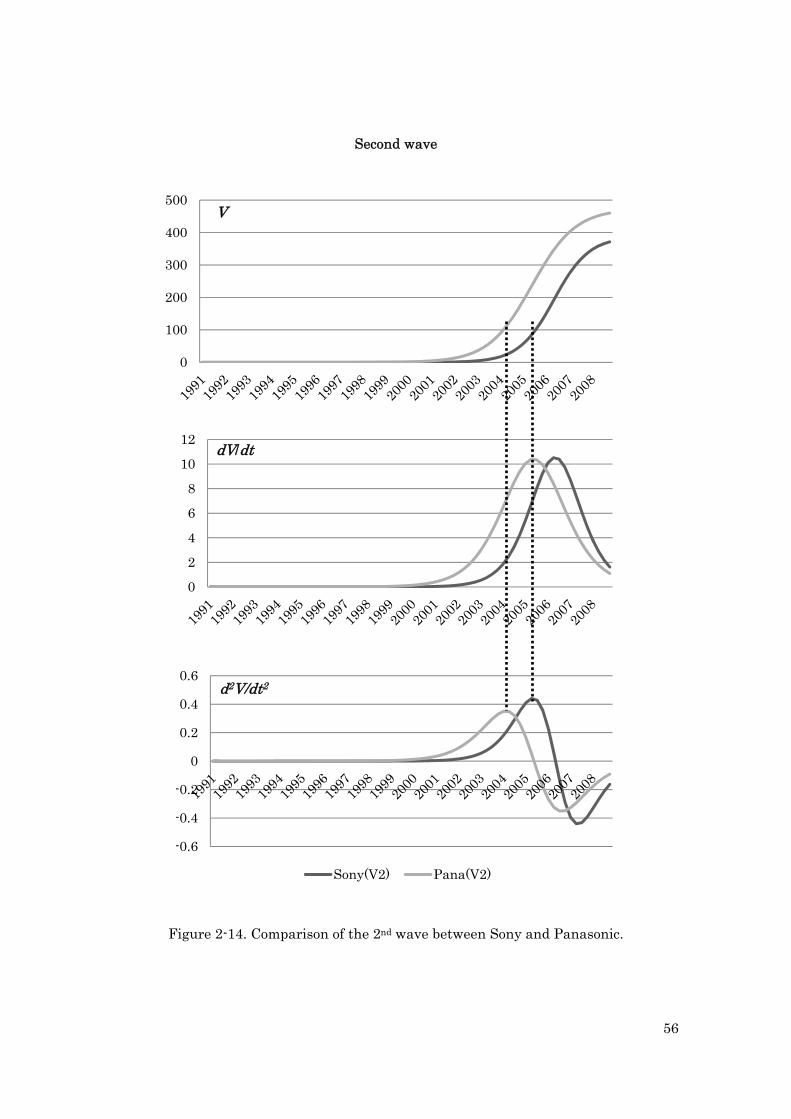
56
Second wave
Figure 2-14. Comparison of the 2nd wave between Sony and Panasonic.
0
100
200
300
400
500V
0
2
4
6
8
10
12 dV/dt
-0.6
-0.4
-0.2
0
0.2
0.4
0.6
Sony(V2) Pana(V2)
d2V/dt2
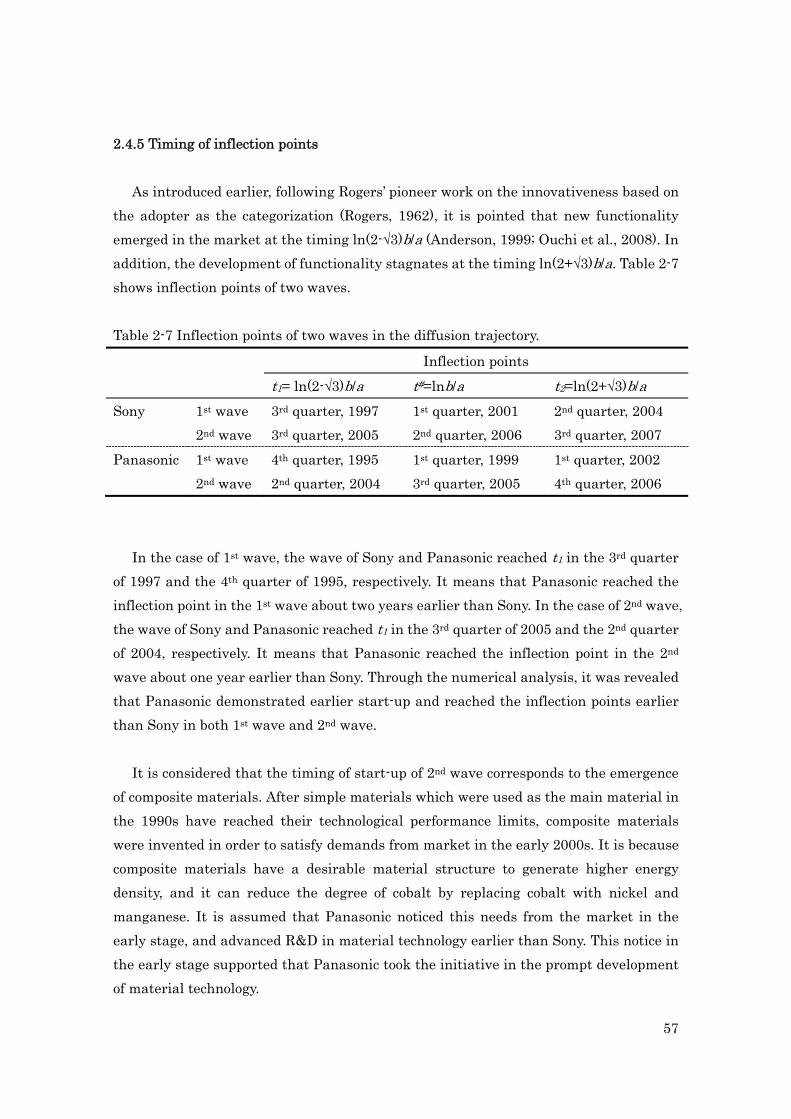
57
2.4.5 Timing of inflection points As introduced earlier, following Rogers’ pioneer work on the innovativeness based on
the adopter as the categorization (Rogers, 1962), it is pointed that new functionality emerged in the market at the timing ln(2-√3)b/a (Anderson, 1999; Ouchi et al., 2008). In addition, the development of functionality stagnates at the timing ln(2+√3)b/a. Table 2-7 shows inflection points of two waves.
Table 2-7 Inflection points of two waves in the diffusion trajectory.
Inflection points t1= ln(2-√3)b/a t#=lnb/a t2=ln(2+√3)b/a Sony 1st wave 3rd quarter, 1997 1st quarter, 2001 2nd quarter, 2004 2nd wave 3rd quarter, 2005 2nd quarter, 2006 3rd quarter, 2007 Panasonic 1st wave 4th quarter, 1995 1st quarter, 1999 1st quarter, 2002 2nd wave 2nd quarter, 2004 3rd quarter, 2005 4th quarter, 2006
In the case of 1st wave, the wave of Sony and Panasonic reached t1 in the 3rd quarter of 1997 and the 4th quarter of 1995, respectively. It means that Panasonic reached the inflection point in the 1st wave about two years earlier than Sony. In the case of 2nd wave, the wave of Sony and Panasonic reached t1 in the 3rd quarter of 2005 and the 2nd quarter of 2004, respectively. It means that Panasonic reached the inflection point in the 2nd wave about one year earlier than Sony. Through the numerical analysis, it was revealed that Panasonic demonstrated earlier start-up and reached the inflection points earlier than Sony in both 1st wave and 2nd wave.
It is considered that the timing of start-up of 2nd wave corresponds to the emergence of composite materials. After simple materials which were used as the main material in the 1990s have reached their technological performance limits, composite materials were invented in order to satisfy demands from market in the early 2000s. It is because composite materials have a desirable material structure to generate higher energy density, and it can reduce the degree of cobalt by replacing cobalt with nickel and manganese. It is assumed that Panasonic noticed this needs from the market in the early stage, and advanced R&D in material technology earlier than Sony. This notice in the early stage supported that Panasonic took the initiative in the prompt development of material technology.
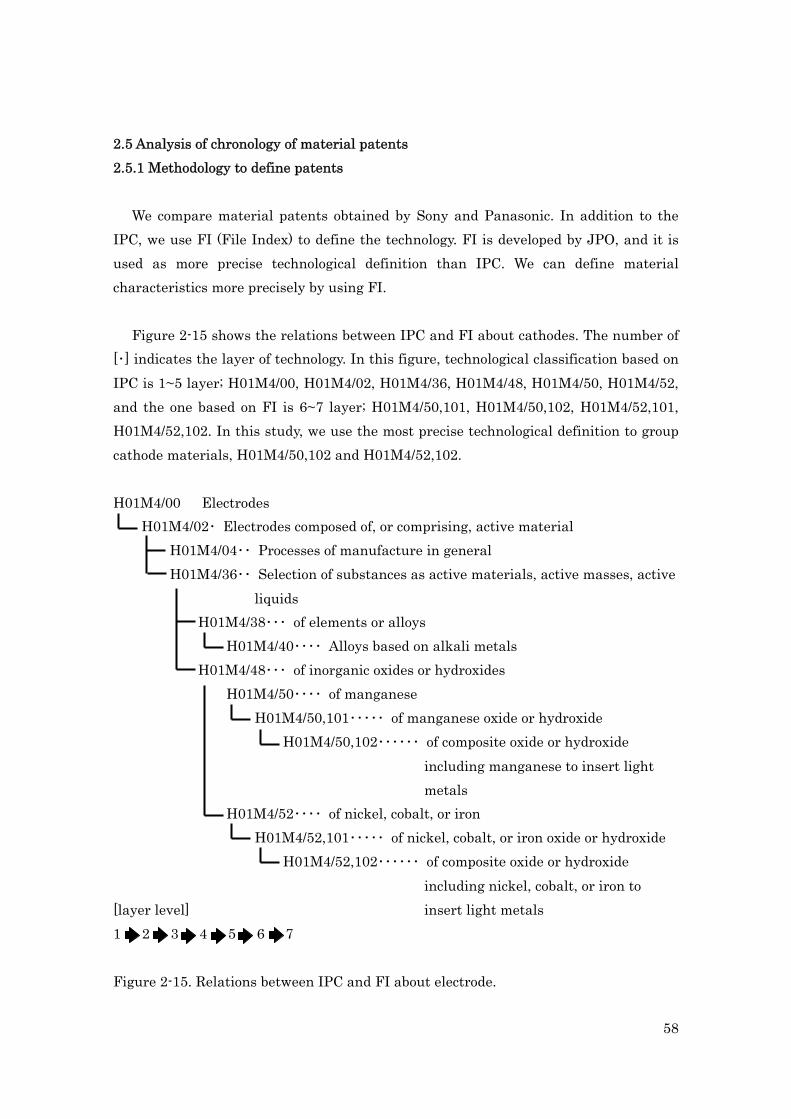
58
2.5 Analysis of chronology of material patents 2.5.1 Methodology to define patents
We compare material patents obtained by Sony and Panasonic. In addition to the
IPC, we use FI (File Index) to define the technology. FI is developed by JPO, and it is used as more precise technological definition than IPC. We can define material characteristics more precisely by using FI.
Figure 2-15 shows the relations between IPC and FI about cathodes. The number of
[・] indicates the layer of technology. In this figure, technological classification based on IPC is 1~5 layer; H01M4/00, H01M4/02, H01M4/36, H01M4/48, H01M4/50, H01M4/52, and the one based on FI is 6~7 layer; H01M4/50,101, H01M4/50,102, H01M4/52,101, H01M4/52,102. In this study, we use the most precise technological definition to group cathode materials, H01M4/50,102 and H01M4/52,102. H01M4/00 Electrodes H01M4/02・ Electrodes composed of, or comprising, active material H01M4/04・・ Processes of manufacture in general H01M4/36・・ Selection of substances as active materials, active masses, active
liquids H01M4/38・・・ of elements or alloys H01M4/40・・・・ Alloys based on alkali metals H01M4/48・・・ of inorganic oxides or hydroxides H01M4/50・・・・ of manganese H01M4/50,101・・・・・ of manganese oxide or hydroxide H01M4/50,102・・・・・・ of composite oxide or hydroxide
including manganese to insert light metals
H01M4/52・・・・ of nickel, cobalt, or iron H01M4/52,101・・・・・ of nickel, cobalt, or iron oxide or hydroxide H01M4/52,102・・・・・・ of composite oxide or hydroxide
including nickel, cobalt, or iron to [layer level] insert light metals 1 2 3 4 5 6 7 Figure 2-15. Relations between IPC and FI about electrode.
59
2.5.2 Methodology to group the development of materials As described in Chapter I, after the practical use of LIB started, technological
functionality of electrode plays a significant role in leading the LIB innovation process. This functionality of electrode depends on the development of cathode materials.
As the main technological functionality of cathode materials, improvement of energy density is required to generate higher energy as LIB. The development of IT and the diffusion of digital equipment, especially cellular phones, are considered as the main reason for the demand. In fact, multiple functions of cellular phones are attributed to the improvement of energy density of cathode materials.
Additionally, as one of the structural characteristics of LIB, organic solvent which
can easily burn has to be used as the electrolyte to transfer lithium between cathode and anode. With the improvement of energy density, stability of materials also needs to be developed. It is because cathode materials must withstand heavy heat load when energy is generated on the electrode. The thermotolerance of materials depends on a material structure like simple material and composite material. The material structure of composite material is composed of two or more elements such as nickel-cobalt or manganese-cobalt, in contrast to simple material which is mainly composed of only one element. Therefore, composite materials have a more complicated material structure than simple materials, because nickel atoms or manganese atoms are inserted among the cobalt atoms. While discharging or recharging, lithium-ions hardly move in such a complicated material structure, and it can lead the deceleration of chemical reaction velocity. This deceleration reduces the heat load on cathode materials per unit time, and it contributes to long-lasting materials.
Thus, material innovation in the development of energy density and stability has a
significant role in leading the LIB innovation process. In order to satisfy the aforementioned two requirements simultaneously, simple materials needs to be developed into composite materials. It is because these simple materials and composite materials have physically different structures, and appearance of composite materials is essential to improve the stability of cathode materials. Along with the development of these two functionalities of cathode materials, we classify the innovation process of cathode materials into the following five groups (Ohzuku et al., 2007):
60
(1) The first material used in LIB is the lithium-cobalt oxide, which is mainly composed of cobalt; for instance, LiCoxO2 can be classified into this group. We call this material 1st material. As previously noted, LIB was first manufactured by Sony in 1991, and this material has been used since then. It is because cobalt is known as a material having desirable electric characteristics (Nagaura, 1991; Sekai et al., 1993).
(2) The second material used in LIB is the lithium-nickel (or manganese) oxide, which is mainly composed of nickel (or manganese); for instance, LiNixO2, LiMnxO4 can be classified into this group. We call this material 2nd material. Although cobalt was used in LIB as the desirable material at first, cobalt is known as an expensive rare metal because of its unavailability. Therefore, materials like nickel and manganese were expected to be alternative materials of cobalt, so that R&D in these materials was encouraged after the appearance of 1st material in the late 1990s (Amatucci et al., 2002; Gummow et al., 1994).
(3) The third material used in LIB is the lithium-nickel (or manganese)-cobalt oxide, which is mainly composed of nickel (or manganese) and cobalt; for instance, LiNixCoyO2, LiMnxCoyO4 can be classified into this group. We call this material 3rd material. The improvement of energy density was accelerated in the 1990s, but the development turned to be decelerated after 2000. One of reasons could be that 1st material and 2nd material reached their performance limit, and new composite materials were required after 2000. Then, composite materials in which a portion of cobalt was replaced with nickel (or manganese) were invented in the early 2000s to provide higher energy density than traditional materials and constituted a desirable material structure for heat load (Armstrong et al., 2002; Ohzuku et al., 1993).
(4) The fourth material used in LIB is the lithium-nickel-manganese-cobalt oxide, which is mainly composed of nickel, manganese, and cobalt; for instance, LiNixMnyCozO2
can be classified into this group. We call this material 4th material. A portion of cobalt was replaced with both nickel and manganese. This material was diffused rapidly in the late 2000s (Koyama et al., 2004 a, 2004 b; Yoshizawa et al., 2003).
(5) The fifth material used in LIB is the lithium-nickel-manganese oxide, which is mainly composed of nickel and manganese; for instance, LiNixMnyO2 can be classified into this group. We call this material 5th material. This material hasn’t put into practical use yet, but it is expected as the next generation material. Because it makes electrodes work without cobalt (Gopukumar et al., 2004; Jae-Won et al., 2009; Makimura et al., 2003; Yoncheva et al., 2007, 2009).
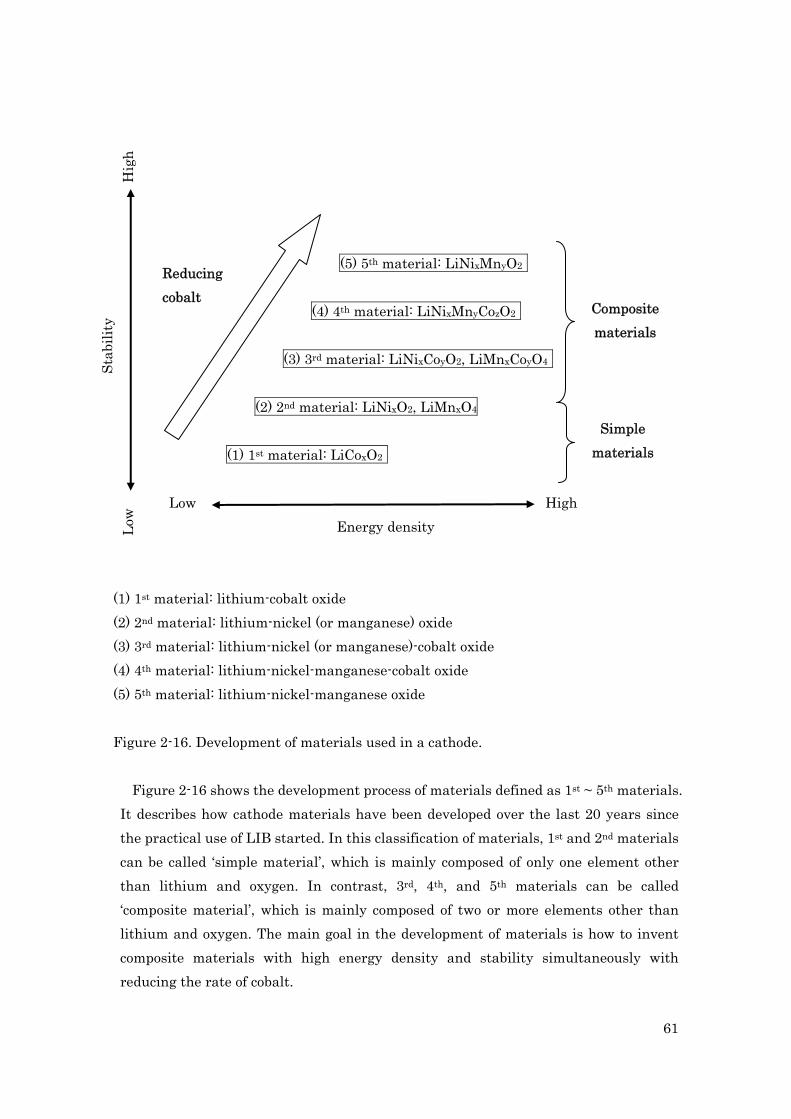
61
(5) 5th material: LiNixMnyO2
(4) 4th material: LiNixMnyCozO2
(3) 3rd material: LiNixCoyO2, LiMnxCoyO4
(2) 2nd material: LiNixO2, LiMnxO4
(1) 1st material: LiCoxO2
Low High Energy density
(1) 1st material: lithium-cobalt oxide (2) 2nd material: lithium-nickel (or manganese) oxide (3) 3rd material: lithium-nickel (or manganese)-cobalt oxide (4) 4th material: lithium-nickel-manganese-cobalt oxide (5) 5th material: lithium-nickel-manganese oxide Figure 2-16. Development of materials used in a cathode.
Figure 2-16 shows the development process of materials defined as 1st ~ 5th materials. It describes how cathode materials have been developed over the last 20 years since the practical use of LIB started. In this classification of materials, 1st and 2nd materials can be called ‘simple material’, which is mainly composed of only one element other than lithium and oxygen. In contrast, 3rd, 4th, and 5th materials can be called ‘composite material’, which is mainly composed of two or more elements other than lithium and oxygen. The main goal in the development of materials is how to invent composite materials with high energy density and stability simultaneously with reducing the rate of cobalt.
Hig
h
Reducing cobalt
Compositematerials
Stab
ility
Lo
w
Simple materials
62
In addition to energy density and stability of materials, how to reduce the degree of cobalt has also been discussed in the development of cathode materials. In the 1990s, cathodes were mainly made from lithium-cobalt oxide with suitable electrical characteristics, and cobalt was considered as the most appropriate material at that time; however, one of drawbacks of using cobalt was its high price. Although LIB with high energy density could be achieved by using cobalt as cathode material, cobalt was an expensive rare metal. If the cobalt content in composite material was increased in order to provide high energy density, these composite materials became more expensive. In order to deal with this contradicted demand, composite materials in which a portion of cobalt was replaced with nickel (or manganese) began to be investigated after 2000. Therefore, a main R&D subject has been to improve the energy density of composite materials to a level as high as cobalt. Composite materials became necessary to reduce the use of cobalt and improve the energy density with new demand for LIB in the 2000s (Lin et al., 2008).
The success of 5th material is expected in the near future due to the unavailability of cobalt. Cobalt is restricted in some regions like the Congo in Africa. The Congo holds the largest cobalt reserves, and it is estimated to represents 50% of the world cobalt reserves. Cobalt is mined and produced in many countries such as Australia, Finland, Canada, and Zambia. Japanese firms have to import cobalt from these producing countries; however, this international trade is influenced by many factors like politics and economics. Thus, it is critical for Japan to ensure a stable supply of energy to advance the development of every product which derives energy from LIB. Therefore, it is valuable to invent new materials which depend less on cobalt to lead innovation for the world’s energy.
The LIB industry could no longer rely on lithium-cobalt oxide to produce electrodes as
they had been in the early 1990s, and firms had to develop new materials with more suitable characteristics that would satisfy requirements of lowering cost and improving the technological functionality.
Based on the material classification exhibited in Figure 2-16, we analyze patents obtained by Sony and Panasonic and establish the chronology of development of material technology in each firm.
63
2.5.3 Data construction
In this study, we analyze the LIB innovation process in Sony and Panasonic by using patent data. First, we compared diffusion trajectories of electrode technology in Sony and Panasonic. Numerical analysis was conducted by utilizing the bi-logistic function model and patent data classified into ‘Structure and Electrode’ defined by IPC. In addition to this numerical analysis, we classify the development of cathode materials into five groups and compare chronologies of material patents obtained by Sony and Panasonic.
Table 2-8 and Table 2-9 show the chronology of material patents obtained by Sony and Panasonic, respectively. In these tables, every patent is extracted which is classified as H01M4/50,102 or H01M4/52,102 and filed by Sony and Panasonic in JPO during 1991-2009.
In these tables, ‘Date’ indicates the filing date. ‘Number’ indicates the patent number. ‘Chemical formula’ indicates the chemical formula described in the main claim of patents. ‘Details’ indicates the numerical range of composite materials and the combination of added metals. Technological information in ‘Details’ is collected from patent claims and patent specifications. ‘Category’ indicates the material classification among (1) ~ (5) which is defined in Figure 2-16. In this ‘Category’, material technology is classified into five groups on the basis of ‘Chemical formula’ and ‘Details’.
The data of patent applications are obtained by a retrieval of patent data in “Industrial Property Digital Library” provided by National Center for Industrial Property Information and Training in Japan.
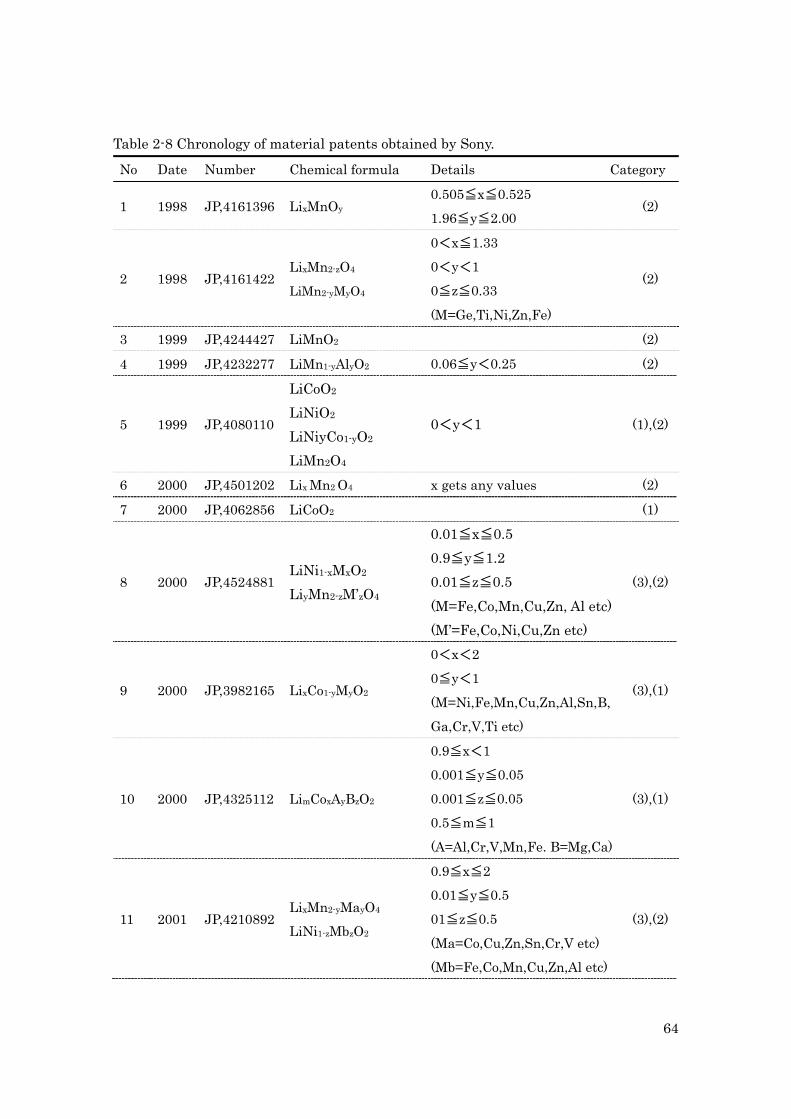
64
Table 2-8 Chronology of material patents obtained by Sony.
No Date Number Chemical formula Details Category
1 1998 JP,4161396 LixMnOy 0.505≦x≦0.525
1.96≦y≦2.00 (2)
2 1998 JP,4161422 LixMn2-zO4
LiMn2-yMyO4
0<x≦1.33
0<y<1
0≦z≦0.33
(M=Ge,Ti,Ni,Zn,Fe)
(2)
3 1999 JP,4244427 LiMnO2 (2)
4 1999 JP,4232277 LiMn1-yAlyO2 0.06≦y<0.25 (2)
5 1999 JP,4080110
LiCoO2 LiNiO2 LiNiyCo1-yO2 LiMn2O4
0<y<1 (1),(2)
6 2000 JP,4501202 Lix Mn2 O4 x gets any values (2)
7 2000 JP,4062856 LiCoO2 (1)
8 2000 JP,4524881 LiNi1-xMxO2
LiyMn2-zM’zO4
0.01≦x≦0.5 0.9≦y≦1.2 0.01≦z≦0.5 (M=Fe,Co,Mn,Cu,Zn, Al etc) (M’=Fe,Co,Ni,Cu,Zn etc)
(3),(2)
9 2000 JP,3982165 LixCo1-yMyO2
0<x<2
0≦y<1
(M=Ni,Fe,Mn,Cu,Zn,Al,Sn,B,
Ga,Cr,V,Ti etc)
(3),(1)
10 2000 JP,4325112 LimCoxAyBzO2
0.9≦x<1
0.001≦y≦0.05
0.001≦z≦0.05
0.5≦m≦1
(A=Al,Cr,V,Mn,Fe. B=Mg,Ca)
(3),(1)
11 2001 JP,4210892 LixMn2-yMayO4
LiNi1-zMbzO2
0.9≦x≦2
0.01≦y≦0.5
01≦z≦0.5
(Ma=Co,Cu,Zn,Sn,Cr,V etc)
(Mb=Fe,Co,Mn,Cu,Zn,Al etc)
(3),(2)
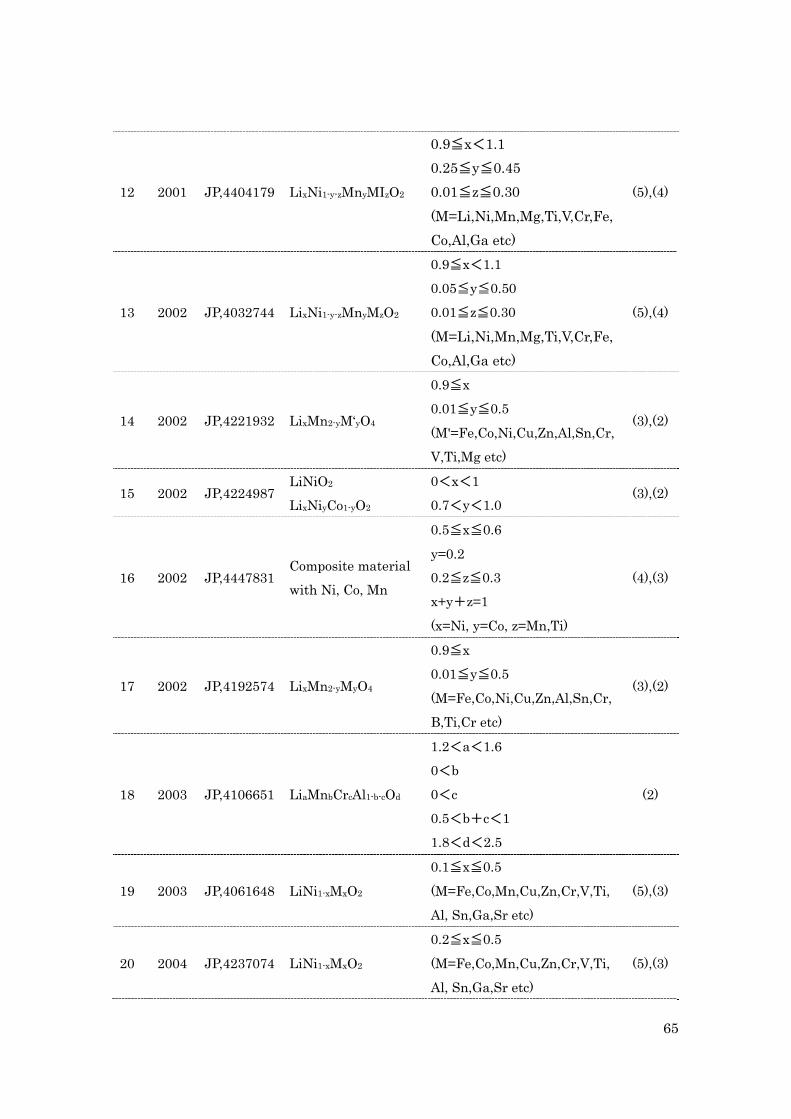
65
12 2001 JP,4404179 LixNi1-y-zMnyMIzO2
0.9≦x<1.1 0.25≦y≦0.45 0.01≦z≦0.30 (M=Li,Ni,Mn,Mg,Ti,V,Cr,Fe,Co,Al,Ga etc)
(5),(4)
13 2002 JP,4032744 LixNi1-y-zMnyMzO2
0.9≦x<1.1
0.05≦y≦0.50
0.01≦z≦0.30
(M=Li,Ni,Mn,Mg,Ti,V,Cr,Fe,Co,Al,Ga etc)
(5),(4)
14 2002 JP,4221932 LixMn2-yM‘yO4
0.9≦x
0.01≦y≦0.5
(M'=Fe,Co,Ni,Cu,Zn,Al,Sn,Cr,
V,Ti,Mg etc)
(3),(2)
15 2002 JP,4224987 LiNiO2
LixNiyCo1-yO2
0<x<1
0.7<y<1.0 (3),(2)
16 2002 JP,4447831 Composite material
with Ni, Co, Mn
0.5≦x≦0.6
y=0.2 0.2≦z≦0.3
x+y+z=1
(x=Ni, y=Co, z=Mn,Ti)
(4),(3)
17 2002 JP,4192574 LixMn2-yMyO4
0.9≦x
0.01≦y≦0.5
(M=Fe,Co,Ni,Cu,Zn,Al,Sn,Cr,
B,Ti,Cr etc)
(3),(2)
18 2003 JP,4106651 LiaMnbCrcAl1-b-cOd
1.2<a<1.6
0<b
0<c
0.5<b+c<1
1.8<d<2.5
(2)
19 2003 JP,4061648 LiNi1-xMxO2
0.1≦x≦0.5
(M=Fe,Co,Mn,Cu,Zn,Cr,V,Ti,
Al, Sn,Ga,Sr etc)
(5),(3)
20 2004 JP,4237074 LiNi1-xMxO2
0.2≦x≦0.5
(M=Fe,Co,Mn,Cu,Zn,Cr,V,Ti,
Al, Sn,Ga,Sr etc)
(5),(3)
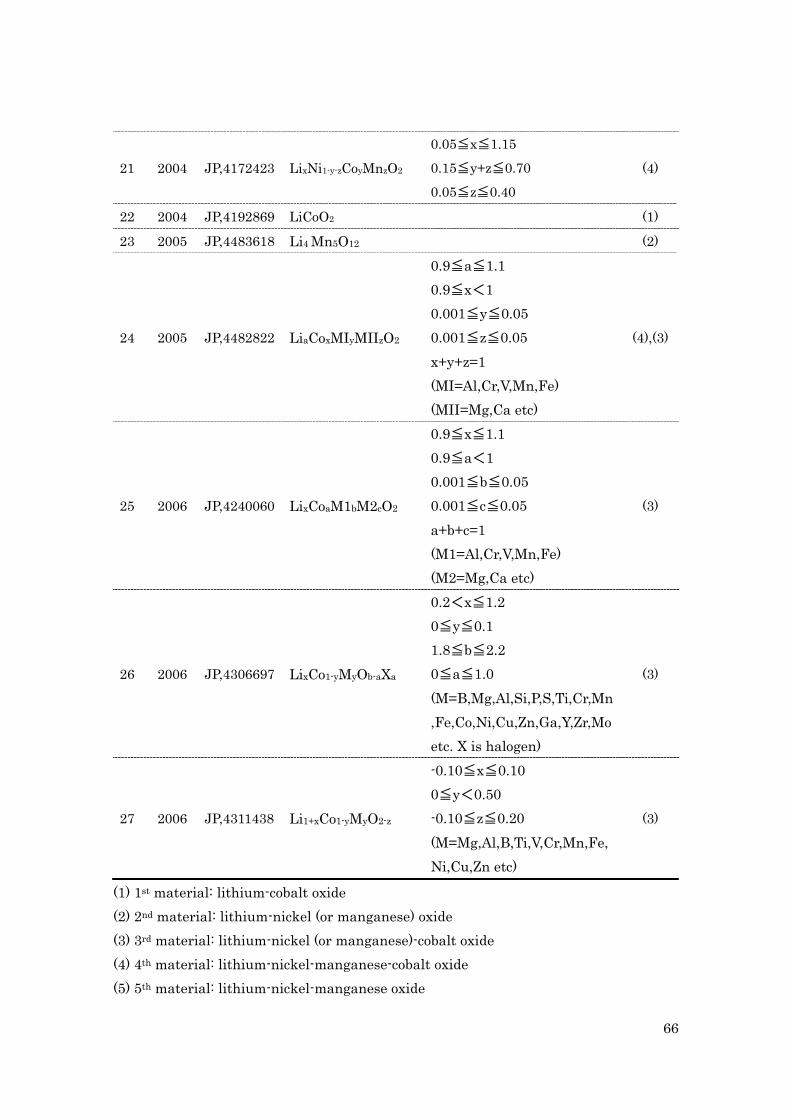
66
21 2004 JP,4172423 LixNi1-y-zCoyMnzO2
0.05≦x≦1.15
0.15≦y+z≦0.70
0.05≦z≦0.40 (4)
22 2004 JP,4192869 LiCoO2 (1)
23 2005 JP,4483618 Li4 Mn5O12 (2)
24 2005 JP,4482822 LiaCoxMIyMIIzO2
0.9≦a≦1.1 0.9≦x<1 0.001≦y≦0.05 0.001≦z≦0.05 x+y+z=1 (MI=Al,Cr,V,Mn,Fe) (MII=Mg,Ca etc)
(4),(3)
25 2006 JP,4240060 LixCoaM1bM2cO2
0.9≦x≦1.1 0.9≦a<1 0.001≦b≦0.05 0.001≦c≦0.05 a+b+c=1 (M1=Al,Cr,V,Mn,Fe) (M2=Mg,Ca etc)
(3)
26 2006 JP,4306697 LixCo1-yMyOb-aXa
0.2<x≦1.2 0≦y≦0.1 1.8≦b≦2.2 0≦a≦1.0 (M=B,Mg,Al,Si,P,S,Ti,Cr,Mn,Fe,Co,Ni,Cu,Zn,Ga,Y,Zr,Mo etc. X is halogen)
(3)
27 2006 JP,4311438 Li1+xCo1-yMyO2-z
-0.10≦x≦0.10 0≦y<0.50 -0.10≦z≦0.20 (M=Mg,Al,B,Ti,V,Cr,Mn,Fe,Ni,Cu,Zn etc)
(3)
(1) 1st material: lithium-cobalt oxide (2) 2nd material: lithium-nickel (or manganese) oxide (3) 3rd material: lithium-nickel (or manganese)-cobalt oxide (4) 4th material: lithium-nickel-manganese-cobalt oxide (5) 5th material: lithium-nickel-manganese oxide
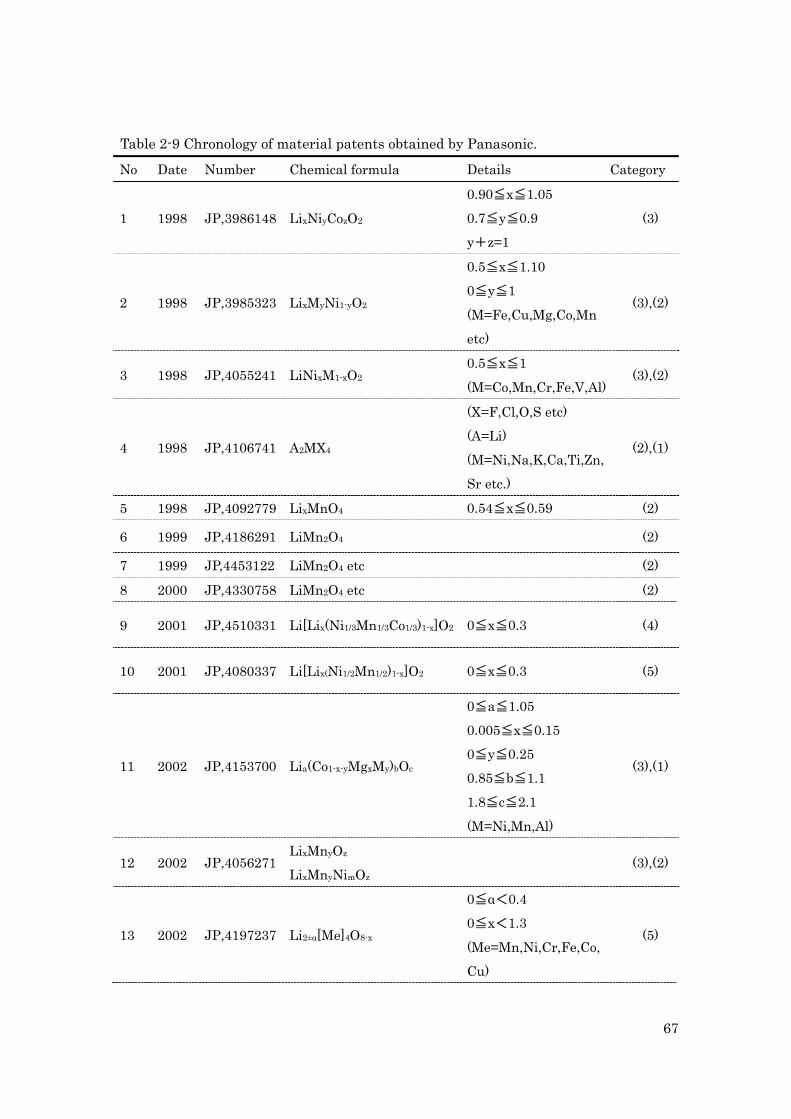
67
Table 2-9 Chronology of material patents obtained by Panasonic.
No Date Number Chemical formula Details Category
1 1998 JP,3986148 LixNiyCozO2
0.90≦x≦1.05
0.7≦y≦0.9
y+z=1 (3)
2 1998 JP,3985323 LixMyNi1-yO2
0.5≦x≦1.10
0≦y≦1
(M=Fe,Cu,Mg,Co,Mn
etc)
(3),(2)
3 1998 JP,4055241 LiNixM1-xO2 0.5≦x≦1
(M=Co,Mn,Cr,Fe,V,Al) (3),(2)
4 1998 JP,4106741 A2MX4
(X=F,Cl,O,S etc)
(A=Li)
(M=Ni,Na,K,Ca,Ti,Zn,
Sr etc.)
(2),(1)
5 1998 JP,4092779 LixMnO4 0.54≦x≦0.59 (2)
6 1999 JP,4186291 LiMn2O4 (2)
7 1999 JP,4453122 LiMn2O4 etc (2)
8 2000 JP,4330758 LiMn2O4 etc (2)
9 2001 JP,4510331 Li[Lix(Ni1/3Mn1/3Co1/3)1-x]O2 0≦x≦0.3 (4)
10 2001 JP,4080337 Li[Lix(Ni1/2Mn1/2)1-x]O2 0≦x≦0.3 (5)
11 2002 JP,4153700 Lia(Co1-x-yMgxMy)bOc
0≦a≦1.05
0.005≦x≦0.15
0≦y≦0.25
0.85≦b≦1.1
1.8≦c≦2.1
(M=Ni,Mn,Al)
(3),(1)
12 2002 JP,4056271 LixMnyOz
LixMnyNimOz (3),(2)
13 2002 JP,4197237 Li2±α[Me]4O8-x
0≦α<0.4
0≦x<1.3
(Me=Mn,Ni,Cr,Fe,Co,
Cu)
(5)
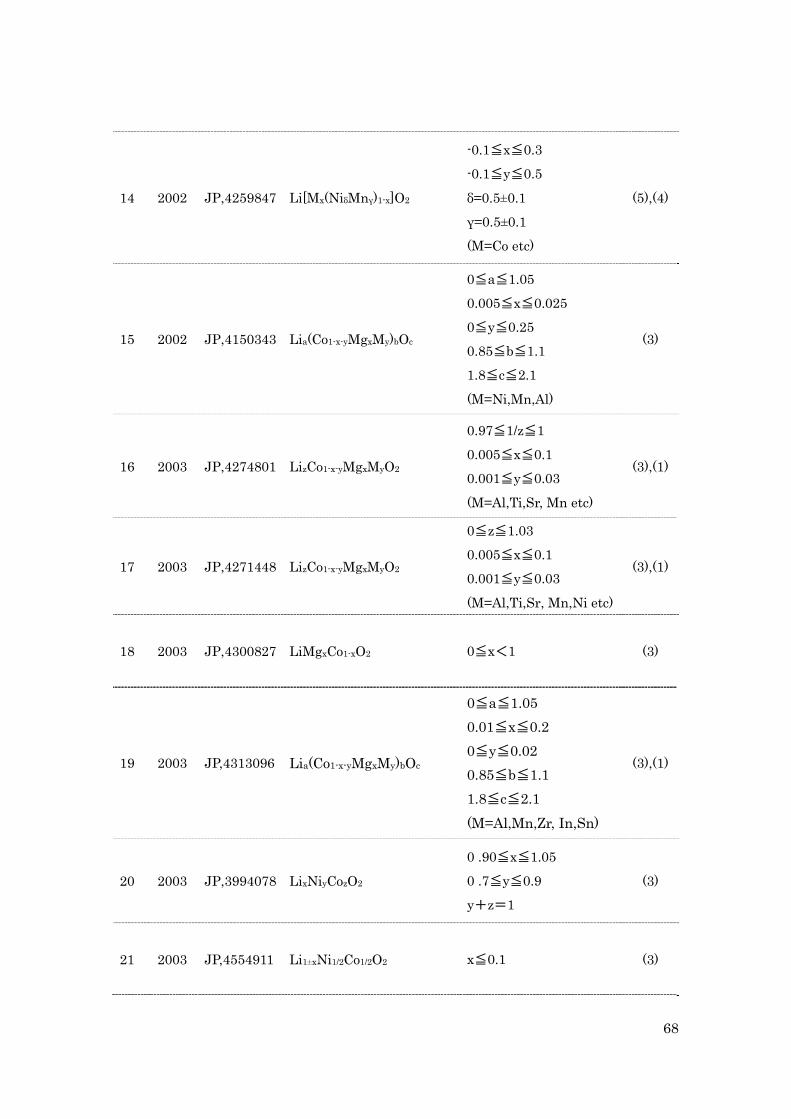
68
14 2002 JP,4259847 Li[Mx(NiδMnγ)1-x]O2
-0.1≦x≦0.3
-0.1≦y≦0.5
δ=0.5±0.1
γ=0.5±0.1
(M=Co etc)
(5),(4)
15 2002 JP,4150343 Lia(Co1-x-yMgxMy)bOc
0≦a≦1.05
0.005≦x≦0.025
0≦y≦0.25
0.85≦b≦1.1
1.8≦c≦2.1
(M=Ni,Mn,Al)
(3)
16 2003 JP,4274801 LizCo1-x-yMgxMyO2
0.97≦1/z≦1
0.005≦x≦0.1
0.001≦y≦0.03
(M=Al,Ti,Sr, Mn etc)
(3),(1)
17 2003 JP,4271448 LizCo1-x-yMgxMyO2
0≦z≦1.03
0.005≦x≦0.1
0.001≦y≦0.03
(M=Al,Ti,Sr, Mn,Ni etc)
(3),(1)
18 2003 JP,4300827 LiMgxCo1-xO2
0≦x<1
(3)
19 2003 JP,4313096 Lia(Co1-x-yMgxMy)bOc
0≦a≦1.05 0.01≦x≦0.2 0≦y≦0.02 0.85≦b≦1.1 1.8≦c≦2.1 (M=Al,Mn,Zr, In,Sn)
(3),(1)
20 2003 JP,3994078 LixNiyCozO2
0 .90≦x≦1.05
0 .7≦y≦0.9
y+z=1 (3)
21 2003 JP,4554911 Li1±xNi1/2Co1/2O2
x≦0.1
(3)
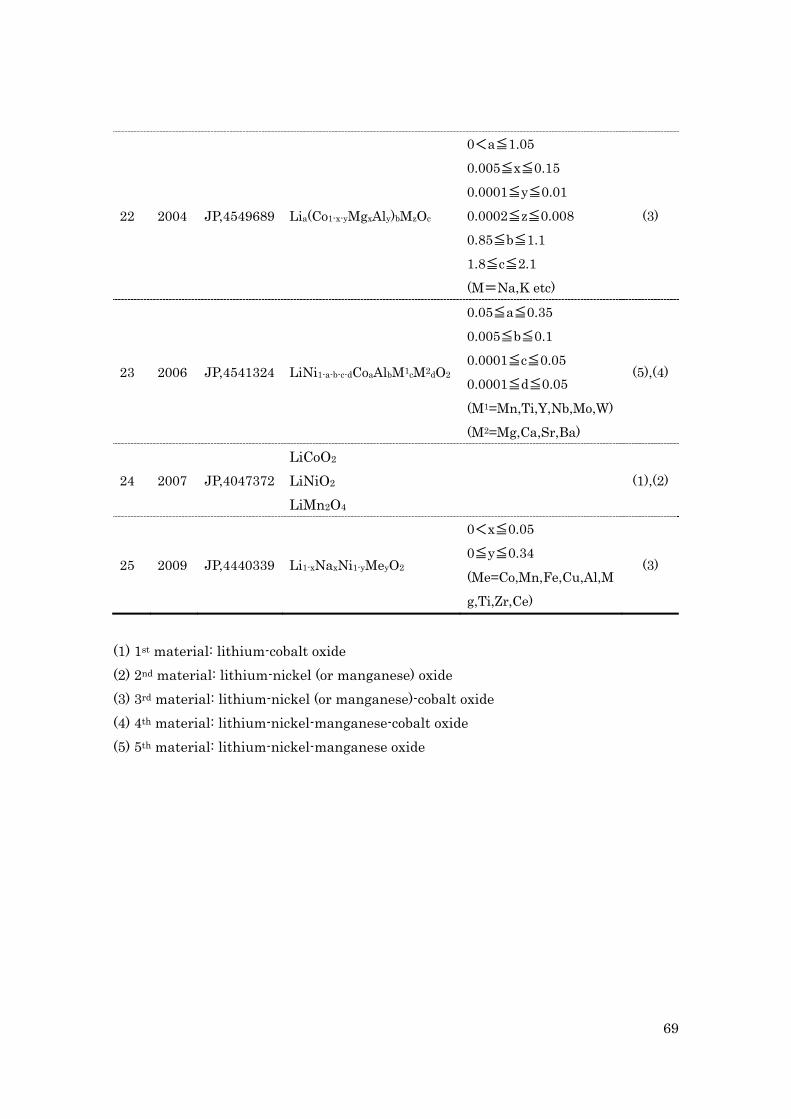
69
22 2004 JP,4549689 Lia(Co1-x-yMgxAly)bMzOc
0<a≦1.05
0.005≦x≦0.15
0.0001≦y≦0.01
0.0002≦z≦0.008
0.85≦b≦1.1
1.8≦c≦2.1
(M=Na,K etc)
(3)
23 2006 JP,4541324 LiNi1-a-b-c-dCoaAlbM1cM2dO2
0.05≦a≦0.35
0.005≦b≦0.1
0.0001≦c≦0.05
0.0001≦d≦0.05
(M1=Mn,Ti,Y,Nb,Mo,W)
(M2=Mg,Ca,Sr,Ba)
(5),(4)
24 2007 JP,4047372 LiCoO2 LiNiO2 LiMn2O4
(1),(2)
25 2009 JP,4440339 Li1-xNaxNi1-yMeyO2
0<x≦0.05
0≦y≦0.34
(Me=Co,Mn,Fe,Cu,Al,M
g,Ti,Zr,Ce)
(3)
(1) 1st material: lithium-cobalt oxide (2) 2nd material: lithium-nickel (or manganese) oxide (3) 3rd material: lithium-nickel (or manganese)-cobalt oxide (4) 4th material: lithium-nickel-manganese-cobalt oxide (5) 5th material: lithium-nickel-manganese oxide
70
2.5.4 The results of analysis
In the case of LIB industry, it is useful to observe the timing of when R&D in material technology was switched from simple materials to composite materials. In order to investigate this, we compared the timing of when patents of composite materials were filed by Sony and Panasonic. As previously explained, ‘first-to-file principles’ was introduced by JPO, therefore early filing of patent application is necessary to have superiorities for other later patent applications.
In the case of Sony, Table 2-8 demonstrates that the first patent of composite material was filed in 2000. While most patents of 1st and 2nd materials were filed before 2000, patents of 3rd, 4th, and 5th materials were filed after 2000. Thus, R&D was switched to the composite materials after 2000. Additionally, we discuss the trends in chronology with the numerical results from a bi-logistic function model. According to Figure 2-14, it appears that the 2nd wave of Sony started in around 2000. This emergence of composite materials corresponds to the start-up of 2nd wave in Sony.
In the case of Panasonic, Table 2-9 demonstrates that the first patent of composite
material was filed in 1998. It suggests that R&D in Panasonic was switched from patents of 1st and 2nd materials to patents of 3rd, 4th, and 5th materials about two years earlier than Sony. It can be said that the 2nd wave of Panasonic started in around 1998 by referring Figure 2-14. This emergence of composite materials corresponds to the start-up of 2nd wave in Panasonic.
After the practical use of LIB started, both Sony and Panasonic were competing to invent new materials. The results of chronological analysis of material patents suggested that the start-up of 2nd wave corresponds to the emergence of composite materials in both firms. Additionally, it was also revealed that the number of patents of simple materials has decreased and that of composite materials has increased since 2000. It is assumed that the emergence of composite material leveraged the shift from 1st wave to 2nd wave.
Thus, based on the results of numerical analysis and chronological analysis, it can be said that Panasonic demonstrated earlier development of material technology than Sony. Panasonic’s prompt undertaking in the 2nd wave in the diffusion trajectory of electrode technology was initiated by the development of composite materials.
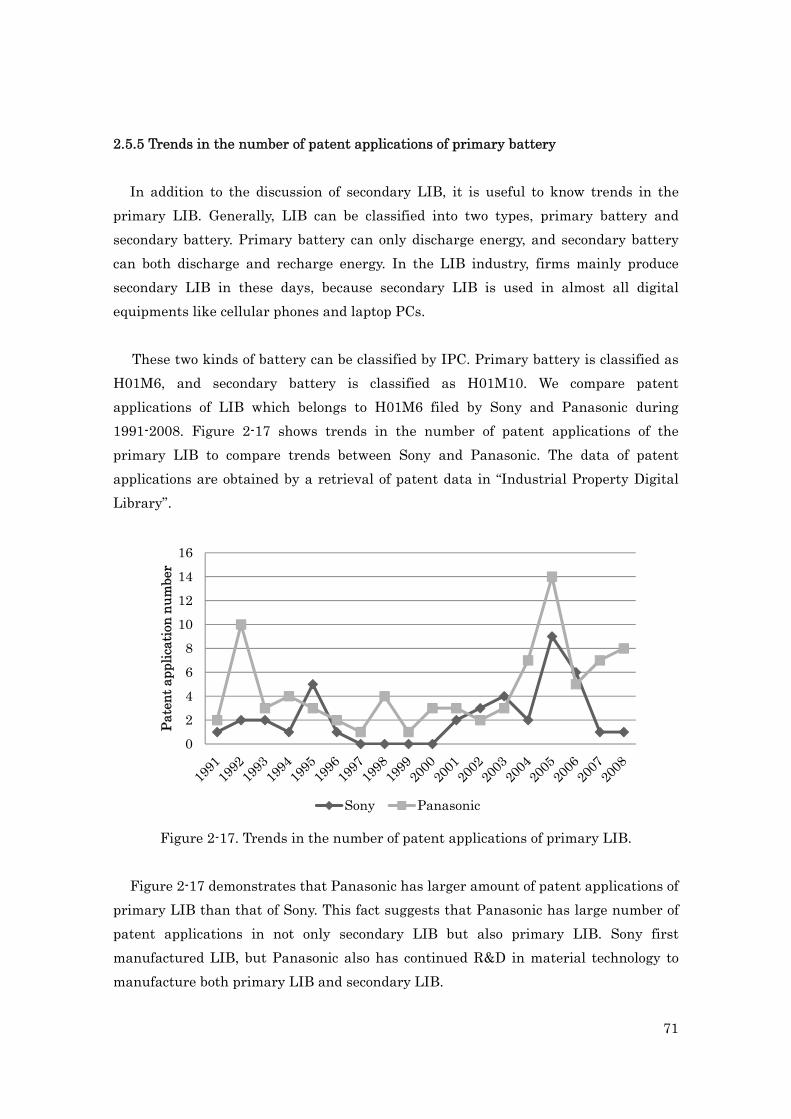
71
2.5.5 Trends in the number of patent applications of primary battery
In addition to the discussion of secondary LIB, it is useful to know trends in the primary LIB. Generally, LIB can be classified into two types, primary battery and secondary battery. Primary battery can only discharge energy, and secondary battery can both discharge and recharge energy. In the LIB industry, firms mainly produce secondary LIB in these days, because secondary LIB is used in almost all digital equipments like cellular phones and laptop PCs.
These two kinds of battery can be classified by IPC. Primary battery is classified as H01M6, and secondary battery is classified as H01M10. We compare patent applications of LIB which belongs to H01M6 filed by Sony and Panasonic during 1991-2008. Figure 2-17 shows trends in the number of patent applications of the primary LIB to compare trends between Sony and Panasonic. The data of patent applications are obtained by a retrieval of patent data in “Industrial Property Digital Library”.
Figure 2-17. Trends in the number of patent applications of primary LIB.
Figure 2-17 demonstrates that Panasonic has larger amount of patent applications of
primary LIB than that of Sony. This fact suggests that Panasonic has large number of patent applications in not only secondary LIB but also primary LIB. Sony first manufactured LIB, but Panasonic also has continued R&D in material technology to manufacture both primary LIB and secondary LIB.
0
2
46
810
1214
16
Pate
nt a
pplic
atio
n nu
mbe
r
Sony Panasonic
72
2.6 Discussion
It is useful to discuss what Panasonic did between 4th quarter, 1995 (t1 of 1st wave) and 2nd quarter, 2004 (t1 of 2nd wave). It could be considered that timely invention of composite materials encouraged the Panasonic’s earlier start-up on the diffusion trajectory of electrode technology. According to the NIKKEI news paper (Appendix A, B), one of differences between Sony and Panasonic was the collaborative R&D with different industries. In 2000, president of Panasonic stated to advance cross-industrial associations to survive the global competition.
Mr. Kunio Nakamura was elected as the president of Panasonic in June 2000. Nakamura has implemented the restructuring of organization under the theme of ‘Destruction and Creation’ since the appointment as president. In fact, Nakamura announced that cross-industrial association was the key to survive the global competition, and has encouraged collaborative R&D with other firms and universities since 2000. It is assumed that such collaborative R&D would help the development of material technology in Panasonic.
The importance of such open innovations is pointed in many previous works (Chesbrough et al., 2002, 2003, 2006; Grove, 1996; Millson and Wielmon, 2006). Additionally, many previous works demonstrated that technology spillover plays an important role in innovation (Watanabe et al., 2002, 2003; Verspagen and Loo, 1999; Cohen and Levinthal 1989, 1990). The importance of relationships between university-industry has been discussed (Audretsch and Lehmann, 2005; Kelly and Nakosteen, 2005; Tanabe and Watanabe, 2005). In fact, in 2001 and in 2006, Japanese government started the second and third “Science and Technology basic plans” to encourage academia-industry cooperation. It seems that cross-industrial associations could contribute the development of material technology in Panasonic.
Based on the foregoing observation, it could be considered that Panasonic has
encouraged the cross-industrial associations since 2000, and it contributed to the rapid growth of diffusion trajectory of electrode technology. In collaborative R&D, it could provide opportunities for inventors to gather knowledge relating to material technology widely from outside and exchange knowledge to expand the opportunities of research. Then, knowledge relating to material technology spilled into Panasonic, and it could account for the prompt development of composite materials.

73
2.7 Conclusion In conclusion, it was revealed that Panasonic succeeded in prompt undertaking in
the 2nd wave on the diffusion trajectory of electrode technology earlier than Sony. Additionally, it was also revealed that Panasonic obtained the patents of composite materials earlier than Sony. It can be said that Panasonic’s prompt undertaking in the 2nd wave in the diffusion trajectory was initiated by the development of composite materials.
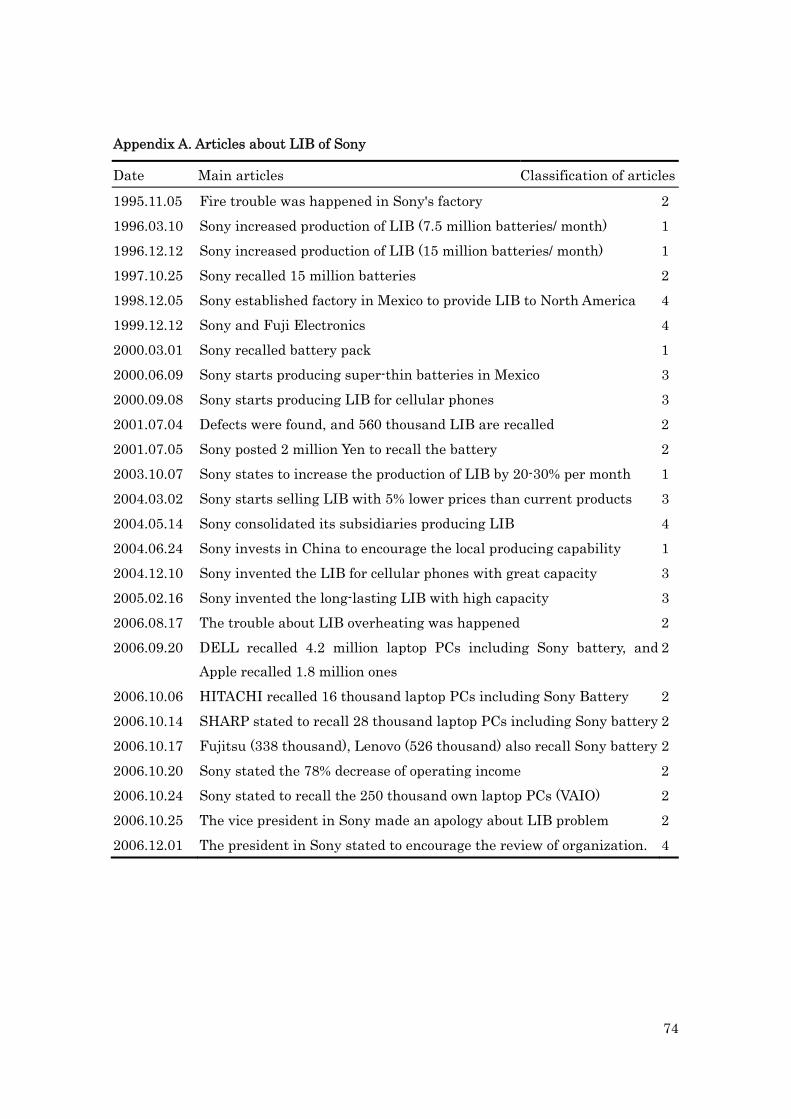
74
Appendix A. Articles about LIB of Sony
Date Main articles Classification of articles
1995.11.05 Fire trouble was happened in Sony's factory 2 1996.03.10 Sony increased production of LIB (7.5 million batteries/ month) 1 1996.12.12 Sony increased production of LIB (15 million batteries/ month) 1 1997.10.25 Sony recalled 15 million batteries 2 1998.12.05 Sony established factory in Mexico to provide LIB to North America 4 1999.12.12 Sony and Fuji Electronics 4 2000.03.01 Sony recalled battery pack 1 2000.06.09 Sony starts producing super-thin batteries in Mexico 3 2000.09.08 Sony starts producing LIB for cellular phones 3 2001.07.04 Defects were found, and 560 thousand LIB are recalled 2 2001.07.05 Sony posted 2 million Yen to recall the battery 2 2003.10.07 Sony states to increase the production of LIB by 20-30% per month 1 2004.03.02 Sony starts selling LIB with 5% lower prices than current products 3 2004.05.14 Sony consolidated its subsidiaries producing LIB 4 2004.06.24 Sony invests in China to encourage the local producing capability 1 2004.12.10 Sony invented the LIB for cellular phones with great capacity 3 2005.02.16 Sony invented the long-lasting LIB with high capacity 3 2006.08.17 The trouble about LIB overheating was happened 2 2006.09.20 DELL recalled 4.2 million laptop PCs including Sony battery, and
Apple recalled 1.8 million ones 2
2006.10.06 HITACHI recalled 16 thousand laptop PCs including Sony Battery 2 2006.10.14 SHARP stated to recall 28 thousand laptop PCs including Sony battery 2 2006.10.17 Fujitsu (338 thousand), Lenovo (526 thousand) also recall Sony battery 2 2006.10.20 Sony stated the 78% decrease of operating income 2 2006.10.24 Sony stated to recall the 250 thousand own laptop PCs (VAIO) 2 2006.10.25 The vice president in Sony made an apology about LIB problem 2 2006.12.01 The president in Sony stated to encourage the review of organization. 4
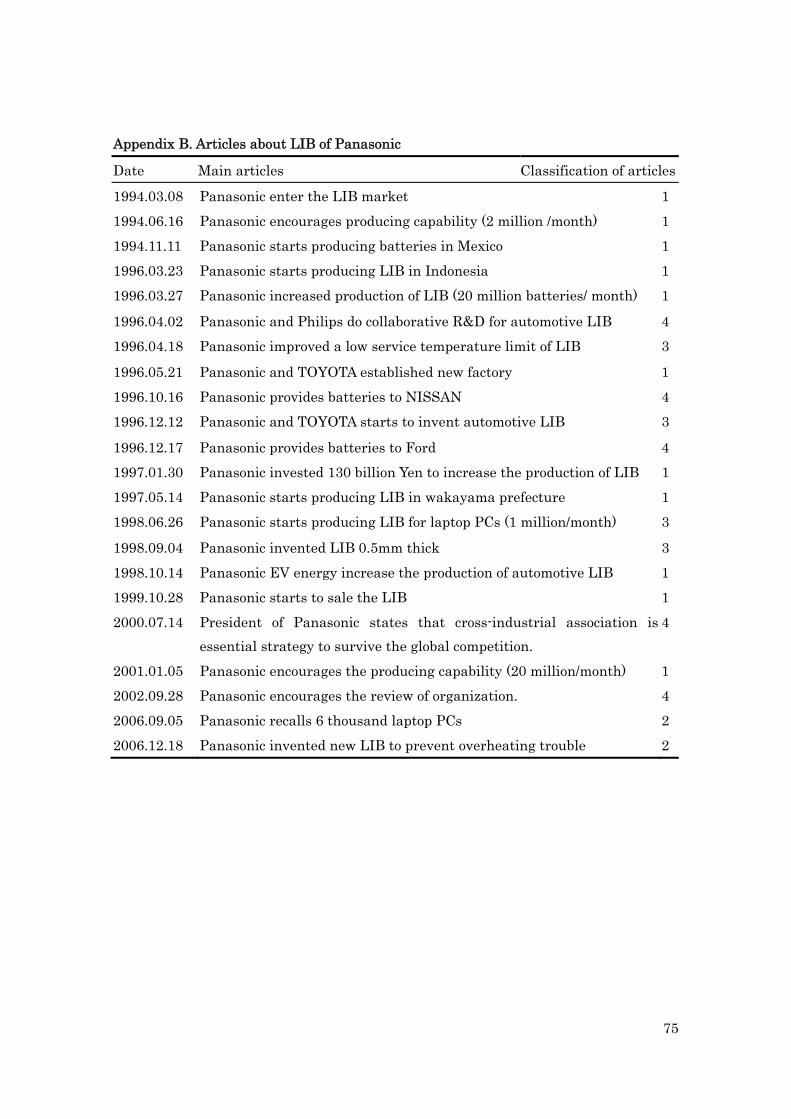
75
Appendix B. Articles about LIB of Panasonic
Date Main articles Classification of articles
1994.03.08 Panasonic enter the LIB market 1 1994.06.16 Panasonic encourages producing capability (2 million /month) 1 1994.11.11 Panasonic starts producing batteries in Mexico 1 1996.03.23 Panasonic starts producing LIB in Indonesia 1 1996.03.27 Panasonic increased production of LIB (20 million batteries/ month) 1
1996.04.02 Panasonic and Philips do collaborative R&D for automotive LIB 4 1996.04.18 Panasonic improved a low service temperature limit of LIB 3
1996.05.21 Panasonic and TOYOTA established new factory 1 1996.10.16 Panasonic provides batteries to NISSAN 4 1996.12.12 Panasonic and TOYOTA starts to invent automotive LIB 3
1996.12.17 Panasonic provides batteries to Ford 4 1997.01.30 Panasonic invested 130 billion Yen to increase the production of LIB 1 1997.05.14 Panasonic starts producing LIB in wakayama prefecture 1 1998.06.26 Panasonic starts producing LIB for laptop PCs (1 million/month) 3
1998.09.04 Panasonic invented LIB 0.5mm thick 3 1998.10.14 Panasonic EV energy increase the production of automotive LIB 1 1999.10.28 Panasonic starts to sale the LIB 1 2000.07.14 President of Panasonic states that cross-industrial association is
essential strategy to survive the global competition. 4
2001.01.05 Panasonic encourages the producing capability (20 million/month) 1 2002.09.28 Panasonic encourages the review of organization. 4 2006.09.05 Panasonic recalls 6 thousand laptop PCs 2 2006.12.18 Panasonic invented new LIB to prevent overheating trouble 2
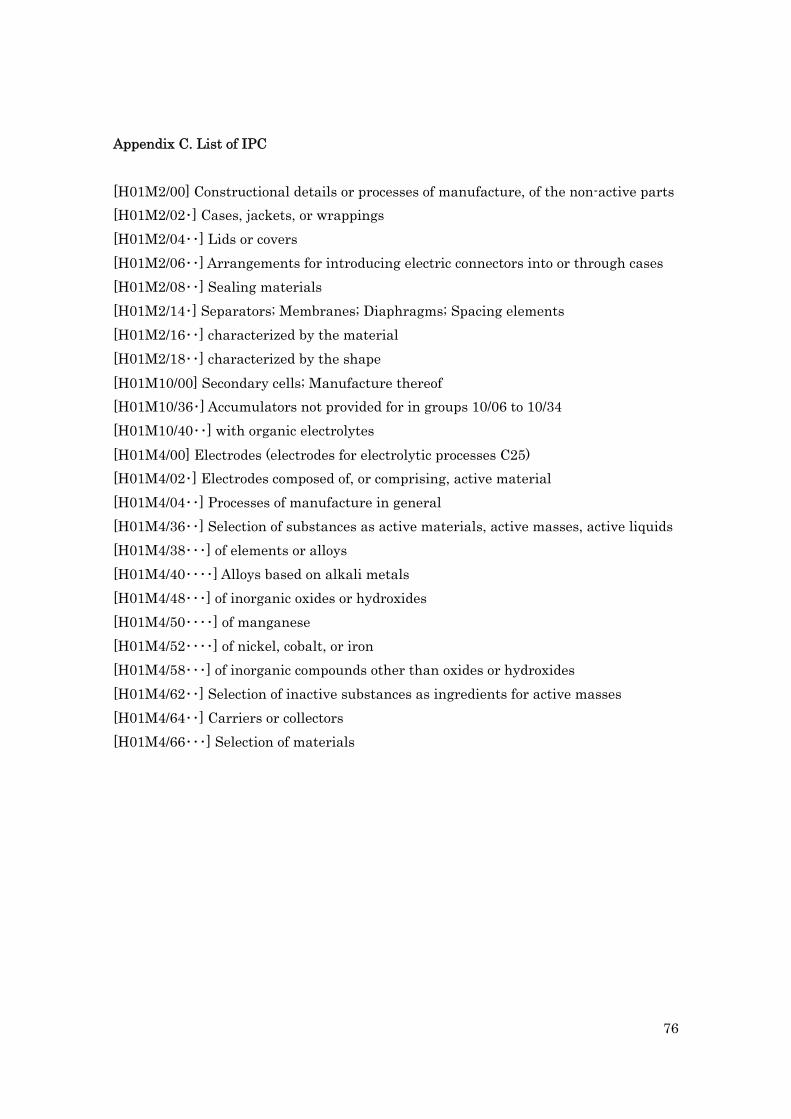
76
Appendix C. List of IPC
[H01M2/00] Constructional details or processes of manufacture, of the non-active parts [H01M2/02・] Cases, jackets, or wrappings [H01M2/04・・] Lids or covers [H01M2/06・・] Arrangements for introducing electric connectors into or through cases [H01M2/08・・] Sealing materials [H01M2/14・] Separators; Membranes; Diaphragms; Spacing elements [H01M2/16・・] characterized by the material [H01M2/18・・] characterized by the shape [H01M10/00] Secondary cells; Manufacture thereof [H01M10/36・] Accumulators not provided for in groups 10/06 to 10/34 [H01M10/40・・] with organic electrolytes [H01M4/00] Electrodes (electrodes for electrolytic processes C25) [H01M4/02・] Electrodes composed of, or comprising, active material [H01M4/04・・] Processes of manufacture in general [H01M4/36・・] Selection of substances as active materials, active masses, active liquids [H01M4/38・・・] of elements or alloys [H01M4/40・・・・] Alloys based on alkali metals [H01M4/48・・・] of inorganic oxides or hydroxides [H01M4/50・・・・] of manganese [H01M4/52・・・・] of nickel, cobalt, or iron [H01M4/58・・・] of inorganic compounds other than oxides or hydroxides [H01M4/62・・] Selection of inactive substances as ingredients for active masses [H01M4/64・・] Carriers or collectors [H01M4/66・・・] Selection of materials
77
References Amatucci, G and Tarascon, J.M. (2002), “Optimization of Insertion Compounds Such as
LiMn2O4 for Li-Ion Batteries”, J. lectrochem. Soc, 149(12), pp. K31-K46. Anderson, B. (1999). “The hunt for S-shaped growth paths in technological innovation: a
patent study”, Journal of Evolutionary Economics, 9 (4), pp. 486-526. Armstrong, A.R., Paterson, A.J., Robertson, A.D., Bruce, P.G. (2002) “Nonstoichiometric
Layered LixMnyO2 with a High Capacity for Lithium Intercalation/Deintercalation”, Chemistry of Materials, 14 , pp. 710-719.
Audretsch, D. B., Lehmann, E.E. (2005). “Does the knowledge spillover theory of entrepreneurship” hold for regions ?”, Research Policy, 34, pp. 1191-1201.
Cairncross, F. (1997). “The Death of Distance”, Harvard Business School Press, Boston. Chesbrough, H. (2003). “Open Innovation: the New Imperative for Creating the
Profiting from Technology”, Harvard Business School Press, Boston. Chesbrough, H., Rosenbloom, R. S. (2002). “The role of the business model in capturing
value from innovation: evidence from Xerox corporation’s technology spin-off companies”, Industrial and Corporation Change, 11 (3), pp. 529-555.
Chesbrough, H., Spohrer, J. (2006). “A research manifesto for service science”, Communication of the ACM, 49 (7), pp. 33-40.
Cohen, W. M., Levinthal, D. A. (1989). “Innovation and learning: the two faces of R&D”, The Economic Journal, 99, pp. 569-596.
Cohen, W. M., Levinthal, D. A. (1990). “Absorptive capacity: a new perspective on learning and innovation”, Administrative Science Quarterly, 35, pp.128-152.
Griliches, Z. (1957). “Hybrid corn: an explanation in the economics of technical change”, Econometrica, 25 (4), pp. 501-522.
Griliches, Z., Lichtenberg, F. (1984). “Interindustry Technology Flows and Productivity Growth: A Reexiamination”, Review of Economics and Statistics, 66, p.324.
Gopukumar, S., Kyung Yoon, C., Kwang Bum, K. (2004). “Novel synthesis of layered LiNi1/2Mn1/2O2 as cathode material for lithium rechargeable cells”, Electrochimica Acta, 49(5), pp. 803-810.
Grove, A. S. (1996). “Only the Paranoid Survive: How to Exploit the Crisis Points that Challenge Every Company”, Doubleday, New York.
Gummow, R.J., de Kock, A., Thackeray, M.M. (1994). “Improved capacity retention in rechargeable 4 V lithium/lithium-manganese oxide (spinel) cells”, Solid State Ionics, 69(1), pp. 59-67.
Jae-Won, L., Sun-Min, P., Hae-Jin, K. (2009). “Effect of LiNi1/2Mn1/2O2 coating on the
78
electrochemical performance of Li–Mn spinel”, Electrochemistry Communications, 11(6), pp. 1101-1104.
Japan Patent Office (2010). “Survey on technological trends in patent applications (fiscal year 2009): Lithium Ion Battery”, Japan Patent Office, Tokyo.
Japanese government, “The second science and technology basic plan”, 2001. Japanese government, “The third science and technology basic plan”, 2006. Kelly, D. J., Nakosteen, R. A. (2005). “Technology resources, alliances, and sustained
growth in new, technology based-firms”, IEEE Transactions on Engineering Management, 52 (3), pp. 292-300.
Koyama, Y., Yabuuchi, N., Tanaka, I., Adachi, H., Ohzuku, T. (2004 a). “Solid-State Chemistry and Electrochemistry of LiCo1/3Ni1/3Mn1/3O2 for Advanced Lithium-Ion Batteries”, J. Electrochem. Soc, 151(10), pp. A1545-A1551.
Koyama, Y., Makimura, Y., Tanaka, I., Adachi, H., Ohzuku, T. (2004 b). “Systematic Research on Insertion Materials Based on Superlattice Models in a Phase Triangle of LiCoO2-LiNiO2-LiMnO2”, J. Electrochem. Soc, 151(9), pp. A1499-A1506.
Mahajan, V., Muller, E., and Srivastara, R. K. (1990). “Determination of adopter categories by using innovation diffusion models”, Journal of Marketing Research, 27 (1), pp. 37-50.
Makimura, Y., Ohzuku, T. (2003). “Lithium insertion material of LiNi1/2Mn1/2O2 for advanced lithium-ion batteries”, Journal of Power Sources, Vol.119-221, p.156.
Meyer, P. S. (1994). “Bi-logistic growth”, Technological Forecasting and Social Changes, 47 (1), pp. 89-102.
Meyer, P. S., Ausbel, J. H. (1999). “Carrying Capacity: a model with logistically varying limits”, Technological Forecasting and Social Change, 61 (3), pp. 209-214.
Millson, M.R., Wielmon, D. (2006). “Driving new product success in the electrical equipment manufacturing industry”, Technovation, 26, pp. 1268–1286.
Modis, T. (1992). Prediction, Simon & Schnster, New York. Nagaura, T. (1991). Prog. Batteries Solar Cells, 10, p.209. Nikkei Inc, (1990-2007). Nikkei all articles data base. [CD-ROM]. Nikkei Inc, Tokyo. Ohzuku, T., Brodd, R. (2007). “An overview of positive-electrode materials for advanced
lithium-ion batteries”, Journal of Power sources, 174, p.449. Ohzuku, T., Ueda, A., Nagayama, M., Iwakoshi, Y., Komori, H. (1993). “Comparative
study of LiCoO2, LiNi 1/2Co1/2O2 and LiNiO2 for 4 volt secondary lithium cells”, Electrochima Acta, 38, pp. 1159-1167.
Ohzuku, T., Ueda, A., Yamamoto, N., and Iwakoshi, Y. (1995). “Actor affecting the
79
capacity retention of lithium-ion cells”, Journal of Power Sources, 54, p.99. Ouchi, N., Takahashi, T., Saiki, T., Watanabe, C., and Tou, Y. (2008). “Timing of the
initial functionality development as a key to sustainable functionality: comparative analysis of copying machine development in Canon and Ricoh”, Journal of Advances in Management Research, 5 (II), pp.42-55.
Panasonic Corporation, (2001-2009). Annual Report. Panasonic Corp, Osaka. Rogers, E. M. (1962). Diffusion of Innovation, Free Press of Glencoe, New York. Ruttan, V. W. (2001). “Technology, Growth, and Development – An Induced Innovation
Perspective”, Oxford Univ. Press, New York. Sekai, K., Azuma, H., Omaru, A., Fujita, S., Imoto, H., Endo, T., Yamaura, K., Nishi, Y.
(1993). “Lithium-ion rechargeable cells with LiCoO, and carbon electrodes”, Journal of Power Sources, 43-44, pp. 241-244.
Sony Corporation, (2001-2009). Annual Report. Sony Corp, Tokyo. Tanabe, K., Watanabe, C. (2005). “Soft policy instruments for inducing industrial
innovation in a service oriented economy: a comparative analysis of the vision system and university system”, Journal of services research, 5 (1), pp. 123-154.
Verhulst, P. F. (1845). “Recherches mathematiques sur la loi d’accroissement de la population”, Nouv. mem. de l’Academie Royale des Sci. et Belles-Lettres de Bruxelles, 18, pp. 3-38.
Verspagen, B., Loo, I.D. (1999). “Technology spillovers between sectors and over time”, Technological Forecasting and Social Change, 60 (3), pp. 215-235.
Watanabe, C., Asgari, B., and Nagamatsu, A. (2003). “Virtuous cycle between R&D, functionality development and assimilation capacity for competitive strategy in Japan’s high-technology industry”, Technovation, 23 (11), pp. 879-900.
Watanabe, C., Hur, J. Y., and Matsumoto, K. (2005). “Technological diversification and firm’s techno-economic structure: an assessment of Canon’s sustainable growth trajectory”, Technological Forecasting and Social Change, 72 (1), pp.11-27.
Watanabe, C., Takayama, M., Nagamatsu, A., Tagami, T., and Griffy-Brown, C. (2002). “Technology spillover as a complement for high-level R&D intensity in the pharmaceutical industry”, Technovation, 22 (4), pp.245-258.
Yoncheva, M., Stoyanova, R., Zhecheva, E., Alcántara, R., Ortiz, G., Tirado, J. L. (2007). “Effect of the high pressure on the structure and intercalation properties of lithium–nickel–manganese oxides Original Research Article”, Journal of Solid State Chemistry, 180( 6), pp. 1816-1825.
Yoncheva, M., Stoyanova, R., Zhecheva, E., Alcántara, R., Ortiz, G., Tirado, J. L. (2009). “Electrochemical performance and local cationic distribution in layered

80
LiNi1/2Mn1/2O2 electrodes for lithium ion batteries Original Research Article”, Electrochimica Acta, 54(6), pp. 1694-1701.
Yoshizawa, H and Ohzuku, T. (2003). “Prismatic Lithium-Ion Batteries of LiCo1/3Ni 1/3Mn1/3O2 with Graphite”, Electrochemistry, 71, pp. 1177–1181.
81
Chapter III Technology Spillover in Innovation of
Material Technology: A Case Study of Lithium Ion Battery in
Sony and Panasonic
82
Abstract In this Chapter III, in order to analyze the innovation process of materials used in
Lithium Ion Battery (LIB), we compare the changes of technology spillover structure of two leading firms in Japan, Sony and Panasonic. Technology spillover structure is classified into four types on the aspect of organizational view and technological view. Based on this technology spillover structure, diversification process of simple materials and composite materials is compared between Sony and Panasonic.
In conclusion, it was revealed that simple materials and composite materials followed the same growth trajectory, which could be described as inter-technology spillover; diffusion of technologies from material technology to process, component, and product technologies. It was also revealed that this LIB innovation process was reconstructed when physical structure of materials was innovated from simple materials to composite materials. In conclusion, the changes of technology spillover structure played a significant role in driving the development of material technology. Keywords Cathode; Cobalt; Lithium ion battery; Patent; Patent strategy; Technology spillover.
83
3.1 Introduction
In a mature economy, material technology plays a significant role in driving the innovation process. Improvement of material technology, especially materials used in a cathode of Lithium Ion Battery (LIB), is essential for digital equipments such as cellular phones, laptop PCs in these days. Such materials have been innovated with the contribution of knowledge creation, and significant role of knowledge management in R&D has been discussed so far.
In the case of LIB, as suggested in Chapter II, LIB firms could no longer rely on
simple material, which is mainly composed of one element, to produce electrode as they did in the 1990s, but had to develop materials with suitable characteristics which could provide higher energy density with lower cost. Composite material, which is composed of two or more elements, was then invented to realize higher technological performance in the early 2000s. 3.1.1 Knowledge management
The importance of how to create knowledge in R&D has long been discussed among academics. Nonaka (1990, 1991) suggested that knowledge can be important sources of competitive advantage for firms and knowledge creation can be critical for innovation. Nonaka (1994) noted that firms should not only possess information efficiently but also create knowledge to respond to changes in business environment. This knowledge creation can be one of important firm’s strategies, and how to manage knowledge is discussed so far.
In previous works, many papers are discussing the importance of knowledge management. For instance, process of accessing, sharing and integrating knowledge (Grant and Baden, 2004; Grant, 1997), knowledge-based view of the firm (Grant, 1996 a, b), organizational knowledge creation (Nonaka, 1994), wellsprings of knowledge (Leonard-Barton, 1992, 1995), intellectual capital (Stewart, 1997), working knowledge (Davenport and Prusak, 1998), knowledge workers (Fuller, 2001), and community of practice (Brown and Duguid, 1991), gives us useful suggestions of how to create new knowledge.
84
In many cases, innovation would not be created by an individual person but a collective work of a group or a team, so that “organizational knowledge creation” is proposed which is defined as “the process of making available and amplifying knowledge created by individuals as well as crystallizing and connecting it with an organizational knowledge system” (Nonaka et al., 2006).
As an academic work, although some papers discuss the individual tacit knowledge
(Gourlay, 2004; Tsoukas, 2003) and the quality of individual tacit knowledge (Noh et al, 2000; Sanders, 2004), group tacit knowledge is recently focused on as one of organizational knowledge creation models (Cook and Brown, 1999; Zarraga and Bonache, 2005). It is because group tacit knowledge is socially complex and difficult to imitate, and therefore it can constitute a part of a firm’s intangible resources that give rise to competitive advantage (Leidner, 2000). The quality of group tacit knowledge is also remarked recently, and it is suggested that it can be a resource that organizations can rely on when they confront with unexpected and unfamiliar situations (Erden, von Krough, and Nonaka, 2008). The importance of information systems to combine individual knowledge in an organization is also implied (von Krough, 2009). Thus, methods of how to manage knowledge in an organization have been discussed. 3.1.2 Technology spillover
In order to propose effective knowledge management for R&D, many papers
demonstrated that knowledge flow among technologies, technology spillover, could play an important role in leading the innovation. For example, technology spillover can make an impact on R&D strategy (Watanabe et al., 2001). Firms with a well-developed assimilation capacity succeeded in effectively utilizing technology spillover resulting in a very productive R&D structure (Watanabe et al., 2002). Cross-functional spillover could be a survival strategy for ceramics industry (Ohmura et al., 2003; Ohmura and Watanabe, 2005). The differences of firm’s size are one of important factors for technology spillovers (Ornaghi, 2006). Furthermore, other studies also demonstrated that technology developments could be attributed to technology spillover (Griliches and Lichtenberg, 1984; Jaffe, 1986; Bernstein and Nadiri, 1988, 1989; Goto and Suzuki, 1989; Kwang and Watanabe, 2001; Nakanishi, 2002; Watanabe and Ane, 2003; Watanabe and Tokumasu, 2003; Nieto and Quevedo, 2005). Most of these studies show the mechanism of technology spillover in the innovation process.
85
Additionally, some papers suggested that technology spillover plays a significant role in developing materials. For instance, the effect of technology spillover in the fine ceramics industry is analyzed (Ohmura et al., 2003, 2006). The effect of technology spillover in the nonferrous metal industry is also analyzed (Nakagawa et al., 2007, 2009). We also analyzed the technology spillover effect in the acoustic industry, and suggested that the development of material technology is a key to improve the functionalities in a product (Shibata and Saiki, 2009). Thus, on the aspect of technology spillover, the importance of how to innovate materials are discussed so far.
In this study, we mainly focus on the development of cathode materials used in LIB, and discuss the differences of LIB innovation process between Sony and Panasonic. Then, we introduce the concept of technology spillover structure which is classified into four types on the aspect of organizational point of view and technological point of view.
In this chapter, two-dimensional model of technology spillover is introduced in (3.2).
Hypothetical view is described in (3.3). The technology spillover in material technology is analyzed in (3.4). The results are discussed in (3.5). Conclusion in this chapter is remarked in (3.6).
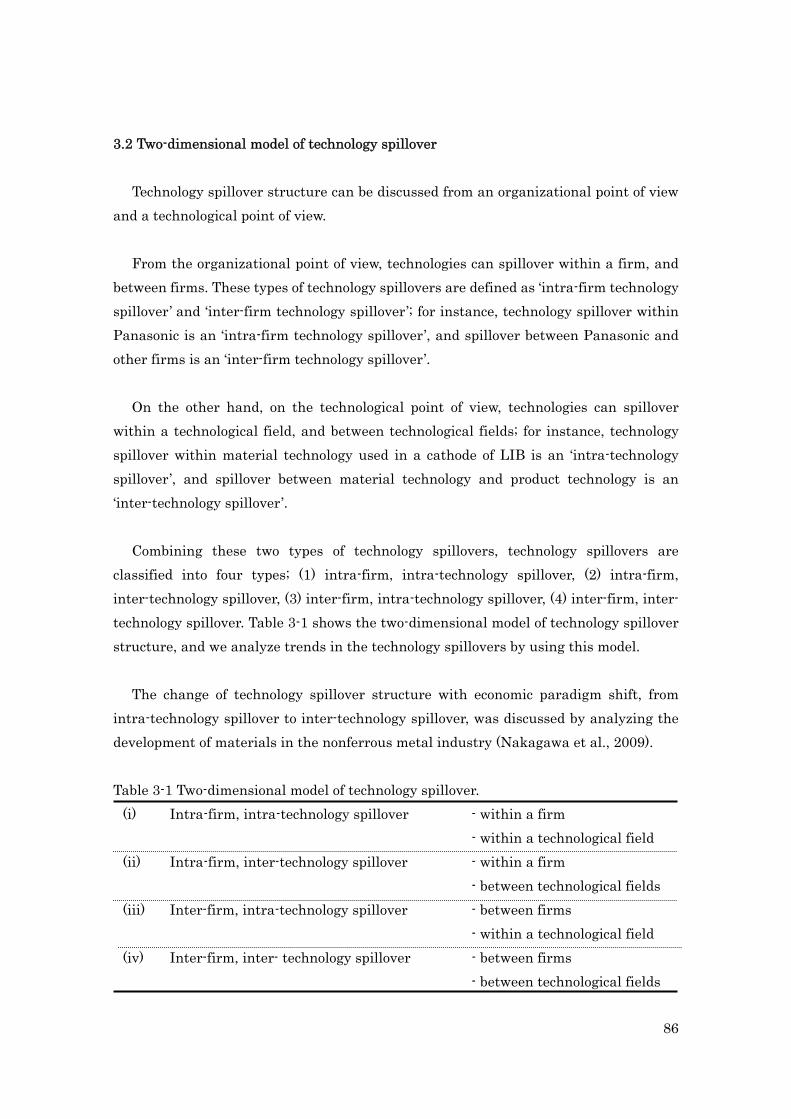
86
3.2 Two-dimensional model of technology spillover Technology spillover structure can be discussed from an organizational point of view
and a technological point of view.
From the organizational point of view, technologies can spillover within a firm, and between firms. These types of technology spillovers are defined as ‘intra-firm technology spillover’ and ‘inter-firm technology spillover’; for instance, technology spillover within Panasonic is an ‘intra-firm technology spillover’, and spillover between Panasonic and other firms is an ‘inter-firm technology spillover’.
On the other hand, on the technological point of view, technologies can spillover
within a technological field, and between technological fields; for instance, technology spillover within material technology used in a cathode of LIB is an ‘intra-technology spillover’, and spillover between material technology and product technology is an ‘inter-technology spillover’.
Combining these two types of technology spillovers, technology spillovers are
classified into four types; (1) intra-firm, intra-technology spillover, (2) intra-firm, inter-technology spillover, (3) inter-firm, intra-technology spillover, (4) inter-firm, inter- technology spillover. Table 3-1 shows the two-dimensional model of technology spillover structure, and we analyze trends in the technology spillovers by using this model.
The change of technology spillover structure with economic paradigm shift, from
intra-technology spillover to inter-technology spillover, was discussed by analyzing the development of materials in the nonferrous metal industry (Nakagawa et al., 2009). Table 3-1 Two-dimensional model of technology spillover.
(i) Intra-firm, intra-technology spillover - within a firm - within a technological field (ii) Intra-firm, inter-technology spillover - within a firm - between technological fields (iii) Inter-firm, intra-technology spillover - between firms - within a technological field (iv) Inter-firm, inter- technology spillover - between firms
- between technological fields
87
3.3 Hypothetical view In the Chapter I, we suggest that material technology played an important role in
developing the functionality of LIB. It was required for new materials to provide higher energy density and constitute a desirable material structure for heat load with less cobalt Thus, it can be said that the prompt development of material technology is a key to lead the innovation in the LIB industry.
Additionally, in the Chapter II, it was revealed that Panasonic succeeded in prompt undertaking of the diffusion trajectory of electrode technology in both 1st wave and 2nd wave, and Panasonic obtained patents of composite materials earlier than Sony. On the basis patent statistics, we concluded that Panasonic’s prompt undertaking of electrode technology earlier than Sony was initiated by the development of composite materials.
Panasonic encouraged cross-industrial associations after 2000, and it provided opportunities for researchers to exchange knowledge relating to material technology. This collaborative R&D would contribute to promote inter-firm technology spillover, and technology spillover between industries. In addition to this, Panasonic introduced the ‘platform structure’ to utilize specific knowledge of core technologies in the development of products (Shinozaki, 2002). In this R&D system, researchers moved from basic research center to advanced research center to transfer knowledge, and it would contribute to advance the inter-technology spillover. Thus, Panasonic shifted the technology spillover from intra-firm to inter-firm technology spillover, and from intra-technology spillover to inter-technology spillover.
It could be considered that knowledge of material technology was diffused not only within material technology but also between material technology and other technologies to facilitate the development of material technology such as process, component, and product technologies. We call these technologies ‘complementary technology’. After material technology has been developed, it would be diffused to complementary technologies. Therefore, the hypothesis can be expressed as follows. [Hypothesis] Knowledge of material technology was diffused to complementary technology in the LIB innovation process.
88
3.4. Analysis of technology spillover in material technology 3.4.1 Methodology to define patents and materials
We compare trends in the number of joint patent applications filed by Sony and Panasonic, and analyze the relations among researchers in these firms who invented materials used in a cathode.
In previous studies, in order to analyze the technology spillover, patent data has been recognized as a useful indicator to evaluate the technological innovation quantitatively (Griliches, 1990). Patents can be good examples to investigate technology spillover, because patents describe technological contents, references to technologies, and relations among inventors. Technology spillover paths can be identified by tracking the date of application, inventors, and technological description. Therefore, we use patent data to investigate the LIB innovation process.
As introduced in Chapter II, FI (File Index) is used to define technologies. FI was
developed by Japan Patent Office (JPO), and it was used as more precise technological definition of patent than IPC. It is possible to define material characteristics more precisely by using FI. In this study, we use the most precise technological definition to group cathode materials, H01M4/50,102 and H01M4/52,102. The definition of these FI, H01M4/50,102 and H01M4/52,102, are as follows.
H01M4/50,102: Selection of substances of composite oxide or hydroxide including manganese to insert light metals
H01M4/52,102: Selection of substances of nickel, cobalt, or iron of composite oxide
or hydroxide including nickel, cobalt, or iron to insert light metals
The data of patents are obtained by a retrieval of patent data in “Industrial Property Digital Library” provided by National Center for Industrial Property Information and Training in Japan.
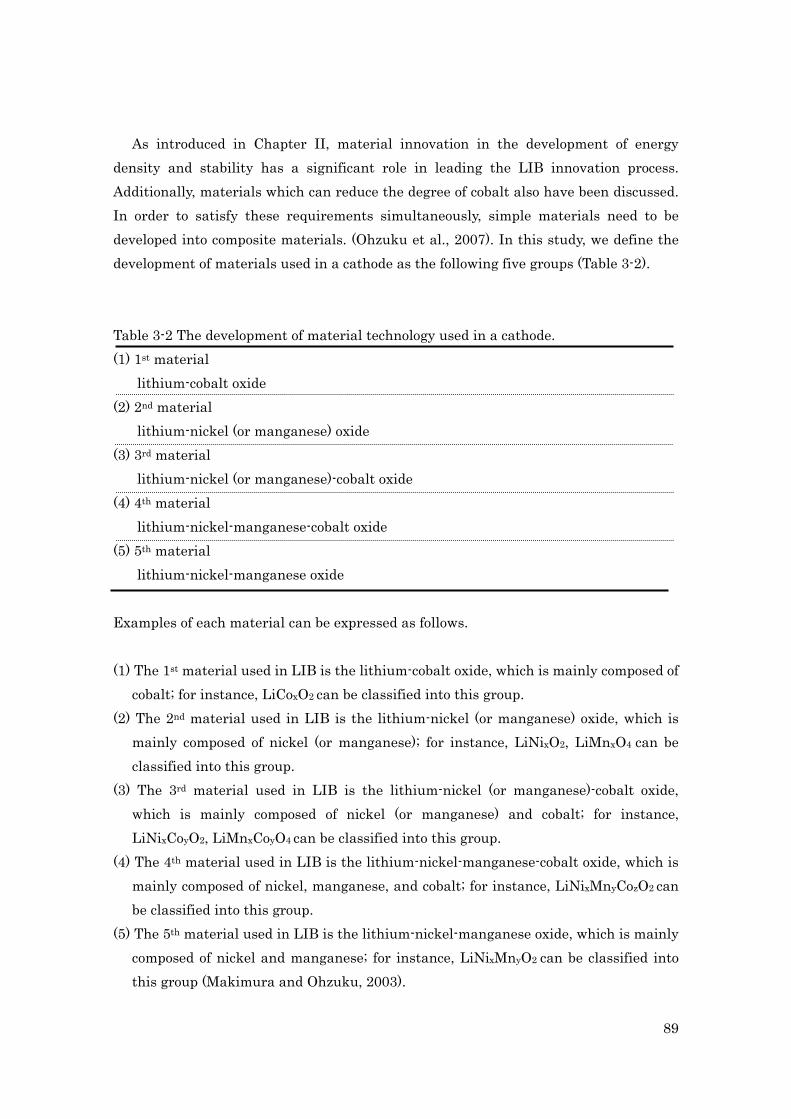
89
As introduced in Chapter II, material innovation in the development of energy density and stability has a significant role in leading the LIB innovation process. Additionally, materials which can reduce the degree of cobalt also have been discussed. In order to satisfy these requirements simultaneously, simple materials need to be developed into composite materials. (Ohzuku et al., 2007). In this study, we define the development of materials used in a cathode as the following five groups (Table 3-2). Table 3-2 The development of material technology used in a cathode. (1) 1st material
lithium-cobalt oxide (2) 2nd material
lithium-nickel (or manganese) oxide (3) 3rd material
lithium-nickel (or manganese)-cobalt oxide (4) 4th material
lithium-nickel-manganese-cobalt oxide (5) 5th material
lithium-nickel-manganese oxide Examples of each material can be expressed as follows. (1) The 1st material used in LIB is the lithium-cobalt oxide, which is mainly composed of
cobalt; for instance, LiCoxO2 can be classified into this group. (2) The 2nd material used in LIB is the lithium-nickel (or manganese) oxide, which is
mainly composed of nickel (or manganese); for instance, LiNixO2, LiMnxO4 can be classified into this group.
(3) The 3rd material used in LIB is the lithium-nickel (or manganese)-cobalt oxide, which is mainly composed of nickel (or manganese) and cobalt; for instance, LiNixCoyO2, LiMnxCoyO4 can be classified into this group.
(4) The 4th material used in LIB is the lithium-nickel-manganese-cobalt oxide, which is mainly composed of nickel, manganese, and cobalt; for instance, LiNixMnyCozO2 can be classified into this group.
(5) The 5th material used in LIB is the lithium-nickel-manganese oxide, which is mainly composed of nickel and manganese; for instance, LiNixMnyO2 can be classified into this group (Makimura and Ohzuku, 2003).
90
3.4.2 Data construction about inventors of material technology
In order to compare trends between the number of joint patent applications and the inventors, Table 3-3 and Table 3-4 show the chronology about material patents obtained by Sony and Panasonic and every inventor relating to these patents. In these tables, every patent is extracted which is classified as H01M4/50,102 or H01M4/52,102 and filed by Sony and Panasonic in JPO during 1991-2009.
In these tables, ‘Date’ indicates the filing date of patent. ‘Number’ indicates the
patent number. ‘Co-applicant’ indicates the applicant of joint application other than Sony or Panasonic. ‘Inventor’ indicates researcher who is the inventor of patents. In the ‘Inventor’, ‘Sn’ and ‘Pn’ mean researchers in Sony and Panasonic, respectively. ‘Mn’, ‘Tn’, ‘In’, ‘Un’, and ‘En’ mean researchers in Mitsui Chemical, Tanaka Chemical, Independent inventor, Osaka City University, and Energy Company, respectively. ‘Category’ indicates the classification of materials according to the Table 3-2.
In the case of Panasonic, some researchers moved from Panasonic to Energy
Company. As previously noted, Panasonic introduced ‘platform structure’, and researchers moved from basic research center in Panasonic to advanced research center in Energy Company; ‘Energy Company’ is the group company of Panasonic treating energy devices. Such researchers are expressed as ‘En(Pn)’.
It is obvious by referring Table 3-3 and Table 3-4 that Sony obtained 27 patents of cathode materials by 43 inventors in Sony during 1998-2006, and only one patent was obtained with other firm as joint application. In contrast, Panasonic obtained 25 patents by 31 inventors in Panasonic during 1998-2009, and 9 patents were obtained with other firms, universities, and independent inventors as joint applications.
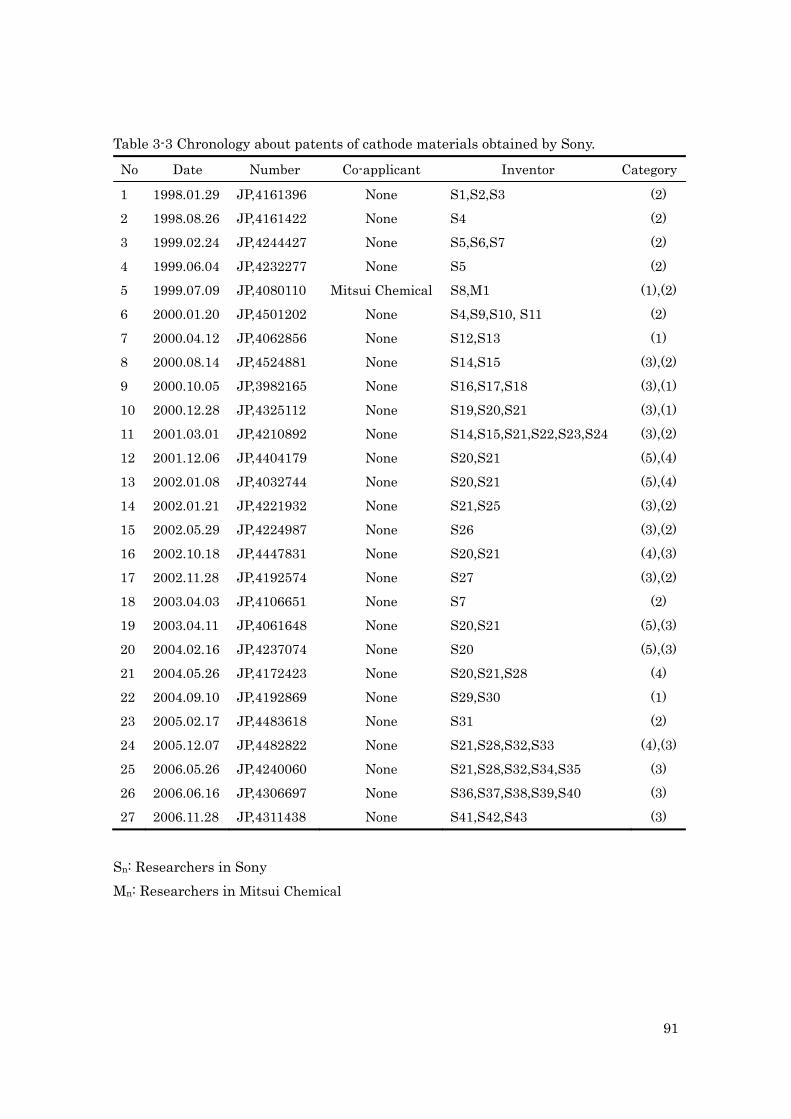
91
Table 3-3 Chronology about patents of cathode materials obtained by Sony.
No Date Number Co-applicant Inventor Category
1 1998.01.29 JP,4161396 None S1,S2,S3 (2)
2 1998.08.26 JP,4161422 None S4 (2)
3 1999.02.24 JP,4244427 None S5,S6,S7 (2)
4 1999.06.04 JP,4232277 None S5 (2)
5 1999.07.09 JP,4080110 Mitsui Chemical S8,M1 (1),(2)
6 2000.01.20 JP,4501202 None S4,S9,S10, S11 (2)
7 2000.04.12 JP,4062856 None S12,S13 (1)
8 2000.08.14 JP,4524881 None S14,S15 (3),(2)
9 2000.10.05 JP,3982165 None S16,S17,S18 (3),(1)
10 2000.12.28 JP,4325112 None S19,S20,S21 (3),(1)
11 2001.03.01 JP,4210892 None S14,S15,S21,S22,S23,S24 (3),(2)
12 2001.12.06 JP,4404179 None S20,S21 (5),(4)
13 2002.01.08 JP,4032744 None S20,S21 (5),(4)
14 2002.01.21 JP,4221932 None S21,S25 (3),(2)
15 2002.05.29 JP,4224987 None S26 (3),(2)
16 2002.10.18 JP,4447831 None S20,S21 (4),(3)
17 2002.11.28 JP,4192574 None S27 (3),(2)
18 2003.04.03 JP,4106651 None S7 (2)
19 2003.04.11 JP,4061648 None S20,S21 (5),(3)
20 2004.02.16 JP,4237074 None S20 (5),(3)
21 2004.05.26 JP,4172423 None S20,S21,S28 (4)
22 2004.09.10 JP,4192869 None S29,S30 (1)
23 2005.02.17 JP,4483618 None S31 (2)
24 2005.12.07 JP,4482822 None S21,S28,S32,S33 (4),(3)
25 2006.05.26 JP,4240060 None S21,S28,S32,S34,S35 (3)
26 2006.06.16 JP,4306697 None S36,S37,S38,S39,S40 (3)
27 2006.11.28 JP,4311438 None S41,S42,S43 (3)
Sn: Researchers in Sony Mn: Researchers in Mitsui Chemical
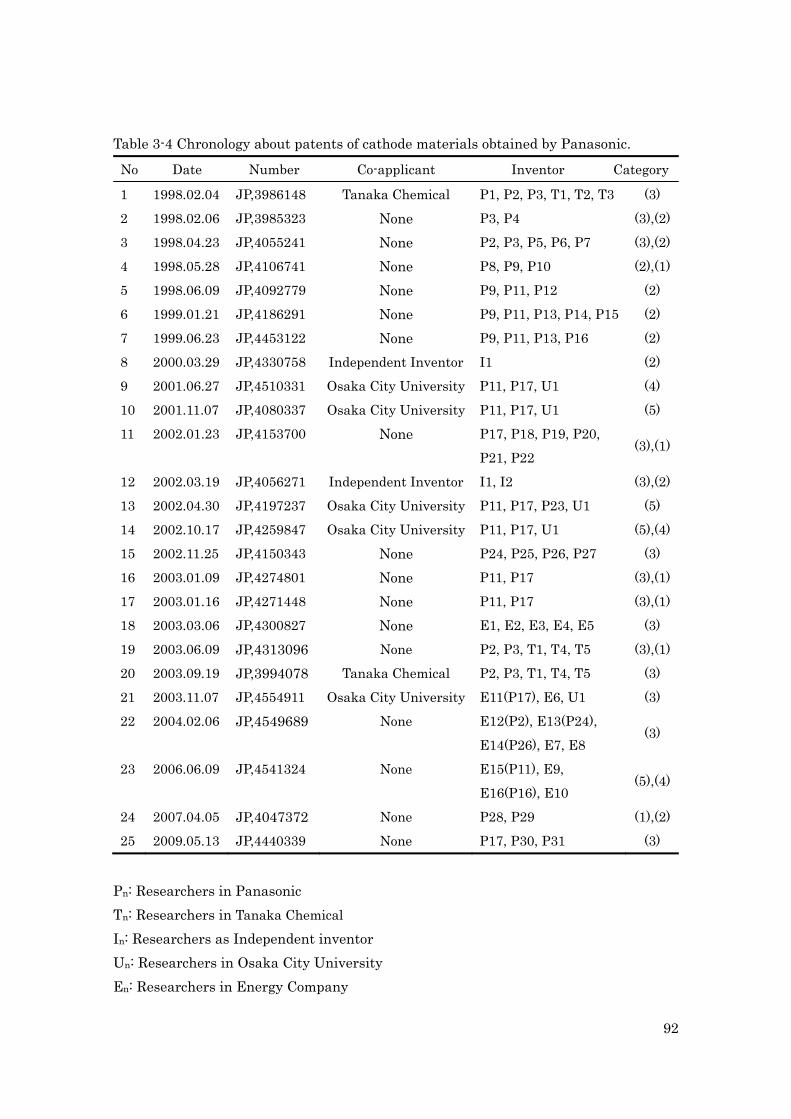
92
Table 3-4 Chronology about patents of cathode materials obtained by Panasonic.
No Date Number Co-applicant Inventor Category
1 1998.02.04 JP,3986148 Tanaka Chemical P1, P2, P3, T1, T2, T3 (3)
2 1998.02.06 JP,3985323 None P3, P4 (3),(2)
3 1998.04.23 JP,4055241 None P2, P3, P5, P6, P7 (3),(2)
4 1998.05.28 JP,4106741 None P8, P9, P10 (2),(1)
5 1998.06.09 JP,4092779 None P9, P11, P12 (2)
6 1999.01.21 JP,4186291 None P9, P11, P13, P14, P15 (2)
7 1999.06.23 JP,4453122 None P9, P11, P13, P16 (2)
8 2000.03.29 JP,4330758 Independent Inventor I1 (2)
9 2001.06.27 JP,4510331 Osaka City University P11, P17, U1 (4)
10 2001.11.07 JP,4080337 Osaka City University P11, P17, U1 (5)
11 2002.01.23 JP,4153700 None P17, P18, P19, P20,
P21, P22 (3),(1)
12 2002.03.19 JP,4056271 Independent Inventor I1, I2 (3),(2)
13 2002.04.30 JP,4197237 Osaka City University P11, P17, P23, U1 (5)
14 2002.10.17 JP,4259847 Osaka City University P11, P17, U1 (5),(4)
15 2002.11.25 JP,4150343 None P24, P25, P26, P27 (3)
16 2003.01.09 JP,4274801 None P11, P17 (3),(1)
17 2003.01.16 JP,4271448 None P11, P17 (3),(1)
18 2003.03.06 JP,4300827 None E1, E2, E3, E4, E5 (3)
19 2003.06.09 JP,4313096 None P2, P3, T1, T4, T5 (3),(1)
20 2003.09.19 JP,3994078 Tanaka Chemical P2, P3, T1, T4, T5 (3)
21 2003.11.07 JP,4554911 Osaka City University E11(P17), E6, U1 (3)
22 2004.02.06 JP,4549689 None E12(P2), E13(P24),
E14(P26), E7, E8 (3)
23 2006.06.09 JP,4541324 None E15(P11), E9,
E16(P16), E10 (5),(4)
24 2007.04.05 JP,4047372 None P28, P29 (1),(2)
25 2009.05.13 JP,4440339 None P17, P30, P31 (3)
Pn: Researchers in Panasonic Tn: Researchers in Tanaka Chemical In: Researchers as Independent inventor Un: Researchers in Osaka City University En: Researchers in Energy Company
93
3.4.3 Methodology to analyze technology spillover As previously introduced, we use two-dimensional technology spillover model to
investigate the knowledge flow. As Beneito (2006) suggested, technology spillover structures reflect strategic options in firm’s technology developments, because collaborative R&D activities play a different role from in-house R&D. In order to compare trends in changes of technology spillover with the development of material technology between Sony and Panasonic, we have to define the technology spillover structure in the case of the LIB industry.
In a previous work, we introduced the concept of technological classification like ‘basic technology’ and ‘complementary technology’ in acoustic industry. ‘Basic technology’ was defined as the technology which demonstrates the fundamental physical laws as a core technology, and ‘complementary technology’ was defined as the technology which facilitates the work of basic technologies in a product. In conclusion, we suggest that technology spillover diffused from basic technology to complementary technology with the development of materials (Shibata and Saiki, 2009).
In this study, we introduced the concept of technological classification like ‘material
technology’ and ‘complementary technology’ in the LIB industry. ‘Material technology’ is defined as the development of materials used in a cathode as a core technology, and ‘complementary technology’ is defined as the technology which facilitates the work of material technology such as process, component, and product technologies. In the case of LIB, the development of complementary technology has a strong relationship with the development of material technology, because complementary technology should be developed on the basis of technological characteristics of material technology. Therefore, it is considered that knowledge is diffused from material technology to complementary technology. Based on this technological classification, we investigate the diffusion process of technologies in LIB.
Technology spillover in Panasonic can be described as Figure 3-1 as an example. In this figure, vertical line separate technologies into material technology and complementary technology, and it can distinguish the intra- or inter-technology spillover. In contrast, horizontal line separate technologies into sole patent application and joint patent application with Osaka City University, and it can distinguish the intra- or inter-firm technology spillover.
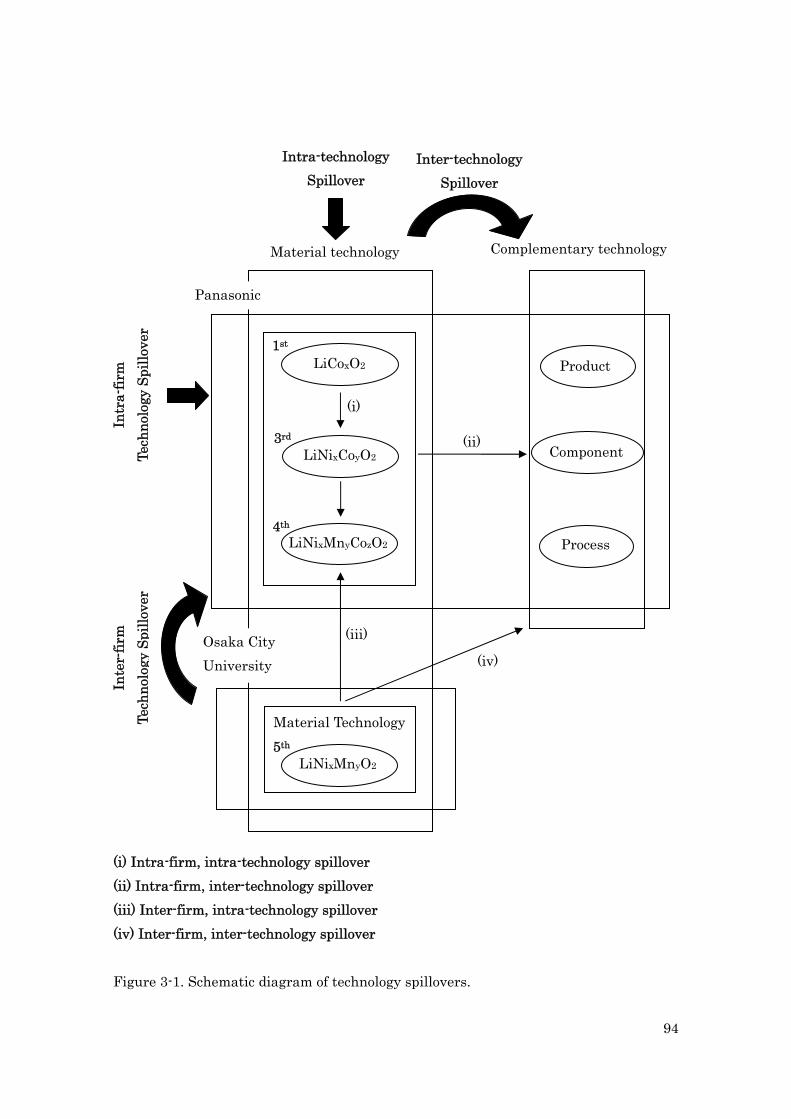
94
(i) Intra-firm, intra-technology spillover (ii) Intra-firm, inter-technology spillover (iii) Inter-firm, intra-technology spillover (iv) Inter-firm, inter-technology spillover Figure 3-1. Schematic diagram of technology spillovers.
Intr
a-fir
m
Tech
nolo
gy S
pillo
ver
Inter-technology Spillover
Intra-technology Spillover
LiNixMnyO2
(iii)
(iv)
LiCoxO2
Material technology
LiNixCoyO2
(i)
Complementary technology
Product
(ii) Component
Process
Material Technology
Inte
r-fir
m
Tech
nolo
gy S
pillo
ver
Osaka City University
Panasonic
LiNixMnyCozO2
1st
3rd
4th
5th
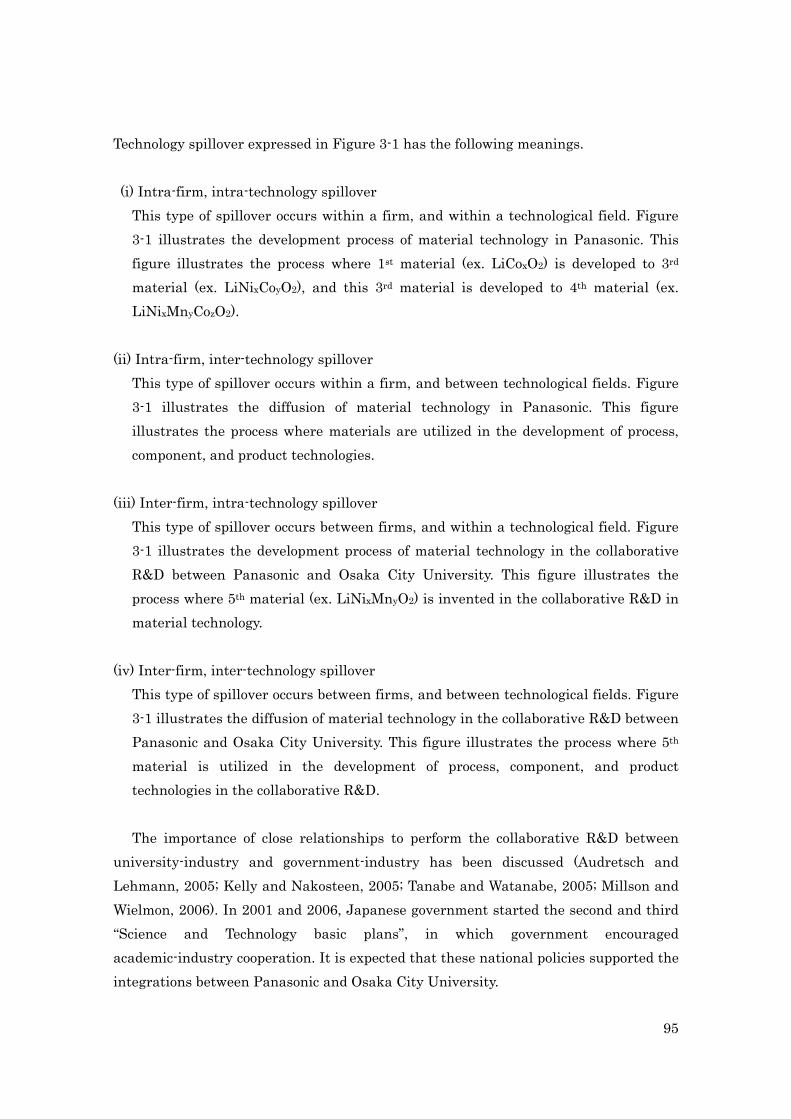
95
Technology spillover expressed in Figure 3-1 has the following meanings. (i) Intra-firm, intra-technology spillover
This type of spillover occurs within a firm, and within a technological field. Figure 3-1 illustrates the development process of material technology in Panasonic. This figure illustrates the process where 1st material (ex. LiCoxO2) is developed to 3rd material (ex. LiNixCoyO2), and this 3rd material is developed to 4th material (ex. LiNixMnyCozO2).
(ii) Intra-firm, inter-technology spillover
This type of spillover occurs within a firm, and between technological fields. Figure 3-1 illustrates the diffusion of material technology in Panasonic. This figure illustrates the process where materials are utilized in the development of process, component, and product technologies.
(iii) Inter-firm, intra-technology spillover
This type of spillover occurs between firms, and within a technological field. Figure 3-1 illustrates the development process of material technology in the collaborative R&D between Panasonic and Osaka City University. This figure illustrates the process where 5th material (ex. LiNixMnyO2) is invented in the collaborative R&D in material technology.
(iv) Inter-firm, inter-technology spillover
This type of spillover occurs between firms, and between technological fields. Figure 3-1 illustrates the diffusion of material technology in the collaborative R&D between Panasonic and Osaka City University. This figure illustrates the process where 5th material is utilized in the development of process, component, and product technologies in the collaborative R&D.
The importance of close relationships to perform the collaborative R&D between
university-industry and government-industry has been discussed (Audretsch and Lehmann, 2005; Kelly and Nakosteen, 2005; Tanabe and Watanabe, 2005; Millson and Wielmon, 2006). In 2001 and 2006, Japanese government started the second and third “Science and Technology basic plans”, in which government encouraged academic-industry cooperation. It is expected that these national policies supported the integrations between Panasonic and Osaka City University.
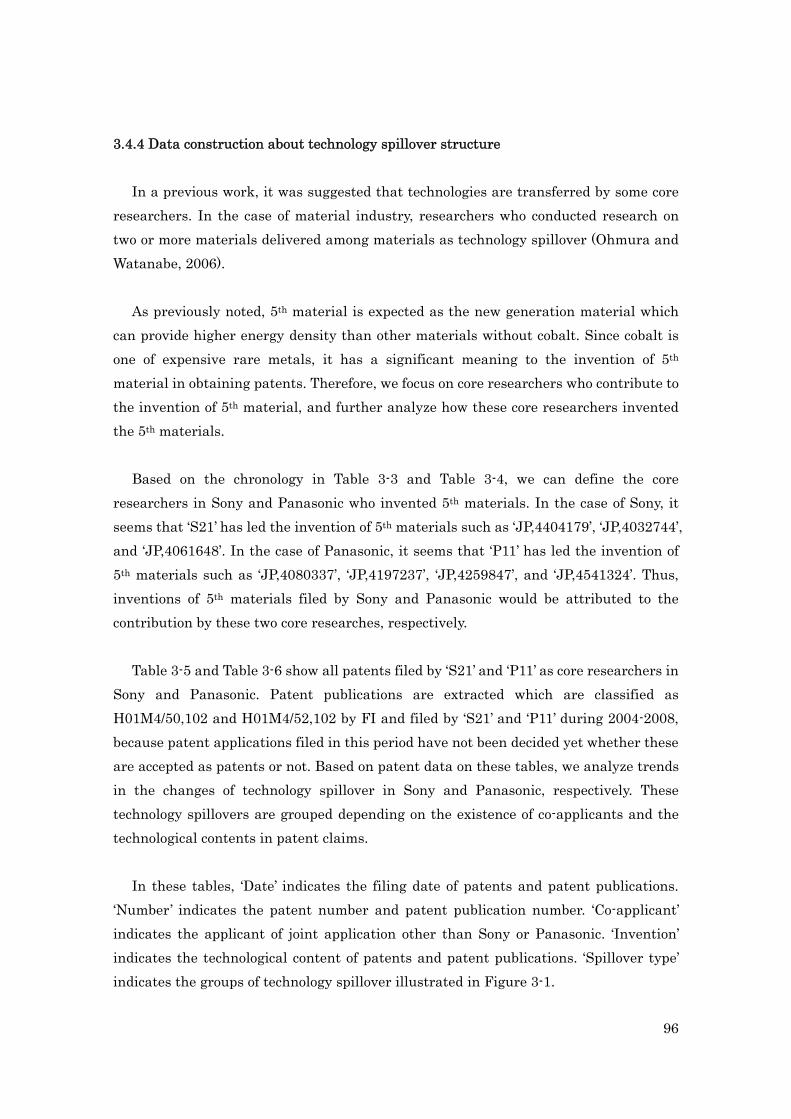
96
3.4.4 Data construction about technology spillover structure In a previous work, it was suggested that technologies are transferred by some core
researchers. In the case of material industry, researchers who conducted research on two or more materials delivered among materials as technology spillover (Ohmura and Watanabe, 2006).
As previously noted, 5th material is expected as the new generation material which
can provide higher energy density than other materials without cobalt. Since cobalt is one of expensive rare metals, it has a significant meaning to the invention of 5th material in obtaining patents. Therefore, we focus on core researchers who contribute to the invention of 5th material, and further analyze how these core researchers invented the 5th materials.
Based on the chronology in Table 3-3 and Table 3-4, we can define the core researchers in Sony and Panasonic who invented 5th materials. In the case of Sony, it seems that ‘S21’ has led the invention of 5th materials such as ‘JP,4404179’, ‘JP,4032744’, and ‘JP,4061648’. In the case of Panasonic, it seems that ‘P11’ has led the invention of 5th materials such as ‘JP,4080337’, ‘JP,4197237’, ‘JP,4259847’, and ‘JP,4541324’. Thus, inventions of 5th materials filed by Sony and Panasonic would be attributed to the contribution by these two core researches, respectively.
Table 3-5 and Table 3-6 show all patents filed by ‘S21’ and ‘P11’ as core researchers in Sony and Panasonic. Patent publications are extracted which are classified as H01M4/50,102 and H01M4/52,102 by FI and filed by ‘S21’ and ‘P11’ during 2004-2008, because patent applications filed in this period have not been decided yet whether these are accepted as patents or not. Based on patent data on these tables, we analyze trends in the changes of technology spillover in Sony and Panasonic, respectively. These technology spillovers are grouped depending on the existence of co-applicants and the technological contents in patent claims.
In these tables, ‘Date’ indicates the filing date of patents and patent publications.
‘Number’ indicates the patent number and patent publication number. ‘Co-applicant’ indicates the applicant of joint application other than Sony or Panasonic. ‘Invention’ indicates the technological content of patents and patent publications. ‘Spillover type’ indicates the groups of technology spillover illustrated in Figure 3-1.
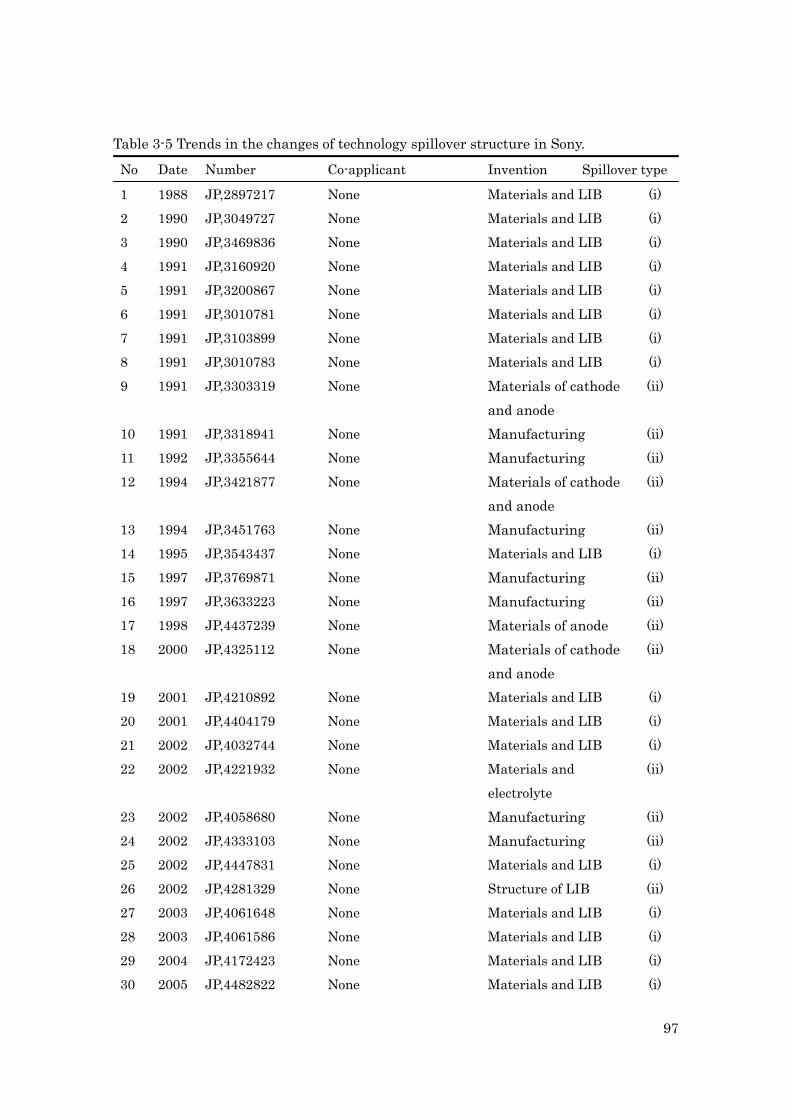
97
Table 3-5 Trends in the changes of technology spillover structure in Sony.
No Date Number Co-applicant Invention Spillover type
1 1988 JP,2897217 None Materials and LIB (i)
2 1990 JP,3049727 None Materials and LIB (i)
3 1990 JP,3469836 None Materials and LIB (i)
4 1991 JP,3160920 None Materials and LIB (i)
5 1991 JP,3200867 None Materials and LIB (i)
6 1991 JP,3010781 None Materials and LIB (i)
7 1991 JP,3103899 None Materials and LIB (i)
8 1991 JP,3010783 None Materials and LIB (i)
9 1991 JP,3303319 None Materials of cathode and anode
(ii)
10 1991 JP,3318941 None Manufacturing (ii)
11 1992 JP,3355644 None Manufacturing (ii)
12 1994 JP,3421877 None Materials of cathode and anode
(ii)
13 1994 JP,3451763 None Manufacturing (ii)
14 1995 JP,3543437 None Materials and LIB (i)
15 1997 JP,3769871 None Manufacturing (ii)
16 1997 JP,3633223 None Manufacturing (ii)
17 1998 JP,4437239 None Materials of anode (ii)
18 2000 JP,4325112 None Materials of cathode and anode
(ii)
19 2001 JP,4210892 None Materials and LIB (i)
20 2001 JP,4404179 None Materials and LIB (i)
21 2002 JP,4032744 None Materials and LIB (i)
22 2002 JP,4221932 None Materials and
electrolyte
(ii)
23 2002 JP,4058680 None Manufacturing (ii)
24 2002 JP,4333103 None Manufacturing (ii)
25 2002 JP,4447831 None Materials and LIB (i)
26 2002 JP,4281329 None Structure of LIB (ii)
27 2003 JP,4061648 None Materials and LIB (i)
28 2003 JP,4061586 None Materials and LIB (i)
29 2004 JP,4172423 None Materials and LIB (i)
30 2005 JP,4482822 None Materials and LIB (i)
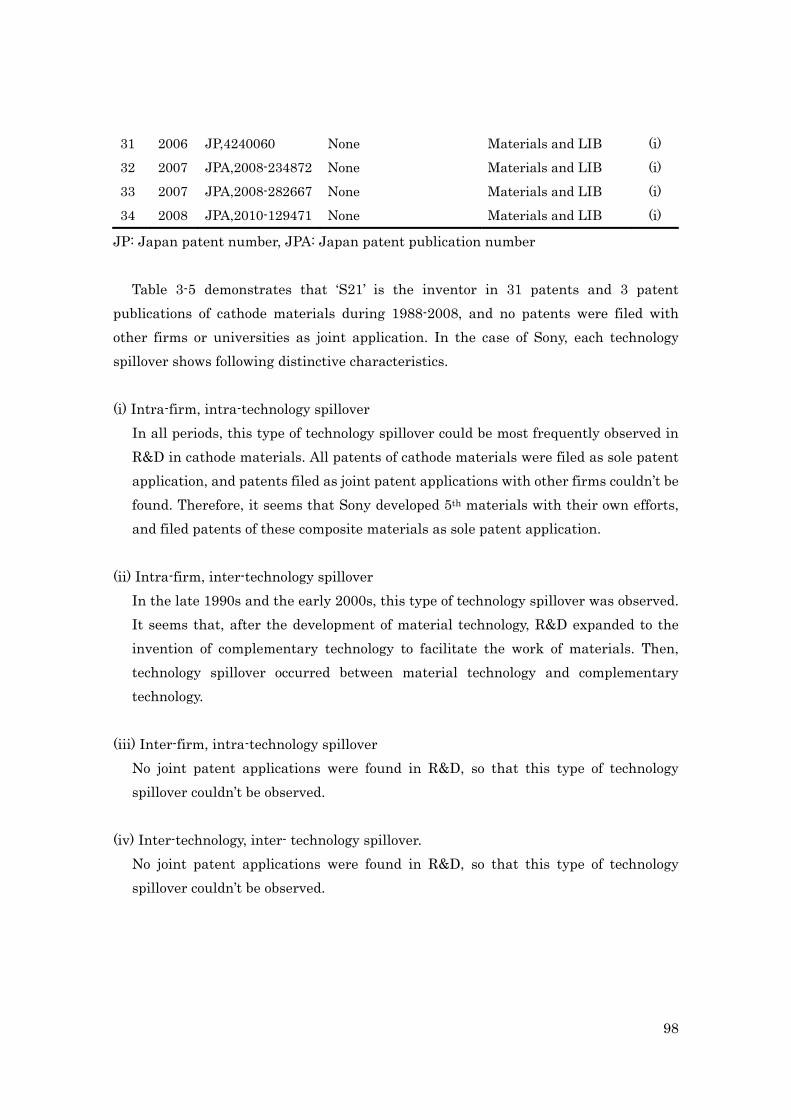
98
31 2006 JP,4240060 None Materials and LIB (i)
32 2007 JPA,2008-234872 None Materials and LIB (i)
33 2007 JPA,2008-282667 None Materials and LIB (i)
34 2008 JPA,2010-129471 None Materials and LIB (i)
JP: Japan patent number, JPA: Japan patent publication number
Table 3-5 demonstrates that ‘S21’ is the inventor in 31 patents and 3 patent publications of cathode materials during 1988-2008, and no patents were filed with other firms or universities as joint application. In the case of Sony, each technology spillover shows following distinctive characteristics. (i) Intra-firm, intra-technology spillover
In all periods, this type of technology spillover could be most frequently observed in R&D in cathode materials. All patents of cathode materials were filed as sole patent application, and patents filed as joint patent applications with other firms couldn’t be found. Therefore, it seems that Sony developed 5th materials with their own efforts, and filed patents of these composite materials as sole patent application.
(ii) Intra-firm, inter-technology spillover
In the late 1990s and the early 2000s, this type of technology spillover was observed. It seems that, after the development of material technology, R&D expanded to the invention of complementary technology to facilitate the work of materials. Then, technology spillover occurred between material technology and complementary technology.
(iii) Inter-firm, intra-technology spillover
No joint patent applications were found in R&D, so that this type of technology spillover couldn’t be observed.
(iv) Inter-technology, inter- technology spillover.
No joint patent applications were found in R&D, so that this type of technology spillover couldn’t be observed.
99
Table 3-6 Trends in the changes of technology spillover in Panasonic.
No Date Number Co-applicant Invention Spillover type
1 1995 JP,3329124 None Manufacturing (ii)
2 1995 JP,3331824 None Materials and LIB (i)
3 1995 JP,3229531 None Materials and LIB (i)
4 1998 JP,4366724 None Materials and LIB (i)
5 1998 JP,4066509 None Manufacturing (ii)
6 1998 JP,3468099 None Manufacturing (ii)
7 1998 JP,4092779 None Manufacturing (ii)
8 1998 JP,3468106 None Manufacturing (ii)
9 1998 JP,4085479 None Anode and LIB (ii)
10 1998 JP,4185191 Mitsui Mining &
Smelting Co Manufacturing (iv)
11 1998 JP,3528615 None Manufacturing (ii)
12 1999 JP,4186291 None Manufacturing (ii)
13 1999 JP,4453122 None Materials of cathode and anode
(ii)
14 2000 JP,3890185 Osaka City University
Tanaka Chemical Materials and its manufacturing
(iii)
15 2001 JP,4510331 Osaka City University Materials and LIB (iii)
16 2001 JP,3827545 Osaka City University Manufacturing (iv)
17 2001 JP,4080337 Osaka City University Materials and LIB (iii)
18 2001 JP,3782058 None Materials and LIB (i)
19 2002 JP,4197237 Osaka City University Manufacturing (iv)
20 2002 JP,4259847 Osaka City University Materials and LIB (iii)
21 2002 JP,3654592 None Materials of cathode
and electrolyte
(ii)
22 2002 JP,3844733 None Materials and LIB (iii)
23 2003 JP,4274801 None Manufacturing (iv)
24 2003 JP,4271448 None Materials and LIB (iii)
25 2003 JP,3637344 None Manufacturing (iv)
26 2003 JP,4060782 None Battery pack and
electric devices
(ii)
27 2003 JP,4112478 None Battery Pack and
charging devices
(ii)
28 2006 JP,4541324 None Materials and LIB (i)
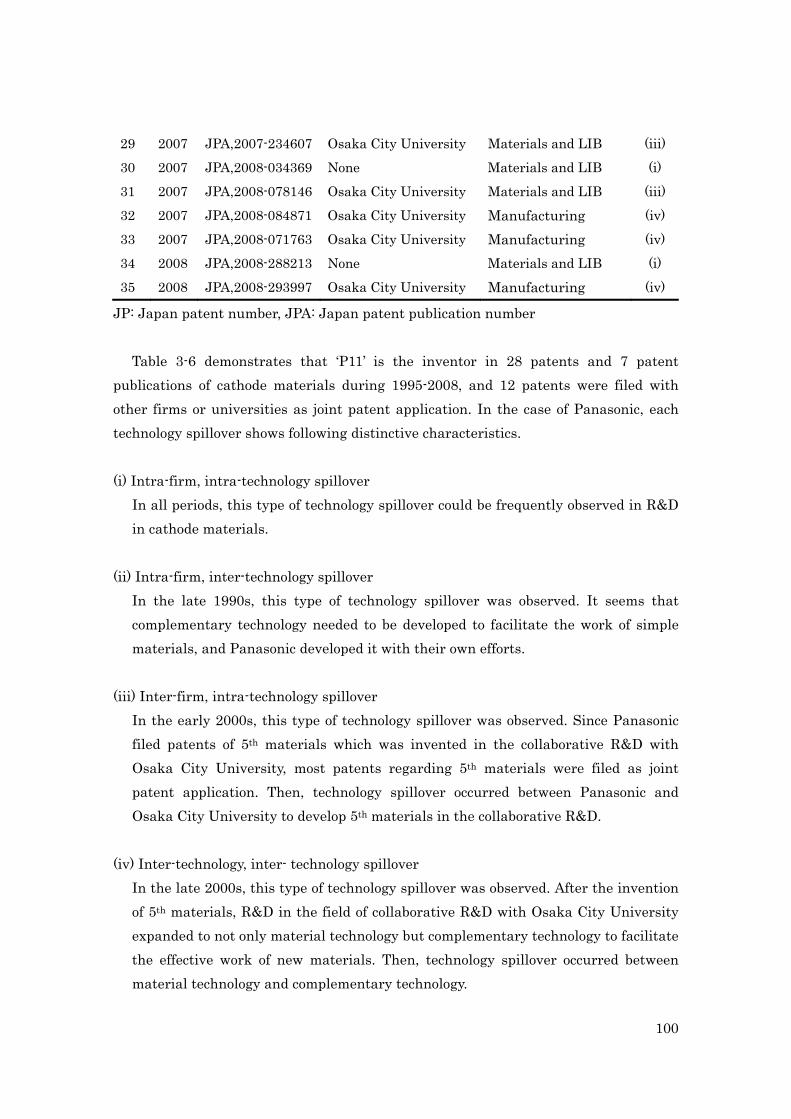
100
29 2007 JPA,2007-234607 Osaka City University Materials and LIB (iii)
30 2007 JPA,2008-034369 None Materials and LIB (i)
31 2007 JPA,2008-078146 Osaka City University Materials and LIB (iii)
32 2007 JPA,2008-084871 Osaka City University Manufacturing (iv)
33 2007 JPA,2008-071763 Osaka City University Manufacturing (iv)
34 2008 JPA,2008-288213 None Materials and LIB (i)
35 2008 JPA,2008-293997 Osaka City University Manufacturing (iv)
JP: Japan patent number, JPA: Japan patent publication number
Table 3-6 demonstrates that ‘P11’ is the inventor in 28 patents and 7 patent publications of cathode materials during 1995-2008, and 12 patents were filed with other firms or universities as joint patent application. In the case of Panasonic, each technology spillover shows following distinctive characteristics. (i) Intra-firm, intra-technology spillover
In all periods, this type of technology spillover could be frequently observed in R&D in cathode materials.
(ii) Intra-firm, inter-technology spillover
In the late 1990s, this type of technology spillover was observed. It seems that complementary technology needed to be developed to facilitate the work of simple materials, and Panasonic developed it with their own efforts.
(iii) Inter-firm, intra-technology spillover
In the early 2000s, this type of technology spillover was observed. Since Panasonic filed patents of 5th materials which was invented in the collaborative R&D with Osaka City University, most patents regarding 5th materials were filed as joint patent application. Then, technology spillover occurred between Panasonic and Osaka City University to develop 5th materials in the collaborative R&D.
(iv) Inter-technology, inter- technology spillover
In the late 2000s, this type of technology spillover was observed. After the invention of 5th materials, R&D in the field of collaborative R&D with Osaka City University expanded to not only material technology but complementary technology to facilitate the effective work of new materials. Then, technology spillover occurred between material technology and complementary technology.
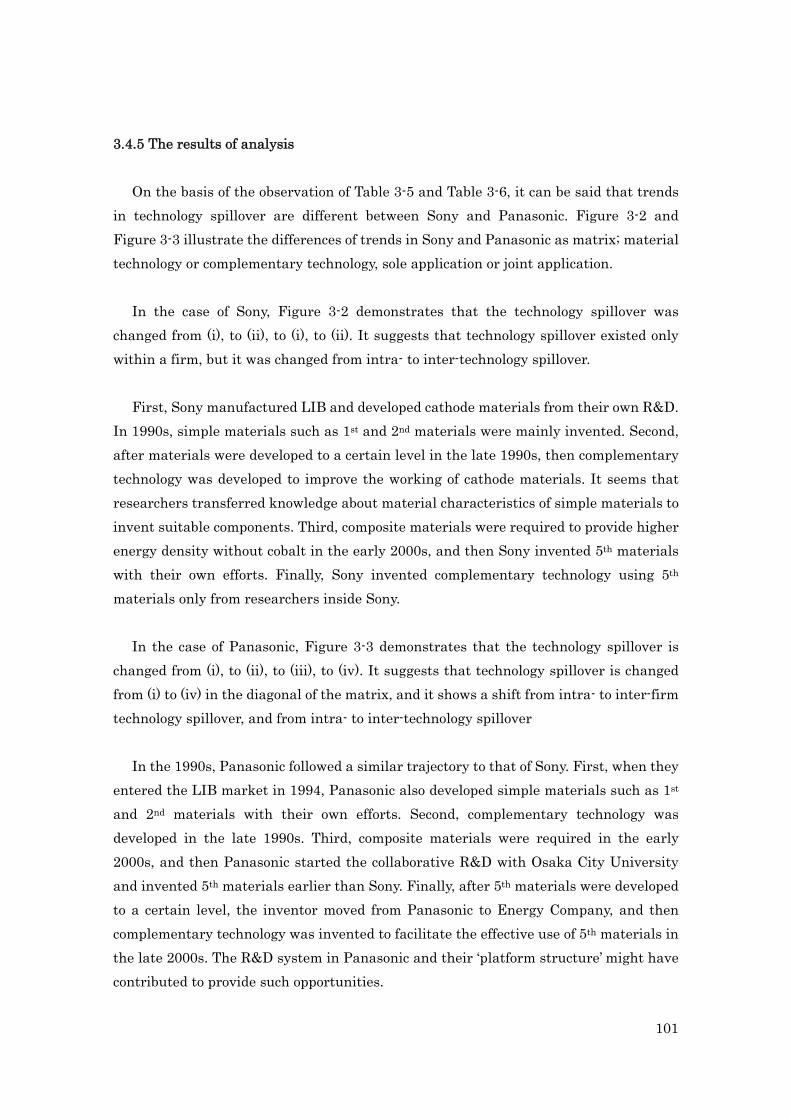
101
3.4.5 The results of analysis On the basis of the observation of Table 3-5 and Table 3-6, it can be said that trends
in technology spillover are different between Sony and Panasonic. Figure 3-2 and Figure 3-3 illustrate the differences of trends in Sony and Panasonic as matrix; material technology or complementary technology, sole application or joint application.
In the case of Sony, Figure 3-2 demonstrates that the technology spillover was changed from (i), to (ii), to (i), to (ii). It suggests that technology spillover existed only within a firm, but it was changed from intra- to inter-technology spillover.
First, Sony manufactured LIB and developed cathode materials from their own R&D.
In 1990s, simple materials such as 1st and 2nd materials were mainly invented. Second, after materials were developed to a certain level in the late 1990s, then complementary technology was developed to improve the working of cathode materials. It seems that researchers transferred knowledge about material characteristics of simple materials to invent suitable components. Third, composite materials were required to provide higher energy density without cobalt in the early 2000s, and then Sony invented 5th materials with their own efforts. Finally, Sony invented complementary technology using 5th materials only from researchers inside Sony.
In the case of Panasonic, Figure 3-3 demonstrates that the technology spillover is changed from (i), to (ii), to (iii), to (iv). It suggests that technology spillover is changed from (i) to (iv) in the diagonal of the matrix, and it shows a shift from intra- to inter-firm technology spillover, and from intra- to inter-technology spillover
In the 1990s, Panasonic followed a similar trajectory to that of Sony. First, when they
entered the LIB market in 1994, Panasonic also developed simple materials such as 1st and 2nd materials with their own efforts. Second, complementary technology was developed in the late 1990s. Third, composite materials were required in the early 2000s, and then Panasonic started the collaborative R&D with Osaka City University and invented 5th materials earlier than Sony. Finally, after 5th materials were developed to a certain level, the inventor moved from Panasonic to Energy Company, and then complementary technology was invented to facilitate the effective use of 5th materials in the late 2000s. The R&D system in Panasonic and their ‘platform structure’ might have contributed to provide such opportunities.
102
Inter technology spillover Material Technology Complementary technology
(i) Intra-firm, Intra-technology (ii) Intra-firm, Inter-technology JP,3010781 (1991) JP,3633223 (1997) JP,3103899 (1991) JP,4437239 (1998) JP,3010783 (1991) JP,4325112 (2000)
JP,4210892 (2001) JP,4058680 (2002) JP,4404179 (2001) JP,4333103 (2002) JP,4032744 (2002) JP,4281329 (2002)
(iii) Inter-firm, Intra-technology (iv) Inter-firm, Inter-technology
Figure 3-2. Matrix of technology spillovers in Sony.
Inter technology spillover Material Technology Complementary technology
(i) Intra-firm, Intra-technology (ii) Intra-firm, Inter-technology JP,3331824 (1995) JP,3528615 (1998) JP,3329531 (1995) JP,4186291 (1999) JP,4366724 (1998) JP,4453122 (1999)
(iii) Inter-firm, Intra-technology (iv) Inter-firm, Inter-technology
JP,3890185 (2000) JPA,2008-084871 (2007) JP,4510331 (2001) JPA,2008-071763 (2007) JP,4080337 (2001) JPA,2008-293997 (2008) JP,4259847 (2002)
Figure 3-3. Matrix of technology spillovers in Panasonic.
Sony
Inte
r fir
m te
chno
logy
spi
llove
r
Sony
/ O
ther
s Pa
naso
nic
Pana
soni
c / U
nive
rsit y
Inte
r fir
m te
chno
logy
spi
llove
r
103
3.4.6 Patent strategy of material technology
In previous works, the importance of patent strategy has been discussed. For instance, management of intangible resources is reported (Hall, 1992; Young et al., 2008). The measurement of patent portfolio size and its quality is discussed (Lichtenthaler, 2009; Gann Xu, 2009). The numbers of patent applications and citations can be a factor to evaluate patents (Blind et al, 2009). Patent management in biotechnology industry is discussed (Thumm, 2001; Calabrese et al, 2000 ). Patent management in Japanese firms is also noted (Sasaki, 2004).
We also demonstrated the importance of patent strategy for the innovation, and discussed the changes of patent strategy before and after the restructuring of organization by focusing on the merger and acquisition (M&A) in pharmaceutical industry. Intellectual Property (IP) management in M&A cases of Japanese pharmaceutical firms were investigated. We used the rate of Rate For Examination (RFE), the duration of RFE, and the rate of granted as indices of IP management, which can describe the selectivity in filing patent applications and in filing RFE. The ways of managing IP protection of the firms depend on IP management department, and these indices would be useful to analyze the strategies of IP management in M&A. The management would be blended among two or more firms before M&A with less difficulty if they are similar in their IP management. Thus, it is advisable for IP department of pharmaceutical firms in M&A to obtain information of IP management using indices stated above in advance (Shibata, Takahashi, and Saiki, 2010).
In this work, we investigated following two things based on the analysis of relations between patent strategy and restructuring of organization in two cases of M&A of pharmaceutical firms, Daiichi-Sankyo and Astellas. i) The ways of managing IP protection of the firms before M&A are different with each
other or similar in each IP management indices. ii) The ways of managing information on IP rights in the new-drug firms before M&A
could be blended with little difficulties because of their similarity with one another.
Thus, it is important to provide suitable IP management in each industry. It is also important to understand IP management in the case of material technology
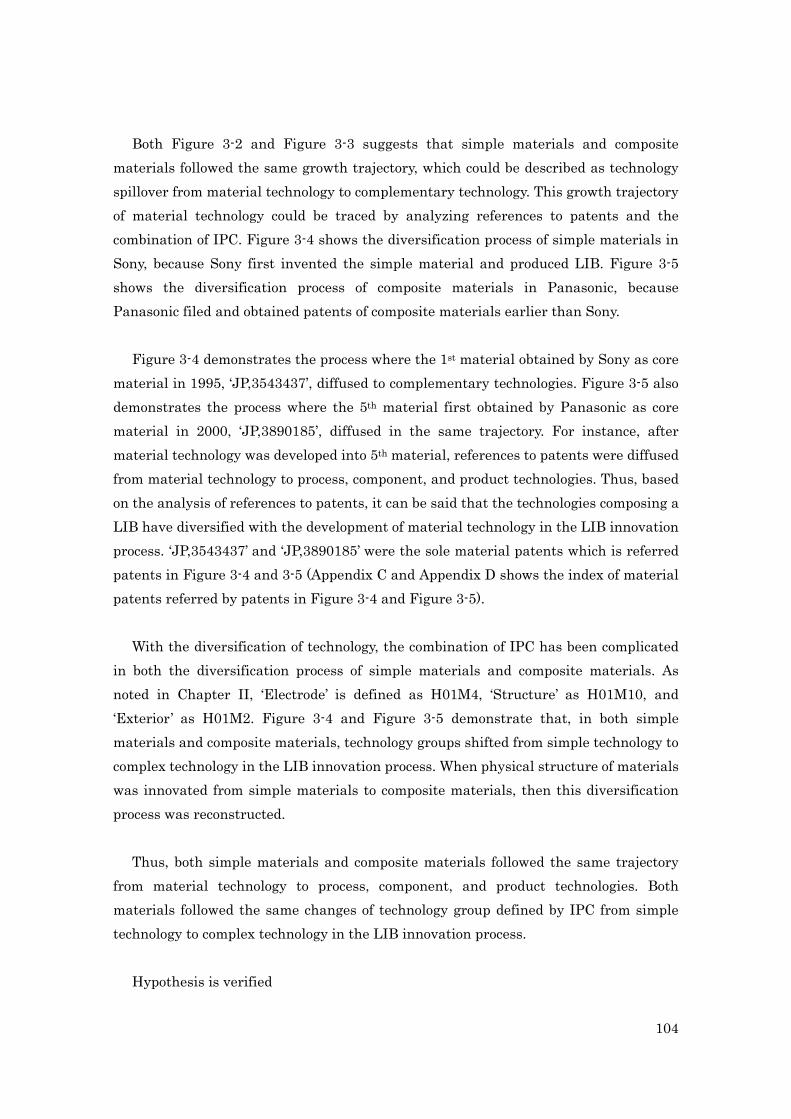
104
Both Figure 3-2 and Figure 3-3 suggests that simple materials and composite materials followed the same growth trajectory, which could be described as technology spillover from material technology to complementary technology. This growth trajectory of material technology could be traced by analyzing references to patents and the combination of IPC. Figure 3-4 shows the diversification process of simple materials in Sony, because Sony first invented the simple material and produced LIB. Figure 3-5 shows the diversification process of composite materials in Panasonic, because Panasonic filed and obtained patents of composite materials earlier than Sony.
Figure 3-4 demonstrates the process where the 1st material obtained by Sony as core material in 1995, ‘JP,3543437’, diffused to complementary technologies. Figure 3-5 also demonstrates the process where the 5th material first obtained by Panasonic as core material in 2000, ‘JP,3890185’, diffused in the same trajectory. For instance, after material technology was developed into 5th material, references to patents were diffused from material technology to process, component, and product technologies. Thus, based on the analysis of references to patents, it can be said that the technologies composing a LIB have diversified with the development of material technology in the LIB innovation process. ‘JP,3543437’ and ‘JP,3890185’ were the sole material patents which is referred patents in Figure 3-4 and 3-5 (Appendix C and Appendix D shows the index of material patents referred by patents in Figure 3-4 and Figure 3-5).
With the diversification of technology, the combination of IPC has been complicated in both the diversification process of simple materials and composite materials. As noted in Chapter II, ‘Electrode’ is defined as H01M4, ‘Structure’ as H01M10, and ‘Exterior’ as H01M2. Figure 3-4 and Figure 3-5 demonstrate that, in both simple materials and composite materials, technology groups shifted from simple technology to complex technology in the LIB innovation process. When physical structure of materials was innovated from simple materials to composite materials, then this diversification process was reconstructed.
Thus, both simple materials and composite materials followed the same trajectory from material technology to process, component, and product technologies. Both materials followed the same changes of technology group defined by IPC from simple technology to complex technology in the LIB innovation process.
Hypothesis is verified
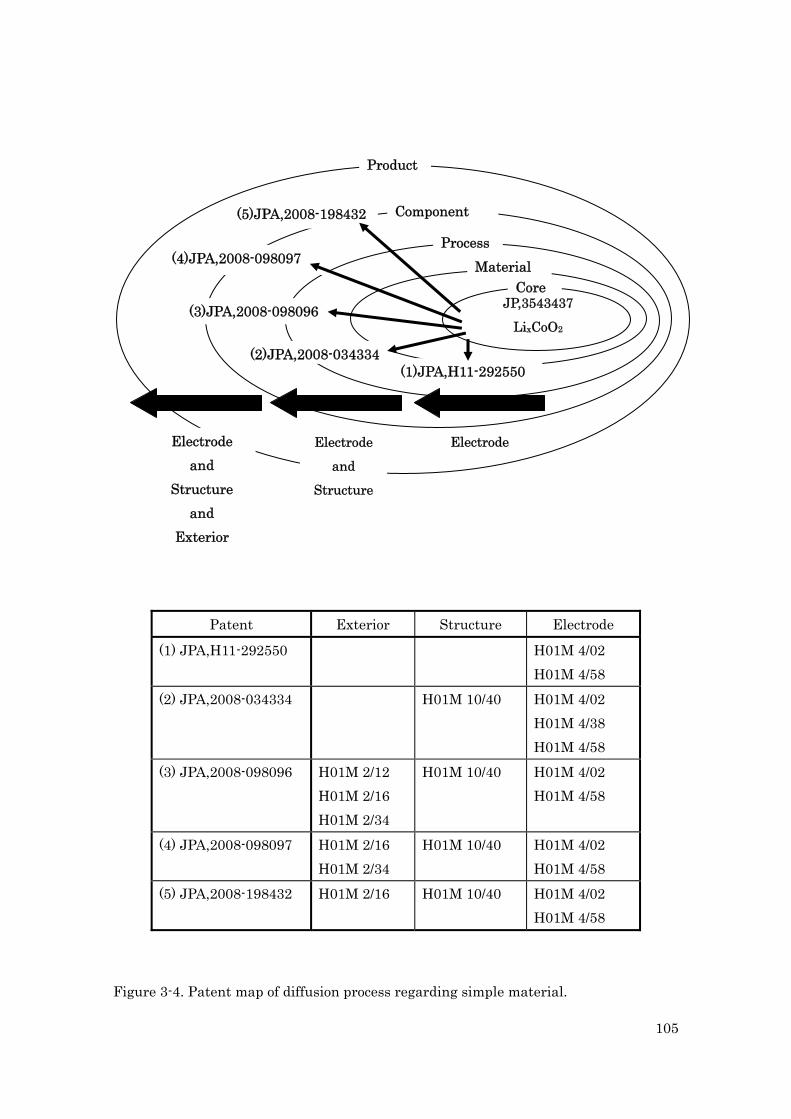
105
Patent Exterior Structure Electrode
(1) JPA,H11-292550
H01M 4/02 H01M 4/58
(2) JPA,2008-034334
H01M 10/40 H01M 4/02 H01M 4/38 H01M 4/58
(3) JPA,2008-098096
H01M 2/12 H01M 2/16 H01M 2/34
H01M 10/40 H01M 4/02 H01M 4/58
(4) JPA,2008-098097
H01M 2/16 H01M 2/34
H01M 10/40 H01M 4/02 H01M 4/58
(5) JPA,2008-198432
H01M 2/16 H01M 10/40 H01M 4/02 H01M 4/58
Figure 3-4. Patent map of diffusion process regarding simple material.
Core Material
Process
Component
Product
JP,3543437 LixCoO2
(3)JPA,2008-098096
(2)JPA,2008-034334 (1)JPA,H11-292550
(5)JPA,2008-198432
(4)JPA,2008-098097
Electrode Electrode
and Structure
Electrode and
Structure and
Exterior
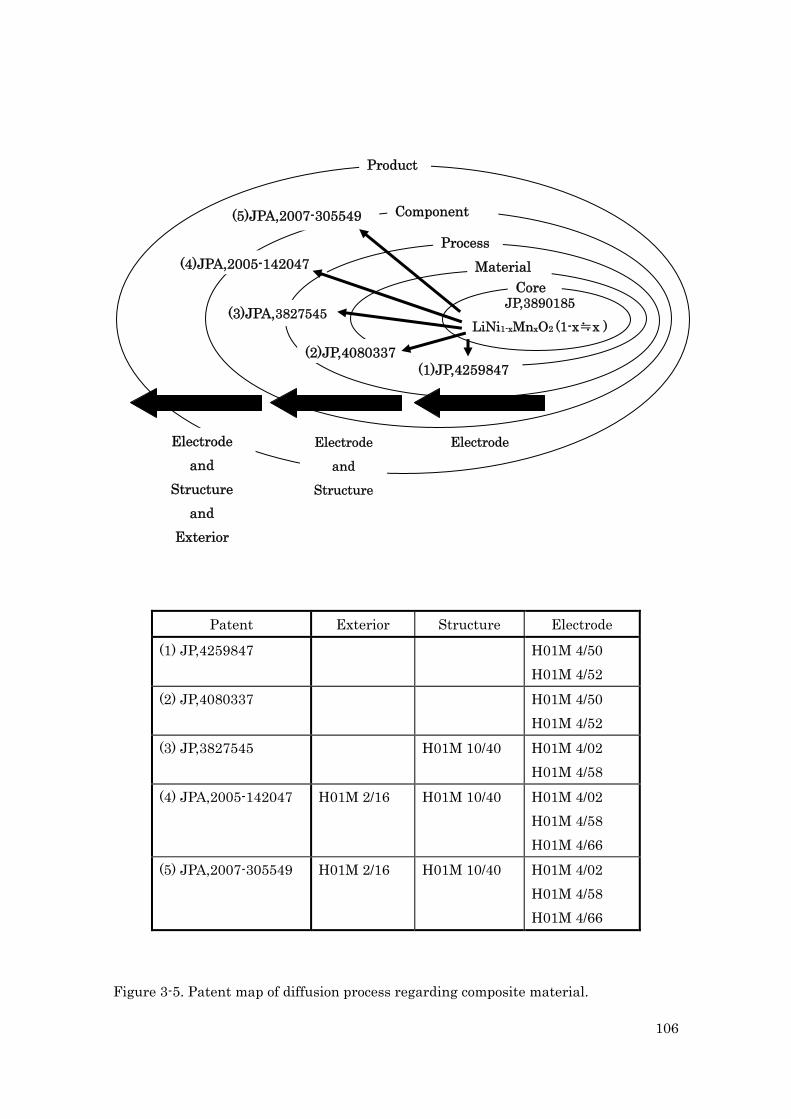
106
Patent Exterior Structure Electrode
(1) JP,4259847 H01M 4/50 H01M 4/52
(2) JP,4080337 H01M 4/50 H01M 4/52
(3) JP,3827545 H01M 10/40 H01M 4/02 H01M 4/58
(4) JPA,2005-142047 H01M 2/16 H01M 10/40 H01M 4/02 H01M 4/58 H01M 4/66
(5) JPA,2007-305549 H01M 2/16 H01M 10/40 H01M 4/02 H01M 4/58 H01M 4/66
Figure 3-5. Patent map of diffusion process regarding composite material.
Core Material
Process
Component
Product
JP,3890185 LiNi1-xMnxO2 (1-x≒x )
(3)JPA,3827545
(2)JP,4080337 (1)JP,4259847
(5)JPA,2007-305549
(4)JPA,2005-142047
Electrode Electrode
and Structure
Electrode and
Structure and
Exterior
107
3.5 Discussion As the innovation dynamism of material technology in the LIB industry, the results
demonstrate that technology spillover structure was changed from intra-technology to inter-technology spillover.
First, intra-technology spillover, technology spillover within material technology, was
encouraged. As previously noted, technological functionality of LIB was attributed to the development of materials with high energy density and stability. It could be considered that material technology was based on explicit knowledge, because it can be conceptualized by chemical rules such as chemical formula, chemical equation, and chemical laws. In the LIB industry, innovation was created from the conceptualization of core material and derivative materials. Thus, intra-technology spillover facilitated the development of materials at the start of innovation.
Next, inter-technology spillover, technology spillover between material technology
and complementary technology, was encouraged as an integration of technologies. In both simple materials and composite materials, the innovation process traced a similar path. After the development of material technology, knowledge regarding materials needed to be transferred to complementary technologies to reflect specific characteristics of materials into a product. It could be considered that complementary technology had a strong relationship with tacit knowledge; for instance, methods of how to manufacture products would be based on the experiences, skills, and know-how from a firm’s own facilities and equipments. Integration of these technologies was then required to manufacture innovative products. Thus, inter-technology spillover facilitated the manufacturing of products in the LIB innovation process.
For example, Panasonic has advanced cross-industrial associations since 2000 and increased the collaborative R&D. In addition to this, Panasonic introduced ‘platform structure’ in their R&D and promoted the horizontal integration between core technologies and strategic products. It seems that these projects contributed to encourage technology spillover, not only within Panasonic but also between Panasonic and other entities, additionally not only within a basic technology but also between basic technology and advanced technology. This change of the technology spillover structure from intra-technology to inter-technology spillover can be one of reasons for Panasonic’s success.
108
3.6 Conclusion In conclusion, it was revealed that simple materials and composite materials
followed the same growth trajectory, which could be described as inter-technology spillover; diffusion of technologies from material technology to process, component, and product technologies. Then, both materials followed the same changes of technology group defined by IPC from simple technology to complex technology in the LIB innovation process. It was also revealed that this LIB innovation process was reconstructed when physical structure of materials was innovated from simple materials to composite materials.
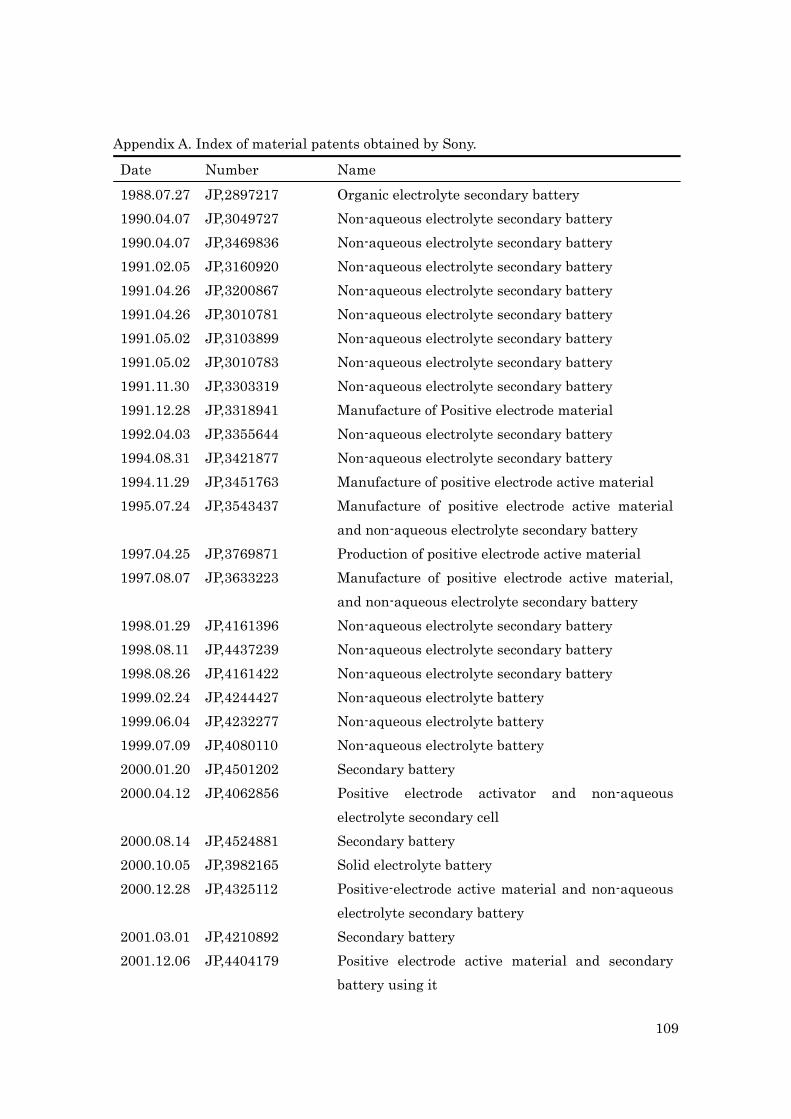
109
Appendix A. Index of material patents obtained by Sony.
Date Number Name 1988.07.27 JP,2897217 Organic electrolyte secondary battery 1990.04.07 JP,3049727 Non-aqueous electrolyte secondary battery 1990.04.07 JP,3469836 Non-aqueous electrolyte secondary battery 1991.02.05 JP,3160920 Non-aqueous electrolyte secondary battery 1991.04.26 JP,3200867 Non-aqueous electrolyte secondary battery 1991.04.26 JP,3010781 Non-aqueous electrolyte secondary battery 1991.05.02 JP,3103899 Non-aqueous electrolyte secondary battery 1991.05.02 JP,3010783 Non-aqueous electrolyte secondary battery 1991.11.30 JP,3303319 Non-aqueous electrolyte secondary battery 1991.12.28 JP,3318941 Manufacture of Positive electrode material 1992.04.03 JP,3355644 Non-aqueous electrolyte secondary battery 1994.08.31 JP,3421877 Non-aqueous electrolyte secondary battery 1994.11.29 JP,3451763 Manufacture of positive electrode active material 1995.07.24 JP,3543437 Manufacture of positive electrode active material
and non-aqueous electrolyte secondary battery 1997.04.25 JP,3769871 Production of positive electrode active material 1997.08.07 JP,3633223 Manufacture of positive electrode active material,
and non-aqueous electrolyte secondary battery 1998.01.29 JP,4161396 Non-aqueous electrolyte secondary battery 1998.08.11 JP,4437239 Non-aqueous electrolyte secondary battery 1998.08.26 JP,4161422 Non-aqueous electrolyte secondary battery 1999.02.24 JP,4244427 Non-aqueous electrolyte battery 1999.06.04 JP,4232277 Non-aqueous electrolyte battery 1999.07.09 JP,4080110 Non-aqueous electrolyte battery 2000.01.20 JP,4501202 Secondary battery 2000.04.12 JP,4062856 Positive electrode activator and non-aqueous
electrolyte secondary cell 2000.08.14 JP,4524881 Secondary battery 2000.10.05 JP,3982165 Solid electrolyte battery 2000.12.28 JP,4325112 Positive-electrode active material and non-aqueous
electrolyte secondary battery 2001.03.01 JP,4210892 Secondary battery 2001.12.06 JP,4404179 Positive electrode active material and secondary
battery using it
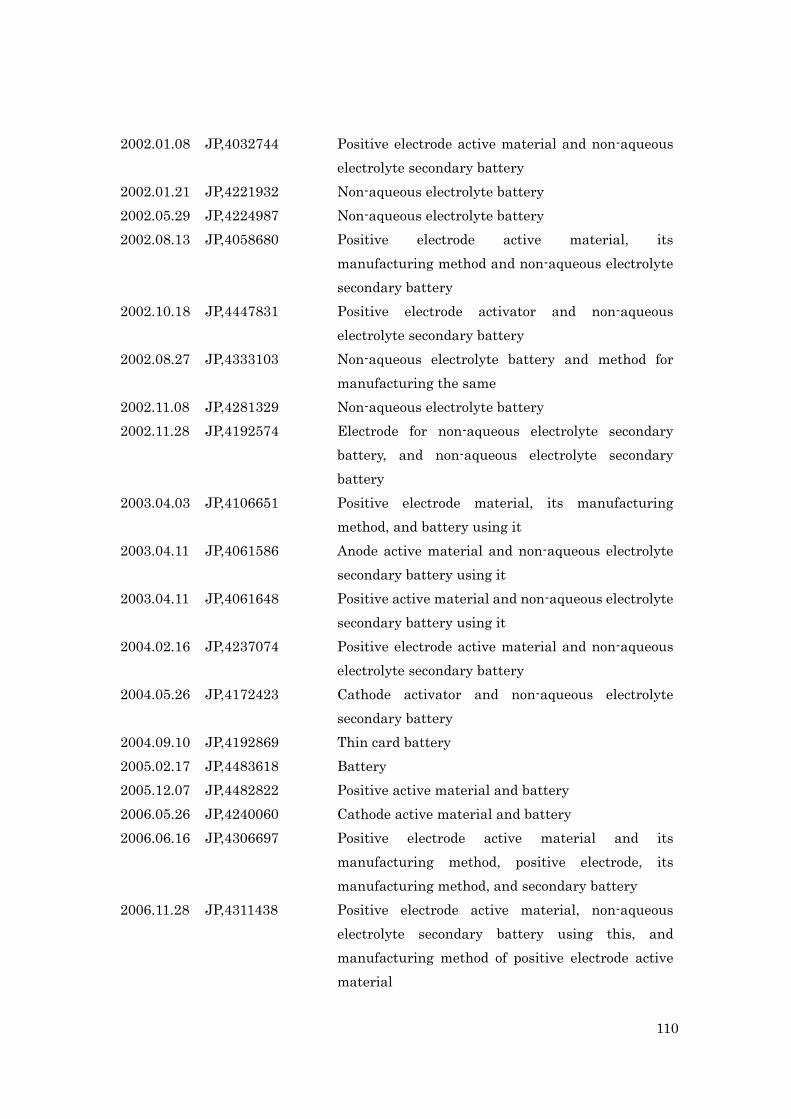
110
2002.01.08 JP,4032744 Positive electrode active material and non-aqueous electrolyte secondary battery
2002.01.21 JP,4221932 Non-aqueous electrolyte battery 2002.05.29 JP,4224987 Non-aqueous electrolyte battery 2002.08.13 JP,4058680 Positive electrode active material, its
manufacturing method and non-aqueous electrolyte secondary battery
2002.10.18 JP,4447831 Positive electrode activator and non-aqueous electrolyte secondary battery
2002.08.27 JP,4333103 Non-aqueous electrolyte battery and method for manufacturing the same
2002.11.08 JP,4281329 Non-aqueous electrolyte battery 2002.11.28 JP,4192574 Electrode for non-aqueous electrolyte secondary
battery, and non-aqueous electrolyte secondary battery
2003.04.03 JP,4106651 Positive electrode material, its manufacturing method, and battery using it
2003.04.11 JP,4061586 Anode active material and non-aqueous electrolyte secondary battery using it
2003.04.11 JP,4061648 Positive active material and non-aqueous electrolyte secondary battery using it
2004.02.16 JP,4237074 Positive electrode active material and non-aqueous electrolyte secondary battery
2004.05.26 JP,4172423 Cathode activator and non-aqueous electrolyte secondary battery
2004.09.10 JP,4192869 Thin card battery 2005.02.17 JP,4483618 Battery 2005.12.07 JP,4482822 Positive active material and battery 2006.05.26 JP,4240060 Cathode active material and battery 2006.06.16 JP,4306697 Positive electrode active material and its
manufacturing method, positive electrode, its manufacturing method, and secondary battery
2006.11.28 JP,4311438 Positive electrode active material, non-aqueous electrolyte secondary battery using this, and manufacturing method of positive electrode active material
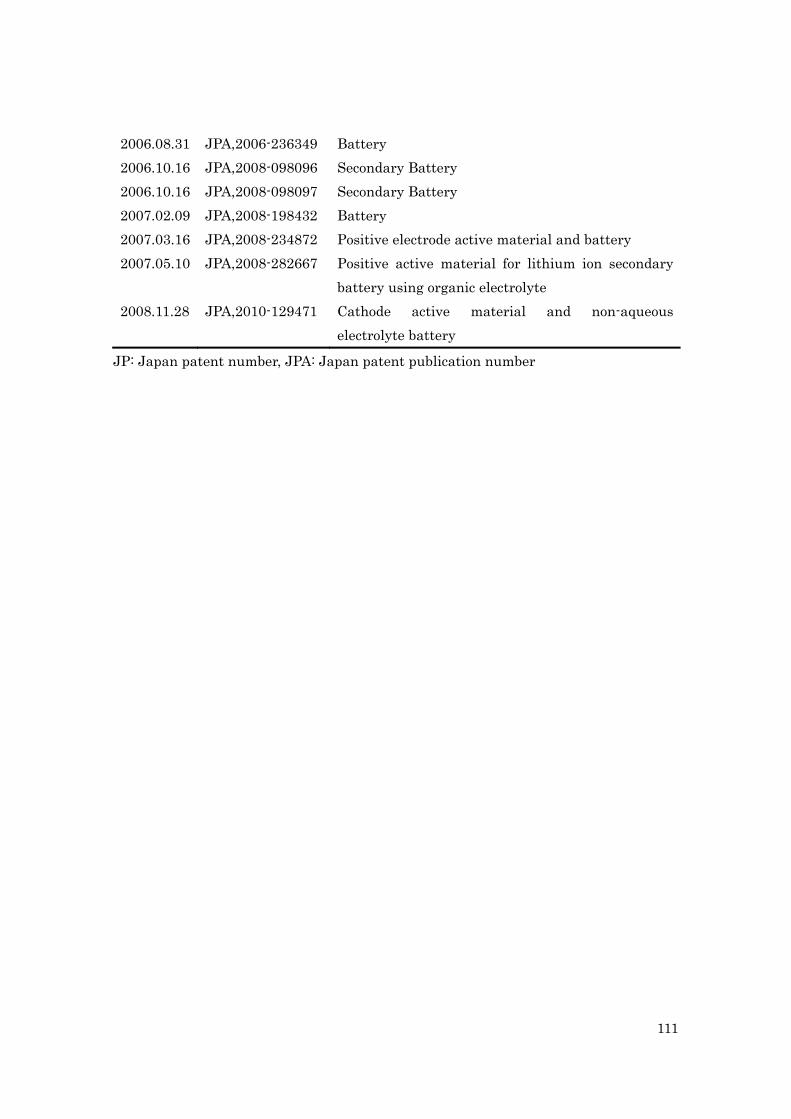
111
2006.08.31 JPA,2006-236349 Battery 2006.10.16 JPA,2008-098096 Secondary Battery 2006.10.16 JPA,2008-098097 Secondary Battery 2007.02.09 JPA,2008-198432 Battery 2007.03.16 JPA,2008-234872 Positive electrode active material and battery 2007.05.10 JPA,2008-282667 Positive active material for lithium ion secondary
battery using organic electrolyte 2008.11.28 JPA,2010-129471 Cathode active material and non-aqueous
electrolyte battery
JP: Japan patent number, JPA: Japan patent publication number
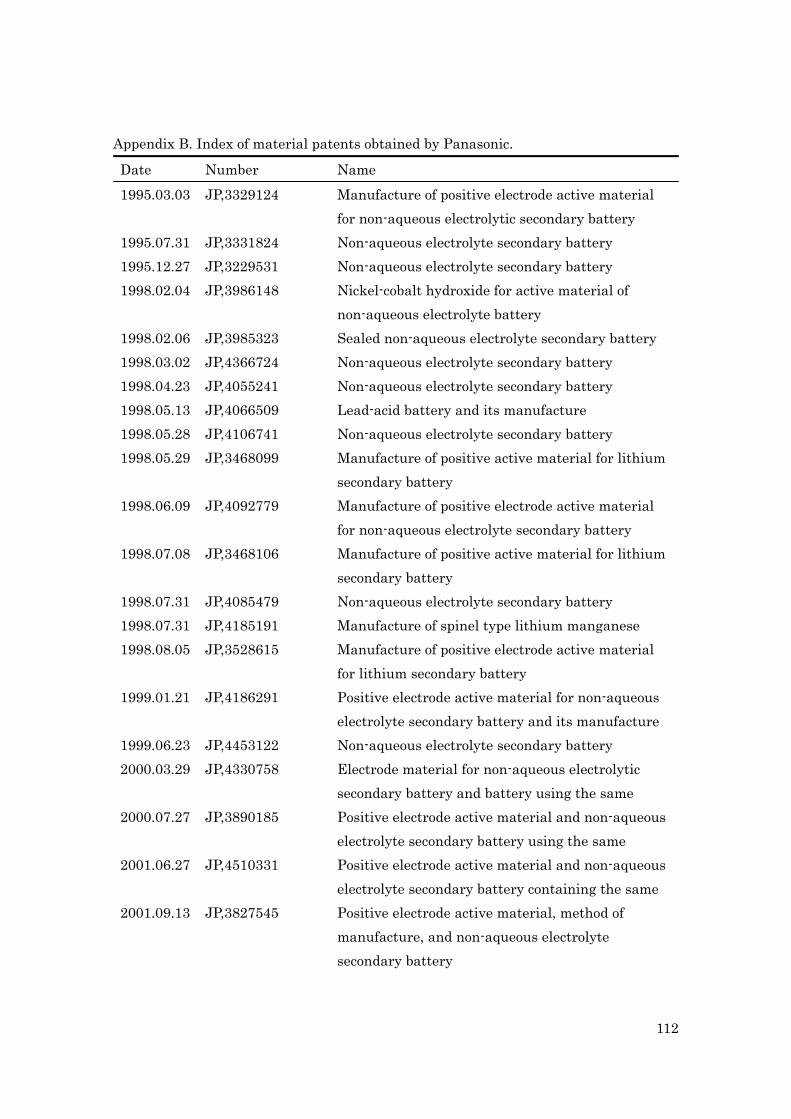
112
Appendix B. Index of material patents obtained by Panasonic.
Date Number Name 1995.03.03 JP,3329124 Manufacture of positive electrode active material
for non-aqueous electrolytic secondary battery 1995.07.31 JP,3331824 Non-aqueous electrolyte secondary battery 1995.12.27 JP,3229531 Non-aqueous electrolyte secondary battery 1998.02.04 JP,3986148 Nickel-cobalt hydroxide for active material of
non-aqueous electrolyte battery 1998.02.06 JP,3985323 Sealed non-aqueous electrolyte secondary battery 1998.03.02 JP,4366724 Non-aqueous electrolyte secondary battery 1998.04.23 JP,4055241 Non-aqueous electrolyte secondary battery 1998.05.13 JP,4066509 Lead-acid battery and its manufacture 1998.05.28 JP,4106741 Non-aqueous electrolyte secondary battery 1998.05.29 JP,3468099 Manufacture of positive active material for lithium
secondary battery 1998.06.09 JP,4092779 Manufacture of positive electrode active material
for non-aqueous electrolyte secondary battery 1998.07.08 JP,3468106 Manufacture of positive active material for lithium
secondary battery 1998.07.31 JP,4085479 Non-aqueous electrolyte secondary battery 1998.07.31 JP,4185191 Manufacture of spinel type lithium manganese 1998.08.05 JP,3528615 Manufacture of positive electrode active material
for lithium secondary battery 1999.01.21 JP,4186291 Positive electrode active material for non-aqueous
electrolyte secondary battery and its manufacture 1999.06.23 JP,4453122 Non-aqueous electrolyte secondary battery 2000.03.29 JP,4330758 Electrode material for non-aqueous electrolytic
secondary battery and battery using the same 2000.07.27 JP,3890185 Positive electrode active material and non-aqueous
electrolyte secondary battery using the same 2001.06.27 JP,4510331 Positive electrode active material and non-aqueous
electrolyte secondary battery containing the same 2001.09.13 JP,3827545 Positive electrode active material, method of
manufacture, and non-aqueous electrolyte secondary battery
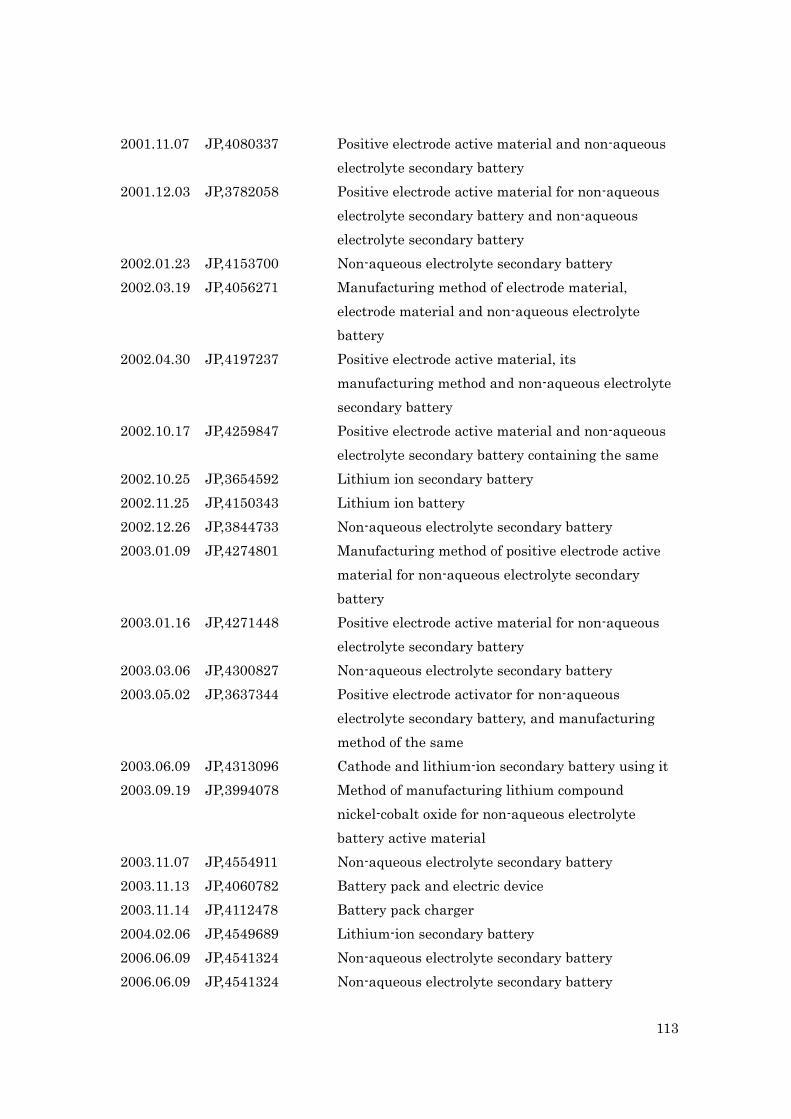
113
2001.11.07 JP,4080337 Positive electrode active material and non-aqueous electrolyte secondary battery
2001.12.03 JP,3782058 Positive electrode active material for non-aqueous electrolyte secondary battery and non-aqueous electrolyte secondary battery
2002.01.23 JP,4153700 Non-aqueous electrolyte secondary battery 2002.03.19 JP,4056271 Manufacturing method of electrode material,
electrode material and non-aqueous electrolyte battery
2002.04.30 JP,4197237 Positive electrode active material, its manufacturing method and non-aqueous electrolyte secondary battery
2002.10.17 JP,4259847 Positive electrode active material and non-aqueous electrolyte secondary battery containing the same
2002.10.25 JP,3654592 Lithium ion secondary battery 2002.11.25 JP,4150343 Lithium ion battery 2002.12.26 JP,3844733 Non-aqueous electrolyte secondary battery 2003.01.09 JP,4274801 Manufacturing method of positive electrode active
material for non-aqueous electrolyte secondary battery
2003.01.16 JP,4271448 Positive electrode active material for non-aqueous electrolyte secondary battery
2003.03.06 JP,4300827 Non-aqueous electrolyte secondary battery 2003.05.02 JP,3637344 Positive electrode activator for non-aqueous
electrolyte secondary battery, and manufacturing method of the same
2003.06.09 JP,4313096 Cathode and lithium-ion secondary battery using it2003.09.19 JP,3994078 Method of manufacturing lithium compound
nickel-cobalt oxide for non-aqueous electrolyte battery active material
2003.11.07 JP,4554911 Non-aqueous electrolyte secondary battery 2003.11.13 JP,4060782 Battery pack and electric device 2003.11.14 JP,4112478 Battery pack charger 2004.02.06 JP,4549689 Lithium-ion secondary battery 2006.06.09 JP,4541324 Non-aqueous electrolyte secondary battery 2006.06.09 JP,4541324 Non-aqueous electrolyte secondary battery
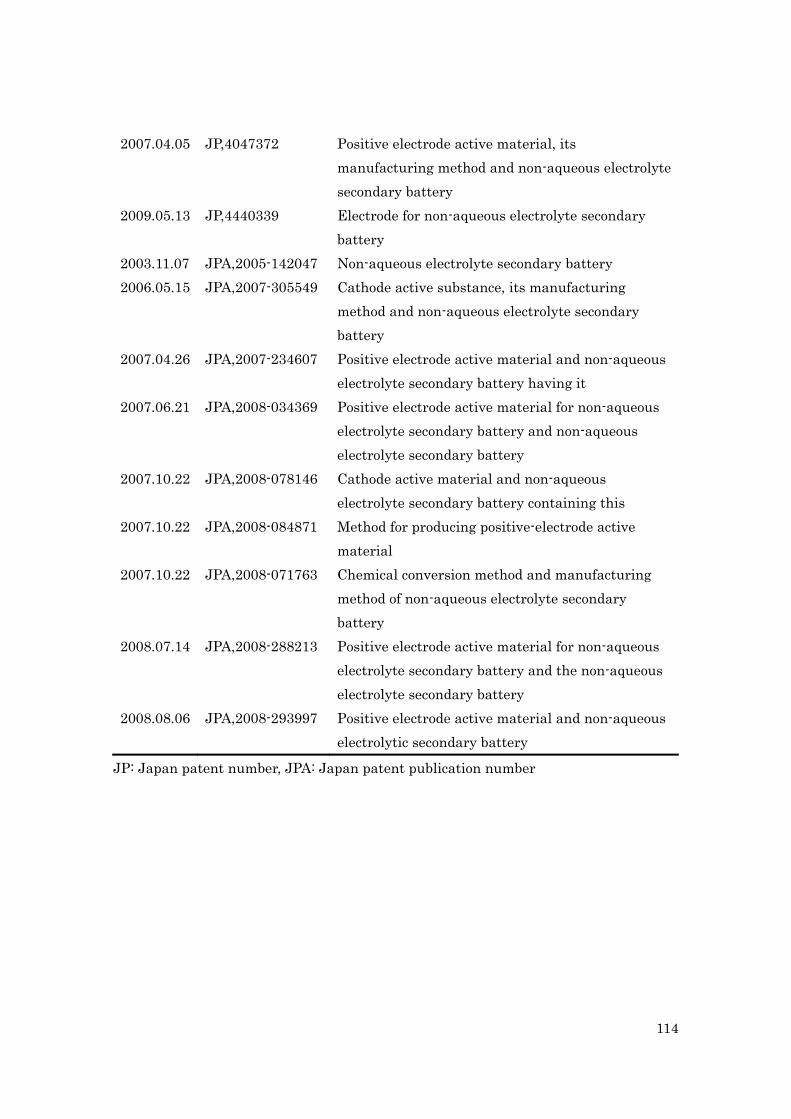
114
2007.04.05 JP,4047372 Positive electrode active material, its manufacturing method and non-aqueous electrolyte secondary battery
2009.05.13 JP,4440339 Electrode for non-aqueous electrolyte secondary battery
2003.11.07 JPA,2005-142047 Non-aqueous electrolyte secondary battery 2006.05.15 JPA,2007-305549 Cathode active substance, its manufacturing
method and non-aqueous electrolyte secondary battery
2007.04.26 JPA,2007-234607 Positive electrode active material and non-aqueous electrolyte secondary battery having it
2007.06.21 JPA,2008-034369 Positive electrode active material for non-aqueous electrolyte secondary battery and non-aqueous electrolyte secondary battery
2007.10.22 JPA,2008-078146 Cathode active material and non-aqueous electrolyte secondary battery containing this
2007.10.22 JPA,2008-084871 Method for producing positive-electrode active material
2007.10.22 JPA,2008-071763 Chemical conversion method and manufacturing method of non-aqueous electrolyte secondary battery
2008.07.14 JPA,2008-288213 Positive electrode active material for non-aqueous electrolyte secondary battery and the non-aqueous electrolyte secondary battery
2008.08.06 JPA,2008-293997 Positive electrode active material and non-aqueous electrolytic secondary battery
JP: Japan patent number, JPA: Japan patent publication number
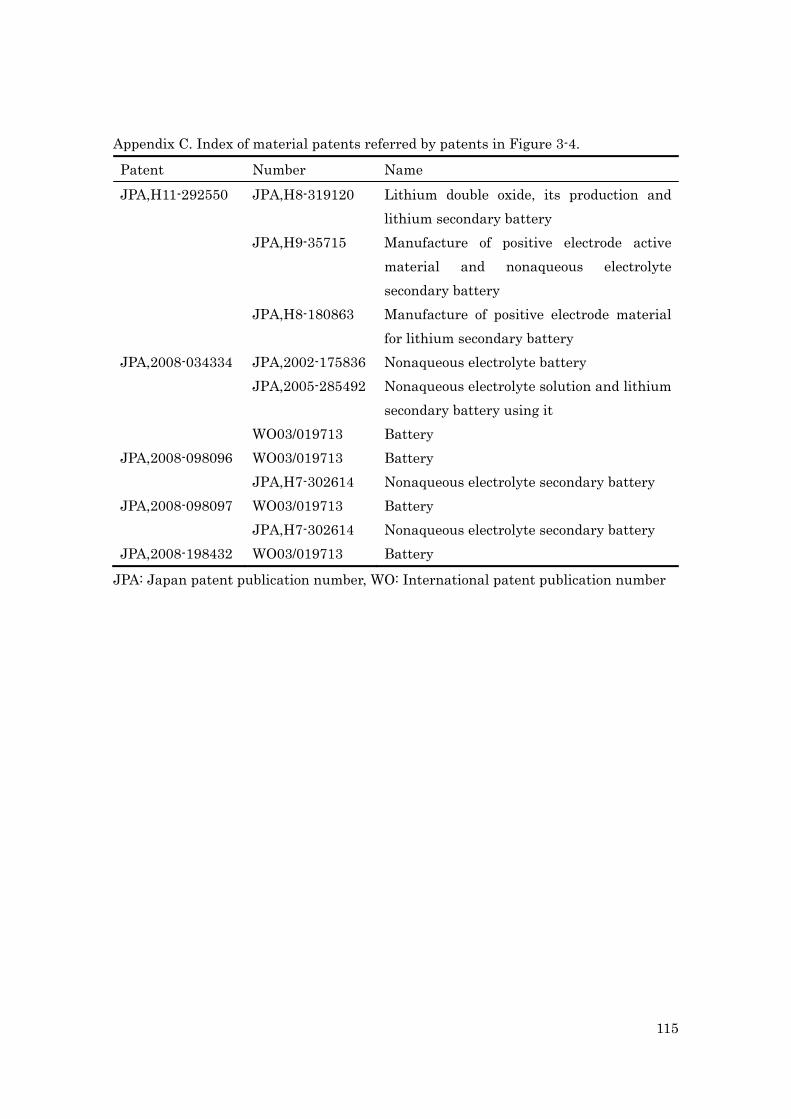
115
Appendix C. Index of material patents referred by patents in Figure 3-4.
Patent Number Name JPA,H11-292550 JPA,H8-319120 Lithium double oxide, its production and
lithium secondary battery JPA,H9-35715 Manufacture of positive electrode active
material and nonaqueous electrolyte secondary battery
JPA,H8-180863 Manufacture of positive electrode material for lithium secondary battery
JPA,2008-034334 JPA,2002-175836 Nonaqueous electrolyte battery JPA,2005-285492 Nonaqueous electrolyte solution and lithium
secondary battery using it WO03/019713 Battery JPA,2008-098096 WO03/019713 Battery JPA,H7-302614 Nonaqueous electrolyte secondary battery JPA,2008-098097 WO03/019713 Battery JPA,H7-302614 Nonaqueous electrolyte secondary battery JPA,2008-198432 WO03/019713 Battery
JPA: Japan patent publication number, WO: International patent publication number
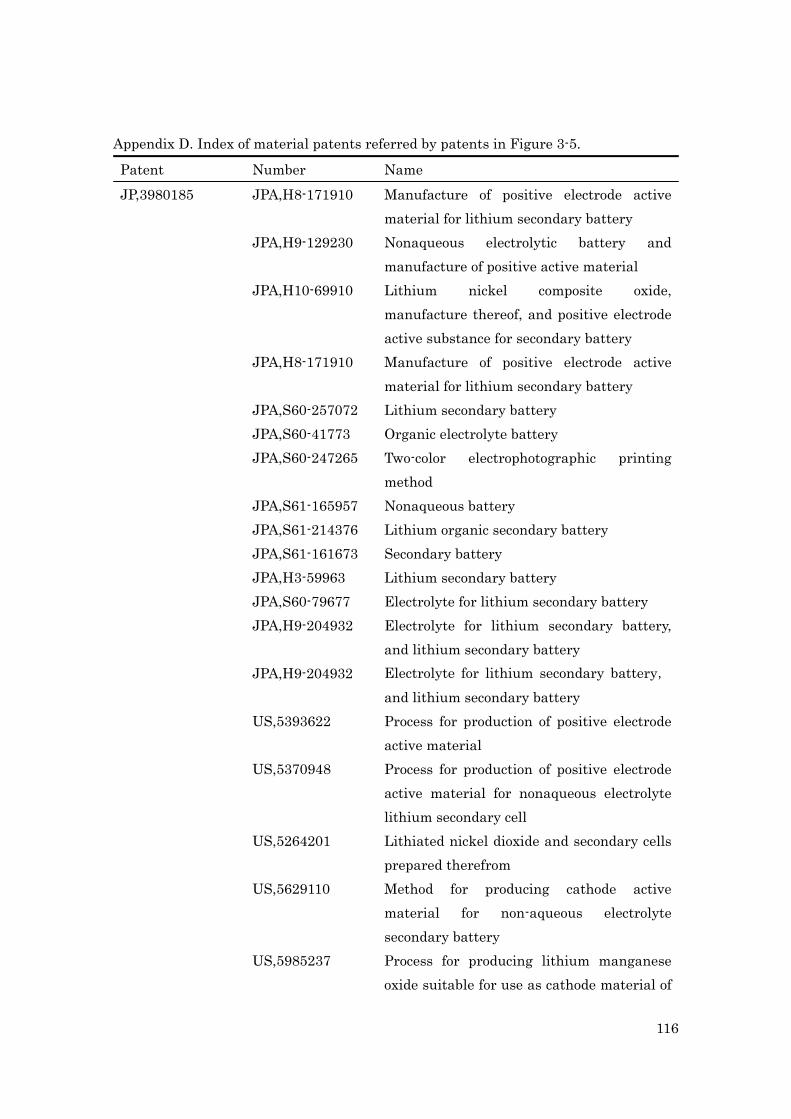
116
Appendix D. Index of material patents referred by patents in Figure 3-5.
Patent Number Name JP,3980185 JPA,H8-171910 Manufacture of positive electrode active
material for lithium secondary battery JPA,H9-129230 Nonaqueous electrolytic battery and
manufacture of positive active material JPA,H10-69910 Lithium nickel composite oxide,
manufacture thereof, and positive electrode active substance for secondary battery
JPA,H8-171910 Manufacture of positive electrode active material for lithium secondary battery
JPA,S60-257072 Lithium secondary battery JPA,S60-41773 Organic electrolyte battery JPA,S60-247265 Two-color electrophotographic printing
method JPA,S61-165957 Nonaqueous battery JPA,S61-214376 Lithium organic secondary battery JPA,S61-161673 Secondary battery JPA,H3-59963 Lithium secondary battery JPA,S60-79677 Electrolyte for lithium secondary battery JPA,H9-204932 Electrolyte for lithium secondary battery,
and lithium secondary battery JPA,H9-204932 Electrolyte for lithium secondary battery,
and lithium secondary battery US,5393622 Process for production of positive electrode
active material US,5370948 Process for production of positive electrode
active material for nonaqueous electrolyte lithium secondary cell
US,5264201 Lithiated nickel dioxide and secondary cells prepared therefrom
US,5629110 Method for producing cathode active material for non-aqueous electrolyte secondary battery
US,5985237 Process for producing lithium manganese oxide suitable for use as cathode material of
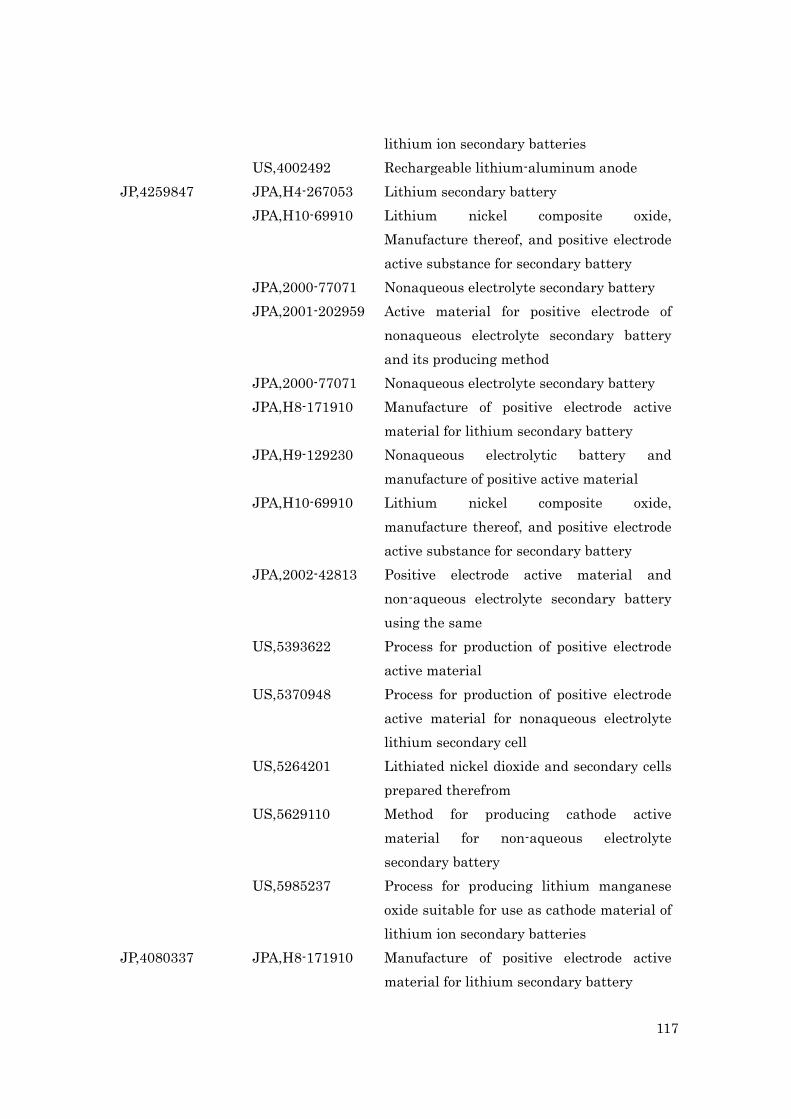
117
lithium ion secondary batteries US,4002492 Rechargeable lithium-aluminum anode JP,4259847 JPA,H4-267053 Lithium secondary battery JPA,H10-69910 Lithium nickel composite oxide,
Manufacture thereof, and positive electrode active substance for secondary battery
JPA,2000-77071 Nonaqueous electrolyte secondary battery JPA,2001-202959 Active material for positive electrode of
nonaqueous electrolyte secondary battery and its producing method
JPA,2000-77071 Nonaqueous electrolyte secondary battery JPA,H8-171910 Manufacture of positive electrode active
material for lithium secondary battery JPA,H9-129230 Nonaqueous electrolytic battery and
manufacture of positive active material JPA,H10-69910 Lithium nickel composite oxide,
manufacture thereof, and positive electrode active substance for secondary battery
JPA,2002-42813 Positive electrode active material and non-aqueous electrolyte secondary battery using the same
US,5393622 Process for production of positive electrode active material
US,5370948 Process for production of positive electrode active material for nonaqueous electrolyte lithium secondary cell
US,5264201 Lithiated nickel dioxide and secondary cells prepared therefrom
US,5629110 Method for producing cathode active material for non-aqueous electrolyte secondary battery
US,5985237 Process for producing lithium manganese oxide suitable for use as cathode material of lithium ion secondary batteries
JP,4080337 JPA,H8-171910 Manufacture of positive electrode active material for lithium secondary battery
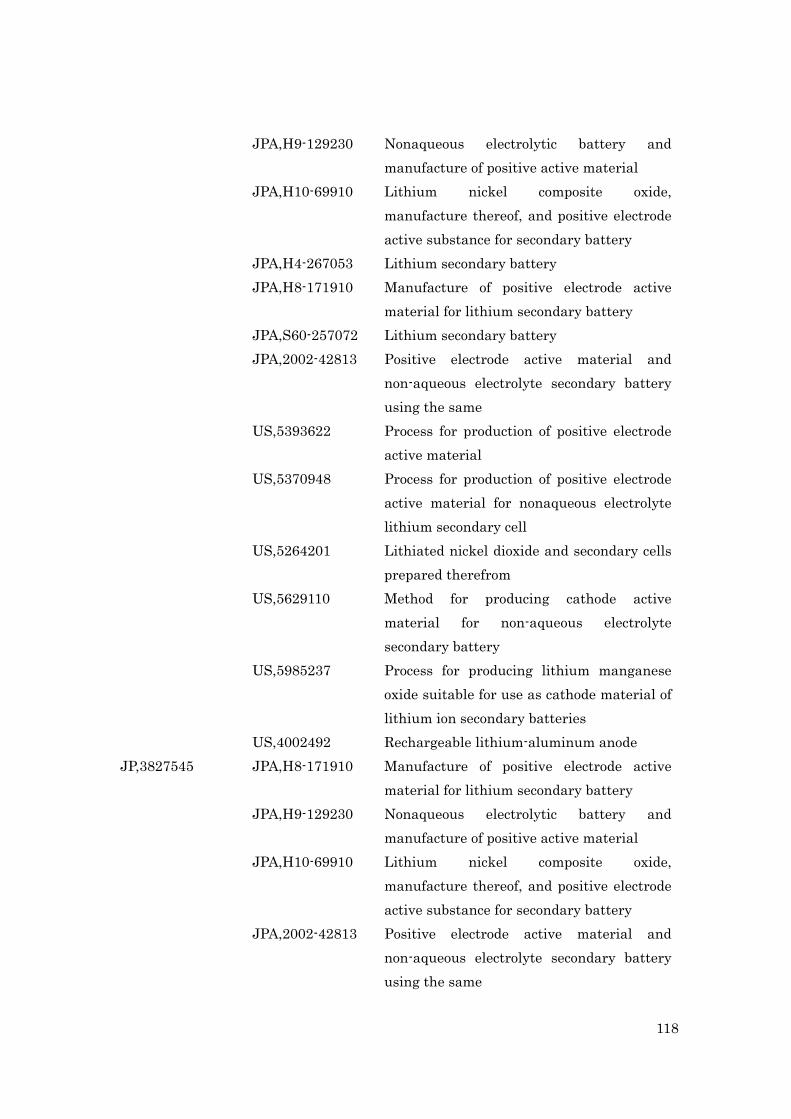
118
JPA,H9-129230 Nonaqueous electrolytic battery and manufacture of positive active material
JPA,H10-69910 Lithium nickel composite oxide, manufacture thereof, and positive electrode active substance for secondary battery
JPA,H4-267053 Lithium secondary battery JPA,H8-171910 Manufacture of positive electrode active
material for lithium secondary battery JPA,S60-257072 Lithium secondary battery JPA,2002-42813 Positive electrode active material and
non-aqueous electrolyte secondary battery using the same
US,5393622 Process for production of positive electrode active material
US,5370948 Process for production of positive electrode active material for nonaqueous electrolyte lithium secondary cell
US,5264201 Lithiated nickel dioxide and secondary cells prepared therefrom
US,5629110 Method for producing cathode active material for non-aqueous electrolyte secondary battery
US,5985237 Process for producing lithium manganese oxide suitable for use as cathode material of lithium ion secondary batteries
US,4002492 Rechargeable lithium-aluminum anode JP,3827545 JPA,H8-171910 Manufacture of positive electrode active
material for lithium secondary battery JPA,H9-129230 Nonaqueous electrolytic battery and
manufacture of positive active material JPA,H10-69910 Lithium nickel composite oxide,
manufacture thereof, and positive electrode active substance for secondary battery
JPA,2002-42813 Positive electrode active material and non-aqueous electrolyte secondary battery using the same
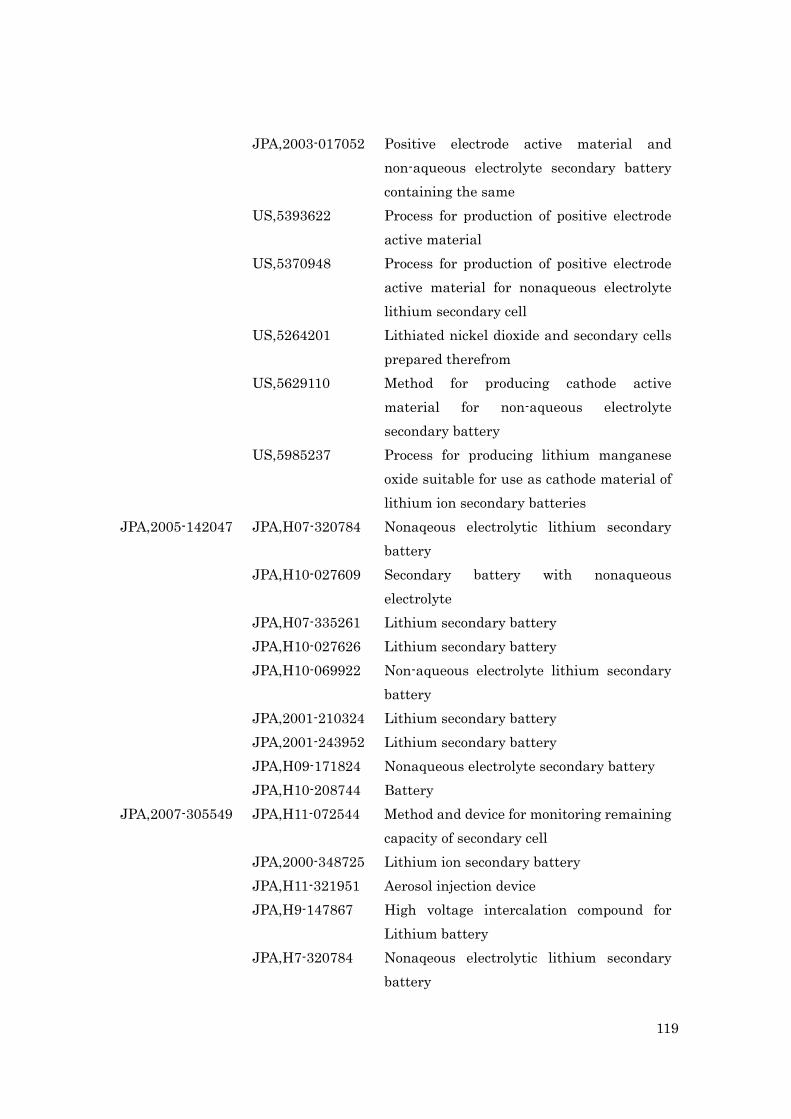
119
JPA,2003-017052 Positive electrode active material and non-aqueous electrolyte secondary battery containing the same
US,5393622 Process for production of positive electrode active material
US,5370948 Process for production of positive electrode active material for nonaqueous electrolyte lithium secondary cell
US,5264201 Lithiated nickel dioxide and secondary cells prepared therefrom
US,5629110 Method for producing cathode active material for non-aqueous electrolyte secondary battery
US,5985237 Process for producing lithium manganese oxide suitable for use as cathode material of lithium ion secondary batteries
JPA,2005-142047 JPA,H07-320784 Nonaqeous electrolytic lithium secondary battery
JPA,H10-027609 Secondary battery with nonaqueous electrolyte
JPA,H07-335261 Lithium secondary battery JPA,H10-027626 Lithium secondary battery JPA,H10-069922 Non-aqueous electrolyte lithium secondary
battery JPA,2001-210324 Lithium secondary battery JPA,2001-243952 Lithium secondary battery JPA,H09-171824 Nonaqueous electrolyte secondary battery JPA,H10-208744 Battery JPA,2007-305549 JPA,H11-072544 Method and device for monitoring remaining
capacity of secondary cell JPA,2000-348725 Lithium ion secondary battery JPA,H11-321951 Aerosol injection device JPA,H9-147867 High voltage intercalation compound for
Lithium battery JPA,H7-320784 Nonaqeous electrolytic lithium secondary
battery
120
JPA,H7-335261 Lithium secondary battery JPA,H10-27609 Secondary battery with nonaqueous
electrolyte JPA,H10-27626 Lithium secondary battery JPA,H10-27627 Lithium secondary battery JPA,2001-243952 Lithium secondary battery JPA,2001-210324 Lithium secondary battery
JP: Japan patent number, JPA: Japan patent publication number, US: United State patent number
121
References Audretsch, D. B., Lehmann, E.E. (2005). “Does the knowledge spillover theory of
entrepreneurship” hold for regions ?”, Research Policy, 34, pp. 1191-1201. Beneito, P. (2006). “The innovation performance of in-house and contracted R&D in
terms of patents and utility models”, Research policy, 35, pp. 502-517. Bernstein, J.I., Nadiri, M.I. (1988). “Interindustry R&D spillovers: rates of return, and
production in high-tech industries”, The American Economic Review, 78 (2), pp. 9–434.
Bernstein, J.I., Nadiri, M.I. (1989). “Research and development and intra-industry spillovers: an empirical application of dynamic duality”, Review of Economic Studies, 56, pp. 249–269.
Blind, K., Cremers, K., Mueller, E. (2009). “The influence of strategic patenting on companies’ patent portfolios”, Research Policy, pp428-436.
Brown, J., Duguid, P. (1991). “Organizational learning and communities of practice: toward a unified view of working, learning, and innovation”, Organization Science, 2, pp. 40-57.
Calabrese, T., Baum, Joel A.C., Silverman, B.S. (2000). “Canadian Biotechnology Start-Ups, 1991-1997: The Role of Incumbents’ Patents and Strategic Alliances in Controlling Competition”, Social Science Research, 29, pp. 503-534.
Cook, S.D.N., Brown, J.S. (1999). “Bridging epistemologies: the generative dance between organizational knowledge and organizational knowing”. Organization Science, 10 (4), pp. 381–400.
Davenport, T, H., Pruask, L. (1998). “Working Knowledge”, Harvard business school press, Boston.
Erden, Z., von Krogh, G., Nonaka, I. (2008). “The quality of group tacit knowledge”, Journal of Strategic Information Systems, 17, pp. 4-18.
Fuller, S. (2001). “Knowledge Management Foundations”, Butterworht Heinemann, London.
Gann Xu, G. (2009). “Information for corporate IP management”, World Patent Information, pp.149-156.
Goto, A., Suzuki, K. (1989). “R&D Capital, rate of return on R&D investment and spillover of R&D in Japanese manufacturing industries”, Review of Economics and Statistics, 71 (4), pp. 555–564.
Gourlay, S.N. (2004). “Knowing as semiosis: steps towards a reconceptualization of tacit knowledge”, Organizations as Knowledge Systems, Palgrave Macmillan,
122
London. Grant, R. (1996a). “Toward a knowledge-based theory of the firm”, Strategic
Management Journal, 17, pp. 109-122. Grant, R. (1996b). “Prospering in dynamically competitive environments: organizational
capability as knowledge integration”, Organization Science, 7 (4), pp. 375-387. Grant, R. (1997). “The-knowledge-based view of the firm: implications for management
practice”, Long Range Planning, 30, pp. 450-454. Grant, R., Baden-Fuller, C. (2004). “A knowledge accessing theory of strategic alliance”,
Journal of Management Studies, 41 (1), pp. 61-84. Griliches, Z., Lichtenberg, F. (1984). “Inter-industry technology flows and productivity
growth: a reexamination”, Review of Economics and Statistics, 66 (2), pp. 324–329.
Griliches, Z. (1990), “Patent Statistics as Economic Indicators: A survey”, Journal of Economic Literature, 28, p.1661.
Hall, R. (1992). “The strategic analysis of intangible resources”, Strategic Management Journal, 13, pp. 135-144.
Jaffe, A.B. (1986). “Technological opportunity and spillovers of R&D: evidence from firms patents, profits and market value”, American Economic Review, 76 (5), pp. 984–1001.
Japan Patent Office (2010). “Survey on technological trends in patent applications (fiscal year 2009): Lithium Ion Battery”, Japan Patent Office, Tokyo.
Japanese government, “The second science and technology basic plan”, 2001. Japanese government, “The third science and technology basic plan”, 2006. Kelly, D. J., Nakosteen, R. A. (2005). “Technology resources, alliances, and sustained
growth in new, technology based-firms”, IEEE Transactions on Engineering Management, 52 (3), pp. 292-300.
Kwang, I.H., Watanabe, C. (2001). “Unintentional technology spillover between two sectors: kinetic approach”, Technovation, 21, pp. 227–235.
Leidner, D.E. (2000). “Knowledge Management and Knowledge Management Systems”, Journal of Strategic Information Systems Special Issue, 9 (2–3), pp. 101–261.
Leonard-Barton, D. (1992). “Core capabilities and core rigidities: a paradox in managing new product development”, Strategic Management Journal, 13, pp.111-125.
Leonard-Barton, D. (1995). “Wellsprings of Knowledge”, Harvard business school press, Boston.
Lichtenthaler, U. (2009). “The role of corporate technology strategy and patent portfolios in low-, medium- and high-technology firms”, Research Policy,
123
pp.559-569. Makimura, Y., Ohzuku, T. (2003). “Lithium insertion material of LiNi1/2Mn1/2O2 for
advanced lithium-ion batteries”, Journal of Power Sources, 119-221, p.156. Millson, M.R., Wielmon, D. (2006). “Driving new product success in the electrical
equipment manufacturing industry”, Technovation, 26, pp. 1268–1286. Nakagawa, M., Watanabe, C. (2007). “Moving beyond organizational inertia as a
survival strategy for resources-based industry in a service-oriented economy: lessons from cross-sector technology spillover in the nonferrous metal industry”, Journal of Service Research, 7(1), pp. 7-35.
Nakagawa, M., Watanabe, C., Griffy-Brown, C. (2009). “Changes in the technology spillover structure due to economic paradigm shifts: A driver of the economic revival in Japan’s materials industry beyond the year 2000”, Technovation, 29, pp. 5-22.
Nakanishi, Y. (2002). “Empirical evidence of inter-industry R&D spillover in Japan”, Journal of Economic Research, 7, pp. 91–94.
Nieto, M., Quevedo, P. (2005). “Absorptive capacity, technological opportunity, knowledge spillovers, and innovative effort”, Technovation, 25, pp. 1141–1157.
Noh, J., Lee, K., Kim, J., Lee, J., Kim, S. (2000). “A case-based reasoning approach to cognitive map-driven tacit knowledge management”. Expert Systems With Applications, 19, pp. 249–259.
Nonaka, I. (1990). “Managing innovation as a knowledge-creation process: a new model for a knowledge-creating organization”, Paper presented at New York University, Stern School of Business, International Business Colloquium.
Nonaka, I. (1991). “The knowledge-creating company”, Harvard Business Review, 69 (6), pp. 96-104.
Nonaka, I. (1994). “A dynamic theory of organizational knowledge creation”, Organization Science, 5 (1), pp. 14-37.
Nonaka, I., von Krogh, G., Voepel, S. (2006). “Organizational knowledge creation theory: evolutionary paths and future advances”, Organization studies, 27 (8), pp. 1179-1208.
Ohmura, A., Ouchi, N., Morisaki, S., Watanabe, C. (2003). “Functionality development as a survival strategy for fine ceramics”, Technovation, 23 (10), pp. 833–842.
Ohmura, A., Watanabe, C. (2005). “Inside the black box of cross-functional spillover: a lesson from the functionality development of fine ceramics”, Journal of Advances in Management Research, 2 (2), pp. 7–23.
Ohmura, A., Watanabe, C. (2006). “Cross-products technology spillover in inducing a
124
self-propagating dynamism for the shift to a service oriented economy: lessons from high-performance fine ceramics”, Journal of Services Research, 6 (2), pp. 145–159.
Ohzuku, T., Brodd, R. (2007). “An overview of positive-electrode materials for advanced lithium-ion batteries”, Journal of Power sources, 174, p.449.
Ohzuku, T., Ueda, A., Yamamoto, N., Iwakoshi, Y. (1995), “Factor affecting the capacity retention of lithium-ion cells”, Journal of Power Sources, 54, p.99.
Ornaghi, C. (2006). “Spillovers in product and process innovation: evidence from manufacturing firms”, International Journal of Industrial Organization, 24, pp. 349-380.
Sanders, D.A. (2004). “Knowledge management and potentially useful new hyperdidactic structures”, Defense & Security Analysis, 20 (3), pp. 229–243.
Sasaki, T. (2004). “Patent strategy –Maturity of technology and patent strategic pattern”, Managing Intellectual Property, Chuokeizai-sha, Inc, pp41-64.
Shibata, Y., Saiki, T. (2009), “The dynamics of Knowledge Spillover for functionality development in Japanese Acoustic Equipment”. [CD-ROM]. VIPSI-Amalfi, VIPSI 2009 conference.
Shibata, Y., Takahashi, T., Saiki, T. (2010). “Intellectual property and Information on Intellectual property rights management of Japanese pharmaceutical companies in M&A”. [CD-ROM]. PICMET’10 conference.
Shinozaki, A. (2002). “Destruction and Construction in Panasonic”, Jitsugyo no Nihon Sha, Ltd.
Stewart, T. (1997). “Intellectual Capital: The New Wealth of Organization”, Doubleday, New York.
Tanabe, K., Watanabe, C. (2005). “Soft policy instruments for inducing industrial innovation in a service oriented economy: a comparative analysis of the vision system and university system”, Journal of services research, 5 (1), pp. 123-154.
Thumm, N. (2001). “Management of Intellectual Property Rights in European Biotechnology Firms”, Technological Forecasting and Social Change, 67, pp.259-272.
Tsoukas, H. (2003). “Do we really understand tacit knowledge?”, Handbook of Organizational Learning and Knowledge Management. Blackwell, Malden, NJ, pp. 410–427.
von Krogh, G. (2009). “Individualist and collectivist perspectives on knowledge in organizations: Implications for information systems research”, Journal of Strategic Information Systems, 18, pp. 119-129.
125
Watanabe, C., Ane, B.K. (2003). “Co-evolution of manufacturing and service industry functions”, Journal of Services Research, 3 (1), pp. 110–118.
Watanabe, C., Takayama, M., Nagamatsu, A., Tagami, T. (2002). “Technology spillover as a complement for high-level R&D intensity in the pharmaceutical industry”, Technovation, 22 (4), pp. 245-258.
Watanabe, C., Tokumasu, S. (2003). “Optimal timing of R&D for effective utilization of potential resources in innovation”, Journal of Advances in Management Research, 1 (1), pp. 11–27.
Watanabe, C., Zhu, B., Griffy-Brown, C., Asgari, B. (2001). “Global technology spillover of and its impact on industry’s R&D strategies”, Technovation, 21, pp. 281-291.
Young, B., Hewitt-Dundas, N., Roper, S. (2008). “Intellectual Property management in publicly funded R&D centres-A comparison of university-based and company-based research centres”, Technovation, 28, pp.473-484.
Zarraga, C., Bonache, J. (2005). “The impact of team atmosphere on knowledge outcomes in self-managed teams”, Organization Studies, 26(5), pp. 661–681.
126
Chapter IV Trends in Diversification of Technologies:
Empirical Analysis of Lithium Ion Battery Industry in Japan
127
Abstract In this Chapter IV, we investigate trends in the diversification process of technologies
composing a Lithium Ion Battery (LIB) by demonstrating the multiple regression analysis. The number of patent applications of LIB filed in Japan patent office is utilized as a proxy to evaluate the development of technologies. We group LIB into two groups by using the International Patent Classification (IPC), ‘simple technology’ and ‘complex technology’. Simple technology is the technology which belongs to one technology segment, and complex technology is the technology which belongs to two or more technology segments.
In conclusion, it was revealed that technologies relating to electrode technology have diversified from simple technology to complex technology in the LIB innovation process. Especially, complex technology relating to electrode technology has increased after the practical use of LIB started, and it played a significant role in leading the LIB innovation process.
Keywords Innovation; International Patent Classification; Lithium Ion Battery; Patent
128
4.1 Introduction
It is important for firms to continuously develop inventions and technologies, and produce new valuable products which can show their innovation capability. The R&D efforts of firms leading the innovation are essential for firm’s growth and the growth of society itself.
As suggested in Chapter III, changes of technology spillover structure played a significant role in driving the development of material technology in the LIB innovation process. In this process, simple materials and composite materials followed the same growth trajectory. It is inter-technology spillover; diffusion of technologies from material technology to process, component, and product technologies. 4.1.1 Knowledge spillover
A lot of papers have been published discussing the usefulness of knowledge spillover as one of the foremost factors in encouraging the development of technologies. As Griliches (1979) mentioned, the level of productivity achieved by one firm or industry depends on not only its own R&D efforts but also general knowledge spilled over from other firms and industries. In previous studies, patent data has been recognized as a useful indicator in evaluating the technological innovation quantitatively (Griliches, 1990). In many papers, relations between innovation and knowledge spillover are discussed by using patent data.
Many previous papers have mainly discussed the knowledge spillover at the level of
countries, industries, or firms. For instance, how the spillover effect among different foreign countries affects domestic productivity has been discussed (Branstetter, 2001; Eaton and Kortum, 1999; Keller, 2002). The importance of knowledge spillover between industries has also been discussed (Scherer, 1984; Griliches and Lichtenberg, 1984; Goto and Suzuki, 1989). The importance to control the industrial characteristics has been reported so far (Bernstein and Nadiri, 1988; Bernstein, 1997; Terero, 2001).
We find three main points of view in previous papers in relations to knowledge
spillover. The first point is technological affinity. It is comparatively easy to obtain knowledge from other firms which are working in a similar technology field, because it
129
is assumed that these firms possess similar technological facilities and experiences. Companies working in a similar technology field are able to raise R&D productivity by referring to other firms’ R&D result (Jaffe, 1986; Lee, 2006). The second point concerns geographical distance between firms. Geographical distances relate to the ease of communication with other firms. Companies, which are located in a region close to one another, can easily make contact, so that they have the advantage of prompt information exchanges (Jaffe et al., 1993; Tappeiner et al., 2008). The third feature is cultural differences. It is relatively easy for firms to cooperate with another firm which shares similar cultures concerning management principles, business structure, and language. A mutual understanding of culture could be a key for promotion of knowledge spillover. In this study, we focus on the technological affinity in analyzing knowledge spillover among technologies composing a product (Shibata and Saiki, 2010).
Geroski (1995) reported that knowledge spillover effect depends on the maturity of
technologies. Therefore, industrial characteristics and technological characteristics should be taken into consideration when knowledge spillover is discussed. Recent papers have focused on this point and discussed the existence of technology spillover.
Some papers suggested that technology spillover played a significant role in leading
the development of material technology. For instance, the effect of technology spillover in fine ceramics industry was analyzed (Ohmura et al., 2003, 2006). The effect of technology spillover in the nonferrous metal industry was also analyzed (Nakagawa et al., 2007, 2008, 2009). We also analyzed the technology spillover effect in the acoustic industry, and suggested that the development of material technology is a key to improve the functionality of products (Shibata and Saiki, 2009). Thus, on the aspect of technology spillover, the importance of how to innovate materials have been discussed so far.
In this chapter, the back ground of the LIB industry is introduced in (4.2). Hypothetical view is described in (4.3). The trends in diversification of technologies composing a LIB are analyzed in (4.4). The results are discussed in (4.5). Conclusion in this chapter is remarked in (4.6).
130
4.1.2 Diversification of technology in acoustic industry In previous work, we focused on the innovation process in the acoustic industry and
analyzed the role of technology spillover based on the empirical observation of patent statistics. Especially, speaker is the main electric device in the acoustic industry. We defined ‘basic technology’, technology which demonstrates the fundamental physical laws as a core technology, and ‘complementary technology’, technology which facilitates the work of basic technology, respectively. The International Patent Classification (IPC) was used to group technologies. In the case of speaker technology, transducers (H04R9, H04R17) were defined as basic technology, because dynamo-electrical system was based on the Fleming’s rules. Additionally, ‘Component’ (H04R1), ‘Circuit’ (H04R3), and ‘Diaphragm’ (H04R7) were defined as complementary technology. Figure 4-1 shows the relations among these IPC, and details are described in Appendix A.
In speaker technology, it could be said that development of material technology played an important role in leading the innovation process. In all periods, main demands from markets were miniaturization and improving the frequency characteristics of a speaker; however, these demands were structurally contradicted. It is because large panel was required to create good sounds with large volume in a diaphragm. The key to satisfy both of these contradicted demands was the material characteristics used in a diaphragm. Thus, the development of material technology is a key factor to improve the functionality of a speaker in the acoustic industry.
Based on the analysis of patent statistics, it was revealed that there were two stages
in the innovation process in the speaker industry. Technology spillover mainly occurred between basic technology and complementary technology, but structure of technology spillover has changed in the innovation process. First, technology spillover occurred between basic technology and ‘Diaphragm’, and next technology spillover occurred between ‘Diaphragm’ and ‘Component’. It is considered that the development of materials used in a diaphragm was a key to change the structure of technology spillover in the innovation process. First, knowledge of fundamental physical laws spilled over from basic technology to ‘Diaphragm’ to encourage the development of materials used in a diaphragm. Second, knowledge of materials used in a diaphragm spilled over to ‘Component’ to facilitate the effective work of new materials. As a result, it can be said that the development of materials was a key to encourage the technology spillover in the innovation process (Shibata and Saiki, 2009).
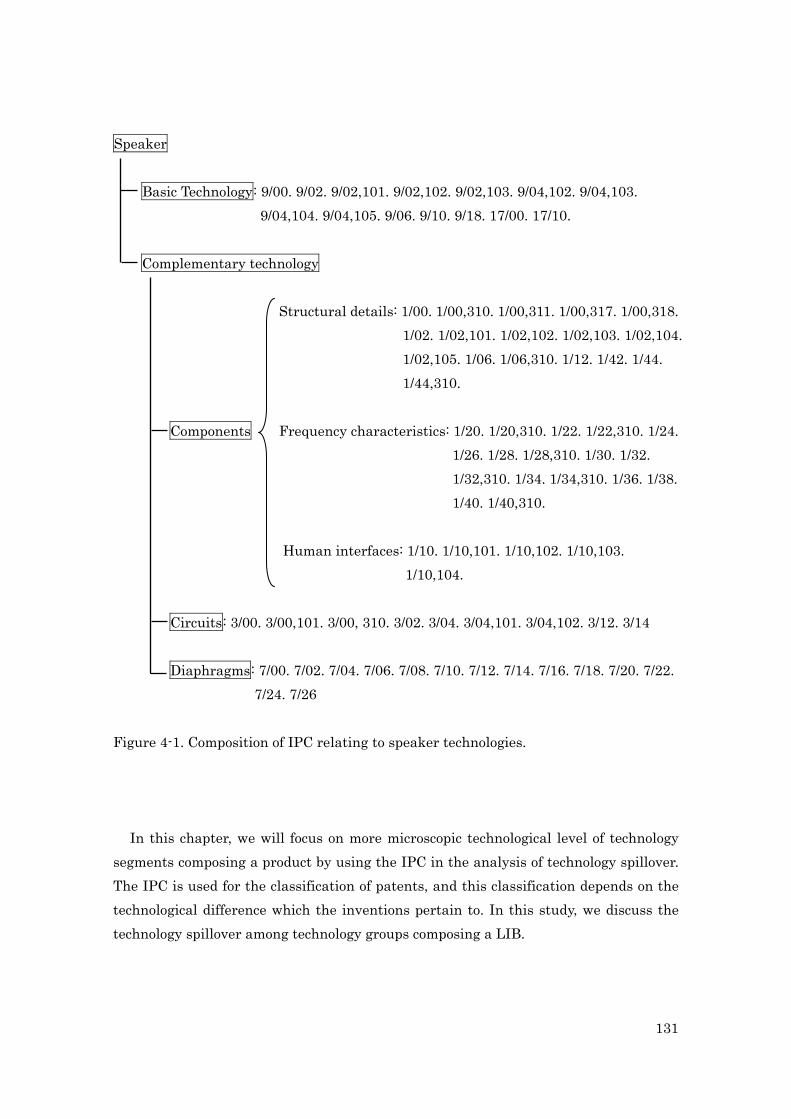
131
Speaker
Basic Technology: 9/00. 9/02. 9/02,101. 9/02,102. 9/02,103. 9/04,102. 9/04,103. 9/04,104. 9/04,105. 9/06. 9/10. 9/18. 17/00. 17/10.
Complementary technology
Structural details: 1/00. 1/00,310. 1/00,311. 1/00,317. 1/00,318.
1/02. 1/02,101. 1/02,102. 1/02,103. 1/02,104. 1/02,105. 1/06. 1/06,310. 1/12. 1/42. 1/44. 1/44,310.
Components Frequency characteristics: 1/20. 1/20,310. 1/22. 1/22,310. 1/24.
1/26. 1/28. 1/28,310. 1/30. 1/32. 1/32,310. 1/34. 1/34,310. 1/36. 1/38. 1/40. 1/40,310.
Human interfaces: 1/10. 1/10,101. 1/10,102. 1/10,103. 1/10,104.
Circuits: 3/00. 3/00,101. 3/00, 310. 3/02. 3/04. 3/04,101. 3/04,102. 3/12. 3/14
Diaphragms: 7/00. 7/02. 7/04. 7/06. 7/08. 7/10. 7/12. 7/14. 7/16. 7/18. 7/20. 7/22.
7/24. 7/26
Figure 4-1. Composition of IPC relating to speaker technologies.
In this chapter, we will focus on more microscopic technological level of technology segments composing a product by using the IPC in the analysis of technology spillover. The IPC is used for the classification of patents, and this classification depends on the technological difference which the inventions pertain to. In this study, we discuss the technology spillover among technology groups composing a LIB.
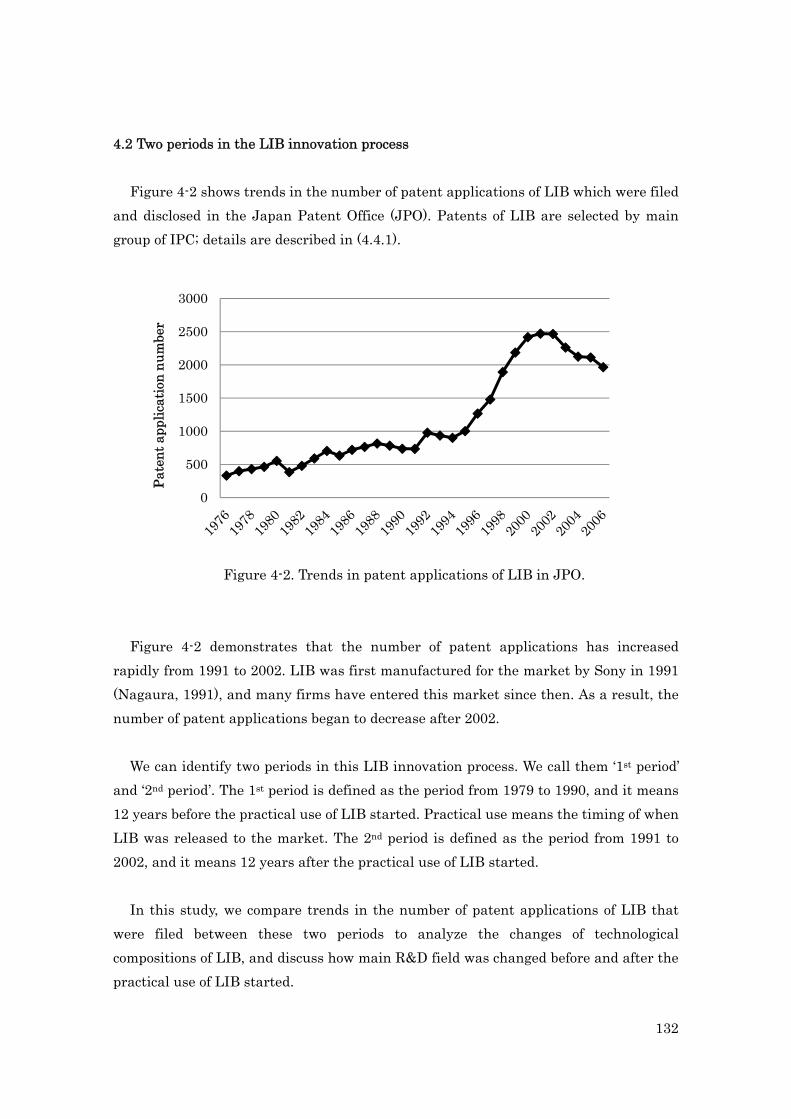
132
4.2 Two periods in the LIB innovation process Figure 4-2 shows trends in the number of patent applications of LIB which were filed
and disclosed in the Japan Patent Office (JPO). Patents of LIB are selected by main group of IPC; details are described in (4.4.1).
Figure 4-2. Trends in patent applications of LIB in JPO.
Figure 4-2 demonstrates that the number of patent applications has increased rapidly from 1991 to 2002. LIB was first manufactured for the market by Sony in 1991 (Nagaura, 1991), and many firms have entered this market since then. As a result, the number of patent applications began to decrease after 2002.
We can identify two periods in this LIB innovation process. We call them ‘1st period’
and ‘2nd period’. The 1st period is defined as the period from 1979 to 1990, and it means 12 years before the practical use of LIB started. Practical use means the timing of when LIB was released to the market. The 2nd period is defined as the period from 1991 to 2002, and it means 12 years after the practical use of LIB started.
In this study, we compare trends in the number of patent applications of LIB that
were filed between these two periods to analyze the changes of technological compositions of LIB, and discuss how main R&D field was changed before and after the practical use of LIB started.
0
500
1000
1500
2000
2500
3000
Pate
nt a
pplic
atio
n nu
mbe
r
133
4.3 Hypothetical view In the Chapter I, it is suggested that new materials better than lithium-cobalt oxide
was developed in the 1990s in order to satisfy requirements from market. Although properties of manganese and nickel were different from those of cobalt, the development of composite materials was requested to satisfy needs from market. Therefore, composite materials such as lithium-manganese-cobalt oxide were invented as new materials (Makimura et al., 2003).
In the Chapter III, it was revealed that technology spillover structure changed from
intra-technology to inter-technology spillover. Technology spillover occurred from material technology to process, component, and product technologies. Technological functionality of LIB was innovated by the development of material technology, and then technology spillover played a significant role in the diffusion of technology.
In order to lead the LIB innovation process, ‘Electrode’ made of new materials has to
be diffused to constitutional technologies like ‘Exterior’ and ‘Structure’. Technology spillover has to occur between ‘Electrode’ and ‘Exterior’, or between ‘Electrode’ and ‘Structure’, to obtain the optimal structural contents. It is because the metal constituents with different properties require an applicable LIB constitution suitable for their properties; for instance, new materials used in an electrode need applicable LIB constitutions like size, weight, and shape to match its characteristics.
It could be considered that the collaboration of two or more technologies involving
‘Electrode’ is required in the 2nd period; for instance, ‘Exterior and Electrode’, ‘Structure and Electrode’, ‘Exterior and Structure and Electrode’. These technologies are classified as complex technology. The collaborations among technologies would be inspired in the LIB innovation process, and then technologies have diversified with the increase of complex technology. It can be postulated that the changes from simple technology to complex technology have been caused by the development of composite materials for electrode technology, and then technology spillover contributed to diffuse the material technology. Therefore, the hypothesis can be expressed as follows.
[Hypothesis] Technology leading the LIB innovation process was replaced from simple technology to complex technology.
134
4.4 Analysis of trends in diversification of technologies 4.4.1 Methodology to classify technologies
In previous works, quite strong relationships between R&D and the number of
patent applications have been suggested (Griliches et al., 1984), and so that patent statistics could be a useful economic indicator in illuminating the process of innovation.
In this study, we introduce the concept of ‘Innovation Process’ and ‘Technology
Knowledge’ as proxy variables like follows by using the number of patent applications as an indicator. ‘Innovation Process’ indicates the total number of patent applications regarding LIB. ‘Technology Knowledge’ is classified into simple technology and complex technology, and these indicates that the number of patent applications given the specific IPC of simple technology or complex technology.
[Innovation Process] The total number of patent applications relating to LIB. [Technology Knowledge] The number of patent applications relating to either simple technology or complex technology defined by IPC.
When patents are filed to obtain rights for inventions, patent office gives IPC depending on the technological categorization of patents. It is considered that the number of patents defined by IPC could be a proxy to evaluate the volume of technological ideas disclosed in patents. Therefore, we can discuss which kinds of ‘Technology Knowledge’ most contribute to encourage ‘Innovation Process’ by performing the empirical analysis.
As suggested in Chapter II, it can be conceptualized that batteries were composed of three technology segments; ‘Exterior’ (the shape or the appearance of a battery), ‘Structure’ (the structural details of a battery), and ‘Electrode’ (the details of a cathode and an anode to cause a chemical reaction to generate energy). According to the IPC, batteries are classified into [H01M]. We select technologies regarding LIB from technologies which are classified as this [H01M], and group technologies by IPC into three simple technologies and four complex technologies. Finally, technologies can be grouped into seven technology groups like follows.
135
[Simple technology] We classify technologies composing a LIB into three technology segments; ‘Exterior’, ‘Structure’, and ‘Electrode’. Technology group which belongs to only one technology segment is defined as ‘simple technology’. These technology groups are defined like follows by the sub group level of IPC.
i) Exterior: We classify technologies which belong to only (H01M2) as ‘Exterior’.
We use the following IPC groups to define inventions which belong to ‘Exterior’. H01M2/00, H01M2/02, H01M2/04, H01M2/06, H01M2/08, H01M2/14, H01M2/16, H01M2/18
ii) Structure: We classify technologies which belong to only (H01M10) as ‘Structure’.
We use the following IPC groups to define inventions which belong to ‘Structure’. H01M10/00, H01M10/36, H01M10/40
iii) Electrode: We classify technologies which belong to only (H01M4) as ‘Electrode’.
We use the following IPC groups to define inventions which belong to ‘Electrode’. H01M4/00, H01M4/02, H01M4/04, H01M4/36, H01M4/38, H01M4/48, H01M4/50, H01M4/52, H01M4/58, H01M4/62, H01M4/64, H01M4/66
[Complex technology] We classify technologies composing a LIB into three technology segments; ‘Exterior’, ‘Structure’, and ‘Electrode’. Technology group which belongs to two or more technology segments is defined as ‘complex technology’, and these are four kinds of combinations of technology segments; ‘Exterior and Structure’, ‘Exterior and Electrode’, ‘Structure and Electrode’, ‘Exterior and Structure and Electrode’. These technology groups are defined by the combination of IPC of above simple technology.
In these seven technology groups, there are one simple technology and three complex technologies relating to electrode technology; ‘Electrode’, ‘Exterior and Electrode’, ‘Structure and Electrode’, and ‘Exterior and Structure and Electrode’. In order to analyze trends in the diversification of technologies composing a LIB, we focus on the relations between these simple technology and complex technology relating to electrode technology.
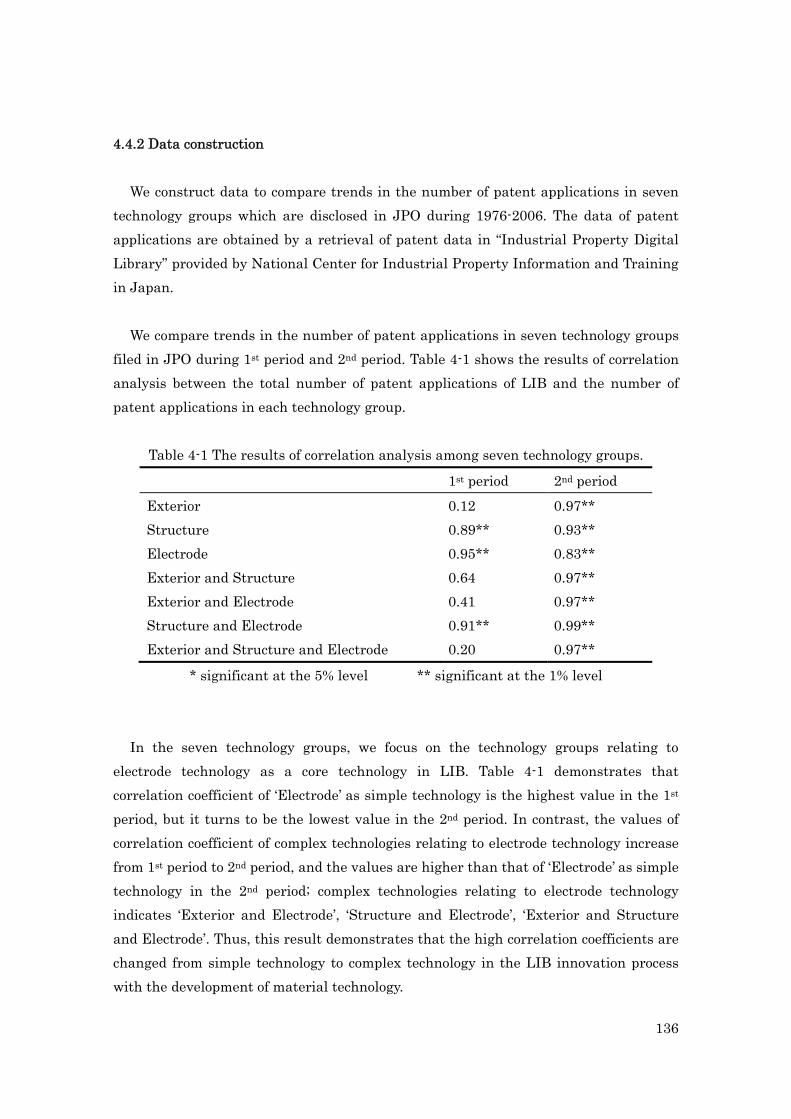
136
4.4.2 Data construction We construct data to compare trends in the number of patent applications in seven
technology groups which are disclosed in JPO during 1976-2006. The data of patent applications are obtained by a retrieval of patent data in “Industrial Property Digital Library” provided by National Center for Industrial Property Information and Training in Japan.
We compare trends in the number of patent applications in seven technology groups filed in JPO during 1st period and 2nd period. Table 4-1 shows the results of correlation analysis between the total number of patent applications of LIB and the number of patent applications in each technology group.
Table 4-1 The results of correlation analysis among seven technology groups.
1st period 2nd period Exterior 0.12 0.97** Structure 0.89** 0.93** Electrode 0.95** 0.83** Exterior and Structure 0.64 0.97** Exterior and Electrode 0.41 0.97** Structure and Electrode 0.91** 0.99** Exterior and Structure and Electrode 0.20 0.97**
* significant at the 5% level ** significant at the 1% level
In the seven technology groups, we focus on the technology groups relating to electrode technology as a core technology in LIB. Table 4-1 demonstrates that correlation coefficient of ‘Electrode’ as simple technology is the highest value in the 1st period, but it turns to be the lowest value in the 2nd period. In contrast, the values of correlation coefficient of complex technologies relating to electrode technology increase from 1st period to 2nd period, and the values are higher than that of ‘Electrode’ as simple technology in the 2nd period; complex technologies relating to electrode technology indicates ‘Exterior and Electrode’, ‘Structure and Electrode’, ‘Exterior and Structure and Electrode’. Thus, this result demonstrates that the high correlation coefficients are changed from simple technology to complex technology in the LIB innovation process with the development of material technology.
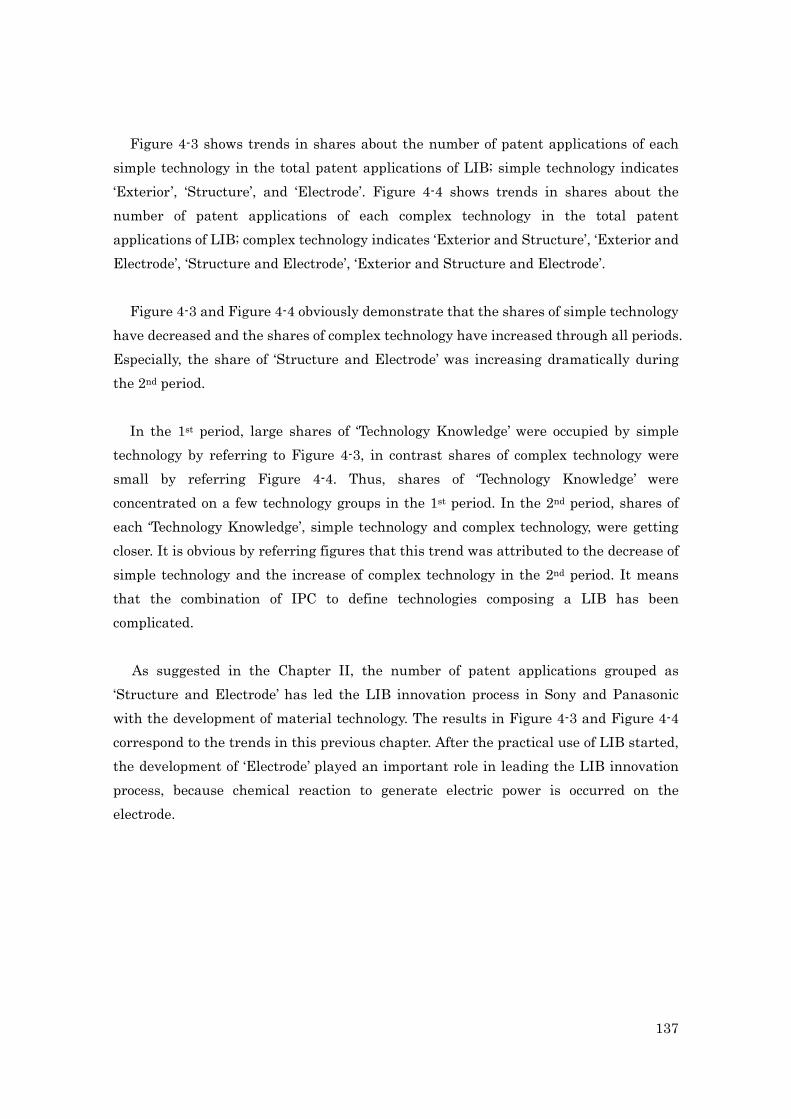
137
Figure 4-3 shows trends in shares about the number of patent applications of each simple technology in the total patent applications of LIB; simple technology indicates ‘Exterior’, ‘Structure’, and ‘Electrode’. Figure 4-4 shows trends in shares about the number of patent applications of each complex technology in the total patent applications of LIB; complex technology indicates ‘Exterior and Structure’, ‘Exterior and Electrode’, ‘Structure and Electrode’, ‘Exterior and Structure and Electrode’.
Figure 4-3 and Figure 4-4 obviously demonstrate that the shares of simple technology have decreased and the shares of complex technology have increased through all periods. Especially, the share of ‘Structure and Electrode’ was increasing dramatically during the 2nd period.
In the 1st period, large shares of ‘Technology Knowledge’ were occupied by simple technology by referring to Figure 4-3, in contrast shares of complex technology were small by referring Figure 4-4. Thus, shares of ‘Technology Knowledge’ were concentrated on a few technology groups in the 1st period. In the 2nd period, shares of each ‘Technology Knowledge’, simple technology and complex technology, were getting closer. It is obvious by referring figures that this trend was attributed to the decrease of simple technology and the increase of complex technology in the 2nd period. It means that the combination of IPC to define technologies composing a LIB has been complicated.
As suggested in the Chapter II, the number of patent applications grouped as ‘Structure and Electrode’ has led the LIB innovation process in Sony and Panasonic with the development of material technology. The results in Figure 4-3 and Figure 4-4 correspond to the trends in this previous chapter. After the practical use of LIB started, the development of ‘Electrode’ played an important role in leading the LIB innovation process, because chemical reaction to generate electric power is occurred on the electrode.
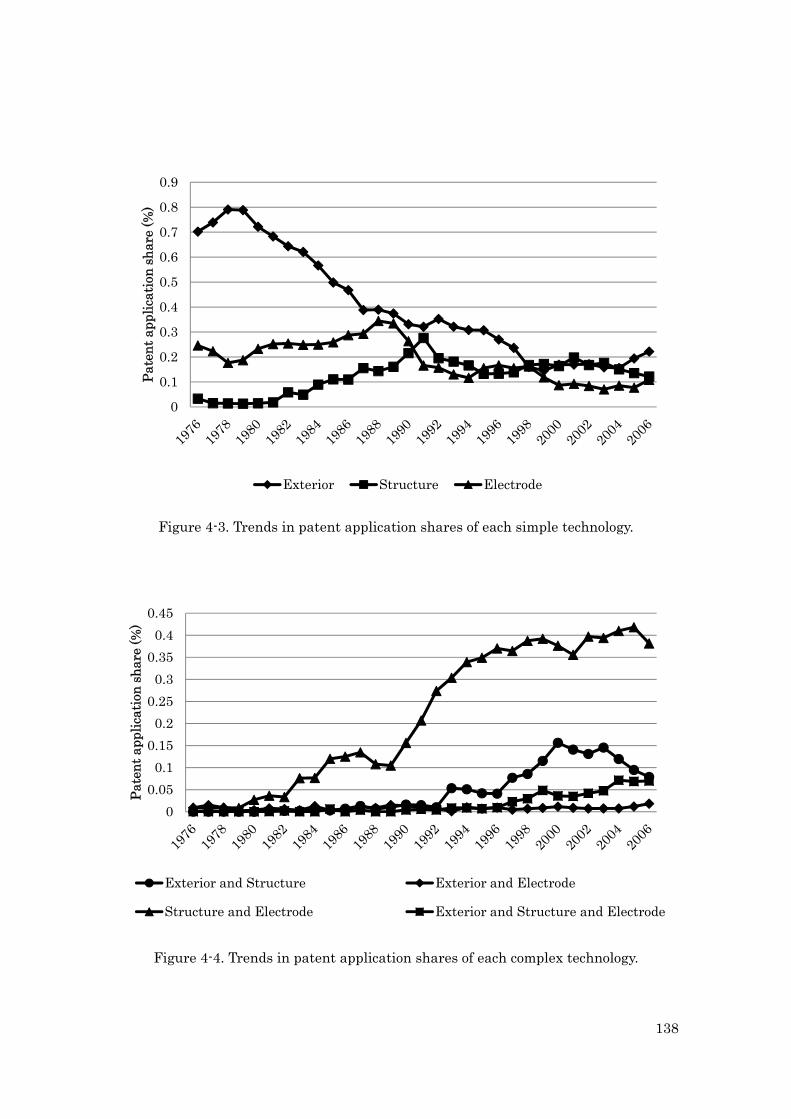
138
Figure 4-3. Trends in patent application shares of each simple technology.
Figure 4-4. Trends in patent application shares of each complex technology.
0
0.1
0.2
0.3
0.4
0.5
0.6
0.7
0.8
0.9
Pate
nt a
pplic
atio
n sh
are
(%)
Exterior Structure Electrode
00.05
0.10.15
0.20.25
0.30.35
0.40.45
Pate
nt a
pplic
atio
n sh
are
(%)
Exterior and Structure Exterior and Electrode
Structure and Electrode Exterior and Structure and Electrode
139
4.4.3 Numerical model to analyze diversification of technologies
To analyze the diversification process of technologies composing a LIB from simple technology to complex technology, we perform the multiple regression analysis. As previously noted, complex technology is defined as the combination of two or more simple technologies. It is considered that technology spillover occurred among simple technologies, and it inspired the growth of complex technology.
In order to analyze the contributions of simple technology and complex technology for the innovation during the 1st period and the 2nd period, the relations between ‘Innovation Process’ of LIB and ‘Technology Knowledge’ of simple technology and complex technology can be described as in the equation (4-1).
P = F (Tsimp,Tcomp)
(4-1) where ‘P’ indicates ‘Innovation Process’, and it is measured by the total number of
patent applications relating to LIB. ‘Tsimp’ indicates ‘Technology Knowledge’ of simple technology, and it is measured by the number of patent applications given IPC of one technology segment. ‘Tcomp’ indicates ‘Technology Knowledge’ of complex technology, and it is measured by the number of patent applications given IPC of two or more technology segments.
In order to analyze the contribution of technology groups relating to electrode technology for the innovation, we select simple technology and complex technology relating to electrode technology as a core technology in LIB. (4-1) can be rewritten as the equation (4-2).
P = F (T’simp,T’comp)
(4-2) where ‘T’simp’ indicates ‘Technology Knowledge’ of simple technology relating to
electrode technology, and it is measured by the number of patent applications given IPC of ‘Electrode’. ‘T’comp’ indicates ‘Technology Knowledge’ of complex technology relating to electrode technology, and it is measured by the number of patent applications given IPC of ‘Exterior and Electrode’, or ‘Structure and Electrode’, or ‘Exterior and Structure and Electrode’.
140
In the equation (4-2), difference of the 1st period and the 2nd period can be distinguished by substituting a dummy variable. Finally, (4-2) can be rewritten as linear function like equation (4-3).
lnP = A+(1-D)(γs1lnT’simp(1)+ γc1lnT’comp(1))+D(γs2lnT’simp(2)+ γc2lnT’comp(2))
(4-3) where, ‘A’ indicates a constant value. ‘D’ indicates a dummy variable; D=0 in the 1st
period, and D=1 in the 2nd period. ‘T’simp(1)’ and ‘T’comp(1)’ indicates ‘Technology Knowledge’ of simple technology and complex technology relating to electrode technology in the 1st period, respectively. ‘T’simp(2)’ and ‘T’comp(2)’ indicates ‘Technology Knowledge’ of simple technology and complex technology relating to electrode technology in the 2nd period, respectively. ‘γs1’, ‘γc1’, ‘γs2’ and ‘γc2’ are coefficient values, respectively.
By performing the multiple regression analysis in (4-3), we can analyze which factors, simple technology or complex technology, contributed to lead the LIB innovation process in each period.
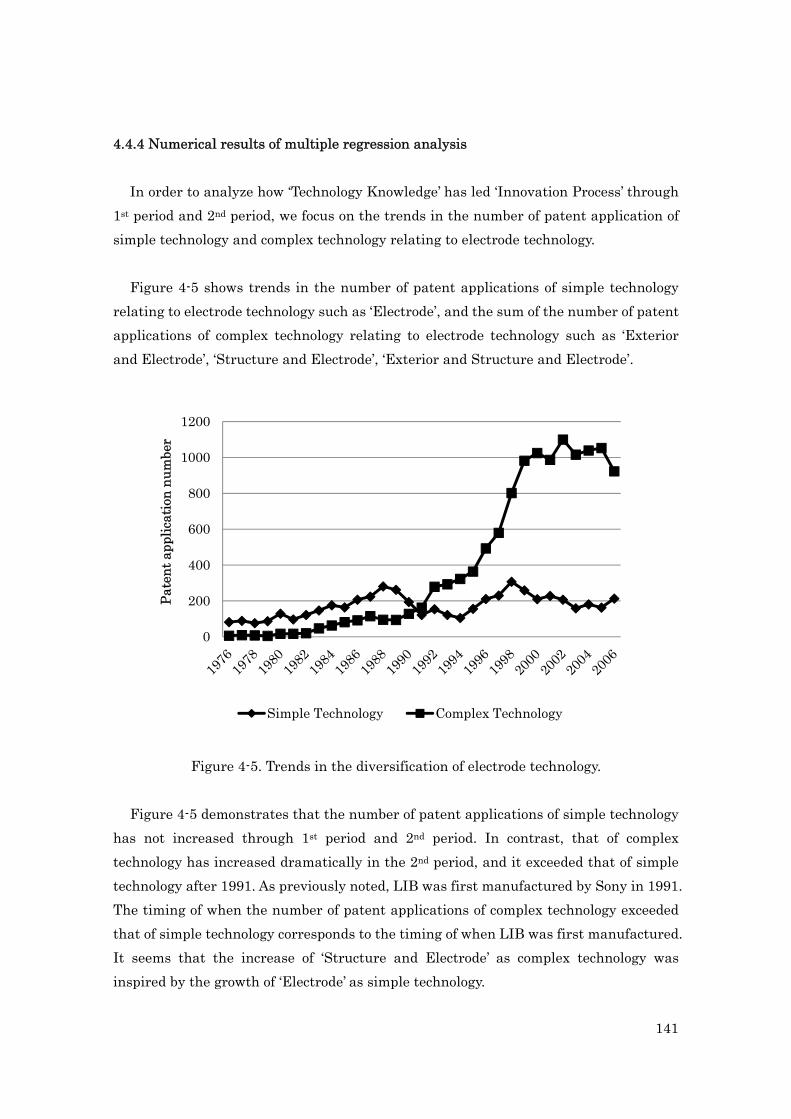
141
4.4.4 Numerical results of multiple regression analysis In order to analyze how ‘Technology Knowledge’ has led ‘Innovation Process’ through
1st period and 2nd period, we focus on the trends in the number of patent application of simple technology and complex technology relating to electrode technology.
Figure 4-5 shows trends in the number of patent applications of simple technology
relating to electrode technology such as ‘Electrode’, and the sum of the number of patent applications of complex technology relating to electrode technology such as ‘Exterior and Electrode’, ‘Structure and Electrode’, ‘Exterior and Structure and Electrode’.
Figure 4-5. Trends in the diversification of electrode technology.
Figure 4-5 demonstrates that the number of patent applications of simple technology has not increased through 1st period and 2nd period. In contrast, that of complex technology has increased dramatically in the 2nd period, and it exceeded that of simple technology after 1991. As previously noted, LIB was first manufactured by Sony in 1991. The timing of when the number of patent applications of complex technology exceeded that of simple technology corresponds to the timing of when LIB was first manufactured. It seems that the increase of ‘Structure and Electrode’ as complex technology was inspired by the growth of ‘Electrode’ as simple technology.
0
200
400
600
800
1000
1200
Pate
nt a
pplic
atio
n nu
mbe
r
Simple Technology Complex Technology
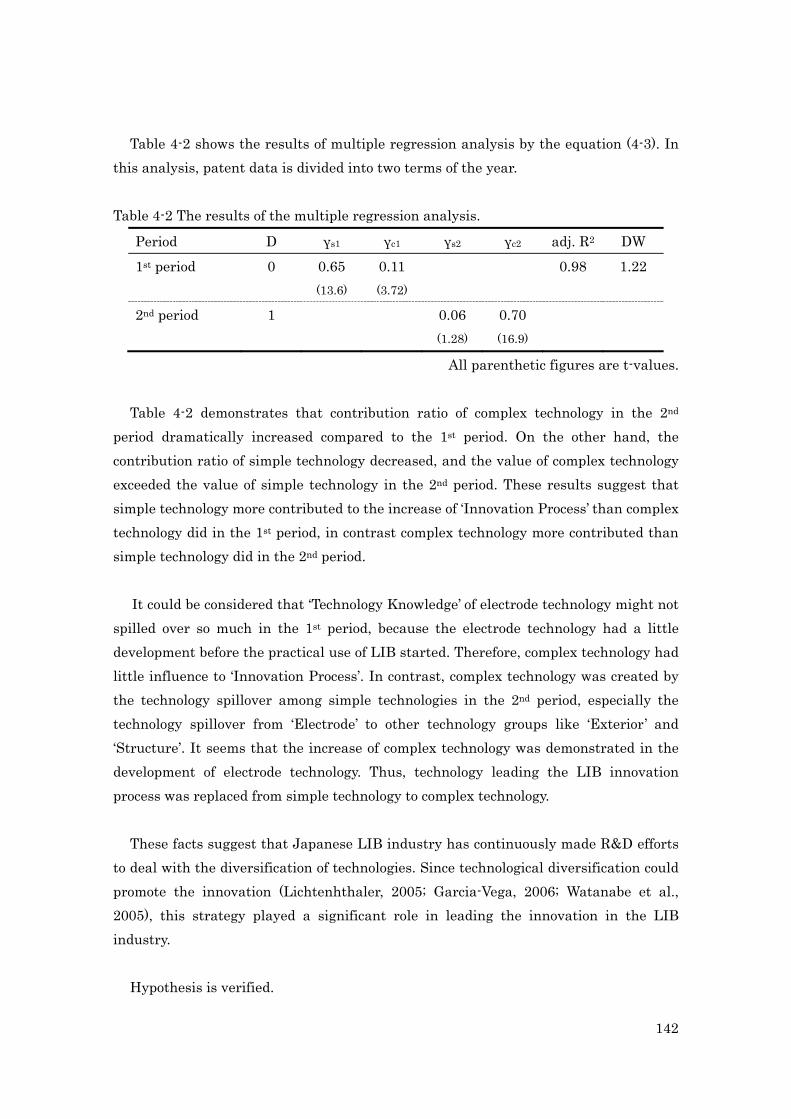
142
Table 4-2 shows the results of multiple regression analysis by the equation (4-3). In this analysis, patent data is divided into two terms of the year.
Table 4-2 The results of the multiple regression analysis.
Period D γs1 γc1 γs2 γc2 adj. R2 DW 1st period 0 0.65 0.11 0.98 1.22 (13.6) (3.72) 2nd period 1 0.06 0.70 (1.28) (16.9)
All parenthetic figures are t-values.
Table 4-2 demonstrates that contribution ratio of complex technology in the 2nd period dramatically increased compared to the 1st period. On the other hand, the contribution ratio of simple technology decreased, and the value of complex technology exceeded the value of simple technology in the 2nd period. These results suggest that simple technology more contributed to the increase of ‘Innovation Process’ than complex technology did in the 1st period, in contrast complex technology more contributed than simple technology did in the 2nd period.
It could be considered that ‘Technology Knowledge’ of electrode technology might not spilled over so much in the 1st period, because the electrode technology had a little development before the practical use of LIB started. Therefore, complex technology had little influence to ‘Innovation Process’. In contrast, complex technology was created by the technology spillover among simple technologies in the 2nd period, especially the technology spillover from ‘Electrode’ to other technology groups like ‘Exterior’ and ‘Structure’. It seems that the increase of complex technology was demonstrated in the development of electrode technology. Thus, technology leading the LIB innovation process was replaced from simple technology to complex technology.
These facts suggest that Japanese LIB industry has continuously made R&D efforts to deal with the diversification of technologies. Since technological diversification could promote the innovation (Lichtenhthaler, 2005; Garcia-Vega, 2006; Watanabe et al., 2005), this strategy played a significant role in leading the innovation in the LIB industry.
Hypothesis is verified.
143
4.5 Discussion In this chapter, we grouped technologies composing a LIB into simple technology and
complex technology by using the IPC, and analyzed the LIB innovation process based on patent data. Through this analysis, it was revealed that technology leading the LIB innovation process was replaced from simple technology to complex technology.
It was shown that the LIB innovation process was divided into two periods. In the 1st
period, before the practical use of LIB started, the number of patent applications was mainly concentrated on the ‘Electrode’ as simple technology. However, in the 2nd period, after the practical use of LIB started, that of complex technology has increased such as ‘Exterior and Electrode’, ‘Structure and Electrode’, ‘Exterior and Structure and Electrode’. It was revealed that the combination of IPC to define inventions has been complicated after the practical use of LIB started by the increase of complex technology through all periods.
In the Chapter III, we concluded that innovation process in the LIB industry was started from the new findings of material technology, and innovation was encouraged with the diversification of technologies. Technology spillover occurred from ‘Electrode’ to ‘Structure’ and ‘Exterior’, and it has led the growth of complex technology like ‘Structure and Electrode’ and ‘Exterior and Structure and Electrode’. Numerical results in this Chapter IV correspond to the results in this Chapter III.
On the basis of intensive empirical observation of patent statistics, it could be
considered that diversification of technology from simple technology to complex technology was driving the LIB innovation process, and it was originated by the development of material technology. In the LIB innovation process, material technology would spill over to the constitutional technologies like ‘Structure’ and ‘Exterior’ to design the appropriate size, weight, shape and structural details with the aim of better product function. Technology spillover occurred from material technology to complementary technology in order to diffuse material technology to process, component, and product technologies for LIB production. Thus, technologies composing a LIB have diversified with the development of material technology.
Finally, it can be concluded that the diversification of technology played an
important role in leading the LIB innovation process.

144
4.6 Conclusion In conclusion, it was revealed that technologies relating to electrode technology have
diversified from simple technology to complex technology in the LIB innovation process. Especially, complex technology relating to electrode technology has increased after the practical use of LIB started, and it played a significant role in leading the LIB innovation process. Based on this conclusion, we could introduce the significant effect of technology spillover among simple technologies.
145
Appendix A. List of IPC [H04R1/00] Details of transducers [H04R1/00,310・] Speaker [H04R1/00,311・・] Waterproof structure [H04R1/00,317・・] by using bone conduction [H04R1/00,318・・] support board or suspender [H04R1/02・] Casings; Cabinets; Mountings therein [H04R1/02,101・・] Speaker cabinets [H04R1/02,102・・] Speaker cases applied to specific thing [H04R1/02,103・・・] for using with other equipments [H04R1/02,104・・] front panel of speaker [H04R1/02,105・・] Attachment tools for speaker [H04R1/06・] Arranging circuit leads; Relieving strain on circuit leads [H04R1/06,310・・] Speaker [H04R1/10・] Earpieces; Attachments therefor [H04R1/10,101・・] Headphone and appendage [H04R1/10,102・・・] Pad [H04R1/10,103・・・] Attachment tool [H04R1/10,104・・] Earphone and appendage [H01R1/12・] Sanitary or hygienic devices for mouthpieces or earpieces [H04R1/20 ・ ] Arrangements for obtaining desired frequency or directional
characteristics [H04R1/20,310・・] Speaker [H04R1/22・・] for obtaining desired frequency characteristic only [H04R1/22,310・・・] Speaker [H04R1/24・・・] Structural combinations of separate transducers or of parts of the same
transducer and responsive respectively to two or more frequency ranges [H04R1/26・・・] Spatial arrangement of separate transducers responsive to two or more
frequency ranges [H04R1/28・・・] Transducer mountings or enclosures designed for specific frequency
response; Transducer enclosures modified by provision of mechanical or acoustic impedances,
[H04R1/28,310・・・・] Speaker [H04R1/30・・・] Combinations of transducers with horns [H04R1/32・・] for obtaining desired directional characteristic only
146
[H04R1/32,310・・・] Speaker [H04R1/34・・・] by using a single transducer with sound reflecting, diffracting, directing
or guiding means [H04R1/34,310・・・・] Speaker [H04R1/36・・・・] by using a single aperture of dimensions not greater than the shortest
operating wavelength [H04R1/38・・・・ ] in which sound waves act upon both sides of a diaphragm and
incorporating acoustic phase-shifting means [H04R1/40・・・] by combining a number of identical transducers [H04R1/40,310・・・・] Speaker [H01R1/42・] Combinations of transducers with fluid-pressure or other non-electrical
amplifying means [H01R1/44・] Special adaptations for subaqueous use [H01R1/44,310・・] Speaker [H04R3/00] Circuits for transducers [H04R3/00,101・] Protection circuit [H04R3/00,310・] Speaker [H04R3/02・] for preventing acoustic reaction [H04R3/04・] for correcting frequency response [H04R3/04,101・・] by using a negative feedback circuit [H04R3/04,102・・] for transducers of moving-coil, piezo-electric transducers, and other
transducers [H04R3/12・] for distributing signals to two or more loud-speakers [H04R3/14・・] Cross-over networks [H04R7/00] Diaphragms for electromechanical transducers; Cones [H04R7/02・] characterized by the construction [H04R7/04・・] Plane diaphragms [H04R7/06・・・] comprising a plurality of sections or layers [H04R7/08・・・・] comprising superposed layers separated by air or other fluid [H04R7/10・・・・] comprising superposed layers in contact [H04R7/12・・] Non-planar diaphragms or cones [H04R7/14・・・] corrugated, pleated, or ribbed [H04R7/16・] Mounting or tensioning of diaphragms or cones [H04R7/18・・] at the periphery [H04R7/20・・・] Securing diaphragm or cone resiliently to support by flexible material,
springs, cords, or strands
147
[H04R7/22・・・] Clamping rim of diaphragm or cone against seating [H04R7/24・・] Tensioning by means acting directly on free portion of diaphragm or cone [H04R7/26・] Damping by means acting directly on free portion of diaphragm or cone [H04R9/00] Transducers of moving-coil, moving-strip, or moving-wire type [H04R9/02・] Details [H04R9/02,101・・] Frame; appendage [H04R9/02,102・・] Magnetic circuit [H04R9/02,103・・] Damper [H04R9/04・・] Construction, mounting, or centering of coil [H04R9/04,102・・・] Coil [H04R9/04,103・・・] Lead wire; Connection between coil and lead wire [H04R9/04,104・・・] Bobbin [H04R9/04,105・・・・] Bobbin and other components [H04R9/06・] Loud-speakers [H04R9/10・] Telephone receivers [H04R9/18・] Resonant transducers, i.e. adapted to produce maximum output at a
predetermined frequency [H04R17/00] Piezo-electric transducers; Electrostrictive transducers [H04R17/10・] Resonant transducers
148
References Bernstein, J., Nadiri, M. (1988). “Interindustry R&D Spillovers, Rates of Return, and
Production in High-Tech Industries”, American Economic Review, 78, p.429. Bernstein, J. (1997). “Interindustry R&D Spillover for Electrical and Electric Products:
The Canadian Case”, Economic Systems Research, 9, p.111. Branstetter, L. (2001). “Are Knowledge Spillovers International or International
Inscope?: Microeconometric Evidence from the U.S. and Japan”, Journal of International Economics, 53, p.53.
Eaton, J., Kortum, S. (1999). “International Technology diffusion: theory and Measurement”, International Economic Review, 40, p.537.
Garcia-Vega, M. (2006). “Does technological diversification promote innovation? An empirical analysis for European firms”, Research Policy, 35 (2), pp. 30-246.
Geroski, P. (1995). “Markets for Technology: Knowledge, Innovation, and Appropriability, Stoneman”, Handbook of the Economic Innovation and technological Change, p.90.
Goto, A., Suzuki, K. (1989). “R&D Capital, Rate of Return on R&D Investment, and Spillover of R&D in Japanese Manufacturing Industries”, Review of Economics and Statistics, 71, p.555.
Griliches, Z. (1979). “Issues in Assessing the Contribution of R&D to Productivity Growth”, Bell Journal of Economics, 10, p.92 .
Griliches, Z., Lichtenberg, F. (1984). “Interindustry Technology Flows and Productivity Growth: A Reexiamination”, Review of Economics and Statistics, 66, p.324.
Griliches, Z., Pakes, A. (1984). “Patents and R&D at the Firm level: A First Look, Z. Griliches, R&D patents and Productivity”, University of Chicago Press, p.55.
Griliches, Z. (1990). “Patent Statistics as Economic Indicators: A survey”, Journal of Economic Literature, 28, p.1661.
Jaffe, A. (1986). “Technological Opportunity and Spillovers of R&D: Evidence from firm’s patents, profits and market value”, American Economic Review, 76, p.984.
Jaffe, A., Trajtenberg, M., Henderson, R. (1993). “Geographic Localization of Knowledge Spillovers as Evidenced by Patent Citations”, Quarterly Journal of Economics, 108, p. 577.
Keller, W. (2002). “Geographic Localization of International Technology Diffusion”, American Economic Review, 92, p.120.
Lee, G. (2006). “The effectiveness of international knowledge spillover channels”,
149
European Economic Review, 50, p.2075. Lichtenhthaler, E. (2005). “Corporate diversification: identifying new business
systematically in the diversified firm”, Technovation, 25, pp. 697-709. Lin, B., Wen, Z., Han, J., Wu, X. (2008). “Electrochemical properties of carbon coated
Li[Ni1/3 Co1/3Mn1/3]O2 cathode material for lithium-ion batteries”, Solid State Ionics, 179, p.1750.
Makimura, Y., Ohzuku, T. (2003). “Lithium insertion material of LiNi1/2Mn1/2O2 for advanced lithium-ion batteries”, Journal of Power Sources, 119-221, p.156.
Nagaura, T. (1991). Prog. Batteries Solar Cells, 10, p.209. Nakagawa, M., Watanabe, C. (2007). “Moving beyond organizational inertia as a
survival strategy for resources-based industry in a service-oriented economy: lessons from cross-sector technology spillover in the nonferrous metal industry”, Journal of Service research, 7, 1, p.7.
Nakagawa, M., Watanabe, C. (2008). “A Driver for Materials Technology Innovation: Changes in Technology Spillover Structure in Japan’s Nonferrous Metal Industry”, New Directions of Technology Management, 1 , p.25.
Nakagawa, M., Watanabe, C., Griffy-Brown, C. (2009). “Changes in the technology spillover structure due to economic paradigm shifts: A driver of the economic revival in Japan’s materials industry beyond the year 2000”, Technovation, 29, pp. 5-22.
Ohmura, A., Ouchi, N., Morisaki, S., Watanabe, C. (2003). “Functionality development as a survival strategy for fine ceramics”, Technovation, 23 (10), pp. 833–842.
Ohmura, A., Watanabe, C. (2006), “Cross-Products Technology Spillover in inducing a self-propagating dynamism for the shift to a service oriented economy: Lessons from high-performance fine ceramics”, Journal of Service Research, 6, 2, p.145.
Ohzuku, T., Brodd, R. (2007). “An overview of positive-electrode materials for advanced lithium-ion batteries”, Journal of Power sources, 174, p.449.
Ohzuku, T., Ueda, A., Yamamoto, N., Iwakoshi, Y. (1995). “Factor affecting the capacity retention of lithium-ion cells”, Journal of Power Sources, 54, p.99.
Scherer, F. (1984), “Using Linked Patent and R&D Data to Measure Interindustry Technology Flow, A, Griliches, R&D patents and productivity”, University of Chicago Press, p.417.
Shibata, Y., Saiki, T. (2009). “The dynamics of Knowledge Spillover for functionality development in Japanese Acoustic Equipment”. [CD-ROM]. VIPSI-Amalfi, VIPSI 2009 conference.
Shibata, Y., Saiki, T. (2010). “The new scope of knowledge spillover to develop the
150
functionality of technologies”, Int. J. Society Systems Sciences, 2 (4), pp. 334-350.
Tappeiner, G., Hauser, C., Walde, J. (2008). “Regional Knowledge Spillovers: Fact or Artifact”, Research Policy, 37, p.861.
Terero, M. (2001). “Analyzing the Spillover Mechanism on the Semiconductor Industry in the Silicon Valley and Route 123”, Econometric Society World Congress 2000 Contributed Papers from Econometric Society, p.90.
Watanabe, C., Hur, J. Y., and Matsumoto, K. (2005). “Technological diversification and firm’s techno-economic structure: an assessment of Canon’s sustainable growth trajectory”, Technological Forecasting and Social Change, 72 (1), pp.11-27.

151
Chapter V Conclusion
152
5.1 General summary
In this study, we focus on the development of material technologies used in a cathode of LIB to analyze the innovation dynamism of material technology.
In the Chapter I, based on the observation of market data and previous works, the significant role of material technology used in a cathode was suggested.
In the Chapter II, it was revealed that Panasonic’s prompt undertaking in the 2nd wave in the diffusion trajectory of electrode technology earlier than Sony was initiated by the development of composite materials. In fact, it was also revealed that Panasonic obtained patents of composite materials earlier than Sony. Based on this conclusion, we could suggest the significant role of composite materials to lead the LIB innovation process.
In the Chapter III, it was revealed that simple materials and composite materials followed the same growth trajectory, which was described as inter-technology spillover; diffusion of technologies from material technology to process, component, and product technologies. In both Sony and Panasonic, simple materials and composite materials followed the same change of technology group defined by IPC from simple technology to complex technology. The LIB innovation process was reconstructed when physical structure of materials was innovated from simple materials to composite materials. Thus, it could be suggested that technology spillover played a significant role in the LIB innovation process.
In the Chapter IV, it was revealed that technologies relating to electrode technology
have diversified from simple technology to complex technology in the LIB innovation process. Technology leading the LIB innovation process was replaced from simple technology to complex technology with the development of materials used in a cathode. Then, technology spillover occurred from ‘Electrode’ to ‘Structure’ and ‘Exterior’, and it has led the growth of complex technology like ‘Structure and Electrode’ and ‘Exterior and Structure and Electrode’. The significant role of diversification of technologies composing a LIB could be suggested.
Based on the general summary in each previous chapter, we propose the innovation
dynamism of material technology in this Chapter 5.
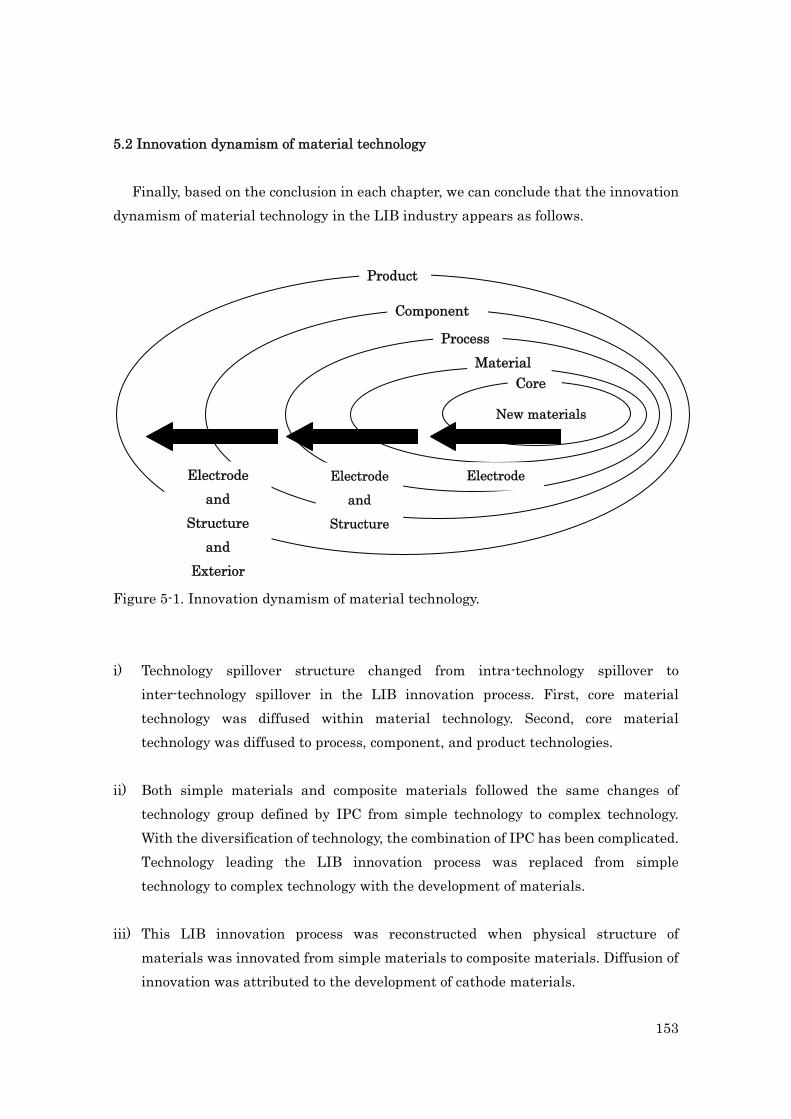
153
5.2 Innovation dynamism of material technology Finally, based on the conclusion in each chapter, we can conclude that the innovation
dynamism of material technology in the LIB industry appears as follows.
Figure 5-1. Innovation dynamism of material technology. i) Technology spillover structure changed from intra-technology spillover to
inter-technology spillover in the LIB innovation process. First, core material technology was diffused within material technology. Second, core material technology was diffused to process, component, and product technologies.
ii) Both simple materials and composite materials followed the same changes of
technology group defined by IPC from simple technology to complex technology. With the diversification of technology, the combination of IPC has been complicated. Technology leading the LIB innovation process was replaced from simple technology to complex technology with the development of materials.
iii) This LIB innovation process was reconstructed when physical structure of
materials was innovated from simple materials to composite materials. Diffusion of innovation was attributed to the development of cathode materials.
Core Material
Process
Component
Product
New materials
Electrode Electrode
and
Structure
Electrode and
Structure and
Exterior
154
5.3 Implication
It is useful to understand how results of this research can contribute to R&D in firms. As one example, this result makes it possible to evaluate the maturity level of material technology in the LIB innovation process.
Technologies composing a LIB was developed on the basis of material technology in the LIB innovation process (Material → Compartment → Product); for instance, material characteristics were developed by changing the mole ratio of elements, changing added materials, or changing the manufacturing process. In this study, it was revealed that this LIB innovation process was reconstructed when physical structure of materials was innovated to the next stage; for instance, since LIB was first manufactured from simple materials in 1991, LIB innovation process was created on the basis of simple materials in 1990s. In the 2000s, since composite materials with superior physical structure than simple materials started to be diffused, LIB innovation process was reconstructed on the basis of composite materials. The LIB innovation process traced a similar path in both the 1990s and the 2000s.
In this research, we focused on the relation between the development of materials
and the technology groups defined by IPC. As a result, it was revealed that the combination of IPC has diversified (‘Electrode’ → ‘Structure and Electrode’ → ‘Exterior and Structure and Electrode’) with the development of materials in the LIB innovation process (Material → Compartment → Product). This result demonstrates that the development of materials can be evaluated by the combination of IPC; for instance, material technology (‘Material’) corresponds to simple technology (‘Electrode’), and complementary technology (‘Compartment’ and ‘Product’) corresponds to complex technology (‘Structure and Electrode’, ‘Exterior and Structure and Electrode’). Thus, by observing the combination of IPC, it is possible to select essential materials which can be the roots to create the next LIB innovation process.
This result is useful for R&D managers, material engineers, and intellectual property lawyers to research material patents obtained by other firms; for instance, Panasonic filed about 4000 patents relating to LIB during 1991-2008. Researching patents defined as the technology group of ‘Electrode’, we can select only 40 patents as essential materials among the 4000 patents filed by Panasonic.
155
5.4 New findings in each chapter In this study, following new things were found in each chapter. Chapter II
i) Panasonic demonstrated timely start-up of the diffusion trajectory of electrode technology earlier than Sony in both 1st wave and 2nd wave.
ii) Panasonic filed and obtained patents of composite materials such as 3rd, 4th, and 5th materials earlier than Sony.
iii) Panasonic’s prompt undertaking in the 2nd wave was initiated by the development of composite materials.
Chapter III i) In both Sony and Panasonic, technologies have diversified from material
technology to process, component, and product technologies. ii) In both Sony and Panasonic, both simple materials and composite materials
followed the same changes of technology group defined by IPC from simple technology to complex technology.
iii) In both Sony and Panasonic, the LIB innovation process was reconstructed when physical structure of materials was innovated from simple materials to composite materials.
Chapter IV i) Technologies relating to electrode technology have diversified from simple
technology to complex technology in the LIB innovation process. ii) Complex technology relating to electrode technology has dramatically
increased after the practical use of LIB started. iii) Technology leading the LIB innovation process was replaced from simple
technology to complex technology with the development of materials.
156
5.5 Future works
In this study, we analyzed a significant role of material technology in the LIB industry as a model on the basis of patent data. In future works, it will be helpful to analyze material technology from different point of view like follows.
i) It is useful to compare innovation dynamism of material technology between different energy devices; for instance, comparing the innovation process between LIB and solar battery, or LIB and fuel battery. Through this comparison, we can propose more flexible innovation dynamism of material technology. ii) It is also useful to discuss the difference of innovation dynamism between Japanese firms and foreign firms; for instance, comparing R&D management between Japanese firms and Korean firms, or Japanese firms and Chinese firms. Through this discussion, we can realize why Korean firms and Chinese firms can make such rapid progress in the LIB industry.
iii) Additionally, it is necessary to consider how the material innovation influences innovations in other industries; for instance, analyzing how material innovation contributes to the development of service innovation such as Google or You tube in the diffusion of digital equipment. Through this analysis, we can understand the process of how the development of material technology in the LIB industry can create and lead the innovation in other industries.
157
Chapter VI Addendum:
A case study of R&D management of material technology in Panasonic
158
6.1 Historical view in reforms at Panasonic As one example of R&D management in Panasonic, it is useful to discuss the
relations between ‘Nakamura Reform’ and the results of Chapter III.
In the 1990s, Panasonic expanded their market share by riding the wave of rapid economic growth, and then they relied on mass production and high volume sales through the business department system that divided products into technological categories. This organizational structure has an advantage that business department system is able to optimize the overall business process of development, manufacturing, and sales. This fact suggests that Panasonic adopted a diversification strategy in order to increase the variety of products, and enhance their positions in the market.
However, following things would be considered as the disadvantages of this
organizational structure; high cost is required due to duplication of business divisions; gaps in awareness among employees in different divisions; lack of speed and sharing of information due to vertical layers of management. As a result, Panasonic faced difficulties to follow the changes of the environments caused by the diversity of demands from markets and the development of digital equipments. Finally, Panasonic recorded the largest profit loss in their history in fiscal 2001 (Kodama, 2007).
Restructuring the organizational structure, Mr. Kunio Nakamura was elected as the
president of Panasonic in June 2000. Since the appointment as president, Nakamura has implemented the restructuring of organizational structure under the theme of ‘Destruction and Creation’. In order to make the organization to be a flat structure, this restructuring changed pyramid organization of the old business departments from 13-layer structure to 4-layer structure. Although Panasonic recorded the largest profit loss in fiscal 2001, it has realized a sudden V-shaped recovery in business results after Panasonic instituted drastic structural reforms.
When Nakamura was elected as the president, he announced ‘Great Leap 21 Plan’ on 9 January, 2004. This is the mid-term management plan for the next three years starting from fiscal 2004. For instance, Panasonic invented ‘V products’ in this plan which has three features; Black-box technology, environmental considerations, and universal design. Thus, restructuring of organization provided fields for workers to create new ideas and products in Panasonic.
159
In the ‘Nakamura Reform’, many projects and strategies were demonstrated such as the introduction of cell production system, modularization design concepts, and balancing the quality and cost. In this study, we especially focus on the following three strategies relating to R&D management (Shinozaki, 2002).
First, the ‘alliance strategy’ was encouraged as one of these policies. Project team specialized for alliance was established in Panasonic to select the best partner for alliance. In this strategy, Panasonic classified business segments into two segments according to whether they need alliance or not. With the introduction of this new strategy in 2000, Panasonic changed R&D management from diversification strategy in the 1990s to ‘selection and concentration’. Panasonic encouraged the ‘alliance strategy’ to survive the global competition.
Second, Nakamura undertook the restructuring of R&D system, and introduced
‘platform structure’ as new R&D system. In this system, platform was classified into two types, ‘platform for the core technology’ and ‘platform for the strategic products’. The main purpose of this restructuring R&D system was promoting the horizontal integration between these two platforms, and crystallizing the individual knowledge accumulated in Panasonic group. In this structure, basic researches were mainly performed R&D in the basic research center in Panasonic. With the development of these basic researches, technologies were transferred from basic research center to each advanced research center in the Panasonic group. In the case of LIB, technology was transferred from basic research center in Panasonic to advanced research center in Energy Company.
Third, ‘black-boxing strategy’ was also advanced. The main purpose of this strategy
was inventing products which other firms hardly imitate. In this strategy, development of technology which was based on tacit knowledge was encouraged such as process technology for producing products. In parallel with this, obtaining intellectual property rights such as patents and trademarks was also advanced.
We discuss the process in which knowledge possessed by researchers and inventors was shared, assessed, and integrated across organizational boundaries in order to create new knowledge in Panasonic.
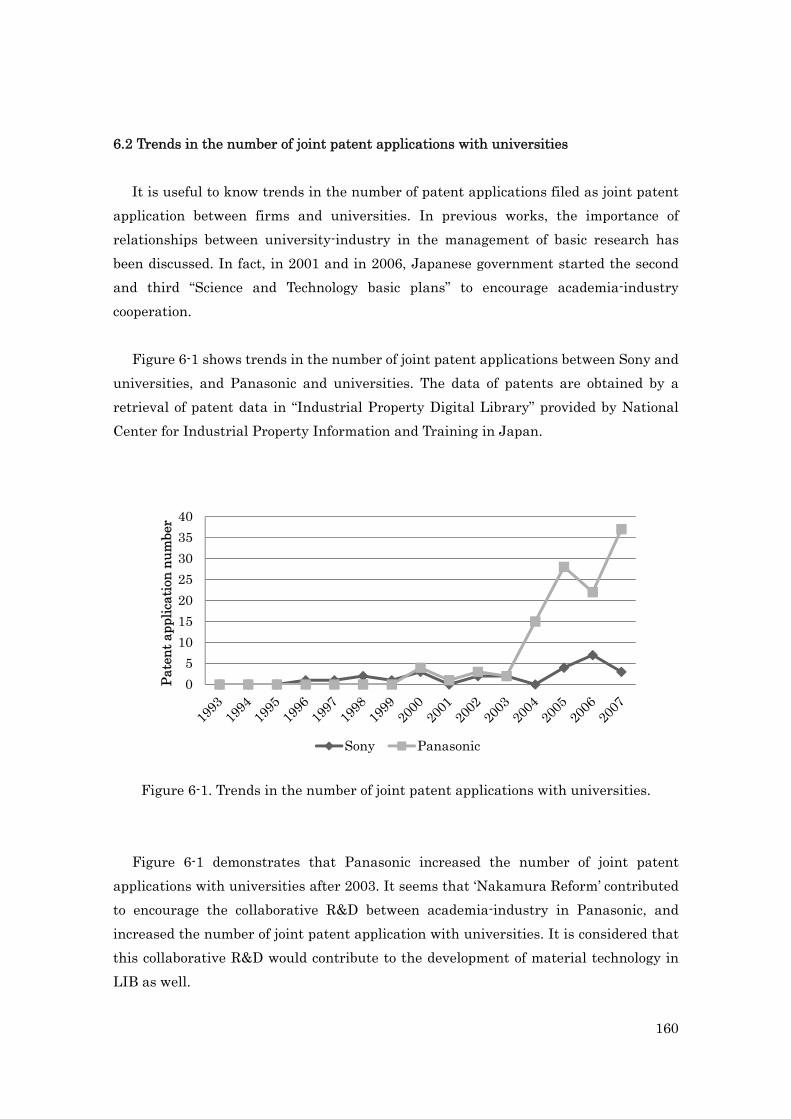
160
6.2 Trends in the number of joint patent applications with universities It is useful to know trends in the number of patent applications filed as joint patent
application between firms and universities. In previous works, the importance of relationships between university-industry in the management of basic research has been discussed. In fact, in 2001 and in 2006, Japanese government started the second and third “Science and Technology basic plans” to encourage academia-industry cooperation.
Figure 6-1 shows trends in the number of joint patent applications between Sony and
universities, and Panasonic and universities. The data of patents are obtained by a retrieval of patent data in “Industrial Property Digital Library” provided by National Center for Industrial Property Information and Training in Japan.
Figure 6-1. Trends in the number of joint patent applications with universities.
Figure 6-1 demonstrates that Panasonic increased the number of joint patent applications with universities after 2003. It seems that ‘Nakamura Reform’ contributed to encourage the collaborative R&D between academia-industry in Panasonic, and increased the number of joint patent application with universities. It is considered that this collaborative R&D would contribute to the development of material technology in LIB as well.
05
10152025303540
Pate
nt a
pplic
atio
n nu
mbe
r
Sony Panasonic
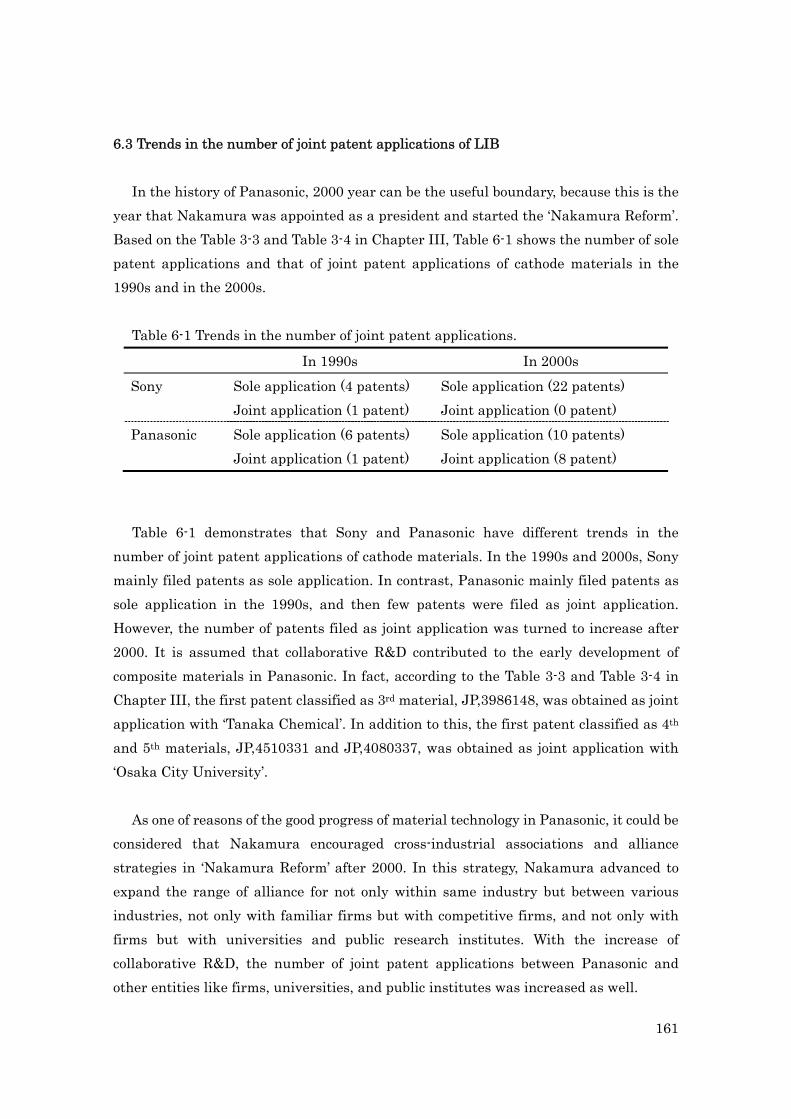
161
6.3 Trends in the number of joint patent applications of LIB In the history of Panasonic, 2000 year can be the useful boundary, because this is the
year that Nakamura was appointed as a president and started the ‘Nakamura Reform’. Based on the Table 3-3 and Table 3-4 in Chapter III, Table 6-1 shows the number of sole patent applications and that of joint patent applications of cathode materials in the 1990s and in the 2000s.
Table 6-1 Trends in the number of joint patent applications.
In 1990s In 2000s Sony Sole application (4 patents)
Joint application (1 patent) Sole application (22 patents) Joint application (0 patent)
Panasonic Sole application (6 patents) Joint application (1 patent)
Sole application (10 patents) Joint application (8 patent)
Table 6-1 demonstrates that Sony and Panasonic have different trends in the number of joint patent applications of cathode materials. In the 1990s and 2000s, Sony mainly filed patents as sole application. In contrast, Panasonic mainly filed patents as sole application in the 1990s, and then few patents were filed as joint application. However, the number of patents filed as joint application was turned to increase after 2000. It is assumed that collaborative R&D contributed to the early development of composite materials in Panasonic. In fact, according to the Table 3-3 and Table 3-4 in Chapter III, the first patent classified as 3rd material, JP,3986148, was obtained as joint application with ‘Tanaka Chemical’. In addition to this, the first patent classified as 4th and 5th materials, JP,4510331 and JP,4080337, was obtained as joint application with ‘Osaka City University’.
As one of reasons of the good progress of material technology in Panasonic, it could be
considered that Nakamura encouraged cross-industrial associations and alliance strategies in ‘Nakamura Reform’ after 2000. In this strategy, Nakamura advanced to expand the range of alliance for not only within same industry but between various industries, not only with familiar firms but with competitive firms, and not only with firms but with universities and public research institutes. With the increase of collaborative R&D, the number of joint patent applications between Panasonic and other entities like firms, universities, and public institutes was increased as well.
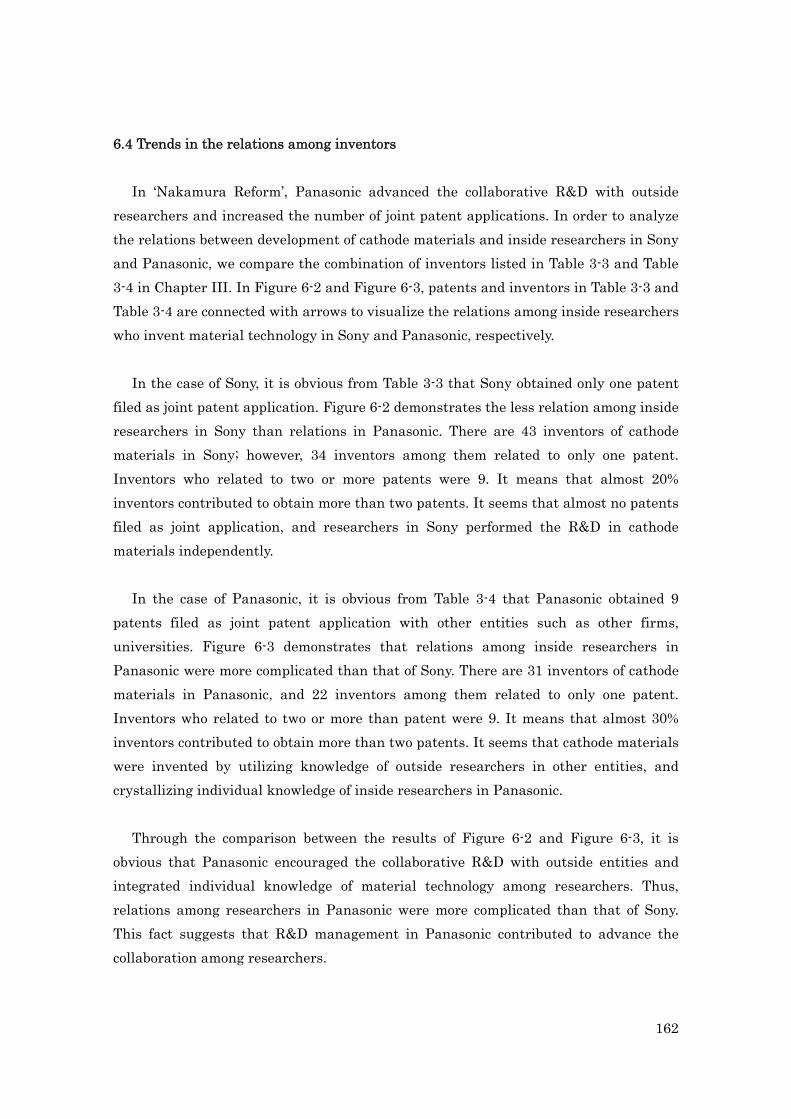
162
6.4 Trends in the relations among inventors
In ‘Nakamura Reform’, Panasonic advanced the collaborative R&D with outside researchers and increased the number of joint patent applications. In order to analyze the relations between development of cathode materials and inside researchers in Sony and Panasonic, we compare the combination of inventors listed in Table 3-3 and Table 3-4 in Chapter III. In Figure 6-2 and Figure 6-3, patents and inventors in Table 3-3 and Table 3-4 are connected with arrows to visualize the relations among inside researchers who invent material technology in Sony and Panasonic, respectively.
In the case of Sony, it is obvious from Table 3-3 that Sony obtained only one patent filed as joint patent application. Figure 6-2 demonstrates the less relation among inside researchers in Sony than relations in Panasonic. There are 43 inventors of cathode materials in Sony; however, 34 inventors among them related to only one patent. Inventors who related to two or more patents were 9. It means that almost 20% inventors contributed to obtain more than two patents. It seems that almost no patents filed as joint application, and researchers in Sony performed the R&D in cathode materials independently.
In the case of Panasonic, it is obvious from Table 3-4 that Panasonic obtained 9
patents filed as joint patent application with other entities such as other firms, universities. Figure 6-3 demonstrates that relations among inside researchers in Panasonic were more complicated than that of Sony. There are 31 inventors of cathode materials in Panasonic, and 22 inventors among them related to only one patent. Inventors who related to two or more than patent were 9. It means that almost 30% inventors contributed to obtain more than two patents. It seems that cathode materials were invented by utilizing knowledge of outside researchers in other entities, and crystallizing individual knowledge of inside researchers in Panasonic.
Through the comparison between the results of Figure 6-2 and Figure 6-3, it is obvious that Panasonic encouraged the collaborative R&D with outside entities and integrated individual knowledge of material technology among researchers. Thus, relations among researchers in Panasonic were more complicated than that of Sony. This fact suggests that R&D management in Panasonic contributed to advance the collaboration among researchers.
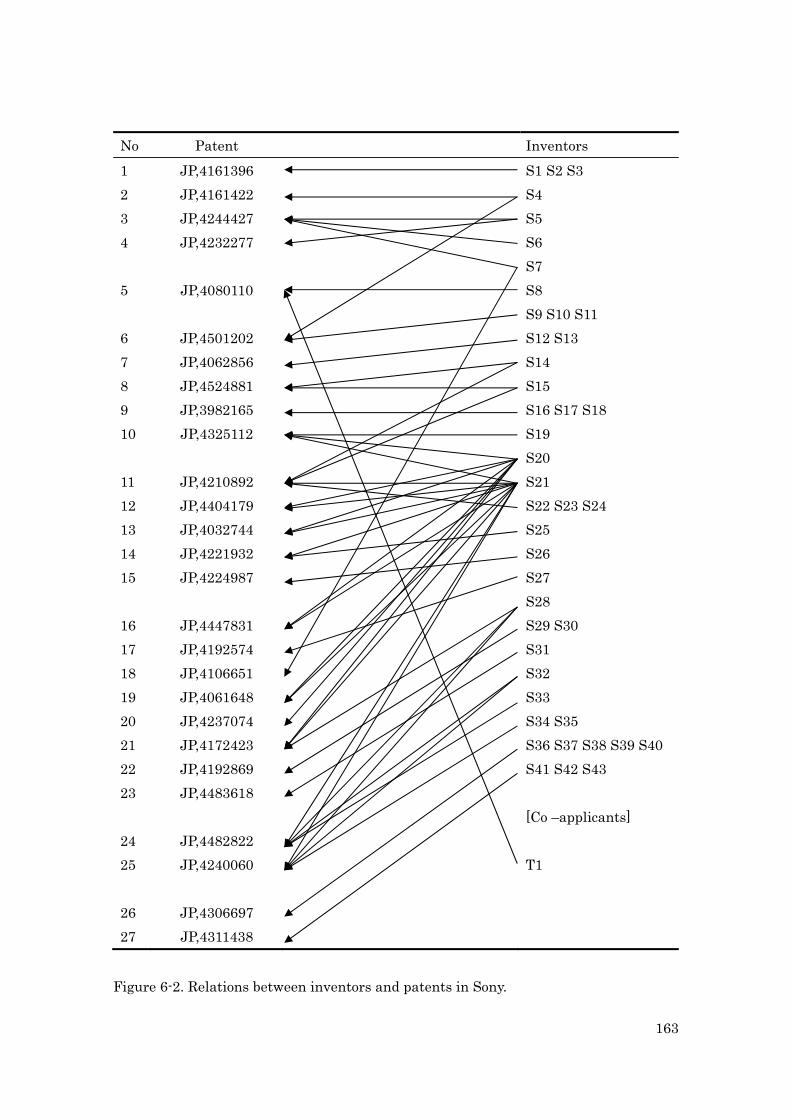
163
No Patent Inventors 1 JP,4161396 S1 S2 S3 2 JP,4161422 S4 3 JP,4244427 S5 4 JP,4232277 S6 S7 5 JP,4080110 S8 S9 S10 S11 6 JP,4501202 S12 S13 7 JP,4062856 S14 8 JP,4524881 S15 9 JP,3982165 S16 S17 S18 10 JP,4325112 S19 S20 11 JP,4210892 S21 12 JP,4404179 S22 S23 S24 13 JP,4032744 S25 14 JP,4221932 S26 15 JP,4224987 S27 S28 16 JP,4447831 S29 S30 17 JP,4192574 S31 18 JP,4106651 S32 19 JP,4061648 S33 20 JP,4237074 S34 S35 21 JP,4172423 S36 S37 S38 S39 S40 22 JP,4192869 S41 S42 S43 23 JP,4483618 [Co –applicants] 24 JP,4482822 25 JP,4240060 T1 26 JP,4306697 27 JP,4311438
Figure 6-2. Relations between inventors and patents in Sony.
164
No Patent Inventors 1 JP,3986148 P1 2 JP,3985323 P2 3 JP,4055241 P3 4 JP,4106741 P4 5 JP,4092779 P5 P6 P7 6 JP,4186291 P8 P10 7 JP,4453122 P9 P11 8 JP,4330758 P13 9 JP,4510331 P12 P14 P15 10 JP,4080337 P16 P17 11 JP,4153700 P18 P19 P20 P21 P22 P23 12 JP,4056271 P24 13 JP,4197237 P26 14 JP,4259847 P25 P27 P28 P29 15 JP,4150343 P30 P31 16 JP,4274801 17 JP,4271448 [Co applicants] 18 JP,4300827 T1 T2 T3 19 JP,4313096 T4 T5 20 JP,3994078 21 JP,4554911 I1 I2 22 JP,4549689 U1 23 JP,4541324 E1 E2 E3 E4 E5 24 JP,4047372 E7 E8 25 JP,4440339 E6 E9 E10
Figure 6-3. Relations between inventors and patents in Panasonic.
165
6.5 Trends in the move of inventors in Panasonic
As previously noted, Panasonic encouraged the collaborative R&D after 2000. Furthermore, according to the Table 3-4, it was also revealed that some researchers moved from basic research center in Panasonic to advanced research center in Energy Company. Energy Company is one of Panasonic group companies, which mainly treats energy devices. It seems that this move of researchers was attributed to the Panasonic’s new R&D system, ‘platform structure’, in order to promote the knowledge integrations.
As previously noted, Nakamura introduced ‘platform structure’ in their R&D
management as ‘Nakamura Reform’, and promoted the horizontal integration between core technology and strategic products in Panasonic. It seems that basic researches in every technology field were performed in the basic research center in Panasonic. In the ‘platform structure’, after these basic researches reached a workable level, researchers moved from basic research center to each advanced research center in the Panasonic group. In the case of LIB, researchers moved from Panasonic to Energy Company. Figure 6-4 shows these moves of researchers in Panasonic.
Figure 6-4 demonstrates that technology spillover in Panasonic was composed of two steps. First, Panasonic encouraged the collaborative R&D with other entities in the cross-industrial associations, and obtained knowledge, skills, and ideas from outside widely. This type of technology spillover between firms could be recognized as inter-firm technology spillover. Since R&D in material technology was considered as basic researches, the collaborative R&D was demonstrated in the basic research center in Panasonic in the early 2000s.
Second, after basic researches developed to a practical level, researchers moved to
the advanced research center in Energy Company. It is assumed that main purpose of this move was promoting the horizontal integration in Panasonic group, and transferred knowledge of material technology to share it among researchers in Energy Company to produce strategic products. This type of technology spillover between technologies could be recognized as inter-technology spillover. Thus, Panasonic encouraged the utilization of two kinds of technology spillovers, inter-firm technology spillover and inter-technology spillover.
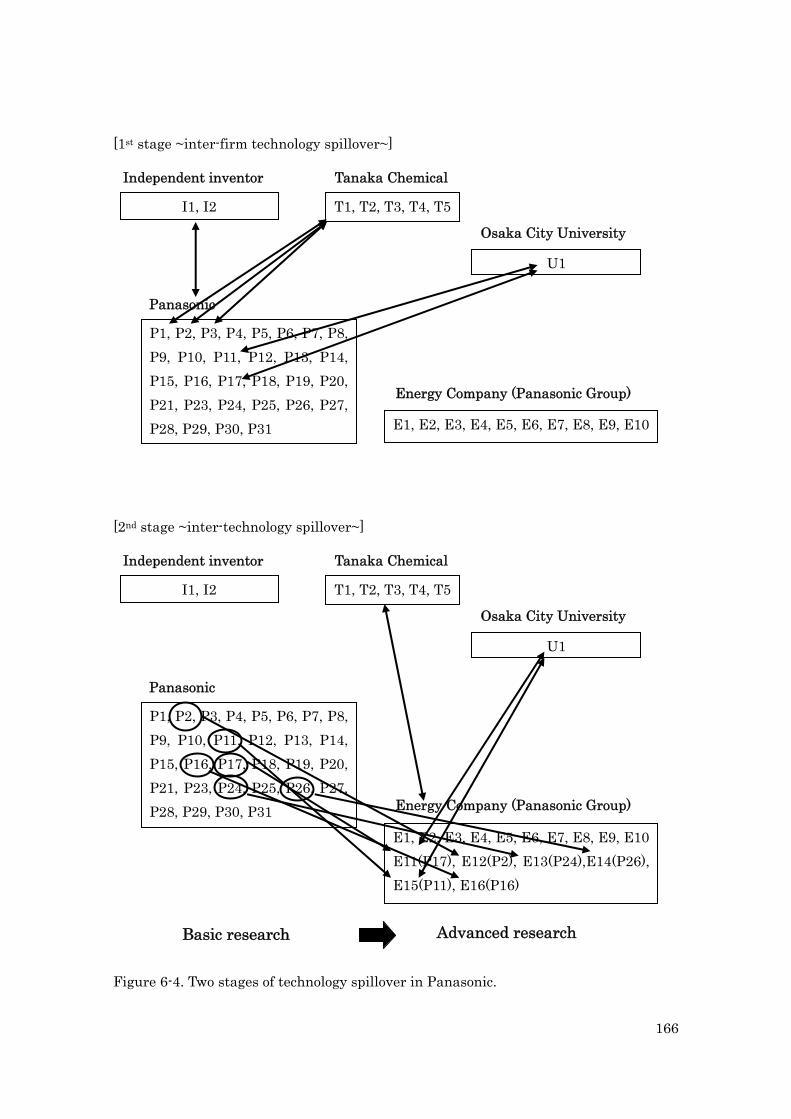
166
[1st stage ~inter-firm technology spillover~] [2nd stage ~inter-technology spillover~] Figure 6-4. Two stages of technology spillover in Panasonic.
Panasonic
P1, P2, P3, P4, P5, P6, P7, P8, P9, P10, P11, P12, P13, P14, P15, P16, P17, P18, P19, P20, P21, P23, P24, P25, P26, P27, P28, P29, P30, P31 E1, E2, E3, E4, E5, E6, E7, E8, E9, E10
I1, I2 T1, T2, T3, T4, T5
U1
Tanaka Chemical
Osaka City University
Independent inventor
Energy Company (Panasonic Group)
P1, P2, P3, P4, P5, P6, P7, P8, P9, P10, P11, P12, P13, P14, P15, P16, P17, P18, P19, P20, P21, P23, P24, P25, P26, P27, P28, P29, P30, P31
E1, E2, E3, E4, E5, E6, E7, E8, E9, E10 E11(P17), E12(P2), E13(P24),E14(P26), E15(P11), E16(P16)
I1, I2 T1, T2, T3, T4, T5
U1
Tanaka Chemical
Osaka City University
Independent inventor
Panasonic
Energy Company (Panasonic Group)
Basic research Advanced research
167
6.6 R&D management in Panasonic In R&D management of material technology in Panasonic, the results demonstrate
that technology spillover structure was changed from intra-firm to inter-firm technology spillover, and from intra-technology to inter-technology spillover.
In the 1990s, when Panasonic entered the LIB market, intra-firm technology
spillover was dominated. It is considered that materials were critical for innovation, so that firms hardly disclosed their manufacturing process of materials. Additionally, firms might not need external learning for material technology in this period, because material innovation was conducted from the development of their own technology such as simple materials. Thus, intra-firm technology spillover facilitated the development of cathode materials in the 1990s.
In the 2000s, the technology spillover structure has changed according to the
‘Nakamura Reform’. This change has extended to the boundary of spillovers from intra-firm to inter-firms, from intra-technology to inter-technology.
First, inter-firm technology spillover was encouraged in their R&D management. In
fact, after Nakamura announced encouraging cross-industrial associations, Panasonic and Osaka City University filed their first joint patent application in 2001. Next, inter-technology spillover was encouraged as the diffusion of technologies in their R&D management. After the development of material technology, knowledge of new materials was transferred to develop complementary technology by moving researchers from basic research to advanced research. This material innovation could be a symbolic case of academic-industry collaboration in Japan.
It is considered that Panasonic obtained knowledge of material technology from university, and next knowledge was transferred to develop complementary technology. It is likely that there existed bilateral causality between academic research and practical research, so that intensive collaborative R&D contributed to invent the composite materials. It can be said that strategic R&D management in Panasonic has led the technology spillover to diffuse the knowledge of material technology, and this technology spillover played a significant role to develop the material technology in the LIB innovation process.
168
6.7 R&D management of material technology Based on the observation of R&D management in Panasonic, following 3 steps R&D
management of material technology can be proposed as one example. In stage 1, intra-firm technology spillover leads an innovation. When firms enter the
material industry, they need to prepare infrastructures to create materials such as facilities, equipments, and tools to produce materials. Additionally, knowledge, not only material technology but also know-how, experiences, skills for their facilities, also needs to be accumulated. After the development of materials, complementary technology is also developed to facilitate the effective work of materials. It seems that the R&D in material technology is started from the firm’s own effort, and little collaborative R&D is performed with other entities. In this step, the basic infrastructure to create materials is established.
In stage 2, inter-firm, intra-technology spillover leads an innovation. Firms are
required to develop the technological characteristics of materials in the advancement of the performance of a product. In order to develop materials, collaborative R&D is encouraged to provide opportunities for inside researchers in a firm to exchange information with outside researchers. It seems that collaborative R&D is demonstrated among researchers in the field of material technology to develop the functionality of core technology. In this step, horizontal integration between organizations, for instance between university and firm, is promoted. Additionally, vertical integration within material technology, for instance between simple materials and composite materials, is promoted.
In stage 3, inter-firm, inter-technology spillover leads an innovation. In order to put
new materials into practical use, it is required for firms to diffuse knowledge of material technology to process, component, and product technologies. Then, researchers in the collaborative R&D need to move to participate in the advanced research. In this step, horizontal integration between organizations is promoted. Additionally, horizontal integration between technologies, for instance between material technology and product technology, is promoted.
Figure 6-5 shows the relations of R&D management and innovation of material
technology on the aspect of technology spillover.
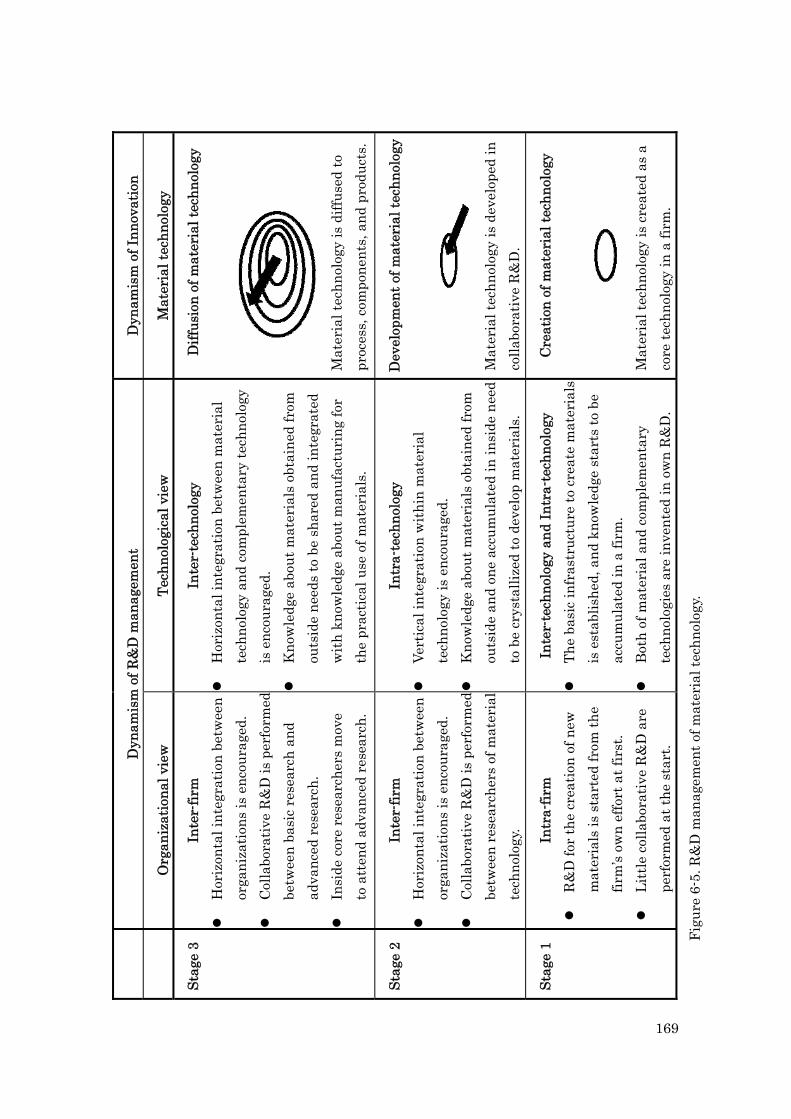
169
Dyn
amis
m o
f Inn
ovat
ion
Mat
eria
l tec
hnol
ogy
Diff
usio
n of
mat
eria
l tec
hnol
ogy
Mat
eria
l tec
hnol
ogy
is d
iffus
ed to
pr
oces
s, c
ompo
nent
s, a
nd p
rodu
cts.
Dev
elop
men
t of m
ater
ial t
echn
olog
y
Mat
eria
l tec
hnol
ogy
is d
evel
oped
in
colla
bora
tive
R&
D.
Cre
atio
n of
mat
eria
l tec
hnol
ogy
Mat
eria
l tec
hnol
ogy
is c
reat
ed a
s a
core
tech
nolo
gy in
a fi
rm.
Dyn
amis
m o
f R&
D m
anag
emen
t
Tech
nolo
gica
l vie
w
Inte
r-te
chno
logy
Hor
izon
tal i
nteg
ratio
n be
twee
n m
ater
ial
tech
nolo
gy a
nd c
ompl
emen
tary
tech
nolo
gy
is e
ncou
rage
d.
K
now
ledg
e ab
out m
ater
ials
obt
aine
d fr
om
outs
ide
need
s to
be
shar
ed a
nd in
tegr
ated
w
ith k
now
ledg
e ab
out m
anuf
actu
ring
for
the
prac
tical
use
of m
ater
ials
.
Intr
a-te
chno
logy
Vert
ical
inte
grat
ion
with
in m
ater
ial
tech
nolo
gy is
enc
oura
ged.
Kno
wle
dge
abou
t mat
eria
ls o
btai
ned
from
ou
tsid
e an
d on
e ac
cum
ulat
ed in
insi
de n
eed
to b
e cr
ysta
llize
d to
dev
elop
mat
eria
ls.
Inte
r-te
chno
logy
and
Intr
a-te
chno
logy
The
basi
c in
fras
truc
ture
to c
reat
e m
ater
ials
is
est
ablis
hed,
and
kno
wle
dge
star
ts to
be
accu
mul
ated
in a
firm
.
Bot
h of
mat
eria
l and
com
plem
enta
ry
tech
nolo
gies
are
inve
nted
in o
wn
R&
D.
Org
aniz
atio
nal v
iew
Inte
r-fir
m
H
oriz
onta
l int
egra
tion
betw
een
orga
niza
tions
is e
ncou
rage
d.
C
olla
bora
tive
R&
D is
per
form
edbe
twee
n ba
sic
rese
arch
and
ad
vanc
ed r
esea
rch.
Insi
de c
ore
rese
arch
ers
mov
e
to a
tten
d ad
vanc
ed r
esea
rch.
Inte
r-fir
m
H
oriz
onta
l int
egra
tion
betw
een
orga
niza
tions
is e
ncou
rage
d.
C
olla
bora
tive
R&
D is
per
form
edbe
twee
n re
sear
cher
s of
mat
eria
l te
chno
logy
.
Intr
a-fir
m
R
&D
for
the
crea
tion
of n
ew
mat
eria
ls is
sta
rted
from
the
firm
’s ow
n ef
fort
at f
irst
.
Litt
le c
olla
bora
tive
R&
D a
re
perf
orm
ed a
t the
sta
rt.
Stag
e 3
Stag
e 2
Stag
e 1
Figu
re 6
-5. R
&D
man
agem
ent o
f mat
eria
l tec
hnol
ogy.

170
References Kodama, M. (2007). “Innovation through boundary management-a case study in
reforms at Matsushita electric”, Technovation, 27, pp.15-29. Nikkei Inc, (1990-2007). Nikkei all articles data base. [CD-ROM]. Nikkei Inc, Tokyo. Panasonic Corporation, (2001-2009). Annual Report. Panasonic Corp, Osaka. Shinozaki, A. (2002). “Destruction and Construction in Panasonic”, Jitsugyo no Nihon
Sha, Ltd.
171
Acknowledgement
I would like to express my deep and sincere gratitude to my supervisor, Professor Tomoko Saiki, Innovation Management Department, Tokyo Institute of Technology. Her wide knowledge and logical thinking have provided a good basis for this study.
I wish to thank Prof. Koji Tanabe, Prof. Shuzo Fujimura, Prof. Takehiro Inohara, Prof. Toshiya Watanabe, and Associate Prof. Masaharu Tsujimoto. Their detailed and constructive comments have had a remarkable influence on my research.
I am grateful to my parents, colleagues, and all the people who supported me. Without their encouragements and supports, it would have been impossible for me to finish this work.
Finally, the support of Tokyo Institute of Technology is gratefully acknowledged. Their kind support has been of great value in this study. Graduate school of Innovation Management, Tokyo Institute of Technology Yosuke Shibata


