Embed Size (px)
Citation preview
HAL Id: hal-03196105https://hal.archives-ouvertes.fr/hal-03196105
Submitted on 21 Apr 2021
HAL is a multi-disciplinary open accessarchive for the deposit and dissemination of sci-entific research documents, whether they are pub-lished or not. The documents may come fromteaching and research institutions in France orabroad, or from public or private research centers.
L’archive ouverte pluridisciplinaire HAL, estdestinée au dépôt et à la diffusion de documentsscientifiques de niveau recherche, publiés ou non,émanant des établissements d’enseignement et derecherche français ou étrangers, des laboratoirespublics ou privés.
Innovative photocatalytic luminous textiles optimizedtowards water treatment: Performance evaluation of
photoreactorsA. Almansba, A. Kane, N. Nasrallah, R. Maachi, L. Lamaa, L. Peruchon, C.
Brochier, I. Béchohra, A. Amrane, A.A. Assadi
To cite this version:A. Almansba, A. Kane, N. Nasrallah, R. Maachi, L. Lamaa, et al.. Innovative photocatalytic lumi-nous textiles optimized towards water treatment: Performance evaluation of photoreactors. ChemicalEngineering Journal, Elsevier, 2021, 416, pp.129195. �10.1016/j.cej.2021.129195�. �hal-03196105�
1
Innovative photocatalytic luminous textiles optimized towards water
treatment: Performance evaluation of photoreactors
Amira ALMANSBAa,b,c, Abdoulaye KANEc, Noureddine NASRALLAHa, Rachida MAACHIa, Lina
LAMAAd, Laure PERUCHONd, Cedric BROCHIERd, Imane BÉCHOHRAa, Abdeltif AMRANEb,
Aymen Amine ASSADIb*
aLaboratoire de Génie de la Réaction, Faculté de Génie Mécanique et Génie des Procédés, Université des
Sciences et de la Technologie Houari Boumediene, Bab Ezzouar, Alger 16111, Algeria
bUniv Rennes, Ecole Nationale Supérieure de Chimie de Rennes, CNRS, ISCR - UMR 6226, F-35000
Rennes, France
cUniLaSalle-Ecole des Métiers de l’Environnement, Campus de Ker Lann, 35170 Bruz, France
dBrochier Technologies, 90 Rue Frédéric Fays, 69100 Villeurbanne Lyon, France
* Corresponding author: A. ASSADI, E-mail: [email protected]
Abstract
The photocatalytic removal of Flumequine (antibiotic) using a luminous textile which
served as a support for the TiO2 and a light transmitter through optical fibers was
examined in this study. Two configurations of luminous textile were investigated (Mono-
Face and Double-Face) in terms of compounds degradation and mineralization.
Photocatalytic performances of Double-Face configuration were found to be better than
the one obtained with Mono-Face. Furthermore, to describe the kinetics of the reaction,
the Langmuir-Hinshelwood model was successfully applied and both reaction kinetic and
adsorption/desorption equilibrium constants were determined. Double-Face configuration
also showed better performances compared to the conventional process in the different
2
water matrices tested (ultrapure water, synthetic solution simulating seawater and
synthetic hospital wastewater). This configuration was tested for cetirizine (antihistamine)
degradation as well, with a satisfying result obtained. Moreover, this technology showed
good stability and reusability. On the other hand, the larger size of Double-Face retained
its performance at pilot-scale. Finally, the irradiation analyzes showed a good light
distribution homogeneity on the textile surface at both laboratory-scale and pilot-scale.
Keywords
Photocatalysis; Luminous textile; Process intensification; Water matrices; Pilot-scale.
1. Introduction
It is well-known that the presence of organic pollutants in wastewater bodies from
industrial waste, are harmful to both the environment and human health [1,2]. Most of
these pollutants contain stable compounds and possess a poor biodegradability [3]. These
contaminants are hardly eliminated from wastewater by conventional methods, such as
coagulation, filtration or adsorption [4–6]. These non-destructive techniques consist in a
simple transfer of the pollution from one phase to another. Other available water treatment
methods such as, biological process and chemical water treatment systems can release
toxic by-product pollutants into the environment [7,8].
Since then, it is necessary to tackle this issue by seeking innovative treatment solutions.
These innovations can be integrated for example in existing wastewater treatment
technologies in order to allow for a complete elimination of persistent pollutants.
Nowadays, heterogeneous photocatalysis with TiO2 under UV-light irradiation is
considered as a promising technology. One of the main characteristics of the
3
heterogeneous photocatalytic process lies not only in the fact that it allows the
degradation of the target molecules, but it also allows the mineralization of by-products
[9]. Some of the keys advantages of the TiO2 catalyst are: its low toxicity, low cost,
commercial availability and photochemical stability [10]; in addition, it shows the ability of
degrading a wide range of organic pollutants. Indeed, it has been already reported by
previous researches that suspended TiO2 particles used in photoreactors give high activity
due to their high surface area [11,12]. However, the semiconductor cannot be easily
separated from the treated solution, and hence a recycling process is needed, which is a
costly and complicated method to be applied on large scale [13]. Therefore, the
immobilization of the photocatalyst became a useful option to avoid this problem [14], but
the majority of the designed photocatalytic reactors suffer from poor light penetration,
since they involve external light [15]. The main challenge to overcome this bottleneck is
to optimize the contact between the light, the catalyst and the pollutant. In fact, since
photocatalysis is a heterogeneous process, the adsorption-desorption phenomena of the
reagents on the catalyst surface plays a very important role in the photocatalytic process,
as demonstrated by Zhou et al, using a simple photocatalyst model for the treatment of
substrates with different functional groups, which create different contact interactions with
the semiconductor surface [16,17]. Marinangeli and Ollis [18], proposed theoretically, that
photoreactors with catalyst-coated optical fibers, could be used as a support for TiO2
photocatalyst and could solve the light transmission problem. Some previous works
demonstrated the possibility of using this configuration as an alternative to the wide range
of needs for environmental remediation. Optical fibers have however some drawbacks;
the main limitation is related to the decrease of light intensity along the axial direction of
the coated fiber. Several works were consequently performed to make the light distribution
4
homogeneous all along the fiber by varying the thickness and length of the TiO2 deposit,
as well as the diameter and number of optical fibers. Despite these efforts, this problem
remains persistent [19–21].
In this context, Brochier Technologies has developed a luminous textile, which consists
on merging optical and textile fibers. Such configuration is a new technology that,
represents a new way to design a high-performance photocatalytic reaction system.
The major innovation of the luminous textile relies on the irradiation from inside by the
optical fiber of the immobilized photocatalyst film on the supporting substrate. Luminous
textile’s lighting is the result of a specific treatment (developed by Brochier Technologies)
applied to the optical fiber. It leads to relative homogeneity in light distribution on the
textile’s surface, increasing that way, the contact between the TiO2, the pollutant and the
light source, and hence promoting mass transfer and allowing the exposure of a large
catalytic surface to light. The special feature of the luminous textile is the use of LED
(Light-Emitting Diode) technology, with consequently a low energy consumption.
Furthermore, this technology reduces the photoreactor size. Only few studies have been
published regarding the luminous textile, and if that is the case, they were focusing mainly
on its characterization aspects [22,23].
In the present study, as a first step we compared the luminous textile performances with
a conventional photocatalytic process. Then, a comparative study between two new
designs of luminous textile (not previously reported) was performed. A parametric study
was performed on the most efficient configuration and tested in different water matrices,
then compared to the conventional process. And finally, tested on a pilot-scale with larger
luminous textile.
5
As model molecules, we selected two commonly used pharmaceuticals compounds which
are Flumequine (FLU) and Cetirizine (CET). The FLU is a typical quinolone antibiotic,
widely detected in aquatic environments (2.5–50 ng.L−1) [24–26]. Previous reports
indicated that the release of FLU in the environment is a dramatic concern for aquatic
ecosystems, and thus contributes to the development of newly resistant bacteria [27].
Cetirizine (CET) belongs to the piperazine class of antihistamines used to treat allergic
rhinitis (high fever), dermatitis, and urticaria. This pollutant is hardly degraded during
wastewater treatment [28], and has been frequently reported in surface water samples (4
ng.L−1–1.4 mg.L−1) [29–31]. To our knowledge, no research work on the depollution of
different water matrices (ultrapure water, synthetic solution simulating seawater and
synthetic hospital wastewater) using a compactness reactor with a catalyst on double-
face of a luminous textile.
2. Material and Methods
2.1 Chemicals
All chemical reagents were purchased from sigma Aldrich supplier, namely Flumequine
(C14H12FNO3, ≥97.0%), Cetirizine dihydrochloride (C21H25ClN2O3 2HCl, ≥98.0%), (HCl,
37% v/v), (NaOH, 98%), tetrachloromethane (CCl4, 99.5%), Tert-Butanol ((CH3)3COH,
purity>99.5%), Ethylenediaminetetraacetic acid (EDTA) (purity>99%), hydrogen peroxide
(H2O2). Stock solutions were prepared with ultrapure water (UPW). Characteristics of tap
water and synthetic hospital wastewater [32] is summarized in table 1.
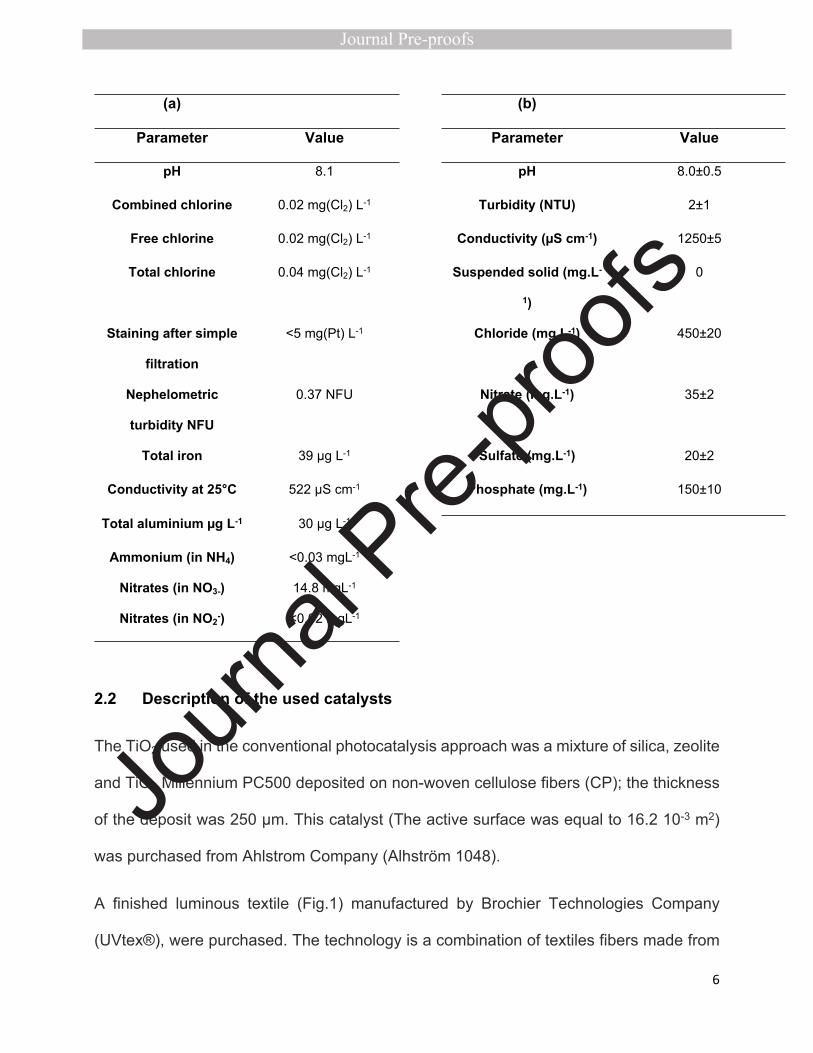
Table 1. Characterization of tap water (a) and synthetic hospital wastewater (b).
6
(a) (b)
Parameter Value Parameter Value
pH 8.1 pH 8.0±0.5
Combined chlorine 0.02 mg(Cl2) L-1 Turbidity (NTU) 2±1
Free chlorine 0.02 mg(Cl2) L-1 Conductivity (µS cm-1) 1250±5
Total chlorine 0.04 mg(Cl2) L-1 Suspended solid (mg.L-
1)
0
Staining after simple
filtration
<5 mg(Pt) L-1 Chloride (mg.L-1) 450±20
Nephelometric
turbidity NFU
0.37 NFU Nitrate (mg.L-1) 35±2
Total iron 39 µg L-1 Sulfate (mg.L-1) 20±2
Conductivity at 25°C 522 µS cm-1 Phosphate (mg.L-1) 150±10
Total aluminium µg L-1 30 µg L-1
Ammonium (in NH4) <0.03 mgL-1
Nitrates (in NO3-) 14.8 mgL-1
Nitrates (in NO2-) <0.02 mgL-1
2.2 Description of the used catalysts
The TiO2 used in the conventional photocatalysis approach was a mixture of silica, zeolite
and TiO2 Millennium PC500 deposited on non-woven cellulose fibers (CP); the thickness
of the deposit was 250 μm. This catalyst (The active surface was equal to 16.2 10-3 m2)
was purchased from Ahlstrom Company (Alhström 1048).
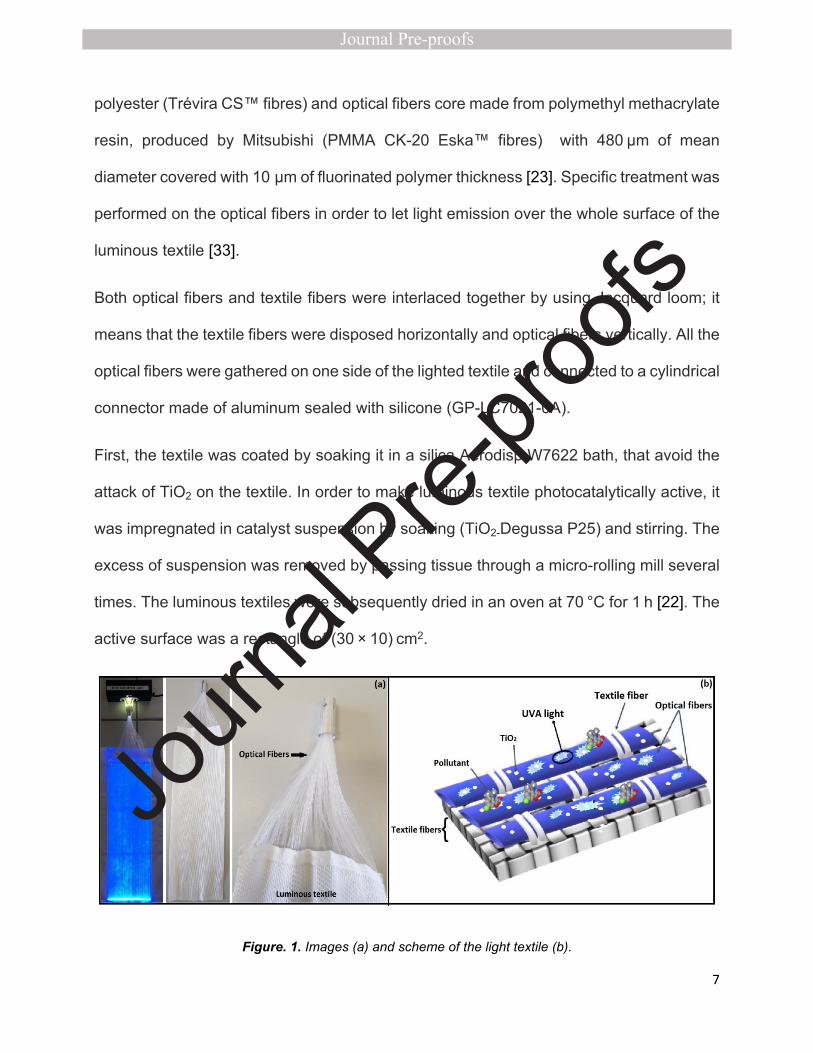
A finished luminous textile (Fig.1) manufactured by Brochier Technologies Company
(UVtex®), were purchased. The technology is a combination of textiles fibers made from
7
polyester (Trévira CS™ fibres) and optical fibers core made from polymethyl methacrylate
resin, produced by Mitsubishi (PMMA CK-20 Eska™ fibres) with 480 μm of mean
diameter covered with 10 μm of fluorinated polymer thickness [23]. Specific treatment was
performed on the optical fibers in order to let light emission over the whole surface of the
luminous textile [33].
Both optical fibers and textile fibers were interlaced together by using Jacquard loom; it
means that the textile fibers were disposed horizontally and optical fibers vertically. All the
optical fibers were gathered on one side of the lighted textile and connected to a cylindrical
connector made of aluminum sealed with silicone (GP-LC7021-0A).
First, the textile was coated by soaking it in a silica Aerodisp W7622 bath, that avoid the
attack of TiO2 on the textile. In order to make luminous textile photocatalytically active, it
was impregnated in catalyst suspension by soaking (TiO2-Degussa P25) and stirring. The
excess of suspension was removed by passing tissue through a micro-rolling mill several
times. The luminous textiles were subsequently dried in an oven at 70 °C for 1 h [22]. The
active surface was a rectangle of (30 × 10) cm2.
Figure. 1. Images (a) and scheme of the light textile (b).
8
Two different luminous textiles were prepared; first one is the “mono-face” (MF) and the
second one is “Double-face” (DF). The same number of optical fibers was present in both
textile configurations, as well as the amount of TiO2 deposited; the only difference was
the distribution of optical fibers. Regarding the DF, optical fibers were distributed on its
two sides unlike the MF where it was present on one side only.
In the pilot-scale system, a larger size of DF luminous textile was produced (80x10 cm2)
using the same method, with the same catalyst density.
2.3 Characterization of the luminous textile
2.3.1 SEM/EDX analysis
The analysis of the surface by SEM/EDX (Scanning electron microscopy-energy
dispersive spectroscopy X-ray diffraction technique) is a completely accepted method to
provide informations about the morphology, topology and structure of the sample [34].
The combination with the EDX technique allows to determine the elemental composition
of its surface [34].
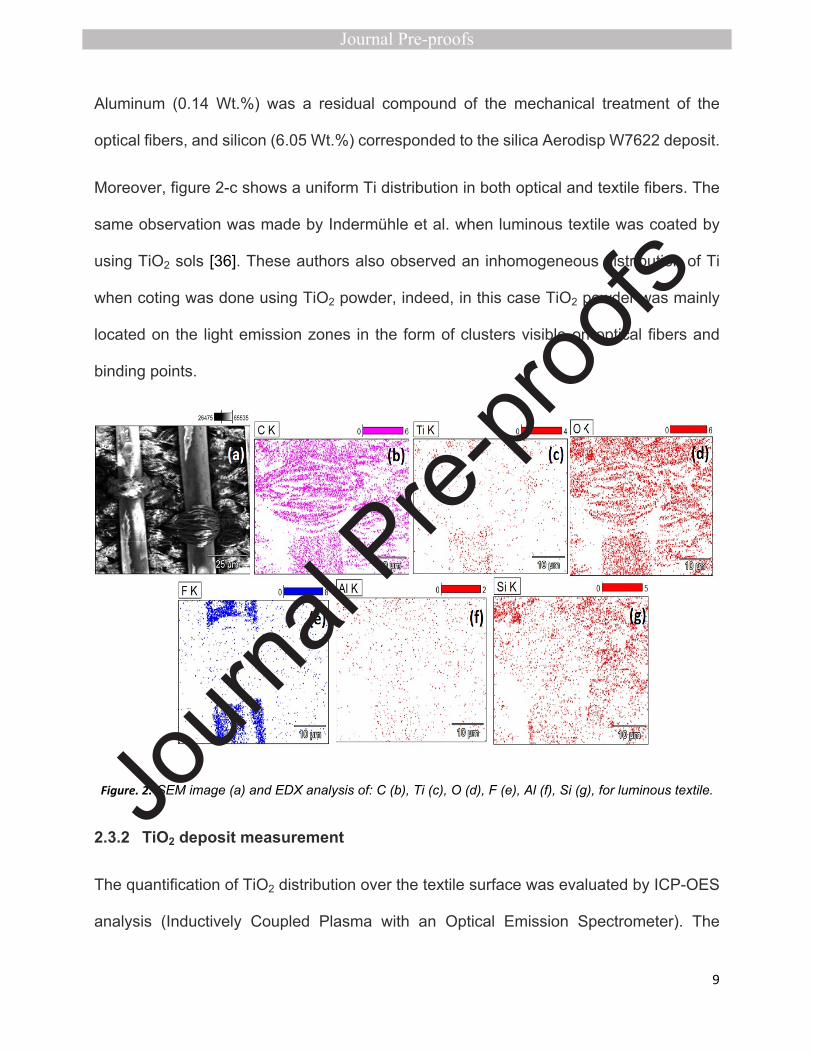
Indeed, SEM/EDX analysis provided an enlarged view of the luminous textile sample
showing the entanglement between the textile fibers and the optical fibers forming a tying
point (Fig.2-a), this analysis also shows defects present on the optical fibers surface
inducing a loss of light. The SEM/EDX method revealed the different elements of the
luminous textile like: titanium (4.86 Wt.%), carbon (16.56 Wt.%) and oxygen (54.68 Wt.%),
which were also previously found in cotton TiO2 support [35]. To these elements’ fluorine
can be added (17.48 Wt.%) since the optical fibers cladding is made of fluoropolymer.
9
Aluminum (0.14 Wt.%) was a residual compound of the mechanical treatment of the
optical fibers, and silicon (6.05 Wt.%) corresponded to the silica Aerodisp W7622 deposit.
Moreover, figure 2-c shows a uniform Ti distribution in both optical and textile fibers. The
same observation was made by Indermühle et al. when luminous textile was coated by
using TiO2 sols [36]. These authors also observed an inhomogeneous distribution of Ti
when coting was done using TiO2 powder, indeed, in this case TiO2 powder was mainly
located on the light emission zones in the form of clusters visible on optical fibers and
binding points.
Figure. 2. SEM image (a) and EDX analysis of: C (b), Ti (c), O (d), F (e), Al (f), Si (g), for luminous textile.
2.3.2 TiO2 deposit measurement
The quantification of TiO2 distribution over the textile surface was evaluated by ICP-OES
analysis (Inductively Coupled Plasma with an Optical Emission Spectrometer). The
10
luminous textile samples of 6 cm2 were melted with lithium tetraborate and after a heating
step, the residue was dissolved in hydrochloric acid. The solutions obtained was sprayed
into the heart of a plasma at high temperatures, the atomic vapor produced was analyzed
with an optical emission spectrometer (OES) [36]. The catalyst quantity on the textile
surface was equal to 12 gTiO2/m2.
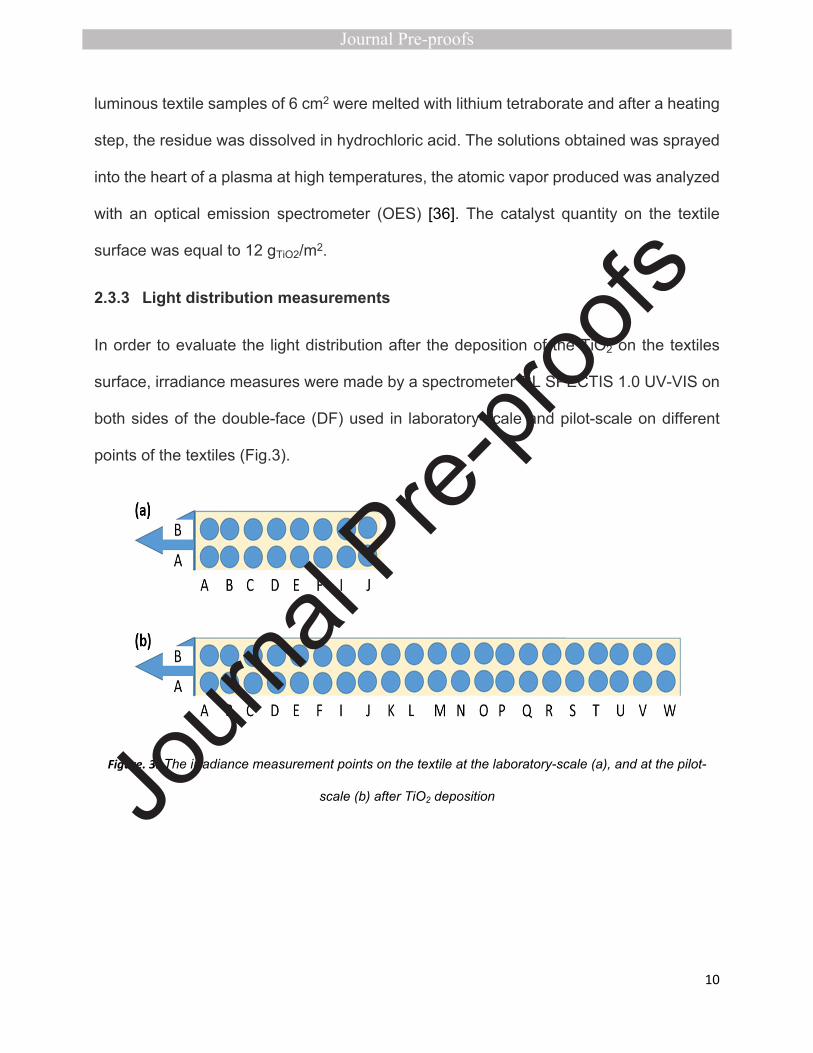
2.3.3 Light distribution measurements
In order to evaluate the light distribution after the deposition of the TiO2 on the textiles
surface, irradiance measures were made by a spectrometer GL SPECTIS 1.0 UV-VIS on
both sides of the double-face (DF) used in laboratory-scale and pilot-scale on different
points of the textiles (Fig.3).
Figure. 3. The irradiance measurement points on the textile at the laboratory-scale (a), and at the pilot-
scale (b) after TiO2 deposition
11
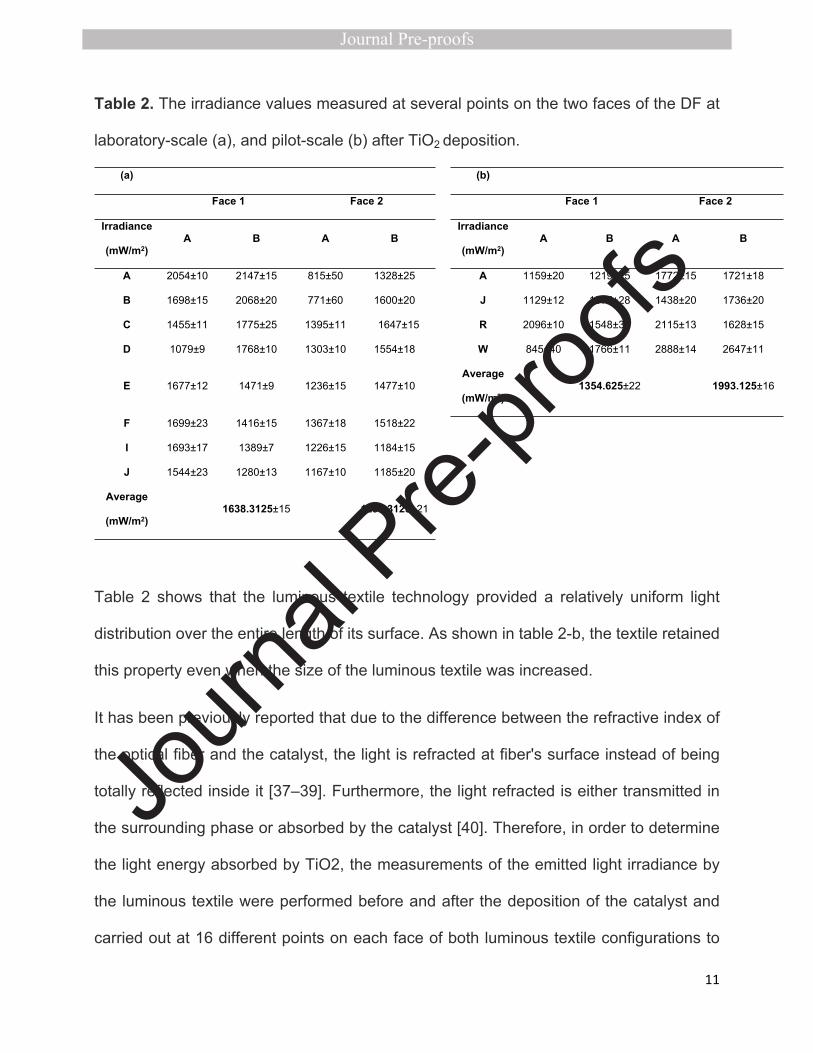
Table 2. The irradiance values measured at several points on the two faces of the DF at
laboratory-scale (a), and pilot-scale (b) after TiO2 deposition.
(a) (b)
Face 1 Face 2 Face 1 Face 2
Irradiance
(mW/m2)A B A B
Irradiance
(mW/m2)A B A B
A 2054±10 2147±15 815±50 1328±25 A 1159±20 1219±25 1772±15 1721±18
B 1698±15 2068±20 771±60 1600±20 J 1129±12 1075±28 1438±20 1736±20
C 1455±11 1775±25 1395±11 1647±15 R 2096±10 1548±30 2115±13 1628±15
D 1079±9 1768±10 1303±10 1554±18 W 845±40 1766±11 2888±14 2647±11
E 1677±12 1471±9 1236±15 1477±10Average
(mW/m2) 1354.625±22
1993.125±16
F 1699±23 1416±15 1367±18 1518±22
I 1693±17 1389±7 1226±15 1184±15
J 1544±23 1280±13 1167±10 1185±20
Average
(mW/m2) 1638.3125±15
1298.3125±21
Table 2 shows that the luminous textile technology provided a relatively uniform light
distribution over the entire length of its surface. As shown in table 2-b, the textile retained
this property even when the size of the luminous textile was increased.
It has been previously reported that due to the difference between the refractive index of
the optical fiber and the catalyst, the light is refracted at fiber's surface instead of being
totally reflected inside it [37–39]. Furthermore, the light refracted is either transmitted in
the surrounding phase or absorbed by the catalyst [40]. Therefore, in order to determine
the light energy absorbed by TiO2, the measurements of the emitted light irradiance by
the luminous textile were performed before and after the deposition of the catalyst and
carried out at 16 different points on each face of both luminous textile configurations to
12
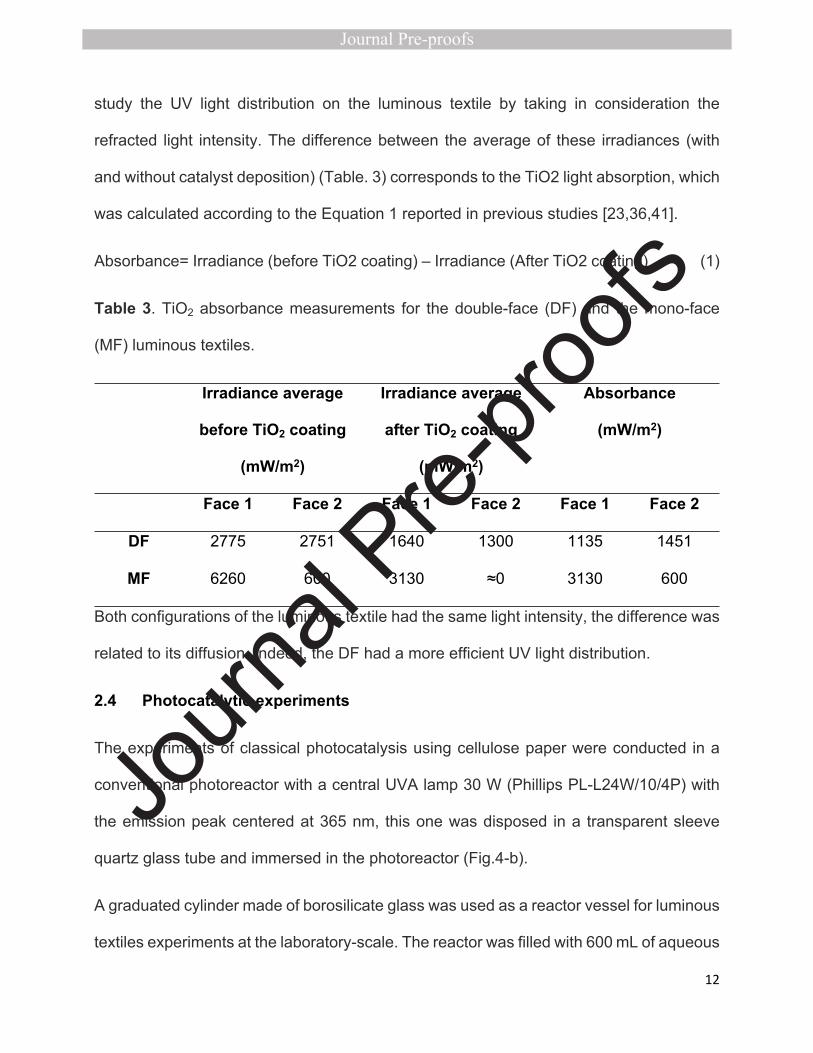
study the UV light distribution on the luminous textile by taking in consideration the
refracted light intensity. The difference between the average of these irradiances (with
and without catalyst deposition) (Table. 3) corresponds to the TiO2 light absorption, which
was calculated according to the Equation 1 reported in previous studies [23,36,41].
Absorbance= Irradiance (before TiO2 coating) – Irradiance (After TiO2 coating) (1)
Table 3. TiO2 absorbance measurements for the double-face (DF) and the mono-face
(MF) luminous textiles.
Irradiance average
before TiO2 coating
(mW/m2)
Irradiance average
after TiO2 coating
(mW/m2)
Absorbance
(mW/m2)
Face 1 Face 2 Face 1 Face 2 Face 1 Face 2
DF 2775 2751 1640 1300 1135 1451
MF 6260 600 3130 ≈0 3130 600
Both configurations of the luminous textile had the same light intensity, the difference was
related to its diffusion. Indeed, the DF had a more efficient UV light distribution.
2.4 Photocatalytic experiments
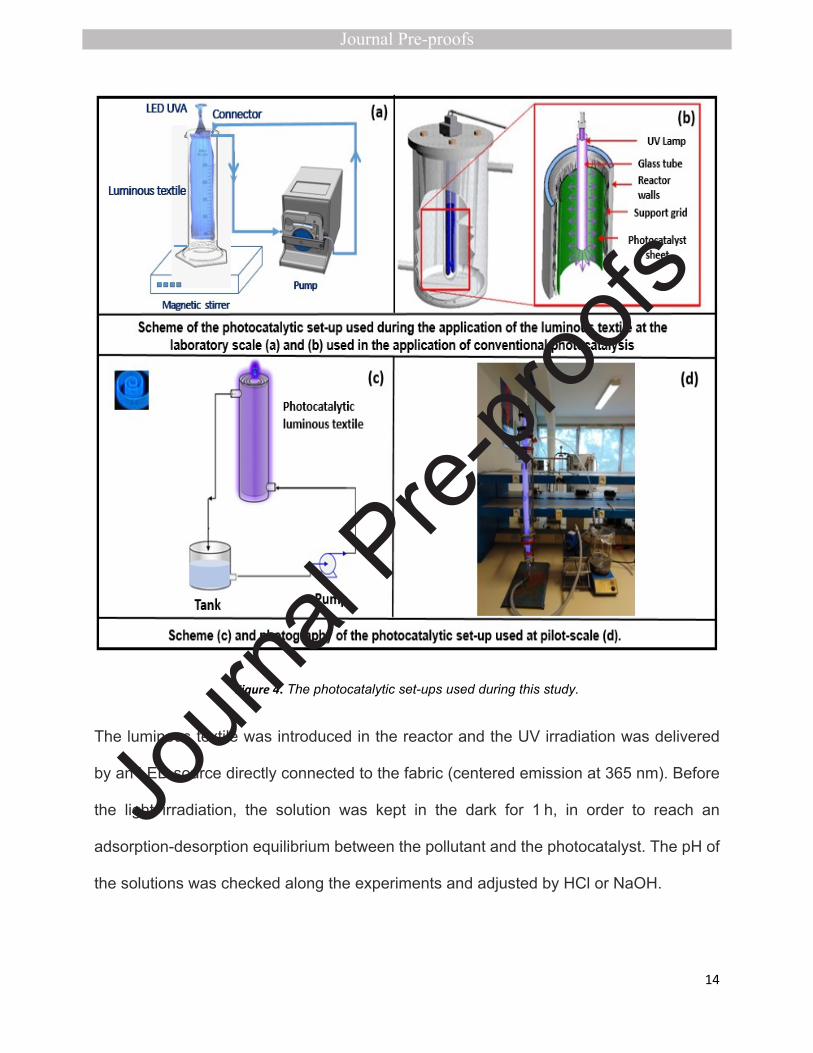
The experiments of classical photocatalysis using cellulose paper were conducted in a
conventional photoreactor with a central UVA lamp 30 W (Phillips PL-L24W/10/4P) with
the emission peak centered at 365 nm, this one was disposed in a transparent sleeve
quartz glass tube and immersed in the photoreactor (Fig.4-b).
A graduated cylinder made of borosilicate glass was used as a reactor vessel for luminous
textiles experiments at the laboratory-scale. The reactor was filled with 600 mL of aqueous
13
solution and different initial pollutant concentrations at room temperature. A peristaltic
pump operating at a flow rate of 87 mL min−1 and a magnetic stirrer at 60 rpm were used
to recirculate and homogenize the medium (Fig.4-a). The light intensity of MF and DF
were 3.1 W.m-2 and 2.9 W.m-2, respectively.
The surface of the luminous textile used at the pilot-scale was three times larger than the
one used at the laboratory-scale. However, there was no big difference between their
luminous intensities; it was 3.3 W.m-2 in the case of the pilot-scale reactor. The
experiments were carried out in a recirculating annular reactor consisting of two concentric
Pyrex tubes (Fig.4-c and 4-d), operating continuously and supplied with 2 L of polluted
solution, at a flow rate of 0.65 m3/h.
Regeneration of the luminous textile was performed under UVA and by stirring in water
after each photocatalytic experiment. The textile regeneration duration used at laboratory
and pilot scales were about 90 min and 120 min, respectively.
14
Figure 4. The photocatalytic set-ups used during this study.
The luminous textile was introduced in the reactor and the UV irradiation was delivered
by an LED source directly connected to the fabric (centered emission at 365 nm). Before
the light irradiation, the solution was kept in the dark for 1 h, in order to reach an
adsorption-desorption equilibrium between the pollutant and the photocatalyst. The pH of
the solutions was checked along the experiments and adjusted by HCl or NaOH.
15
At regular time intervals, samples were filtered using 0.45 μm PTFE Millipore syringe filters
before analysis. Aqueous concentrations of the pollutants were measured at a wavelength
of 247 nm for FLU and 231 nm for CET, by a Shimadzu UV-1800 UV–vis
spectrophotometer using quartz cell.
Degradation efficiency (%) was estimated using the Equation 2.
(2)η(%) = (C0 ― CtC0 )𝑥100
C0 and Ct are the initial FLU concentration and its concentration at time t, respectively.
The kinetic analysis of pollutant degradation was carried out using Equation 3
(3)Ln(Ct C0) = 𝑘𝑎𝑝𝑝 . 𝑡
where kapp is the apparent kinetic constant (h-1); t is the reaction time, h
The (TOC) was determined using a TOC Analyzer (Shimadzu TOC-VCSH) and the yield
was calculated according to the Eq. (4)
(4)𝑚𝑖𝑛𝑒𝑟𝑎𝑙𝑖𝑧𝑎𝑡𝑖𝑜𝑛 𝑦𝑖𝑒𝑙𝑑(%) = (TOC0 ― TOCt TOC0 )𝑥 100
TOC0 and TOCt are the initial Total Organic Carbon and the Total Organic Carbon at
time t, respectively.
In order to make the comparison between the different materials studied, the use of the
degradation constant is not the best option, because it does not take into account the
number of photons driving it [34]. To overcome this problem, the use of apparent quantum
yield (which correspond to a lower limits of the quantum yield) as a performance indicator
16
of the photocatalytic material is more appropriate [34]. The apparent quantum yield which
based on incident photons was calculated at a precise wavelength according to Equation
5.
(5)𝐴𝑄𝑌 (%) =𝑅𝑠
𝐼0(𝜆) 𝑥 100
Where (mol.L –1 s –1) is the transformation rate of the FLU; AQY is the apparent 𝑅𝑠
quantum yield of reactant loss at the irradiation wavelength (λ = 365 nm) and I0 (Einstein.
L –1 s –1) is the effective photon flux which was obtained after correcting the actinometric
measurement by convoluting the ferrioxalate spectrum [42].
The photocatalytic reaction kinetics of many organic compounds has been represented
using the Langmuir–Hinshelwood model (Eq.6), which takes into account the contribution
of adsorption properties of substrate on the photocatalyst surface and photocatalytic
reactions kinetic [43,44]. Indeed, the transformation of these substrates, which are
adsorbed on the catalyst surface during the process, leads to a variations in their
concentration; and Langmuir–Hinshelwood (L-H) model takes in consideration these
phenomena [45].
(6)𝑟0 = ― d𝐶0
dt =𝑘𝐿 ― 𝐻 𝐾𝐿 𝐶0
1 + 𝐾𝐿 𝐶0
Where (mg.min−1.L−1) is the initial reaction rate, (mg.min−1.L−1) is the apparent 𝑟0 𝑘𝐿 ― 𝐻
L-H rate and (L.mg−1) is the adsorption/desorption equilibrium constant.𝐾𝐿
3. Results and discussion
17
Our study started with a comparison between the performance of the luminous textile and
the cellulosic paper (CP). The effect of different parameters on the luminous textile were
then examined, such as, pH, design of luminous textile, initial pollutant concentration,
impact of oxidant addition, water matrix. Moreover, for each individual pollutant, the
performances of the double-face configuration were also tested and compared (FLU and
CET). In addition, the reusability of the luminous textile was also examined. Finally, a pilot-
scale application was carried out, and the results obtained are being discussed in this
work.
The degradation process was followed by monitoring both the pollutant disappearance
(degradation) and the mineralization degree.
3.1 Comparison between the photocatalytic performances of the
conventional process and the MF luminous textile
The first experiment on the luminous textile was conducted to compare its photocatalytic
performance and at the same time its energy consumption to the conventional method of
photocatalysis using cellulose paper as support for TiO2. The amount of catalyst deposited
on the two supports was identical and equal to 0.36 g. The MF was selected for this
comparison in terms of apparent quantum yield (Eq. 5), at 20 mg.L-1 initial pollutant
amount. R2 (correlation coefficient) of the initial slope was equal to 0.989 for MF and 0.976
for CP.
As shown in table 4, the luminous textile was much more efficient than the CP in terms of
FLU apparent quantum yield; this can be justified by a better penetration of light in the
case of the luminous textile because the catalyst was in direct contact with the light source.
18
This is the main obstacle, which usually slows down the traditional processes of
photocatalysis and this can be avoidable by using this new technology. The other
advantage was the lower energy consumption; in fact, the light intensity of the MF and the
lamp used with CP were 9.3 10-2 W and 30 W, respectively.
In view of these very encouraging and promising results, a study was undertaken on this
innovative process in order to improve its performance.
Table 4. Comparison between the photocatalytic performances of MF and CP in terms of
apparent quantum yield of FLU at 365 nm; pH=6.5; [FLU]o = 20 mg.L-1; Ф(MF) =9.3 10-2
W; Ф(CP) = 30 W; reaction volume = 600 mL.
CP MF luminous textile
Apparent
quantum yield
(%)
3 ± 1 21 ± 2
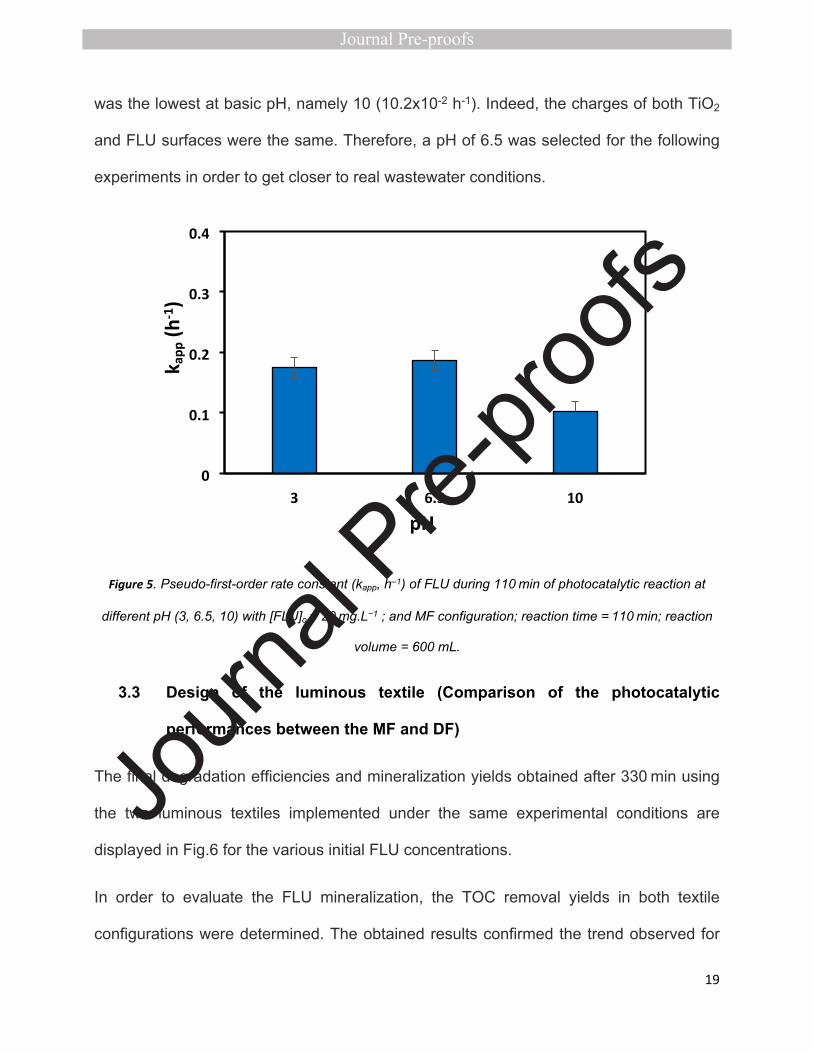
3.2 Effect of pH
The pH plays a key role in the photocatalytic reaction. Consequently, the effect of pH on
the degradation rate was studied at three pH values (3, 6.5 and 10) with mono-face
configuration (R2 ≥ 0.988). pH influence is related to the behavior of the extent of FLU
ionization characterized by the acid ionization constant (pKa), and the superficial charge
of the catalyst described by the point of zero charge (PZC).
Previous reports have indicated that the PZC of Degussa P25 is 6 [46], and the pKa of
FLU is 6.27 [47]. At pH< 6 (pH=3) the surface of TiO2 is therefore positive and the FLU is
neutral. Similarly, the surface of the catalyst and FLU are negatively charged at pH>pzc
(pH =10), causing a repulsion reducing the affinity between them. As seen in figure 5, kapp
19
was the lowest at basic pH, namely 10 (10.2x10⁻² h-1). Indeed, the charges of both TiO2
and FLU surfaces were the same. Therefore, a pH of 6.5 was selected for the following
experiments in order to get closer to real wastewater conditions.
0
0.1
0.2
0.3
0.4
3 6.5 10
pH
k app
(h-1
)
Figure 5. Pseudo-first-order rate constant (kapp, h–1) of FLU during 110 min of photocatalytic reaction at
different pH (3, 6.5, 10) with [FLU]o = 20 mg.L−1 ; and MF configuration; reaction time = 110 min; reaction
volume = 600 mL.
3.3 Design of the luminous textile (Comparison of the photocatalytic
performances between the MF and DF)
The final degradation efficiencies and mineralization yields obtained after 330 min using
the two luminous textiles implemented under the same experimental conditions are
displayed in Fig.6 for the various initial FLU concentrations.
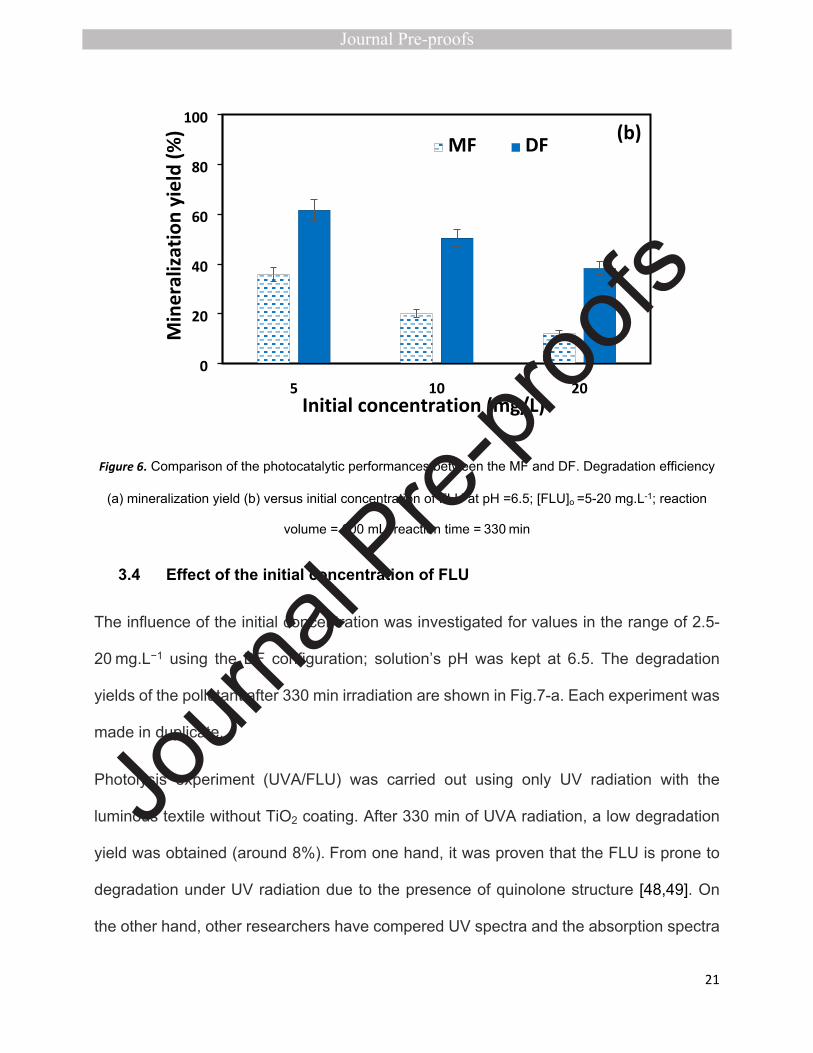
In order to evaluate the FLU mineralization, the TOC removal yields in both textile
configurations were determined. The obtained results confirmed the trend observed for
20
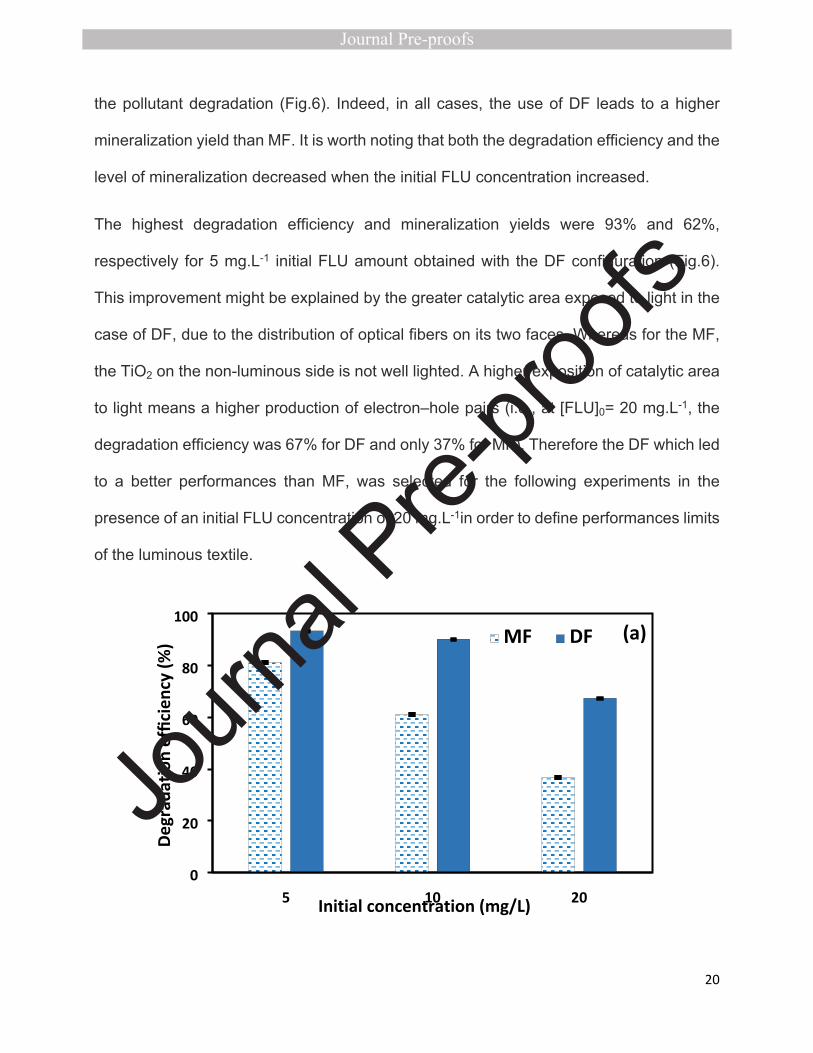
the pollutant degradation (Fig.6). Indeed, in all cases, the use of DF leads to a higher
mineralization yield than MF. It is worth noting that both the degradation efficiency and the
level of mineralization decreased when the initial FLU concentration increased.
The highest degradation efficiency and mineralization yields were 93% and 62%,
respectively for 5 mg.L-1 initial FLU amount obtained with the DF configuration (Fig.6).
This improvement might be explained by the greater catalytic area exposed to light in the
case of DF, due to the distribution of optical fibers on its two faces. Whereas for the MF,
the TiO2 on the non-luminous side is not well lighted. A higher exposition of catalytic area
to light means a higher production of electron–hole pairs (i.e., at [FLU]0= 20 mg.L-1, the
degradation efficiency was 67% for DF and only 37% for MF). Therefore the DF which led
to a better performances than MF, was selected for the following experiments in the
presence of an initial FLU concentration of 20 mg.L-1in order to define performances limits
of the luminous textile.
0
20
40
60
80
100
5 10 20
MF DF
Initial concentration (mg/L)
Degr
adat
ion
effic
ienc
y (%
) (a)
21
0
20
40
60
80
100
5 10 20
MF DF
Initial concentration (mg/L)
Min
eral
izat
ion
yiel
d (%
) (b)
Figure 6. Comparison of the photocatalytic performances between the MF and DF. Degradation efficiency
(a) mineralization yield (b) versus initial concentration of FLU at pH =6.5; [FLU]o =5-20 mg.L-1; reaction
volume = 600 mL; reaction time = 330 min
3.4 Effect of the initial concentration of FLU
The influence of the initial concentration was investigated for values in the range of 2.5-
20 mg.L−1 using the DF configuration; solution’s pH was kept at 6.5. The degradation
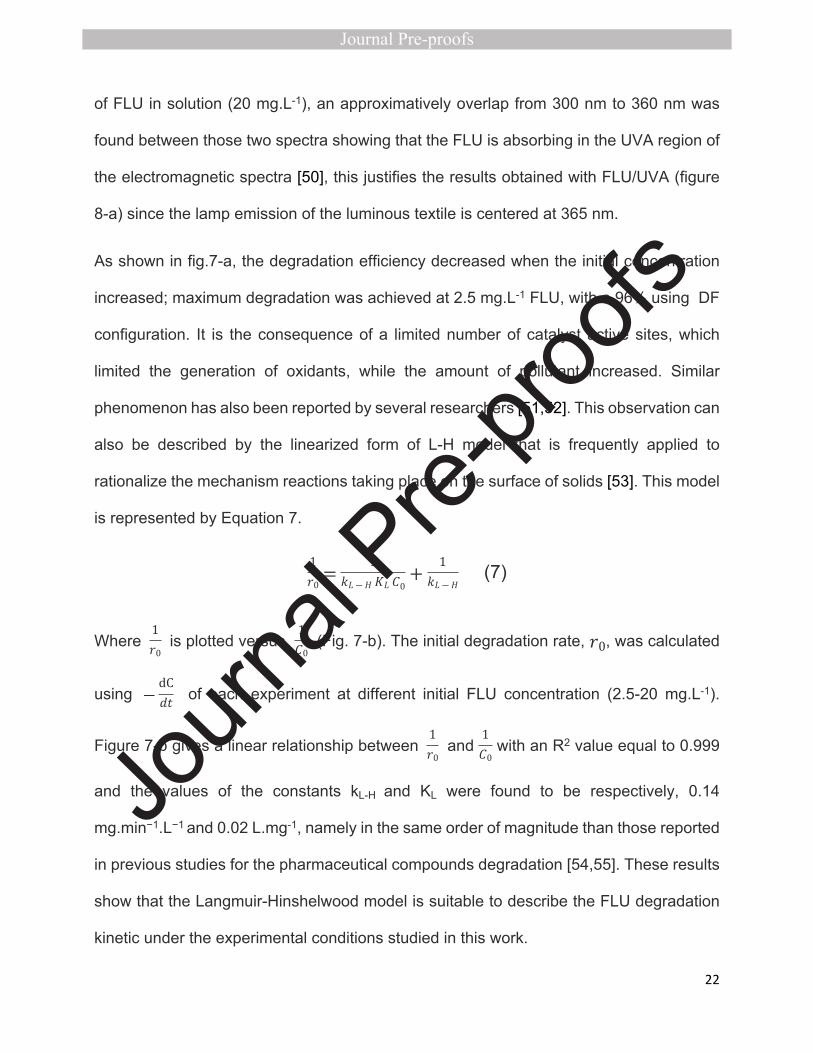
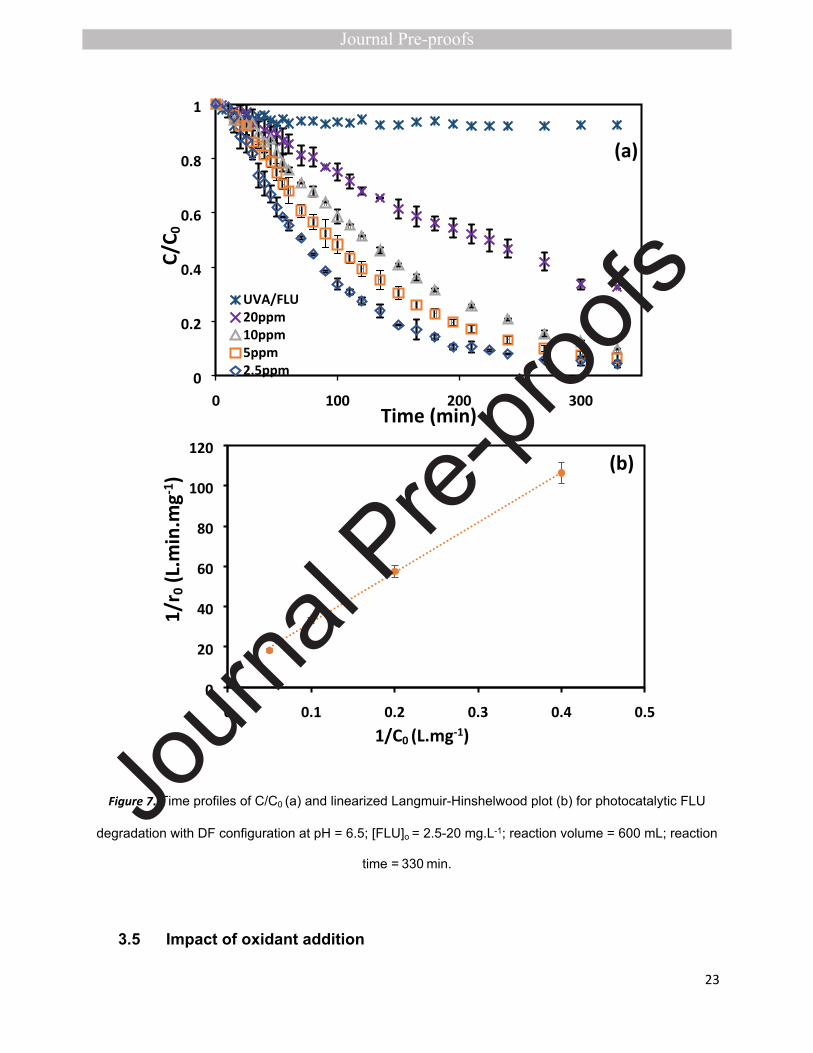
yields of the pollutant after 330 min irradiation are shown in Fig.7-a. Each experiment was
made in duplicate.
Photolysis experiment (UVA/FLU) was carried out using only UV radiation with the
luminous textile without TiO2 coating. After 330 min of UVA radiation, a low degradation
yield was obtained (around 8%). From one hand, it was proven that the FLU is prone to
degradation under UV radiation due to the presence of quinolone structure [48,49]. On
the other hand, other researchers have compered UV spectra and the absorption spectra
22
of FLU in solution (20 mg.L-1), an approximatively overlap from 300 nm to 360 nm was
found between those two spectra showing that the FLU is absorbing in the UVA region of
the electromagnetic spectra [50], this justifies the results obtained with FLU/UVA (figure
8-a) since the lamp emission of the luminous textile is centered at 365 nm.
As shown in fig.7-a, the degradation efficiency decreased when the initial concentration
increased; maximum degradation was achieved at 2.5 mg.L-1 FLU, with a 96% using DF
configuration. It is the consequence of a limited number of catalyst active sites, which
limited the generation of oxidants, while the amount of pollutant increased. Similar
phenomenon has also been reported by several researchers [51,52]. This observation can
also be described by the linearized form of L-H model that is frequently applied to
rationalize the mechanism reactions taking place on the surface of solids [53]. This model
is represented by Equation 7.
(7)1𝑟0
=1
𝑘𝐿 ― 𝐻 𝐾𝐿 𝐶0+
1𝑘𝐿 ― 𝐻
Where is plotted versus (Fig. 7-b). The initial degradation rate, , was calculated 1𝑟0
1
𝐶0 𝑟0
using of each experiment at different initial FLU concentration (2.5-20 mg.L-1). ― dC𝑑𝑡
Figure 7-b gives a linear relationship between and with an R2 value equal to 0.999 1𝑟0
1
𝐶0
and the values of the constants kL-H and KL were found to be respectively, 0.14
mg.min−1.L−1 and 0.02 L.mg-1, namely in the same order of magnitude than those reported
in previous studies for the pharmaceutical compounds degradation [54,55]. These results
show that the Langmuir-Hinshelwood model is suitable to describe the FLU degradation
kinetic under the experimental conditions studied in this work.
23
0
0.2
0.4
0.6
0.8
1
0 100 200 300
UVA/FLU 20ppm10ppm 5ppm 2.5ppm
Time (min)
C/C 0
(a)
0
20
40
60
80
100
120
0 0.1 0.2 0.3 0.4 0.51/C0 (L.mg-1)
1/r 0
(L.m
in.m
g-1)
(b)
Figure 7. Time profiles of C/C0 (a) and linearized Langmuir-Hinshelwood plot (b) for photocatalytic FLU
degradation with DF configuration at pH = 6.5; [FLU]o = 2.5-20 mg.L-1; reaction volume = 600 mL; reaction
time = 330 min.
3.5 Impact of oxidant addition
24
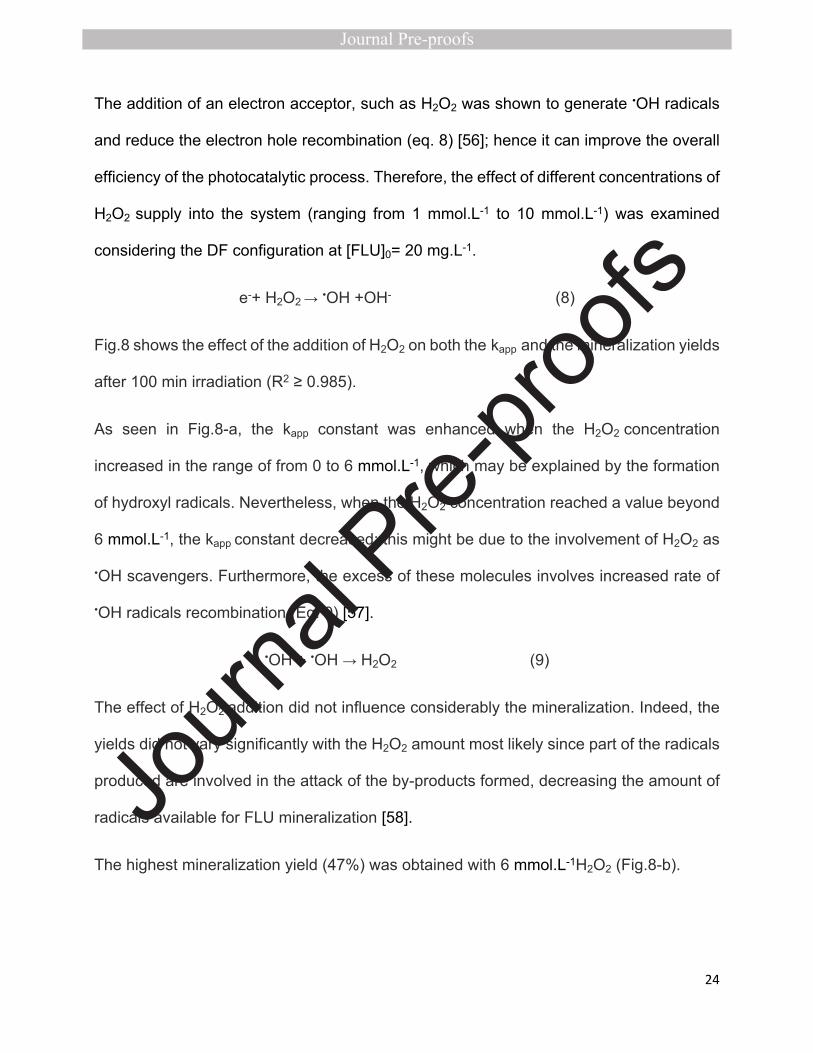
The addition of an electron acceptor, such as H2O2 was shown to generate •OH radicals
and reduce the electron hole recombination (eq. 8) [56]; hence it can improve the overall
efficiency of the photocatalytic process. Therefore, the effect of different concentrations of
H2O2 supply into the system (ranging from 1 mmol.L-1 to 10 mmol.L-1) was examined
considering the DF configuration at [FLU]0= 20 mg.L-1.
e-+ H2O2 → •OH +OH- (8)
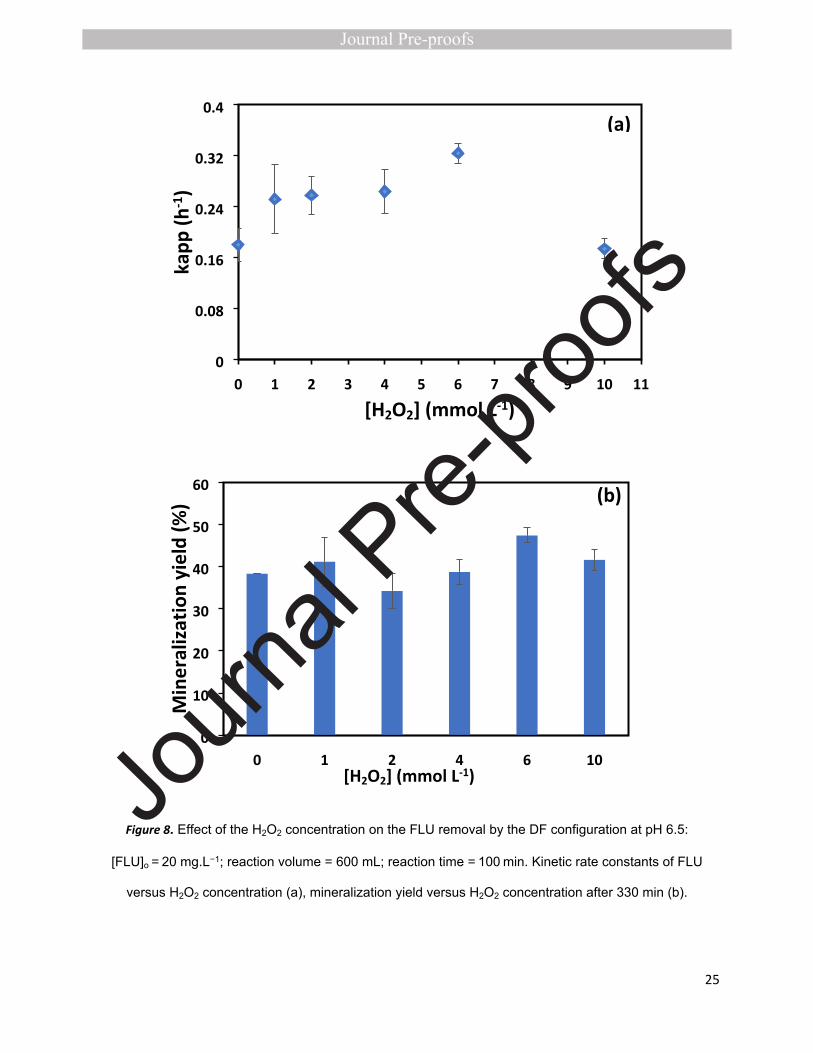
Fig.8 shows the effect of the addition of H2O2 on both the kapp and the mineralization yields
after 100 min irradiation (R2 ≥ 0.985).
As seen in Fig.8-a, the kapp constant was enhanced when the H2O2 concentration
increased in the range of from 0 to 6 mmol.L-1, which may be explained by the formation
of hydroxyl radicals. Nevertheless, when the H2O2 concentration reached a value beyond
6 mmol.L-1, the kapp constant decreased; this might be due to the involvement of H2O2 as
•OH scavengers. Furthermore, the excess of these molecules involves increased rate of
•OH radicals recombination (Eq. 9) [57].
•OH + •OH → H2O2 (9)
The effect of H2O2 addition did not influence considerably the mineralization. Indeed, the
yields did not vary significantly with the H2O2 amount most likely since part of the radicals
produced are involved in the attack of the by-products formed, decreasing the amount of
radicals available for FLU mineralization [58].
The highest mineralization yield (47%) was obtained with 6 mmol.L-1H2O2 (Fig.8-b).
25
0
0.08
0.16
0.24
0.32
0.4
0 1 2 3 4 5 6 7 8 9 10 11
[H2O2] (mmol L-1)
kapp
(h-1
)
(a)
0
10
20
30
40
50
60
0 1 2 4 6 10[H2O2] (mmol L-1)
Min
eral
izat
ion
yiel
d (%
) (b)
Figure 8. Effect of the H2O2 concentration on the FLU removal by the DF configuration at pH 6.5:
[FLU]o = 20 mg.L−1; reaction volume = 600 mL; reaction time = 100 min. Kinetic rate constants of FLU
versus H2O2 concentration (a), mineralization yield versus H2O2 concentration after 330 min (b).
13 experiments
26
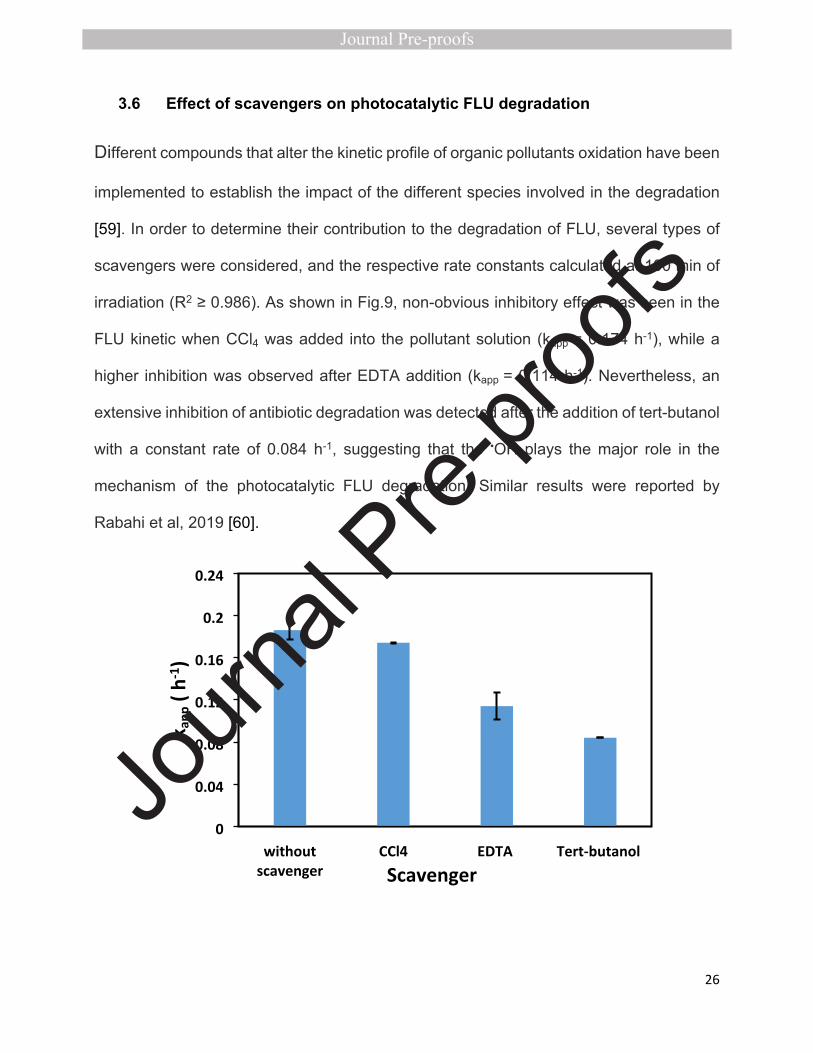
3.6 Effect of scavengers on photocatalytic FLU degradation
Different compounds that alter the kinetic profile of organic pollutants oxidation have been
implemented to establish the impact of the different species involved in the degradation
[59]. In order to determine their contribution to the degradation of FLU, several types of
scavengers were considered, and the respective rate constants calculated at 100 min of
irradiation (R2 ≥ 0.986). As shown in Fig.9, non-obvious inhibitory effect was seen in the
FLU kinetic when CCl4 was added into the pollutant solution (kapp = 0.174 h-1), while a
higher inhibition was observed after EDTA addition (kapp = 0.114 h-1). Nevertheless, an
extensive inhibition of antibiotic degradation was detected after the addition of tert-butanol
with a constant rate of 0.084 h-1, suggesting that the •OH plays the major role in the
mechanism of the photocatalytic FLU degradation. Similar results were reported by
Rabahi et al, 2019 [60].
0
0.04
0.08
0.12
0.16
0.2
0.24
without scavenger
CCl4 EDTA Tert-butanol
Scavenger
k app
( h-1
)
27
Figure 9. FLU kinetic rate constants versus scavengers for the DF configuration at : pH 6.5,
[FLU]o = 20mg.L-1; [Tert-butanol] = 50 mmol.L-1; [EDTA] = 120 mg.L-1; VCCl4= 60µL; reactional volume =
600 mL; reaction time=100 min.
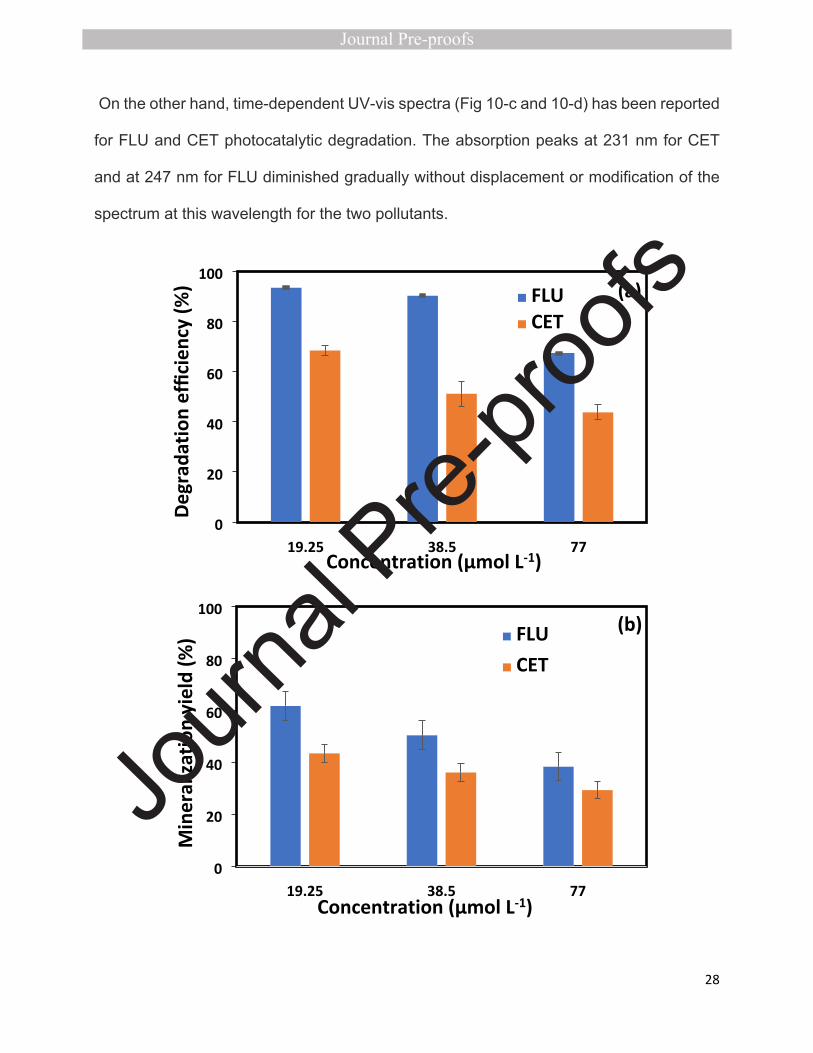
3.7 Comparative DF performance for elimination of FLU and CET
In order to evaluate the luminous textile performance, the effect of the initial CET
concentration (19.25- 77.00 μmol.L-1) was investigated. The degradation efficiency and
the mineralization yield results were also compared with those obtained with FLU under
the same conditions (Fig.10) (19.25-77 μmol.L-1 is the equivalent of 5–20 mg.L-1 of FLU).
According to our review of the literature, FLU and CET are two molecules that are not
found together in wastewater; the objective of this comparison was therefore to test the
DF performances on a molecule which is more complex than the FLU, and belongs to
another family (antihistamine). CET is commonly found in wastewater.
Degradation efficiency decreased from 68% to 44% and mineralization yield from 43% to
29% when CET concentration increased from 19.25 to 77.00 μmol.L−1 respectively. This
might be due to the augmentation in the number of CET molecules with increasing
concentration of pollutant, while the number of radical species remains constant, leading
to a reduction in the photocatalytic performances [61]. Moreover, it was clearly seen in
Fig.10-a and 10-b the higher photocatalytic performances regarding FLU compered to
CET. Indeed, FLU degradation and mineralization were 93% and 62% respectively,
whereas they were 68% and 43% for CET after 330 min of irradiation at 19.25 μmol.L-1.
The difference in degradation and mineralization of pollutants is probably due to the fact
that CET is more photo-stable than FLU [62,63].
13 experiments
28
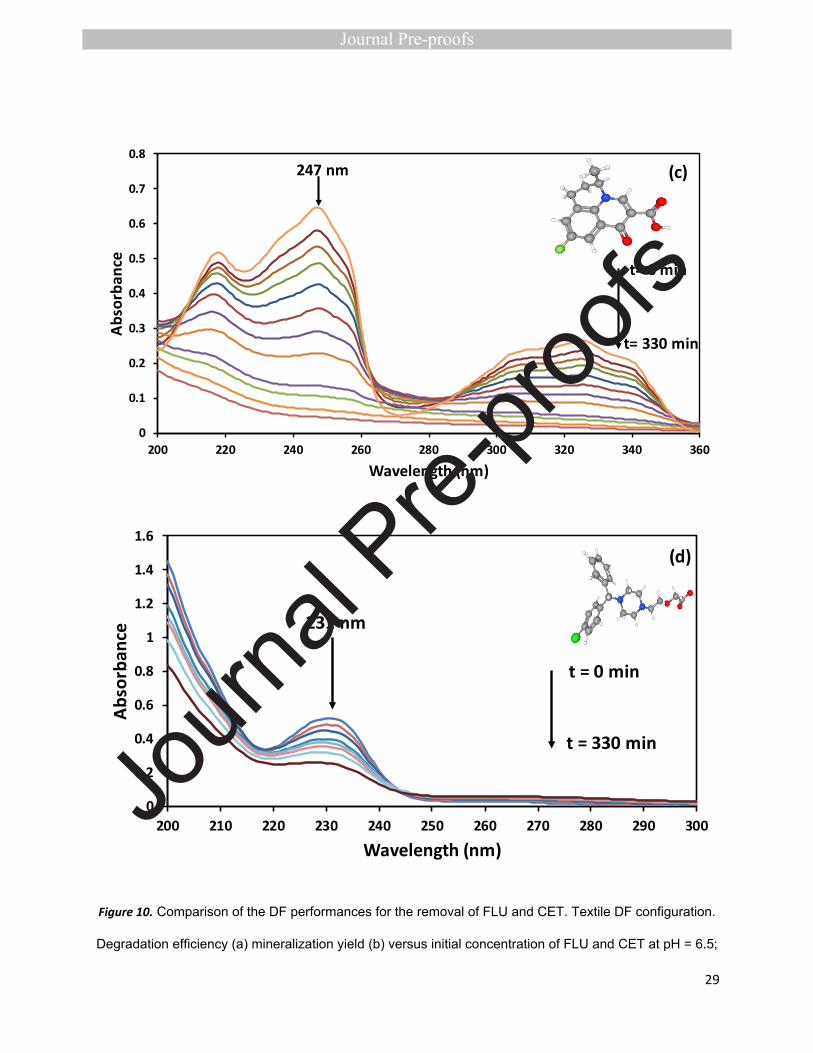
On the other hand, time-dependent UV-vis spectra (Fig 10-c and 10-d) has been reported
for FLU and CET photocatalytic degradation. The absorption peaks at 231 nm for CET
and at 247 nm for FLU diminished gradually without displacement or modification of the
spectrum at this wavelength for the two pollutants.
0
20
40
60
80
100
19.25 38.5 77
FLUCET
Concentration (μmol L-1)
Min
eral
izat
ion
yiel
d (%
)
(b)
0
20
40
60
80
100
19.25 38.5 77
FLUCET
Concentration (μmol L-1)
Degr
adat
ion
effic
ienc
y (%
) (a)
29
0
0.1
0.2
0.3
0.4
0.5
0.6
0.7
0.8
200 220 240 260 280 300 320 340 360
Abso
rban
ce
Wavelength (nm)
247 nm
t= 330 min
t= 0 min
(c)
0
0.2
0.4
0.6
0.8
1
1.2
1.4
1.6
200 210 220 230 240 250 260 270 280 290 300
Abso
rban
ce
Wavelength (nm)
231 nm
t = 0 min
(d)
t = 330 min
Figure 10. Comparison of the DF performances for the removal of FLU and CET. Textile DF configuration.
Degradation efficiency (a) mineralization yield (b) versus initial concentration of FLU and CET at pH = 6.5;
30
reaction volume = 600 mL; reaction time = 330 min. Time dependent UV–vis spectra of photocalalytic
degradation of FLU (c) and CET (d) at 38.5 μmol.L-1.
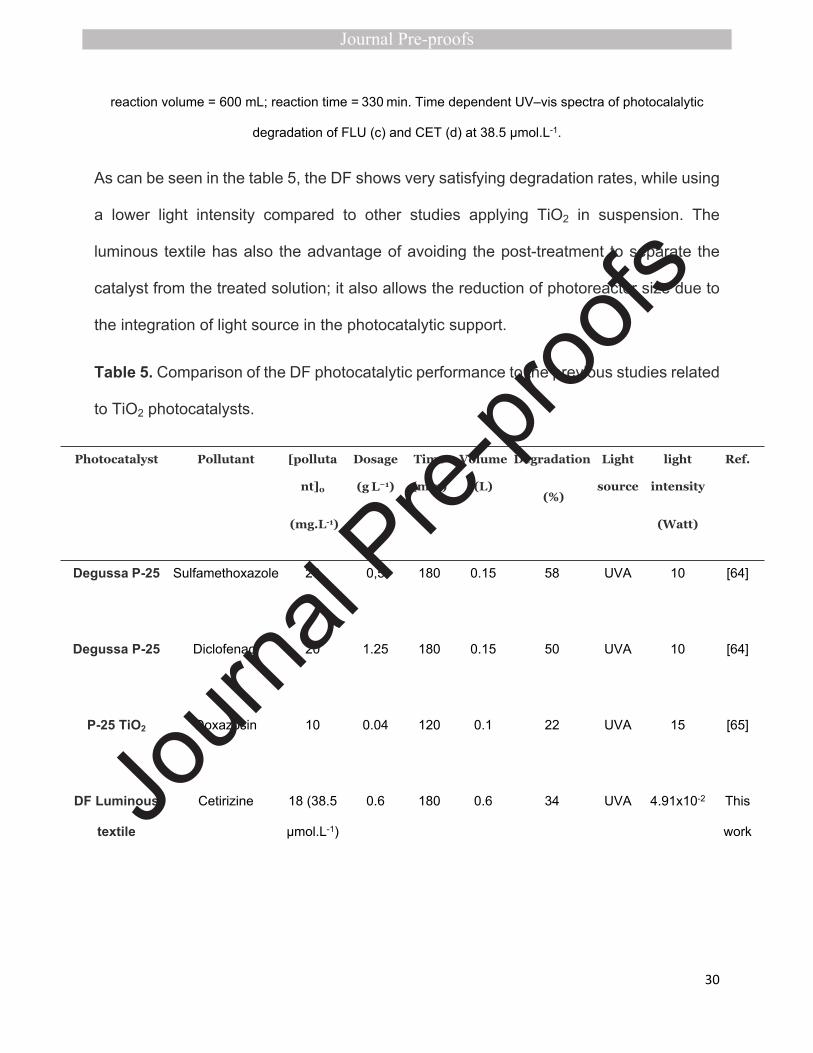
As can be seen in the table 5, the DF shows very satisfying degradation rates, while using
a lower light intensity compared to other studies applying TiO2 in suspension. The
luminous textile has also the advantage of avoiding the post-treatment to separate the
catalyst from the treated solution; it also allows the reduction of photoreactor size due to
the integration of light source in the photocatalytic support.
Table 5. Comparison of the DF photocatalytic performance to the previous studies related
to TiO2 photocatalysts.
Photocatalyst Pollutant [polluta
nt]0
(mg.L-1)
Dosage
(g L−1)
Time
(min)
Volume
(L)
Degradation
(%)
Light
source
light
intensity
(Watt)
Ref.
Degussa P-25 Sulfamethoxazole 20 0,5 180 0.15 58 UVA 10 [64]
Degussa P-25 Diclofenac 20 1.25 180 0.15 50 UVA 10 [64]
P-25 TiO2 Doxazosin 10 0.04 120 0.1 22 UVA 15 [65]
DF Luminous
textile
Cetirizine 18 (38.5
μmol.L-1)
0.6 180 0.6 34 UVA 4.91x10⁻² This
work
31
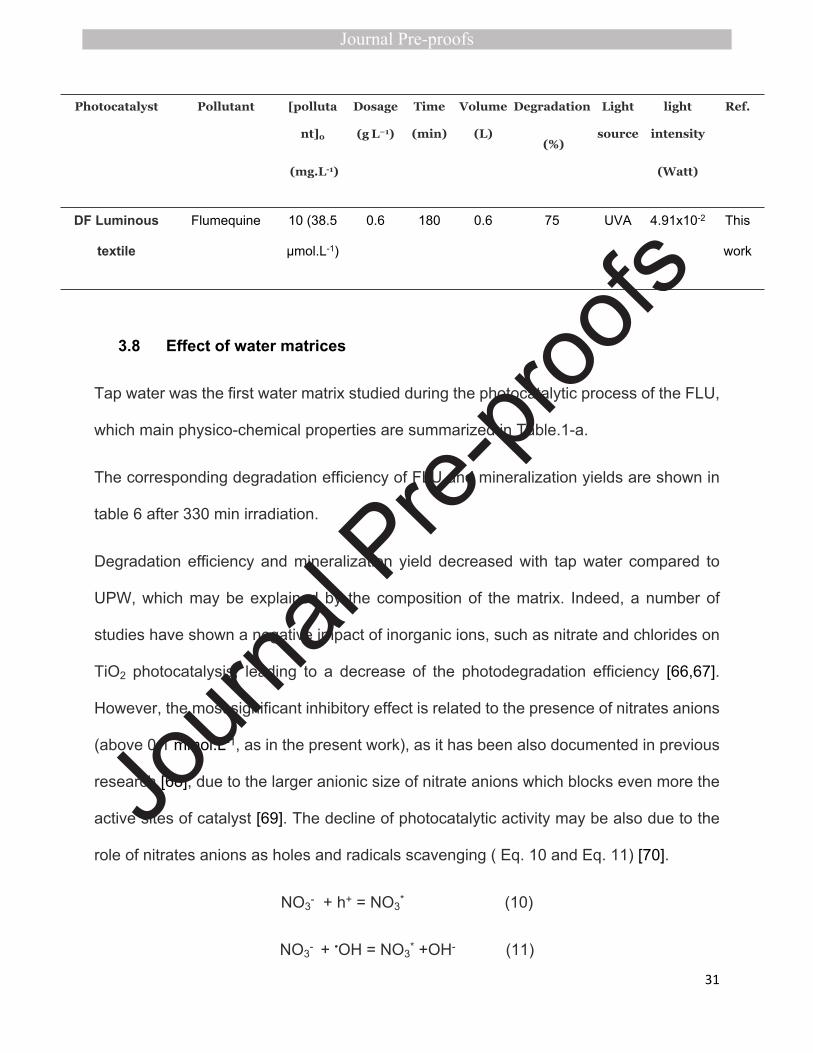
Photocatalyst Pollutant [polluta
nt]0
(mg.L-1)
Dosage
(g L−1)
Time
(min)
Volume
(L)
Degradation
(%)
Light
source
light
intensity
(Watt)
Ref.
DF Luminous
textile
Flumequine 10 (38.5
μmol.L-1)
0.6 180 0.6 75 UVA 4.91x10⁻² This
work
3.8 Effect of water matrices
Tap water was the first water matrix studied during the photocatalytic process of the FLU,
which main physico-chemical properties are summarized in Table.1-a.
The corresponding degradation efficiency of FLU and mineralization yields are shown in
table 6 after 330 min irradiation.
Degradation efficiency and mineralization yield decreased with tap water compared to
UPW, which may be explained by the composition of the matrix. Indeed, a number of
studies have shown a negative impact of inorganic ions, such as nitrate and chlorides on
TiO2 photocatalysis, leading to a decrease of the photodegradation efficiency [66,67].
However, the most significant inhibitory effect is related to the presence of nitrates anions
(above 0.1 mmol.L-1, as in the present work), as it has been also documented in previous
research [68], due to the larger anionic size of nitrate anions which blocks even more the
active sites of catalyst [69]. The decline of photocatalytic activity may be also due to the
role of nitrates anions as holes and radicals scavenging ( Eq. 10 and Eq. 11) [70].
NO3- + h+ = NO3* (10)
NO3- + •OH = NO3* +OH- (11)
32
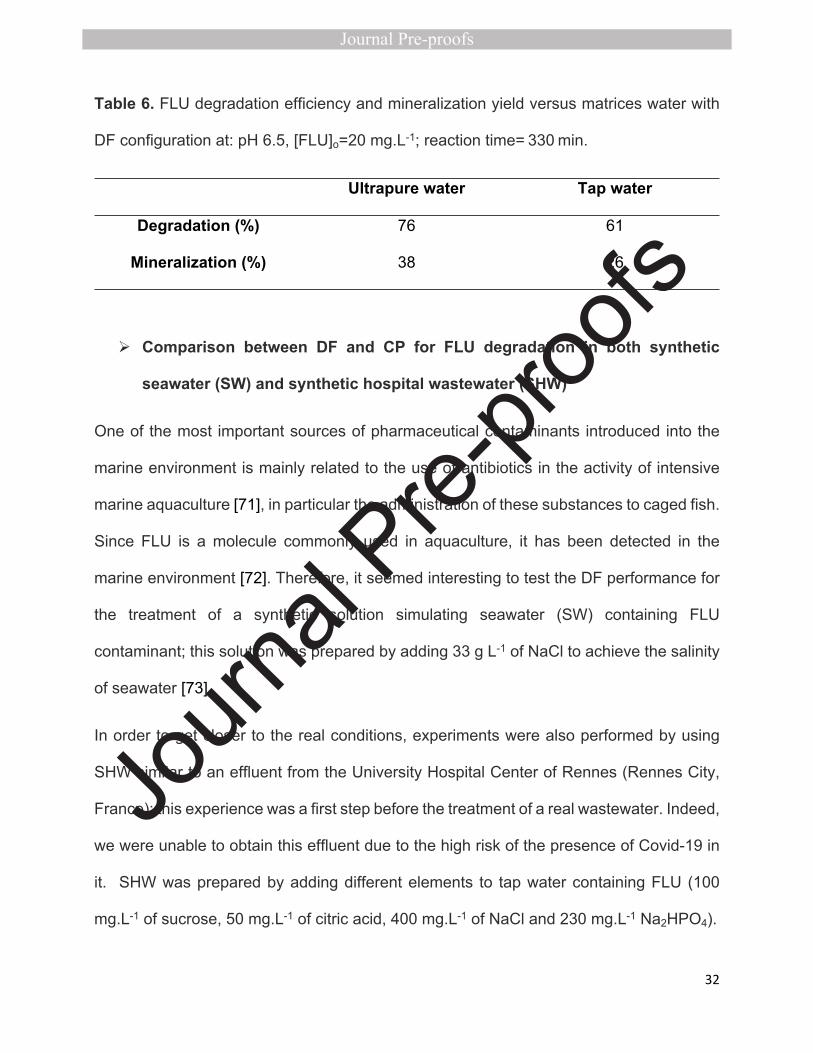
Table 6. FLU degradation efficiency and mineralization yield versus matrices water with
DF configuration at: pH 6.5, [FLU]o=20 mg.L-1; reaction time= 330 min.
Ultrapure water Tap water
Degradation (%) 76 61
Mineralization (%) 38 26
Comparison between DF and CP for FLU degradation in both synthetic
seawater (SW) and synthetic hospital wastewater (SHW)
One of the most important sources of pharmaceutical contaminants introduced into the
marine environment is mainly related to the use of antibiotics in the activity of intensive
marine aquaculture [71], in particular the administration of these substances to caged fish.
Since FLU is a molecule commonly used in aquaculture, it has been detected in the
marine environment [72]. Therefore, it seemed interesting to test the DF performance for
the treatment of a synthetic solution simulating seawater (SW) containing FLU
contaminant; this solution was prepared by adding 33 g L-1 of NaCl to achieve the salinity
of seawater [73].
In order to get closer to the real conditions, experiments were also performed by using
SHW similar to an effluent from the University Hospital Center of Rennes (Rennes City,
France); this experience was a first step before the treatment of a real wastewater. Indeed,
we were unable to obtain this effluent due to the high risk of the presence of Covid-19 in
it. SHW was prepared by adding different elements to tap water containing FLU (100
mg.L-1 of sucrose, 50 mg.L-1 of citric acid, 400 mg.L-1 of NaCl and 230 mg.L-1 Na2HPO4).
33
To compare the DF efficiency with the conventional process under similar conditions as
encountered in real effluents, we performed experiments on the DF and CP in different
water matrices (UPW, SW and SHW). The comparison between these two processes was
made in terms of FLU apparent quantum yield (Eq. 5) at 10 mg.L-1 (with R2 ≥ 0.997 for the
initial slope).
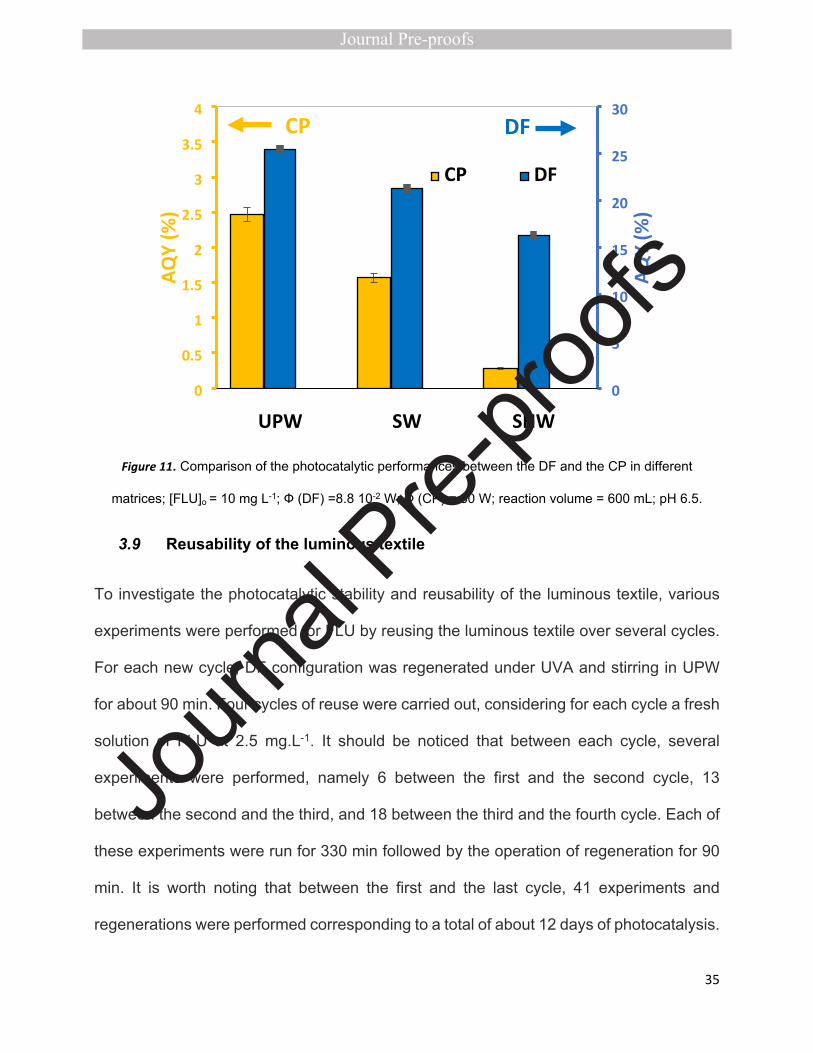
As can be seen in Fig.11, the DF was significantly more efficient over CP in all water
matrices studied, which confirmed the effectiveness of this technology. Fig.11 also shows
that for both catalysts (DF and CP) a lower value of the apparent quantum yield in the
simulated matrices (SW and SHW) were observed if compared to the apparent quantum
yields in UPW. Regarding the simulated seawater, SW, this could be explained by the low
solubility of oxygen due to the ionic strength of the reaction volume, and it also can be due
to the presence of chloride ions at a high concentration which act as scavengers of the
hole and the radical species responsible for the FLU degradation [74]. The mechanism of
scavenging by chloride ions was proposed by Matthews and McEnvoy (Eq. 12 and Eq.
13) [75].
Cl− + •OH = •Cl + OH− (12)
Cl− + h+ = •Cl (13)
However, the decrease was significantly more pronounced in SHW if compared to SW.
This decline may be due to the presence of inorganic ions (Table 1.b) in the SHW. In fact,
a number of studies have reported that the presence of salts causes photocatalytic
deactivation of TiO2 because they can be adsorbed on the surface of the catalyst, reducing
the contact between the pollutant and the TiO2 [76], their presence can also cause a
34
decrease in colloidal stability. Adding to this, inorganic ions such as those present in SHW
namely nitrates (Eq. 10 and Eq. 11), chlorides (Eq. 12 and Eq.13), phosphates (Eq. 14)
and sulfates (Eq. 15 and Eq. 16) can be scavengers of holes and hydroxyl groups [77,78].
•OH + HPO4 2− → HPO4−+ OH- (14)
•OH + SO4 2− → •SO4 2− (15)
h+ + SO4 2− → • SO4 2− (16)
Indeed in Fig.11, an almost total inhibition can be seen in the case of CP with a drop of
88% in the apparent quantum yield if compared to UPW; while in the case of the DF it was
only 36%. Moreover, in a previous study, a total inhibition of the FLU degradation rate was
noticed in a SHW with the same characteristics, by using nano-sized iron oxides (FeOx)
supported on polyester textile as catalyst [32].
35
0
0.5
1
1.5
2
2.5
3
3.5
4
0
5
10
15
20
25
30
UPW SW SHW
CP DFAQ
Y (%
)
AQY
(%)
DFCP
Figure 11. Comparison of the photocatalytic performances between the DF and the CP in different
matrices; [FLU]o = 10 mg L-1; Ф (DF) =8.8 10-2 W; Ф (CP) = 30 W; reaction volume = 600 mL; pH 6.5.
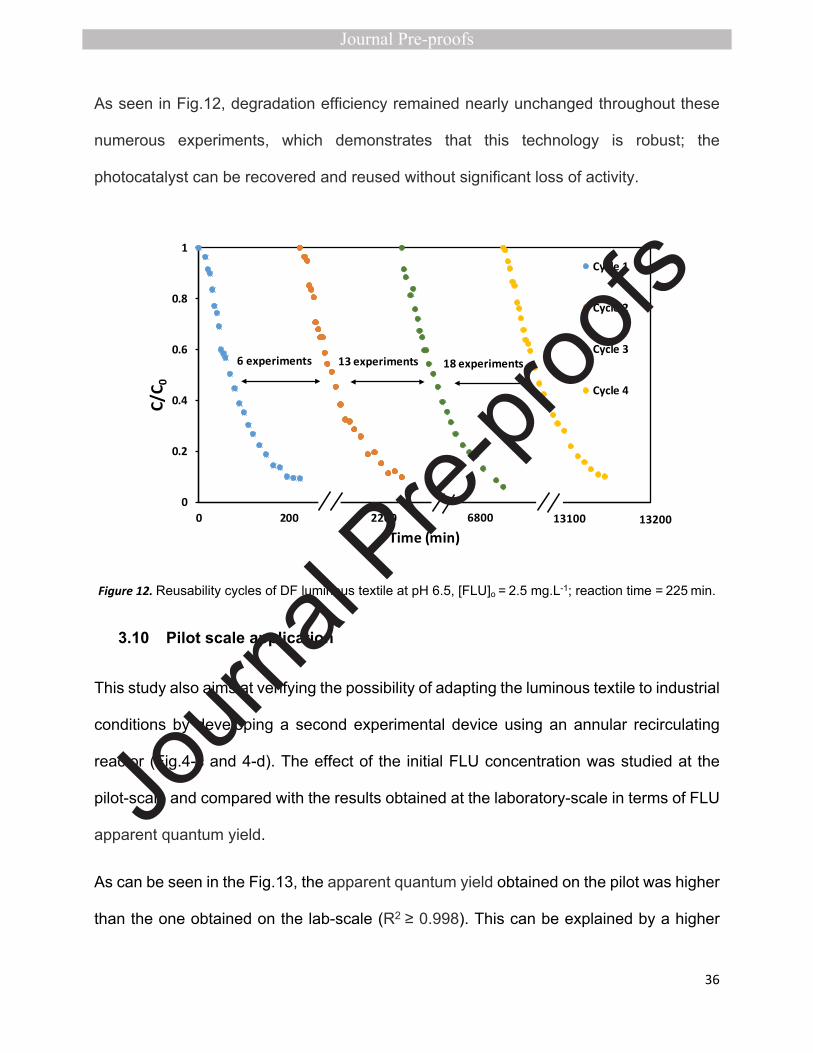
3.9 Reusability of the luminous textile
To investigate the photocatalytic stability and reusability of the luminous textile, various
experiments were performed for FLU by reusing the luminous textile over several cycles.
For each new cycle, DF configuration was regenerated under UVA and stirring in UPW
for about 90 min. Four cycles of reuse were carried out, considering for each cycle a fresh
solution of FLU at 2.5 mg.L-1. It should be noticed that between each cycle, several
experiments were performed, namely 6 between the first and the second cycle, 13
between the second and the third, and 18 between the third and the fourth cycle. Each of
these experiments were run for 330 min followed by the operation of regeneration for 90
min. It is worth noting that between the first and the last cycle, 41 experiments and
regenerations were performed corresponding to a total of about 12 days of photocatalysis.
36
As seen in Fig.12, degradation efficiency remained nearly unchanged throughout these
numerous experiments, which demonstrates that this technology is robust; the
photocatalyst can be recovered and reused without significant loss of activity.
0
0.2
0.4
0.6
0.8
1
0 200 400 600 800 1000
C/C 0
Time (min)
Cycle 1
Cycle 2
Cycle 3
Cycle 4
2200 6800 13100 13200
13 experiments 18 experiments 6 experiments
Figure 12. Reusability cycles of DF luminous textile at pH 6.5, [FLU]o = 2.5 mg.L-1; reaction time = 225 min.
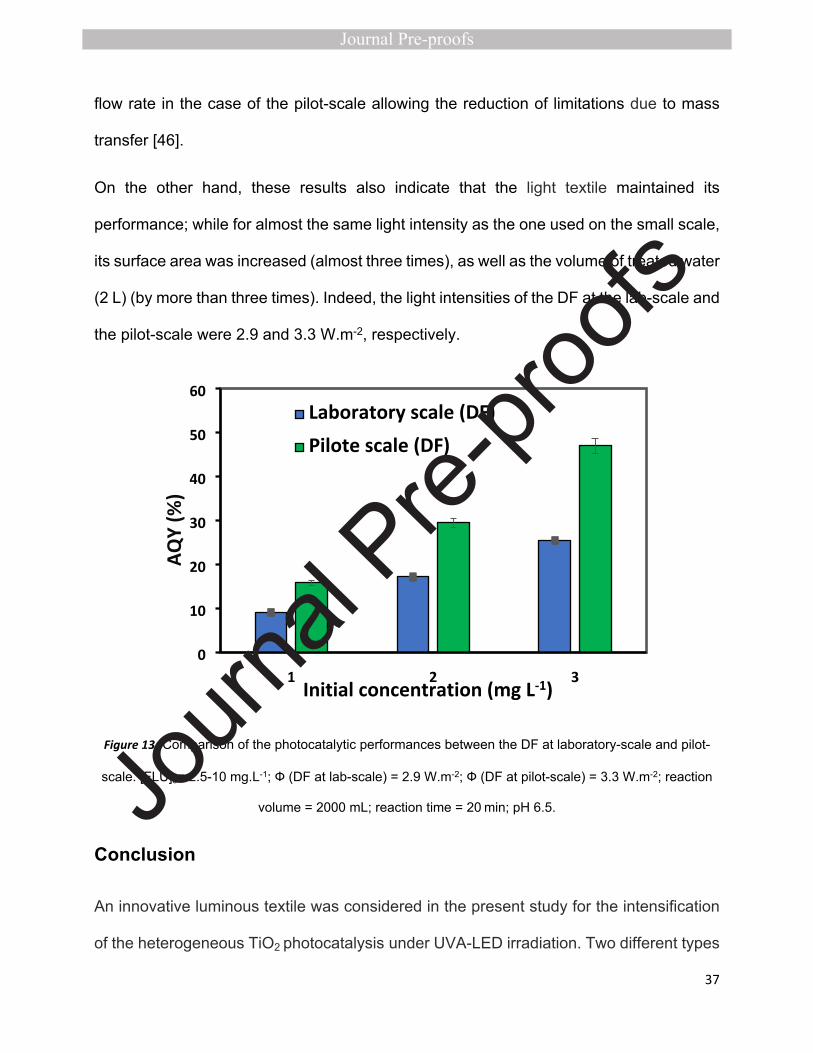
3.10 Pilot scale application
This study also aims at verifying the possibility of adapting the luminous textile to industrial
conditions by developing a second experimental device using an annular recirculating
reactor (Fig.4-c and 4-d). The effect of the initial FLU concentration was studied at the
pilot-scale and compared with the results obtained at the laboratory-scale in terms of FLU
apparent quantum yield.
As can be seen in the Fig.13, the apparent quantum yield obtained on the pilot was higher
than the one obtained on the lab-scale (R2 ≥ 0.998). This can be explained by a higher
37
flow rate in the case of the pilot-scale allowing the reduction of limitations due to mass
transfer [46].
On the other hand, these results also indicate that the light textile maintained its
performance; while for almost the same light intensity as the one used on the small scale,
its surface area was increased (almost three times), as well as the volume of treated water
(2 L) (by more than three times). Indeed, the light intensities of the DF at the lab-scale and
the pilot-scale were 2.9 and 3.3 W.m-2, respectively.
0
10
20
30
40
50
60
1 2 3
Laboratory scale (DF)Pilote scale (DF)
Initial concentration (mg L-1)
AQY
(%)
Figure 13. Comparison of the photocatalytic performances between the DF at laboratory-scale and pilot-
scale. [FLU]o= 2.5-10 mg.L-1; Ф (DF at lab-scale) = 2.9 W.m-2; Ф (DF at pilot-scale) = 3.3 W.m-2; reaction
volume = 2000 mL; reaction time = 20 min; pH 6.5.
Conclusion
An innovative luminous textile was considered in the present study for the intensification
of the heterogeneous TiO2 photocatalysis under UVA-LED irradiation. Two different types
38
of pharmaceutical compounds, flumequine (antibiotic) and cetirizine (antihistaminic), were
used in aqueous solution to evaluate the photocatalytic performances of the luminous
textile. After confirming that this technology was more efficient than the conventional
process, various parameters were examined on the textile showing a high degradation of
FLU at 2.5 mg.L-1 initial concentration (96%) with the double-face configuration. The
photocatalytic performances of this last configuration was better than that obtained with
the mono-face one in terms of FLU degradation and mineralization, with 93% and 62% for
5 mg.L-1 after 330min irradiation, respectively. These results were also compared with
those obtained for the elimination of CET, showing a lower efficiency for CET removal.
The presence of H2O2 improves the apparent kinetic constant (kapp) of FLU, and the
optimal H2O2 dosage was equal to 6 mmol.L-1. The photocatalytic activity of the luminous
textile did not decrease even after repeated uses, retaining its catalytic performance after
at least about 287 h of operation. Moreover, the textile showed better efficiency than the
cellulosic paper in the various water matrices studied and also maintained its performance
at the pilot-scale.
Overall, the outcome of the present work suggests that the luminous textile is an excellent
photocatalyst for the photocatalytic degradation process, improving the contact between
the light, the catalyst and the pollutant, as well as reducing the energy consumption by
using LED.
Acknowledgments
The authors are grateful to Sebastien Potel (UniLaSalle-Beauvais) for SEM-EDX
characterization, to Campus France through PROFAS B+ program for its financial support

39
in this collaborative project and to Brochier Technologies for providing the optical fiber
fabrics.
40
References
[1] G. Ghasemzadeh, M. Momenpour, F. Omidi, M.R. Hosseini, M. Ahani, A. Barzegari, Applications of
nanomaterials in water treatment and environmental remediation, Frontiers of Environmental
Science & Engineering. 8 (2014) 471–482. https://doi.org/10.1007/s11783-014-0654-0.
[2] L. Liu, Z. Liu, H. Bai, D.D. Sun, Concurrent filtration and solar photocatalytic disinfection/degradation
using high-performance Ag/TiO2 nanofiber membrane, Water Research. 46 (2012) 1101–1112.
https://doi.org/10.1016/j.watres.2011.12.009.
[3] M. Bilal, M. Adeel, T. Rasheed, Y. Zhao, H.M.N. Iqbal, Emerging contaminants of high concern and
their enzyme-assisted biodegradation – A review, Environment International. 124 (2019) 336–353.
https://doi.org/10.1016/j.envint.2019.01.011.
[4] T. Singh, N. Srivastava, P.K. Mishra, A.K. Bhatiya, N.L. Singh, Application of TiO2 Nanoparticle in
Photocatalytic Degradation of Organic Pollutants, MSF. 855 (2016) 20–32.
https://doi.org/10.4028/www.scientific.net/MSF.855.20.
[5] F. Yu, Y. Li, S. Han, J. Ma, Adsorptive removal of antibiotics from aqueous solution using carbon
materials, Chemosphere. 153 (2016) 365–385.
https://doi.org/10.1016/j.chemosphere.2016.03.083.
[6] K. Zare, V.K. Gupta, O. Moradi, A.S.H. Makhlouf, M. Sillanpää, M.N. Nadagouda, H. Sadegh, R.
Shahryari-ghoshekandi, A. Pal, Z. Wang, I. Tyagi, M. Kazemi, A comparative study on the basis of
adsorption capacity between CNTs and activated carbon as adsorbents for removal of noxious
synthetic dyes: a review, J Nanostruct Chem. 5 (2015) 227–236. https://doi.org/10.1007/s40097-
015-0158-x.
[7] I. Béchohra, A. Couvert, A. Amrane, Absorption and biodegradation of toluene: Optimization of its
initial concentration and the biodegradable non-aqueous phase liquid volume fraction, International
41
Biodeterioration & Biodegradation. 104 (2015) 350–355.
https://doi.org/10.1016/j.ibiod.2015.07.004.
[8] M. de Kwaadsteniet, P.H. Dobrowsky, A. van Deventer, W. Khan, T.E. Cloete, Domestic Rainwater
Harvesting: Microbial and Chemical Water Quality and Point-of-Use Treatment Systems, Water Air
Soil Pollut. 224 (2013) 1629. https://doi.org/10.1007/s11270-013-1629-7.
[9] R. Liang, J.C. Van Leuwen, L.M. Bragg, M.J. Arlos, L.C.M. Li Chun Fong, O.M. Schneider, I. Jaciw-
Zurakowsky, A. Fattahi, S. Rathod, P. Peng, M.R. Servos, Y.N. Zhou, Utilizing UV-LED pulse width
modulation on TiO2 advanced oxidation processes to enhance the decomposition efficiency of
pharmaceutical micropollutants, Chemical Engineering Journal. 361 (2019) 439–449.
https://doi.org/10.1016/j.cej.2018.12.065.
[10] M. Nasr, C. Eid, R. Habchi, P. Miele, M. Bechelany, Recent Progress on Titanium Dioxide
Nanomaterials for Photocatalytic Applications, ChemSusChem. 11 (2018) 3023–3047.
https://doi.org/10.1002/cssc.201800874.
[11] A. Carabin, P. Drogui, D. Robert, Photo-degradation of carbamazepine using TiO2 suspended
photocatalysts, Journal of the Taiwan Institute of Chemical Engineers. 54 (2015) 109–117.
https://doi.org/10.1016/j.jtice.2015.03.006.
[12] A. Patchaiyappan, S. Saran, S.P. Devipriya, Recovery and reuse of TiO2 photocatalyst from aqueous
suspension using plant based coagulant - A green approach, Korean J. Chem. Eng. 33 (2016) 2107–
2113. https://doi.org/10.1007/s11814-016-0059-9.
[13] W.M. Samhaber, M.T. Nguyen, Applicability and costs of nanofiltration in combination with
photocatalysis for the treatment of dye house effluents, Beilstein Journal of Nanotechnology. 5
(2014) 476–484. https://doi.org/10.3762/bjnano.5.55.
42
[14] P. Westerhoff, P. Alvarez, Q. Li, J. Gardea-Torresdey, J. Zimmerman, Overcoming implementation
barriers for nanotechnology in drinking water treatment, Environ. Sci.: Nano. 3 (2016) 1241–1253.
https://doi.org/10.1039/C6EN00183A.
[15] R. van Grieken, J. Marugán, C. Sordo, P. Martínez, C. Pablos, Photocatalytic inactivation of bacteria
in water using suspended and immobilized silver-TiO2, Applied Catalysis B: Environmental. 93 (2009)
112–118. https://doi.org/10.1016/j.apcatb.2009.09.019.
[16] R. Zhou, M.I. Guzman, CO2 Reduction under Periodic Illumination of ZnS, J. Phys. Chem. C. 118 (2014)
11649–11656. https://doi.org/10.1021/jp4126039.
[17] R. Zhou, M.I. Guzman, Photocatalytic Reduction of Fumarate to Succinate on ZnS Mineral Surfaces,
J. Phys. Chem. C. 120 (2016) 7349–7357. https://doi.org/10.1021/acs.jpcc.5b12380.
[18] R.E. Marinangeli, D.F. Ollis, Photoassisted heterogeneous catalysis with optical fibers: I. Isolated
single fiber, AIChE Journal. 23 (1977) 415–426. https://doi.org/10.1002/aic.690230403.
[19] A. Danion, J. Disdier, C. Guillard, N. Jaffrezic-Renault, Malic acid photocatalytic degradation using a
TiO2-coated optical fiber reactor, Journal of Photochemistry and Photobiology A: Chemistry. 190
(2007) 135–140. https://doi.org/10.1016/j.jphotochem.2007.03.022.
[20] A. Danion, J. Disdier, C. Guillard, O. Païssé, N. Jaffrezic-Renault, Photocatalytic degradation of
imidazolinone fungicide in TiO2-coated optical fiber reactor, Applied Catalysis B: Environmental. 62
(2006) 274–281. https://doi.org/10.1016/j.apcatb.2005.08.008.
[21] A. Danion, J. Disdier, C. Guillard, F. Abdelmalek, N. Jaffrezic-Renault, Characterization and study of a
single-TiO2-coated optical fiber reactor, Applied Catalysis B: Environmental. 52 (2004) 213–223.
https://doi.org/10.1016/j.apcatb.2004.04.005.
[22] P.-A. Bourgeois, E. Puzenat, L. Peruchon, F. Simonet, D. Chevalier, E. Deflin, C. Brochier, C. Guillard,
Characterization of a new photocatalytic textile for formaldehyde removal from indoor air, Applied
Catalysis B: Environmental. 128 (2012) 171–178. https://doi.org/10.1016/j.apcatb.2012.03.033.
43
[23] C. Indermühle, E. Puzenat, F. Simonet, L. Peruchon, C. Brochier, C. Guillard, Modelling of UV optical
ageing of optical fibre fabric coated with TiO2, Applied Catalysis B: Environmental. 182 (2016) 229–
235. https://doi.org/10.1016/j.apcatb.2015.09.037.
[24] M. Feng, L. Yan, X. Zhang, P. Sun, S. Yang, L. Wang, Z. Wang, Fast removal of the antibiotic flumequine
from aqueous solution by ozonation: Influencing factors, reaction pathways, and toxicity evaluation,
Science of The Total Environment. 541 (2016) 167–175.
https://doi.org/10.1016/j.scitotenv.2015.09.048.
[25] M. Feng, R. Qu, X. Zhang, P. Sun, Y. Sui, L. Wang, Z. Wang, Degradation of flumequine in aqueous
solution by persulfate activated with common methods and polyhydroquinone-coated
magnetite/multi-walled carbon nanotubes catalysts, Water Research. 85 (2015) 1–10.
https://doi.org/10.1016/j.watres.2015.08.011.
[26] J. Iqbal, N.S. Shah, M. Sayed, N. Muhammad, S.- Rehman, J.A. Khan, Z.U. Haq Khan, F.M. Howari, Y.
Nazzal, C. Xavier, S. Arshad, A. Hussein, K. Polychronopoulou, Deep eutectic solvent-mediated
synthesis of ceria nanoparticles with the enhanced yield for photocatalytic degradation of
flumequine under UV-C, Journal of Water Process Engineering. 33 (2020) 101012.
https://doi.org/10.1016/j.jwpe.2019.101012.
[27] A. Labella, M. Gennari, V. Ghidini, I. Trento, A. Manfrin, J.J. Borrego, M.M. Lleo, High incidence of
antibiotic multi-resistant bacteria in coastal areas dedicated to fish farming, Mar. Pollut. Bull. 70
(2013) 197–203. https://doi.org/10.1016/j.marpolbul.2013.02.037.
[28] J. Kosonen, L. Kronberg, The occurrence of antihistamines in sewage waters and in recipient rivers,
Environ Sci Pollut Res. 16 (2009) 555–564. https://doi.org/10.1007/s11356-009-0144-2.
[29] A. Bahlmann, J.J. Carvalho, M.G. Weller, U. Panne, R.J. Schneider, Immunoassays as high-throughput
tools: Monitoring spatial and temporal variations of carbamazepine, caffeine and cetirizine in surface
44
and wastewaters, Chemosphere. 89 (2012) 1278–1286.
https://doi.org/10.1016/j.chemosphere.2012.05.020.
[30] J. Fick, H. Söderström, R.H. Lindberg, C. Phan, M. Tysklind, D.G.J. Larsson, Contamination of surface,
ground, and drinking water from pharmaceutical production, Environmental Toxicology and
Chemistry. 28 (2009) 2522–2527. https://doi.org/10.1897/09-073.1.
[31] M. Teixeira, Â. Almeida, V. Calisto, V.I. Esteves, R.J. Schneider, F.J. Wrona, A.M.V.M. Soares, E.
Figueira, R. Freitas, Toxic effects of the antihistamine cetirizine in mussel Mytilus galloprovincialis,
Water Research. 114 (2017) 316–326. https://doi.org/10.1016/j.watres.2017.02.032.
[32] G.N. Coulibaly, S. Bae, J. Kim, A.A. Assadi, K. Hanna, Enhanced removal of antibiotics in hospital
wastewater by Fe–ZnO activated persulfate oxidation, Environ. Sci.: Water Res. Technol. 5 (2019)
2193–2201. https://doi.org/10.1039/C9EW00611G.
[33] C. BROCHIER, E. DEFLIN, T. BRETING, ILLUMINATING COMPLEX - ALSTOM TRANSPORT SA, WO
2008/062141, 2008. http://www.sumobrain.com/patents/wipo/Illuminating-
complex/WO2008061789.html (accessed September 8, 2019).
[34] M.A. Hoque, M.I. Guzman, Photocatalytic Activity: Experimental Features to Report in
Heterogeneous Photocatalysis, Materials. 11 (2018) 1990. https://doi.org/10.3390/ma11101990.
[35] W.A. Daoud, J.H. Xin, Y.-H. Zhang, Surface functionalization of cellulose fibers with titanium dioxide
nanoparticles and their combined bactericidal activities, Surface Science. 599 (2005) 69–75.
https://doi.org/10.1016/j.susc.2005.09.038.
[36] C. Indermühle, E. Puzenat, F. Dappozze, F. Simonet, L. Lamaa, L. Peruchon, C. Brochier, C. Guillard,
Photocatalytic activity of titania deposited on luminous textiles for water treatment, Journal of
Photochemistry and Photobiology A: Chemistry. 361 (2018) 67–75.
https://doi.org/10.1016/j.jphotochem.2018.04.047.
45
[37] N.J. Peill, M.R. Hoffmann, Development and Optimization of a TiO2-Coated Fiber-Optic Cable
Reactor: Photocatalytic Degradation of 4-Chlorophenol, Environ. Sci. Technol. 29 (1995) 2974–2981.
https://doi.org/10.1021/es00012a013.
[38] R.-D. Sun, A. Nakajima, I. Watanabe, T. Watanabe, K. Hashimoto, TiO2-coated optical fiber bundles
used as a photocatalytic filter for decomposition of gaseous organic compounds, Journal of
Photochemistry and Photobiology A: Chemistry. 136 (2000) 111–116.
https://doi.org/10.1016/S1010-6030(00)00330-0.
[39] A review of intensification of photocatalytic processes, Chemical Engineering and Processing: Process
Intensification. 46 (2007) 781–789. https://doi.org/10.1016/j.cep.2007.05.012.
[40] W. Choi, J.Y. Ko, H. Park, J.S. Chung, Investigation on TiO2-coated optical fibers for gas-phase
photocatalytic oxidation of acetone, Applied Catalysis B: Environmental. 31 (2001) 209–220.
https://doi.org/10.1016/S0926-3373(00)00281-2.
[41] P.-A. Bourgeois, E. Puzenat, L. Peruchon, F. Simonet, D. Chevalier, E. Deflin, C. Brochier, C. Guillard,
Characterization of a new photocatalytic textile for formaldehyde removal from indoor air, Applied
Catalysis B: Environmental. 128 (2012) 171–178. https://doi.org/10.1016/j.apcatb.2012.03.033.
[42] C.G. Hatchard, C.A. Parker, E.J. Bowen, A new sensitive chemical actinometer - II. Potassium
ferrioxalate as a standard chemical actinometer, Proceedings of the Royal Society of London. Series
A. Mathematical and Physical Sciences. 235 (1956) 518–536.
https://doi.org/10.1098/rspa.1956.0102.
[43] H. Yang, G. Li, T. An, Y. Gao, J. Fu, Photocatalytic degradation kinetics and mechanism of
environmental pharmaceuticals in aqueous suspension of TiO2: A case of sulfa drugs, Catalysis
Today. 153 (2010) 200–207. https://doi.org/10.1016/j.cattod.2010.02.068.
46
[44] M.E. Leblebici, J. Rongé, J.A. Martens, G.D. Stefanidis, T. Van Gerven, Computational modelling of a
photocatalytic UV-LED reactor with internal mass and photon transfer consideration, Chemical
Engineering Journal. 264 (2015) 962–970. https://doi.org/10.1016/j.cej.2014.12.013.
[45] Z. Khuzwayo, E.M.N. Chirwa, Modelling and simulation of photocatalytic oxidation mechanism of
chlorohalogenated substituted phenols in batch systems: Langmuir–Hinshelwood approach, Journal
of Hazardous Materials. 300 (2015) 459–466. https://doi.org/10.1016/j.jhazmat.2015.07.034.
[46] M. Gar Alalm, A. Tawfik, S. Ookawara, Solar photocatalytic degradation of phenol by TiO 2 /AC
prepared by temperature impregnation method, Desalination and Water Treatment. 57 (2016) 835–
844. https://doi.org/10.1080/19443994.2014.969319.
[47] J.E.A. Comer, 5.16 - Ionization Constants and Ionization Profiles, in: J.B. Taylor, D.J. Triggle (Eds.),
Comprehensive Medicinal Chemistry II, Elsevier, Oxford, 2007: pp. 357–397.
https://doi.org/10.1016/B0-08-045044-X/00133-4.
[48] H.-G. Guo, N.-Y. Gao, W.-H. Chu, L. Li, Y.-J. Zhang, J.-S. Gu, Y.-L. Gu, Photochemical degradation of
ciprofloxacin in UV and UV/H2O2 process: kinetics, parameters, and products, Environ Sci Pollut Res.
20 (2013) 3202–3213. https://doi.org/10.1007/s11356-012-1229-x.
[49] Y. Qi, R. Qu, J. Liu, J. Chen, G. Al-Basher, N. Alsultan, Z. Wang, Z. Huo, Oxidation of flumequine in
aqueous solution by UV-activated peroxymonosulfate: Kinetics, water matrix effects, degradation
products and reaction pathways, Chemosphere. 237 (2019) 124484.
https://doi.org/10.1016/j.chemosphere.2019.124484.
[50] C. Sirtori, A. Zapata, W. Gernjak, S. Malato, A. Agüera, Photolysis of flumequine: Identification of the
major phototransformation products and toxicity measures, Chemosphere. 88 (2012) 627–634.
https://doi.org/10.1016/j.chemosphere.2012.03.047.
47
[51] Y. Chen, K. Liu, Preparation and characterization of nitrogen-doped TiO2/diatomite integrated
photocatalytic pellet for the adsorption-degradation of tetracycline hydrochloride using visible light,
Chemical Engineering Journal. 302 (2016) 682–696. https://doi.org/10.1016/j.cej.2016.05.108.
[52] M. Dou, J. Wang, B. Gao, C. Xu, F. Yang, Photocatalytic difference of amoxicillin and cefotaxime under
visible light by mesoporous g-C3N4: Mechanism, degradation pathway and DFT calculation, Chemical
Engineering Journal. 383 (2020) 123134. https://doi.org/10.1016/j.cej.2019.123134.
[53] K.V. Kumar, K. Porkodi, F. Rocha, Langmuir–Hinshelwood kinetics – A theoretical study, Catalysis
Communications. 9 (2008) 82–84. https://doi.org/10.1016/j.catcom.2007.05.019.
[54] H. Yang, G. Li, T. An, Y. Gao, J. Fu, Photocatalytic degradation kinetics and mechanism of
environmental pharmaceuticals in aqueous suspension of TiO2: A case of sulfa drugs, Catalysis
Today. 153 (2010) 200–207. https://doi.org/10.1016/j.cattod.2010.02.068.
[55] D. D, R. I, F. Z, X. Np, V. D, M. D, Degradation, mineralization and antibiotic inactivation of amoxicillin
by UV-A/TiO₂ photocatalysis., J Environ Manage. 98 (2012) 168–174.
https://doi.org/10.1016/j.jenvman.2012.01.010.
[56] Z. Liu, X. Sheng, D. Wang, X. Feng, Efficient Hydrogen Peroxide Generation Utilizing Photocatalytic
Oxygen Reduction at a Triphase Interface, IScience. 17 (2019) 67–73.
https://doi.org/10.1016/j.isci.2019.06.023.
[57] H. Hayashi, S. Akamine, R. Ichiki, S. Kanazawa, Comparison of OH Radical Concentration Generated
by Underwater Discharge Using Two Methods, (2016) 5.
[58] A.M. Díez, F.C. Moreira, B.A. Marinho, J.C.A. Espíndola, L.O. Paulista, M.A. Sanromán, M. Pazos,
R.A.R. Boaventura, V.J.P. Vilar, A step forward in heterogeneous photocatalysis: Process
intensification by using a static mixer as catalyst support, Chemical Engineering Journal. 343 (2018)
597–606. https://doi.org/10.1016/j.cej.2018.03.041.
48
[59] J. Trawiński, R. Skibiński, Rapid degradation of clozapine by heterogeneous photocatalysis.
Comparison with direct photolysis, kinetics, identification of transformation products and scavenger
study, Science of The Total Environment. 665 (2019) 557–567.
https://doi.org/10.1016/j.scitotenv.2019.02.124.
[60] A Rabahi, AA Assadi, N Nasrallah, A Bouzaza, R Maachi, D Wolbert, Photocatalytic treatment of
petroleum industry wastewater using recirculating annular reactor: comparison of experimental and
modeling, Environmental Science and Pollution Research 26 (2019) 19035-19046.
[61] M Kamagate, AA Assadi, T Kone, S Giraudet, L Coulibaly, K Hanna, Use of laterite as a sustainable
catalyst for removal of fluoroquinolone antibiotics from contaminated water , Chemosphere 195
(2018) 847-853
[62] M. Paczkowska, M. Mizera, K. Lewandowska, M. Kozak, A. Miklaszewski, J. Cielecka-Piontek, Effects
of inclusion of cetirizine hydrochloride in β-cyclodextrin, J Incl Phenom Macrocycl Chem. 91 (2018)
149–159. https://doi.org/10.1007/s10847-018-0808-y.
[63] F. Vargas, C. Rivas, Mechanistic Studies on Phototoxicity Induced by Antibacterial Quinolones, Toxic
Substance Mechanisms. 16 (1997) 81–86. https://doi.org/10.1080/107691897229810.
[64] M.R. Eskandarian, H. Choi, M. Fazli, M.H. Rasoulifard, Effect of UV-LED wavelengths on direct
photolytic and TiO2 photocatalytic degradation of emerging contaminants in water, Chemical
Engineering Journal. 300 (2016) 414–422. https://doi.org/10.1016/j.cej.2016.05.049.
[65] I.T. Bujak, M.B. Kralj, D.S. Kosyakov, N.V. Ul’yanovskii, A.T. Lebedev, P. Trebše, Photolytic and
photocatalytic degradation of doxazosin in aqueous solution, Science of The Total Environment. 740
(2020) 140131. https://doi.org/10.1016/j.scitotenv.2020.140131.
[66] A Abou Dalle, L Domergue, F Fourcade, AA Assadi, H Djelal, T Lendormi, Soutrel I., Taha S., Amrane
A.,Efficiency of DMSO as hydroxyl radical probe in an Electrochemical Advanced Oxidation Process−
49
Reactive oxygen species monitoring and impact of the current density, Electrochimica Acta 246
(2017) 1-8.
[67] K. Wang, J. Zhang, L. Lou, S. Yang, Y. Chen, UV or visible light induced photodegradation of AO7 on
TiO2 particles: the influence of inorganic anions, Journal of Photochemistry and Photobiology A:
Chemistry. 165 (2004) 201–207. https://doi.org/10.1016/j.jphotochem.2004.03.025.
[68] A.M. Dugandžić, A.V. Tomašević, M.M. Radišić, N.Ž. Šekuljica, D.Ž. Mijin, S.D. Petrović, Effect of
inorganic ions, photosensitisers and scavengers on the photocatalytic degradation of nicosulfuron,
Journal of Photochemistry and Photobiology A: Chemistry. 336 (2017) 146–155.
https://doi.org/10.1016/j.jphotochem.2016.12.031.
[69] W. Chen, J. Xu, S. Lu, W. Jiao, L. Wu, A.C. Chang, Fates and transport of PPCPs in soil receiving
reclaimed water irrigation, Chemosphere. 93 (2013) 2621–2630.
https://doi.org/10.1016/j.chemosphere.2013.09.088.
[70] B. Chládková, E. Evgenidou, L. Kvítek, A. Panáček, R. Zbořil, P. Kovář, D. Lambropoulou, Adsorption
and photocatalysis of nanocrystalline TiO2 particles for Reactive Red 195 removal: effect of humic
acids, anions and scavengers, Environ Sci Pollut Res. 22 (2015) 16514–16524.
https://doi.org/10.1007/s11356-015-4806-y.
[71] P.J.G. Henriksson, A. Rico, M. Troell, D.H. Klinger, A.H. Buschmann, S. Saksida, M.V. Chadag, W.
Zhang, Unpacking factors influencing antimicrobial use in global aquaculture and their implication
for management: a review from a systems perspective, Sustain Sci. 13 (2018) 1105–1120.
https://doi.org/10.1007/s11625-017-0511-8.
[72] B. González-Gaya, L. Cherta, L. Nozal, A. Rico, An optimized sample treatment method for the
determination of antibiotics in seawater, marine sediments and biological samples using LC-TOF/MS,
Science of The Total Environment. 643 (2018) 994–1004.
https://doi.org/10.1016/j.scitotenv.2018.06.079.
50
[73] L.M. Pastrana-Martínez, S. Morales-Torres, J.L. Figueiredo, J.L. Faria, A.M.T. Silva, Graphene oxide
based ultrafiltration membranes for photocatalytic degradation of organic pollutants in salty water,
Water Research. 77 (2015) 179–190. https://doi.org/10.1016/j.watres.2015.03.014.
[74] S. Yang, Y. Chen, L. Lou, X. Wu, Involvement of chloride anion in photocatalytic process, Journal of
Environmental Sciences. 17 (2005) 761–765.
[75] R.W. Matthews, S.R. McEvoy, A comparison of 254 nm and 350 nm excitation of TiO2 in simple
photocatalytic reactors, Journal of Photochemistry and Photobiology A: Chemistry. 66 (1992) 355–
366. https://doi.org/10.1016/1010-6030(92)80008-J.
[76] D.L. Liao, C.A. Badour, B.Q. Liao, Preparation of nanosized TiO2/ZnO composite catalyst and its
photocatalytic activity for degradation of methyl orange, Journal of Photochemistry and
Photobiology A: Chemistry. 194 (2008) 11–19. https://doi.org/10.1016/j.jphotochem.2007.07.008.
[77] M. Golshan, B. Kakavandi, M. Ahmadi, M. Azizi, Photocatalytic activation of peroxymonosulfate by
TiO2 anchored on cupper ferrite (TiO2@CuFe2O4) into 2,4-D degradation: Process feasibility,
mechanism and pathway, Journal of Hazardous Materials. 359 (2018) 325–337.
https://doi.org/10.1016/j.jhazmat.2018.06.069.
[78] J. Li, M. Xu, G. Yao, B. Lai, Enhancement of the degradation of atrazine through CoFe2O4 activated
peroxymonosulfate (PMS) process: Kinetic, degradation intermediates, and toxicity evaluation,
Chemical Engineering Journal. 348 (2018) 1012–1024. https://doi.org/10.1016/j.cej.2018.05.032.
Highlights
TiO2 on Luminous textile was tested for pharmaceutical compounds removal.
Intensification of degradation efficiency was investigated with adding H2O2.
TiO2 on Luminous textile showed better performances in the different water
matrices

51
Even at pilot-scale, the light fabric showed a satisfactory stability and reusability.