Embed Size (px)
Citation preview
InSAR data as a field guide for mapping minor earthquake surfaceruptures: Ground displacements along the Paganica Faultduring the 6 April 2009 L’Aquila earthquake
L. Guerrieri,1 G. Baer,2 Y. Hamiel,2 R. Amit,2 A. M. Blumetti,1 V. Comerci,1
P. Di Manna,1 A. M. Michetti,3 A. Salamon,2 A. Mushkin,2 G. Sileo,3 and E. Vittori1
Received 22 March 2010; revised 2 September 2010; accepted 23 September 2010; published 30 December 2010.
[1] On 6 April 2009, a moderate earthquake (Mw = 6.3;Ml = 5.8) struck the Abruzzo regionin central Italy, causing more than 300 fatalities and heavy damage to L’Aquila andsurrounding villages. Coseismic surface effects have been thoroughly documented by timelyfield surveys as well as by remote sensing analyses of satellite images. The outstandingquality of geological, seismological, geodetic, and interferometric synthetic aperture radar(InSAR) information arguably represents the best ever data set made available immediatelyafter a moderate seismic event. Based on this data set, we aim at testing the capabilityof coupled geological and InSAR data to map surface faulting patterns associated withmoderate earthquakes. Coseismic ground ruptures have been mapped at a scale of 1:500 inthe whole epicentral area. Traces of surface ruptures have been inferred from linear phasediscontinuities identified in the interferogram. A very good agreement between the twomethods resulted in the characterization of the main surface rupture along the Paganica fault.The same approach applied to ground ruptures hypothesized along other capable faultsegments providedmore questionable results. Thus, the combined field and InSAR approachappeared useful for detecting continuous surface ruptures exceeding 1 km in length andshowing displacements greater than a few centimeters. These are the typical faultingparameters for moderate earthquakes (6.0 <Mw < 6.5) in central Apennines. For continuousground cracks shorter than a few hundred meters and/or that show displacements smallerthan 1–2 cm, the described approach may be less helpful, most probably due to the limitedresolution of the data.
Citation: Guerrieri, L., et al. (2010), InSAR data as a field guide for mapping minor earthquake surface ruptures: Grounddisplacements along the Paganica Fault during the 6 April 2009 L’Aquila earthquake, J. Geophys. Res., 115, B12331,doi:10.1029/2010JB007579.
1. Introduction
[2] The use of interferometric synthetic aperture radar(InSAR) maps as a guide to field work, particularly formoderate earthquakes and small‐scale fault ruptures has beenexplored only in a very limited number of cases [e.g., Priceand Sandwell, 1998; Baer et al., 2008]. This paper aims attesting the effective capability of a coupled geological (basedon immediate and accurate postseismic field mapping) andInSAR studies to detect and analyze surface faulting associ-ated with moderate seismic events such as the 6 April 2009
Mw 6.3 L’Aquila earthquake [e.g., Chiarabba et al., 2009;Walters et al., 2009; Wilkinson et al., 2010].[3] To this end, a joint team composed by the Geological
Surveys of Italy and Israel and the University of Insubriaconducted specific field surveys and precise InSAR analysisof the epicentral area. Clearly, in this case the field surveypreceded the InSAR measurements due to the immediatelyavailable epicentral location and the good accessibility of thearea that allowed surveying the territory already in the firsthours after the event, long before the first postearthquakeradar satellite images were acquired. Nevertheless, the sen-sitivity of InSAR to displacements in the satellite to groundline of sight (LOS) is such that even very minor surfaceruptures show up in the general deformation fringe pattern,confirming (or not) suspected fault reactivations and con-tributing to the better understanding of the coseismic events.[4] Moderate magnitude normal faulting earthquakes
associated with small surface fault displacement are typicalseismic events in the extensional tectonic setting of theApennines in Italy [e.g.,Michetti et al., 2000]. The L’Aquila
1Geological Survey of Italy, High Institute for the EnvironmentalProtection and Research, Rome, Italy.
2Geological Survey of Israel, Jerusalem, Israel.3Dipartimento di Scienze Chimiche ed Ambientali, Facoltà di Scienze
Matematiche, Fisiche e Naturali, Università degli Studi dell’Insubria,Como, Italy.
Copyright 2010 by the American Geophysical Union.0148‐0227/10/2010JB007579
JOURNAL OF GEOPHYSICAL RESEARCH, VOL. 115, B12331, doi:10.1029/2010JB007579, 2010
B12331 1 of 16
event (Ml 5.8, Mw 6.3, hypocentral depth 9 km) occurred on6 April 2009 at 0132 GMT: the epicenter was located verynear the historical downtown of L’Aquila (Figure 1), whichwas severely damaged together with many villages in thesurroundings. The death toll was of more than 300 casualties.Two M > 5.0 shocks followed on 7 April (Ml = 5.3; epicenternot far from Fossa, about 10 km southeast of L’Aquila) andon 9 April (Ml = 5.1; epicenter near Campotosto, about 15 kmnorthwest of L’Aquila).[5] The seismic sequence lasted for several months with
M > 4 events even in October 2009, affecting a ∼40 kmlong NW trending zone mostly coinciding with the MiddleAterno River Valley [Chiarabba et al., 2009]. The focalplane solutions clearly define NW trending normal sourcemechanisms, in good agreement with the tectonic setting ofthe region, characterized by tectonic valleys and mountainchains bounded by NW trending capable normal faults [e.g.,Blumetti and Guerrieri, 2007]. The focal depths are generallywithin 10–12 km, but the 7 April event was slightly anoma-lous in terms of focal depth (about 15 km) and focal mech-anism (having a significant strike‐slip component). Whilemost of the main events appear to have occurred on SWdipping planes, the few aftershocks referable to the 7 Aprilevent do not yet define a preferred nodal plane for the rupture,leaving for the moment a question mark on its source.[6] The scenario of damages to buildings compiled by the
Quick Earthquake Survey Team (QUEST) [Galli et al., 2009]shows a maximum intensity of IX MCS with a preferredpropagation toward southeast from the epicenter and a veryirregular pattern. This depends basically on the evolvingbuilding practices from masonry to concrete frame (mostconstructions postdate the XVII century, after the destruc-tive 2 February 1703 earthquake, I° = X MCS) and the localgeology, dominated by a valley floor filled by Quaternarylacustrine and alluvial deposits, and steep mountain slopes.In particular, the highest macroseismic intensity values(Intensity ≥ IX MCS) have occurred in isolated localitieswithin areas characterized by a lower level of damages(Intensity ≤ VIII MCS). These peaks of intensity appear tohave been caused by a peculiar seismic vulnerability, asso-ciated in some cases with evident site effects (e.g., Onnaand other villages located on the soft alluvial and lake sedi-ments of the Middle Aterno River Valley).
[7] Several teams of geologists began surveys in the hitarea on the very day of the main shock, looking for evi-dence of seismogenic environmental effects, especially sur-face rupturing whose first hint was given by the rupture ofthe Gran Sasso Aqueduct across the Paganica Fault (see theGeological Sheet “L’Aquila” [Servizio Geologico d’Italia,2006]). Immediate investigations along this fault identifiedclear evidence of reactivation, in the form of ground cracks,sometimes displaying a modest vertical offset, only occa-sionally exceeding 8–10 cm, aligned almost continuously ina narrow belt at least 2.6 km long. The estimate of the totalsurface rupture length ranges from about 3 to 19 kmaccording to different authors [Blumetti et al., 2009; EmergeoWorking Group, 2010; Falcucci et al., 2009; Galli et al.,2009; Roberts et al., 2010; E. Vittori et al., Surface faultingof the April 6, 2009, Mw 6.3 L’Aquila earthquake in centralItaly, submitted to Bulletin of the Seismological Society ofAmerica, 2010]. Other authors interpreted the observedground cracks as secondary phenomena indirectly connectedto the causative earthquake source fault at depth [e.g.,Valensise, 2009]. This uncertainty in the actual dimensionsand geometry of the tectonic surface ruptures was one of themain motivations for our study.[8] Synthetic aperture radar (SAR) data were distributed by
the European Space Agency (ESA) a few days after the mainshock. Published InSAR results revealed with increasingclarity the amount and extent of the deformation and con-firmed the location of the main fault rupture and the area ofmaximal subsidence [Atzori et al., 2009;Walters et al., 2009].While most of the published models agree with the generalpattern of deformation, they provided ambiguous resultsregarding the upward extension of the surface slip along thefault. This is typical for moderate earthquakes (Mw around 6)particularly when surface deformation and displacements aretoo small for unequivocal source parameter inversion [e.g.,Vittori et al., 2000; Salvi et al., 2000; Biggs et al., 2006].[9] In the following, we compare detailed field mea-
surements of coseismic ground displacement and InSARmaps in order to test the resolution of InSAR observationsfor understanding primary surface rupture processes duringmoderate magnitude earthquakes. The L’Aquila seismicevent provides in fact a unique data set for this test, due to theoutstanding quality of geological, seismological, geodetic,
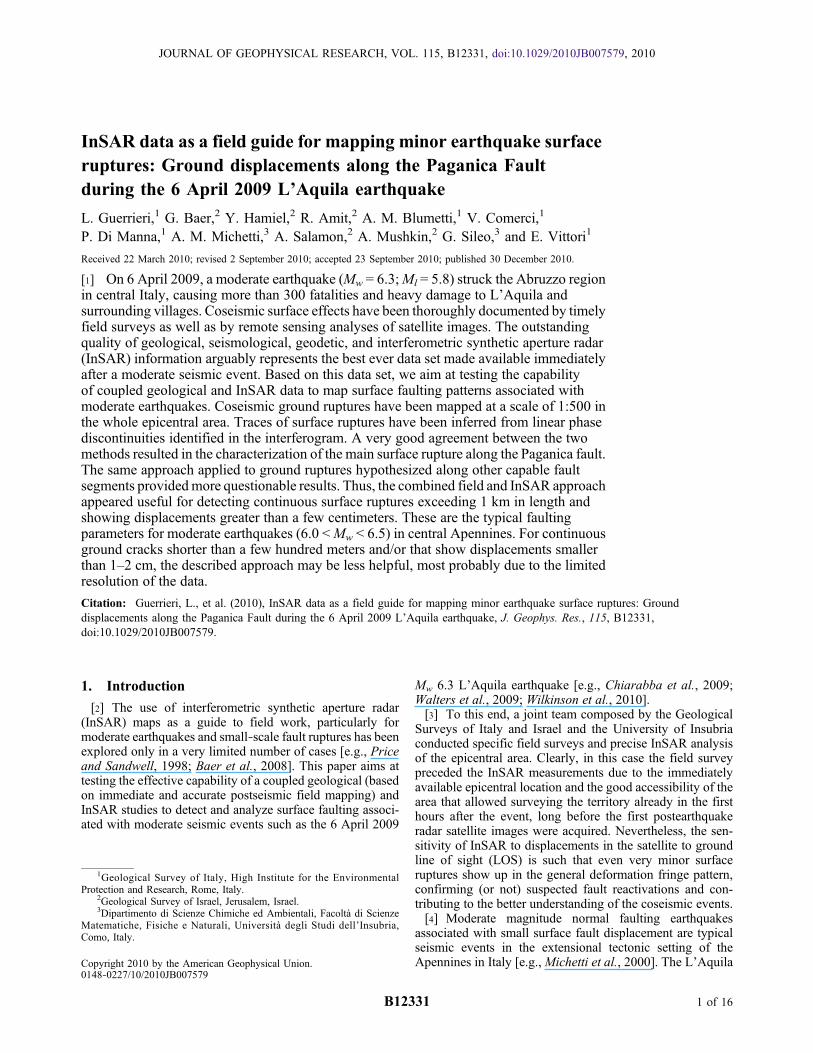
Figure 1. Seismotectonic framework of the study area with location of surface effects along capable faults. The 2009 L’A-quila seismic sequence was characterized by three main shocks (red and orange stars with corresponding focal mechanism). Ayellow dashed line delimits the area with aftershocks occurred in the period 6April to 20 July (source is INGV). Smaller yellowstars locate the epicenters of relevant historical earthquakes (source is CPTI08). Red lines locate capable faults (source isITHACA database, www.apat.gov.it/site/en‐GB/Projects/ITHACA_‐_ITaly_HAzards_from_CApable_faults/default.html)named by the following acronyms (in blue): ASG, Assergi fault; BAR, Barisciano fault; BAZ, Bazzano fault; CAP, Capitigna-no fault; CAT, Colle Caticchio fault; CCE, Colle Cerasitto fault; CEN, Colle Enzano fault; CFE, Campo Felice fault; CIM,Campo Imperatore fault; COF, Colle Frolla fault; COP, Colle Praticciolo fault; LAM, Laga Mountains fault; MAR, MonteD’Aragno fault; MAV, Middle Aterno Valley fault system; MCS, Monte Castellano fault; MDU, Monti della Duchessa fault;MFS, Monticchio‐Fossa‐Stiffe fault system; MMA, Monte Macchione fault; MOR, Monte Orsello fault; MRZ, Monte Ruzzafault; MSF, Monte San Franco fault; OPP, Ovindoli‐Piani di Pezza fault; PAG, Paganica fault; PET, Monte Pettino fault; PIZ,Pizzoli fault; ROC, Roio‐Canetre fault; SDE, San Demetrio faults system; SCI, Scindarella fault; SMA, San Martino fault;SSS, Santo Stefano di Sessanio fault system; STB, Stabiata fault; TRS, Tre Selle fault; VAS, Valle degli Asini fault;VEM, Velino‐Magnola fault; VDS, Valle del Salto fault. Coseismic geological effects along capable faults that are describedin Table 2 (except the Paganica Fault mapped in Figure 3) are indicated by dots colored according to the measured maximumfield offset (see legend at the top right). White labels report the corresponding numbers in Table 2. The A‐B purple line showsthe trace of the geological cross section (Figure 2). Blue dashed box in the Paganica area locates Figure 3.
GUERRIERI ET AL.: INSAR FIELD RUPTURES 2009 L’AQUILA B12331B12331
2 of 16
Figure 1
GUERRIERI ET AL.: INSAR FIELD RUPTURES 2009 L’AQUILA B12331B12331
3 of 16
and remote sensing (in particular InSAR) information, madeavailable immediately after the main shock.
2. Seismotectonic Setting of the L’Aquila Area
2.1. Geological Framework
[10] The epicentral area of the 2009 L’Aquila seismicsequence is characterized by a system of NW‐SE trendingtectonic depressions, located between the Gran Sasso and theMonti d’Ocre morphotectonic units. The outcropping geo-logical formations and the geophysical data reveal a complexstructural setting given by several overthrusted tectonic unitsbelonging to the transitional domain between the Latium‐Abruzzi carbonate shelf platform and the Umbria‐Marchepelagic basin [Vezzani and Ghisetti, 1998; Servizio Geologicod’Italia, 2006].[11] Basically, the present structure of the region is the
result of Messinian to lower Pliocene orogenic thrust tec-tonics [Patacca et al., 1992] followed by extension whichstarted at least 2 Ma ago, causing the formation of lacustrinebasins developed in a low‐relief landscape [Demangeot,1965] and containing mammal fauna (see Mammuthus(Archidiskodon) meridionalis vestinus, Lower Pleistocene[Maccagno, 1962; Azzaroli, 1977]).[12] The typical block‐faulted morphostructural setting
characterized by tectonically controlled basins and ranges[Serva et al., 2002; Blumetti et al., 2004; Blumetti andGuerrieri, 2007] is the cumulative effect of this extensionalactivity at least since the end of the Lower Pleistocene (about0.8 Ma) when most of the Apennines relief was formed[Demangeot, 1965].[13] Active extensional tectonics is accommodated by
a dense array of normal faults (Figure 1). Major tectonicelements are typically located at the base of fault generatedmountain fronts, tens of kilometers long and some hun-dreds of meters high. Subordinate faults within the majorblocks determine additional topographic irregularities. Dur-ing moderate to strong earthquakes (M > 6) all these faultsmight be rejuvenated up to the surface. Therefore, their totalthrow is the result of a number of surface faulting events.
Crustal extension is still ongoing in this area, as demonstratedby geodetic data [e.g., D’Agostino et al., 2008], seismicity,and paleoseismicity [Bagnaia et al., 1992; Blumetti, 1995;Galadini and Galli, 2000; Moro et al., 2002; Papanikolaouet al., 2005].[14] In the northern sector of the 2009 L’Aquila seismic
sequence, the Pizzoli and Pettino faults have downthrown the“Upper Aterno Valley” unit from the Monte Marine plateauby at least 700 m in the last 0.8 Ma.[15] In the southern area, the Paganica–San Demetrio fault
[Bagnaia et al., 1992] is located at the boundary between the“Middle Aterno Valley” and the “Gran Sasso” structuralunits. This latter block which coincides with the highestelevations in the Apennines, is dissected by a set of WNW‐ESE trending normal faults including the Assergi and CampoImperatore faults from 2914 m (Monte Corno Grande) downto about 1500 m at the Anzano Plateau. These faults have alistric geometry showing normal reactivation of old thrusts atdepth [D’Agostino et al., 2001], and are cut by the Paganica–San Demetrio high‐angle normal fault, which downthrowsthe Middle Aterno valley region, at an elevation of about600 m.[16] At the SW border of the Middle Aterno valley, the
Bazzano andMonticchio‐Fossa‐Stiffe antithetic faults boundtheMonti d’Ocre structural unit to the north (Figure 2). Minorfaults with en echelon pattern cross this unit (Roio‐Canetre,Colle Cerasitto, Campo Felice and Monte Orsello faults). Tothe south, together with the Piano di Pezza fault, these faultsare linked to the Fucino basin fault zone, active during the13 January 1915Avezzano earthquake (M= 7.0; I0 =XIMCS[e.g., Michetti et al., 1996]).[17] Major faults (e.g., high‐angle faults with large
morphostructural throw) are also those with higher seis-mogenic potential, capable of producing surface faulting.Capable faults located in the epicentral area are shown inFigure 1 (from Italian Hazard from Capable faults database(ITHACA), according to the state of knowledge on seismo-tectonic and paleoseismic research). It is important to outlinethat most of the Quaternary tectonic deformation was accom-modated along these faults.
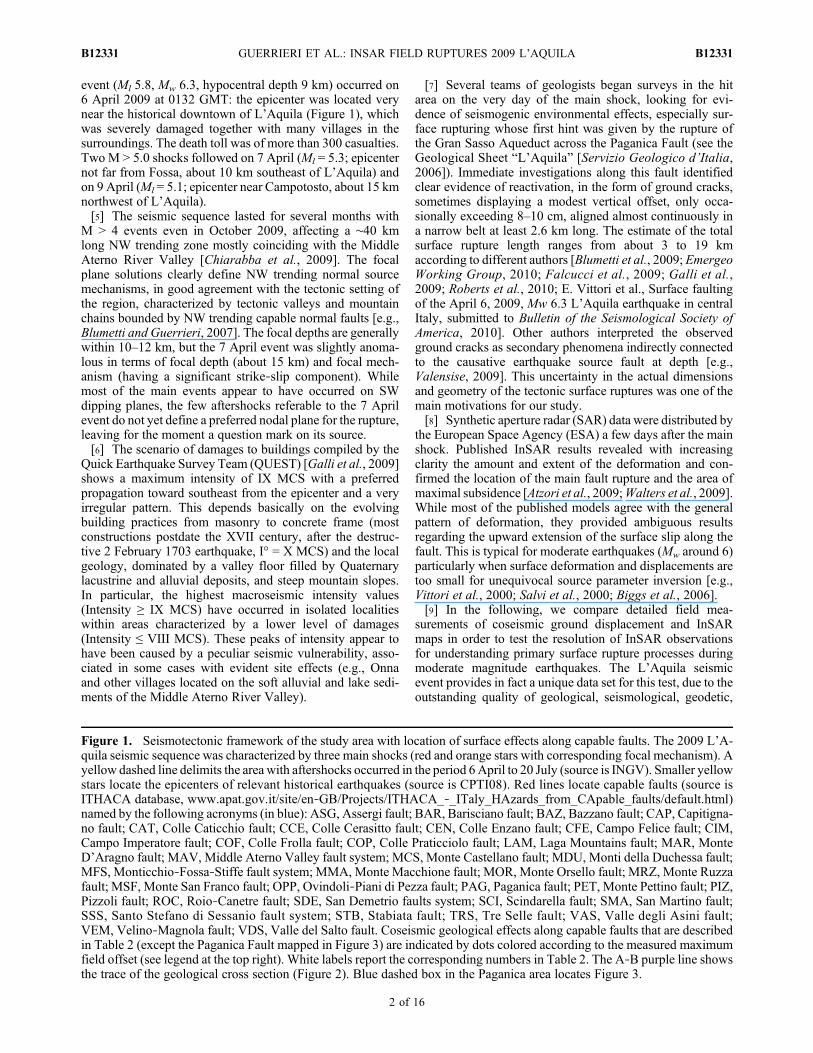
Figure 2. Geological cross section across the Bazzano, Colle Caticchio, and Paganica faults. Trace inFigure 1.
GUERRIERI ET AL.: INSAR FIELD RUPTURES 2009 L’AQUILA B12331B12331
4 of 16
[18] With specific regard to the Paganica fault area, anassociated fault generated mountain front is not evident dueto the presence of an ancient drainage system at the footwall,which was active since at least the end of the Lower Pleis-tocene (“Paleo‐Raiale” river [Messina et al., 2009]). Relictforms of this ancient landscape as well as different ordersof fluvial deposits terraced by the progressive activity of thePaganica fault are still preserved in the footwall (Figure 2).Among them, deposits at about 150 m above the local baselevel contain tephra layers referred to the eruptions from theLatium volcanic districts which occurred between 560 and360 ka. These data constrain the Paganica fault long‐term sliprate to the order of 0.4 mm/yr.
2.2. Historical Seismicity
[19] In the historical past, several moderate to strongearthquakes affected the epicentral area (Figure 1, source,CPTI08). Two events with Intensity X MCS, but with dif-ferent estimated magnitudes, occurred on 26 November 1461and 2 February 1703. Two other destructive earthquakes hitthe same area on 9 September 1349, IX‐X MCS (epicenterin Valle del Salto, about 20 km SW of L’Aquila) and on6 October 1762, IXMCS. The strongest and best documentedearthquake sequence, occurred in 1703, and was character-ized by three main shocks that moved in a few days fromNNW to SSE. The third shock, on 2 February (Intensity XMCS), which destroyed the city of L’Aquila causing 2500casualties [Baratta, 1901] (CPTI08), produced surface faultingalong the Pizzoli fault for a length of about 20 km [Blumetti,1995; Moro et al., 2002]. Impressive secondary effects wereinduced by that event, among which there was a huge deep‐seated gravitational slide on the Mt. Marine ridge, a largeslope movement at Villa Camponeschi, near Posta, severalrockfalls, and liquefaction phenomena along the Aterno River[Parozzani, 1887;Uria de Llanos, 1703]. The 1461 and 1762events were probably smaller and similar to the 2009 earth-quake, both in their magnitudes and epicenter location south-east of L’Aquila, suggesting a return period of ∼3 centuriesfor this type of events.
3. Surface Faulting Along the Paganica Fault
[20] Descriptions of geological effects reported along thePaganica Fault are from Blumetti et al. [2009], integrated insome cases with observations published by Boncio et al.[2010], Emergeo Working Group [2010], Falcucci et al.[2009], Galli et al. [2009], Messina et al. [2009], Wilkinsonet al. [2010] and Vittori et al. (submitted manuscript, 2010).
3.1. Field Evidence
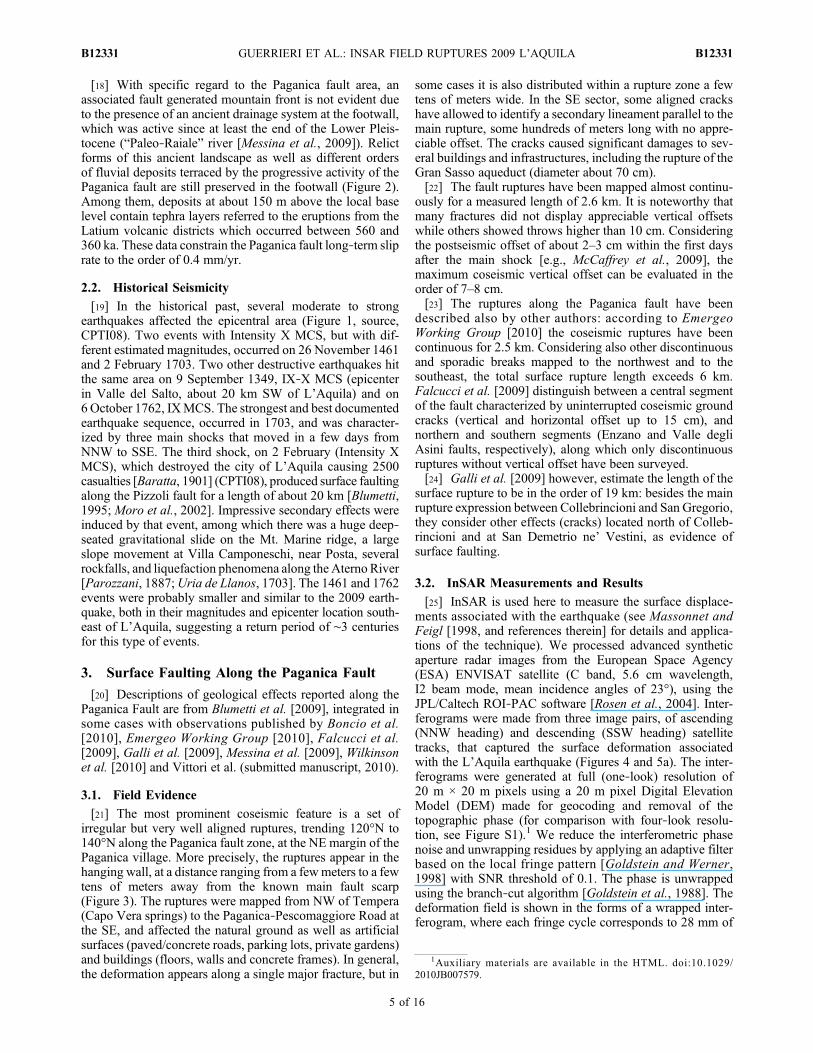
[21] The most prominent coseismic feature is a set ofirregular but very well aligned ruptures, trending 120°N to140°N along the Paganica fault zone, at the NE margin of thePaganica village. More precisely, the ruptures appear in thehanging wall, at a distance ranging from a fewmeters to a fewtens of meters away from the known main fault scarp(Figure 3). The ruptures were mapped from NW of Tempera(Capo Vera springs) to the Paganica‐Pescomaggiore Road atthe SE, and affected the natural ground as well as artificialsurfaces (paved/concrete roads, parking lots, private gardens)and buildings (floors, walls and concrete frames). In general,the deformation appears along a single major fracture, but in
some cases it is also distributed within a rupture zone a fewtens of meters wide. In the SE sector, some aligned crackshave allowed to identify a secondary lineament parallel to themain rupture, some hundreds of meters long with no appre-ciable offset. The cracks caused significant damages to sev-eral buildings and infrastructures, including the rupture of theGran Sasso aqueduct (diameter about 70 cm).[22] The fault ruptures have been mapped almost continu-
ously for a measured length of 2.6 km. It is noteworthy thatmany fractures did not display appreciable vertical offsetswhile others showed throws higher than 10 cm. Consideringthe postseismic offset of about 2–3 cm within the first daysafter the main shock [e.g., McCaffrey et al., 2009], themaximum coseismic vertical offset can be evaluated in theorder of 7–8 cm.[23] The ruptures along the Paganica fault have been
described also by other authors: according to EmergeoWorking Group [2010] the coseismic ruptures have beencontinuous for 2.5 km. Considering also other discontinuousand sporadic breaks mapped to the northwest and to thesoutheast, the total surface rupture length exceeds 6 km.Falcucci et al. [2009] distinguish between a central segmentof the fault characterized by uninterrupted coseismic groundcracks (vertical and horizontal offset up to 15 cm), andnorthern and southern segments (Enzano and Valle degliAsini faults, respectively), along which only discontinuousruptures without vertical offset have been surveyed.[24] Galli et al. [2009] however, estimate the length of the
surface rupture to be in the order of 19 km: besides the mainrupture expression between Collebrincioni and San Gregorio,they consider other effects (cracks) located north of Colleb-rincioni and at San Demetrio ne’ Vestini, as evidence ofsurface faulting.
3.2. InSAR Measurements and Results
[25] InSAR is used here to measure the surface displace-ments associated with the earthquake (see Massonnet andFeigl [1998, and references therein] for details and applica-tions of the technique). We processed advanced syntheticaperture radar images from the European Space Agency(ESA) ENVISAT satellite (C band, 5.6 cm wavelength,I2 beam mode, mean incidence angles of 23°), using theJPL/Caltech ROI‐PAC software [Rosen et al., 2004]. Inter-ferograms were made from three image pairs, of ascending(NNW heading) and descending (SSW heading) satellitetracks, that captured the surface deformation associatedwith the L’Aquila earthquake (Figures 4 and 5a). The inter-ferograms were generated at full (one‐look) resolution of20 m × 20 m pixels using a 20 m pixel Digital ElevationModel (DEM) made for geocoding and removal of thetopographic phase (for comparison with four‐look resolu-tion, see Figure S1).1 We reduce the interferometric phasenoise and unwrapping residues by applying an adaptive filterbased on the local fringe pattern [Goldstein and Werner,1998] with SNR threshold of 0.1. The phase is unwrappedusing the branch‐cut algorithm [Goldstein et al., 1988]. Thedeformation field is shown in the forms of a wrapped inter-ferogram, where each fringe cycle corresponds to 28 mm of
1Auxiliary materials are available in the HTML. doi:10.1029/2010JB007579.
GUERRIERI ET AL.: INSAR FIELD RUPTURES 2009 L’AQUILA B12331B12331
5 of 16
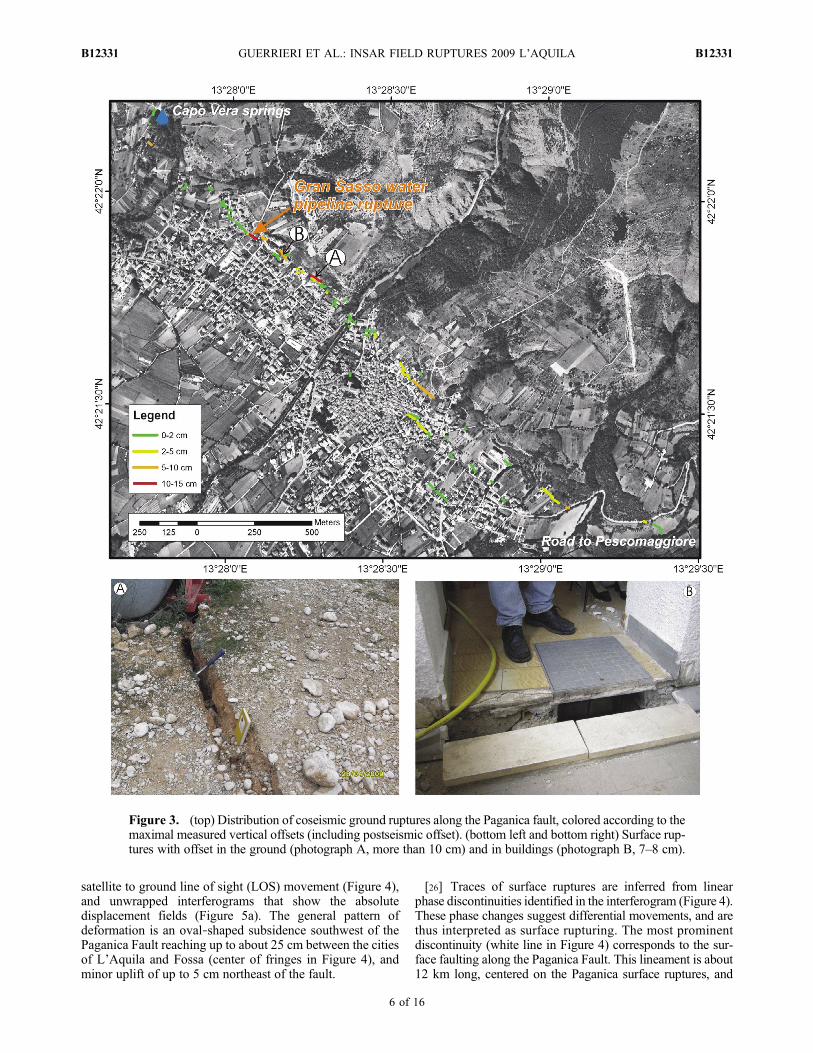
satellite to ground line of sight (LOS) movement (Figure 4),and unwrapped interferograms that show the absolutedisplacement fields (Figure 5a). The general pattern ofdeformation is an oval‐shaped subsidence southwest of thePaganica Fault reaching up to about 25 cm between the citiesof L’Aquila and Fossa (center of fringes in Figure 4), andminor uplift of up to 5 cm northeast of the fault.
[26] Traces of surface ruptures are inferred from linearphase discontinuities identified in the interferogram (Figure 4).These phase changes suggest differential movements, and arethus interpreted as surface rupturing. The most prominentdiscontinuity (white line in Figure 4) corresponds to the sur-face faulting along the Paganica Fault. This lineament is about12 km long, centered on the Paganica surface ruptures, and
Figure 3. (top) Distribution of coseismic ground ruptures along the Paganica fault, colored according to themaximal measured vertical offsets (including postseismic offset). (bottom left and bottom right) Surface rup-tures with offset in the ground (photograph A, more than 10 cm) and in buildings (photograph B, 7–8 cm).
GUERRIERI ET AL.: INSAR FIELD RUPTURES 2009 L’AQUILA B12331B12331
6 of 16
extends both to the NW and to the SE. Three minor dis-continuities (marked black) are seen at the northwesternextension of the Paganica Fault, and west and south of the fault(Figure 4).[27] Displacement profiles across the Paganica Fault were
made from the descending track interferogram (Figures 4and 6) and are compared with ground truth values. Mostprofiles (numbers 1–5) show LOS displacements of up to12 cm, decreasing to the NW and SE, in quite good agree-ment with the field observations (see discussion for a moredetailed comparison).
3.3. Slip Distribution Along the Paganica Fault
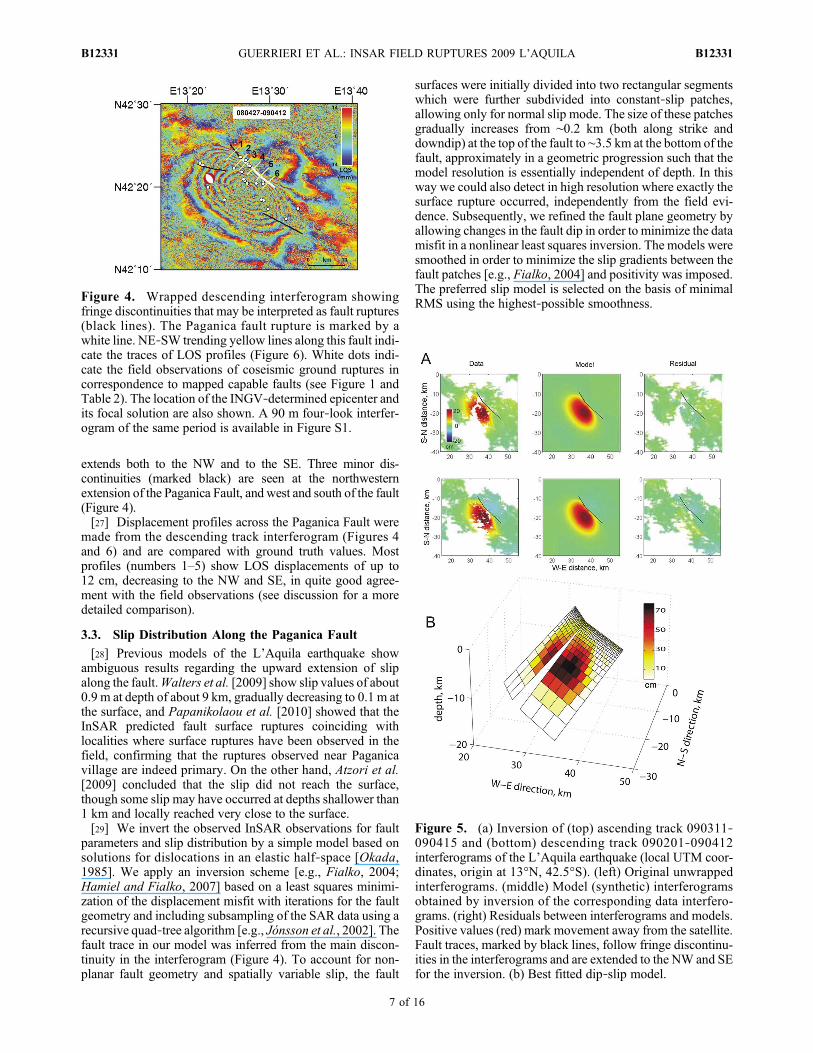
[28] Previous models of the L’Aquila earthquake showambiguous results regarding the upward extension of slipalong the fault.Walters et al. [2009] show slip values of about0.9 m at depth of about 9 km, gradually decreasing to 0.1 m atthe surface, and Papanikolaou et al. [2010] showed that theInSAR predicted fault surface ruptures coinciding withlocalities where surface ruptures have been observed in thefield, confirming that the ruptures observed near Paganicavillage are indeed primary. On the other hand, Atzori et al.[2009] concluded that the slip did not reach the surface,though some slip may have occurred at depths shallower than1 km and locally reached very close to the surface.[29] We invert the observed InSAR observations for fault
parameters and slip distribution by a simple model based onsolutions for dislocations in an elastic half‐space [Okada,1985]. We apply an inversion scheme [e.g., Fialko, 2004;Hamiel and Fialko, 2007] based on a least squares minimi-zation of the displacement misfit with iterations for the faultgeometry and including subsampling of the SAR data using arecursive quad‐tree algorithm [e.g., Jónsson et al., 2002]. Thefault trace in our model was inferred from the main discon-tinuity in the interferogram (Figure 4). To account for non-planar fault geometry and spatially variable slip, the fault
surfaces were initially divided into two rectangular segmentswhich were further subdivided into constant‐slip patches,allowing only for normal slip mode. The size of these patchesgradually increases from ∼0.2 km (both along strike anddowndip) at the top of the fault to ∼3.5 km at the bottom of thefault, approximately in a geometric progression such that themodel resolution is essentially independent of depth. In thisway we could also detect in high resolution where exactly thesurface rupture occurred, independently from the field evi-dence. Subsequently, we refined the fault plane geometry byallowing changes in the fault dip in order to minimize the datamisfit in a nonlinear least squares inversion. The models weresmoothed in order to minimize the slip gradients between thefault patches [e.g., Fialko, 2004] and positivity was imposed.The preferred slip model is selected on the basis of minimalRMS using the highest‐possible smoothness.Figure 4. Wrapped descending interferogram showing
fringe discontinuities that may be interpreted as fault ruptures(black lines). The Paganica fault rupture is marked by awhite line. NE‐SW trending yellow lines along this fault indi-cate the traces of LOS profiles (Figure 6). White dots indi-cate the field observations of coseismic ground ruptures incorrespondence to mapped capable faults (see Figure 1 andTable 2). The location of the INGV‐determined epicenter andits focal solution are also shown. A 90 m four‐look interfer-ogram of the same period is available in Figure S1.
Figure 5. (a) Inversion of (top) ascending track 090311‐090415 and (bottom) descending track 090201‐090412interferograms of the L’Aquila earthquake (local UTM coor-dinates, origin at 13°N, 42.5°S). (left) Original unwrappedinterferograms. (middle) Model (synthetic) interferogramsobtained by inversion of the corresponding data interfero-grams. (right) Residuals between interferograms and models.Positive values (red) mark movement away from the satellite.Fault traces, marked by black lines, follow fringe discontinu-ities in the interferograms and are extended to the NW and SEfor the inversion. (b) Best fitted dip‐slip model.
GUERRIERI ET AL.: INSAR FIELD RUPTURES 2009 L’AQUILA B12331B12331
7 of 16
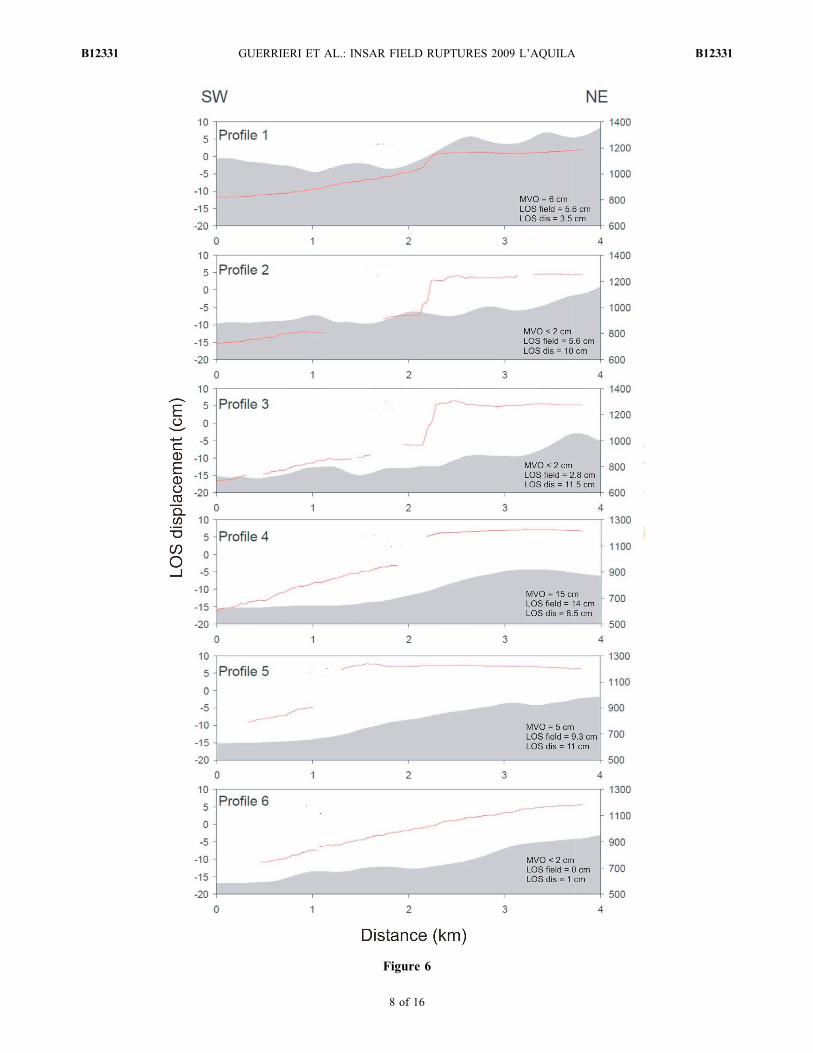
Figure 6
GUERRIERI ET AL.: INSAR FIELD RUPTURES 2009 L’AQUILA B12331B12331
8 of 16
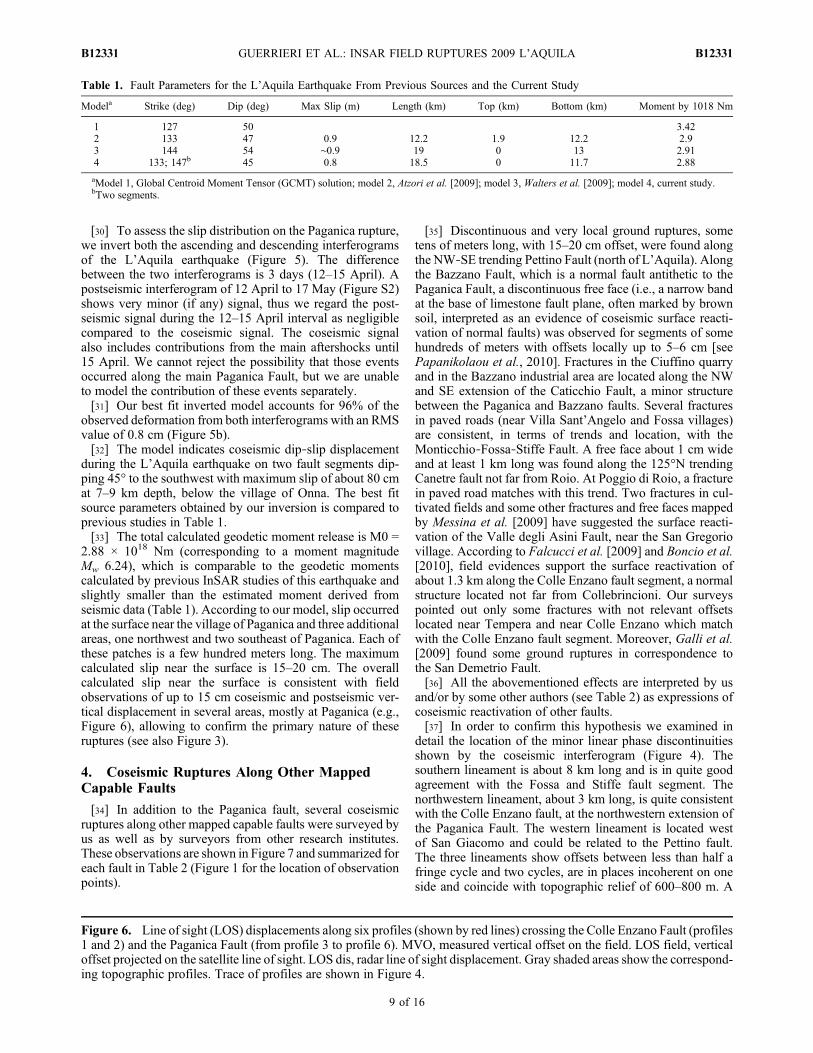
[30] To assess the slip distribution on the Paganica rupture,we invert both the ascending and descending interferogramsof the L’Aquila earthquake (Figure 5). The differencebetween the two interferograms is 3 days (12–15 April). Apostseismic interferogram of 12 April to 17 May (Figure S2)shows very minor (if any) signal, thus we regard the post-seismic signal during the 12–15 April interval as negligiblecompared to the coseismic signal. The coseismic signalalso includes contributions from the main aftershocks until15 April. We cannot reject the possibility that those eventsoccurred along the main Paganica Fault, but we are unableto model the contribution of these events separately.[31] Our best fit inverted model accounts for 96% of the
observed deformation from both interferograms with an RMSvalue of 0.8 cm (Figure 5b).[32] The model indicates coseismic dip‐slip displacement
during the L’Aquila earthquake on two fault segments dip-ping 45° to the southwest with maximum slip of about 80 cmat 7–9 km depth, below the village of Onna. The best fitsource parameters obtained by our inversion is compared toprevious studies in Table 1.[33] The total calculated geodetic moment release is M0 =
2.88 × 10¹⁸ Nm (corresponding to a moment magnitudeMw 6.24), which is comparable to the geodetic momentscalculated by previous InSAR studies of this earthquake andslightly smaller than the estimated moment derived fromseismic data (Table 1). According to our model, slip occurredat the surface near the village of Paganica and three additionalareas, one northwest and two southeast of Paganica. Each ofthese patches is a few hundred meters long. The maximumcalculated slip near the surface is 15–20 cm. The overallcalculated slip near the surface is consistent with fieldobservations of up to 15 cm coseismic and postseismic ver-tical displacement in several areas, mostly at Paganica (e.g.,Figure 6), allowing to confirm the primary nature of theseruptures (see also Figure 3).
4. Coseismic Ruptures Along Other MappedCapable Faults
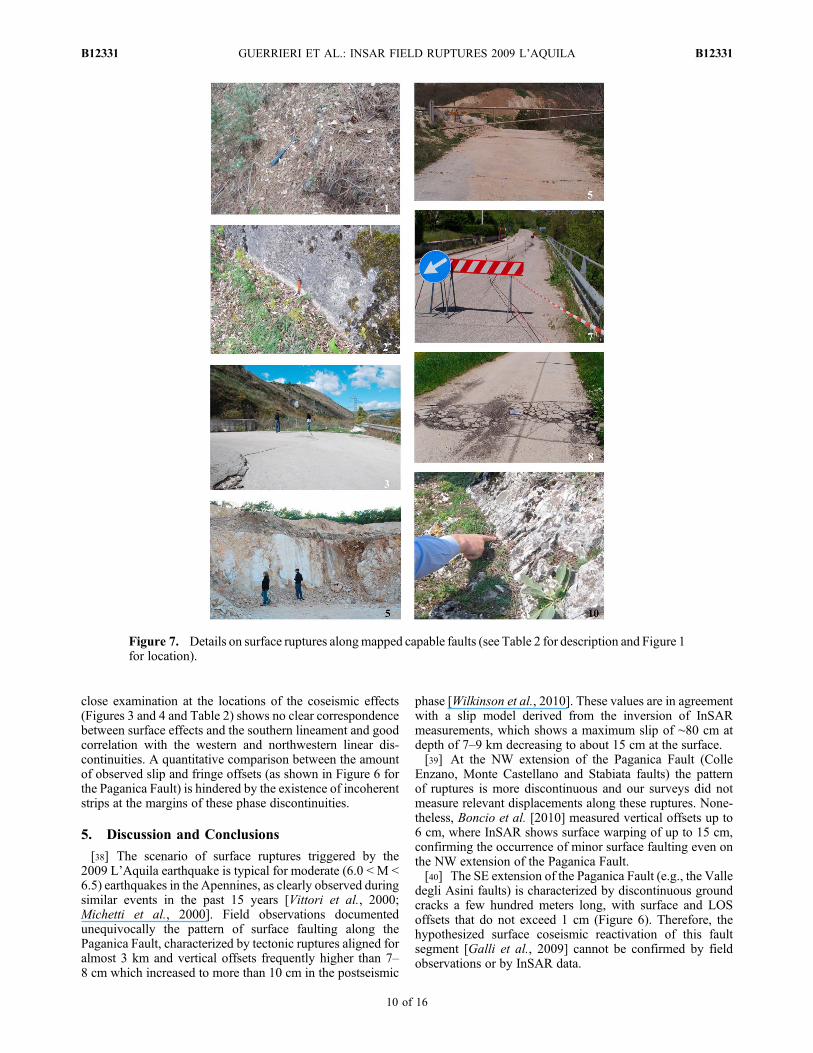
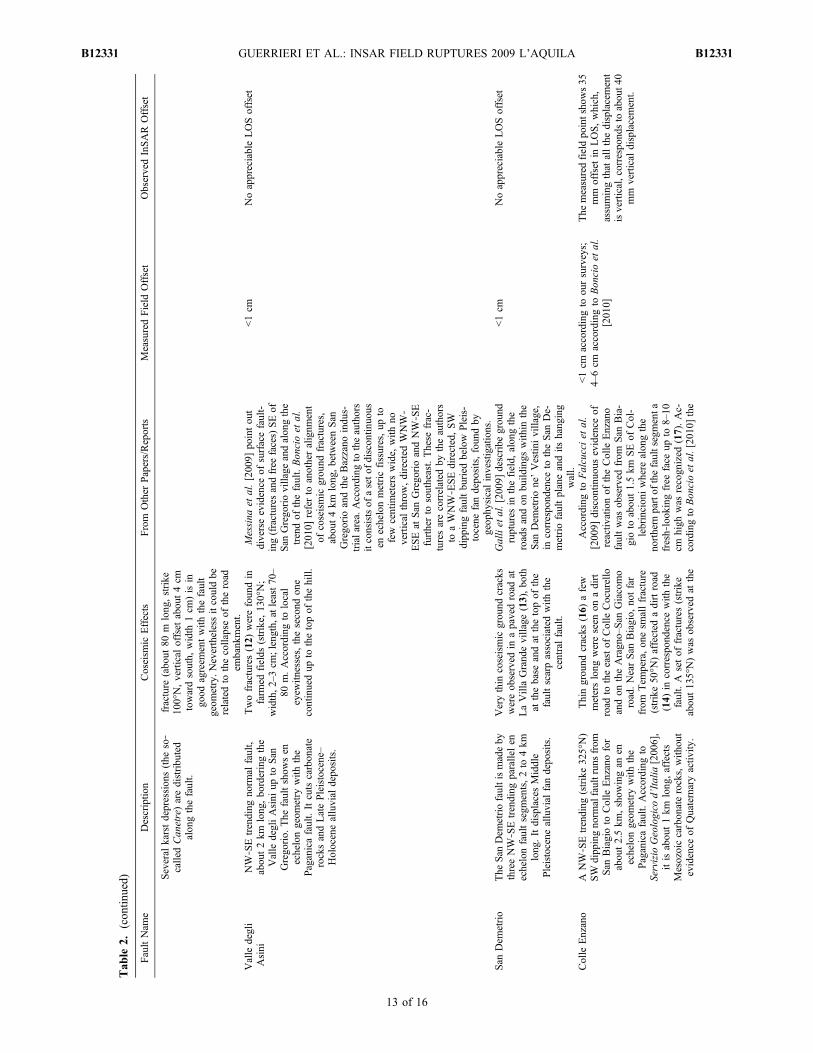
[34] In addition to the Paganica fault, several coseismicruptures along other mapped capable faults were surveyed byus as well as by surveyors from other research institutes.These observations are shown in Figure 7 and summarized foreach fault in Table 2 (Figure 1 for the location of observationpoints).
[35] Discontinuous and very local ground ruptures, sometens of meters long, with 15–20 cm offset, were found alongthe NW‐SE trending Pettino Fault (north of L’Aquila). Alongthe Bazzano Fault, which is a normal fault antithetic to thePaganica Fault, a discontinuous free face (i.e., a narrow bandat the base of limestone fault plane, often marked by brownsoil, interpreted as an evidence of coseismic surface reacti-vation of normal faults) was observed for segments of somehundreds of meters with offsets locally up to 5–6 cm [seePapanikolaou et al., 2010]. Fractures in the Ciuffino quarryand in the Bazzano industrial area are located along the NWand SE extension of the Caticchio Fault, a minor structurebetween the Paganica and Bazzano faults. Several fracturesin paved roads (near Villa Sant’Angelo and Fossa villages)are consistent, in terms of trends and location, with theMonticchio‐Fossa‐Stiffe Fault. A free face about 1 cm wideand at least 1 km long was found along the 125°N trendingCanetre fault not far from Roio. At Poggio di Roio, a fracturein paved road matches with this trend. Two fractures in cul-tivated fields and some other fractures and free faces mappedby Messina et al. [2009] have suggested the surface reacti-vation of the Valle degli Asini Fault, near the San Gregoriovillage. According to Falcucci et al. [2009] and Boncio et al.[2010], field evidences support the surface reactivation ofabout 1.3 km along the Colle Enzano fault segment, a normalstructure located not far from Collebrincioni. Our surveyspointed out only some fractures with not relevant offsetslocated near Tempera and near Colle Enzano which matchwith the Colle Enzano fault segment. Moreover, Galli et al.[2009] found some ground ruptures in correspondence tothe San Demetrio Fault.[36] All the abovementioned effects are interpreted by us
and/or by some other authors (see Table 2) as expressions ofcoseismic reactivation of other faults.[37] In order to confirm this hypothesis we examined in
detail the location of the minor linear phase discontinuitiesshown by the coseismic interferogram (Figure 4). Thesouthern lineament is about 8 km long and is in quite goodagreement with the Fossa and Stiffe fault segment. Thenorthwestern lineament, about 3 km long, is quite consistentwith the Colle Enzano fault, at the northwestern extension ofthe Paganica Fault. The western lineament is located westof San Giacomo and could be related to the Pettino fault.The three lineaments show offsets between less than half afringe cycle and two cycles, are in places incoherent on oneside and coincide with topographic relief of 600–800 m. A
Figure 6. Line of sight (LOS) displacements along six profiles (shown by red lines) crossing the Colle Enzano Fault (profiles1 and 2) and the Paganica Fault (from profile 3 to profile 6). MVO, measured vertical offset on the field. LOS field, verticaloffset projected on the satellite line of sight. LOS dis, radar line of sight displacement. Gray shaded areas show the correspond-ing topographic profiles. Trace of profiles are shown in Figure 4.
Table 1. Fault Parameters for the L’Aquila Earthquake From Previous Sources and the Current Study
Modela Strike (deg) Dip (deg) Max Slip (m) Length (km) Top (km) Bottom (km) Moment by 1018 Nm
1 127 50 3.422 133 47 0.9 12.2 1.9 12.2 2.93 144 54 ∼0.9 19 0 13 2.914 133; 147b 45 0.8 18.5 0 11.7 2.88
aModel 1, Global Centroid Moment Tensor (GCMT) solution; model 2, Atzori et al. [2009]; model 3, Walters et al. [2009]; model 4, current study.bTwo segments.
GUERRIERI ET AL.: INSAR FIELD RUPTURES 2009 L’AQUILA B12331B12331
9 of 16
close examination at the locations of the coseismic effects(Figures 3 and 4 and Table 2) shows no clear correspondencebetween surface effects and the southern lineament and goodcorrelation with the western and northwestern linear dis-continuities. A quantitative comparison between the amountof observed slip and fringe offsets (as shown in Figure 6 forthe Paganica Fault) is hindered by the existence of incoherentstrips at the margins of these phase discontinuities.
5. Discussion and Conclusions
[38] The scenario of surface ruptures triggered by the2009 L’Aquila earthquake is typical for moderate (6.0 < M <6.5) earthquakes in the Apennines, as clearly observed duringsimilar events in the past 15 years [Vittori et al., 2000;Michetti et al., 2000]. Field observations documentedunequivocally the pattern of surface faulting along thePaganica Fault, characterized by tectonic ruptures aligned foralmost 3 km and vertical offsets frequently higher than 7–8 cm which increased to more than 10 cm in the postseismic
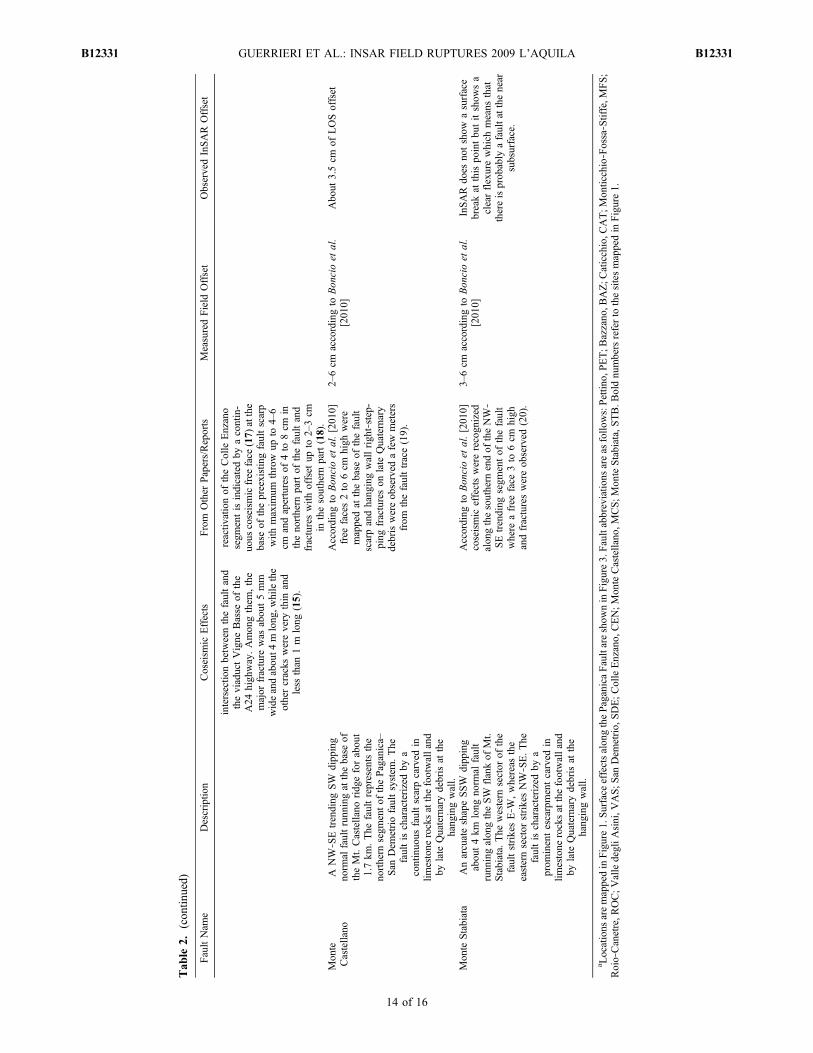
phase [Wilkinson et al., 2010]. These values are in agreementwith a slip model derived from the inversion of InSARmeasurements, which shows a maximum slip of ∼80 cm atdepth of 7–9 km decreasing to about 15 cm at the surface.[39] At the NW extension of the Paganica Fault (Colle
Enzano, Monte Castellano and Stabiata faults) the patternof ruptures is more discontinuous and our surveys did notmeasure relevant displacements along these ruptures. None-theless, Boncio et al. [2010] measured vertical offsets up to6 cm, where InSAR shows surface warping of up to 15 cm,confirming the occurrence of minor surface faulting even onthe NW extension of the Paganica Fault.[40] The SE extension of the Paganica Fault (e.g., the Valle
degli Asini faults) is characterized by discontinuous groundcracks a few hundred meters long, with surface and LOSoffsets that do not exceed 1 cm (Figure 6). Therefore, thehypothesized surface coseismic reactivation of this faultsegment [Galli et al., 2009] cannot be confirmed by fieldobservations or by InSAR data.
Figure 7. Details on surface ruptures alongmapped capable faults (see Table 2 for description and Figure 1for location).
GUERRIERI ET AL.: INSAR FIELD RUPTURES 2009 L’AQUILA B12331B12331
10 of 16
Tab
le2.
Coseism
icGeologicalEffectsThatOccurredon
MappedCapable
Faults
(Field
andInSAREvidence)
a
FaultNam
eDescriptio
nCoseism
icEffects
From
Other
Papers/Reports
MeasuredField
Offset
ObservedInSAR
Offset
Pettin
oNW‐SEtrending
SW
dipp
ing
norm
alfault,abou
t3.5km
long
,bo
rderingtheL’A
quila
basinat
NE,locatedat
thebase
ofafault
escarpment(abo
ut35
0m
high
)on
theSW
slop
eof
Mt.Pettin
o.The
faulthascutthetip
sof
anUpp
erPleistocene
alluvial
fan[Servizio
Geologico
d’Italia,20
06].Paleo-
seismic
investigations
intheSE
sector
[Galliet
al.,20
09]have
show
nthat
thefaultdisplacesde-
positsof
abou
t8ky
r(m
inim
umage).
Openfractures,28
0°N
trending
,a
few
meterslong
,andoffset
ofabou
t5cm
markedby
the
upthrowingof
leaves
(1).
EmergeoWorking
Group
[201
0]describesgrou
ndruptures
alon
gthePettin
ofault,with
offset
upto
15–20cm
insoilanddebris.
5cm
accordingto
oursurveysand
15–20cm
accordingto
Emergeo
Working
Group
[201
0].
NoappreciableLOSoffset
Bazzano
NW‐SEtrending
NEdipp
ing
norm
alfault,abou
t3km
long
,at
thebase
oftheNEslop
eof
Mt.
Bazzano
carbon
ateridg
e.An
evidentfaultescarpmentis
associated
tothisfault.Allu
vial
fandepo
sits(M
iddlePleistocene)
inthehang
ingwallarecoveredby
recent
collu
vial
depo
sitsand,
locally
,by
travertin
es.
Afree
face
(brownstripe
atthe
base
ofawhite
band
)2cm
high
andup
to30
mlong
was
observed
(2).Groun
dcracks
wereob
served
intheasph
altroad
toBazzano
village,prob
ably
associated
with
coseismic
slop
emov
ement(3).A
75°N
trending
fracture,7m
long
andafewmillim
eterswidelocated
inthehang
ingwallof
theno
rthern
segm
entof
theBazzano
fault,was
observed
across
anasph
altroad
(4).
Falcucciet
al.[200
9]describe
afree
face
upto
15cm
high
,afew
meterslong
,atthe
base
ofthefault
plane,
attheNW
endof
thefault,
prob
ably
mainlydu
eto
non-
tecton
icgravitatio
nalprocesses
and/or
compaction.
Nevertheless,
they
cann
otexclud
eatecton
iccompo
nent.EmergeoWorking
Group
[201
0]do
cumenteda
whitishfaultribb
onwith
acon-
stantheight
ofabou
t5cm
atthe
base
ofbedrockfaultplane,
and
otherdiscon
tinuo
usscarps
inun
consolidated
slop
edepo
sitsfor
abou
t1km
,sugg
estin
gvertical
displacementsof
0.1–
0.3m.
2cm
accordingto
oursurveysand
5cm
accordingto
Emergeo
Working
Group
[201
0].
NoappreciableLOSoffset
Caticchio
NW‐SEtrending
,NEdipp
ing
norm
alfault,abou
t2km
long
,at
theNEslop
eof
Mon
teCaticchio.
Allu
vial
depo
sitscrop
outin
the
hang
ingwall.A
new
fault
escarpmentisno
tevident.Atthe
NW
endof
thefault,in
the
Ciuffinoqu
arry,itcutsQuaternary
depo
sits(5).
Asystem
ofeigh
tmainfractures
(5)weremappedin
theCiuffino
quarry
(strike,
between90
°Nand
100°N;width,somemillim
eters;
leng
th,4–
5m).A
survey
repeated
afew
days
latershow
edthe
prog
ressivegrow
thof
onefracture
andtheappearance
oftwo
additio
nalfractures,subp
arallelto
theprevious
ones.Som
eother
fractures(6)weremappedat
the
NW
border
oftheBazzano
indu
strial
area
(strike,
160°N–
<1cm
NoappreciableLOSoffset
GUERRIERI ET AL.: INSAR FIELD RUPTURES 2009 L’AQUILA B12331B12331
11 of 16
Tab
le2.
(con
tinued)
FaultNam
eDescriptio
nCoseism
icEffects
From
Other
Papers/Reports
MeasuredField
Offset
ObservedInSAROffset
170°N;width,3–5cm
;leng
th,
abou
t20
–30m).Thissystem
,althou
ghno
tlocatedin
correspo
ndence
tomappedfaults,
isin
good
agreem
entw
iththetrend
oftheMon
teCaticchio
norm
alfault.
Mon
ticchio‐
Fossa‐Stiffe
The
NW‐SEtrending
NEdipp
ing
Mon
ticchio‐Fossa‐Stiffe
norm
alfaultislocatedat
thebase
ofthe
easternslop
eof
theMon
tid’Ocre
carbon
aterelief,from
Mon
ticchio
toSEof
Stiffe.Itiscompo
sedof
threemainfaultsegm
ents:(1)the
Mon
ticchio
faultsegm
ent(strike
330°N)abou
t3.5km
long
;(2)the
Fossa
faultsegm
ent(strike31
0°N)
abou
t2.5km
long
;and(3)the
Stiffe
faultsegm
ent(strike31
0°N)
abou
t7.5km
long
.Mesozoic
carbon
aterockscrop
outin
the
footwallandQuaternaryalluvial
depo
sitscoveredby
slop
edepo
sits
characterize
thehang
ingwall.
NearVillaSantAng
elo,
fractures
(strike,
130°N;width,some
centim
eters;leng
th>30
m)
affectingpavedroadsarelocated
incorrespo
ndence
with
theFossa
faultsegm
ent.Nevertheless,the
fracturesappear
tobe
morelik
ely
linkedto
thefailu
reof
aretaining
wallparallelto
theroad,indu
ced
bygravitativ
eph
enom
ena(7).NW
ofFossa,asetof
five
parallel
fractures(strike,
120°N–130
°N.
Width,1–2
cm;length,<2m;8
–10
mapart)have
affected
thepaved
road.The
mostdeform
edzone
show
edevidence
ofcompression
(8).Abo
ut20
0m
from
the
previous
site,mud
volcanoeswere
mappedby
EmergeoWorking
Group
[201
0].O
nefracture
upto
1cm
wideandabou
t10
0m
long
was
observed
onan
asph
altroad
SEof
Fossa,paralleltothetrendof
theFossa
Fault(9).
Inthefootwallof
theMon
ticchio
faultsegm
ent,EmergeoWorking
Group
[201
0]high
lighted
the
presence
ofan
open
fracture
onthe
topof
thescarp.
The
fracture
ap-
pearscompatib
lewith
thereacti-
vatio
nof
anassociated
minor
fault
oraconjug
atesetof
fractures.
NeartheFossa
village,surface
ruptures
atleast30
0m
long
were
foun
dcloseto
therecent
geom
or-
phic
scarps.
<1cm
Allthemeasuredfieldpo
intsarein
decorrelated
areasso
itis
impo
ssible
tomeasure
LOS.
Roio‐Canetre
The
NW‐SEtrending
,SW
dipp
ing
Roio‐Canetre
norm
alfaultis
locatedon
theSW
slop
eof
the
carbon
ateridg
edevelopedfrom
Pog
gioof
Roioto
Bagno
.The
faultismadeby
twomajor
segm
entsabou
t4and1km
long
.The
faultcutsMesozoiccarbon
ate
rocksin
thefootwallandpartially
inhang
ingwallwhere
they
are
associated
with
Quaternary
breccias
andcollu
vial
depo
sits.
Afree
face
(brownstripe
atthe
base
ofawhite
band
)1cm
high
andabou
t1km
long
was
observed
attheSEterm
inationof
theNW
faultsegm
ent,affectingrock
debrisandrock‐to‐rock
contacts.
Thiscouldsupp
ortaprim
ary
origin
forthisfeature(10).At
Pog
giodi
Roio,
acoseismic
fracture
crossedan
asph
altroad
andaconcrete
wall(11).The
locatio
nandthegeom
etry
ofthe
EmergeoWorking
Group
[201
0]describesafreshfree
face
scarp
with
aconstant
height
upto
30mm
associated
with
localfissuring,
for
aminim
umleng
thof
1km
.A
5–10
cmwhite
stripe
atthebase
oftheRoiofaultscarpisrepo
rted
byBon
cioet
al.[201
0].
abou
t1cm
NoappreciableLOSoffset
GUERRIERI ET AL.: INSAR FIELD RUPTURES 2009 L’AQUILA B12331B12331
12 of 16
Tab
le2.
(con
tinued)
FaultNam
eDescriptio
nCoseism
icEffects
From
Other
Papers/Reports
MeasuredField
Offset
ObservedInSAROffset
Several
karstdepression
s(the
so‐
calledCan
etre)aredistribu
ted
alon
gthefault.
fracture
(abo
ut80
mlong
,strike
100°N,vertical
offset
abou
t4cm
towardsouth,
width
1cm
)isin
good
agreem
entwith
thefault
geom
etry.Neverthelessitcouldbe
relatedto
thecollapseof
theroad
embank
ment.
Valle
degli
Asini
NW‐SEtrending
norm
alfault,
abou
t2km
long
,bo
rderingthe
Valle
degliAsini
upto
San
Grego
rio.
The
faultshow
sen
echelongeom
etry
with
the
Paganicafault.Itcutscarbon
ate
rocksandLatePleistocene–
Holocenealluvial
depo
sits.
Twofractures(12)
werefoun
din
farm
edfields
(strike,
130°N;
width,2–3cm
;leng
th,atleast70–
80m.According
tolocal
eyew
itnesses,thesecond
one
continuedup
tothetopof
thehill.
Messina
etal.[200
9]po
intou
tdiverseevidence
ofsurfacefault-
ing(fractures
andfree
faces)SEof
San
Grego
riovillage
andalon
gthe
trendof
thefault.Bon
cioet
al.
[201
0]referto
anotheralignm
ent
ofcoseismic
grou
ndfractures,
abou
t4km
long
,betweenSan
Grego
rioandtheBazzano
indu
s-trialarea.A
ccording
totheauthors
itconsistsof
aseto
fdiscon
tinuo
usen
echelonmetricfissures,up
tofew
centim
eterswide,
with
novertical
throw,directed
WNW‐
ESEat
San
Grego
rioandNW‐SE
furtherto
southeast.These
frac-
turesarecorrelated
bytheauthors
toaWNW‐E
SEdirected,SW
dipp
ingfaultbu
ried
below
Pleis-
tocene
fandepo
sits,foun
dby
geop
hysicalinvestigations.
<1cm
NoappreciableLOSoffset
San
Dem
etrio
The
San
Dem
etriofaultismadeby
threeNW‐SEtrending
parallelen
echelonfaultsegm
ents,2to
4km
long
.ItdisplacesMiddle
Pleistocene
alluvial
fandepo
sits.
Verythin
coseismic
grou
ndcracks
wereob
served
inapavedroad
atLaVillaGrand
evillage
(13),bo
that
thebase
andat
thetopof
the
faultscarpassociated
with
the
centralfault.
Gallietal.[20
09]describe
grou
ndruptures
inthefield,
alon
gthe
roadsandon
build
ings
with
inthe
San
Dem
etrione’Vestin
ivillage,
incorrespo
ndence
totheSan
De-
metriofaultplaneandits
hang
ing
wall.
<1cm
NoappreciableLOSoffset
Colle
Enzano
ANW‐SEtrending
(strike32
5°N)
SW
dipp
ingno
rmalfaultrun
sfrom
San
Biagioto
Colle
Enzanofor
abou
t2.5km
,show
ingan
enechelongeom
etry
with
the
Paganicafault.According
toServizio
Geologico
d’Italia
[200
6],
itisabou
t1km
long
,affects
Mesozoiccarbon
aterocks,with
out
evidence
ofQuaternaryactiv
ity.
Thingrou
ndcracks
(16)
afew
meterslong
wereseen
onadirt
road
totheeastof
Colle
Cocurello
andon
theAragn
o–San
Giacomo
road.NearSan
Biagio,
notfar
from
Tem
pera,on
esm
allfracture
(strike50
°N)affected
adirtroad
(14)
incorrespo
ndence
with
the
fault.A
setof
fractures(strike
abou
t13
5°N)was
observed
atthe
According
toFalcucciet
al.
[200
9]discon
tinuo
usevidence
ofreactiv
ationof
theColle
Enzano
faultwas
observed
from
San
Bia-
gioto
abou
t1.5km
SEof
Col-
lebrincion
iwhere
alon
gthe
northern
partof
thefaultsegmenta
fresh‐look
ingfree
face
upto
8–10
cmhigh
was
recogn
ized
(17).Ac-
cordingto
Bon
cioet
al.[201
0]the
<1cm
accordingto
oursurveys;
4–6cm
accordingto
Bon
cioet
al.
[201
0]
The
measuredfieldpo
intsho
ws35
mm
offset
inLOS,which,
assumingthat
allthedisplacement
isvertical,correspon
dsto
abou
t40
mm
vertical
displacement.
GUERRIERI ET AL.: INSAR FIELD RUPTURES 2009 L’AQUILA B12331B12331
13 of 16
Tab
le2.
(con
tinued)
FaultNam
eDescriptio
nCoseism
icEffects
From
Other
Papers/Reports
MeasuredField
Offset
ObservedInSAROffset
intersectio
nbetweenthefaultand
theviaductVigne
Basse
ofthe
A24
high
way.Amon
gthem
,the
major
fracture
was
abou
t5mm
wideandabou
t4m
long
,whilethe
othercracks
werevery
thin
and
less
than
1m
long
(15).
reactiv
ationof
theColle
Enzano
segm
entisindicatedby
acontin-
uous
coseismicfree
face
(17)
atthe
base
ofthepreexistingfaultscarp
with
maxim
umthrow
upto
4–6
cmandaperturesof
4to
8cm
intheno
rthern
partof
thefaultand
fractureswith
offset
upto
2–3cm
inthesouthern
part(18).
Mon
teCastellano
ANW‐SEtrending
SW
dipp
ing
norm
alfaultrunn
ingatthebase
oftheMt.Castellano
ridg
eforabou
t1.7km
.The
faultrepresentsthe
northern
segm
entof
thePaganica–
San
Dem
etriofaultsystem
.The
faultischaracterizedby
acontinuo
usfaultscarpcarved
inlim
estone
rocksatthefootwalland
bylate
Quaternarydebrisat
the
hang
ingwall.
According
toBon
cioet
al.[201
0]free
faces2to
6cm
high
were
mappedat
thebase
ofthefault
scarpandhang
ingwallrigh
t‐step-
ping
fractureson
late
Quaternary
debriswereob
served
afew
meters
from
thefaulttrace(19).
2–6cm
accordingto
Bon
cioet
al.
[201
0]Abo
ut3.5cm
ofLOSoffset
Mon
teStabiata
AnarcuateshapeSSW
dipp
ing
abou
t4km
long
norm
alfault
runn
ingalon
gtheSW
flankof
Mt.
Stabiata.The
western
sector
ofthe
faultstrikesE‐W
,whereas
the
easternsector
strikesNW‐SE.The
faultischaracterizedby
aprom
inentescarpmentcarved
inlim
estone
rocksatthefootwalland
bylate
Quaternarydebrisat
the
hang
ingwall.
According
toBon
cioet
al.[201
0]coseismic
effectswererecogn
ized
alon
gthesouthern
endof
theNW‐
SEtrending
segm
entof
thefault
where
afree
face
3to
6cm
high
andfractureswereob
served
(20).
3–6cm
accordingto
Bon
cioet
al.
[201
0]InSAR
does
notshow
asurface
breakat
thispo
intbu
titshow
sa
clearflexurewhich
means
that
thereisprob
ably
afaultatthenear
subsurface.
a Locations
aremappedin
Figure1.Surface
effectsalon
gthePaganicaFaultareshow
nin
Figure3.Faultabbreviatio
nsareas
follo
ws:Pettin
o,PET;B
azzano
,BAZ;C
aticchio,C
AT;M
onticchio‐Fossa‐Stiffe,M
FS;
Roio‐Canetre,R
OC;ValledegliA
sini,V
AS;S
anDem
etrio,
SDE;ColleEnzano,
CEN;Mon
teCastellano
,MCS;Mon
teStabiata,STB.B
oldnu
mbersreferto
thesitesmappedin
Figure1.
GUERRIERI ET AL.: INSAR FIELD RUPTURES 2009 L’AQUILA B12331B12331
14 of 16
[41] The same approach was applied to other mappedcapable faults. Along the Monticchio‐Fossa‐Stiffe Fault fieldand InSAR evidence seem to be in good agreement, however,the InSAR results are contaminated by topographic contri-bution and decorrelated on one side of the fault, and are thussomewhat questionable.[42] Along some other faults (e.g., the Pettino and Bazzano
faults) offsets were locally comparable to the maximum off-sets of the Paganica ground ruptures: however, these featureswere very discontinuous and appear to bemore likely inducedby the shaking. The InSAR evidence along the Pettino Faultmay indicate reactivation, but cannot be used as a directevidence of surface faulting, since they are decorrelated onone side and are not supported by robust field evidence.[43] Along the Roio‐Canetre fault, a fresh free face in rock,
1 cm high and more than 1 km long, associated with rockdebris and rock‐to‐rock tectonic contacts suggested a primaryorigin. Such minor deformation cannot be seen in by InSAR.[44] In conclusion, this study has demonstrated that the
combination of field observations and InSAR measurementsprove to be very helpful for detecting continuous surfaceruptures, even for moderate events such as the L’Aquilaearthquake. Our study shows unequivocally that the PaganicaFault did generate coseismic surface faulting, for a minimumrupture length of ∼3 km. The consistency between field andInSAR observation allows to confirm that the Paganica Faultis the causative tectonic structure for the L’Aquila event, andthat the tectonic rupture along this structure propagated from∼9 km directly to the ground surface.[45] However, our study also shows that several limitations
still exist even for an exceptionally well documented casehistory such as the one analyzed in this paper. When sur-face ruptures are short, discontinuous and show small dis-placements (typically smaller than 1–2 cm), the combinedapproach may be less helpful due to resolution boundaries. Insuch cases, the genetic interpretation of the ground rupturemechanisms may not always be clear.[46] Nevertheless, remote sensing, and particularly InSAR,
is expected to play an important role in future support offield surveys, thanks to the new constellations of dedicatedsatellites (e.g., Sentinel‐1 by ESA) which will significantlyimprove the frequency of coverage and resolution of imag-ing after destructive earthquakes, which still are the majordrawbacks of satellite potential contribution to hazard anddisaster assessment (e.g., GMES program and the GEOinitiative).
6. Data Source
[47] Data sources for seismological data are as follows:EMSC, http://www.emsc‐csem.org/; INGV, http://iside.rm.ingv.it; USGS, http://earthquake.usgs.gov/regional/neic/. Datasource for historical seismic catalog is as follows: CPTI08,http://emidius.mi.ingv.it/CPTI08. Data source for capablefaults is as follows: ITHACA, Italian Hazard from Capa-ble faults, http://193.206.192.227/wms_dir/Catalogo_delle_Faglie_Capaci_ITHACA.html. The other data used in thispaper came from published sources listed in the references.
[48] Acknowledgments. This research benefited from invaluablediscussion on the L’Aquila earthquake ruptures with Gerald Robertsand Leonello Serva. Funding to G.S. has been provided by a University of
Insubria urgent grant. ENVISAT ASAR images were provided by theEuropean Space Agency under project C1P.5544.
ReferencesAtzori, S., I. Hunstad, M. Chini, S. Salvi, C. Tolomei, C. Bignami,S. Stramondo, E. Transatti, A. Antonioli, and E. Boschi (2009), Finitefault inversion of DInSAR coseismic displacement of the 2009 L’Aquilaearthquake (central Italy), Geophys. Res. Lett., 36, L15305, doi:10.1029/2009GL039293.
Azzaroli, A. (1977), The Villafranchian stage in Italy and the Plio‐Pleistocene boundary, G. Geol., 41(2), 61–79.
Baer, G., Y. Hamiel, G. Shamir, and R. Nof (2008), Evolution of a magma‐driven earthquake swarm and triggering of the nearby Oldoinyo Lengaieruption, as resolved by InSAR, ground observations and elastic model-ing, East African Rift, 2007, Earth Planet. Sci. Lett., 272, 339–352,doi:10.1016/j.epsl.2008.04.052.
Bagnaia, R., A. D’Epifanio, and S. Sylos Labini (1992), Aquila andsubaequan basins: An example of Quaternary evolution in centralApennines, Italy, Quat. Nova, II, 187–209.
Baratta, M. (1901), I Terremoti d’Italia: Saggio di Storia, Geografia eBibliografia Sismica Italiana, Fratelli Bocca, Vigevano, Italy.
Biggs, J., E. Bergman, B. Emmerson, G. J. Funning, J. Jackson, B. Parsons,and T. J. Wright (2006), Fault identification for buried strike‐slipearthquakes using InSAR: The 1994 and 2004 Al Hoceima, Moroccoearthquakes, Geophys. J. Int., 166, 1347–1362, doi:10.1111/j.1365-246X.2006.03071.x.
Blumetti, A. M. (1995), Neotectonic investigations and evidence of paleo-seismicity in the epicentral area of the January–February 1703 centralItaly earthquakes, Bull. Assoc. Eng. Geol., 6, 83–100.
Blumetti, A. M., and L. Guerrieri (2007), Fault‐generated mountain frontsand the identification of fault segments: Implications for seismic hazardassessment, Boll. Soc. Geol. Ital., 126(2), 307–321.
Blumetti, A. M., L. Guerrieri, F. Dramis, B. Gentili, A. M. Michetti, andE. Tondi (2004), P65—Basin and range in central Apennines, in 32ndIGC: Field Trip Guidebooks,Mem. Descr. Carta Geol. Ital., 63(6), 1–48.
Blumetti, A. M., V. Comerci, P. Di Manna, L. Guerrieri, and E. Vittori(2009), Geological effects induced by the L’Aquila earthquake (6 April2009, Ml = 5.8) in the natural environment, report, 38 pp., Ist. Super.per la Prot. e la Ric. Ambientale, Rome. (Available at http://www.apat.gov.it/site/en‐GB/Projects/INQUA_Scale/Documents/.)
Boncio, P., A. Pizzi, F. Brozzetti, G. Pomposo, G. Lavecchia, D. DiNaccio, and F. Ferrarini (2010), Coseismic ground deformation of the6 April 2009 L’Aquila earthquake (central Italy, Mw6.3), Geophys.Res. Lett., 37, L06308, doi:10.1029/2010GL042807.
Chiarabba, C., et al. (2009), The 2009 L’Aquila (central Italy) Mw6.3 earth-quake: Main shock and aftershocks, Geophys. Res. Lett., 36, L18308,doi:10.1029/2009GL039627.
D’Agostino, N., R. Giuliani, M. Mattone, and L. Bonci (2001), Activecrustal extension in the central Apennines (Italy) inferred from GPSmeasurements in the interval 1994–1999, Geophys. Res. Lett., 28,2121–2124, doi:10.1029/2000GL012462.
D’Agostino, N., A. Avallone, D. Cheloni, E. D’Anastasio, S. Mantenuto,and G. Selvaggi (2008), Active tectonics of the Adriatic region fromGPS and earthquake slip vectors, J. Geophys. Res., 113, B12413,doi:10.1029/2008JB005860.
Demangeot, J. (1965), Geomorpholgiè des Abruzzes Adriatiques: Memoirset Documents, 403 pp., Ed. du Cent. Natl. de la Rech. Sci., Paris.
Emergeo Working Group (2010), Evidence for surface rupture associatedwith the Mw 6.3 L’Aquila earthquake sequence of April 2009 (centralItaly), Terra Nova, 22, 43–51, doi:10.1111/j.1365-3121.2009.00915.x.
Falcucci, E., et al. (2009), The Paganica Fault and surface coseismic rup-tures caused by the 6 April 2009 earthquake (L’Aquila, central Italy),Seismol. Res. Lett., 80, 940–950, doi:10.1785/gssrl.80.6.940.
Fialko, Y. (2004), Probing the mechanical properties of seismically activecrust with space geodesy: Study of the coseismic deformation due to the1992 Mw 7.3 Landers (southern California) earthquake, J. Geophys. Res.,109, B03307, doi:10.1029/2003JB002756.
Galadini, F., and P. Galli (2000), Active tectonics in the central Apennines(Italy)—Input data for seismic hazard assessment, Nat. Hazards, 22,225–268, doi:10.1023/A:1008149531980.
Galli, P., R. Camassi, R. Azzaro, F. Bernardini, S. Castenetto, D. Molin,E. Peronace, A. Rossi, M. Vecchi, and A. Tertulliani (2009), Il terremotoaquilano del 6 Aprile 2009: Rilievo macrosismico, effetti di superficie edimplicazioni sismotettoniche, Quaternario, 22, 235–246.
Goldstein, R. M., and C. L. Werner (1998), Radar interferogram filteringfor geophysical applications, Geophys. Res. Lett., 25, 4035–4038,doi:10.1029/1998GL900033.
GUERRIERI ET AL.: INSAR FIELD RUPTURES 2009 L’AQUILA B12331B12331
15 of 16
Goldstein, R. M., H. A. Zebker, and C. L. Werner (1988), Satellite radarinterferometry: Two‐dimensional phase unwrapping, Radio Sci., 23,713–720, doi:10.1029/RS023i004p00713.
Hamiel, Y., and Y. Fialko (2007), Structure and mechanical propertiesof faults in the North Anatolian Fault system from InSAR observationsof coseismic deformation due to the 1999 Izmit (Turkey) earthquake,J. Geophys. Res., 112, B07412, doi:10.1029/2006JB004777.
Jónsson, S., H. Zebker, P. Segall, and F. Amelung (2002), Fault slip distri-bution of the 1999 Mw 7.1 Hector Mine earthquake, California, estimatedfrom satellite radar and GPS measurements, Bull. Seismol. Soc. Am., 92,1377–1389, doi:10.1785/0120000922.
Maccagno, A. M. (1962), L’Elephas Meridionalis, NESTI di Contrada“Madonna della Strada,” Scoppito (L’Aquila), Stab. Tipograf.G. Genovese, Naples, Italy.
Massonnet, D., and K. L. Feigl (1998), Radar interferometry and its appli-cations to changes in the Earth’s surface, Rev. Geophys., 36, 441–500,doi:10.1029/97RG03139.
McCaffrey, K. J., et al. (2009), Post‐seismic slip on the 6th April 2009L’Aquila earthquake surface rupture, measured using a terrestrial laserscanner (tripod‐mounted lidar), Eos Trans. AGU, 90(52), Fall Meet.Suppl., Abstract U23A‐0023.
Messina, A. P., P. Galli, B. Giaccio, and E. Peronace (2009), Quaternarytectonic evolution of the area affected by the Paganica fault (2009L’Aquila earthquake), paper presented at 28th GNGTS National Confer-ence, Osserv. Geofis. Sper., Trieste, Italy.
Michetti, A. M., F. Brunamonte, L. Serva, and E. Vittori (1996), Trenchinvestigations along the 1915 Fucino earthquake fault scarps (Abruzzo,central Italy): Geological evidence of large historical events, J. Geophys.Res., 101, 5921–5936, doi:10.1029/95JB02852.
Michetti, A.M., L. Ferreli, E. Esposito, S. Porfido, A.M. Blumetti, E. Vittori,L. Serva, andG. P. Roberts (2000), Ground effects during the September 9,1998,Mw = 5.6, Lauria earthquake and the seismic potential of the aseismicPollino region in southern Italy, Seismol. Res. Lett., 71, 31–46.
Moro, M., V. Bosi, F. Galadini, P. Galli, B. Giaccio, P. Messina, andA. Sposato (2002), Analisi paleosismologiche lungo la faglia delM. Marine (alta valle dell’Aterno): Risultati preliminari, Quaternario,15, 267–278.
Okada, Y. (1985), Surface deformation due to shear and tensile faults in ahalf space, Bull. Seismol. Soc. Am., 75, 1135–1154.
Papanikolaou, I. D., G. P. Roberts, and A. M. Michetti (2005), Fault scarpsand deformation rates in Lazio‐Abruzzo, central Italy: Comparisonbetween geological fault slip‐rate and GPS data, Tectonophysics,408(1–4), 147–176.
Papanikolaou, I. D., M. Foumelis, I. Parcharidis, E. L. Lekkas, and I. G.Fountoulis (2010), Deformation pattern of the 6 and 7 April 2009,Mw = 6.3 and Mw = 5.6 earthquakes in L’Aquila (central Italy) revealedby ground and space observations, Nat. Hazards Earth Syst. Sci., 10,73–87, doi:10.5194/nhess-10-73-2010.
Parozzani, G. (1887), Notizie Intorno al Terremoto del 2 Febbraio 1703Ricavate dai Manoscritti Antinoriani, Tip. B. Vecchioni, L’Aquila, Italy.
Patacca, E., P. Scandone, M. Bellatalla, N. Perilli, and U. Santini (1992),La zona di giunzione tra l’arco appenninico settentrionale e l’arco appe-ninico meridionale nell’Abruzzo e nel Molise, Studi Geol. Camerti,1991/2, 417–441.
Price, E. J., and D. T. Sandwell (1998), Small‐scale deformation associatedwith the 1992 Landers, California, earthquake mapped by syntheticaperture radar interferometry phase gradient, J. Geophys. Res., 103,27,001–27,016, doi:10.1029/98JB01821.
Roberts, G. P., et al. (2010), Shallow subsurface structure of the 2009 April6 Mw 6.3 L’Aquila earthquake surface rupture at Paganica, investigatedwith ground‐penetrating radar, Geophys. J. Int., 183, 774–790,doi:10.1111/j.1365-246X.2010.04713.x.
Rosen, P. A., S. Henley, G. Peltzer, and M. Simons (2004), Updated repeatorbit interferometry package released, Eos Trans. AGU, 85(5), 35,doi:10.1029/2004EO050004.
Salvi, S., et al. (2000), Modeling coseismic displacements resultingfrom SAR interferometry and GPS measurements during the Umbria‐Marche seismic sequence, J. Seismol., 4, 479–499, doi:10.1023/A:1026502803579.
Serva, L., A. M. Blumetti, L. Guerrieri, and A. M. Michetti (2002), TheApennine intermountain basins: The result of repeated strong earth-quakes over a geological time interval, Boll. Soc. Geol. Ital., 1, 939–946.
Servizio Geologico d’Italia (2006), Carta geologica d’Italia alla scalaI:50.000, sheet 359, APAT, Rome, Italy.
Uria de Llanos, A. (1703), Relazione o Vero Itinerario Fatto dall’AuditoreAlfonso Uria de Llanos per Riconoscere li Danni Causati dalli PassatiTerremoti Seguiti li 14 Gennaro e 2 Febbraro MDCCIII, StamperiaGaetano Zenobi, Rome.
Valensise, G. (2009), Faglie attive e terremoti: Tempo di cambiare strategie,Geoitalia, 28, 12–17.
Vezzani, L., and F. Ghisetti (1998), Carta geologica dell’Abruzzo, scale1:100,000, Soc. Elaborazioni Cartogr., Florence, Italy.
Vittori, E., et al. (2000), Ground effects and surface faulting in the September–October 1997 Umbria‐Marche (central Italy) seismic sequence,J. Geodyn., 29, 535–564, doi:10.1016/S0264-3707(99)00056-3.
Walters, R. J., J. R. Elliott, N. D’Agostino, P. C. England, I. Hunstad, J. A.Jackson, B. Parsons, R. J. Phillips, and G. Roberts (2009), The 2009L’Aquila earthquake (central Italy): A source mechanism and implicationsfor seismic hazard, Geophys. Res. Lett., 36, L17312, doi:10.1029/2009GL039337.
Wilkinson, M., et al. (2010), Partitioned postseismic deformation asso-ciated with the 2009 Mw 6.3 L’Aquila earthquake surface rupture mea-sured using a terrestrial laser scanner, Geophys. Res. Lett., 37, L10309,doi:10.1029/2010GL043099.
R. Amit, G. Baer, Y. Hamiel, A. Mushkin, and A. Salamon, GeologicalSurvey of Israel, 30 Malkhe Yisrael St., Jerusalem 95501, Israel.A. M. Blumetti, V. Comerci, P. Di Manna, L. Guerrieri, and E. Vittori,
Geological Survey of Italy, High Institute for the EnvironmentalProtection and Research, Via Brancati 48, I‐00144 Roma, Italy. ([email protected])A. M. Michetti and G. Sileo, Dipartimento di Scienze Chimiche ed
Ambientali, Facoltà di Scienze Matematiche, Fisiche e Naturali,Università degli Studi dell’Insubria, Via Valleggio 11, I‐22100 Como,Italy.
GUERRIERI ET AL.: INSAR FIELD RUPTURES 2009 L’AQUILA B12331B12331
16 of 16


