Embed Size (px)
Citation preview

INSTITUTIONS, FINANCIAL MARKETS AND FIRM DEBT
MATURITY
ASLI DEMIRGγΓ-KUNT VOJISLAV MAKSIMOVIC*
SEPTEMBER 1996
First Draft: APRIL 1996
* The authors are at the World Bank and the University of Maryland respectively. We would like tothank Jerry Caprio, Ross Levine, Fabio Schiantarelli, Mary Shirley and Sheridan Titman for helpfulcomments and Jim Kuhn for help with the data. An earlier draft was presented at the World BankConference on Term Finance in June 1996. The views expressed here are the authors' own and notnecessarily those of the World Bank or its member countries.

2
INSTITUTIONS, FINANCIAL MARKETS AND FIRM DEBT MATURITY
ABSTRACT
We examine firm debt maturity in thirty developed and developing countries during the period 1980-1991. We find systematic differences in the use of long term debt between developed and developingcountries and small and large firms. In developed countries firms have more long term debt andgreater proportion of their total debt is held as long term debt. Large firms have more long-term debt- as a proportion of total assets and debt - compared to smaller firms.
We attempt to explain the variation in debt composition by differences in the effectiveness of eachcountry’s legal system, the development of stock markets and the banking sector, the level ofgovernment subsidies, and firm characteristics. Both large and small firms in countries with effectivelegal systems have more long-term debt relative to assets and that their debt is of longer maturity.Both large and small firms in countries with a common law tradition use less long-term debt, relativeto their assets, than firms in countries with a Civil Law tradition. Large firms in common lawcountries also use less short-term debt.
In countries with active stock markets large firms have more long-term debt and debt of longermaturity. Neither the level of activity nor the size of the market is correlated with financing choicesof small firms. By contrast, in countries with a large banking sector, small firms have less short-termdebt and their debt is of longer maturity. Variation in the size of the banking sector does not have acorresponding correlation with the capital structures of large firms. Government subsidies to industryincrease long term debt levels of both small and large firms. For all firms, inflation negativelyaffects the use of long term debt. We also find evidence of maturity matching for large as well assmall firms.

3
Conflicts of interest between the firm’s insiders and outside investors are important determinants of
the firm’s ability to obtain capital. These conflicts can be mitigated by the appropriate choice of
securities or contracts between the firm and its investors.1 An extensive theoretical literature in
corporate finance shows that optimal choice of securities for this purpose depends on the ability of
outsiders to monitor compliance and enforce their legal rights.2 Since the capacity of investors to
protect their investment depends on the financial and legal institutions, firms’ financial structures
should differ systematically across countries. However, little is known about how observed
differences in the institutional and legal environments across countries affect the financing choices of
firms.
In this paper we examine how differences in financial and legal institutions affect the use of debt,
and in particular, the choice of debt maturity by firms in a sample of thirty countries in the period
1980-1991. The sample includes both developed and developing countries, and countries with both
common law and Civil Law based legal systems. We ask four questions.
First, are there any systematic differences in the maturity of debt claims issued by firms in different
countries? Second, if there are, can such differences be accounted for by the characteristics of the
firms in each country? Third, can the differences in the use of debt be explained by institutional
differences, particularly in the development of markets and the enforceability of contracts?
Differences in the use of debt could occur if institutional arrangements in each country facilitate the
use of particular securities to control the opportunistic behavior by firms’ insiders. Finally, is there
evidence that some firms, especially small firms, obtain less long-term debt financing in countries
with less developed financial systems? Financial intermediaries may have a comparative advantage
1 The starting point for the analysis of the role of financial securities in the resolution of conflicts betweendifferent classes of stakeholders are the papers by Jensen and Meckling (1976), Myers (1977) and Myers andMajluf (1984). Jensen and Meckling (1976) define the firm itself as a “nexus of contracts.”

4
in monitoring firms, in particular small firms. Thus, access to credit by small firms, which require
extensive monitoring, may depend on the size of the banking sector.
Several authors have explored the effect of the institutional environment on firm financing choices in
specific countries. Hoshi, Kashyap and Scharfstein (1990) have shown that membership in industrial
groups linked to banks reduces financial constraints on Japanese firms. Calomiris (1993) has
examined the effect of differences between the banking systems of the United States and Germany on
firm financing. Rajan and Zingales (1995) have explored capital structure decisions of firms in five
developed countries and DemirgηΗ -Kunt and Maksimovic (1995) have considered financing choices
in a sample of ten developing countries.
There have been fewer cross-sectional studies of the effect of financial and legal institutions on firm
financing. DemirgηΗ -Kunt and Maksimovic (1996a) have explored the relationship between firm
growth and access to external finance for a sample of both developed and developing countries. They
show that the proportion of firms in each country that grow at rates that exceed those that can be
financed internally is correlated with the perceived effectiveness of the country’s legal system and
several indicators of financial market and institutional development.3 DemirgηΗ -Kunt and
Maksimovic (1996a) use only one indicator of the effectiveness of a country’s legal system. In a
comparative study of legal systems, La Porta, Lopez-de-Silanes, Shleifer and Vishny (LLSV) (1996)
have argued the legal tradition on which a country’s legal system is based, as well as several specific
protections, may also be important in determining whether investors can enforce their claims on the
2 For recent examples of optimal financial structures when investors can observe the firm’s cash flows butcannot enforce legal rights to these cash flows see Hart and Moore (1995) and Bolton and Scharfstein (1993).For a comprehensive review of the financial structure literature see Harris and Raviv (1990).3 Rajan and Zingales (1996) independently examine the effect of the development of financial institutions onindustry growth in a sample of countries. DemirgηΗ -Kunt and Maksimovic (1996b) have exploredcomplementarities in stock market and banking sector development on financing decision of firms in a cross-country sample of firms. Neither of these addresses the question of debt maturity or the quality of enforcementof contracts by the legal systems in each country. Empirical studies of debt maturity, including Barclay andSmith (1995) and Stohs and Mauer (1996), have focused on term financing in the United States only.

5
firm’s assets. Their paper classifies the legal systems of a sample of countries according to their
legal tradition and whether or not they grant investors those specific protections. In our tests below,
we use their classification of legal systems to supplement an index measuring the effectiveness of
each country’s legal system.
The rest of the paper is organized as follows. In Section 2 we take a preliminary look at the
differences in term financing between countries and discuss possible explanations advanced in the
literature. Section 3 discusses the determinants of financial maturity across countries. Section 4
reports cross-sectional empirical tests. Section 5 concludes.
2 CROSS-COUNTRY COMPARISON OF TERM FINANCING
Financial theory suggests that a major factor in firms’ choice of capital structure is the reduction of
the cost of contracting between firms and their providers of capital. These costs depend both on the
characteristics of firms and the institutional environment in which the contracting takes place. Thus,
since countries have very different institutional systems and different compositions of firms,
observed financial structures should vary systematically both across countries.
We can obtain an initial assessment of the extent of these differences by comparing the long-term
and short-term indebtedness of firms for a sample of countries at different levels of economic
development. Our sample consists of firms in nineteen developed economies and eleven developing
countries for the period 1980-1991. The developed countries in our sample are Austria, Australia,
Belgium, Canada, Finland, France, Germany, Hong Kong, Italy, Japan, Netherlands, New Zealand,
Norway, Sweden, Singapore, Spain, Switzerland, United Kingdom, United States. The developing
countries are Brazil, India, Jordan, Korea, Malaysia, Mexico, Pakistan, South Africa, Thailand,
Turkey and Zimbabwe.4
4 The selection of countries and the variables discussed in this section are described in detail in Section 3 below.

6
Insert Figures 1-2 here
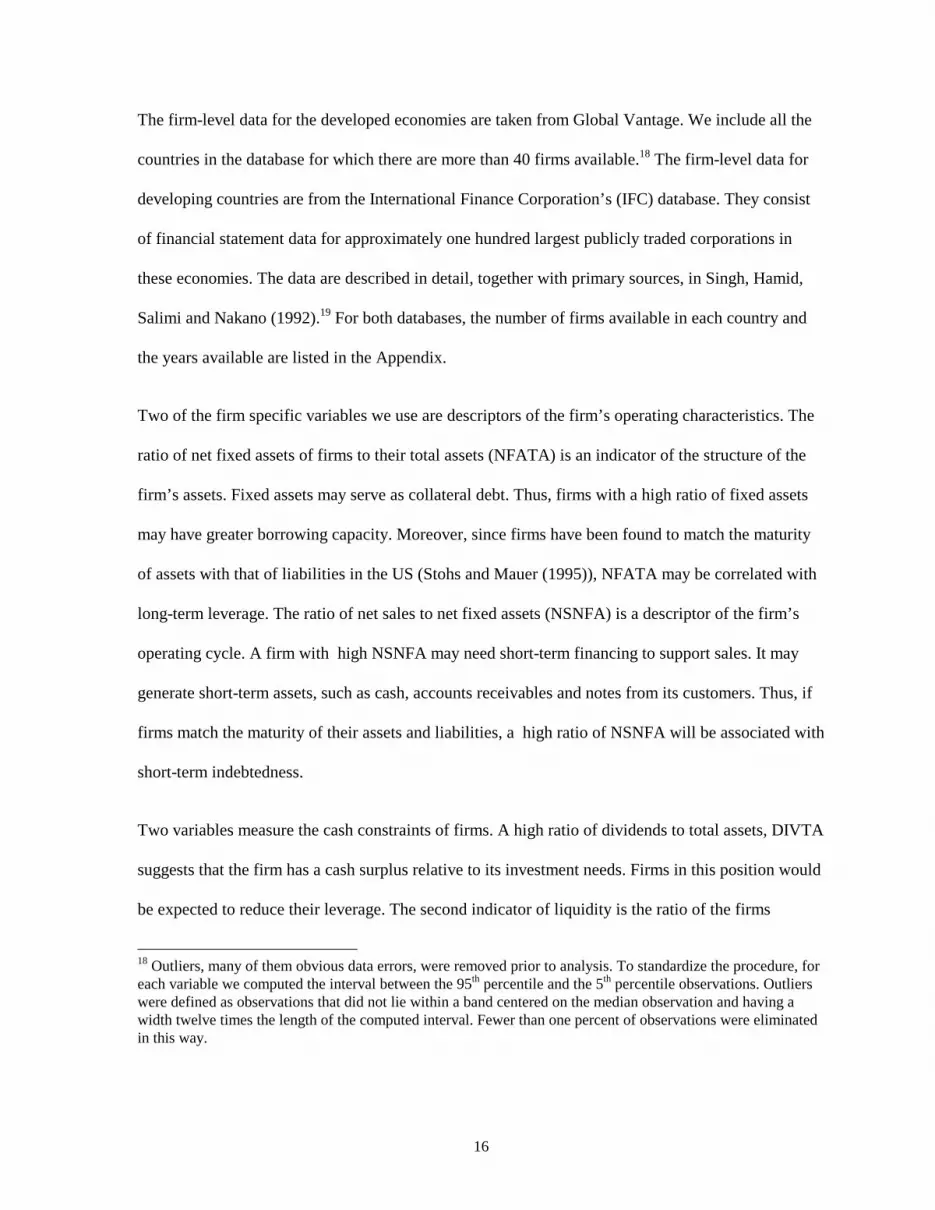
Figure 1 displays the average of long-term debt to total asset ratios for firms in our sample for each
of the thirty countries. The developing countries in our sample are denoted by the darker outline.
Norway has the highest ratio of long-term debt to assets, whereas Zimbabwe has the lowest, at about
one fifth of Norway’s. There is a marked clustering of developing countries at the bottom of the
range, indicating that firms in these countries do not utilize as much long-term debt financing. Figure
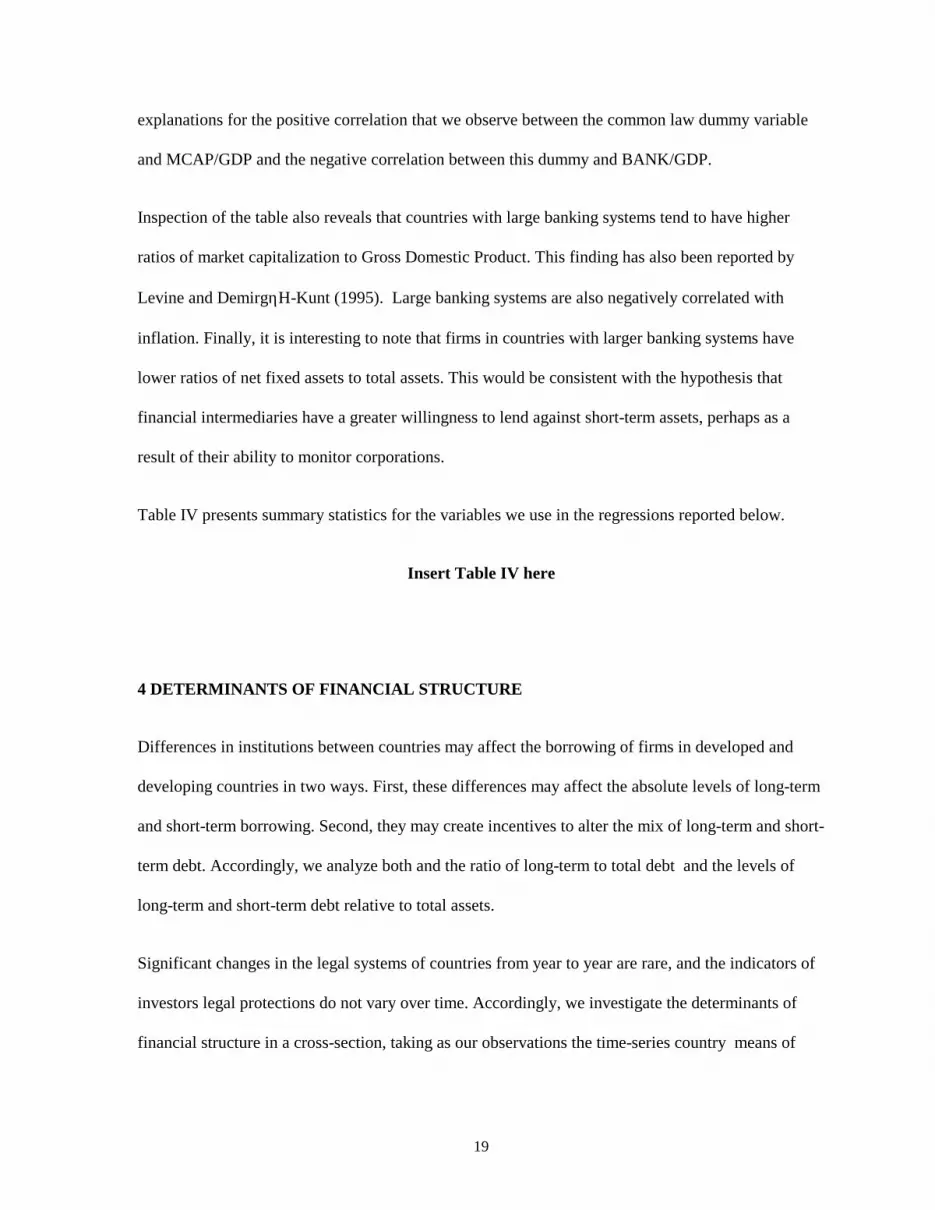
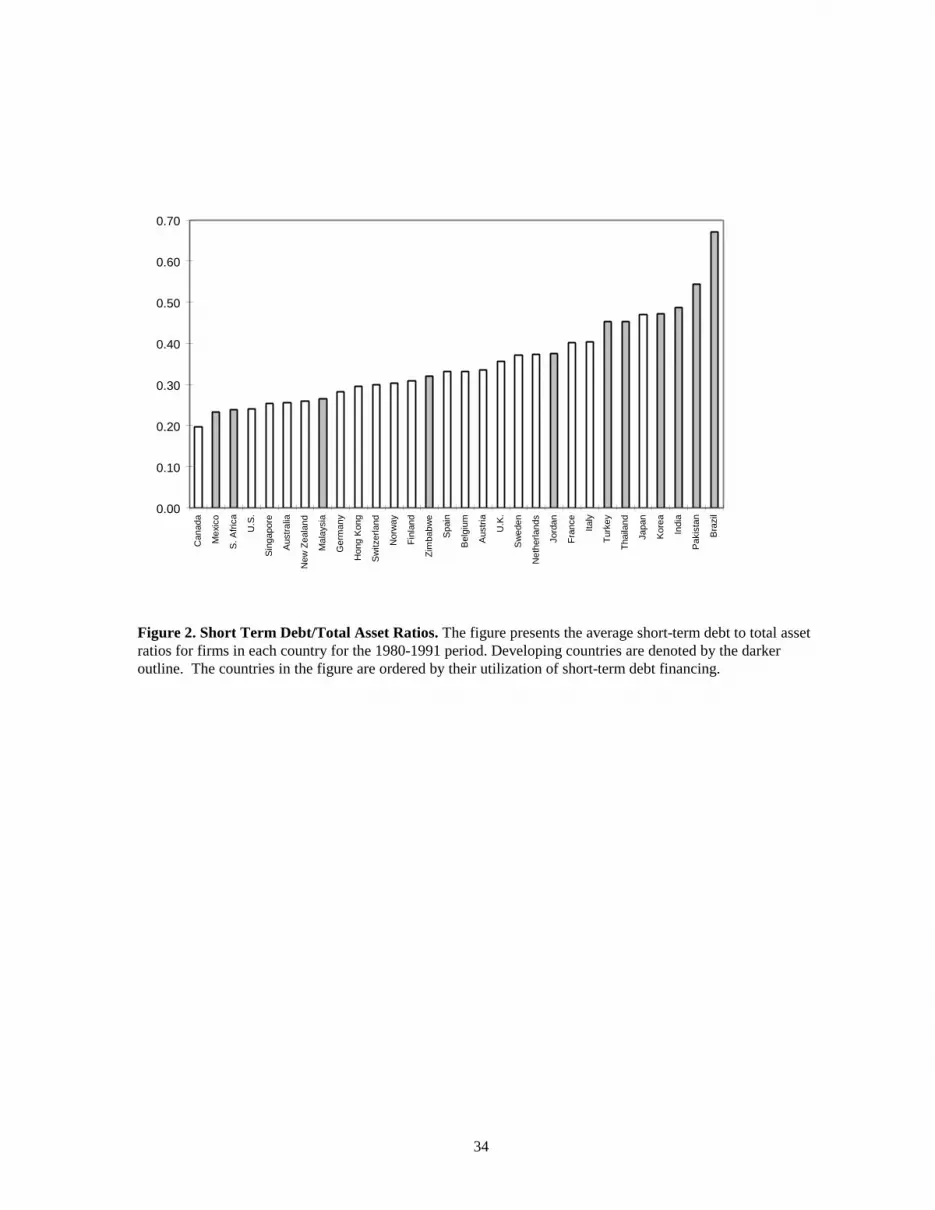
2 displays the ratios of short-term liabilities to total assets.5 While the tendency is not as clear-cut,
firms in developing countries rely more on short-term financial instruments. This pattern is
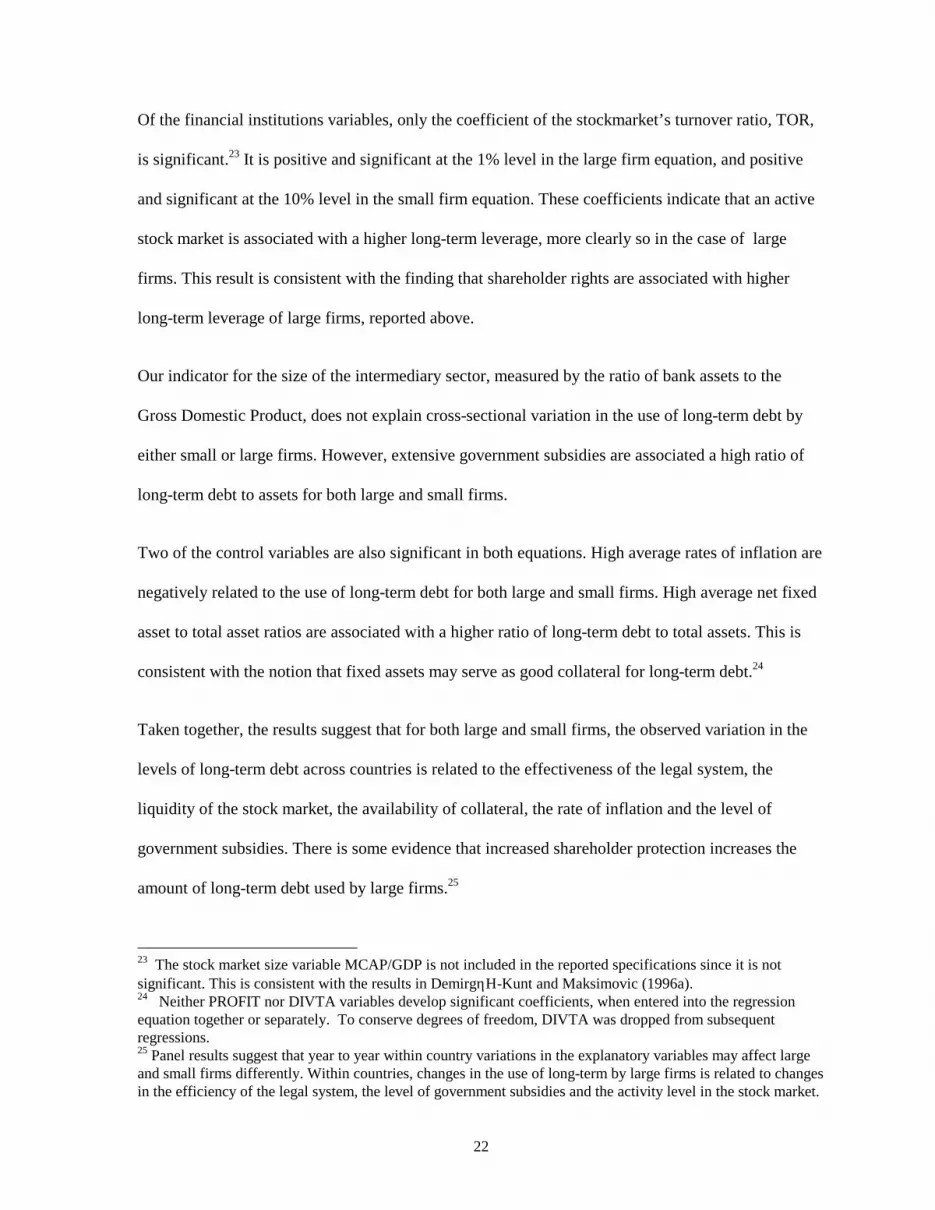
confirmed in Figure 3, which displays the ratio of long-term to total liabilities in our sample of
countries. As a proportion of total debt, firms in developing countries use less long-term debt.
Insert Figure 3 here
The differences in financing patterns across countries reflect differences in institutions and
contracting environments across countries. However, firms with different characteristics may have
different access to financial markets and institutions even within the same economy. Such
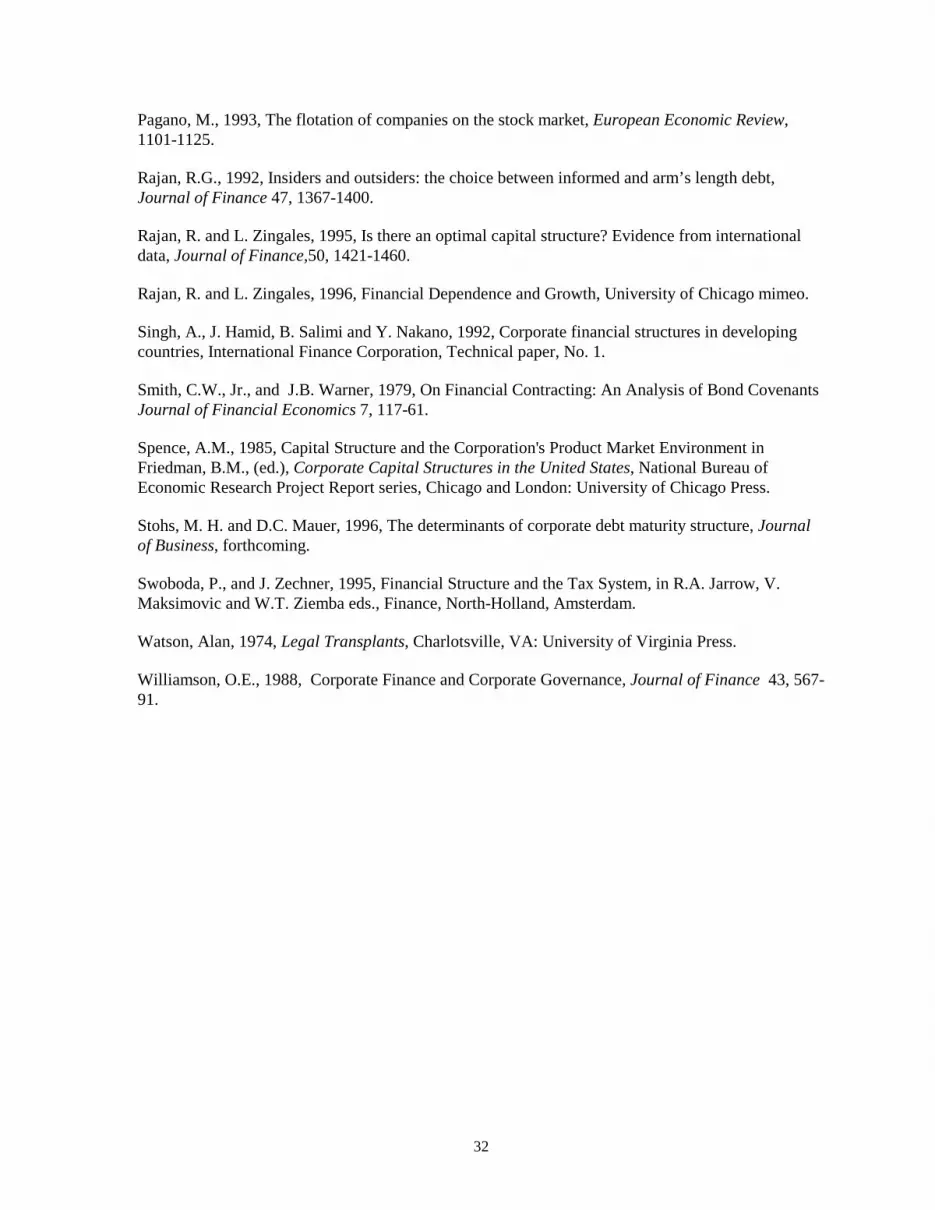
differences may be reflected in different financing patterns. Figure 4 depicts the ratios of short-term,
long-term and total indebtedness and the ratio of long-term to total debt by firm size. The firms in
each country in the sample are divided into quartiles by value of total assets, and the average debt
ratios of each quartile, calculated across countries, is reported. Inspection of the figure reveals that
there are marked and consistent differences across quartiles in the use of long-term debt. Large firms
report higher ratios of long-term debt to total assets and long-term debt to total liabilities. By
contrast, there do not appear to be differences in the ratios of short-term debt to total assets across
firm size quartiles.
5 Note that short-liabilitities include trade credit and other accounts payable, as well as notes payable to banks.

7
Insert Figure 4 here
The figures indicate that there are differences in financing patterns for countries at different levels of
development and for large and small firms. The most pronounced differences are in the use of long-
term debt contracts. In the remainder of the paper we investigate whether these differences can be
explained by firm characteristics, the characteristics of contracting environments and institutions
across countries.
3 MARKETS, INSTITUTIONS AND DEBT MATURITY
In order for the firm to obtain outside financing, and in particular loans, the firm must credibly
commit to respect contracts with investors that control opportunistic behavior. The type of contracts
that permit commitment in any particular case depend both on firm characteristics and on the
institutions in the economy that facilitate monitoring and enforcement of financial contracts.
When the legal system is inefficient or costly to use, short-term debt is more likely to be employed
than long-term debt. As Diamond (1991, 1993) has argued, short-term financing may reduce the
expropriation of creditors by borrowers. The short maturity limits the period during which an
opportunistic firm can exploit its creditors without being in default. It allows the creditors to review
the firm’s decisions frequently and, if necessary, to vary the terms of the financing before the
sufficient losses have accumulated to make default by the borrower optimal. Thus, we would expect
an inverse relationship between the inefficiency of a country’s legal system and the use of long-term
debt.6 To the extent that there are fixed litigation costs in enforcing contracts, long-term debt is
likely to be used most heavily by large firms. The fixed costs may also make the use of long-term
6 This presupposes the existence of a trade-off between the use of long-term and short-term debt. As pointed outby Diamond (1991), short-term financing may give creditors excessive control over the firm’s actions. Inparticular, they may force the firm to abandon valuable long-run projects that benefit the owners if they do notsufficiently benefit the short-term creditors. This situation is most likely to occur if the benefits received by theowners cannot be assigned contractually to the creditors.

8
debt, particularly by small firms, less responsive to small year-to-year changes in the economic
environment.
The government can facilitate the issuance of long-term debt by maintaining a predictable value of
the currency. High, and in particular, variable rates of inflation make it costly for investors and firms
to contract. This problem is compounded when the legal resolution of disputes is subject to delay.7
The government can also promote the use of long-term financing directly by granting implicit loan
guarantees when it adopts a policy of subsidizing loss-making firms or sectors.
Two types of institutions, financial intermediaries and stock-markets, directly influence the financial
structure choices of firms. A prime function of financial intermediaries, such as banks, is that of
monitoring borrowers. As Daimond (1984) argues, intermediaries have economies of scale in
obtaining information. Intermediaries may also have greater incentives to use the collected
information to discipline borrowers than small investors subject to free-rider problems. Thus, we
would expect that a developed banking sector would facilitate access to external finance, particularly
among smaller firms.8 The implications for debt maturity of firms are less clearcut. A developed
banking sector may lead to an increase in the availability of short-term financing, since this form of
financing enables intermediaries to utilize their comparative advantage in monitoring. However, their
economies of scale and their ability to monitor convenants may permit banks to offer long-term loans
that would not be available in a dispersed market. Which of these tendencies predominates is an
empirical question.
7 In principle debt contracts can be indexed. For example, in Brazil all contracts specify a government priceindex used to adjust the nominal payments for inflation. This solution is not fully satisfactory in practice. Duringthe sample period the indices may have been subject to risk of adjustments made for political reasons.Furthermore, the judicial system does not index judgments, which are subject to appeal and other delays.Perhaps not coincidentally, Table 1 reveals that Brazilian firms have little long-term debt.8 See Rajan (1992) for an analysis of the relationship between firms and financial intermediaries.

9
Large stock markets provide opportunities for diversification by entrepreneurs. Thus, in countries
with developed stock markets there may be an incentive for firms to substitute from long-term debt to
equity. However, stock markets also transmit information that is useful to creditors. As Grossman
(1976) and Grossman and Stiglitz (1980) demonstrate, prices quoted in financial markets at least
partially reveal information that more informed investors possess.9 This revelation of information
may make lending to a publicly quoted firm less risky. As a result, the existence of active stock
markets may increase the ability of firms to obtain long-term credit. DemirgηΗ -Kunt and
Maksimovic (1996b) provide empirical evidence that in countries with developing financial markets
firm debt-equity ratios increase with an increase in stock market size and activity.
The amount of long-term and short-term debt that is optimal for a firm when financial markets are
perfect in general depends on the opportunities that the firm’s insiders have for diverting resources
and on the assets which the firm has to serve as collateral. Thus, theory predicts that firms whose
principal asset is the present value of growth opportunities do not optimally borrow against that asset
(Myers (1977)). By contrast, firms with a large quantity of fixed assets already in place do not distort
their incentive value when they borrow. The fixed assets also facilitate borrowing by serving as
collateral. The observed financial structure choices depend on these considerations and on the
institutional factors discussed above. We next investigate the relationship empirically.
3 FIRMS AND COUNTRIES IN OUR SAMPLE
3A. Economic Variables
9 The incentives of stock-market investors to monitor the firm depends on the ownership structure. See Admati,Pfleiderer and Zechner (1994).

10
In Table I we summarize some important facts about the economic development of the countries in
our sample.10 The Gross Domestic Product per capita (GDP/CAP) is a broad indicator of differences
in wealth in each country. In 1991, (GDP/CAP) in the sample ranged from $27,492 in Switzerland to
$359 in Pakistan. Thus, the sample includes some of the richest and poorest countries in the world.
Three additional macro-economic indicators are presented in Table I. The average annual growth rate
of the Gross Domestic Product over the sample period may be an indicator of the financing needs of
firms. On an individual firm level, the existence of growth opportunities may also affect the optimal
financing of projects (Myers (1977)). The average inflation rate over the sample period, shown in the
third column, provides both an indicator of the government’s management of the economy and
evidence on whether the local currency provides a stable measure of value to be used in long-term
contracting. There are major variations in the average rate of inflation in the sample countries. The
average annual rate of inflation is highest in Brazil, at 327.6% , and lowest in Japan at 1.5% per
annum.
Insert Table I
The final economic indicator shown in Table I is a measure of the government’s subsidies to the
corporate sector in each country. Government subsidies affect financial structure decisions because
implicit or explicit backing of corporations by the government may distort market incentives and
permit some firms to obtain long-term loans on favorable terms.11 Our measure of the government’s
subsidies is the level of government grants as a percentage of the Gross Domestic Product. More
precisely, we measure the sum of grants on current account by the public authorities to (i) private
industries and public corporations and (ii) government enterprises to compensate for the losses which
10 The sources for the variables discussed in this section are given in the Appendix.11 The Dome Petroleum Harvard Business School case provides a graphic illustration of the effect of implicitgovernment loan guarantees on financial structure Their effect is qualitatively similar to that of depositinsurance in the banking sector. For a discussion of deposit guarantees see Kane (1989).

11
are the consequence of policies of the public authorities.12 As the last column of Table I reveals, the
level of government subsidies is significant is some countries, and exceeds 10% of the GDP in the
case of Brazil.
3B. Legal and Financial Institutions
We explore the relationship between firms’ financing choices and the state of development of both
the legal and the financial institutions in our sample of countries. The principal indicators of legal
and financial development are given in Table II.
Insert Table II
Legal Institutions
We expect that high incomes, measured by Gross Domestic Product per capita, to be positively
correlated with the effectiveness of state institutions that enforce contracts, and thus, of the effect of
the legal environment on financial structure decisions. As a more direct indicator of the efficiency of
the legal system in each country, we use a commercially available index of the level of law and order
in each country, LAWORDER. This index, prepared by the International Country Risk Guide is
scored on a six point scale and aggregates annual reports by a panel of more than a hundred analysts.
It measures the extent to which citizens of a country are willing to accept the established institutions
to make and implement laws and to adjudicate disputes. Low levels of the index denote less reliance
on the legal system to mediate disputes. A second indicator, the index of legal efficiency, produced
by Business International Corporation is also presented for comparison. This second indicator is an
12 Thus, this variable measures realized expenditures but not direct instructions to business or the level of ex-ante commitments made by each government. Over a period, we would expect a correlation betweencommitments and expenditures.

12
index of the efficiency and integrity of the legal environment as it affects business, and in particular
foreign firms. This index is scored from zero to ten, with lower scores indicating lower efficiency.
LLSV have argued that legal systems based on common law may offer investors different protections
than those based on Civil Law.13 Such differences may translate into differences in the optimal
contracts between firms and investors. To test for this relationship we follow LLSV in defining an
indicator variable, COMMON, which is one if the country’s legal system is based on common law
and zero if it based on Civil Law. As Table II reveals, the legal systems of thirteen countries in our
sample are based on common law and those of seventeen countries are based on Civil Law.
Financial structure choices may also be affected by the specific provisions of each countries
commercial laws. To investigate further the effect of differences in legal systems we use the
indicators of creditor and shareholder rights compiled and discussed in detail LLSV. LLSV classify
countries according to whether or not they provide creditors with the following five specific
protections. First, whether the bankruptcy laws prohibit an automatic stay on assets, which would
prevent automatic liquidations of insolvent firms by secured creditors. The existence of an automatic
stay benefits managers and shareholders over secured creditors.14 Second, whether secured creditors
are permitted to repossess their collateral in bankruptcy or whether some third party claims, such as
those of the government or the employees take priority. Third, whether the bankruptcy law prohibits
borrowers from unilaterally obtaining court protection from creditor demands. If distressed
borrowers can obtain such protection unilaterally, their bargaining power is increased. Fourth,
whether creditors can dismiss managers and replace them with administrators when a firm becomes
bankrupt. In addition, LLSV note whether or not the law of each country requires all firms to
maintain a reserve of equity capital. In countries where this requirement exists, firms that do not
fulfill it may be dissolved.

13
In principle, the creditor rights identified are important in defining feasible contracts between firms
and investors. However, there may be no direct statistical relationship between the existence of a
specific right and a specific financial contract, such as long-term debt, even when that right is
important in enforcing the contract. For example, if the existence of a specific right is necessary, but
not sufficient, to make a financial contract enforceable, the statistical relationship between that right
and the use of the contract may be weak. The relationship between a particular creditor protection
and particular debt contract may also be affected by the existence of spillover effects of the creditor
protection on other contracts. For example, strong creditor rights may increase the incentives of
financial institutions to monitor firms, thereby also making stock investments in those firms more
attractive. The size of these spillovers may depend on the development of the stock market and
financial institutions and on the precise provisions of the investor protection laws. Spillovers may
also work in the opposite direction. In some, but not all, countries financial intermediaries hold both
the stocks and debt of corporations.15 As a result, intermediaries with an equity stake in a firm may
be willing to make loans even when creditor protection is relatively weak.
With these caveats in mind, our examination of the relationship between specific creditor protections
and financial structure is exploratory in nature. We give each country a score on an empirically
defined “index of creditor rights” based on whether its laws grant creditors the legal protections
identified above. Specifically, we give each country a score of one for each of the following
conditions that its bankruptcy law satisfies: (i) does not permit an automatic stay on assets, (ii) does
not allow borrowers to unilaterally seek bankruptcy protection, (iii) assures secured creditors the
right to collateral and (iv) does not grant the managers tenure pending resolution of bankruptcy. If
corporations are requited to maintain a capital reserve, then the size of that reserve as a proportion of
13 Watson (1974) discusses differences in legal traditions based on common law and on civil law.14 Note that this provision may also benefit unsecured creditors over secured creditors.15 Hauswald (1996) examines how ownership of both stock and equity by intermediaries alters their incentives toreorganize firms in distress.

14
assets is added to the index. The index is presented in Table 2. Scores range from a high of 4 and a
low of 0.1. Some developing countries, such as India and Pakistan, score highly, whereas some
developed countries, like France and Germany, have low scores. In addition to using our empirical
index of creditor rights, in the regressions below we also test separately for the effect of each
component of the creditor rights index.
We proxy for the rights of shareholders using an index developed by LLSV. This index is scored on a
scale of one to five. It is obtained by adding a score of one for each of the following elements
fulfilled: (i) if sharholders are allowed to vote by mail, (ii) if they are not required to deposit their
shares with a trustee prior to voting, (iii) if the law allows cummulative voting for directors and (iv)
if the law gives minority shareholders special protection, and (iv) if the minimum percentage of share
capital that entitles a shareholder to call for an extraordinary general meeting is less than or equal to
10 percent. This index measures the costs faced by minority investors who want to influence
decisionmaking within the firm, and is presented, for completeness, in Table II.
The index is subject to the same caveats as the index of creditor rights presented earlier. Whether the
costs faced by small shareholders when exercising their rights are important in determining firms’
financial structure decisions will depend on whether there also exist large investors or financial
intermediaries that can enforce shareholder rights. If these large investors exist, then costs faced by
small outside investors may not be material in determining financing patterns.
Financial Institutions
Access to publicly traded equity markets is measured by the ratio of stock market capitalization to
Gross Domestic Product (MCAP/GDP).16 Within our sample there is considerable variation in this
ratio, ranging from 1.35 in South Africa to 0.04 in Pakistan. Interestingly, in some of the more

15
developed countries, such as Italy, the MCAP/GDP is lower than is some of the developing countries,
such as Malaysia (0.15 compared to 0.88, respectively).17
In addition to size, we also measure the activity in the stock markets of each country. The activity
level of the equity markets is measured by the turnover ratio (TOR), computed by dividing the total
value traded by the market capitalization. Higher values of the turnover ratio indicate a higher level
of liquidity. As noted above, a high turnover may also increase the incentives for investors to become
informed. Thus, a high turnover may facilitate external monitoring of corporations. This variable was
found to be a good indicator of stock market development by DemirgηΗ -Kunt and Levine (1995) and
DemirgηΗ -Kunt and Maksimovic (1996a,b).
Access to financial intermediaries by firms is measured by the ratio of the domestic assets of deposit
banks to the Gross Domestic Product. Again, there are wide variations across countries, both within
the developed countries (for example, Japan has a ratio of 1.2 while the US has a ratio of 0.48) and
developing countries (compare Malaysia at .77 with Turkey at 0.25).
3C Firm Specific Characteristics
An important consideration in the choice of financial structure by firms is the reduction of agency
costs. The particular types of agency costs to which the firm is exposed and their magnitude will in
general vary from firm to firm. Thus, the observed differences in financial structures in our sample
of countries depend in part on the characteristics of the population of firms in each economy. We
control for the differences in firm characteristics between countries by introducing firm-specific
variables that are suggested by theory and that are empirically useful in explaining financial structure
decisions of individual firms in a subset of our sample (DemirgηΗ -Kunt and Maksimovic (1995)).
16 See DemirgηΗ -Kunt and Levine (1995) for a discussion of alternative indices of stock market development.The statistics on financial markets and intermediaries quoted in this paragraph are compiled in that paper.17 For a discussion of the determinants of market size see Pagano (1993) and Allen and Gale (1994).
16
The firm-level data for the developed economies are taken from Global Vantage. We include all the
countries in the database for which there are more than 40 firms available.18 The firm-level data for
developing countries are from the International Finance Corporation’s (IFC) database. They consist
of financial statement data for approximately one hundred largest publicly traded corporations in
these economies. The data are described in detail, together with primary sources, in Singh, Hamid,
Salimi and Nakano (1992).19 For both databases, the number of firms available in each country and
the years available are listed in the Appendix.
Two of the firm specific variables we use are descriptors of the firm’s operating characteristics. The
ratio of net fixed assets of firms to their total assets (NFATA) is an indicator of the structure of the
firm’s assets. Fixed assets may serve as collateral debt. Thus, firms with a high ratio of fixed assets
may have greater borrowing capacity. Moreover, since firms have been found to match the maturity
of assets with that of liabilities in the US (Stohs and Mauer (1995)), NFATA may be correlated with
long-term leverage. The ratio of net sales to net fixed assets (NSNFA) is a descriptor of the firm’s
operating cycle. A firm with high NSNFA may need short-term financing to support sales. It may
generate short-term assets, such as cash, accounts receivables and notes from its customers. Thus, if
firms match the maturity of their assets and liabilities, a high ratio of NSNFA will be associated with
short-term indebtedness.
Two variables measure the cash constraints of firms. A high ratio of dividends to total assets, DIVTA
suggests that the firm has a cash surplus relative to its investment needs. Firms in this position would
be expected to reduce their leverage. The second indicator of liquidity is the ratio of the firms
18 Outliers, many of them obvious data errors, were removed prior to analysis. To standardize the procedure, foreach variable we computed the interval between the 95th percentile and the 5th percentile observations. Outlierswere defined as observations that did not lie within a band centered on the median observation and having awidth twelve times the length of the computed interval. Fewer than one percent of observations were eliminatedin this way.

17
earnings before interest and taxes to its total assets (PROFIT). Several studies have found a strong
negative relationship between this variable and leverage, both in the US (e.g., Spence (1985) and in
developing countries (DemirgηΗ -Kunt and Maksimovic (1995a)).20
The preliminary evidence presented in the figures above suggests that the financing decisions of
large and small firms may be differently determined. Accordingly, for the most part we analyze them
separately. For each economy we divide our panel of firms into quartiles based on asset size. Our
sample of large firms consists of the largest quartile of firms in each country. The sample of small
firms consists of firms in that quartile of firms in each country which most closely approximates the
smallest quartile of firms in our developing countries in size, where size is measured by the ratio of
firm’s assets to the economy’s Gross Domestic Product. Thus, the firms in this sample have
approximately the same size relative to their economies. For each country, the firm-specific
variables are constructed by taking annual averages of the values for the sub-samples of large and
small firms separately.
Insert Table IIIA and IIIB here
We present correlations matrices for the variables in Table III. Simple correlations between country
means of the variables of interest (LTDTA, STDTA and LTDTD) and the explanatory variables are
shown in Table IIIA for large and small firms separately. The two variables measuring for the
effectiveness of the legal system, LAWORDER and LEGAL, are significantly correlated with all of
19 Singh, Hamid, Salimi and Nakano (1992) does not list the primary sources for the data for Brazil, which weregathered after that technical report was prepared. The data were collected from the publications of the VargasFoundation of Brazil.20 Firms’ capital structures also depend on the tax advantages of debt and equity financing. See Swoboda andZechner (1995) for a comparative discussion of tax systems. Several factors make the effect of tax incentives onthe capital structures of firms difficult to quantify. The complexity of tax systems, with both federal and localtaxes, makes it difficult to compare the benefits debt across a large sample of countries. As shown by Grahamet al (1996), effective tax rates may significantly differ from statutory tax rates. Moreover, our interest is not onthe total amount of debt that a firm has, but on the composition of the firm’s debt and the ratio of long-term toshort-term debt. The implications of different tax systems for the composition of debt and for debt maturity arenot clearcut. As a result, we do not include tax variables in our cross-sectional regressions.

18
our financial structure variables. The effectiveness of the legal system is highly correlated with
greater reliance on long-term debt and smaller reliance on short-term debt. The signs of the
correlations between the financial structure variables and the Gross Domestic Product per capita
parallel those between the financial structure variables and the legal effectiveness variables.
However, the correlations with the legal effectiveness variables are higher and more statistically
significant. Of the other legal variables, the most interesting correlations are with the creditor rights
index. High scores on the index of creditor rights are associated with a greater reliance of short-term
debt over long-term debt and lower absolute levels of the ratio of long-term debt to total debt. This is
consistent with the argument by Diamond (1991) that lenders that engage in monitoring have an
incentive to make short maturity loans. The correlations between the financial structure variables and
two other legal variables, the index of shareholder rights and the dummy for common law are of
smaller magnitude. Finally, correlations involving the institutional and firm-specific control variables
show less evidence of statistical significance.
Panel IIIB explores the raw correlations between the explanatory variables using data for all firms in
the sample, regardless of size. The legal effectiveness variables, LAWORDER and the LEGAL, are
highly positively correlated with income per capita, and with the existence of a large banking sector.
The relationship between these variables and the other institutional variables are mixed. However,
firms in countries with an effective legal system, as measured by both these variables, tend to have a
lower ratio of net fixed assets to total assets, to be on the average less profitable and to pay out lower
dividends then firms in countries with less effective legal systems.
The three legal variables that measure specific characteristics of the legal system show fewer
significant correlations. As pointed out by LLSV, countries with a common law tradition have better
shareholder and creditor rights. However, in these countries the correlation with shareholder rights is
stronger, indicating a relative predilection for protecting shareholders. This may be one of the
19
explanations for the positive correlation that we observe between the common law dummy variable
and MCAP/GDP and the negative correlation between this dummy and BANK/GDP.
Inspection of the table also reveals that countries with large banking systems tend to have higher
ratios of market capitalization to Gross Domestic Product. This finding has also been reported by
Levine and DemirgηΗ -Kunt (1995). Large banking systems are also negatively correlated with
inflation. Finally, it is interesting to note that firms in countries with larger banking systems have
lower ratios of net fixed assets to total assets. This would be consistent with the hypothesis that
financial intermediaries have a greater willingness to lend against short-term assets, perhaps as a
result of their ability to monitor corporations.
Table IV presents summary statistics for the variables we use in the regressions reported below.
Insert Table IV here
4 DETERMINANTS OF FINANCIAL STRUCTURE
Differences in institutions between countries may affect the borrowing of firms in developed and
developing countries in two ways. First, these differences may affect the absolute levels of long-term
and short-term borrowing. Second, they may create incentives to alter the mix of long-term and short-
term debt. Accordingly, we analyze both and the ratio of long-term to total debt and the levels of
long-term and short-term debt relative to total assets.
Significant changes in the legal systems of countries from year to year are rare, and the indicators of
investors legal protections do not vary over time. Accordingly, we investigate the determinants of
financial structure in a cross-section, taking as our observations the time-series country means of

20
each variable. This specification, estimated using White’s adjustment for heteroscedasticity, is
reported in Panels A-C of Tables V. 21
4.1 Long-Term Debt
Panel A of Table V presents OLS regressions explaining the ratio of long-term debt to total assets
(LTD/TA) for the largest and smallest quartiles of firms in each country over the sample period.
Insert Table V here
Column (1) of Panel A reports the regression of LTD/TA of large firms on the Gross Domestic
Product per capita. GDP/CAP measures systematic differences that exist in corporate long-term
indebtedness between richer and poorer economies. For large firms this variable “explains,” 44% of
the differences in long-term financing over the sample period. The positive coefficient, significant at
the 1% level, indicates that sample corporations in richer countries use long-term financing more.
The size of the coefficient indicates that differences in the GDP per capita in our sample are
associated with very different levels of long-term debt. Thus, a relatively small $1000 increase in the
GDP per capita (the difference between, say, Pakistan and Thailand) translates into an increment of
0.09 in the value of the ratio of long term debt to total assets. Increases of $10,000 in the GDP per
capita (the difference between, say, Pakistan and Singapore) translates into an increase of 0.09 in
long-term leverage, whereas differences between some of the richest and poorest countries in the
sample (the difference of approximately $20,000 between, say, Pakistan and Norway) is associated
with an impressive increase of 0.18 in the value of the ratio of long-term debt to total assets.
21 We have also estimated panel regressions in which each financial structure variable of interest is regressed onthe explanatory variables and country and year dummies. This specification is potentially misspecified because ittreats cross-sectional and time-series variation equally. Moreover, annual observations may not be independent.However, it has the advantage of using all the data, and was reported in an earlier version of this paper. Belowwe note some additional insights suggested by the panel results.

21
The results of corresponding regression of the LTD/TA of small firms on GDP per capita are
qualitatively similar. Together with dummies, GDP per capita “explains” 41% of the variation in the
panel. However, the coefficient of GDP per capita indicates that the variation in the use of long-term
debt in richer and poorer countries by larger and smaller firms is of similar magnitude. For both large
and small firms, GDP per capita loses significance when the model is augmented with our
institutional explanatory variables.
In the remainder of Panel A we attempt to determine what specific institutional variables explain
differences in the use of debt between countries. In columns (2) and (4) we regress the LTD/TA on
the full set of firm-specific and institutional variables and on our indicators of legal system for large
and small firms respectively. There is high degree of consistency between results of the large and
small firms’ cross-sectional equations. Two results pertaining to the legal environment are of
particular interest. First, reliance on long-term debt by both large and small firms is higher in
countries with an effective legal system.22 This finding is consistent with the findings of Demirguc-
Kunt and Maksimovic (1996) that the effectiveness of the legal system is highly correlated with
external financing of firm growth. Second, both large and small firms in countries with the common
law tradition have less long-term debt. Of the investor rights variables, only the index of shareholder
rights is statistically significant at the 5% level, and only for the large firm equation. The positive
coefficient indicates that shareholder rights are associated with a greater use of long-term debt.
Interestingly, high values of the index of creditor rights are not correlated with the use of long-term
debt. We explore the role of creditor rights in more detail below.
22 In the reported equations the efficiency of the legal system is measures by the variable LAWORDER. Thevariable LEGAL is not used since this index is targeted towards foreign firms. When this variable is enteredinstead of LAWORDER , its coefficient was of the same sign, although not always signficant, and if so, at alower level.
22
Of the financial institutions variables, only the coefficient of the stockmarket’s turnover ratio, TOR,
is significant.23 It is positive and significant at the 1% level in the large firm equation, and positive
and significant at the 10% level in the small firm equation. These coefficients indicate that an active
stock market is associated with a higher long-term leverage, more clearly so in the case of large
firms. This result is consistent with the finding that shareholder rights are associated with higher
long-term leverage of large firms, reported above.
Our indicator for the size of the intermediary sector, measured by the ratio of bank assets to the
Gross Domestic Product, does not explain cross-sectional variation in the use of long-term debt by
either small or large firms. However, extensive government subsidies are associated a high ratio of
long-term debt to assets for both large and small firms.
Two of the control variables are also significant in both equations. High average rates of inflation are
negatively related to the use of long-term debt for both large and small firms. High average net fixed
asset to total asset ratios are associated with a higher ratio of long-term debt to total assets. This is
consistent with the notion that fixed assets may serve as good collateral for long-term debt.24
Taken together, the results suggest that for both large and small firms, the observed variation in the
levels of long-term debt across countries is related to the effectiveness of the legal system, the
liquidity of the stock market, the availability of collateral, the rate of inflation and the level of
government subsidies. There is some evidence that increased shareholder protection increases the
amount of long-term debt used by large firms.25
23 The stock market size variable MCAP/GDP is not included in the reported specifications since it is notsignificant. This is consistent with the results in DemirgηΗ -Kunt and Maksimovic (1996a).24 Neither PROFIT nor DIVTA variables develop significant coefficients, when entered into the regressionequation together or separately. To conserve degrees of freedom, DIVTA was dropped from subsequentregressions.25 Panel results suggest that year to year within country variations in the explanatory variables may affect largeand small firms differently. Within countries, changes in the use of long-term by large firms is related to changesin the efficiency of the legal system, the level of government subsidies and the activity level in the stock market.

23
4.2 Short-term Debt
Panel B of Table V examines cross-country variation in the use of short-term debt. In contrast with
the long-term debt equations reported in Panel A, for both large and small firms, cross-sectional
variation in the Gross National Product per capita by itself does not explain differences in the use of
short-term debt. Since the Gross National Product per capita is a proxy for the effectiveness of
institutions, this finding suggests that cross-country institutional differences are less important in
explaining differences in the use of short-term debt. The estimates of the expanded specification (2)
confirm this.
For large firms, the coefficients of two legal indicator variables are significant. Large firms in
countries with more effective legal systems have less short-term debt. The same is true for countries
whose legal system is based on common law. However, we do not find that the use of short-term debt
by small firms is affected either by the effectiveness of the legal system or by whether or not the
legal system is based on common law. The indices of shareholder or creditor rights do not help
explain the use of short-term debt for either large or small firms.
The coefficient of only one of the financial system variables is statistically significant. Small firms in
countries with a large banking sector have less short-term debt. Cross-country variation in the stock
market or in values of the indices of investor protection does not help explain differences in the
usage of short-term debt. Similarly, the indicator of government subsidies as a fraction of the gross
domestic does not improve the explanatory power of the regressions.
These factors were not associated with changes in the use of long-term debt by small firms in the panelregressions. This difference may occur because small firms, which may have less access to financial markets,governmental subsidies and the legal system, are less likely to be affected by marginal improvements infinancial markets and the legal system and changes in the level of subsidies. This is consistent with theadditional finding that within country variation in long-term borrowing by small firms was more strongly relatedto yearly changes in the size of the banking sector. By contrast, the cross-sectional differences between countriesthat we measure in the paper are likely to be of a greater magnitude. Thus, they affect small firms as well aslarge firms.

24
Inspection of columns (2) and (4) reveals that several firm-specific variables help explain short-term
leverage. One of these variables, the ratio of net sales to net fixed assets NSNFA is positively
associated with short-term borrowing for both small and large firms. A high ratio of net fixed assets
to total assets is associated with lower levels of short-term borrowing for large firms. This is
consistent with the notion that such firms more easily match the maturity of borrowing with the
maturity of their assets. Thus, large firms with fixed assets may borrow long-term in preference to
short-term borrowing. Interestingly, more profitable large firms have more short-term debt, whereas
we do not obtain a similar significant relationship for small firms. Small firms that grow fast rely
more heavily on short-term debt. This finding is consistent with Myers (1977) hypothesis that growth
options are not financed using long-term debt.
4.3 Debt Maturity
We explore how the maturity of the firm’s liabilities varies across countries in Panel C. As our
indicator of maturity, we utilize the ratio of long-term liabilities to total-liabilities. The
specifications used parallel the regressions reported in Panels A and B. However, to control for the
firm’s total debt level we add the lagged ratio of total liabilities to total assets to the explanatory
variables to the specifications in Panel C.
The coefficients of debt maturity on the Gross Domestic Product per Capita indicate that firms in
more developed countries have debt of longer maturity. The results of cross-country regressions of
debt maturity on firm-specific and institutional variables are consistent with the results for long-term
and short-term debt reported above. The indicator of the legal system’s efficiency in settling disputes,
LAWORDER, is positive and significant at the 1% level in the large firm equation and positive
significant at the 10% level in the small firms equation. Thus, we find evidence that the higher the
quality of legal institutions, the greater the proportion of long-term financing. There is also some
evidence that the maturity of debt is longer for small firms in common law countries (the coefficient

25
of the dummy COMMON is positive and significant at the 10% level in the small firm equation (2)).
There is no evidence of a similar significant effect for the largest firms in each country. These results
are consistent with the previous finding that both large and small firms in common law countries use
less long-term debt and that large firms only in common law countries use less short-term debt.
Consistent with the previously reported results, large firms in countries with active stock markets
have longer maturity of debt. Interestingly, small firms in countries with large banking systems also
have debt of longer maturity. Together with the finding that small firms in countries with large
banking systems have less short-term debt, this finding suggests that a large banking sector enables
small firms to extend the maturity of their debt.
The coefficients of several of the control variables are of interest. The coefficient of inflation is
negative for both large and small firms, but is only significant in former case. High ratios of sales of
net sales to net fixed assets are negatively associated with long-maturity of debt for both large and
small firms. Small firms in countries that are growing fast have less debt than small firms in slow
growing countries. A high ratio of net fixed assets to total assets and high profits are negative and
significant in the large firm equation. They are also negative, but not significant in the small firm
equation.
4.4 Specific Legal Protections
In Table V we find no evidence that the index of creditor rights helps predict either short-term and
long-term leverage or debt maturity. In this subsection we explore the relationship between creditor
rights and debt levels in more detail. To this end, we replace the creditor rights index by its
individual components in the large-firm and small-firm cross-sectional equations in Panels A-C of
Table V. Table VI shows the coefficients of the individual components of the index in these

26
equations. For convenience, we also present the coefficients of the index from Panels A-C of Table
V.
Insert Table VI here
Inspection of Table VI reveals that the variation in most of the components of the creditor rights
index in this sample is not significantly related to the debt composition decisions of large firms. The
one exception is variation in the right of secured creditors to seize collateral in bankruptcy. This right
is associated with increased short-term borrowing and a significantly shorter maturity of debt for
large firms. The interpretation of a significant partial correlation between any single legal protection
and the use of a financial contract must be tentative because the importance of the protection may
vary in different systems. However, this partial correlation is consistent with the proposition that
short-term lenders may have a greater incentive to monitor borrowers and benefit most from an
ability to repossess secured assets, as suggested by Diamond (1991). Interestingly, the rights of
secured creditors are not similarly correlated with the financing decisions of small firms.26
Small firms in countries whose laws allow managers to stay in control during reorganisations have
significantly less short-term debt. As a result of this, the ratio of long-term debt to short-term debt is
higher for these firms in such countries. Again, interpretation must be tentative. It is however, also
consistent with the conjecture that more monitoring occurs with short-term debt, and that the
availability of short-term financing is reduced when the ability of creditors to act in protection of
their interests is curtailed.
Table VI provides some evidence that small firms in countries where there exists an automatic stay
on assets of bankrupt firms borrow more, although the maturity of their debt remains unaffected. In
26 Note that is some countries, such as the United States, trade creditors may possess rights which other securedcreditors do not possess. Thus, systematic differences in the amount of trade credit used by large and small firmswould confound our results.

27
bankruptcy, an automatic stay benefits borrowers at the expense of secured creditors. Thus, owners
of small firms may wish to borrow more if the automatic stay credibly commits lenders not to
expropriate them in the event that their firms become financially distressed.
5 CONCLUSIONS
We examine maturity of firms’ liabilities in thirty developed and developing countries during the
period 1980-1991. We find systematic differences in the use of long term debt between developed
and developing countries and small and large firms. In developed countries firms have more long
term debt and greater proportion of their total debt is held as long term debt. This is true regardless of
firm size across our sample of countries. Also large firms have more long term debt- as a proportion
of total assets and debt- compared to smaller firms. We attempt to explain the observed cross-country
variation leverage and maturity of liabilities by differences in the legal systems, financial institutions,
government subsidies, as well as firm characteristics and macroeconomic factors, such as the rate of
inflation and the economy’s growth rate.
We find that both large and small firms in countries with legal systems that are perceived to be
effective have more long-term debt relative to assets and that their debt is of longer maturity. Large
firms in countries with effective legal systems have lower short-term liabilities, suggesting that such
firms may be substituting long-term debt for short-term debt. We do not find evidence of a similar
reduction in short-term liabilities by small firms, perhaps because small firms tend to use less long-
term debt than large firms. These conclusions are consistent with the findings of Demirguc-Kunt and
Maksimovic (1996) that a higher proportion of firms in countries with effective legal systems finance
their growth externally.
We also test the hypothesis that tradition on which a country’s legal system is based may influence
the optimal financing of firms in that country. We find that both large and small firms in countries

28
with a common law tradition use less long-term debt, relative to their assets, than firms in countries
with a Civil Law tradition. Large firms in common law countries also use less short-term debt. The
maturity of debt of large firms in common law and civil law countries does not differ significantly,
whereas it is longer for small firms.
The structure of financial institutions is also an important determinant of firms’ financing choices.
Consistent with Demirguc-Kunt and Maksimovic (1996) results on external financing of investment,
we find that whereas the variation in the size of the stock market relative to the country’s economy is
not correlated with financing patterns, variation in the level of activity of the stock market does have
explanatory power for large firms. In countries with active stock markets large firms have more long-
term debt and debt of longer maturity. Neither the level of activity nor the size of the market is
correlated with financing choices of small firms. By contrast, in countries with a large banking
sector, small firms have less short-term debt and their debt is of longer maturity. Variation in the size
of the banking sector does not have a corresponding correlation with the capital structures of large
firms. Thus, at the margin large banking sectors enable smaller firms to substitute long-term debt for
short-term debt.
We also find that the magnitude of government subsidies to industry is positively related to the use of
long-term debt by both large and small firms, perhaps as a result of implicit guarantees. Inflation is
negatively related to the use of long-term debt. Variation in several of the firm-specific
characteristics is also related to the use of debt of different maturities. In particular, high ratios of net
fixed assets to total assets are positively related to the use of long-term debt by both large and small
firms and less short-term borrowing by large firms only. This finding suggests that large firms can
more easily use their fixed assets obtain long-term debt. By contrast, high ratios of sales to fixed
assets are associated with more extensive use of short-term debt. This would be consistent with

29
maturity matching if firms with high ratios of sales to fixed assets also have high ratios of accounts
receivable to fixed assets.
In sum, the underlying legal and institutional differences explain a large portion of the variation in
the use of long-term debt. While we have identified relationships between financial institutions and
legal system origin and efficiency, on the one hand, and financial structures of firms, we have been
not been able to consistently relate specific investor protections with firm financing. This is not
surprising because the constraints that specific features of the legal system impose of contracting by
firms and investors may be depend on the characteristics of the financial system in each country. The
exact way in which this happens is an open research question.
The paper has several policy implications. First, it provides evidence confirming that firms in
developing countries have less long term debt, even after accounting for their characteristics. Second,
the paper shows that this lack of term finance is mainly due to institutional differences, such as the
extent of government subsidies, different level of development of stock markets and banks, and
differences in the underlying legal infrastructure. Third, the results indicate that while policies that
help develop legal and financial infrastructure of countries are effective in increasing the access of
firms to long term debt, different policies would be necessary to lengthen the debt maturity of large
and small firms. Improvements in legal effectiveness seem to benefit all firms, although this result is
much less significant for the smallest firms, which have limited access to the legal system. Similarly,
policies that would help improve the functioning and liquidity of stock markets, would again benefit
mostly the large firms. In contrast, policies that would lead to improvements in the development of
the banking system would improve the access of smaller firms to long term credit.

30
REFERENCES
Admati, A.R., P. Pfleiderer and J. Zechner, 1994, Large Shareholder Activitism, Risk Sharing andFinancial Market Equilibrium, Journal of Political Economy 102, 1097-1131.
Allen, F., and D. Gale, 1994, Limited market participation and volatility of asset prices, AmericanEconomic Review 84, 933-955.
Barclay, M.J. and C.W. Smith, Jr., 1995, The maturity of corporate debt, Journal of Finance 50,609-631.
Barro, R.J., 1991, Economic Growth in a Cross Section of Countries, Quarterly Journal ofEconomics 106, 407-43.
Bolton, P. and D.S. Scharfstein, 1993, Optimal Debt Structure with Multiple Creditors, LSE CapitalMarkets Group Discussion Paper No. 161.
Calomiris, Charles, 1993, Corporate Finance Benefits from Universal Banking: Germany and theUnited States, 1870-1914,” NBER Working Paper, no. 4408.
DemirgηΗ -Kunt and Levine, 1996, Stock market Development and Financial Intermediaries:Stylized Facts, World Bank Economic Review, 10(2) 291-321.
DemirgηΗ -Kunt, A. and V. Maksimovic, 1995, Capital Structures in Developing Countries:Evidence from Ten Country Cases, Policy Research Working Paper, The World Bank.
DemirgηΗ -Kunt, A. and V. Maksimovic, 1996a, Financial Constraints, Uses of Funds and firmGrowth: An International Comparison, Policy Research Working Paper, The World Bank.
DemirgηΗ -Kunt, A. and V. Maksimovic, 1996b, Stock Market Development and Firm FinancingChoices, World Bank Economic Review, 10(2) 341-369.
Diamond, D.W., 1984, Financial Intermediation and Delegated Monitoring, Review of EconomicStudies 51, 393-414.
Diamond, D.W., 1991a, Debt maturity and liquidity risk, Quarterly Journal of Economics 106, 709-737.
Diamond, D.W., 1991b, Monitoring and reputation: the choice between bank loans and directlyplaced debt, Journal of Political Economy 99, 689-721.
Diamond, D.W., 1993, Seniority and Maturity of Debt Contracts, Journal of financial Economics 33,341-368.
Diamond, D.W., 1996, Liquidity, banks and markets, Policy Research Working Paper No 1566, TheWorld Bank.
Flannery, M. J.,, 1986, Asymmetric Information and Risky Debt Maturity Choice, Journal of Finance41, 19-37.

31
Graham, J., M. Lemmon, and J. Schallheim, 1996, Debt, Leases and the Endogeneity of CorporateTax Status, Working Paper, University of Utah, Salt Lake City, UT.
Grossman, S.J., 1976, On the Efficiency of Competitive Stock Markets Where Trades Have DiverseInformation. Journal of Finance 31, 573-85.
Grossman, S.J. and Stiglitz, J.E., 1980, On the Impossibility of Informationally Efficient Markets,American Economic Review 70, 393-408.
Harris, Milton and Artur Raviv, 1990, Capital Structure and the Informational Role of Debt, Journalof Finance 45, 321-349.
Hart, O. and J. Moore, 1995, Debt and Seniority: An Analysis of Hard Claims in ConstrainingManagement, American Economic Review 85, 567-87.
Hauswald, R.B.H.,1996, Banking Systems, Bankruptcy Arrangements and InstitutionalComplementarity, University of Maryland Working Paper.
Hoshi, Kashyap and Scharfstein, 1990, The Role of Banks in Reducing the Costs of FinancialDistress in Japan, Journal of Financial Economics 27, 67-88.
Hodder J.E. and L. W. Senbet, 1990, International Capital Structure Equilibrium, Journal of Finance45, 1495-1516.
Jensen, Michael C. and William Meckling,1976, Theory of the Firm: Managerial Behavior, AgencyCosts, and Capital Structure, Journal of Financial Economics, 3, 305-360.
Kane, E.J., 1989, The S&L insurance mess: How did it happen? Washington, D.C.: Urban InstitutePress.
KPMG Marwick Dreyfus, 1989, Banking and Finance in Brazil, (KPMG, Sao Paulo, Brazil)
La Porta, Rafael, Florencio Lopez-de-Silanes, Andrei Shleifer and Robert Vishny, 1996, Law andFinance, Harvard University and University of Chicago mimeo.
Lee, M. and J. Zechner, 1984, Debt, Taxes, and International Equilibrium, Journal of InternationalMoney and Finance 3, 343-55.
Maksimovic, V., 1988, Capital structure in repeated oligopolies, Rand Journal of Economics 19, 389-408.
Maksimovic, V. and S. Titman, 1990, Financial policy and reputation for product quality, Review ofFinancial Studies 4, 175-200.
Myers, S.C., 1977, Determinants of corporate borrowing, Journal of Financial Economics 5, 147-175.
Myers, Steward C. and Nicholas S. Majluf, 1984, Corporate Financing and Investment Decisionswhen Firms Have Information that Investors Do Not Have, Journal of Financial Economics, 13, 187-221.
32
Pagano, M., 1993, The flotation of companies on the stock market, European Economic Review,1101-1125.
Rajan, R.G., 1992, Insiders and outsiders: the choice between informed and arm’s length debt,Journal of Finance 47, 1367-1400.
Rajan, R. and L. Zingales, 1995, Is there an optimal capital structure? Evidence from internationaldata, Journal of Finance,50, 1421-1460.
Rajan, R. and L. Zingales, 1996, Financial Dependence and Growth, University of Chicago mimeo.
Singh, A., J. Hamid, B. Salimi and Y. Nakano, 1992, Corporate financial structures in developingcountries, International Finance Corporation, Technical paper, No. 1.
Smith, C.W., Jr., and J.B. Warner, 1979, On Financial Contracting: An Analysis of Bond CovenantsJournal of Financial Economics 7, 117-61.
Spence, A.M., 1985, Capital Structure and the Corporation's Product Market Environment inFriedman, B.M., (ed.), Corporate Capital Structures in the United States, National Bureau ofEconomic Research Project Report series, Chicago and London: University of Chicago Press.
Stohs, M. H. and D.C. Mauer, 1996, The determinants of corporate debt maturity structure, Journalof Business, forthcoming.
Swoboda, P., and J. Zechner, 1995, Financial Structure and the Tax System, in R.A. Jarrow, V.Maksimovic and W.T. Ziemba eds., Finance, North-Holland, Amsterdam.
Watson, Alan, 1974, Legal Transplants, Charlotsville, VA: University of Virginia Press.
Williamson, O.E., 1988, Corporate Finance and Corporate Governance, Journal of Finance 43, 567-91.

33
0.00
0.05
0.10
0.15
0.20
0.25
0.30
0.35
0.40
0.45
0.50Zi
mba
bwe
Bra
zil
Jord
an
Thai
land
Hon
g K
ong
Mal
aysi
a
Mex
ico
U.K
.
Pak
ista
n
Turk
ey
S. A
frica
Indi
a
Sin
gapo
re
Japa
n
Aus
tralia
Net
herla
nds
Bel
gium
Kor
ea
Spa
in
Aus
tria
Italy
Sw
itzer
land
Fran
ce
New
Zea
land
U.S
.
Can
ada
Sw
eden
Ger
man
y
Finl
and
Nor
way
Figure 1. Long Term Debt/Total Asset Ratios. The figure presents the average long-term debt to total assetratios for firms in each country for the 1980-1991 period. Developing countries are denoted by the darkeroutline. The countries in the figure are ordered by their utilization of long- term debt financing.
34
0.00
0.10
0.20
0.30
0.40
0.50
0.60
0.70
Can
ada
Mex
ico
S. A
frica
U.S
.
Sin
gapo
re
Aus
tralia
New
Zea
land
Mal
aysi
a
Ger
man
y
Hon
g K
ong
Sw
itzer
land
Nor
way
Finl
and
Zim
babw
e
Spa
in
Bel
gium
Aus
tria
U.K
.
Sw
eden
Net
herla
nds
Jord
an
Fran
ce
Italy
Turk
ey
Thai
land
Japa
n
Kor
ea
Indi
a
Pak
ista
n
Bra
zil
Figure 2. Short Term Debt/Total Asset Ratios. The figure presents the average short-term debt to total assetratios for firms in each country for the 1980-1991 period. Developing countries are denoted by the darkeroutline. The countries in the figure are ordered by their utilization of short-term debt financing.

35
0.00
0.10
0.20
0.30
0.40
0.50
0.60
0.70
Pak
ista
n
Thai
land
Zim
babw
e
Jord
an
Bra
zil
Turk
ey
Indi
a
U.K
.
Japa
n
Hon
g K
ong
Kor
ea
Mal
aysi
a
Mex
ico
Net
herla
nds
S. A
frica
Italy
Bel
gium
Spa
in
Fran
ce
Aus
tria
Sin
gapo
re
Aus
tralia
Sw
itzer
land
Sw
eden
New
Zea
land
U.S
.
Ger
man
y
Finl
and
Can
ada
Nor
way
Figure 3. Long Term Debt/Total Debt Ratios. The figure presents the average long-term debt to total debtratios for firms in each country for the 1980-1991 period. Developing countries are denoted by the darkeroutline. The countries in the figure are ordered by their debt maturity.

36
0.00
0.10
0.20
0.30
0.40
0.50
0.60
0.70
LTD/TA STD/TA TD/TA LTD/TD
Small
Medium
Large
Very Large
Figure 4. Debt Ratios: Small vs. Large Firms. The figure presents the average long-term debt to asset(LTD/TA), short-term debt to asset (STD/TA), total debt to total asset (TD/TA) and long-term debt to total debt(LTD/TD) ratios across thirty countries by firm size. The firms in each country are divided into quartiles byvalue of total assets, and the average debt ratios of each quartile, calculated across countries, is reported.Countries in the sample are: Australia, Austria, Belgium, Brazil, Canada, Germany, Finland, France, HongKong, India, Italy, Jordan, Japan, Korea, Malaysia, Mexico, Netherlands, Norway, New Zealand, Pakistan,Singapore, Spain, Switzerland, Sweden, Thailand, Turkey, United Kingdom, United States, South Africa, andZimbabwe.

37
Table IEconomic Indicators
GDP/CAP is the real GDP per capita in US$ in 1991. It is obtained from World Bank National Accounts. Growth rate is theaverage annual growth rate in GDP/CAP for the period 1980-91. Average annual inflation is given for the period 1980-91. It isthe annual inflation of the GDP deflator, obtained from World Bank National Accounts. Government subsidies are defined asgrants on current account by the public authorities to (i) private industries and public corporations and (ii) governmententerprises. The figures are as percent of GDP averaged over 1983-1991. Data are obtained from various issues of the WorldCompetitiveness Report, The World Economic Forum &IMD International, Geneva, Switzerland.
GDP/CAP(US $)
Growth 80-91(percent)
Inflation 80-91(percent)
Governmentsubsidies to privateand publicenterprises 83-91
Switzerland 27,492 1.7 3.8 1.4Japan 23,584 3.9 1.5 0.6Norway 19,664 1.7 5.2 5.9Sweden 19,649 1.6 7.4 4.8United States 18,972 1.9 4.2 0.6Finland 18,046 1.6 6.6 3.0France 17,365 1.8 5.7 2.4Austria 17,288 2.2 3.6 1.3Netherlands 16,479 2.3 1.8 2.6Germany 16,439 1.8 2.8 2.0Canada 16,098 2.0 4.3 1.9Belgium 16,051 2.2 4.2 3.5Italy 14,570 2.5 9.5 2.9Australia 13,095 1.6 7.0 3.0United Kingdom 12,585 2.3 5.8 1.5New Zealand 10,643 1.0 10.3 1.2Singapore 10,294 4.9 1.9 1.9Hong Kong 9,820 5.8 7.5 n.a.Spain 8,752 3.3 8.9 2.4Korea 4,259 6.8 5.6 6.3Malaysia 2,465 3.6 1.7 4.6South Africa 2,198 -1.0 14.4 n.a.Brazil 2,073 2.1 327.6 10.7Mexico 1,801 1.0 66.5 2.3Turkey 1,375 3.1 44.7 2.2Jordan 1,372 -2.1 1.6 n.a.Thailand 1,362 7.0 3.7 1.4Zimbabwe 630 1.7 12.5 n.a.India 375 3.3 8.2 5.8Pakistan 359 3.9 7.0 5.4

38
Table IIInstitutional Indicators
Law and order indicator, produced by International Country Risk rating agency, reflects the degree to which the citizens of a countryare willing to accept the established institutions to make and implement laws and adjudicate disputes. It is scored 0-6 with higherscores indicating sound political institutions and a strong court system. Lower scores indicate a tradition of depending on physicalforce or illegal means to settle claims. Values reported are 1985-91 averages. Legal efficiency indicator, produced by BusinessInternational Corporation, is an assessment of the efficiency and integrity of the legal environment as it affects business, particularlyforeign firms. It is scored 0-10 with lower scores for lower efficiency levels. An average value for 1980-1983 is available. CommonLaw Dummy takes the value one for common law countries and the value zero for others.. Creditor rights is an index that ranges from0 to 4.5 and aggregates creditor rights and Shareholder rights is an index that ranges from 0 to 5 and aggregates shareholder rightsas described in the text. These three variables are obtained from La Porta, Lopez-de-Silanes, Shleifer and Vishny (1996). Marketcapitalization/GDP is the stock market capitalization divided by GDP. Turnover is the total value of shares traded divided by marketcapitalization. Stock market data are from IFC’s Emerging Market Data Base. Values are 1980-1991 averages. Bank/GDP is the totalassets of the deposit money banks divided by GDP. It is obtained from IMF, International Financial Statistics. Bank is the summationof IFS lines 22a through 22f. Values are 1980-1991 averages. GDP values are from World Bank National Accounts.
Law andOrderIndicator
LegalEfficiencyIndicator
CommonLawDummy
CreditorRightsIndex
ShareholderRightsIndex
MarketCapitalization/GDP
Turnover Bank/GDP
Switzerland 6.00 10.00 0 1.50 1.00 0.75 0.40 1.56
Japan 5.00 10.00 0 2.25 3.00 0.96 0.52 1.21
Norway 6.00 10.00 0 2.20 3.00 0.18 0.41 0.75
Sweden 6.00 10.00 0 2.20 3.00 0.44 0.24 0.69
United States 6.00 10.00 1 1.00 5.00 0.60 0.58 0.48
Finland 6.00 10.00 0 1.00 2.00 0.18 0.18 0.71
France 5.00 8.00 0 0.10 2.00 0.23 0.31 0.96
Austria 6.00 9.50 0 3.10 2.00 0.08 0.55 1.13
Netherlands 6.00 10.00 0 2.00 2.00 0.44 0.39 0.93
Germany 5.57 9.00 0 3.10 1.00 0.24 1.22 1.04
Canada 6.00 9.25 1 1.00 4.00 0.46 0.28 0.48
Belgium 6.00 9.50 0 2.10 0.00 0.31 0.12 0.57
Italy 5.00 6.75 0 2.20 0.00 0.15 0.24 0.53
Australia 6.00 10.00 1 1.00 4.00 0.50 0.29 0.51
United Kingdom 4.43 10.00 1 4.00 4.00 0.85 0.38 0.81
New Zealand 6.00 10.00 1 3.00 4.00 0.38 0.15 0.44
Singapore 5.00 10.00 1 4.00 3.00 0.93 0.32 0.94
Hong Kong 4.71 10.00 1 4.00 4.00 1.19 0.40 n.a.
Spain 4.00 6.25 0 2.20 2.00 0.22 0.30 0.90
Korea 2.17 6.00 0 3.50 2.00 0.22 0.69 0.46
Malaysia 3.86 9.00 1 4.00 3.00 0.79 0.15 0.77
South Africa 1.71 6.00 1 3.00 4.00 1.35 0.05 0.38
Brazil 4.00 5.75 0 1.20 3.00 0.11 0.48 0.23
Mexico 3.00 6.00 0 0.20 0.00 0.10 0.69 0.21
Turkey 2.67 4.00 0 2.20 2.00 0.05 0.08 0.25
Jordan 2.00 8.66 0 n.a. 1.00 0.47 0.13 0.66
Thailand 3.57 3.25 1 3.10 3.00 0.18 0.59 0.60
Zimbabwe 2.00 7.50 1 4.00 3.00 0.10 0.08 0.17
India 1.71 8.00 1 4.00 2.00 0.07 0.59 0.32
Pakistan 2.00 5.00 1 4.00 4.00 0.04 0.11 0.33

39
Table IIICorrelation Matrices
Dependent variables are long term debt to total asset ratio (LTDTA), short term debt to total asset ratio (STDTA), and long term debt to total debt ratios (LTDTD). Independent variables are defined asfollows: NFATA is the net fixed assets divided by total assets. PROFIT is the income before interest and taxes divided by total assets. NSNFA is the net sales divided by net fixed assets. DIVTA is thedividends divided by total assets. GDP/CAP is the GDP per capita. GROWTH is the growth rate of the real GDP per capita. INFLATION is the inflation rate of the GDP deflator. TOR is stock marketturnover defined as the total value of shares traded divided by market capitalization. MCAP/GDP is the stock market capitalization of the country divided by its GDP. BANK/GDP is the total assets ofthe deposit money banks divided by GDP. GOV. SUBS./GDP are the grants on current account by the public authorities to (i) private industries and public corporations and (ii) government enterprises,divided by GDP. LAW & ORDER, scored 1 to 6, is an indicator of the degree to which citizens of a country are able to utilize the existing legal system to mediate disputes and enforce contracts.LEGAL is an index, scored 0 to 10, assessing the “efficiency and integrity of the legal environment as it affects business, particularly foreign firms.” For both indices lower scores indicate lowerenforcement/efficiency levels. COMMON is a dummy variable that takes the value 1 for common law countries and the value zero for others. SHAREHOLDER RIGHTS is an index that ranges from 0to 5 and aggregates shareholder rights and CREDITOR RIGHTS is an index that ranges from 0 to 4.5 and aggregates creditor rights as described in the text. All variables, except last four, are averagedover the 1980-1991 period when available, so that each country has one observation. In panel A averages of firm level variables (LTDTA, STDTA, LTDTD, NFATA, PROFIT, NSNFA, DIVTA) arecalculated for the largest and smallest firms separately. Panel B calculates averages using all firms in the sample. Correlations reported are pearson correlation coefficients. P-values are given in italics.Number of observations are reported under the respective p-values.
Panel A: Correlations of Dependent and Independent VariablesNFATA PROFIT NSNFA DIVTA GDP/CAP GROWTH INFL. TOR MCAP/
GDPBANK/GDP
GOV.SUB./GDP
LAW &ORDER
LEGAL
Large FirmsLTDTA -.127 -.132 -.269 -.437 .676 -.226 -.372 .192 -.108 .290 -.205 .639 .460
.511 .488 .158 .018 .000 .230 .043 .308 .569 .127 .316 .000 .01129 30 29 29 30 30 30 30 30 29 26 30
STDTA -.520 .159 .553 .035 -.094 .262 -.229 -.108 -.286 .074 .072 -.338 -.353.004 .402 .002 .855 .620 .162 .223 .569 .125 .703 .725 .068 .05629 30 29 29 30 30 30 30 30 29 26 30
LTDTD .152 -.173 -.470 -.290 .547 -.284 -.214 .193 .141 .186 -.291 .658 .533.432 .360 .010 .127 .002 .128 .257 .306 .458 .334 .149 .000 .00329 30 29 29 30 30 30 30 30 29 26 30
Small Firms:LTDTA -.184 -.227 -.079 -.473 .655 -.146 -.231 .215 -.205 .208 -.044 .556 .402
.339 .228 .684 .010 .000 .443 .219 .253 .277 .278 .832 .001 .02829 30 29 29 30 30 30 30 30 29 26 30
STDTA -.186 .414 .221 .023 -.320 .539 -.073 .070 -.289 -.121 .168 -.448 -.436.335 .023 .249 .907 .085 .002 .700 .714 .121 .533 .413 .013 .01629 30 29 29 30 30 30 30 30 29 26 30
LTDTD -.163 -.318 -.133 -.462 .726 -.250 -.232 .211 -.099 .251 -.176 .685 .521.398 .087 .491 .012 .000 .183 .218 .263 .601 .189 .391 .000 .00329 30 29 29 30 30 30 30 30 29 26 30

40
Panel B: Cross-Correlations of Independent Variables
PROFIT NSNFA DIVTA GDP/CAP GROWTH INFL. TOR MCAP/GDP
BANK/GDP
GOV.SUB./GDP
LAW &ORDER
LEGAL COMMON
NFATA .122 -.612 .224 -.607 -.232 .639 -.050 -.069 -.621 .461 -.471 -.440 .171.527 .000 .252 .001 .226 .000 .798 .723 .000 .018 .010 .017 .374
PROFIT .108 .818 -.423 .034 -.080 -.292 .095 -.378 -.090 -.504 -.494 .227.576 .000 .020 .858 .675 .118 .619 .044 .663 .005 .006 .227
NSNFA .001 .217 .255 -.431 .103 .144 .281 -.332 .035 .075 .219.998 .258 .182 .020 .595 .457 .147 .098 .858 .698 .253
DIVTA -.489 -.044 -.106 -.387 .350 -.349 -.299 -.465 -.351 .361.007 .822 .585 .038 .063 .069 .146 .011 .062 .055
GDP/CAP -.176 -.323 .196 .179 .697 -.404 .872 .709 -.350.353 .082 .300 .343 .000 .041 .000 .000 .058
GROWTH -.089 .164 .004 .054 .142 -.084 -.255 .194.641 .387 .983 .779 .489 .658 .173 .305
INFLATION .066 -.232 -.391 .649 -.179 -.363 -.197.728 .218 .036 .000 .345 .049 .296
TOR -.140 .262 -.013 .140 .025 -.211.459 .170 .950 .460 .894 .263
MCAP/GDP .367 -.436 .101 .414 .370.050 .026 .595 .023 .044
BANK/GDP -.391 .531 .521 -.351.048 .003 .004 .062
GOV. SUB./GDP -.381 -.286 -.210.055 .156 .303
LAW & ORDER .699 -.206.000 .275
LEGAL .026.891
COMMON
SHAREHOLDER RIGHTS

41
Table IVSummary Statistics
Firm-level variables are reported separately for large and small firms. These are defined as follows: LTDTA is long term debt to total assetratio, STDTA is short term debt to total asset ratio, and LTDTD is long term debt to total debt ratios. NFATA is the net fixed assetsdivided by total assets. PROFIT is the income before interest and taxes divided by total assets. NSNFA is the net sales divided by netfixed assets. DIVTA is the dividends divided by total assets. Institutional variables are available at the country level. GDP/CAP is theGDP per capita in thousands of US$. GROWTH is the growth rate of the real GDP per capita. INFLATION is the inflation rate of theGDP deflator. TOR is stock market turnover defined as the total value of shares traded divided by market capitalization. MCAP/GDP isthe stock market capitalization of the country divided by its GDP. BANK/GDP is the total assets of the deposit money banks divided byGDP. GOV. SUBS./GDP are the grants on current account by the public authorities to (i) private industries and public corporations and(ii) government enterprises, divided by GDP. LAW & ORDER, scored 1 to 6, is an indicator of the degree to which citizens of a countryare able to utilize the existing legal system to mediate disputes and enforce contracts. LEGAL is an index, scored 0 to 10, assessing the“efficiency and integrity of the legal environment as it affects business, particularly foreign firms.” For both indices lower scores indicatelower enforcement/efficiency levels. COMMON is a dummy variable that takes the value 1 for common law countries and the value zerofor others. SHAREHOLDER RIGHTS is an index that ranges from 0 to 5 and aggregates shareholder rights and CREDITOR RIGHTS isan index that ranges from 0 to 4.5 and aggregates creditor rights as described in the text. All variables, except last four, are averaged overthe 1980-1991 period when available, so that each country has one observation.
N Mean Std Dev Minimum Maximum
Large Firms
LTDTA 30 0.269 0.103 0.105 0.528
STDTA 30 0.326 0.099 0.170 0.489
LTDTD 30 0.446 0.125 0.248 0.706
NFATA 29 0.412 0.104 0.227 0.704
PROFIT 30 0.100 0.032 0.070 0.202
NSNFA 29 4.687 3.738 0.883 19.632
DIVTA 29 0.019 0.012 0.002 0.052
Small Firms
LTDTA 30 0.175 0.115 0.056 0.500
STDTA 30 0.338 0.088 0.227 0.538
LTDTD 30 0.321 0.146 0.158 0.664
NFATA 29 0.355 0.088 0.149 0.534
PROFIT 30 0.110 0.044 0.048 0.273
NSNFA 29 6.236 3.545 1.436 16.997
DIVTA 29 0.028 0.022 0.002 0.088
Economic and Institutional Variables
GDP/CAP 30 10.234 7.737 0.299 26.348
GROWTH 30 0.024 0.020 -0.023 0.070
INFLATION 30 0.141 0.341 0.016 1.866
TOR 30 0.364 0.248 0.053 1.221
MCAP/GDP 30 0.419 0.358 0.043 1.351
BANK/GDP 29 0.654 0.335 0.163 1.562
GOV. SUBS./GDP 26 3.130 2.262 0.600 10.686
LAW & ORDER 30 4.447 1.597 1.714 6.000
LEGAL 30 8.247 2.069 3.250 10.000
COMMON 30 0.433 0.504 0.000 1.000
SHR. RIGHTS 30 2.533 1.332 0.000 5.000
CRD. RIGHTS 29 2.453 1.224 0.100 4.000
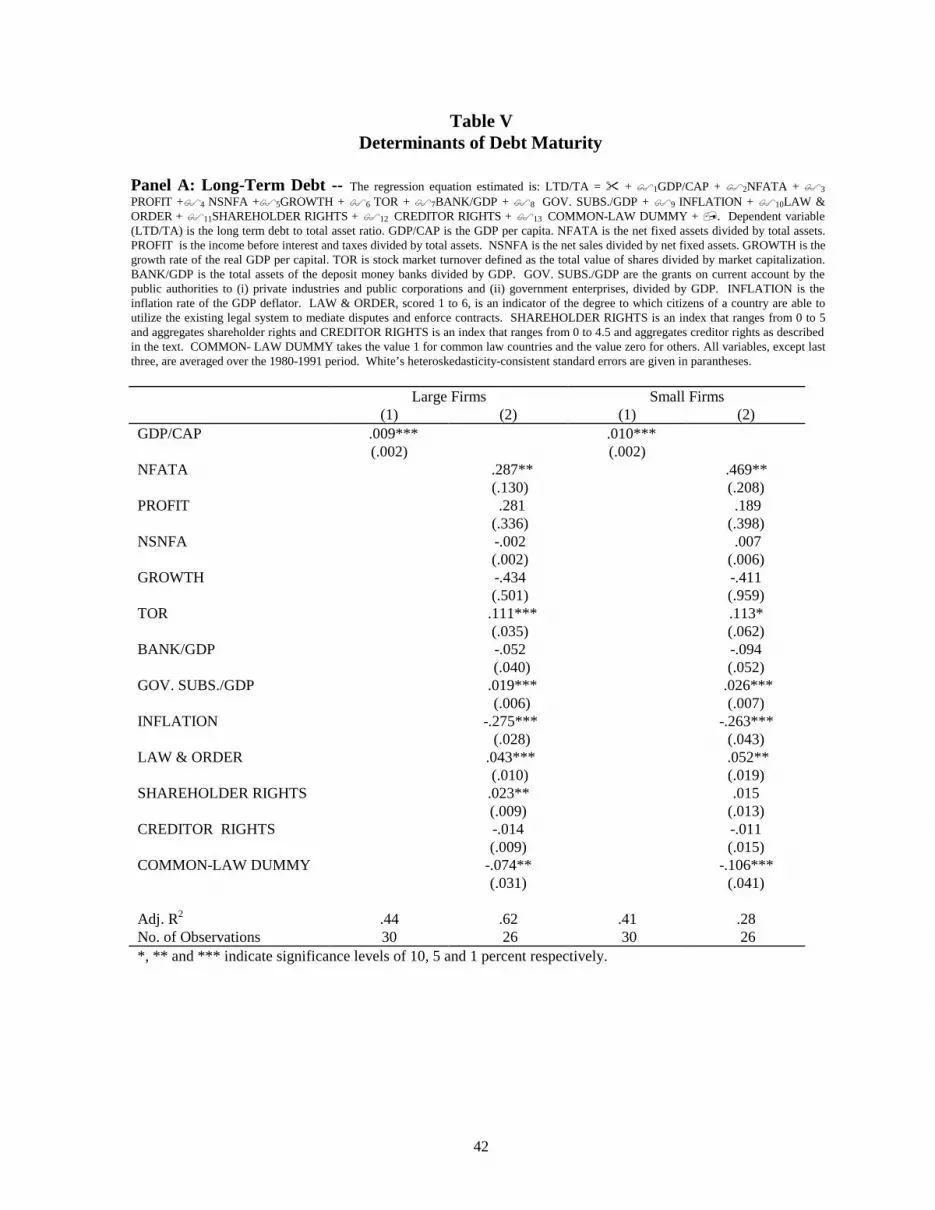
42
Table VDeterminants of Debt Maturity
Panel A: Long-Term Debt -- The regression equation estimated is: LTD/TA = " + $ 1GDP/CAP + $ 2NFATA + $ 3
PROFIT +$ 4 NSNFA +$ 5GROWTH + $ 6 TOR + $ 7BANK/GDP + $ 8 GOV. SUBS./GDP + $ 9 INFLATION + $ 10LAW &ORDER + $ 11SHAREHOLDER RIGHTS + $ 12 CREDITOR RIGHTS + $ 13 COMMON-LAW DUMMY + ,. Dependent variable(LTD/TA) is the long term debt to total asset ratio. GDP/CAP is the GDP per capita. NFATA is the net fixed assets divided by total assets.PROFIT is the income before interest and taxes divided by total assets. NSNFA is the net sales divided by net fixed assets. GROWTH is thegrowth rate of the real GDP per capital. TOR is stock market turnover defined as the total value of shares divided by market capitalization.BANK/GDP is the total assets of the deposit money banks divided by GDP. GOV. SUBS./GDP are the grants on current account by thepublic authorities to (i) private industries and public corporations and (ii) government enterprises, divided by GDP. INFLATION is theinflation rate of the GDP deflator. LAW & ORDER, scored 1 to 6, is an indicator of the degree to which citizens of a country are able toutilize the existing legal system to mediate disputes and enforce contracts. SHAREHOLDER RIGHTS is an index that ranges from 0 to 5and aggregates shareholder rights and CREDITOR RIGHTS is an index that ranges from 0 to 4.5 and aggregates creditor rights as describedin the text. COMMON- LAW DUMMY takes the value 1 for common law countries and the value zero for others. All variables, except lastthree, are averaged over the 1980-1991 period. White’s heteroskedasticity-consistent standard errors are given in parantheses.
Large Firms Small Firms(1) (2) (1) (2)
GDP/CAP .009***(.002)
.010***(.002)
NFATA .287** (.130)
.469**(.208)
PROFIT .281 (.336)
.189(.398)
NSNFA -.002 (.002)
.007(.006)
GROWTH -.434 (.501)
-.411(.959)
TOR .111*** (.035)
.113*(.062)
BANK/GDP -.052 (.040)
-.094(.052)
GOV. SUBS./GDP .019*** (.006)
.026***(.007)
INFLATION -.275*** (.028)
-.263***(.043)
LAW & ORDER .043*** (.010)
.052**(.019)
SHAREHOLDER RIGHTS .023**(.009)
.015(.013)
CREDITOR RIGHTS -.014(.009)
-.011(.015)
COMMON-LAW DUMMY -.074**(.031)
-.106***(.041)
Adj. R2 .44 .62 .41 .28No. of Observations 30 26 30 26*, ** and *** indicate significance levels of 10, 5 and 1 percent respectively.

43
Panel B: Short-Term Debt -- The regression equation estimated is: STD/TA = " + $ 1GDP/CAP + $ 2NFATA + $ 3
PROFIT +$ 4 NSNFA +$ 5GROWTH + $ 6 TOR + $ 7BANK/GDP + $ 8 GOV. SUBS./GDP + $ 9 INFLATION + $ 10LAW &ORDER + $ 11SHAREHOLDER RIGHTS + $ 12 CREDITOR RIGHTS + $ 13 COMMON-LAW DUMMY + ,. Dependent variable(STD/TA) is the short term debt to total asset ratio. GDP/CAP is the GDP per capita. NFATA is the net fixed assets divided by total assets.PROFIT is the income before interest and taxes divided by total assets. NSNFA is the net sales divided by net fixed assets. GROWTH is thegrowth rate of the real GDP per capital. TOR is stock market turnover defined as the total value of shares divided by market capitalization.BANK/GDP is the total assets of the deposit money banks divided by GDP. GOV. SUBS./GDP are the grants on current account by thepublic authorities to (i) private industries and public corporations and (ii) government enterprises, divided by GDP. INFLATION is theinflation rate of the GDP deflator. LAW & ORDER, scored 1 to 6, is an indicator of the degree to which citizens of a country are able toutilize the existing legal system to mediate disputes and enforce contracts. SHAREHOLDER RIGHTS is an index that ranges from 0 to 5and aggregates shareholder rights and CREDITOR RIGHTS is an index that ranges from 0 to 4.5 and aggregates creditor rights as describedin the text. COMMON- LAW DUMMY takes the value 1 for common law countries and the value zero for others. All variables, except lastthree, are averaged over the 1980-1991 period. White’s heteroskedasticity-consistent standard errors are given in parantheses.
Large Firms Small Firms(1) (2) (1) (2)
GDP/CAP -.001(.002)
-.003(.002)
NFATA -.601***(.110)
.035(.113)
PROFIT .738** (.365)
.286(.302)
NSNFA .005* (.003)
.019***(.005)
GROWTH .274 (.598)
2.838***(.638)
TOR -.035 (.028)
-.005(.045)
BANK/GDP -.044 (.034)
-.094**(.026)
GOV. SUBS./GDP .007 (.007)
-.006(.008)
INFLATION -.037 (.031)
.016(.032)
LAW & ORDER -.033*** (.010)
-.008(.008)
SHAREHOLDER RIGHTS .012(.008)
-.006(.010)
CREDITOR RIGHTS .001(.007)
.006(.009)
COMMON-LAW DUMMY -.103**(.036)
-.068(.042)
Adj. R2 .00 .75 .07 .69No. of Observations 30 26 30 26*, ** and *** indicate significance levels of 10, 5 and 1 percent respectively.

44
Panel C: Debt Maturity -- The regression equation estimated is: LTD/TD= " + $ 1GDP/CAP + $ 2NFATA + $ 3 PROFIT+$ 4 NSNFA +$ 5GROWTH + $ 6 TOR + $ 7BANK/GDP + $ 8 GOV. SUBS./GDP + $ 9 INFLATION + $ 10LAW & ORDER +$ 11SHAREHOLDER RIGHTS + $ 12 CREDITOR RIGHTS + $ 13 COMMON-LAW DUMMY + $ 14 TD/TAt-1 + ,. Dependentvariable (LTD/TD) is the long term debt to total debt ratio. GDP/CAP is the GDP per capita. NFATA is the net fixed assets divided by totalassets. PROFIT is the income before interest and taxes divided by total assets. NSNFA is the net sales divided by net fixed assets.GROWTH is the growth rate of the real GDP per capital. TOR is stock market turnover defined as the total value of shares divided bymarket capitalization. BANK/GDP is the total assets of the deposit money banks divided by GDP. GOV. SUBS./GDP are the grants oncurrent account by the public authorities to (i) private industries and public corporations and (ii) government enterprises, divided by GDP.INFLATION is the inflation rate of the GDP deflator. LAW & ORDER, scored 1 to 6, is an indicator of the degree to which citizens of acountry are able to utilize the existing legal system to mediate disputes and enforce contracts. SHAREHOLDER RIGHTS is an index thatranges from 0 to 5 and aggregates shareholder rights and CREDITOR RIGHTS is an index that ranges from 0 to 4.5 and aggregatescreditor rights as described in the text. COMMON- LAW DUMMY takes the value 1 for common law countries and the value zero forothers. TD/TAt-1 is total leverage one period lagged. All variables, except shareholder rights, creditor rights and common law dummy, areaveraged over the 1980-1991 period. White’s heteroskedasticity-consistent standard errors are given in parantheses.
Large Firms Small Firms(1) (2) (1) (2)
GDP/CAP .009***(.003)
.014***(.003)
NFATA .682*** (.101)
.022(.209)
PROFIT -.838* (.461)
-.192(.423)
NSNFA -.006* (.003)
-.022**(.009)
GROWTH -.441 (.736)
-3.962***(1.266)
TOR .089** (.036)
.050(.073)
BANK/GDP -.018 (.038)
.108*(.058)
GOV. SUBS./GDP -.002 (.008)
.012(.010)
INFLATION -.136** (.056)
-.078(.054)
LAW & ORDER .055*** (.010)
.031*(.018)
SHAREHOLDER RIGHTS .003(.012)
.005(.015)
CREDITOR RIGHTS -.010(.010)
-.017(.016)
COMMON-LAW DUMMY .059(.051)
.115*(.061)
TD/TAt-1 .236(.173)
.821***(.176)
Adj. R2 .27 .73 .51 .66No. of Observations 30 26 30 26*, ** and *** indicate significance levels of 15, 10, 5 and 1 percent respectively.
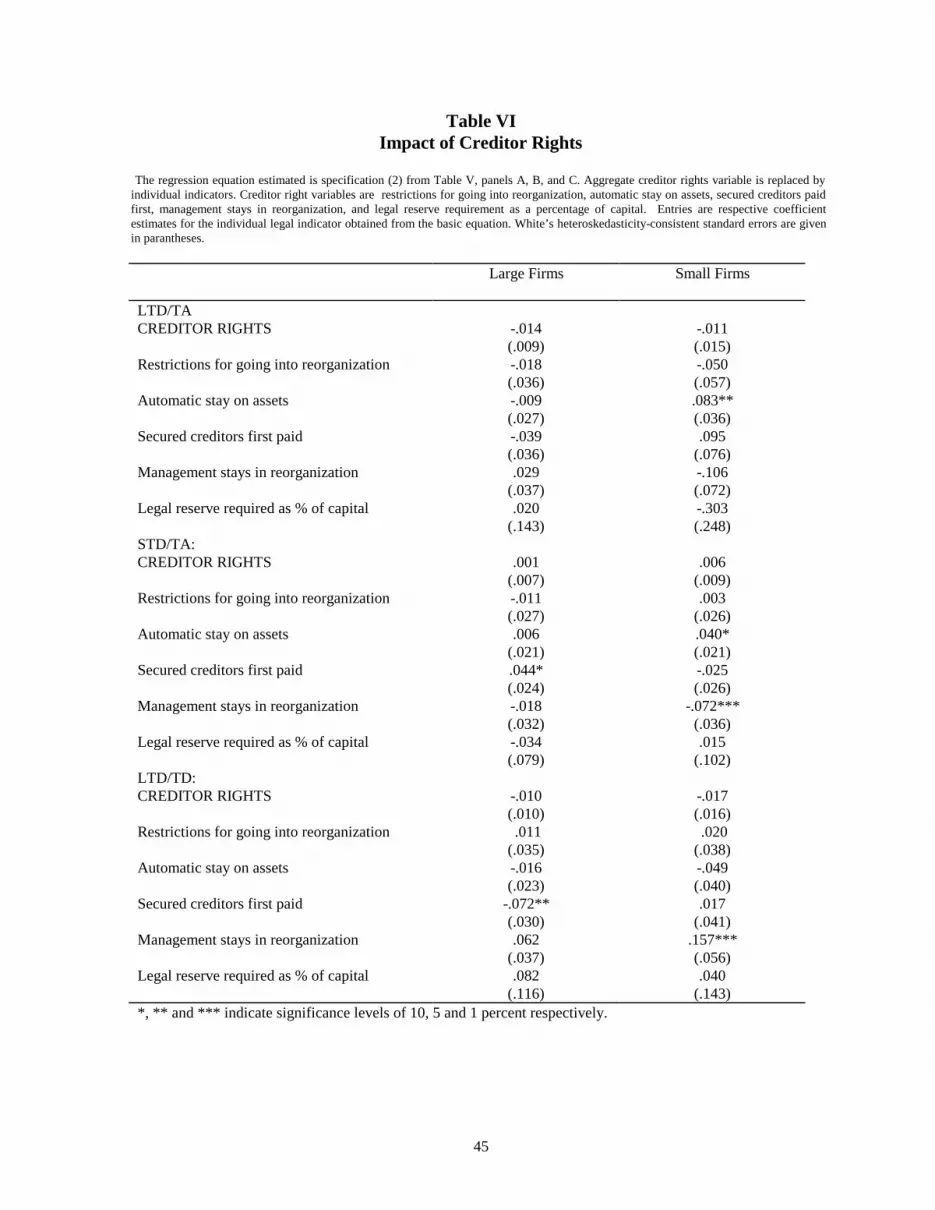
45
Table VIImpact of Creditor Rights
The regression equation estimated is specification (2) from Table V, panels A, B, and C. Aggregate creditor rights variable is replaced byindividual indicators. Creditor right variables are restrictions for going into reorganization, automatic stay on assets, secured creditors paidfirst, management stays in reorganization, and legal reserve requirement as a percentage of capital. Entries are respective coefficientestimates for the individual legal indicator obtained from the basic equation. White’s heteroskedasticity-consistent standard errors are givenin parantheses.
Large Firms Small Firms
LTD/TACREDITOR RIGHTS -.014
(.009)-.011(.015)
Restrictions for going into reorganization -.018(.036)
-.050(.057)
Automatic stay on assets -.009(.027)
.083**(.036)
Secured creditors first paid -.039(.036)
.095(.076)
Management stays in reorganization .029(.037)
-.106(.072)
Legal reserve required as % of capital .020(.143)
-.303(.248)
STD/TA:CREDITOR RIGHTS .001
(.007).006
(.009)Restrictions for going into reorganization -.011
(.027).003
(.026)Automatic stay on assets .006
(.021).040*(.021)
Secured creditors first paid .044*(.024)
-.025(.026)
Management stays in reorganization -.018(.032)
-.072***(.036)
Legal reserve required as % of capital -.034(.079)
.015(.102)
LTD/TD:CREDITOR RIGHTS -.010
(.010)-.017(.016)
Restrictions for going into reorganization .011(.035)
.020(.038)
Automatic stay on assets -.016(.023)
-.049(.040)
Secured creditors first paid -.072**(.030)
.017(.041)
Management stays in reorganization .062(.037)
.157***(.056)
Legal reserve required as % of capital .082(.116)
.040(.143)
*, ** and *** indicate significance levels of 10, 5 and 1 percent respectively.

46
Appendix
Number of Firms and the Sample Period
No.of Firms Time PeriodAustralia 401 1983-91Austria 44 1983-91Belgium 89 1983-91Brazil* 100 1985-91Canada 494 1983-91Switzerland 150 1983-91Germany 359 1983-91Spain 116 1983-91Finland 55 1983-91France 544 1983-91United Kingdom 1275 1983-91Hong Kong 173 1983-91India* 100 1980-90Italy 81 1983-91Jordan* 38 1980-90Japan 1104 1983-91Korea* 100 1980-90Mexico* 100 1984-91Malaysia 143 1983-91Netherlands 165 1983-91Norway 52 1983-91New Zealand 41 1983-91Pakistan* 100 1980-88Singapore 213 1983-91Sweden 68 1983-91Thailand 137 1983-91Turkey* 45 1982-90United States 3247 1983-91South Africa 67 1983-91Zimbabwe* 48 1980-88
For those countries with *, the data source for the firm level variables is IFC's corporate finance data base. Otherwise, thedata are from Global Vantage data base.
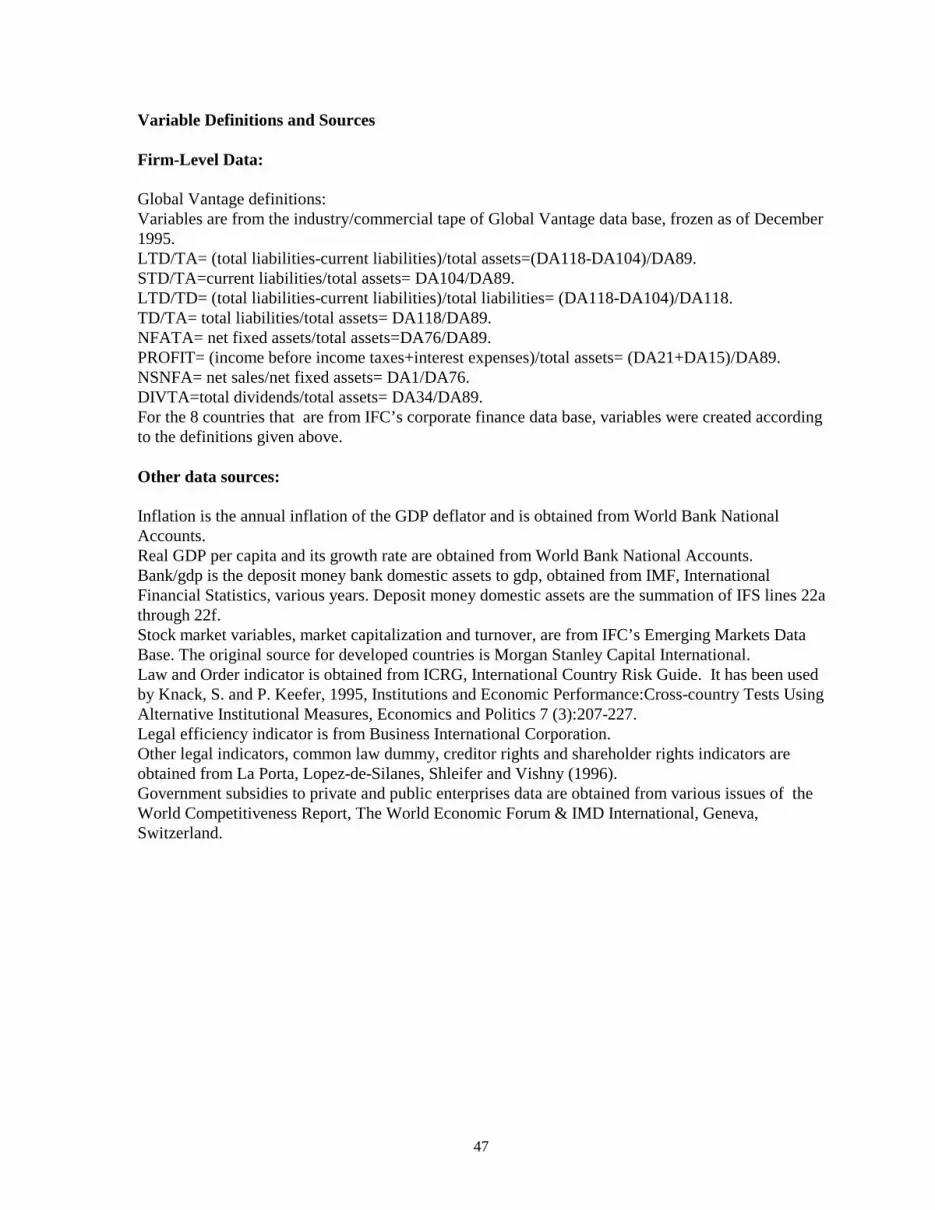
47
Variable Definitions and Sources
Firm-Level Data:
Global Vantage definitions:Variables are from the industry/commercial tape of Global Vantage data base, frozen as of December1995.LTD/TA= (total liabilities-current liabilities)/total assets=(DA118-DA104)/DA89.STD/TA=current liabilities/total assets= DA104/DA89.LTD/TD= (total liabilities-current liabilities)/total liabilities= (DA118-DA104)/DA118.TD/TA= total liabilities/total assets= DA118/DA89.NFATA= net fixed assets/total assets=DA76/DA89.PROFIT= (income before income taxes+interest expenses)/total assets= (DA21+DA15)/DA89.NSNFA= net sales/net fixed assets= DA1/DA76.DIVTA=total dividends/total assets= DA34/DA89.For the 8 countries that are from IFC’s corporate finance data base, variables were created accordingto the definitions given above.
Other data sources:
Inflation is the annual inflation of the GDP deflator and is obtained from World Bank NationalAccounts.Real GDP per capita and its growth rate are obtained from World Bank National Accounts.Bank/gdp is the deposit money bank domestic assets to gdp, obtained from IMF, InternationalFinancial Statistics, various years. Deposit money domestic assets are the summation of IFS lines 22athrough 22f.Stock market variables, market capitalization and turnover, are from IFC’s Emerging Markets DataBase. The original source for developed countries is Morgan Stanley Capital International.Law and Order indicator is obtained from ICRG, International Country Risk Guide. It has been usedby Knack, S. and P. Keefer, 1995, Institutions and Economic Performance:Cross-country Tests UsingAlternative Institutional Measures, Economics and Politics 7 (3):207-227.Legal efficiency indicator is from Business International Corporation.Other legal indicators, common law dummy, creditor rights and shareholder rights indicators areobtained from La Porta, Lopez-de-Silanes, Shleifer and Vishny (1996).Government subsidies to private and public enterprises data are obtained from various issues of theWorld Competitiveness Report, The World Economic Forum & IMD International, Geneva,Switzerland.


