Embed Size (px)
Citation preview

Westpac 2019 Full Year Results Index
Image on front and left Westpac’s ‘Baker of Beirut’ campaign; helping people when it matters.
2019 Full Year Result Presentation 3
Investor Discussion Pack of 2019 Full Year Result 34
Strategy 35
Overview Performance discipline Service leadership Digital transformation
40 45 47 50
Governance and Culture 62
Earnings drivers Revenue Expenses Impairments
72 73 76 78
Credit quality 79
Capital, Funding and Liquidity 101
Divisional results Consumer Business Westpac Institutional Bank Westpac New Zealand
111 112 116 121 124
Economics 130
Appendix and Disclaimer 146
Contact us 155
Disclaimer 156
Brian Hartzer Chief Executive Officer
Financial results throughout this presentation are in Australian dollars and are based on cash earnings unless otherwise stated. Refer page 42 for definition. Results principally cover the 2H19, 1H19 and 2H18 periods. Comparison of 2H19 versus 1H19 (unless otherwise stated)
2019 Results – Overview 4
Westpac Group 2019 Full Year Results Presentation & Investor Discussion Pack
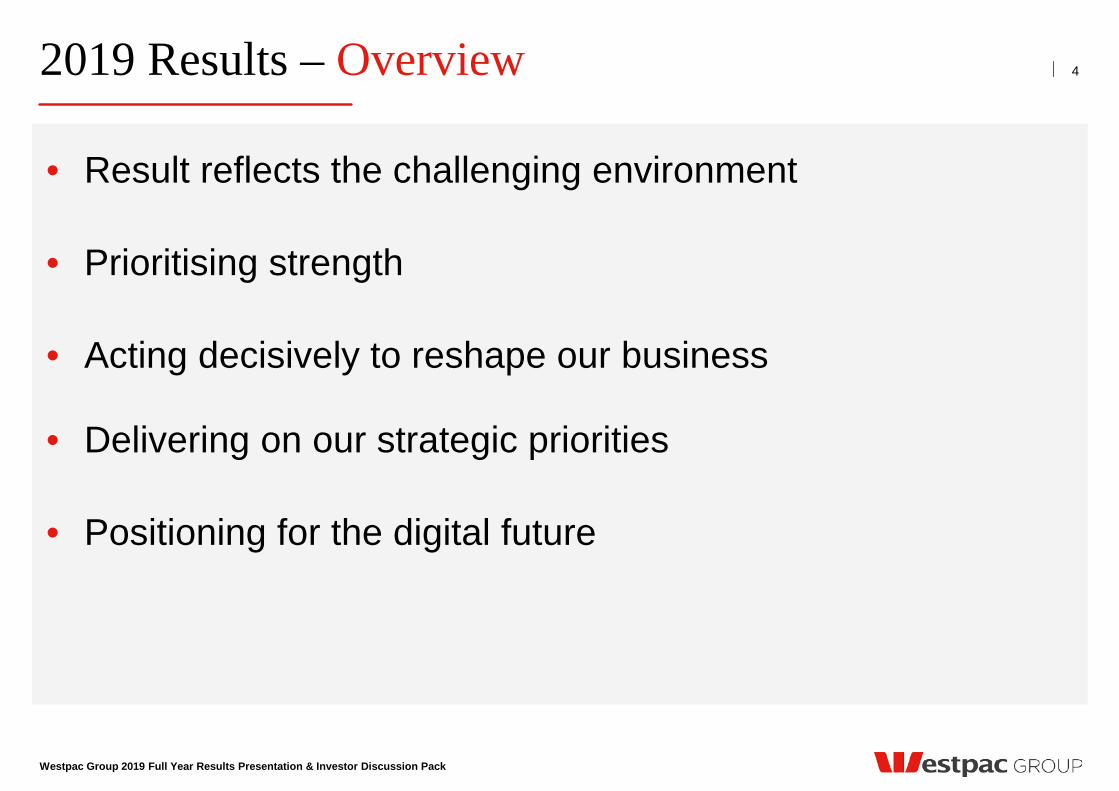
• Result reflects the challenging environment
• Prioritising strength
• Acting decisively to reshape our business
• Delivering on our strategic priorities
• Positioning for the digital future
Westpac Group 2019 Full Year Results Presentation & Investor Discussion Pack
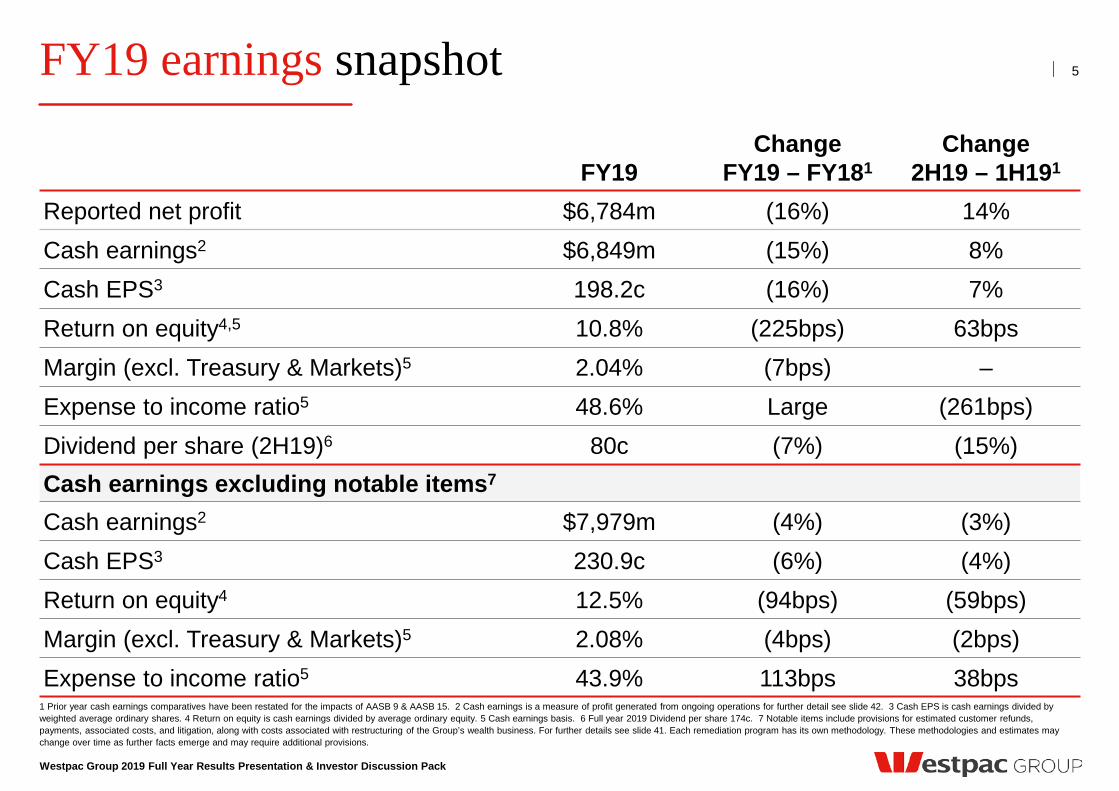
FY19 earnings snapshot
1 Prior year cash earnings comparatives have been restated for the impacts of AASB 9 & AASB 15. 2 Cash earnings is a measure of profit generated from ongoing operations for further detail see slide 42. 3 Cash EPS is cash earnings divided by weighted average ordinary shares. 4 Return on equity is cash earnings divided by average ordinary equity. 5 Cash earnings basis. 6 Full year 2019 Dividend per share 174c. 7 Notable items include provisions for estimated customer refunds, payments, associated costs, and litigation, along with costs associated with restructuring of the Group’s wealth business. For further details see slide 41. Each remediation program has its own methodology. These methodologies and estimates may change over time as further facts emerge and may require additional provisions.
FY19 Change
FY19 – FY181 Change
2H19 – 1H191
Reported net profit $6,784m (16%) 14% Cash earnings2 $6,849m (15%) 8% Cash EPS3 198.2c (16%) 7% Return on equity4,5 10.8% (225bps) 63bps Margin (excl. Treasury & Markets)5 2.04% (7bps) – Expense to income ratio5 48.6% Large (261bps) Dividend per share (2H19)6 80c (7%) (15%) Cash earnings excluding notable items7
Cash earnings2 $7,979m (4%) (3%) Cash EPS3 230.9c (6%) (4%) Return on equity4 12.5% (94bps) (59bps) Margin (excl. Treasury & Markets)5 2.08% (4bps) (2bps) Expense to income ratio5 43.9% 113bps 38bps
5
Westpac Group 2019 Full Year Results Presentation & Investor Discussion Pack
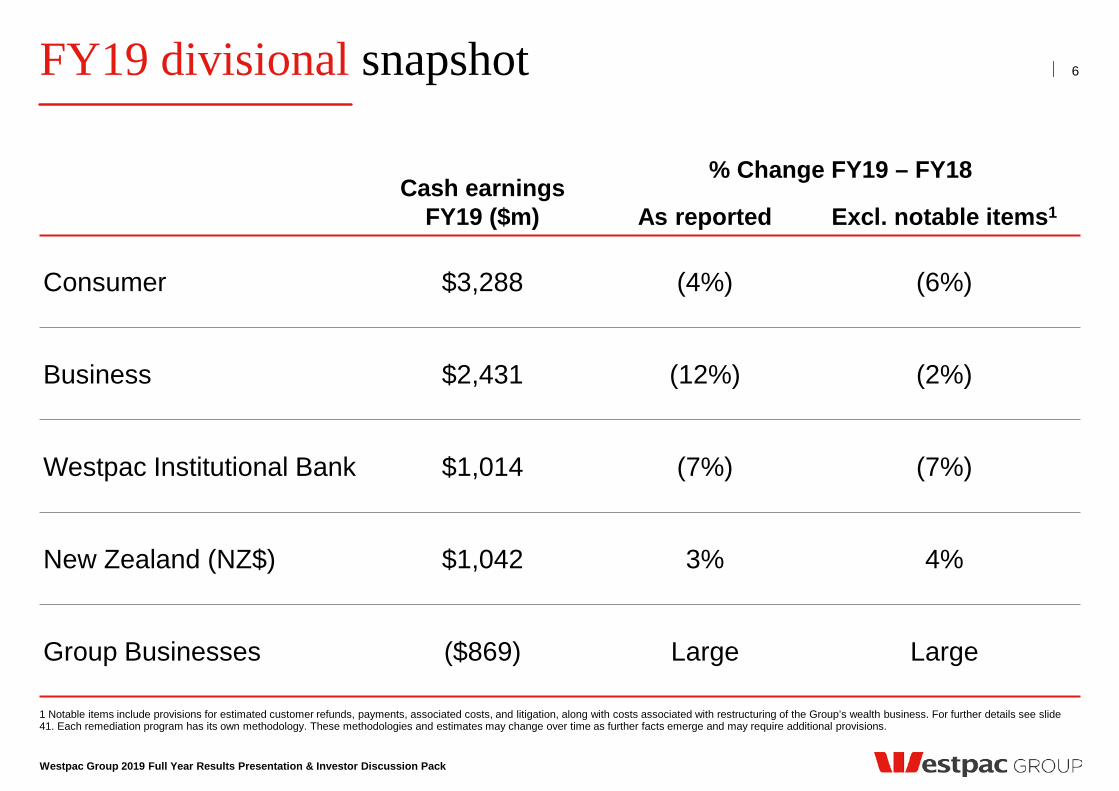
FY19 divisional snapshot
1 Notable items include provisions for estimated customer refunds, payments, associated costs, and litigation, along with costs associated with restructuring of the Group’s wealth business. For further details see slide 41. Each remediation program has its own methodology. These methodologies and estimates may change over time as further facts emerge and may require additional provisions.
Cash earnings
FY19 ($m)
% Change FY19 – FY18
As reported Excl. notable items1
Consumer $3,288 (4%) (6%)
Business $2,431 (12%) (2%)
Westpac Institutional Bank $1,014 (7%) (7%)
New Zealand (NZ$) $1,042 3% 4%
Group Businesses ($869) Large Large
6
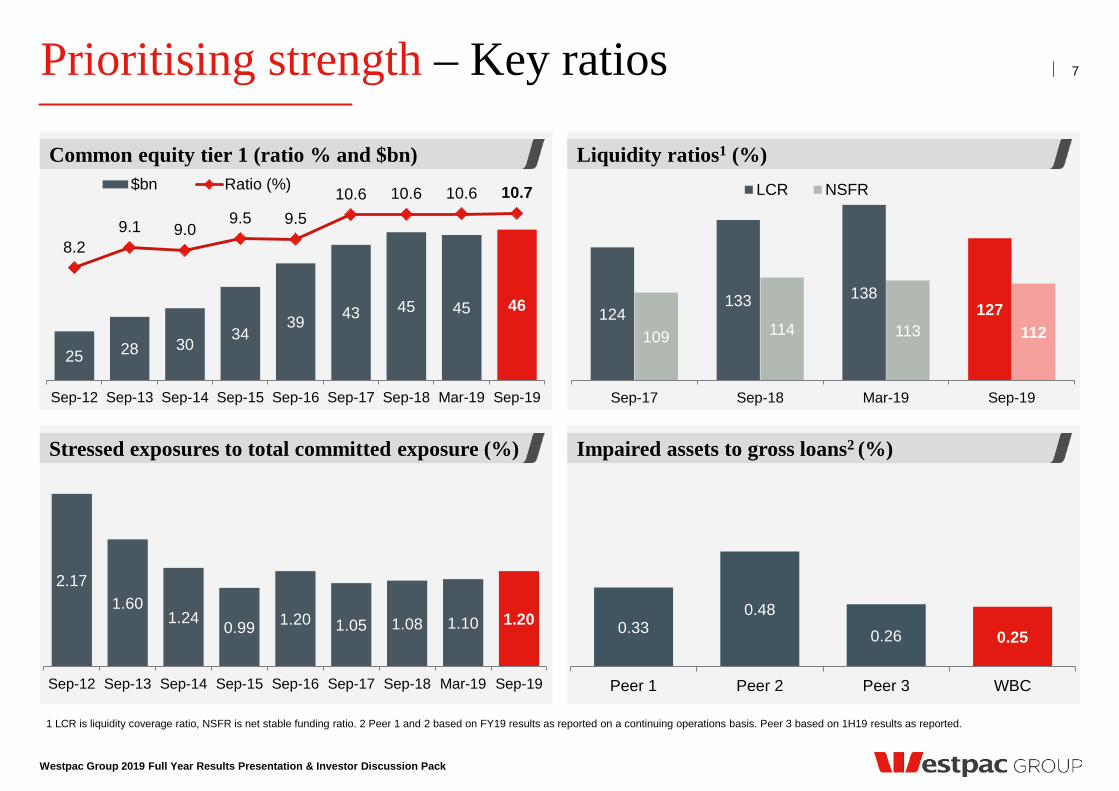
Prioritising strength – Key ratios
Westpac Group 2019 Full Year Results Presentation & Investor Discussion Pack
Liquidity ratios1 (%)
Impaired assets to gross loans2 (%)
Common equity tier 1 (ratio % and $bn)
Stressed exposures to total committed exposure (%)
7
2.17 1.60
1.24 0.99 1.20 1.05 1.08 1.10 1.20
Sep-12 Sep-13 Sep-14 Sep-15 Sep-16 Sep-17 Sep-18 Mar-19 Sep-19
25 28 30 34
39 43 45 45 46
8.2 9.1 9.0
9.5 9.5 10.6 10.6 10.6 10.7
3
4
5
6
7
8
9
10
11
12
15
20
25
30
35
40
45
50
55
Sep-12 Sep-13 Sep-14 Sep-15 Sep-16 Sep-17 Sep-18 Mar-19 Sep-19
$bn Ratio (%)
124 133 138
127 109 114 113 112
Sep-17 Sep-18 Mar-19 Sep-19
LCR NSFR
1 LCR is liquidity coverage ratio, NSFR is net stable funding ratio. 2 Peer 1 and 2 based on FY19 results as reported on a continuing operations basis. Peer 3 based on 1H19 results as reported.
0.33 0.48
0.26 0.25
Peer 1 Peer 2 Peer 3 WBC
Westpac Group 2019 Full Year Results Presentation & Investor Discussion Pack
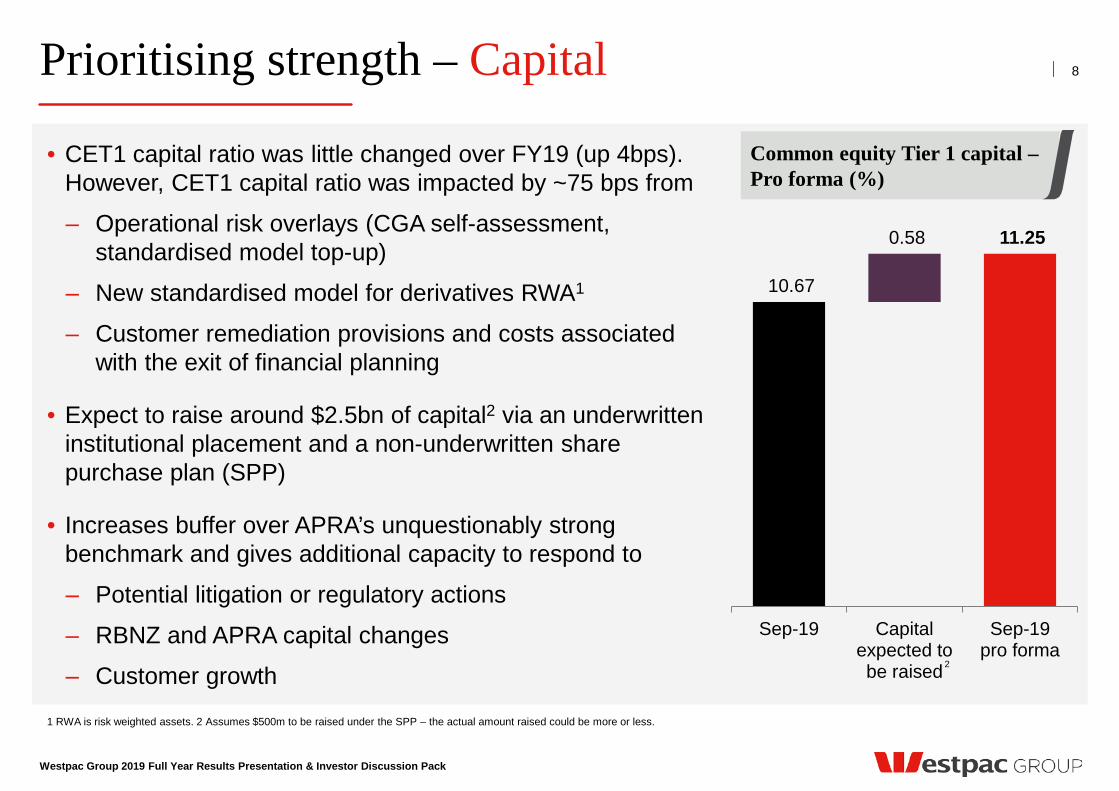
1 RWA is risk weighted assets. 2 Assumes $500m to be raised under the SPP – the actual amount raised could be more or less.
• CET1 capital ratio was little changed over FY19 (up 4bps). However, CET1 capital ratio was impacted by ~75 bps from
‒ Operational risk overlays (CGA self-assessment, standardised model top-up)
‒ New standardised model for derivatives RWA1
‒ Customer remediation provisions and costs associated with the exit of financial planning
• Expect to raise around $2.5bn of capital2 via an underwritten institutional placement and a non-underwritten share purchase plan (SPP)
• Increases buffer over APRA’s unquestionably strong benchmark and gives additional capacity to respond to
‒ Potential litigation or regulatory actions
‒ RBNZ and APRA capital changes
‒ Customer growth
8
10.67
0.58 11.25
Sep-19 Capitalexpected tobe raised
Sep-19pro forma
1
Common equity Tier 1 capital – Pro forma (%)
Prioritising strength – Capital
2
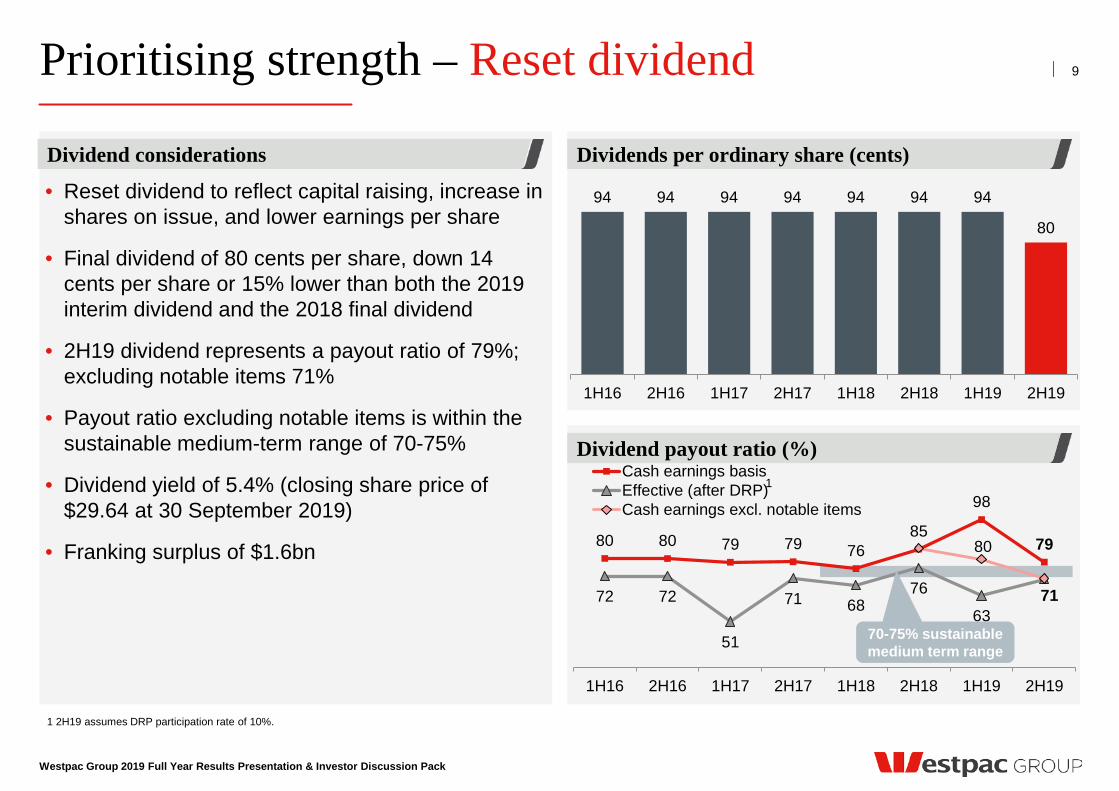
Prioritising strength – Reset dividend
Westpac Group 2019 Full Year Results Presentation & Investor Discussion Pack
1 2H19 assumes DRP participation rate of 10%.
Dividend payout ratio (%)
Dividends per ordinary share (cents) Dividend considerations
9
• Reset dividend to reflect capital raising, increase in shares on issue, and lower earnings per share
• Final dividend of 80 cents per share, down 14 cents per share or 15% lower than both the 2019 interim dividend and the 2018 final dividend
• 2H19 dividend represents a payout ratio of 79%; excluding notable items 71%
• Payout ratio excluding notable items is within the sustainable medium-term range of 70-75%
• Dividend yield of 5.4% (closing share price of $29.64 at 30 September 2019)
• Franking surplus of $1.6bn
1
94 94 94 94 94 94 94
80
1H16 2H16 1H17 2H17 1H18 2H18 1H19 2H19
80 80 79 79 76 85
98
79
72 72
51
71 68 76
63 71
80
1H16 2H16 1H17 2H17 1H18 2H18 1H19 2H19
Cash earnings basisEffective (after DRP)Cash earnings excl. notable items
70-75% sustainable medium term range
1 Australian ATMs. 2 At 1 November 2019. 3 Since 2017.
10
Westpac Group 2019 Full Year Results Presentation & Investor Discussion Pack
Portfolio actions
Deal with outstanding issues
Structural efficiency
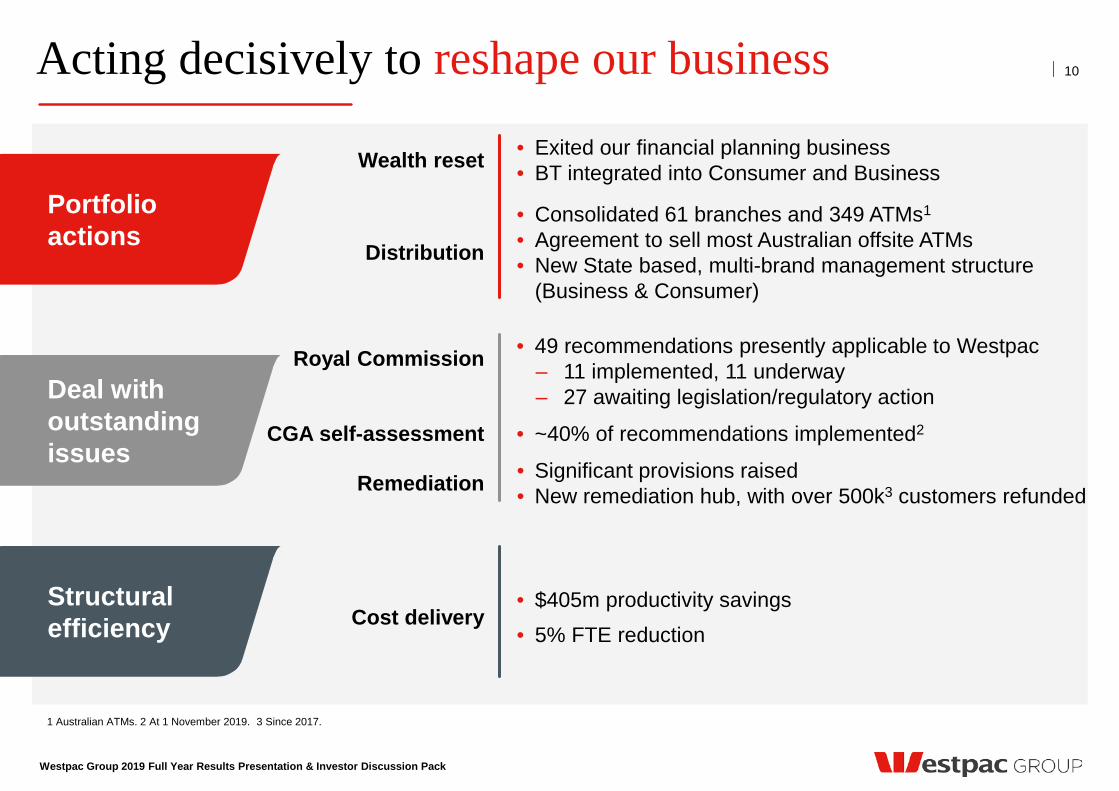
Acting decisively to reshape our business
Wealth reset • Exited our financial planning business • BT integrated into Consumer and Business
Distribution
• Consolidated 61 branches and 349 ATMs1
• Agreement to sell most Australian offsite ATMs • New State based, multi-brand management structure
(Business & Consumer)
Royal Commission
• 49 recommendations presently applicable to Westpac ‒ 11 implemented, 11 underway ‒ 27 awaiting legislation/regulatory action
CGA self-assessment • ~40% of recommendations implemented2
Remediation • Significant provisions raised • New remediation hub, with over 500k3 customers refunded
Cost delivery • $405m productivity savings • 5% FTE reduction
Westpac Group 2019 Full Year Results Presentation & Investor Discussion Pack
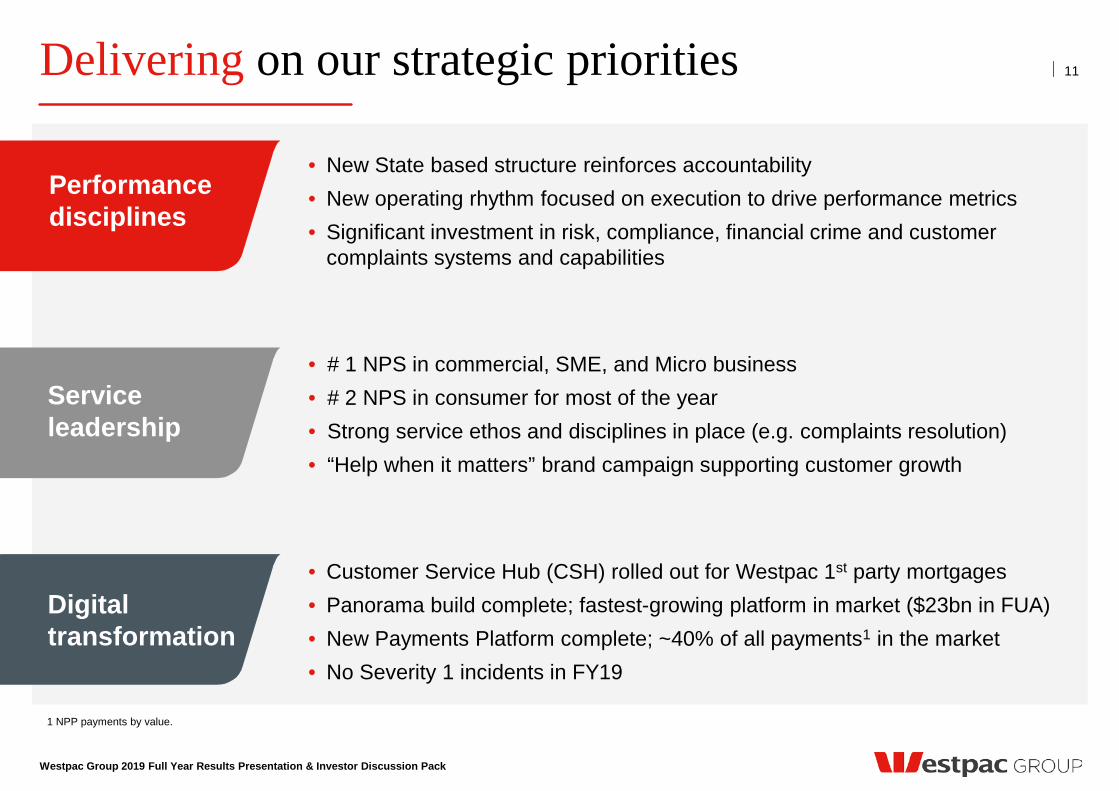
Delivering on our strategic priorities
1 NPP payments by value.
11
• New State based structure reinforces accountability • New operating rhythm focused on execution to drive performance metrics • Significant investment in risk, compliance, financial crime and customer
complaints systems and capabilities
• # 1 NPS in commercial, SME, and Micro business • # 2 NPS in consumer for most of the year • Strong service ethos and disciplines in place (e.g. complaints resolution) • “Help when it matters” brand campaign supporting customer growth
• Customer Service Hub (CSH) rolled out for Westpac 1st party mortgages • Panorama build complete; fastest-growing platform in market ($23bn in FUA) • New Payments Platform complete; ~40% of all payments1 in the market • No Severity 1 incidents in FY19
Performance disciplines
Service leadership
Digital transformation
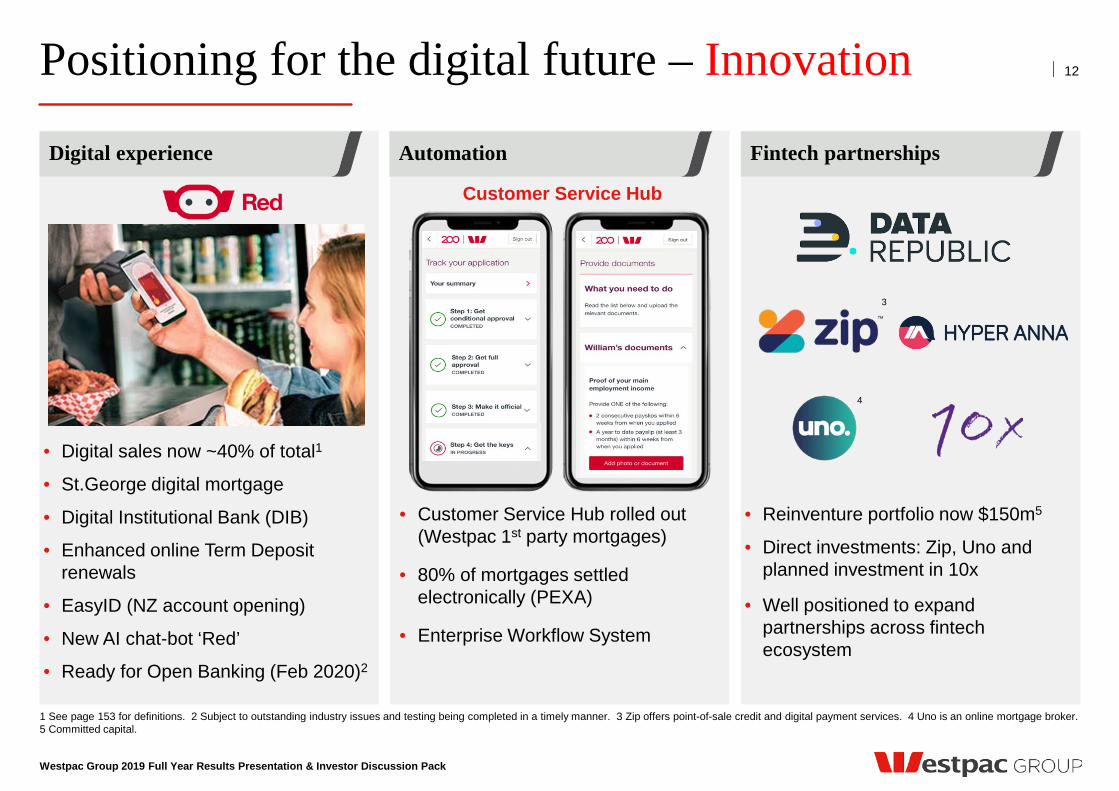
Positioning for the digital future – Innovation 12
1 See page 153 for definitions. 2 Subject to outstanding industry issues and testing being completed in a timely manner. 3 Zip offers point-of-sale credit and digital payment services. 4 Uno is an online mortgage broker. 5 Committed capital.
• Digital sales now ~40% of total1
• St.George digital mortgage
• Digital Institutional Bank (DIB)
• Enhanced online Term Deposit renewals
• EasyID (NZ account opening)
• New AI chat-bot ‘Red’
• Ready for Open Banking (Feb 2020)2
• Customer Service Hub rolled out (Westpac 1st party mortgages)
• 80% of mortgages settled electronically (PEXA)
• Enterprise Workflow System
• Reinventure portfolio now $150m5
• Direct investments: Zip, Uno and planned investment in 10x
• Well positioned to expand partnerships across fintech ecosystem
Westpac Group 2019 Full Year Results Presentation & Investor Discussion Pack
4
3
Customer Service Hub
Digital experience Automation Fintech partnerships
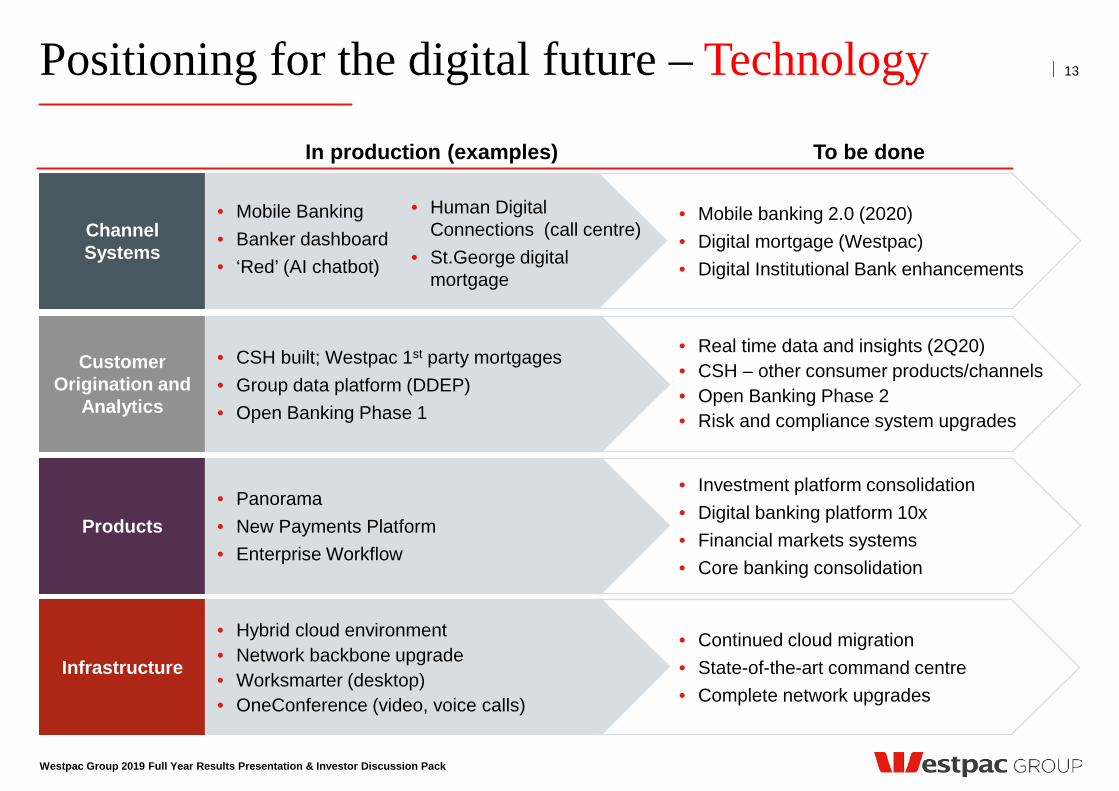
Positioning for the digital future – Technology 13
In production (examples) To be done
Products
Customer Origination and
Analytics
Infrastructure
Channel Systems
• Mobile Banking • Banker dashboard • ‘Red’ (AI chatbot)
• CSH built; Westpac 1st party mortgages • Group data platform (DDEP) • Open Banking Phase 1
• Panorama • New Payments Platform • Enterprise Workflow
• Hybrid cloud environment • Network backbone upgrade • Worksmarter (desktop) • OneConference (video, voice calls)
• Human Digital Connections (call centre)
• St.George digital mortgage
• Mobile banking 2.0 (2020) • Digital mortgage (Westpac) • Digital Institutional Bank enhancements
• Investment platform consolidation • Digital banking platform 10x • Financial markets systems • Core banking consolidation
• Continued cloud migration • State-of-the-art command centre • Complete network upgrades
• Real time data and insights (2Q20) • CSH – other consumer products/channels • Open Banking Phase 2 • Risk and compliance system upgrades
Westpac Group 2019 Full Year Results Presentation & Investor Discussion Pack
Peter King Chief Financial Officer
Financial results throughout this presentation are in Australian dollars and are based on cash earnings unless otherwise stated. Refer page 42 for definition. Results principally cover the 2H19, 1H19 and 2H18 periods. Comparison of 2H19 versus 1H19 (unless otherwise stated)
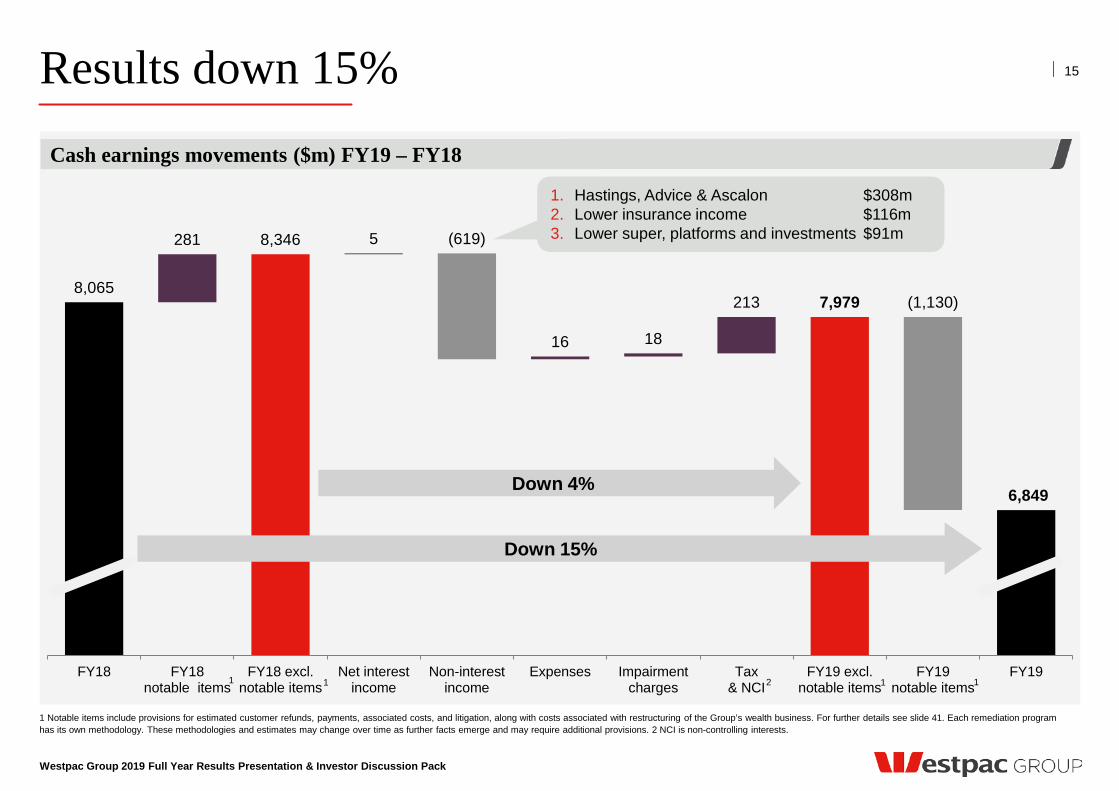
8,065
281 8,346 5
16 18
213 7,979
(619)
(1,130)
6,849
FY18 FY18notable items
FY18 excl.notable items
Net interestincome
Non-interestincome
Expenses Impairmentcharges
Tax& NCI
FY19 excl.notable items
FY19notable items
FY19
Results down 15%
Westpac Group 2019 Full Year Results Presentation & Investor Discussion Pack
1 Notable items include provisions for estimated customer refunds, payments, associated costs, and litigation, along with costs associated with restructuring of the Group’s wealth business. For further details see slide 41. Each remediation program has its own methodology. These methodologies and estimates may change over time as further facts emerge and may require additional provisions. 2 NCI is non-controlling interests.
Cash earnings movements ($m) FY19 – FY18
15
Down 4%
Down 15%
1. Hastings, Advice & Ascalon $308m 2. Lower insurance income $116m 3. Lower super, platforms and investments $91m
2 1 1 1 1
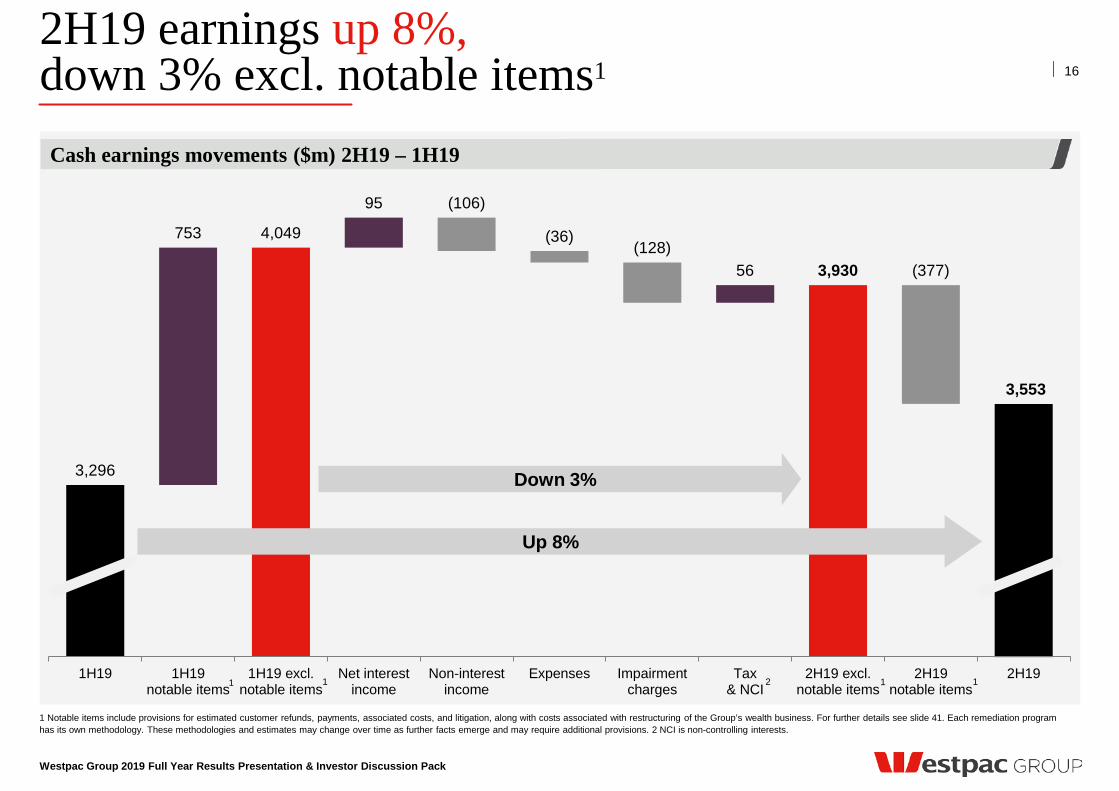
3,296
753 4,049
95
56 3,930
(106)
(36) (128)
(377)
3,553
1H19 1H19notable items
1H19 excl.notable items
Net interestincome
Non-interestincome
Expenses Impairmentcharges
Tax& NCI
2H19 excl.notable items
2H19notable items
2H19
2H19 earnings up 8%, down 3% excl. notable items1
Westpac Group 2019 Full Year Results Presentation & Investor Discussion Pack
1 Notable items include provisions for estimated customer refunds, payments, associated costs, and litigation, along with costs associated with restructuring of the Group’s wealth business. For further details see slide 41. Each remediation program has its own methodology. These methodologies and estimates may change over time as further facts emerge and may require additional provisions. 2 NCI is non-controlling interests.
Cash earnings movements ($m) 2H19 – 1H19
16
Down 3%
Up 8%
2 1 1 1 1
Westpac Group 2019 Full Year Results Presentation & Investor Discussion Pack
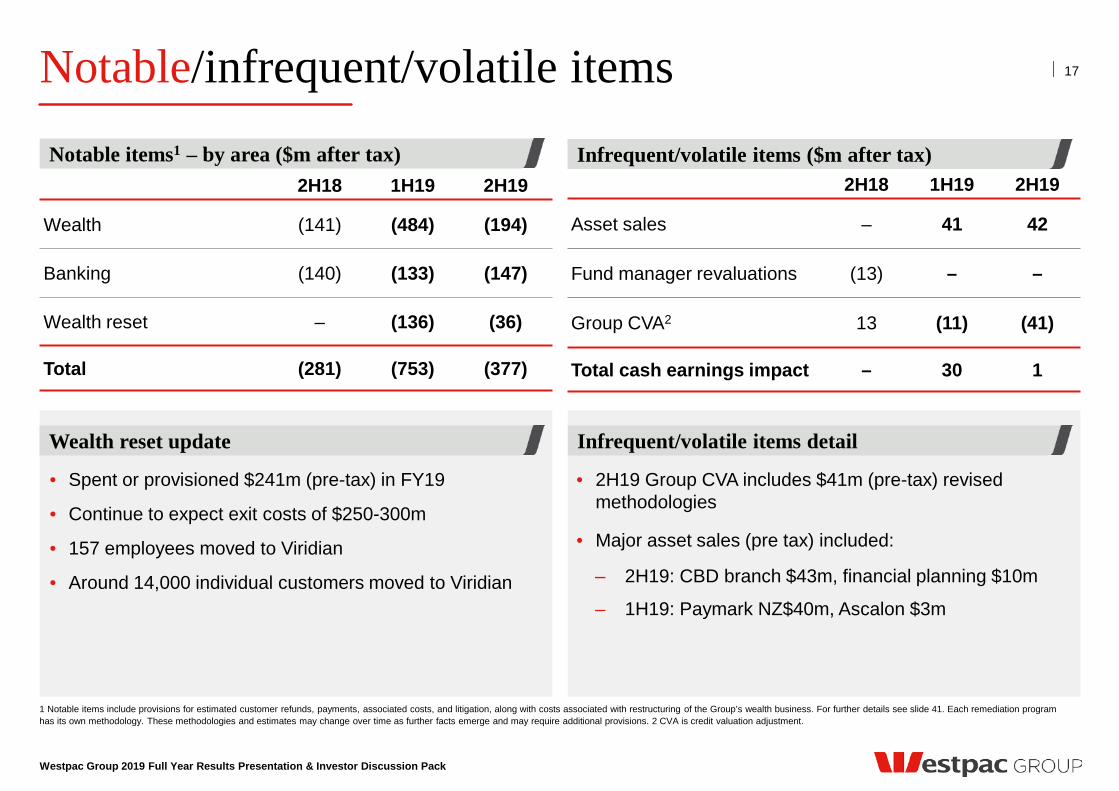
Notable/infrequent/volatile items 17
Infrequent/volatile items ($m after tax) Notable items1 – by area ($m after tax)
Wealth reset update
2H18 1H19 2H19
Wealth (141) (484) (194)
Banking (140) (133) (147)
Wealth reset – (136) (36)
Total (281) (753) (377)
2H18 1H19 2H19
Asset sales – 41 42
Fund manager revaluations (13) – –
Group CVA2 13 (11) (41)
Total cash earnings impact – 30 1
Infrequent/volatile items detail
• Spent or provisioned $241m (pre-tax) in FY19
• Continue to expect exit costs of $250-300m
• 157 employees moved to Viridian
• Around 14,000 individual customers moved to Viridian
• 2H19 Group CVA includes $41m (pre-tax) revised methodologies
• Major asset sales (pre tax) included:
– 2H19: CBD branch $43m, financial planning $10m
– 1H19: Paymark NZ$40m, Ascalon $3m
1 Notable items include provisions for estimated customer refunds, payments, associated costs, and litigation, along with costs associated with restructuring of the Group’s wealth business. For further details see slide 41. Each remediation program has its own methodology. These methodologies and estimates may change over time as further facts emerge and may require additional provisions. 2 CVA is credit valuation adjustment.
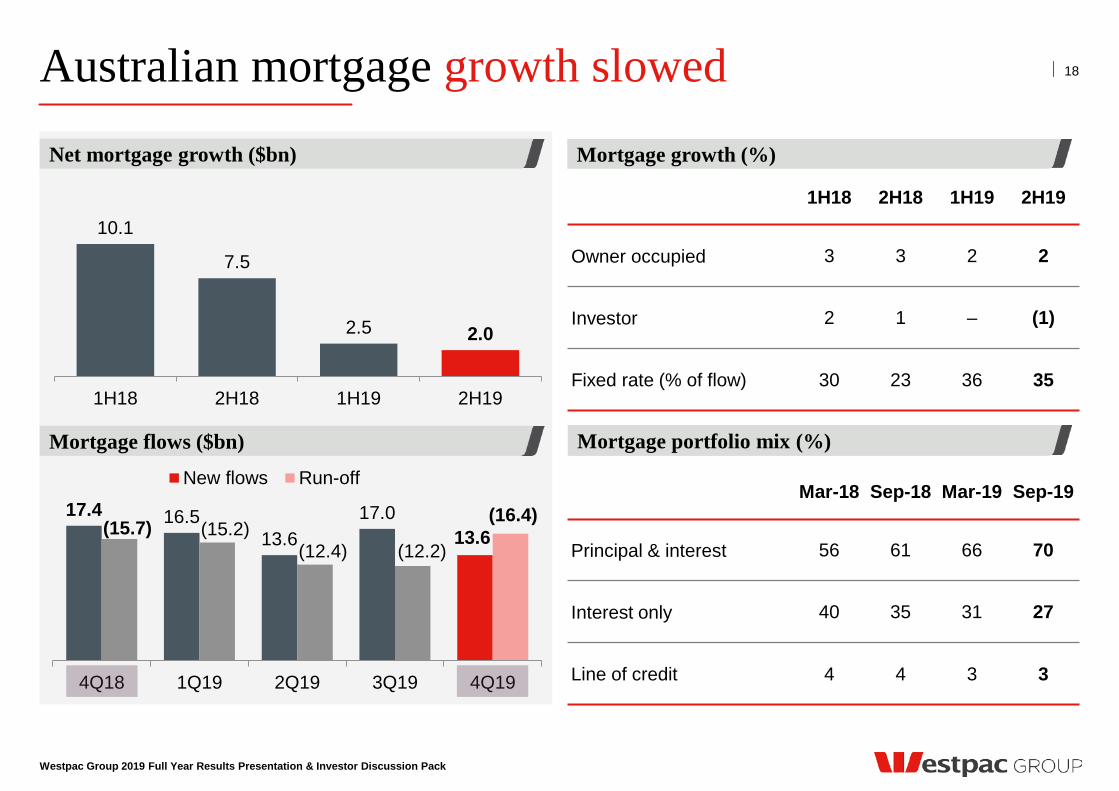
Australian mortgage growth slowed
Westpac Group 2019 Full Year Results Presentation & Investor Discussion Pack
1H18 2H18 1H19 2H19
Owner occupied 3 3 2 2
Investor 2 1 – (1)
Fixed rate (% of flow) 30 23 36 35
Mortgage portfolio mix (%)
Mortgage growth (%)
18
Net mortgage growth ($bn)
Mortgage flows ($bn)
Mar-18 Sep-18 Mar-19 Sep-19
Principal & interest 56 61 66 70
Interest only 40 35 31 27
Line of credit 4 4 3 3
10.1
7.5
2.5 2.0
1H18 2H18 1H19 2H19
17.4 16.5 13.6
17.0 13.6 (15.7) (15.2)
(12.4) (12.2)
(16.4)
4Q18 1Q19 2Q19 3Q19 4Q19
New flows Run-off
Westpac Group 2019 Full Year Results Presentation & Investor Discussion Pack
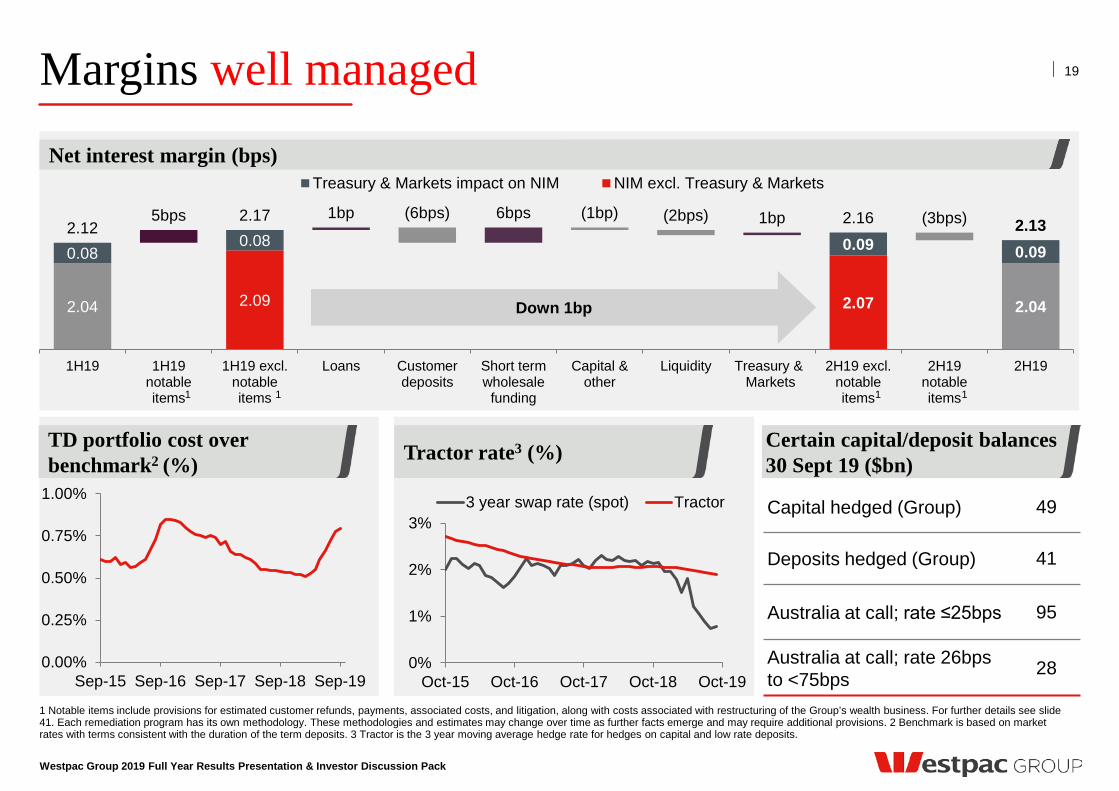
Margins well managed
1 Notable items include provisions for estimated customer refunds, payments, associated costs, and litigation, along with costs associated with restructuring of the Group’s wealth business. For further details see slide 41. Each remediation program has its own methodology. These methodologies and estimates may change over time as further facts emerge and may require additional provisions. 2 Benchmark is based on market rates with terms consistent with the duration of the term deposits. 3 Tractor is the 3 year moving average hedge rate for hedges on capital and low rate deposits.
19
Net interest margin (bps)
Certain capital/deposit balances 30 Sept 19 ($bn)
2.04 2.09 2.07 2.04
0.08 0.08 0.09 0.09
2.12 5bps 2.17 1bp (6bps) 6bps (1bp) (2bps) 1bp 2.16 (3bps) 2.13
1H19 1H19notableitems
1H19 excl.notableitems
Loans Customerdeposits
Short termwholesale
funding
Capital &other
Liquidity Treasury & Markets
2H19 excl.notableitems
2H19notableitems
2H19
Treasury & Markets impact on NIM NIM excl. Treasury & Markets
Capital hedged (Group) 49
Deposits hedged (Group) 41
Australia at call; rate ≤25bps 95
Australia at call; rate 26bps to <75bps 28
Down 1bp
0%
1%
2%
3%
Oct-15 Oct-16 Oct-17 Oct-18 Oct-19
3 year swap rate (spot) Tractor
TD portfolio cost over benchmark2 (%) Tractor rate3 (%)
0.00%
0.25%
0.50%
0.75%
1.00%
Sep-15 Sep-16 Sep-17 Sep-18 Sep-19
1 1 1 1
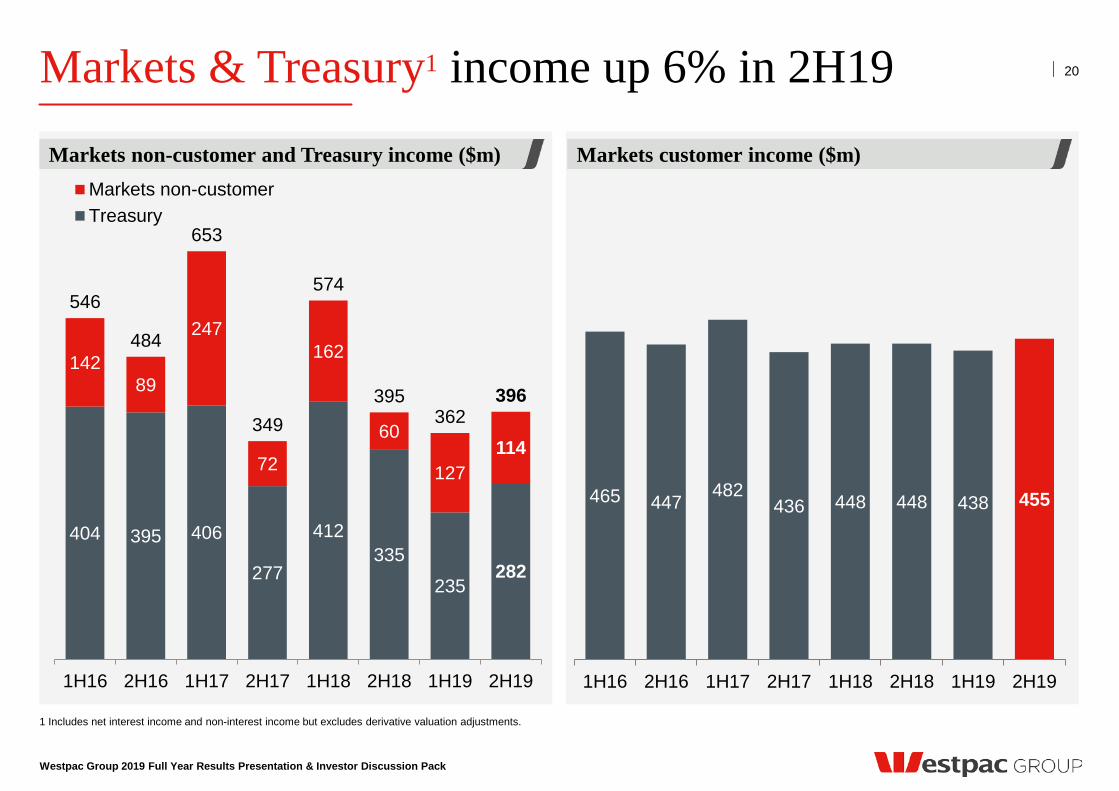
Markets & Treasury1 income up 6% in 2H19
Westpac Group 2019 Full Year Results Presentation & Investor Discussion Pack
1 Includes net interest income and non-interest income but excludes derivative valuation adjustments.
20
Markets customer income ($m) Markets non-customer and Treasury income ($m)
465 447 482 436 448 448 438 455
1H16 2H16 1H17 2H17 1H18 2H18 1H19 2H19
404 395 406
277
412 335
235 282
142 89
247
72
162
60
127 114
546
484
653
349
574
395 362
396
1H16 2H16 1H17 2H17 1H18 2H18 1H19 2H19
Markets non-customerTreasury
Westpac Group 2019 Full Year Results Presentation & Investor Discussion Pack
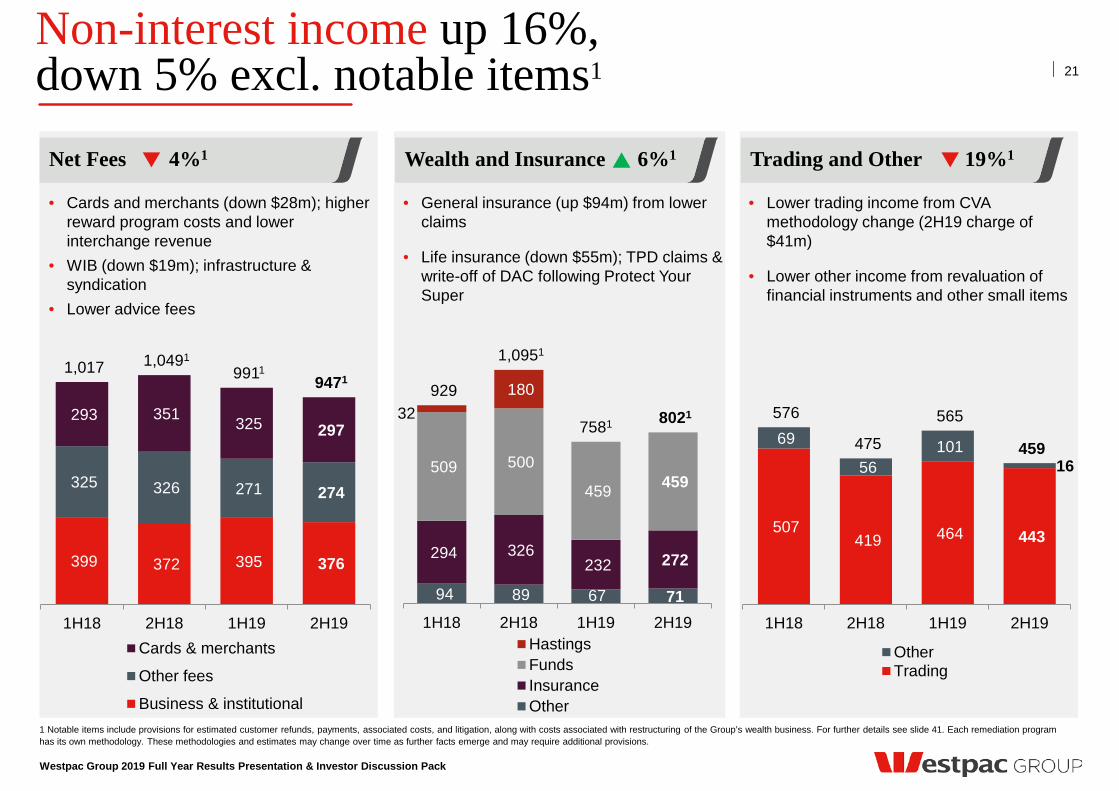
Non-interest income up 16%, down 5% excl. notable items1 21
1 Notable items include provisions for estimated customer refunds, payments, associated costs, and litigation, along with costs associated with restructuring of the Group’s wealth business. For further details see slide 41. Each remediation program has its own methodology. These methodologies and estimates may change over time as further facts emerge and may require additional provisions.
399 372 395 376
325 326 271 274
293 351 325 297
1,017 1,0491 9911 9471
1H18 2H18 1H19 2H19Cards & merchants
Other fees
Business & institutional
• Cards and merchants (down $28m); higher reward program costs and lower interchange revenue
• WIB (down $19m); infrastructure & syndication
• Lower advice fees
94 89 67 71
294 326 232 272
509 500
459 459
32 180 929
1,0951
7581 8021
1H18 2H18 1H19 2H19HastingsFundsInsuranceOther
• General insurance (up $94m) from lower claims
• Life insurance (down $55m); TPD claims & write-off of DAC following Protect Your Super
507 419 464 443
69
56 101
16
576
475
565
459
1H18 2H18 1H19 2H19
OtherTrading
• Lower trading income from CVA methodology change (2H19 charge of $41m)
• Lower other income from revaluation of financial instruments and other small items
Net Fees 4%1 Wealth and Insurance 6%1 Trading and Other 19%1
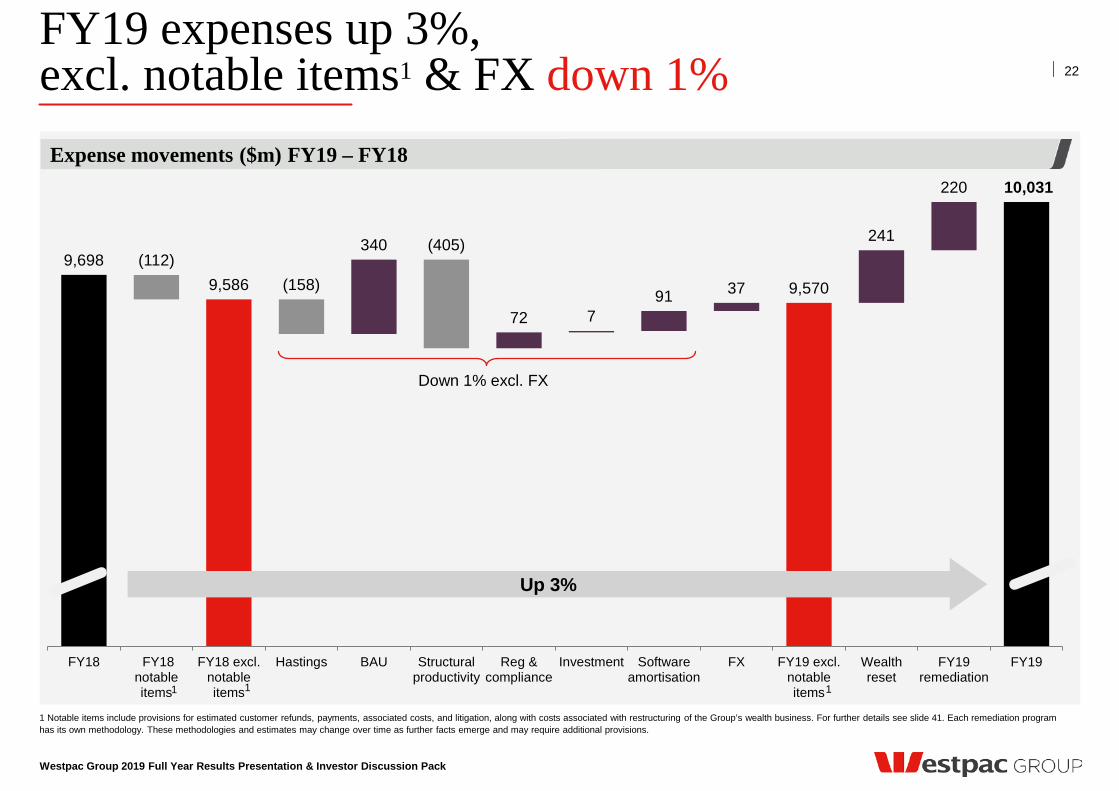
9,698 9,586
340
72 7 91 37 9,570
241
220
(112) (158)
(405)
10,031
FY18 FY18notableitems
FY18 excl.notableitems
Hastings BAU Structuralproductivity
Reg &compliance
Investment Softwareamortisation
FX FY19 excl.notableitems
Wealthreset
FY19remediation
FY19
FY19 expenses up 3%, excl. notable items1 & FX down 1%
Westpac Group 2019 Full Year Results Presentation & Investor Discussion Pack
1 Notable items include provisions for estimated customer refunds, payments, associated costs, and litigation, along with costs associated with restructuring of the Group’s wealth business. For further details see slide 41. Each remediation program has its own methodology. These methodologies and estimates may change over time as further facts emerge and may require additional provisions.
Expense movements ($m) FY19 – FY18
22
Up 3%
Down 1% excl. FX
1 1 1
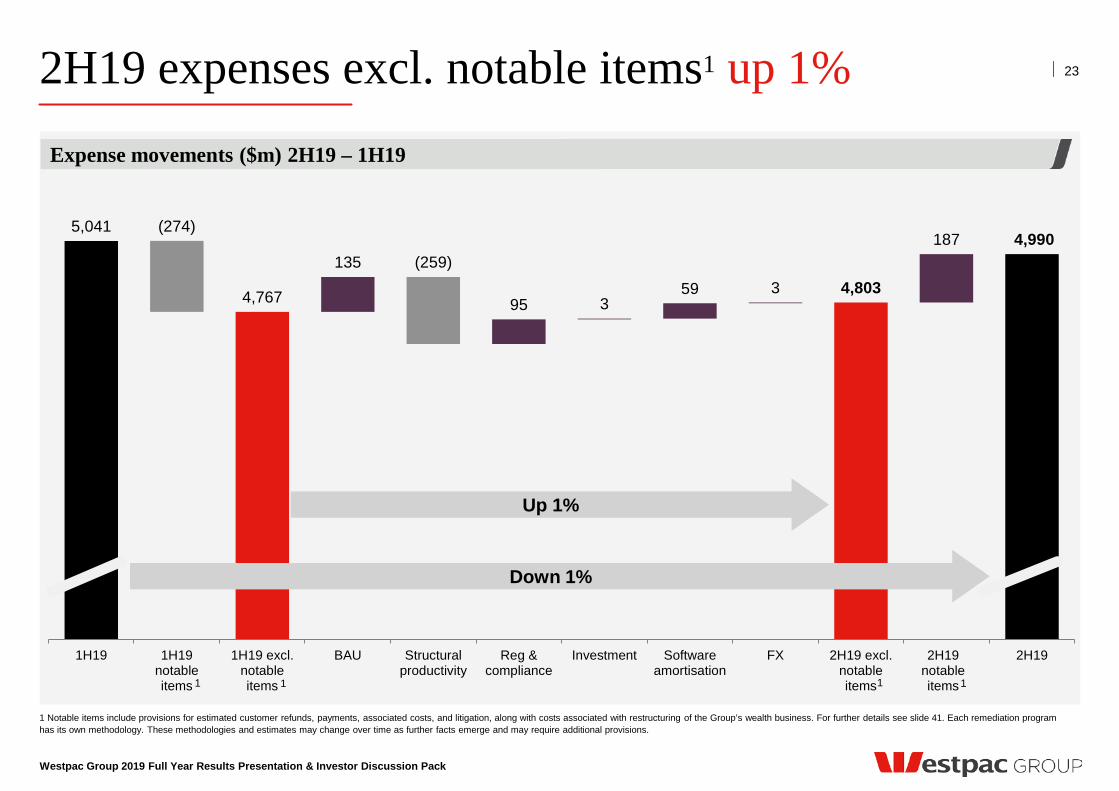
5,041
4,767
135
95 3 59 3 4,803
187 (274)
(259) 4,990
1H19 1H19notableitems
1H19 excl.notableitems
BAU Structuralproductivity
Reg &compliance
Investment Softwareamortisation
FX 2H19 excl.notableitems
2H19notableitems
2H19
2H19 expenses excl. notable items1 up 1%
Westpac Group 2019 Full Year Results Presentation & Investor Discussion Pack
1 Notable items include provisions for estimated customer refunds, payments, associated costs, and litigation, along with costs associated with restructuring of the Group’s wealth business. For further details see slide 41. Each remediation program has its own methodology. These methodologies and estimates may change over time as further facts emerge and may require additional provisions.
Expense movements ($m) 2H19 – 1H19
23
Down 1%
1 1 1 1
Up 1%
Credit quality
Westpac Group 2019 Full Year Results Presentation & Investor Discussion Pack
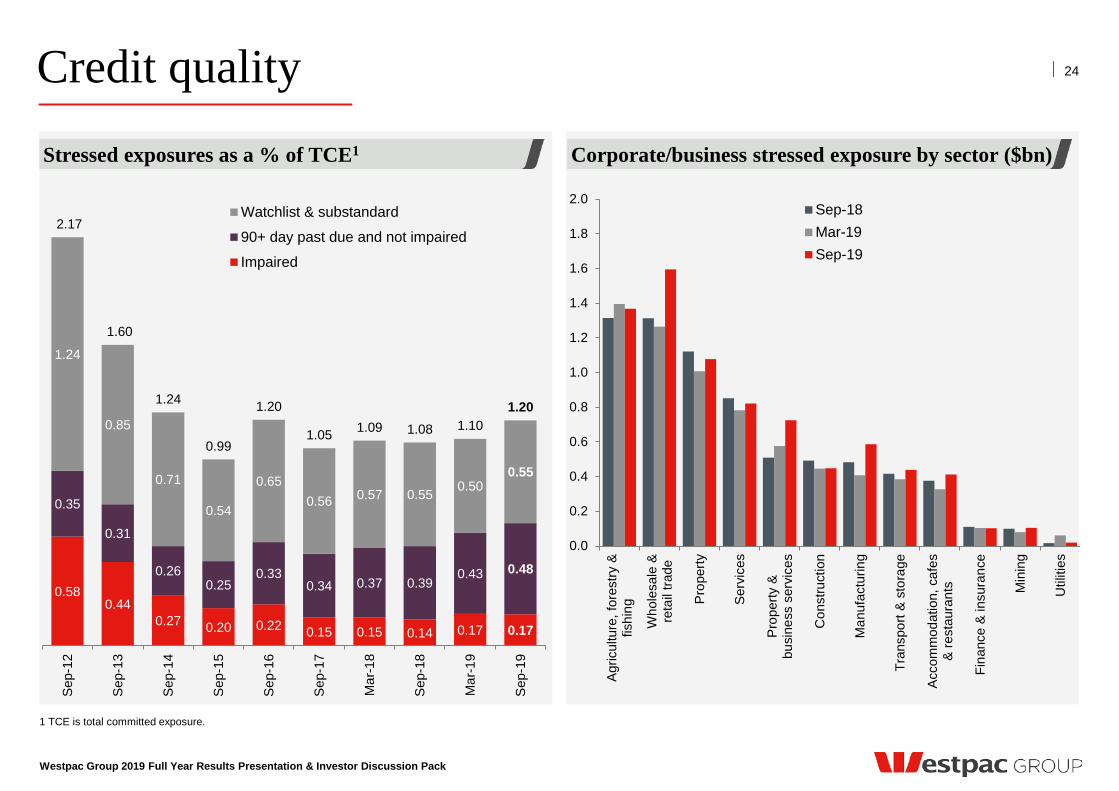
1 TCE is total committed exposure.
24
Corporate/business stressed exposure by sector ($bn) Stressed exposures as a % of TCE1
0.0
0.2
0.4
0.6
0.8
1.0
1.2
1.4
1.6
1.8
2.0
Agr
icul
ture
, for
estry
&fis
hing
Who
lesa
le &
reta
il tra
de
Pro
perty
Ser
vice
s
Pro
perty
&bu
sine
ss s
ervi
ces
Con
stru
ctio
n
Man
ufac
turin
g
Tran
spor
t & s
tora
ge
Acc
omm
odat
ion,
caf
es&
rest
aura
nts
Fina
nce
& in
sura
nce
Min
ing
Util
ities
Sep-18Mar-19Sep-19
0.58 0.44
0.27 0.20 0.22 0.15 0.15 0.14 0.17 0.17
0.35
0.31
0.26 0.25
0.33 0.34 0.37 0.39
0.43 0.48
1.24
0.85
0.71
0.54
0.65 0.56 0.57 0.55 0.50
0.55
2.17
1.60
1.24
0.99
1.20
1.05 1.09 1.08 1.10 1.20
Sep
-12
Sep
-13
Sep
-14
Sep
-15
Sep
-16
Sep
-17
Mar
-18
Sep
-18
Mar
-19
Sep
-19
Watchlist & substandard
90+ day past due and not impaired
Impaired
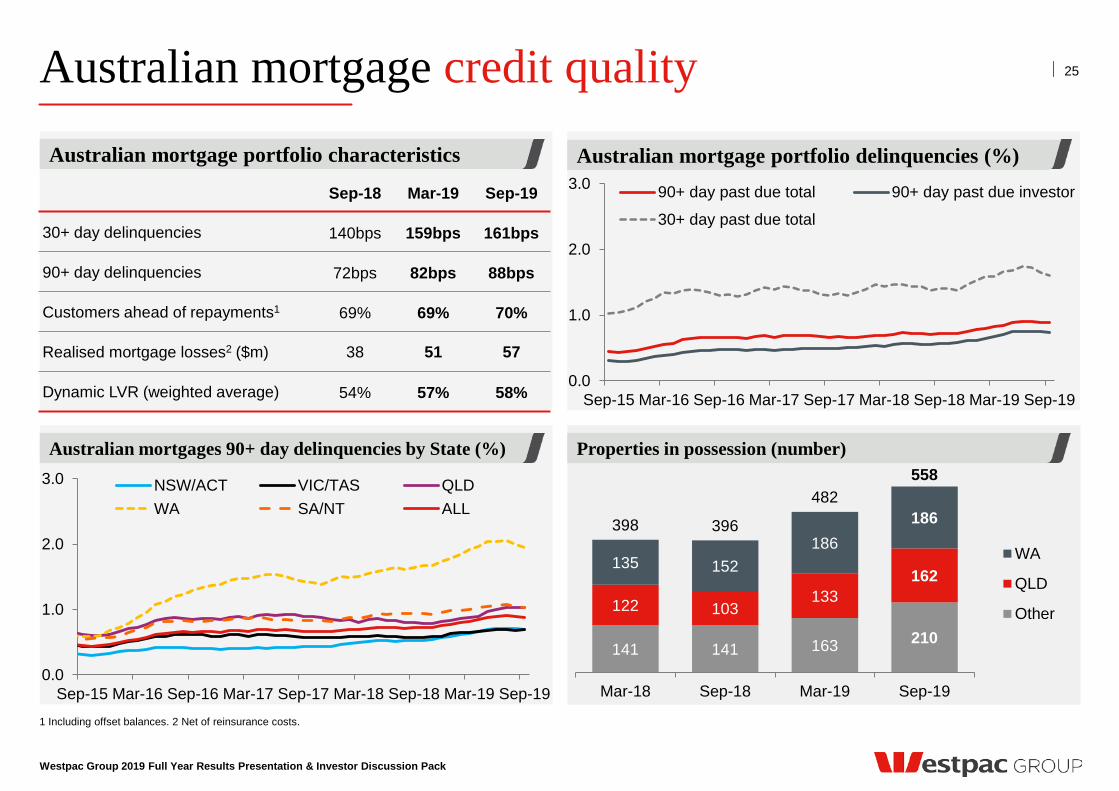
Sep-18 Mar-19 Sep-19
30+ day delinquencies 140bps 159bps 161bps
90+ day delinquencies 72bps 82bps 88bps
Customers ahead of repayments1 69% 69% 70%
Realised mortgage losses2 ($m) 38 51 57
Dynamic LVR (weighted average) 54% 57% 58% 0.0
1.0
2.0
3.0
Sep-15 Mar-16 Sep-16 Mar-17 Sep-17 Mar-18 Sep-18 Mar-19 Sep-19
90+ day past due total 90+ day past due investor
30+ day past due total
0.0
1.0
2.0
3.0
Sep-15 Mar-16 Sep-16 Mar-17 Sep-17 Mar-18 Sep-18 Mar-19 Sep-19
NSW/ACT VIC/TAS QLDWA SA/NT ALL
Australian mortgage credit quality
Westpac Group 2019 Full Year Results Presentation & Investor Discussion Pack
Properties in possession (number)
Australian mortgage portfolio characteristics
Australian mortgages 90+ day delinquencies by State (%)
1 Including offset balances. 2 Net of reinsurance costs.
25
141 141 163 210
122 103 133
162 135 152
186 186 398 396
482 558
Mar-18 Sep-18 Mar-19 Sep-19
WA
QLD
Other
Australian mortgage portfolio delinquencies (%)
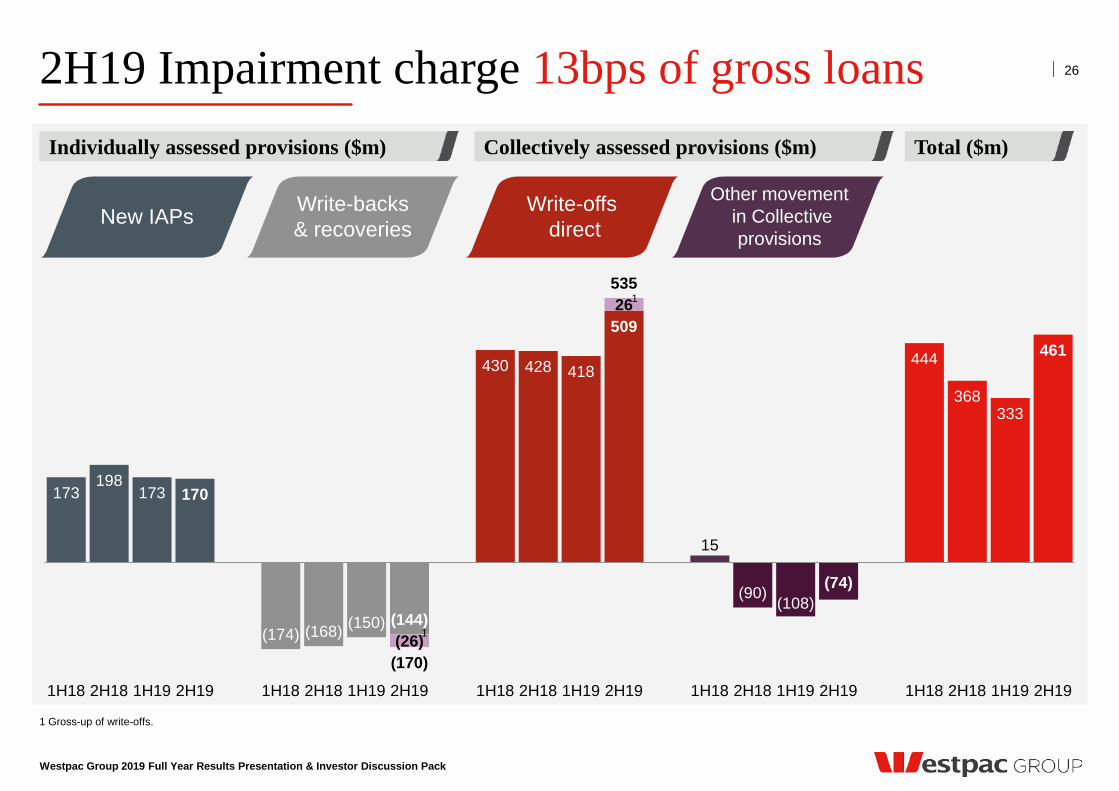
2H19 Impairment charge 13bps of gross loans 26
Total ($m) Collectively assessed provisions ($m) Individually assessed provisions ($m)
173 198
173 170
(174) (168) (150) (144)
430 428 418
509
15
(90) (108) (74)
444
368 333
461
(26)
26
(170)
535
1H18 2H18 1H19 2H19 1H18 2H18 1H19 2H19 1H18 2H18 1H19 2H19 1H18 2H18 1H19 2H19 1H18 2H18 1H19 2H19
New IAPs Write-backs & recoveries
Write-offs direct
Other movement in Collective
provisions
Westpac Group 2019 Full Year Results Presentation & Investor Discussion Pack
1 Gross-up of write-offs.
1
1
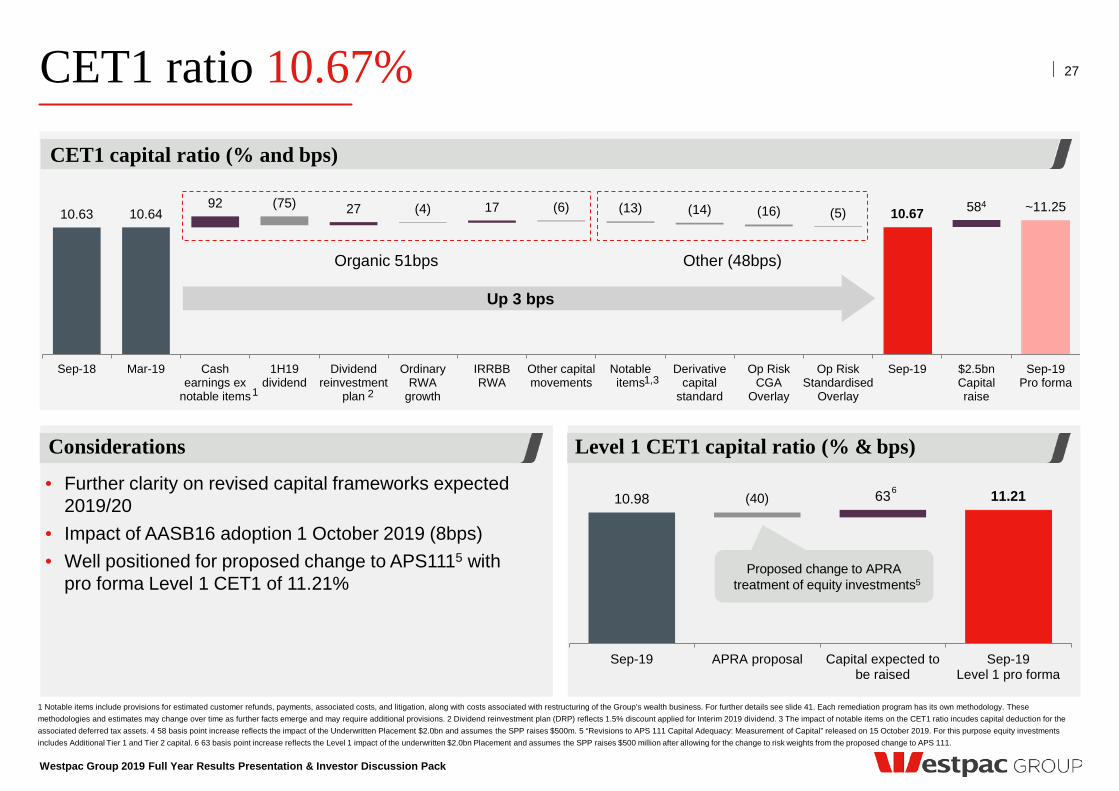
10.63 10.64 92 (75) 27 (4) 17 (6) (13) (14) (16) 10.67 584 ~11.25 (5)
Sep-18 Mar-19 Cashearnings ex
notable items
1H19dividend
Dividendreinvestment
plan
OrdinaryRWA
growth
IRRBBRWA
Other capitalmovements
Notableitems
Derivativecapital
standard
Op RiskCGA
Overlay
Op RiskStandardised
Overlay
Sep-19 $2.5bnCapitalraise
Sep-19Pro forma
CET1 ratio 10.67%
Westpac Group 2019 Full Year Results Presentation & Investor Discussion Pack
1 Notable items include provisions for estimated customer refunds, payments, associated costs, and litigation, along with costs associated with restructuring of the Group’s wealth business. For further details see slide 41. Each remediation program has its own methodology. These methodologies and estimates may change over time as further facts emerge and may require additional provisions. 2 Dividend reinvestment plan (DRP) reflects 1.5% discount applied for Interim 2019 dividend. 3 The impact of notable items on the CET1 ratio incudes capital deduction for the associated deferred tax assets. 4 58 basis point increase reflects the impact of the Underwritten Placement $2.0bn and assumes the SPP raises $500m. 5 “Revisions to APS 111 Capital Adequacy: Measurement of Capital” released on 15 October 2019. For this purpose equity investments includes Additional Tier 1 and Tier 2 capital. 6 63 basis point increase reflects the Level 1 impact of the underwritten $2.0bn Placement and assumes the SPP raises $500 million after allowing for the change to risk weights from the proposed change to APS 111.
CET1 capital ratio (% and bps)
27
Up 3 bps
Organic 51bps Other (48bps)
• Further clarity on revised capital frameworks expected 2019/20
• Impact of AASB16 adoption 1 October 2019 (8bps) • Well positioned for proposed change to APS1115 with
pro forma Level 1 CET1 of 11.21%
Considerations Level 1 CET1 capital ratio (% & bps)
1,3 1 2
10.98 63 11.21 (40)
Sep-19 APRA proposal Capital expected tobe raised
Sep-19Level 1 pro forma
Proposed change to APRA treatment of equity investments5
6
Westpac Group 2019 Full Year Results Presentation & Investor Discussion Pack
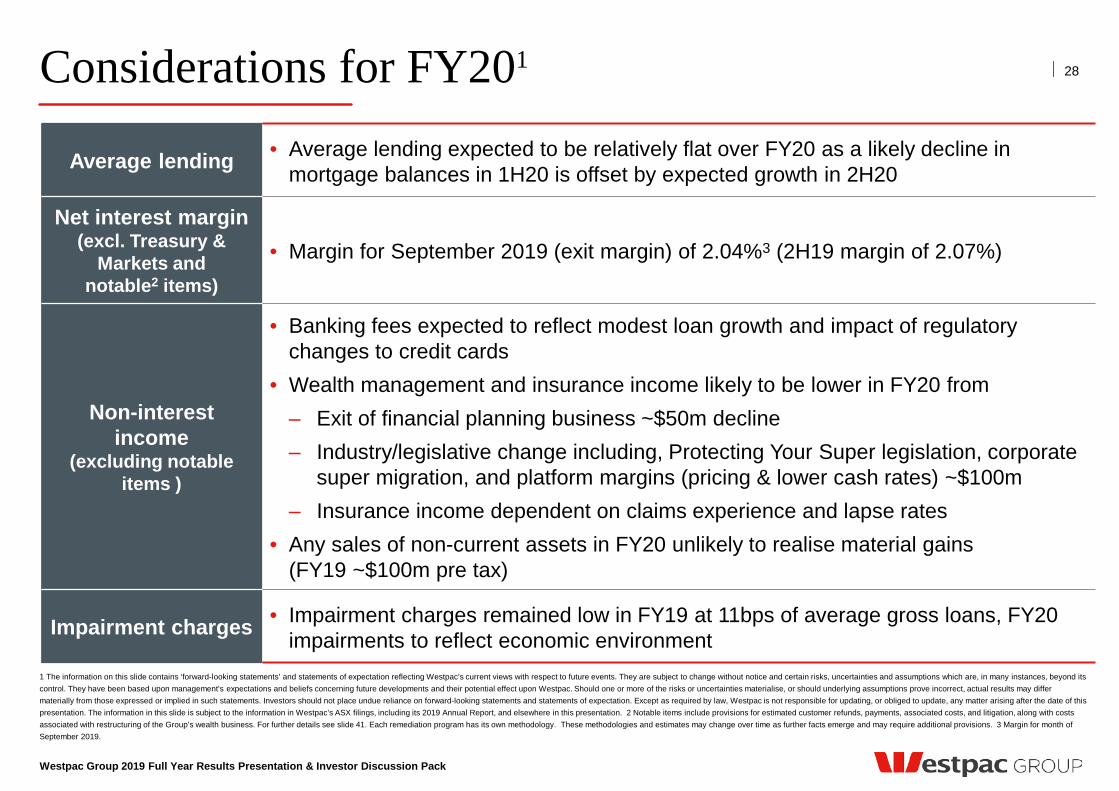
Considerations for FY201
1 The information on this slide contains ‘forward-looking statements’ and statements of expectation reflecting Westpac’s current views with respect to future events. They are subject to change without notice and certain risks, uncertainties and assumptions which are, in many instances, beyond its control. They have been based upon management's expectations and beliefs concerning future developments and their potential effect upon Westpac. Should one or more of the risks or uncertainties materialise, or should underlying assumptions prove incorrect, actual results may differ materially from those expressed or implied in such statements. Investors should not place undue reliance on forward-looking statements and statements of expectation. Except as required by law, Westpac is not responsible for updating, or obliged to update, any matter arising after the date of this presentation. The information in this slide is subject to the information in Westpac’s ASX filings, including its 2019 Annual Report, and elsewhere in this presentation. 2 Notable items include provisions for estimated customer refunds, payments, associated costs, and litigation, along with costs associated with restructuring of the Group’s wealth business. For further details see slide 41. Each remediation program has its own methodology. These methodologies and estimates may change over time as further facts emerge and may require additional provisions. 3 Margin for month of September 2019.
28
Average lending • Average lending expected to be relatively flat over FY20 as a likely decline in mortgage balances in 1H20 is offset by expected growth in 2H20
Net interest margin (excl. Treasury &
Markets and notable2 items)
• Margin for September 2019 (exit margin) of 2.04%3 (2H19 margin of 2.07%)
Non-interest income
(excluding notable items )
• Banking fees expected to reflect modest loan growth and impact of regulatory changes to credit cards
• Wealth management and insurance income likely to be lower in FY20 from ‒ Exit of financial planning business ~$50m decline ‒ Industry/legislative change including, Protecting Your Super legislation, corporate
super migration, and platform margins (pricing & lower cash rates) ~$100m ‒ Insurance income dependent on claims experience and lapse rates
• Any sales of non-current assets in FY20 unlikely to realise material gains (FY19 ~$100m pre tax)
Impairment charges • Impairment charges remained low in FY19 at 11bps of average gross loans, FY20 impairments to reflect economic environment
Westpac Group 2019 Full Year Results Presentation & Investor Discussion Pack
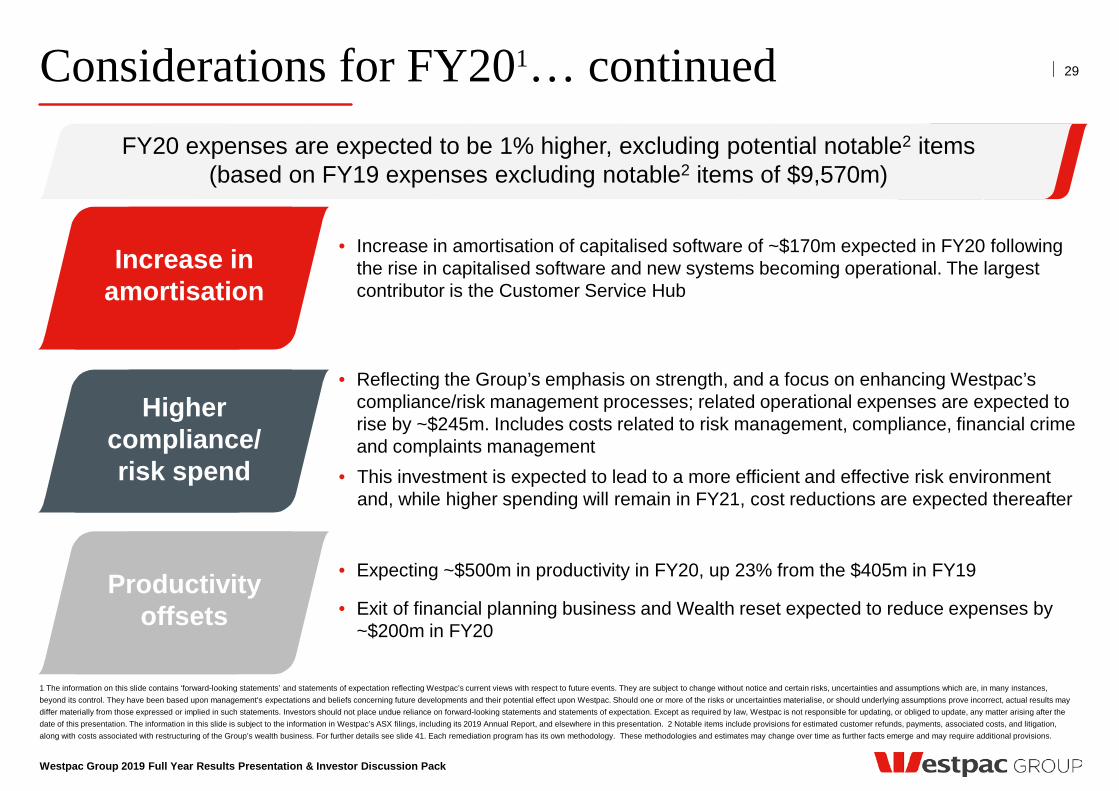
Considerations for FY201… continued
1 The information on this slide contains ‘forward-looking statements’ and statements of expectation reflecting Westpac’s current views with respect to future events. They are subject to change without notice and certain risks, uncertainties and assumptions which are, in many instances, beyond its control. They have been based upon management's expectations and beliefs concerning future developments and their potential effect upon Westpac. Should one or more of the risks or uncertainties materialise, or should underlying assumptions prove incorrect, actual results may differ materially from those expressed or implied in such statements. Investors should not place undue reliance on forward-looking statements and statements of expectation. Except as required by law, Westpac is not responsible for updating, or obliged to update, any matter arising after the date of this presentation. The information in this slide is subject to the information in Westpac’s ASX filings, including its 2019 Annual Report, and elsewhere in this presentation. 2 Notable items include provisions for estimated customer refunds, payments, associated costs, and litigation, along with costs associated with restructuring of the Group’s wealth business. For further details see slide 41. Each remediation program has its own methodology. These methodologies and estimates may change over time as further facts emerge and may require additional provisions.
29
FY20 expenses are expected to be 1% higher, excluding potential notable2 items (based on FY19 expenses excluding notable2 items of $9,570m)
• Increase in amortisation of capitalised software of ~$170m expected in FY20 following the rise in capitalised software and new systems becoming operational. The largest contributor is the Customer Service Hub
• Expecting ~$500m in productivity in FY20, up 23% from the $405m in FY19
• Exit of financial planning business and Wealth reset expected to reduce expenses by ~$200m in FY20
• Reflecting the Group’s emphasis on strength, and a focus on enhancing Westpac’s compliance/risk management processes; related operational expenses are expected to rise by ~$245m. Includes costs related to risk management, compliance, financial crime and complaints management
• This investment is expected to lead to a more efficient and effective risk environment and, while higher spending will remain in FY21, cost reductions are expected thereafter
Productivity offsets
Higher compliance/ risk spend
Increase in amortisation

Brian Hartzer Chief Executive Officer
Financial results throughout this presentation are in Australian dollars and are based on cash earnings unless otherwise stated. Refer page 42 for definition. Results principally cover the 2H19, 1H19 and 2H18 periods. Comparison of 2H19 versus 1H19 (unless otherwise stated)
Westpac Group 2019 Full Year Results Presentation & Investor Discussion Pack
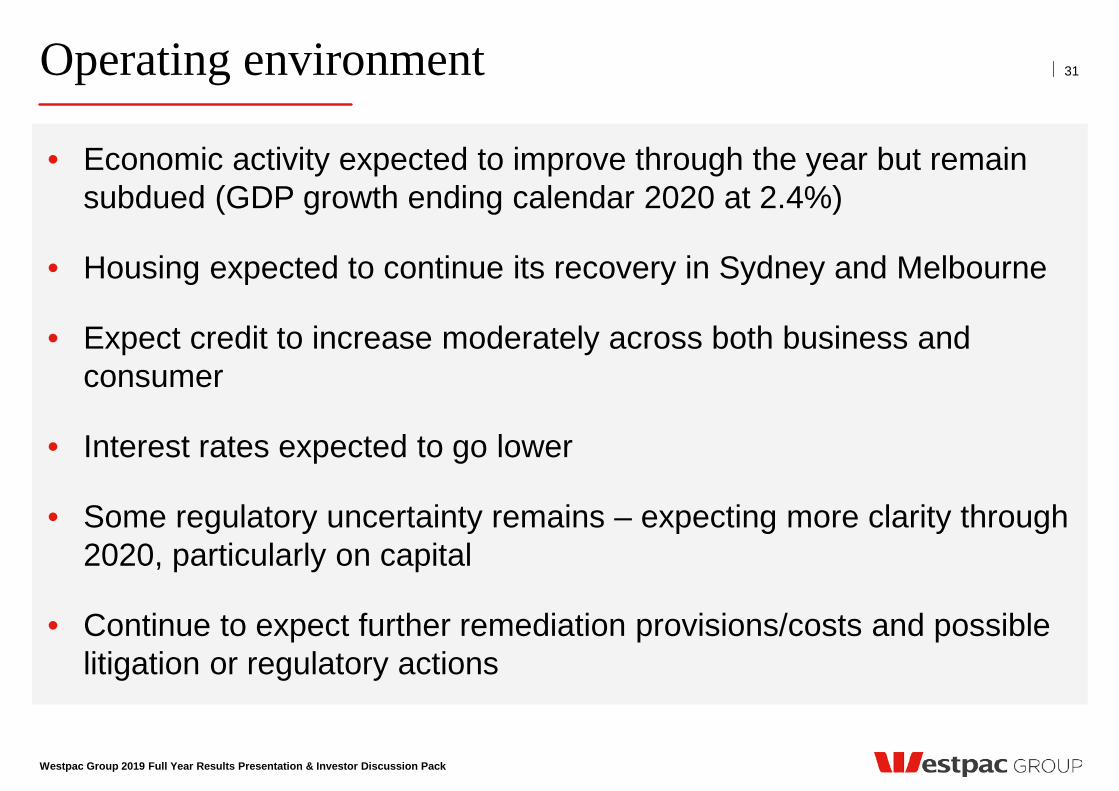
Operating environment
• Economic activity expected to improve through the year but remain subdued (GDP growth ending calendar 2020 at 2.4%)
• Housing expected to continue its recovery in Sydney and Melbourne
• Expect credit to increase moderately across both business and consumer
• Interest rates expected to go lower
• Some regulatory uncertainty remains – expecting more clarity through 2020, particularly on capital
• Continue to expect further remediation provisions/costs and possible litigation or regulatory actions
31
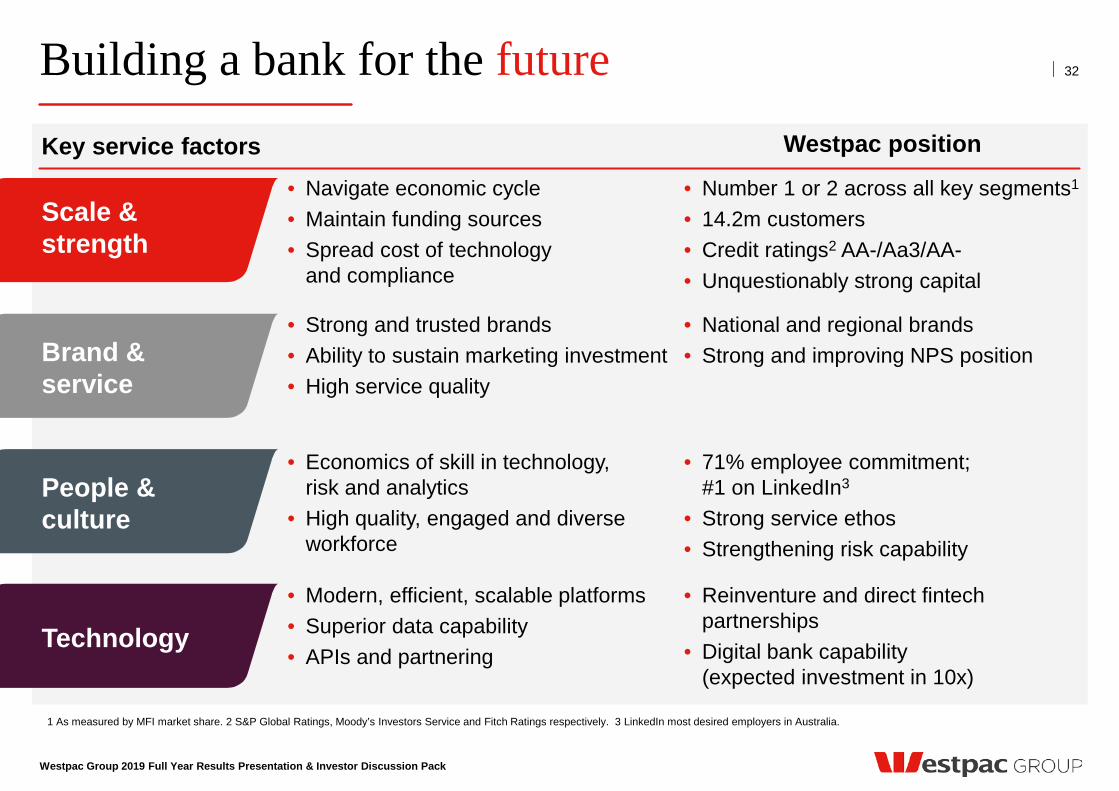
• Navigate economic cycle • Maintain funding sources • Spread cost of technology
and compliance
• Number 1 or 2 across all key segments1 • 14.2m customers • Credit ratings2 AA-/Aa3/AA-
• Unquestionably strong capital
• Strong and trusted brands • Ability to sustain marketing investment • High service quality
• National and regional brands • Strong and improving NPS position
• Economics of skill in technology, risk and analytics
• High quality, engaged and diverse workforce
• 71% employee commitment; #1 on LinkedIn3
• Strong service ethos • Strengthening risk capability
• Modern, efficient, scalable platforms • Superior data capability • APIs and partnering
• Reinventure and direct fintech partnerships
• Digital bank capability (expected investment in 10x)
Westpac Group 2019 Full Year Results Presentation & Investor Discussion Pack
Building a bank for the future
1 As measured by MFI market share. 2 S&P Global Ratings, Moody’s Investors Service and Fitch Ratings respectively. 3 LinkedIn most desired employers in Australia.
32
Scale & strength
Brand & service
People & culture
Technology
Key service factors Westpac position
Westpac Group 2019 Full Year Results Presentation & Investor Discussion Pack
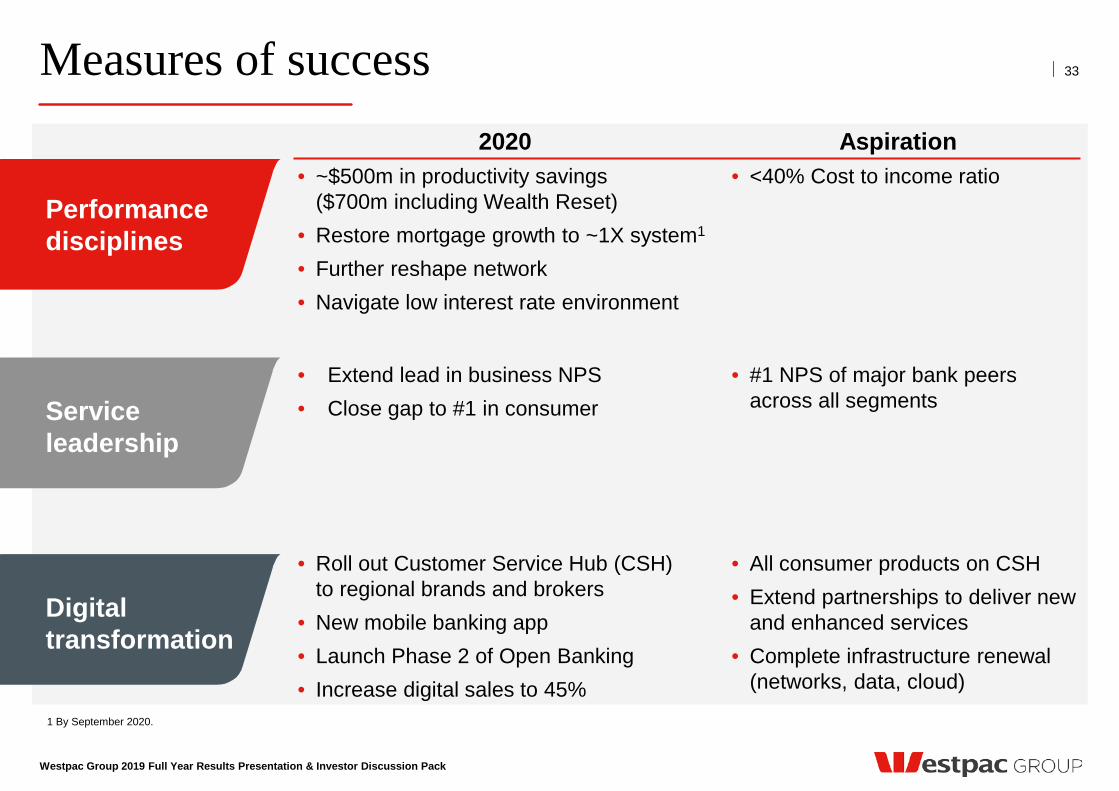
Measures of success
1 By September 2020.
33
2020 Aspiration • ~$500m in productivity savings
($700m including Wealth Reset) • Restore mortgage growth to ~1X system1
• Further reshape network • Navigate low interest rate environment
• <40% Cost to income ratio
• Extend lead in business NPS • Close gap to #1 in consumer
• #1 NPS of major bank peers across all segments
• Roll out Customer Service Hub (CSH) to regional brands and brokers
• New mobile banking app • Launch Phase 2 of Open Banking • Increase digital sales to 45%
• All consumer products on CSH • Extend partnerships to deliver new
and enhanced services • Complete infrastructure renewal
(networks, data, cloud)
Performance disciplines
Service leadership
Digital transformation

Financial results throughout this presentation are in Australian dollars and are based on cash earnings unless otherwise stated. Refer page 42 for definition. Results principally cover the 2H19, 1H19 and 2H18 periods. Comparison of 2H19 versus 1H19 (unless otherwise stated)
Investor Discussion Pack

Strategy
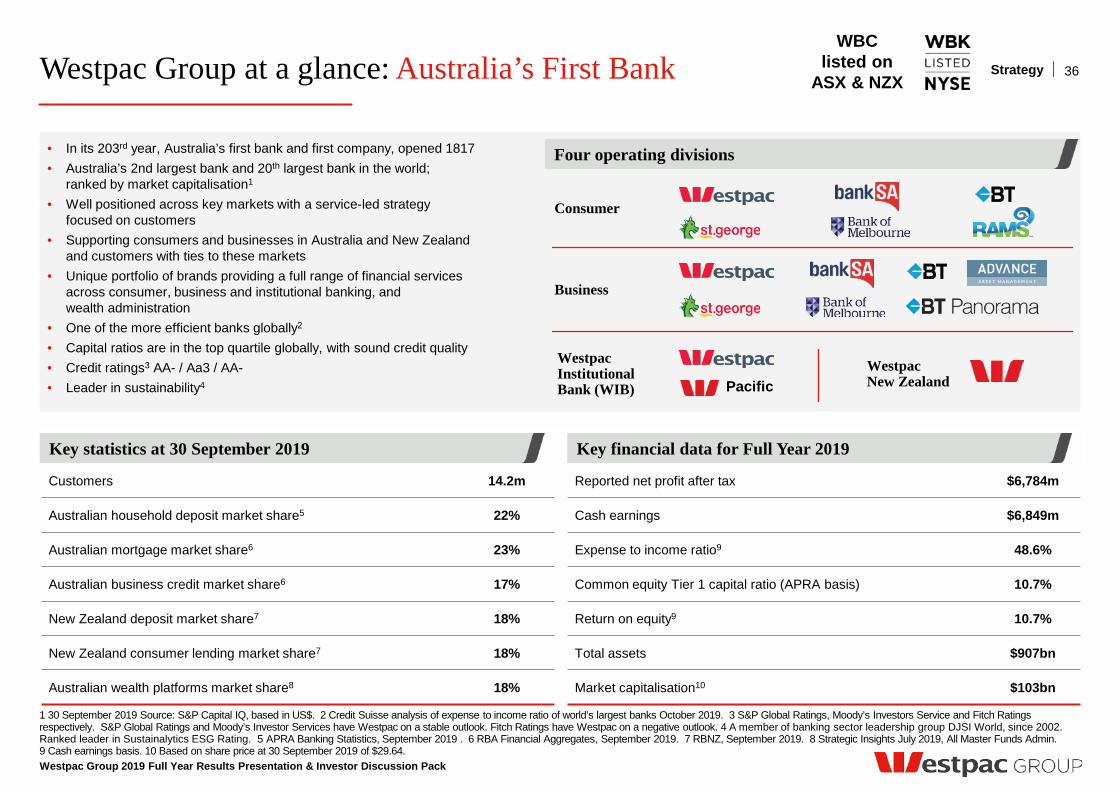
Westpac Group at a glance: Australia’s First Bank
Westpac Group 2019 Full Year Results Presentation & Investor Discussion Pack
1 30 September 2019 Source: S&P Capital IQ, based in US$. 2 Credit Suisse analysis of expense to income ratio of world’s largest banks October 2019. 3 S&P Global Ratings, Moody’s Investors Service and Fitch Ratings respectively. S&P Global Ratings and Moody’s Investor Services have Westpac on a stable outlook. Fitch Ratings have Westpac on a negative outlook. 4 A member of banking sector leadership group DJSI World, since 2002. Ranked leader in Sustainalytics ESG Rating. 5 APRA Banking Statistics, September 2019 . 6 RBA Financial Aggregates, September 2019. 7 RBNZ, September 2019. 8 Strategic Insights July 2019, All Master Funds Admin. 9 Cash earnings basis. 10 Based on share price at 30 September 2019 of $29.64.
36
WBC listed on
ASX & NZX Strategy
• In its 203rd year, Australia’s first bank and first company, opened 1817 • Australia’s 2nd largest bank and 20th largest bank in the world;
ranked by market capitalisation1 • Well positioned across key markets with a service-led strategy
focused on customers • Supporting consumers and businesses in Australia and New Zealand
and customers with ties to these markets • Unique portfolio of brands providing a full range of financial services
across consumer, business and institutional banking, and wealth administration
• One of the more efficient banks globally2
• Capital ratios are in the top quartile globally, with sound credit quality • Credit ratings3 AA- / Aa3 / AA- • Leader in sustainability4
Westpac Institutional Bank (WIB)
Westpac New Zealand
Consumer
Business
Key statistics at 30 September 2019 Key financial data for Full Year 2019
Reported net profit after tax $6,784m
Cash earnings $6,849m
Expense to income ratio9 48.6%
Common equity Tier 1 capital ratio (APRA basis) 10.7%
Return on equity9 10.7%
Total assets $907bn
Market capitalisation10 $103bn
Customers 14.2m
Australian household deposit market share5 22%
Australian mortgage market share6 23%
Australian business credit market share6 17%
New Zealand deposit market share7 18%
New Zealand consumer lending market share7 18%
Australian wealth platforms market share8 18%
Four operating divisions
Pacific
Framing our strategic agenda Strategy
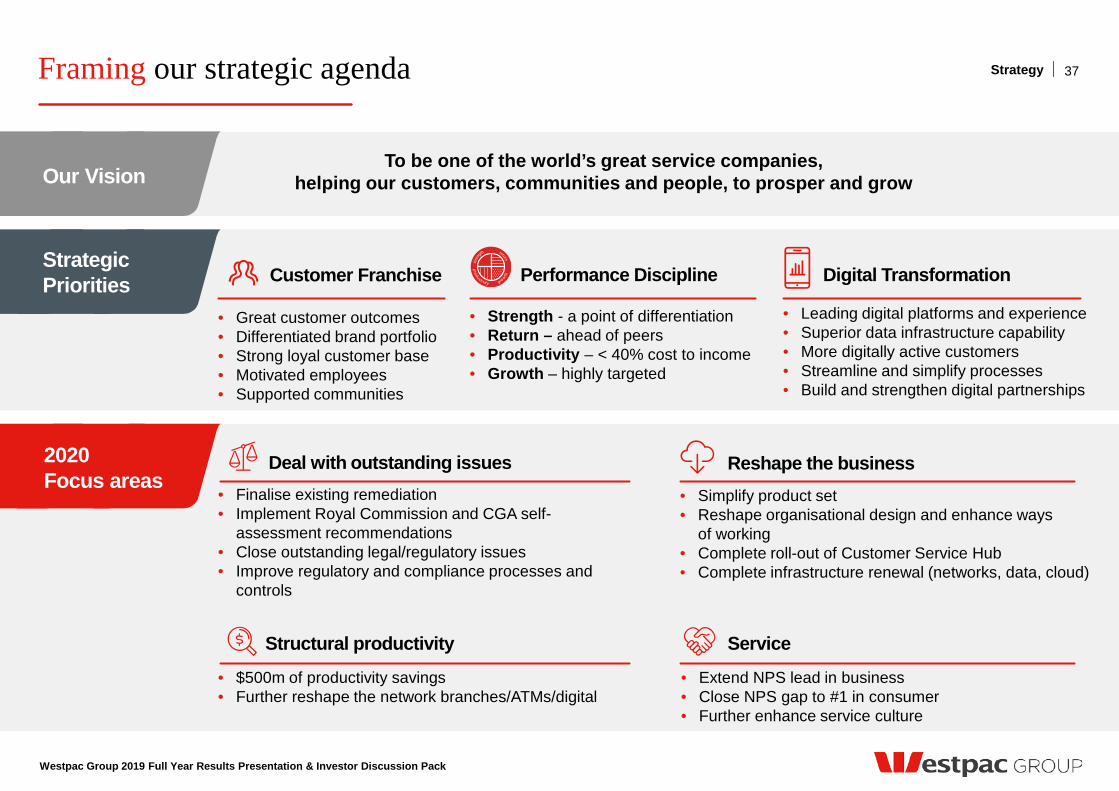
To be one of the world’s great service companies, helping our customers, communities and people, to prosper and grow
Westpac Group 2019 Full Year Results Presentation & Investor Discussion Pack
37
2020 Focus areas
Strategic Priorities Digital Transformation Customer Franchise Performance Discipline
Deal with outstanding issues
Structural productivity
Reshape the business
• Great customer outcomes • Differentiated brand portfolio • Strong loyal customer base • Motivated employees • Supported communities
• Strength - a point of differentiation • Return – ahead of peers • Productivity – < 40% cost to income • Growth – highly targeted
• Leading digital platforms and experience • Superior data infrastructure capability • More digitally active customers • Streamline and simplify processes • Build and strengthen digital partnerships
• Finalise existing remediation • Implement Royal Commission and CGA self-
assessment recommendations • Close outstanding legal/regulatory issues • Improve regulatory and compliance processes and
controls
• $500m of productivity savings • Further reshape the network branches/ATMs/digital
• Simplify product set • Reshape organisational design and enhance ways
of working • Complete roll-out of Customer Service Hub • Complete infrastructure renewal (networks, data, cloud)
Service
• Extend NPS lead in business • Close NPS gap to #1 in consumer • Further enhance service culture
Our Vision
Progress on our 2019 priorities1
Westpac Group 2019 Full Year Results Presentation & Investor Discussion Pack
1 Progress over FY19 unless otherwise noted. 2 Refer to pages 153 and 154 for metric definitions and details of metric provider. 3 Australian NPS is August 2019. 4 Main financial institution. 5 Refers to Total SME. 6 Strategic Insights June 2019. All Master Funds Admin.
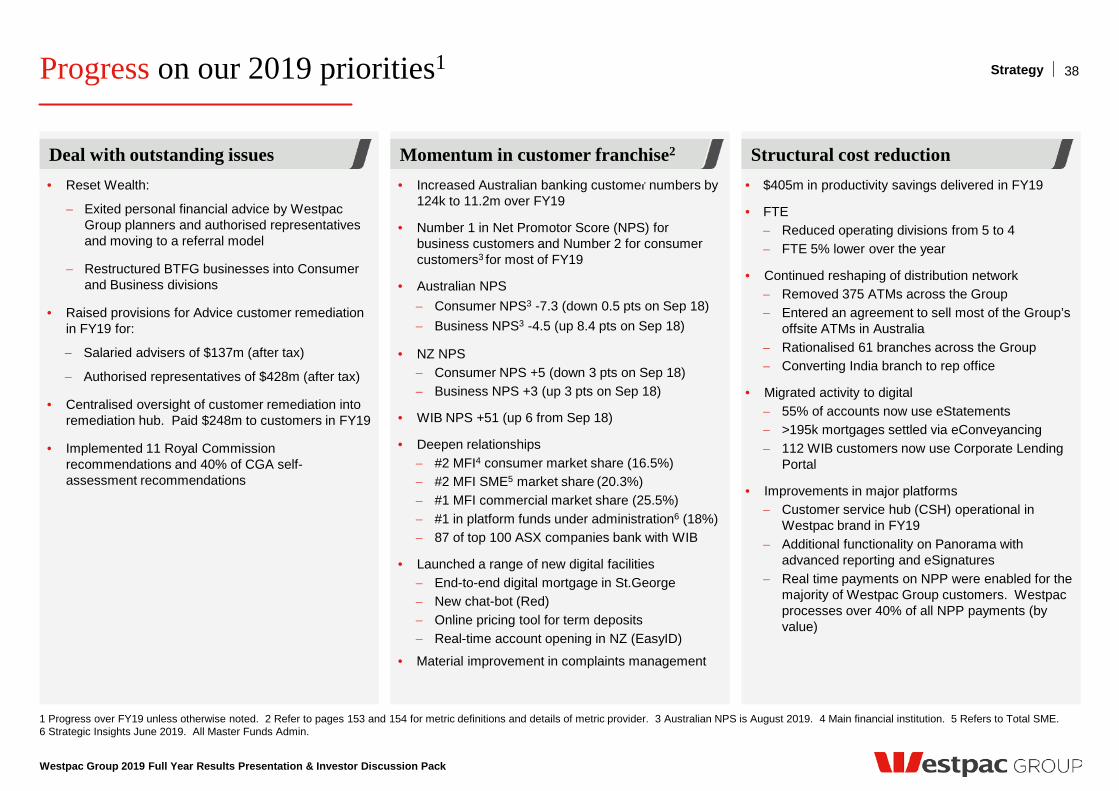
• Reset Wealth:
− Exited personal financial advice by Westpac Group planners and authorised representatives and moving to a referral model
− Restructured BTFG businesses into Consumer and Business divisions
• Raised provisions for Advice customer remediation in FY19 for:
− Salaried advisers of $137m (after tax)
− Authorised representatives of $428m (after tax)
• Centralised oversight of customer remediation into remediation hub. Paid $248m to customers in FY19
• Implemented 11 Royal Commission recommendations and 40% of CGA self-assessment recommendations
Deal with outstanding issues
38
• Increased Australian banking customer numbers by 124k to 11.2m over FY19
• Number 1 in Net Promotor Score (NPS) for business customers and Number 2 for consumer customers3 for most of FY19
• Australian NPS − Consumer NPS3 -7.3 (down 0.5 pts on Sep 18) − Business NPS3 -4.5 (up 8.4 pts on Sep 18)
• NZ NPS − Consumer NPS +5 (down 3 pts on Sep 18) − Business NPS +3 (up 3 pts on Sep 18)
• WIB NPS +51 (up 6 from Sep 18)
• Deepen relationships − #2 MFI4 consumer market share (16.5%) − #2 MFI SME5 market share (20.3%) − #1 MFI commercial market share (25.5%) − #1 in platform funds under administration6 (18%) − 87 of top 100 ASX companies bank with WIB
• Launched a range of new digital facilities − End-to-end digital mortgage in St.George − New chat-bot (Red) − Online pricing tool for term deposits − Real-time account opening in NZ (EasyID)
• Material improvement in complaints management
Momentum in customer franchise2
• $405m in productivity savings delivered in FY19
• FTE − Reduced operating divisions from 5 to 4 − FTE 5% lower over the year
• Continued reshaping of distribution network − Removed 375 ATMs across the Group − Entered an agreement to sell most of the Group’s
offsite ATMs in Australia − Rationalised 61 branches across the Group − Converting India branch to rep office
• Migrated activity to digital − 55% of accounts now use eStatements − >195k mortgages settled via eConveyancing − 112 WIB customers now use Corporate Lending
Portal
• Improvements in major platforms − Customer service hub (CSH) operational in
Westpac brand in FY19 − Additional functionality on Panorama with
advanced reporting and eSignatures − Real time payments on NPP were enabled for the
majority of Westpac Group customers. Westpac processes over 40% of all NPP payments (by value)
Structural cost reduction
Strategy
What sets Westpac apart
Westpac Group 2019 Full Year Results Presentation & Investor Discussion Pack
Strong strategic position – consistent strategy
Sustainability leadership
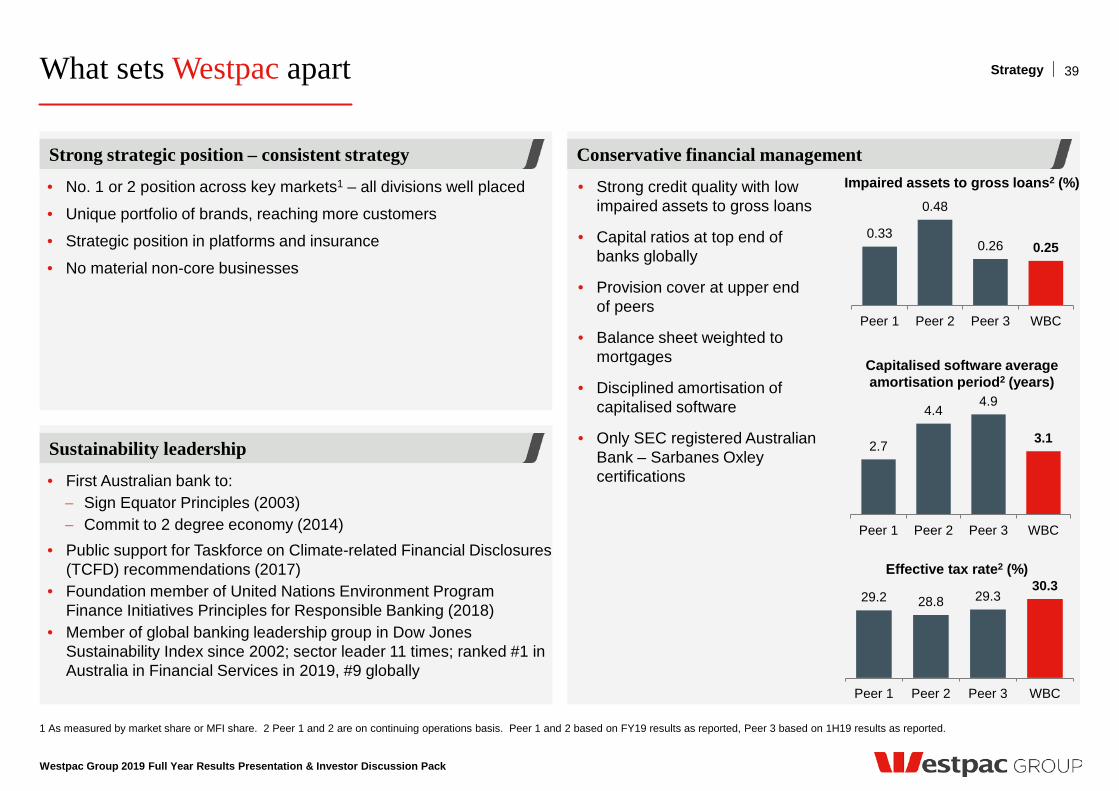
1 As measured by market share or MFI share. 2 Peer 1 and 2 are on continuing operations basis. Peer 1 and 2 based on FY19 results as reported, Peer 3 based on 1H19 results as reported.
• Strong credit quality with low impaired assets to gross loans
• Capital ratios at top end of banks globally
• Provision cover at upper end of peers
• Balance sheet weighted to mortgages
• Disciplined amortisation of capitalised software
• Only SEC registered Australian Bank – Sarbanes Oxley certifications
• First Australian bank to: − Sign Equator Principles (2003) − Commit to 2 degree economy (2014)
• Public support for Taskforce on Climate-related Financial Disclosures (TCFD) recommendations (2017)
• Foundation member of United Nations Environment Program Finance Initiatives Principles for Responsible Banking (2018)
• Member of global banking leadership group in Dow Jones Sustainability Index since 2002; sector leader 11 times; ranked #1 in Australia in Financial Services in 2019, #9 globally
Conservative financial management
39 Strategy
• No. 1 or 2 position across key markets1 – all divisions well placed
• Unique portfolio of brands, reaching more customers
• Strategic position in platforms and insurance
• No material non-core businesses
0.33
0.48
0.26 0.25
Peer 1 Peer 2 Peer 3 WBC
29.2 28.8 29.3 30.3
Peer 1 Peer 2 Peer 3 WBC
2.7
4.4 4.9
3.1
Peer 1 Peer 2 Peer 3 WBC
Impaired assets to gross loans2 (%)
Capitalised software average amortisation period2 (years)
Effective tax rate2 (%)

Overview
Notable items in FY19 and FY18
Westpac Group 2019 Full Year Results Presentation & Investor Discussion Pack
1 Group Businesses.
41 Results
Remediation
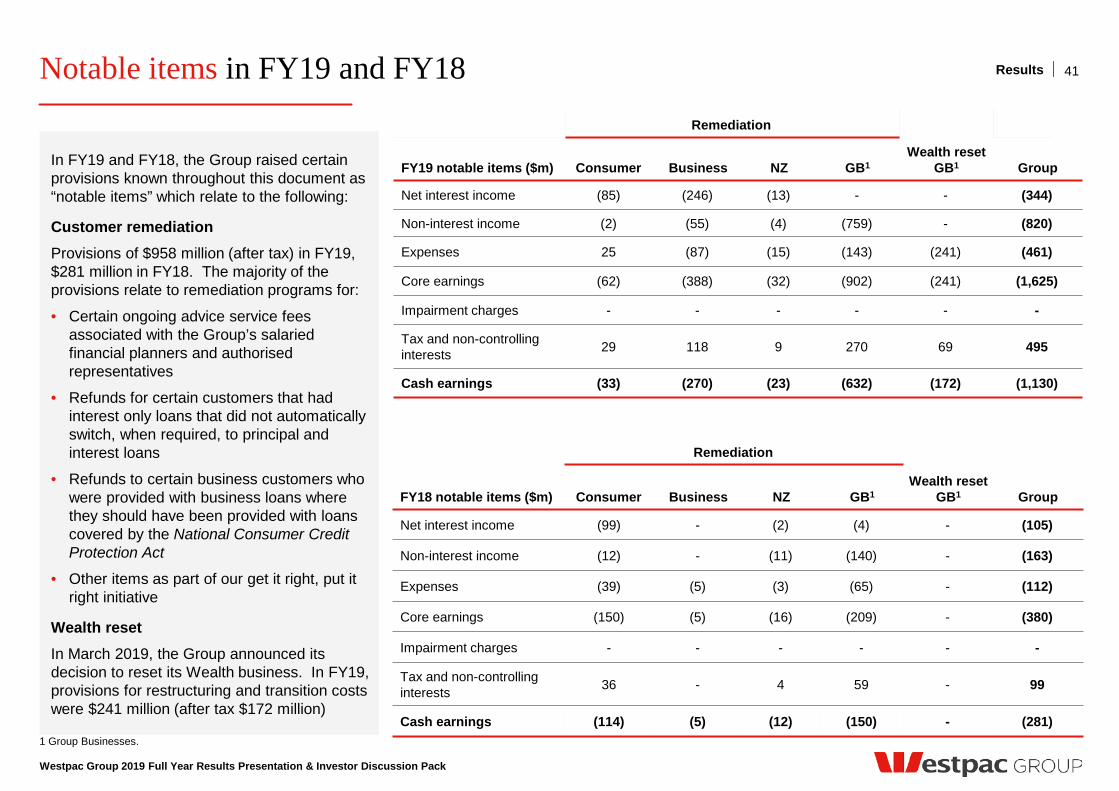
Wealth reset GB1 FY19 notable items ($m) Consumer Business NZ GB1 Group
Net interest income (85) (246) (13) - - (344)
Non-interest income (2) (55) (4) (759) - (820)
Expenses 25 (87) (15) (143) (241) (461)
Core earnings (62) (388) (32) (902) (241) (1,625)
Impairment charges - - - - - -
Tax and non-controlling interests 29 118 9 270 69 495
Cash earnings (33) (270) (23) (632) (172) (1,130)
Remediation
FY18 notable items ($m) Consumer Business NZ GB1 Wealth reset
GB1 Group
Net interest income (99) - (2) (4) - (105)
Non-interest income (12) - (11) (140) - (163)
Expenses (39) (5) (3) (65) - (112)
Core earnings (150) (5) (16) (209) - (380)
Impairment charges - - - - - -
Tax and non-controlling interests 36 - 4 59 - 99
Cash earnings (114) (5) (12) (150) - (281)
In FY19 and FY18, the Group raised certain provisions known throughout this document as “notable items” which relate to the following:
Customer remediation
Provisions of $958 million (after tax) in FY19, $281 million in FY18. The majority of the provisions relate to remediation programs for:
• Certain ongoing advice service fees associated with the Group’s salaried financial planners and authorised representatives
• Refunds for certain customers that had interest only loans that did not automatically switch, when required, to principal and interest loans
• Refunds to certain business customers who were provided with business loans where they should have been provided with loans covered by the National Consumer Credit Protection Act
• Other items as part of our get it right, put it right initiative
Wealth reset
In March 2019, the Group announced its decision to reset its Wealth business. In FY19, provisions for restructuring and transition costs were $241 million (after tax $172 million)
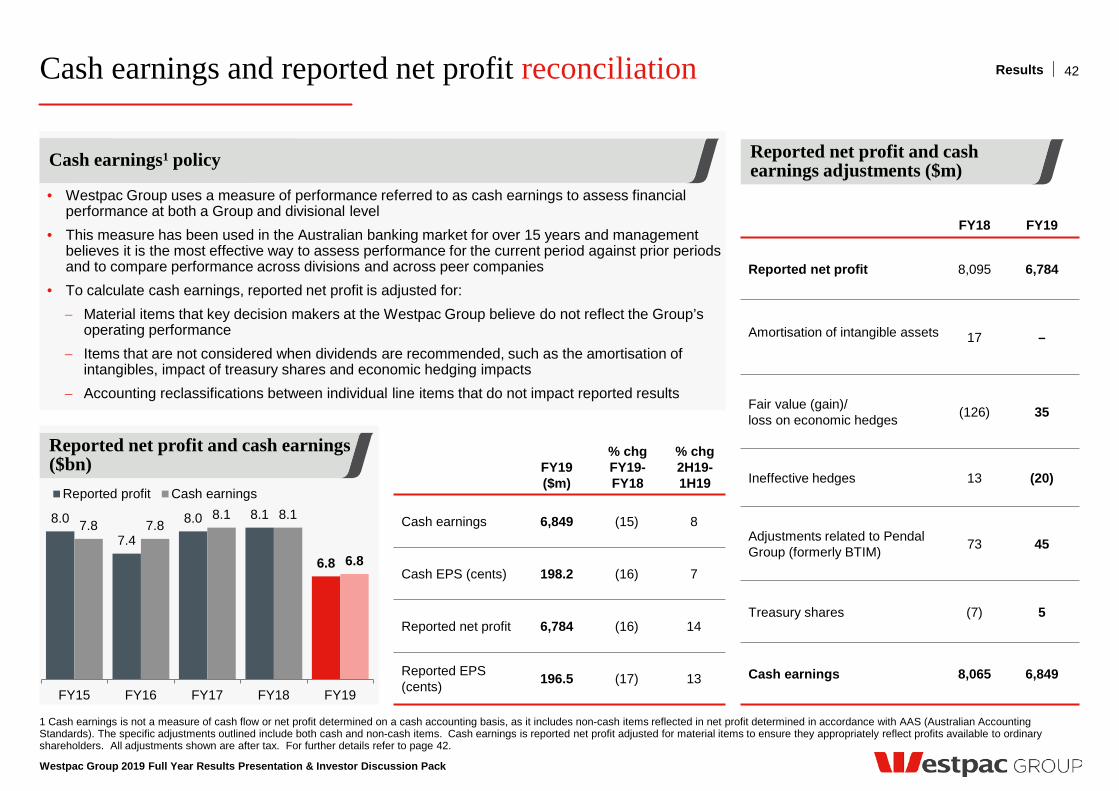
Cash earnings and reported net profit reconciliation
Westpac Group 2019 Full Year Results Presentation & Investor Discussion Pack
1 Cash earnings is not a measure of cash flow or net profit determined on a cash accounting basis, as it includes non-cash items reflected in net profit determined in accordance with AAS (Australian Accounting Standards). The specific adjustments outlined include both cash and non-cash items. Cash earnings is reported net profit adjusted for material items to ensure they appropriately reflect profits available to ordinary shareholders. All adjustments shown are after tax. For further details refer to page 42.
42 Results
Reported net profit and cash earnings adjustments ($m)
FY18 FY19
Reported net profit 8,095 6,784
Amortisation of intangible assets 17 –
Fair value (gain)/ loss on economic hedges (126) 35
Ineffective hedges 13 (20)
Adjustments related to Pendal Group (formerly BTIM) 73 45
Treasury shares (7) 5
Cash earnings 8,065 6,849
• Westpac Group uses a measure of performance referred to as cash earnings to assess financial performance at both a Group and divisional level
• This measure has been used in the Australian banking market for over 15 years and management believes it is the most effective way to assess performance for the current period against prior periods and to compare performance across divisions and across peer companies
• To calculate cash earnings, reported net profit is adjusted for: − Material items that key decision makers at the Westpac Group believe do not reflect the Group’s
operating performance − Items that are not considered when dividends are recommended, such as the amortisation of
intangibles, impact of treasury shares and economic hedging impacts − Accounting reclassifications between individual line items that do not impact reported results
Reported net profit and cash earnings ($bn) FY19
($m)
% chg FY19-FY18
% chg 2H19-1H19
Cash earnings 6,849 (15) 8
Cash EPS (cents) 198.2 (16) 7
Reported net profit 6,784 (16) 14
Reported EPS (cents) 196.5 (17) 13
Cash earnings1 policy
8.0
7.4
8.0 8.1
6.8
7.8 7.8 8.1 8.1
6.8
FY15 FY16 FY17 FY18 FY19
Reported profit Cash earnings
Westpac Group 2019 Full Year Results Presentation & Investor Discussion Pack
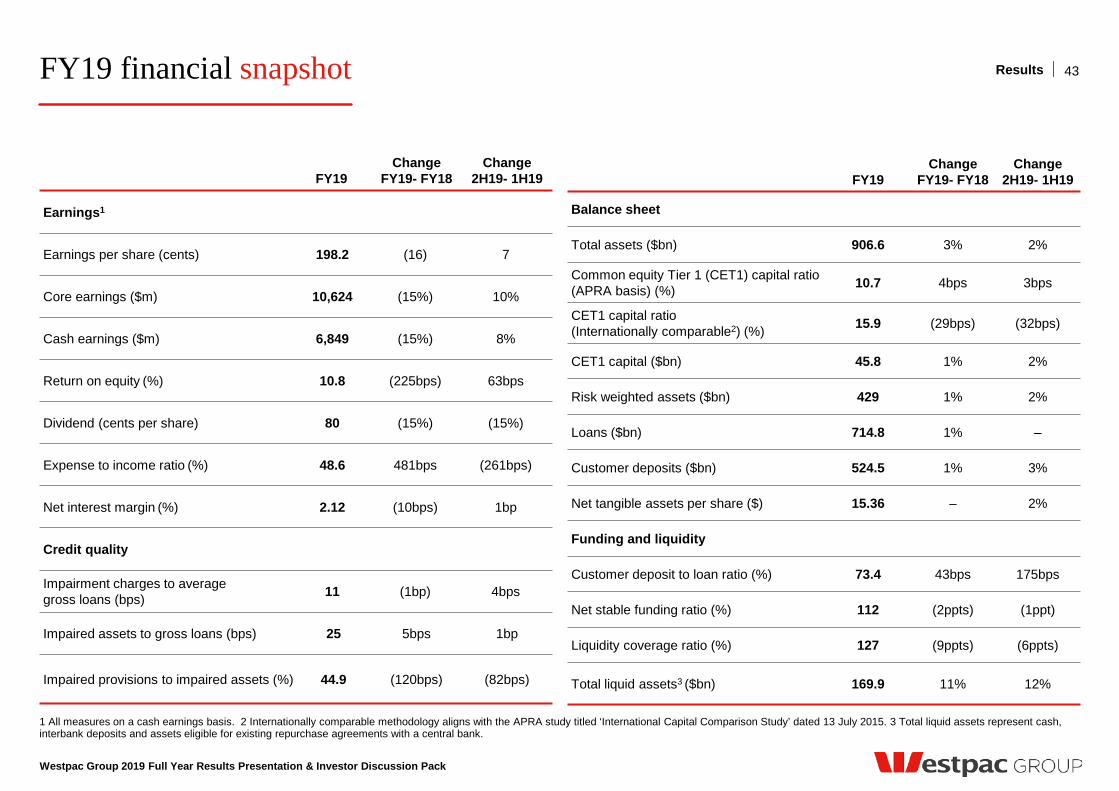
FY19 financial snapshot
1 All measures on a cash earnings basis. 2 Internationally comparable methodology aligns with the APRA study titled ‘International Capital Comparison Study’ dated 13 July 2015. 3 Total liquid assets represent cash, interbank deposits and assets eligible for existing repurchase agreements with a central bank.
FY19 Change
FY19- FY18 Change
2H19- 1H19
Earnings1
Earnings per share (cents) 198.2 (16) 7
Core earnings ($m) 10,624 (15%) 10%
Cash earnings ($m) 6,849 (15%) 8%
Return on equity (%) 10.8 (225bps) 63bps
Dividend (cents per share) 80 (15%) (15%)
Expense to income ratio (%) 48.6 481bps (261bps)
Net interest margin (%) 2.12 (10bps) 1bp
Credit quality
Impairment charges to average gross loans (bps) 11 (1bp) 4bps
Impaired assets to gross loans (bps) 25 5bps 1bp
Impaired provisions to impaired assets (%) 44.9 (120bps) (82bps)
43 Results
FY19 Change
FY19- FY18 Change
2H19- 1H19
Balance sheet
Total assets ($bn) 906.6 3% 2%
Common equity Tier 1 (CET1) capital ratio (APRA basis) (%) 10.7 4bps 3bps
CET1 capital ratio (Internationally comparable2) (%) 15.9 (29bps) (32bps)
CET1 capital ($bn) 45.8 1% 2%
Risk weighted assets ($bn) 429 1% 2%
Loans ($bn) 714.8 1% –
Customer deposits ($bn) 524.5 1% 3%
Net tangible assets per share ($) 15.36 – 2%
Funding and liquidity
Customer deposit to loan ratio (%) 73.4 43bps 175bps
Net stable funding ratio (%) 112 (2ppts) (1ppt)
Liquidity coverage ratio (%) 127 (9ppts) (6ppts)
Total liquid assets3 ($bn) 169.9 11% 12%
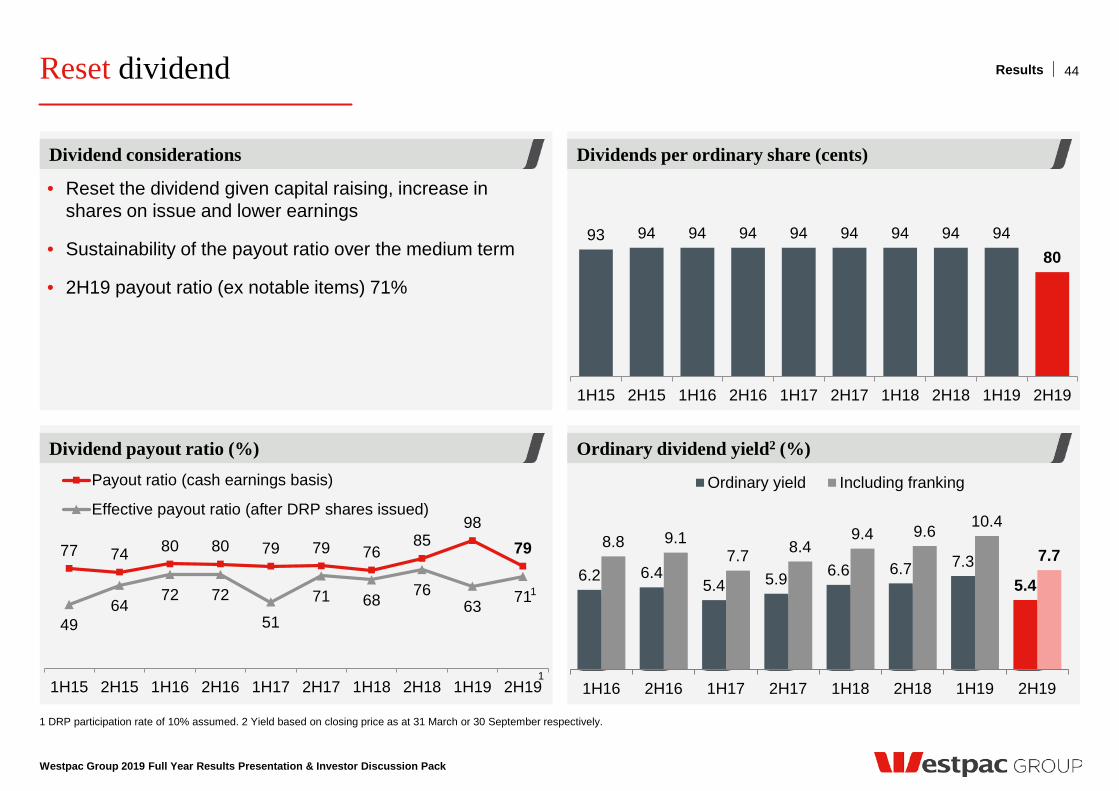
Reset dividend
Westpac Group 2019 Full Year Results Presentation & Investor Discussion Pack
Dividends per ordinary share (cents)
Ordinary dividend yield2 (%)
Dividend considerations
Dividend payout ratio (%)
1 DRP participation rate of 10% assumed. 2 Yield based on closing price as at 31 March or 30 September respectively.
• Reset the dividend given capital raising, increase in shares on issue and lower earnings
• Sustainability of the payout ratio over the medium term
• 2H19 payout ratio (ex notable items) 71%
44
93 94 94 94 94 94 94 94 94 80
1H15 2H15 1H16 2H16 1H17 2H17 1H18 2H18 1H19 2H19
77 74 80 80 79 79 76 85
98 79
49 64
72 72
51 71 68 76
63 71
1H15 2H15 1H16 2H16 1H17 2H17 1H18 2H18 1H19 2H19
Payout ratio (cash earnings basis)
Effective payout ratio (after DRP shares issued)
6.2 6.4 5.4 5.9 6.6 6.7 7.3
5.4
8.8 9.1 7.7 8.4
9.4 9.6 10.4
7.7
1H16 2H16 1H17 2H17 1H18 2H18 1H19 2H19
Ordinary yield Including franking
1
Results
1
3,553 3,296
753 4,049 95 56 3,930
(106) (36) (128) (377)
1H19 Add backnotableitems
1H19 ex-notableitems
Net interestincome
Non-interestincome
Expenses Impairmentcharges
Tax & NCI 2H19 ex-notableitems
Notableitems
2H19
8,065 281 8,346 5 16 18 213 7,979
6,849
(619) (1,130)
FY18 Add backnotableitems
FY18 ex-notableitems
Net interestincome
Non-interestincome
Expenses Impairmentcharges
Tax & NCI FY19 ex-notableitems
Notableitems
FY19
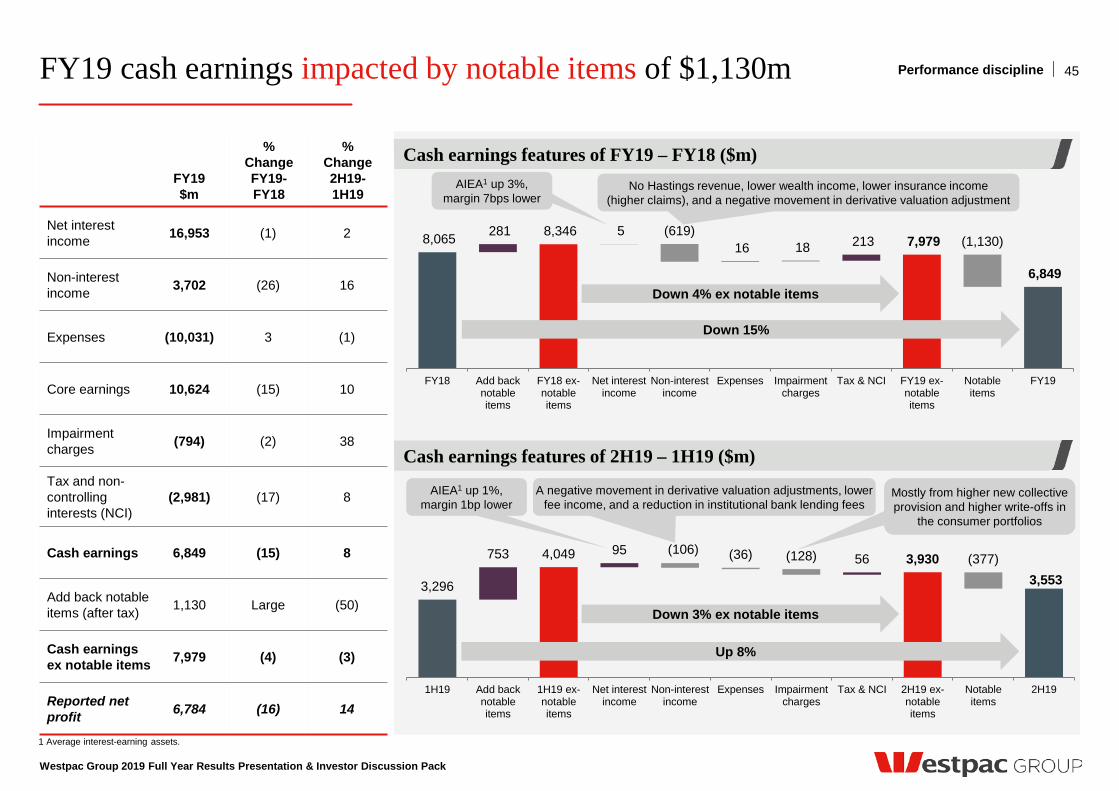
FY19 cash earnings impacted by notable items of $1,130m
Westpac Group 2019 Full Year Results Presentation & Investor Discussion Pack
1 Average interest-earning assets.
Cash earnings features of FY19 – FY18 ($m)
Cash earnings features of 2H19 – 1H19 ($m)
45 Performance discipline
FY19 $m
% Change FY19- FY18
% Change 2H19- 1H19
Net interest income 16,953 (1) 2
Non-interest income 3,702 (26) 16
Expenses (10,031) 3 (1)
Core earnings 10,624 (15) 10
Impairment charges (794) (2) 38
Tax and non- controlling interests (NCI)
(2,981) (17) 8
Cash earnings 6,849 (15) 8
Add back notable items (after tax) 1,130 Large (50)
Cash earnings ex notable items 7,979 (4) (3)
Reported net profit 6,784 (16) 14
Down 15%
Up 8%
AIEA1 up 1%, margin 1bp lower
Down 4% ex notable items
Down 3% ex notable items
AIEA1 up 3%, margin 7bps lower
No Hastings revenue, lower wealth income, lower insurance income (higher claims), and a negative movement in derivative valuation adjustment
A negative movement in derivative valuation adjustments, lower fee income, and a reduction in institutional bank lending fees
Mostly from higher new collective provision and higher write-offs in
the consumer portfolios
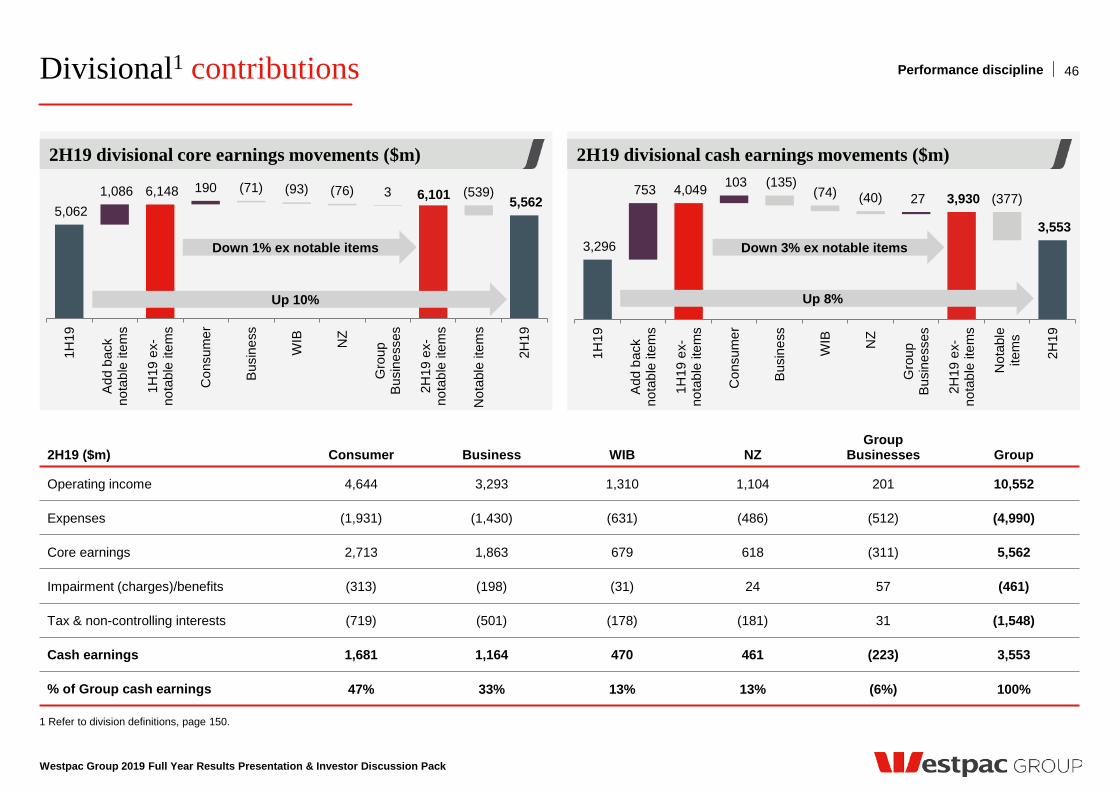
Divisional1 contributions
Westpac Group 2019 Full Year Results Presentation & Investor Discussion Pack
1 Refer to division definitions, page 150.
46 Performance discipline
2H19 ($m) Consumer Business WIB NZ Group
Businesses Group
Operating income 4,644 3,293 1,310 1,104 201 10,552
Expenses (1,931) (1,430) (631) (486) (512) (4,990)
Core earnings 2,713 1,863 679 618 (311) 5,562
Impairment (charges)/benefits (313) (198) (31) 24 57 (461)
Tax & non-controlling interests (719) (501) (178) (181) 31 (1,548)
Cash earnings 1,681 1,164 470 461 (223) 3,553
% of Group cash earnings 47% 33% 13% 13% (6%) 100%
2H19 divisional core earnings movements ($m) 2H19 divisional cash earnings movements ($m)
3,296
753 4,049 103 27 3,930
3,553
(135) (74) (40) (377)
1H19
Add
bac
kno
tabl
e ite
ms
1H19
ex-
nota
ble
item
s
Con
sum
er
Bus
ines
s
WIB NZ
Gro
upB
usin
esse
s
2H19
ex-
nota
ble
item
s
Not
able
item
s
2H19
Up 8%
Down 3% ex notable items
6,101 5,062
1,086 6,148 190 3 5,562
(71) (93) (76) (539)
1H19
Add
bac
kno
tabl
e ite
ms
1H19
ex-
nota
ble
item
s
Con
sum
er
Bus
ines
s
WIB NZ
Gro
upB
usin
esse
s
2H19
ex-
nota
ble
item
s
Not
able
item
s
2H19
Down 1% ex notable items
Up 10%
44 63 63
5
8 8
1
1 1
10
12 12
4
4 5 20
7 7 16 5 5
Sep-08 Sep-18 Sep-19
Wholesale Onshore <1yr
Wholesale Offshore <1yr
Wholesale Onshore >1yr
Wholesale Offshore >1yr
Securitisation
Equity
Customer deposits
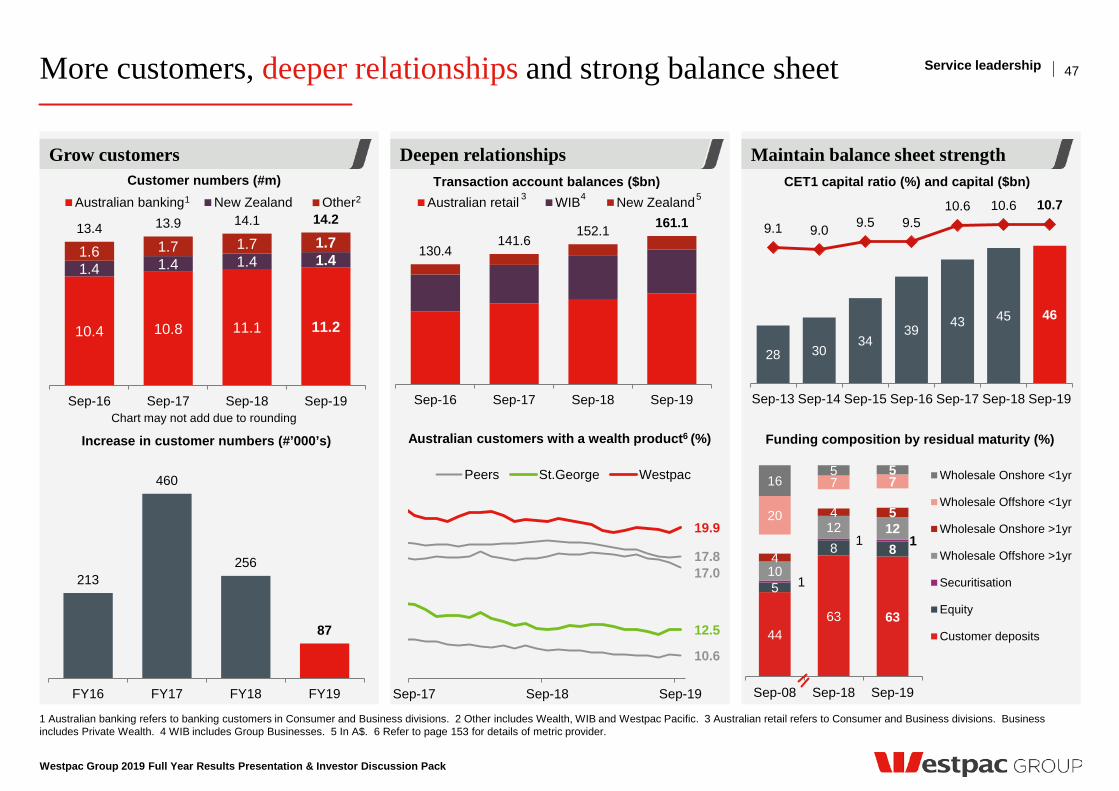
More customers, deeper relationships and strong balance sheet
Westpac Group 2019 Full Year Results Presentation & Investor Discussion Pack
1 Australian banking refers to banking customers in Consumer and Business divisions. 2 Other includes Wealth, WIB and Westpac Pacific. 3 Australian retail refers to Consumer and Business divisions. Business includes Private Wealth. 4 WIB includes Group Businesses. 5 In A$. 6 Refer to page 153 for details of metric provider.
Grow customers
47
Deepen relationships Maintain balance sheet strength
28 30 34
39 43 45 46
9.1 9.0 9.5 9.5 10.6 10.6 10.7
Sep-13 Sep-14 Sep-15 Sep-16 Sep-17 Sep-18 Sep-19
CET1 capital ratio (%) and capital ($bn)
Service leadership
130.4 141.6
152.1 161.1
Sep-16 Sep-17 Sep-18 Sep-19
Transaction account balances ($bn) Australian retail WIB New Zealand
Funding composition by residual maturity (%) Australian customers with a wealth product6 (%)
1 3 4 5 2
17.0 17.8
10.6
12.5
19.9
Sep-17 Sep-18 Sep-19
Peers St.George Westpac
Chart may not add due to rounding
213
460
256
87
FY16 FY17 FY18 FY19
Increase in customer numbers (#’000’s)
10.4 10.8 11.1 11.2
1.4 1.4 1.4 1.4 1.6 1.7 1.7 1.7 13.4 13.9 14.1 14.2
Sep-16 Sep-17 Sep-18 Sep-19
Customer numbers (#m) Australian banking New Zealand Other
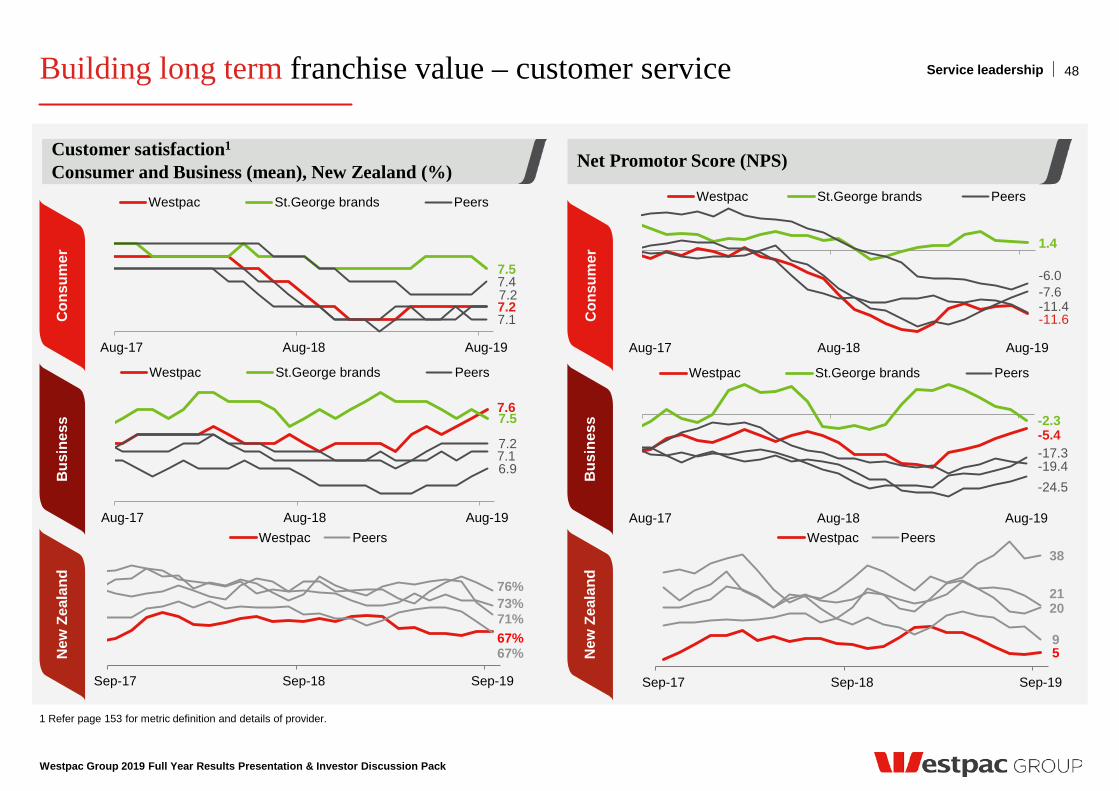
Building long term franchise value – customer service
Westpac Group 2019 Full Year Results Presentation & Investor Discussion Pack
1 Refer page 153 for metric definition and details of provider.
48
Net Promotor Score (NPS) Customer satisfaction1
Consumer and Business (mean), New Zealand (%)
Service leadership N
ew Z
eala
nd
Bus
ines
s C
onsu
mer
New
Zea
land
B
usin
ess
Con
sum
er
67%
76%
67%
73% 71%
Sep-17 Sep-18 Sep-19
Westpac Peers
5
38
9
20 21
Sep-17 Sep-18 Sep-19
Westpac Peers
7.6 7.5
6.9 7.1 7.2
Aug-17 Aug-18 Aug-19
Westpac St.George brands Peers
7.2
7.5
7.1
7.2 7.4
Aug-17 Aug-18 Aug-19
Westpac St.George brands Peers
-11.6
1.4
-11.4 -7.6 -6.0
Aug-17 Aug-18 Aug-19
Westpac St.George brands Peers
-5.4 -2.3
-24.5
-17.3 -19.4
Aug-17 Aug-18 Aug-19
Westpac St.George brands Peers
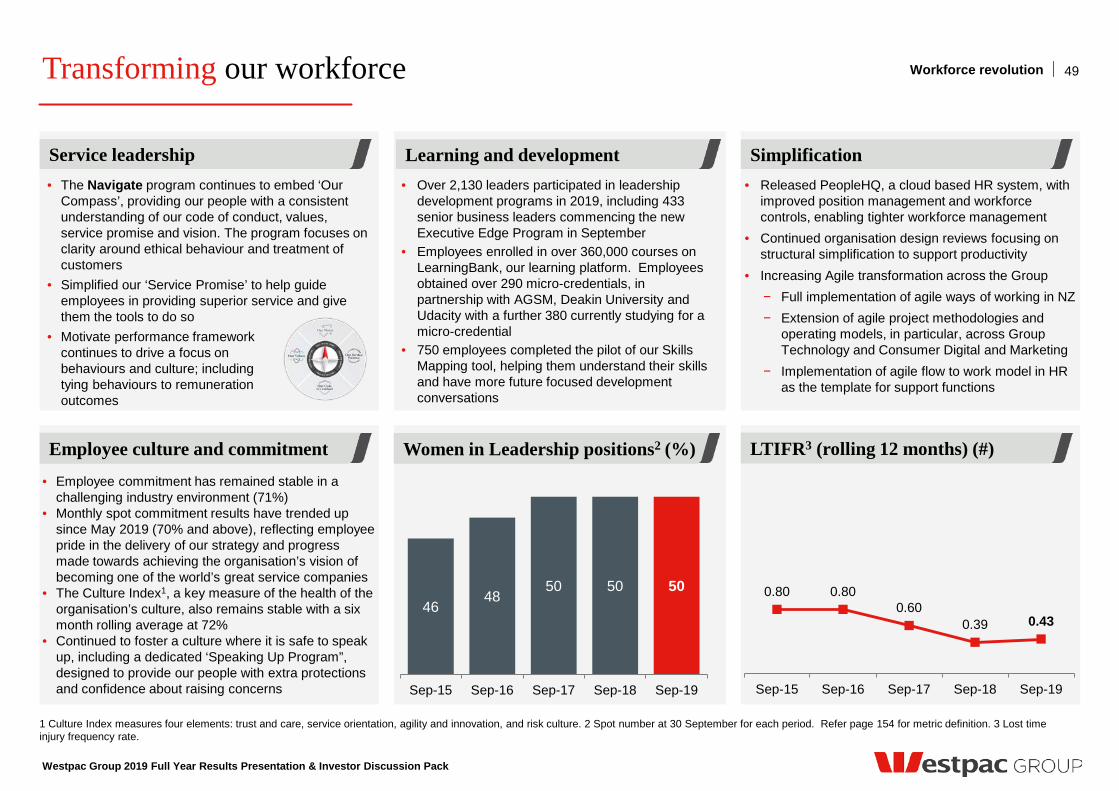
• Over 2,130 leaders participated in leadership development programs in 2019, including 433 senior business leaders commencing the new Executive Edge Program in September
• Employees enrolled in over 360,000 courses on LearningBank, our learning platform. Employees obtained over 290 micro-credentials, in partnership with AGSM, Deakin University and Udacity with a further 380 currently studying for a micro-credential
• 750 employees completed the pilot of our Skills Mapping tool, helping them understand their skills and have more future focused development conversations
Westpac Group 2019 Full Year Results Presentation & Investor Discussion Pack
49 Transforming our workforce
Women in Leadership positions2 (%) LTIFR3 (rolling 12 months) (#) Employee culture and commitment
Learning and development Simplification Service leadership
46 48
50 50 50
Sep-15 Sep-16 Sep-17 Sep-18 Sep-19
0.80 0.80 0.60
0.39 0.43
Sep-15 Sep-16 Sep-17 Sep-18 Sep-19
• Employee commitment has remained stable in a challenging industry environment (71%)
• Monthly spot commitment results have trended up since May 2019 (70% and above), reflecting employee pride in the delivery of our strategy and progress made towards achieving the organisation’s vision of becoming one of the world’s great service companies
• The Culture Index1, a key measure of the health of the organisation’s culture, also remains stable with a six month rolling average at 72%
• Continued to foster a culture where it is safe to speak up, including a dedicated ‘Speaking Up Program”, designed to provide our people with extra protections and confidence about raising concerns
• Released PeopleHQ, a cloud based HR system, with improved position management and workforce controls, enabling tighter workforce management
• Continued organisation design reviews focusing on structural simplification to support productivity
• Increasing Agile transformation across the Group − Full implementation of agile ways of working in NZ − Extension of agile project methodologies and
operating models, in particular, across Group Technology and Consumer Digital and Marketing
− Implementation of agile flow to work model in HR as the template for support functions
• The Navigate program continues to embed ‘Our Compass’, providing our people with a consistent understanding of our code of conduct, values, service promise and vision. The program focuses on clarity around ethical behaviour and treatment of customers
• Simplified our ‘Service Promise’ to help guide employees in providing superior service and give them the tools to do so
• Motivate performance framework continues to drive a focus on behaviours and culture; including tying behaviours to remuneration outcomes
1 Culture Index measures four elements: trust and care, service orientation, agility and innovation, and risk culture. 2 Spot number at 30 September for each period. Refer page 154 for metric definition. 3 Lost time injury frequency rate.
Workforce revolution
Four pillars of our digital strategy
Westpac Group 2019 Full Year Results Presentation & Investor Discussion Pack
50
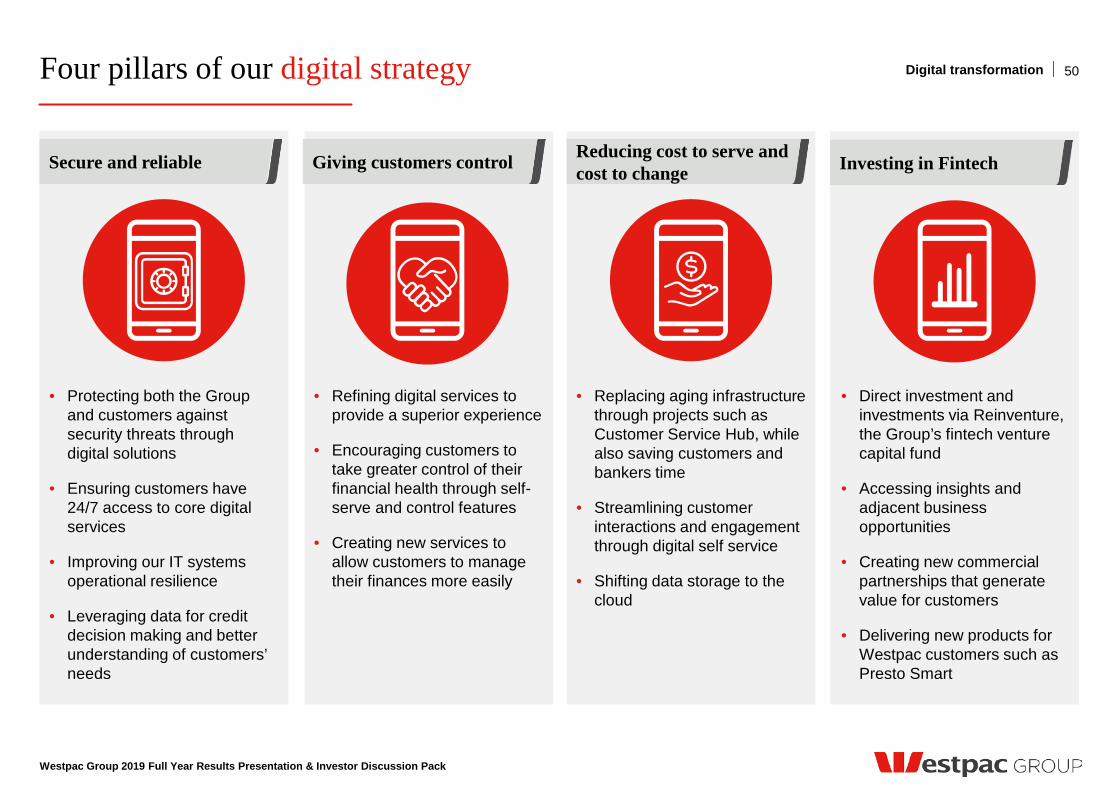
3 Reducing cost to serve and cost to change Secure and reliable Giving customers control Investing in Fintech
• Protecting both the Group and customers against security threats through digital solutions
• Ensuring customers have 24/7 access to core digital services
• Improving our IT systems operational resilience
• Leveraging data for credit decision making and better understanding of customers’ needs
• Refining digital services to provide a superior experience
• Encouraging customers to take greater control of their financial health through self-serve and control features
• Creating new services to allow customers to manage their finances more easily
• Replacing aging infrastructure through projects such as Customer Service Hub, while also saving customers and bankers time
• Streamlining customer interactions and engagement through digital self service
• Shifting data storage to the cloud
• Direct investment and investments via Reinventure, the Group’s fintech venture capital fund
• Accessing insights and adjacent business opportunities
• Creating new commercial partnerships that generate value for customers
• Delivering new products for Westpac customers such as Presto Smart
Digital transformation
Investment in stability and fraud protection
Westpac Group 2019 Full Year Results Presentation & Investor Discussion Pack
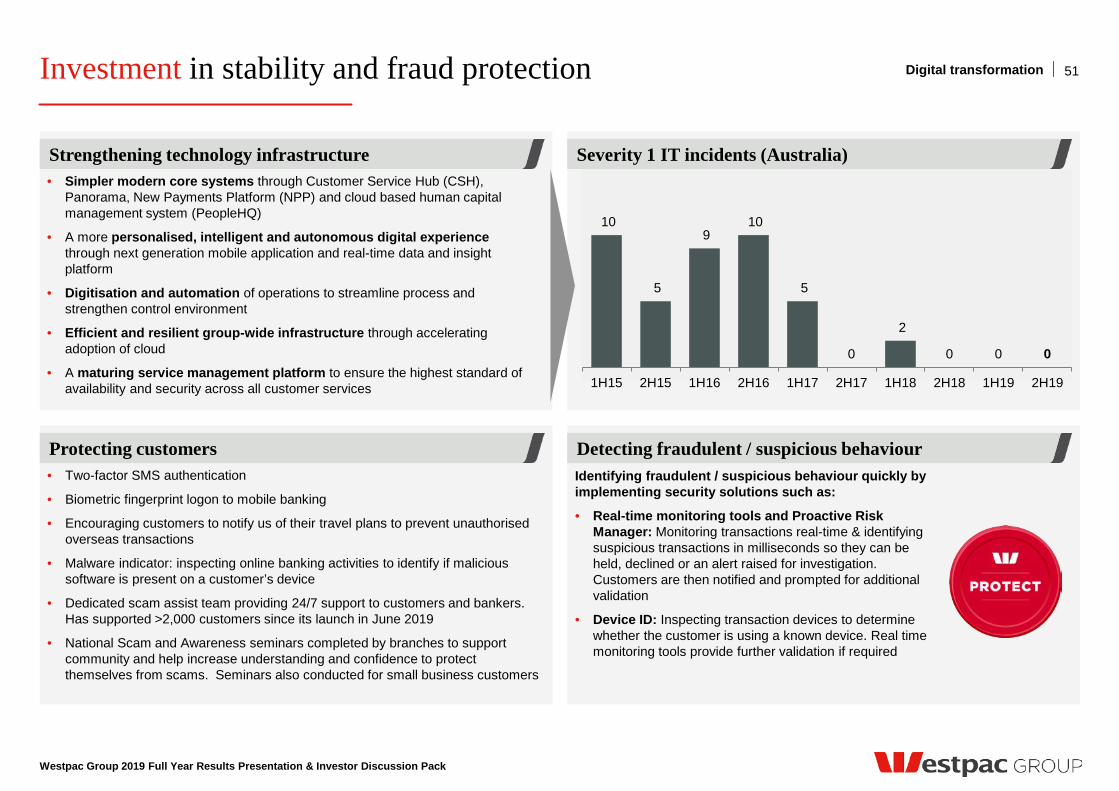
Severity 1 IT incidents (Australia) Strengthening technology infrastructure
Protecting customers
10
5
9 10
5
0
2
0 0 0
1H15 2H15 1H16 2H16 1H17 2H17 1H18 2H18 1H19 2H19
• Two-factor SMS authentication
• Biometric fingerprint logon to mobile banking
• Encouraging customers to notify us of their travel plans to prevent unauthorised overseas transactions
• Malware indicator: inspecting online banking activities to identify if malicious software is present on a customer’s device
• Dedicated scam assist team providing 24/7 support to customers and bankers. Has supported >2,000 customers since its launch in June 2019
• National Scam and Awareness seminars completed by branches to support community and help increase understanding and confidence to protect themselves from scams. Seminars also conducted for small business customers
51 Digital transformation
Identifying fraudulent / suspicious behaviour quickly by implementing security solutions such as:
• Real-time monitoring tools and Proactive Risk Manager: Monitoring transactions real-time & identifying suspicious transactions in milliseconds so they can be held, declined or an alert raised for investigation. Customers are then notified and prompted for additional validation
• Device ID: Inspecting transaction devices to determine whether the customer is using a known device. Real time monitoring tools provide further validation if required
• Simpler modern core systems through Customer Service Hub (CSH), Panorama, New Payments Platform (NPP) and cloud based human capital management system (PeopleHQ)
• A more personalised, intelligent and autonomous digital experience through next generation mobile application and real-time data and insight platform
• Digitisation and automation of operations to streamline process and strengthen control environment
• Efficient and resilient group-wide infrastructure through accelerating adoption of cloud
• A maturing service management platform to ensure the highest standard of availability and security across all customer services
Detecting fraudulent / suspicious behaviour
Giving customers more control
Westpac Group 2019 Full Year Results Presentation & Investor Discussion Pack
1 eWallet include transactions via Android Pay, Fitbit Pay, Garmin Pay and Samsung Pay.
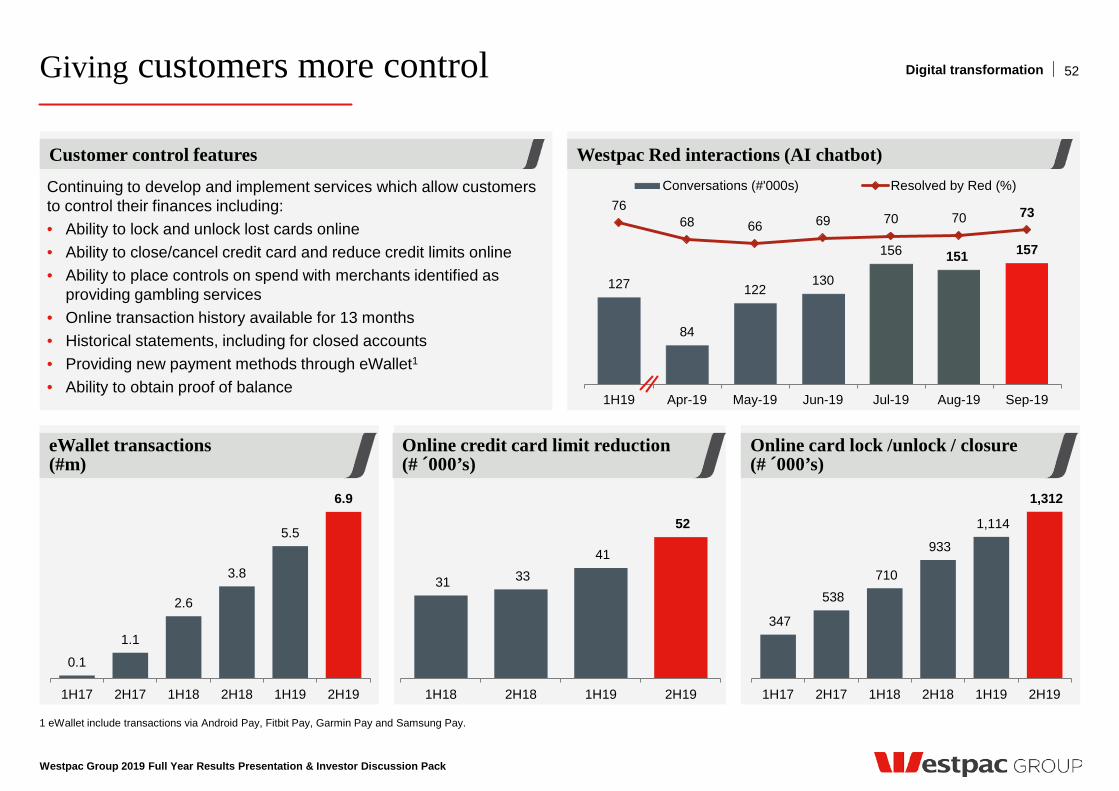
Continuing to develop and implement services which allow customers to control their finances including: • Ability to lock and unlock lost cards online • Ability to close/cancel credit card and reduce credit limits online • Ability to place controls on spend with merchants identified as
providing gambling services • Online transaction history available for 13 months • Historical statements, including for closed accounts • Providing new payment methods through eWallet1
• Ability to obtain proof of balance
Westpac Red interactions (AI chatbot) Customer control features
52 Digital transformation
2 eWallet transactions (#m)
Online credit card limit reduction (# ´000’s)
Online card lock /unlock / closure (# ´000’s)
0.1
1.1
2.6
3.8
5.5
6.9
1H17 2H17 1H18 2H18 1H19 2H19
347
538 710
933
1,114
1,312
1H17 2H17 1H18 2H18 1H19 2H19
31 33 41
52
1H18 2H18 1H19 2H19
127
84
122 130
156 151 157
76 68 66 69 70 70 73
1H19 Apr-19 May-19 Jun-19 Jul-19 Aug-19 Sep-19
Conversations (#'000s) Resolved by Red (%)
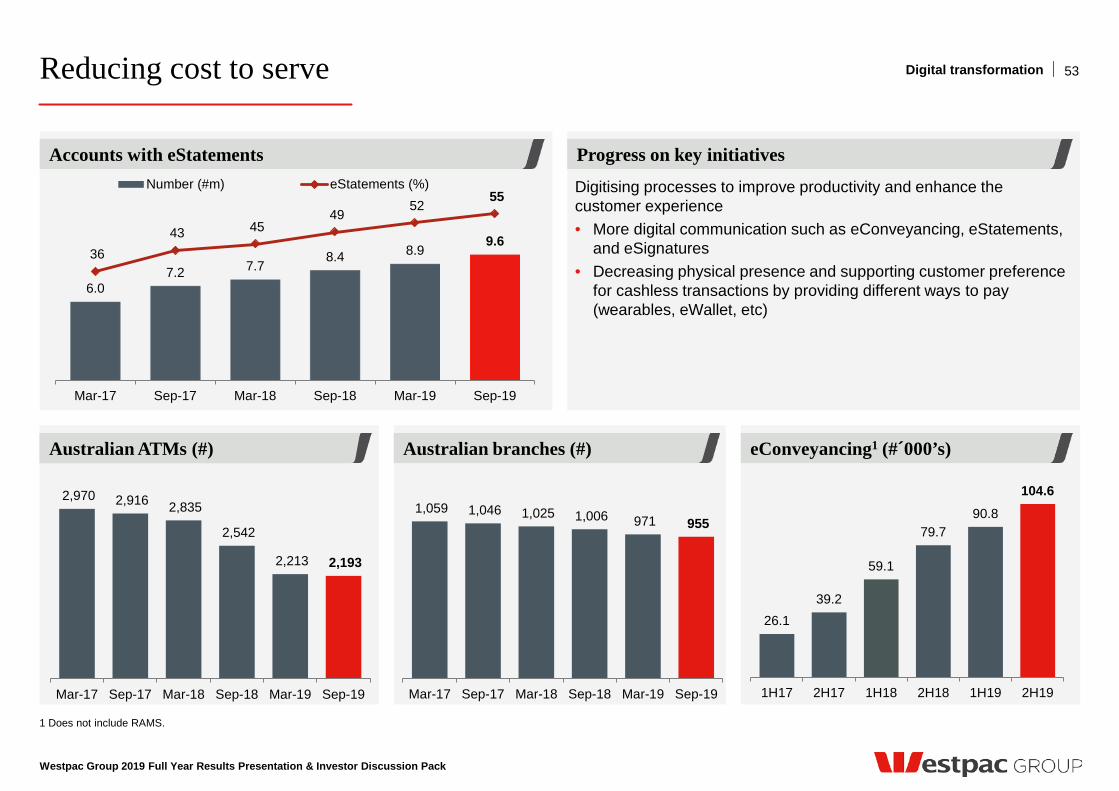
Australian branches (#) eConveyancing1 (#´000’s)
Reducing cost to serve
Westpac Group 2019 Full Year Results Presentation & Investor Discussion Pack
1 Does not include RAMS.
eConveyancing (000’s)
6.0 7.2 7.7
8.4 8.9 9.6
36 43 45
49 52
55
Mar-17 Sep-17 Mar-18 Sep-18 Mar-19 Sep-19
Number (#m) eStatements (%) Digitising processes to improve productivity and enhance the customer experience • More digital communication such as eConveyancing, eStatements,
and eSignatures • Decreasing physical presence and supporting customer preference
for cashless transactions by providing different ways to pay (wearables, eWallet, etc)
Progress on key initiatives Accounts with eStatements
Australian ATMs (#)
53 Digital transformation
2,970 2,916 2,835
2,542
2,213 2,193
Mar-17 Sep-17 Mar-18 Sep-18 Mar-19 Sep-19
26.1 39.2
59.1
79.7 90.8
104.6
1H17 2H17 1H18 2H18 1H19 2H19
1,059 1,046 1,025 1,006 971 955
Mar-17 Sep-17 Mar-18 Sep-18 Mar-19 Sep-19
206 217 222 234 242 257
1H17 2H17 1H18 2H18 1H19 2H19
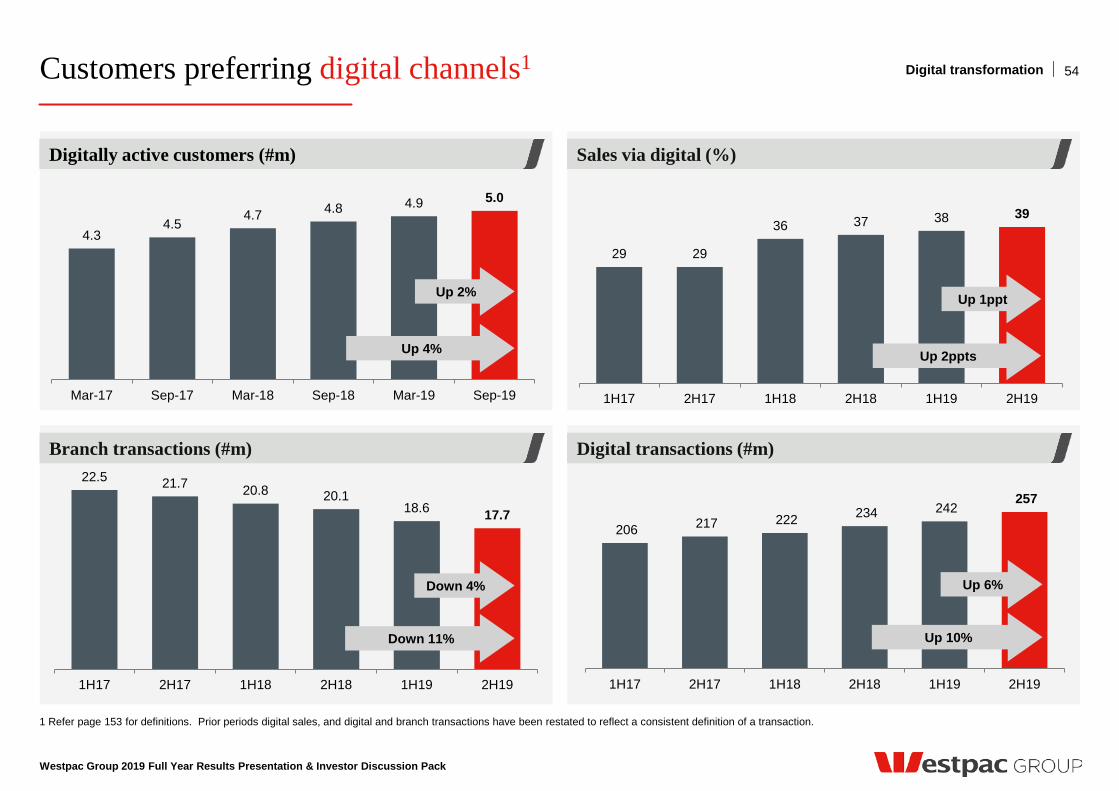
Customers preferring digital channels1
Westpac Group 2019 Full Year Results Presentation & Investor Discussion Pack
1 Refer page 153 for definitions. Prior periods digital sales, and digital and branch transactions have been restated to reflect a consistent definition of a transaction.
54 Digital transformation
Sales via digital (%)
Digital transactions (#m)
Digitally active customers (#m)
Branch transactions (#m)
4.3 4.5
4.7 4.8 4.9 5.0
Mar-17 Sep-17 Mar-18 Sep-18 Mar-19 Sep-19
Up 4%
Up 2%
22.5 21.7 20.8 20.1 18.6 17.7
1H17 2H17 1H18 2H18 1H19 2H19
Down 11%
Down 4%
Up 10%
Up 6%
Digitally active customers (#m)
Digital transactions (#m)
29 29
36 37 38 39
1H17 2H17 1H18 2H18 1H19 2H19
Up 2ppts
Up 1ppt
Settlement
Digital streamlined settlement integrated with land
titles registry
Cap
abili
ties
deliv
ered
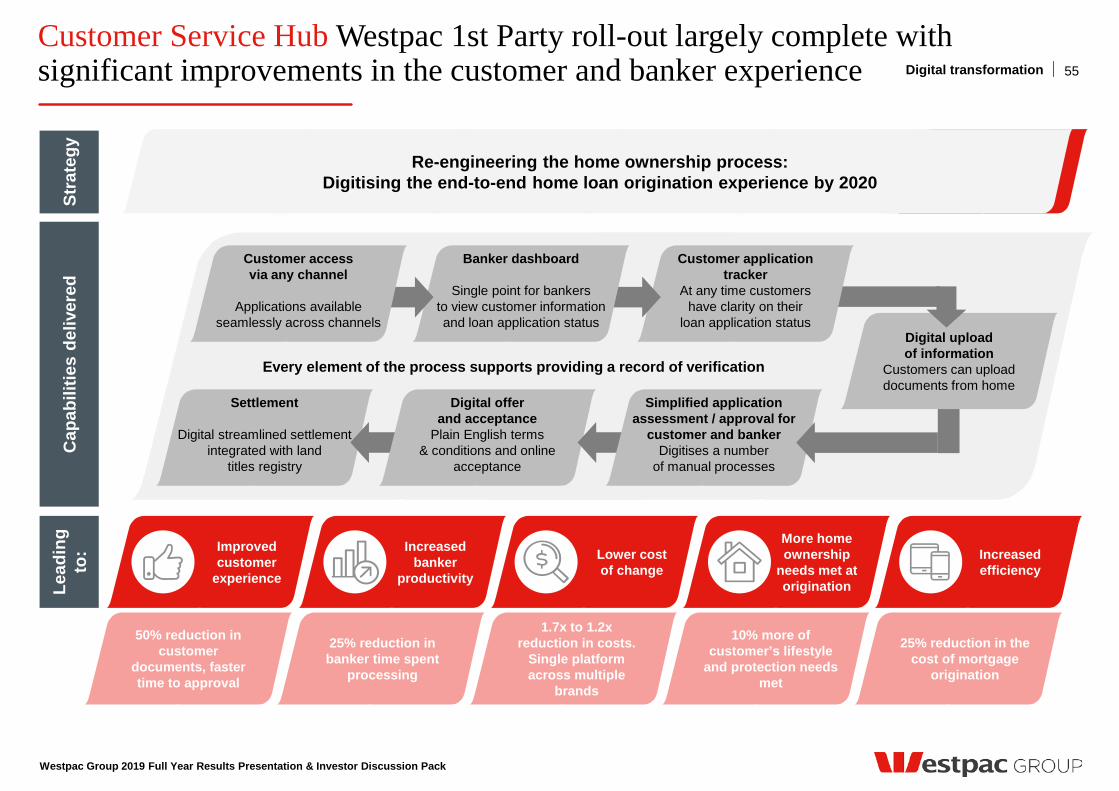
Customer Service Hub Westpac 1st Party roll-out largely complete with significant improvements in the customer and banker experience
Increased efficiency
More home ownership
needs met at origination
Lower cost of change
Increased banker
productivity
Improved customer
experience
Lead
ing
to:
Stra
tegy
Re-engineering the home ownership process: Digitising the end-to-end home loan origination experience by 2020
50% reduction in customer
documents, faster time to approval
25% reduction in banker time spent
processing
1.7x to 1.2x reduction in costs.
Single platform across multiple
brands
10% more of customer’s lifestyle
and protection needs met
25% reduction in the cost of mortgage
origination
Every element of the process supports providing a record of verification
Digital offer and acceptance
Plain English terms & conditions and online
acceptance
Simplified application assessment / approval for
customer and banker Digitises a number
of manual processes
Digital upload of information
Customers can upload documents from home
Customer application tracker
At any time customers have clarity on their
loan application status
Banker dashboard
Single point for bankers to view customer information and loan application status
Customer access via any channel
Applications available
seamlessly across channels
Westpac Group 2019 Full Year Results Presentation & Investor Discussion Pack
55 Digital transformation
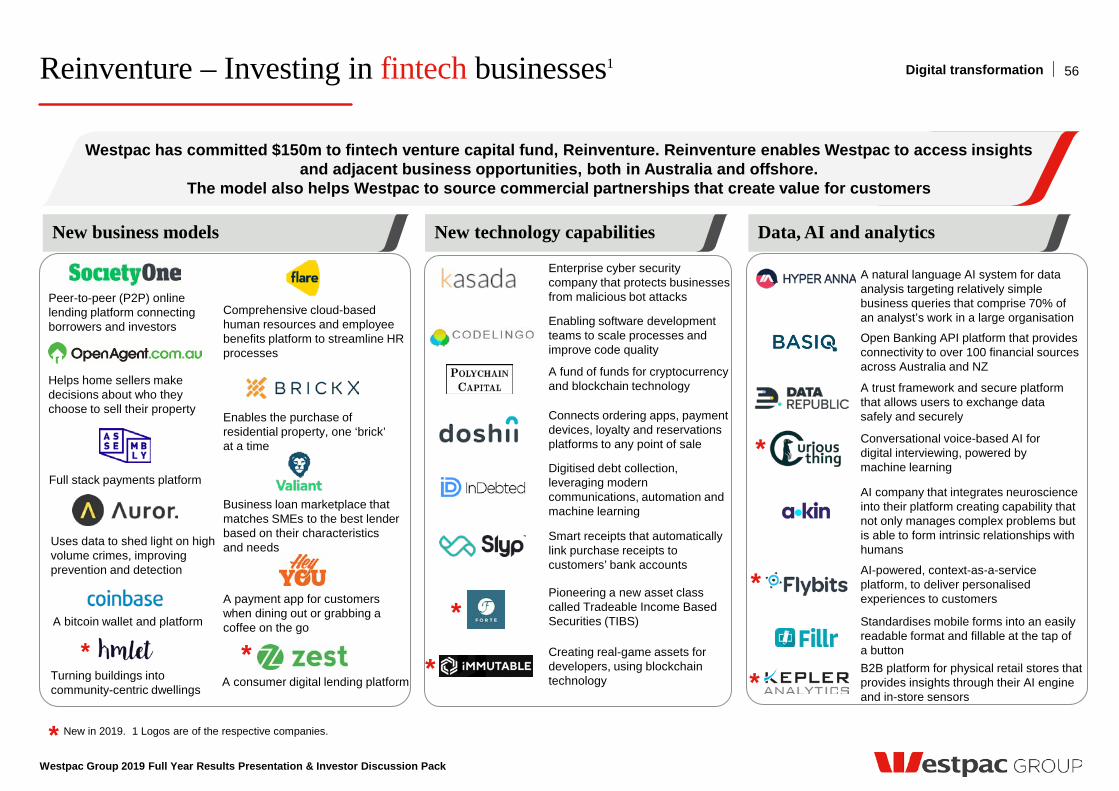
Reinventure – Investing in fintech businesses1
New in 2019. 1 Logos are of the respective companies.
Digital transformation
Comprehensive cloud-based human resources and employee benefits platform to streamline HR processes
Business loan marketplace that matches SMEs to the best lender based on their characteristics and needs
A natural language AI system for data analysis targeting relatively simple business queries that comprise 70% of an analyst’s work in a large organisation
Open Banking API platform that provides connectivity to over 100 financial sources across Australia and NZ
Enables the purchase of residential property, one ‘brick’ at a time
Peer-to-peer (P2P) online lending platform connecting borrowers and investors
A bitcoin wallet and platform
Helps home sellers make decisions about who they choose to sell their property
Full stack payments platform
Connects ordering apps, payment devices, loyalty and reservations platforms to any point of sale
A trust framework and secure platform that allows users to exchange data safely and securely
Standardises mobile forms into an easily readable format and fillable at the tap of a button
Enterprise cyber security company that protects businesses from malicious bot attacks
Enabling software development teams to scale processes and improve code quality
Digitised debt collection, leveraging modern communications, automation and machine learning
A payment app for customers when dining out or grabbing a coffee on the go
New technology capabilities
Westpac is actively responding to digital threats and opportunities. We encourage digital innovation through investing in venture capital, partnerships and direct investments.
Westpac can learn directly and gain access to emerging fintech developments.
Westpac has committed $150m to fintech venture capital fund, Reinventure. Reinventure enables Westpac to access insights and adjacent business opportunities, both in Australia and offshore.
The model also helps Westpac to source commercial partnerships that create value for customers
Westpac Group 2019 Full Year Results Presentation & Investor Discussion Pack
56
Uses data to shed light on high volume crimes, improving prevention and detection
A fund of funds for cryptocurrency and blockchain technology
AI company that integrates neuroscience into their platform creating capability that not only manages complex problems but is able to form intrinsic relationships with humans
Smart receipts that automatically link purchase receipts to customers’ bank accounts
Data, AI and analytics New business models
AI-powered, context-as-a-service platform, to deliver personalised experiences to customers
B2B platform for physical retail stores that provides insights through their AI engine and in-store sensors
A consumer digital lending platform Turning buildings into community-centric dwellings
Pioneering a new asset class called Tradeable Income Based Securities (TIBS)
Creating real-game assets for developers, using blockchain technology
Conversational voice-based AI for digital interviewing, powered by machine learning
* * *
*
*
*
*
*
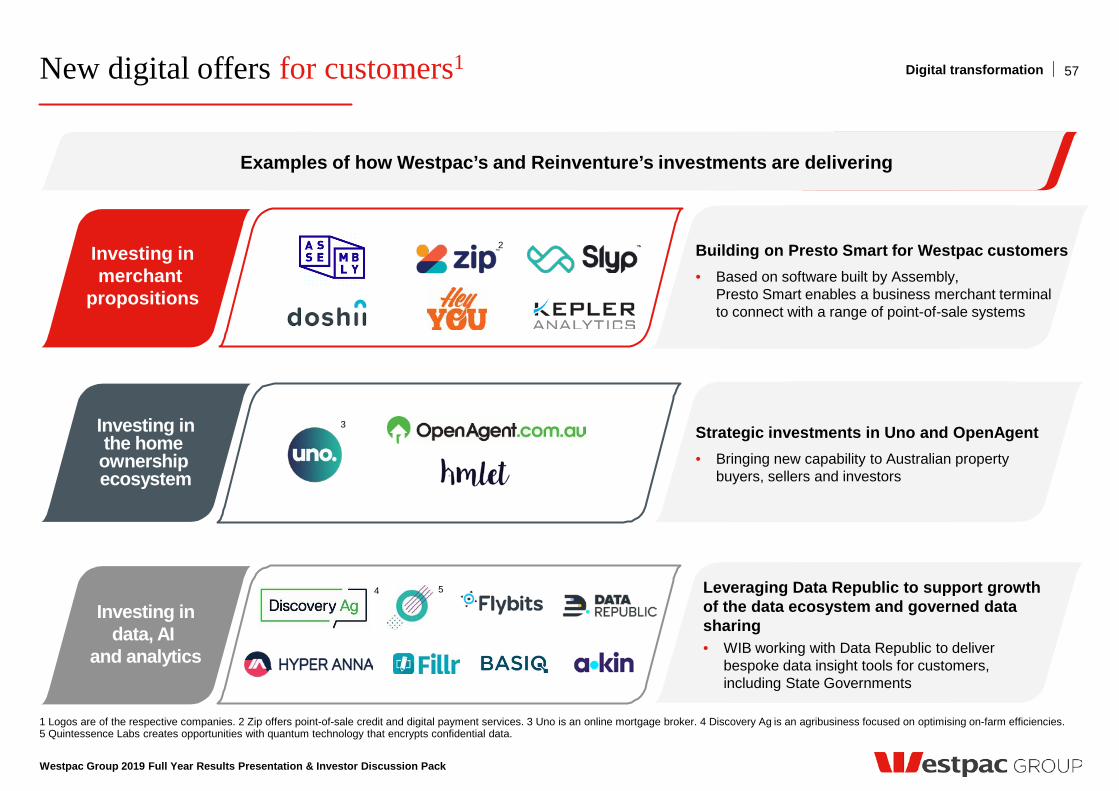
New digital offers for customers1
Westpac Group 2019 Full Year Results Presentation & Investor Discussion Pack
1 Logos are of the respective companies. 2 Zip offers point-of-sale credit and digital payment services. 3 Uno is an online mortgage broker. 4 Discovery Ag is an agribusiness focused on optimising on-farm efficiencies. 5 Quintessence Labs creates opportunities with quantum technology that encrypts confidential data.
57 Digital transformation
3
2
4 5
Investing in the home ownership ecosystem
Investing in data, AI
and analytics
Investing in merchant
propositions
Building on Presto Smart for Westpac customers • Based on software built by Assembly,
Presto Smart enables a business merchant terminal to connect with a range of point-of-sale systems
Strategic investments in Uno and OpenAgent • Bringing new capability to Australian property
buyers, sellers and investors
Leveraging Data Republic to support growth of the data ecosystem and governed data sharing • WIB working with Data Republic to deliver
bespoke data insight tools for customers, including State Governments
Examples of how Westpac’s and Reinventure’s investments are delivering
Westpac Group 2019 Full Year Results Presentation & Investor Discussion Pack
Continued sustainability leadership
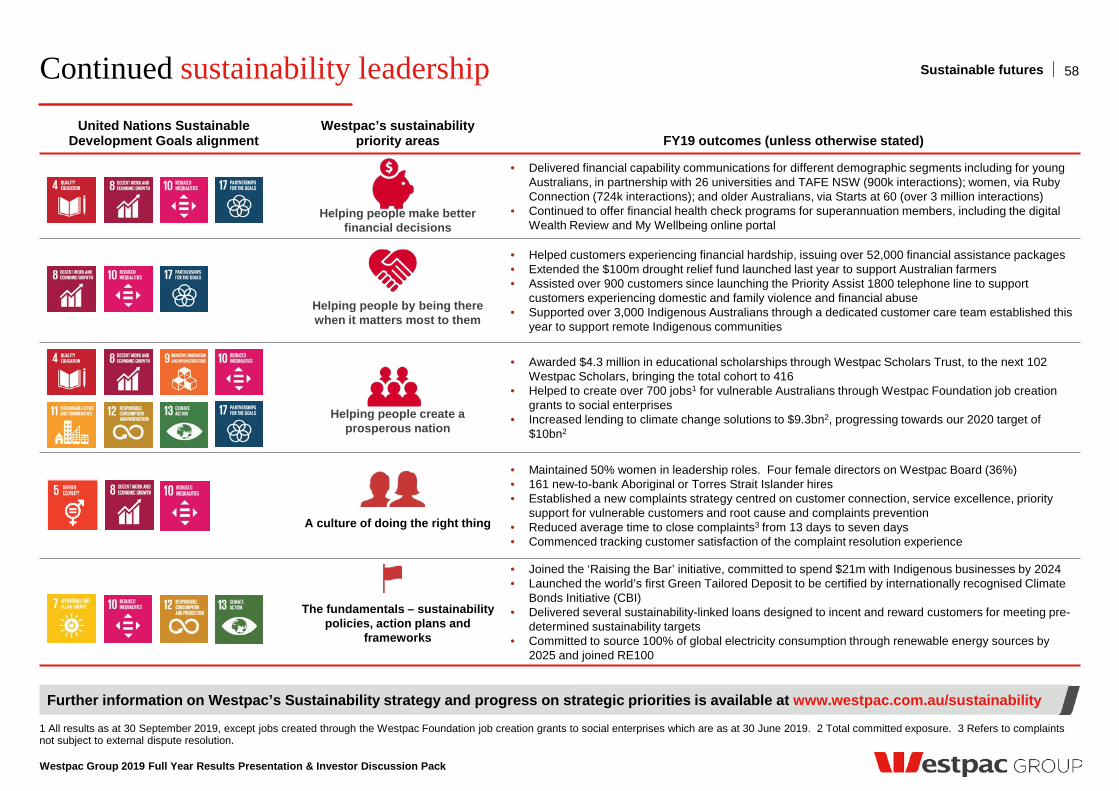
1 All results as at 30 September 2019, except jobs created through the Westpac Foundation job creation grants to social enterprises which are as at 30 June 2019. 2 Total committed exposure. 3 Refers to complaints not subject to external dispute resolution.
United Nations Sustainable Development Goals alignment
Westpac’s sustainability priority areas
FY19 outcomes (unless otherwise stated)
Helping people make better financial decisions
• Delivered financial capability communications for different demographic segments including for young Australians, in partnership with 26 universities and TAFE NSW (900k interactions); women, via Ruby Connection (724k interactions); and older Australians, via Starts at 60 (over 3 million interactions)
• Continued to offer financial health check programs for superannuation members, including the digital Wealth Review and My Wellbeing online portal
Helping people by being there when it matters most to them
• Helped customers experiencing financial hardship, issuing over 52,000 financial assistance packages • Extended the $100m drought relief fund launched last year to support Australian farmers • Assisted over 900 customers since launching the Priority Assist 1800 telephone line to support
customers experiencing domestic and family violence and financial abuse • Supported over 3,000 Indigenous Australians through a dedicated customer care team established this
year to support remote Indigenous communities
Helping people create a prosperous nation
• Awarded $4.3 million in educational scholarships through Westpac Scholars Trust, to the next 102 Westpac Scholars, bringing the total cohort to 416
• Helped to create over 700 jobs1 for vulnerable Australians through Westpac Foundation job creation grants to social enterprises
• Increased lending to climate change solutions to $9.3bn2, progressing towards our 2020 target of $10bn2
A culture of doing the right thing
• Maintained 50% women in leadership roles. Four female directors on Westpac Board (36%) • 161 new-to-bank Aboriginal or Torres Strait Islander hires • Established a new complaints strategy centred on customer connection, service excellence, priority
support for vulnerable customers and root cause and complaints prevention • Reduced average time to close complaints3 from 13 days to seven days • Commenced tracking customer satisfaction of the complaint resolution experience
The fundamentals – sustainability policies, action plans and
frameworks
• Joined the ‘Raising the Bar’ initiative, committed to spend $21m with Indigenous businesses by 2024 • Launched the world’s first Green Tailored Deposit to be certified by internationally recognised Climate
Bonds Initiative (CBI) • Delivered several sustainability-linked loans designed to incent and reward customers for meeting pre-
determined sustainability targets • Committed to source 100% of global electricity consumption through renewable energy sources by
2025 and joined RE100
58 Sustainable futures
Further information on Westpac’s Sustainability strategy and progress on strategic priorities is available at www.westpac.com.au/sustainability
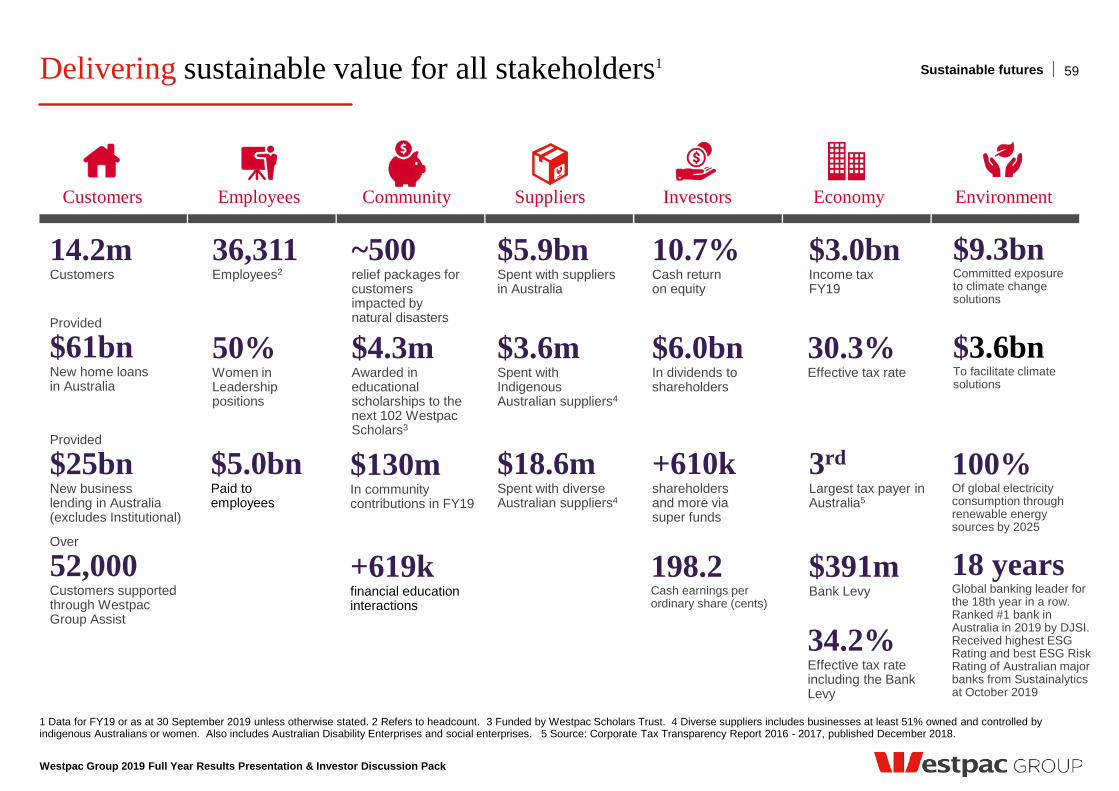
1 Data for FY19 or as at 30 September 2019 unless otherwise stated. 2 Refers to headcount. 3 Funded by Westpac Scholars Trust. 4 Diverse suppliers includes businesses at least 51% owned and controlled by indigenous Australians or women. Also includes Australian Disability Enterprises and social enterprises. 5 Source: Corporate Tax Transparency Report 2016 - 2017, published December 2018.
Customers Employees Community Suppliers Investors Economy Environment
Delivering sustainable value for all stakeholders1 Sustainable futures
Westpac Group 2019 Full Year Results Presentation & Investor Discussion Pack
59
14.2m Customers
Provided
$61bn New home loans in Australia
Over
52,000 Customers supported through Westpac Group Assist
36,311 Employees2
50% Women in Leadership positions
$4.3m Awarded in educational scholarships to the next 102 Westpac Scholars3
$5.9bn Spent with suppliers in Australia
$3.6m Spent with Indigenous Australian suppliers4
10.7% Cash return on equity
$6.0bn In dividends to shareholders
$3.0bn Income tax FY19
Provided
$25bn New business lending in Australia (excludes Institutional)
+610k shareholders and more via super funds
3rd Largest tax payer in Australia5
$5.0bn Paid to employees
198.2 Cash earnings per ordinary share (cents)
30.3% Effective tax rate
$391m Bank Levy
$9.3bn Committed exposure to climate change solutions
$3.6bn To facilitate climate solutions
18 years Global banking leader for the 18th year in a row. Ranked #1 bank in Australia in 2019 by DJSI. Received highest ESG Rating and best ESG Risk Rating of Australian major banks from Sustainalytics at October 2019
34.2% Effective tax rate including the Bank Levy
$130m In community contributions in FY19
$18.6m Spent with diverse Australian suppliers4
100% Of global electricity consumption through renewable energy sources by 2025
~500 relief packages for customers impacted by natural disasters
+619k financial education interactions
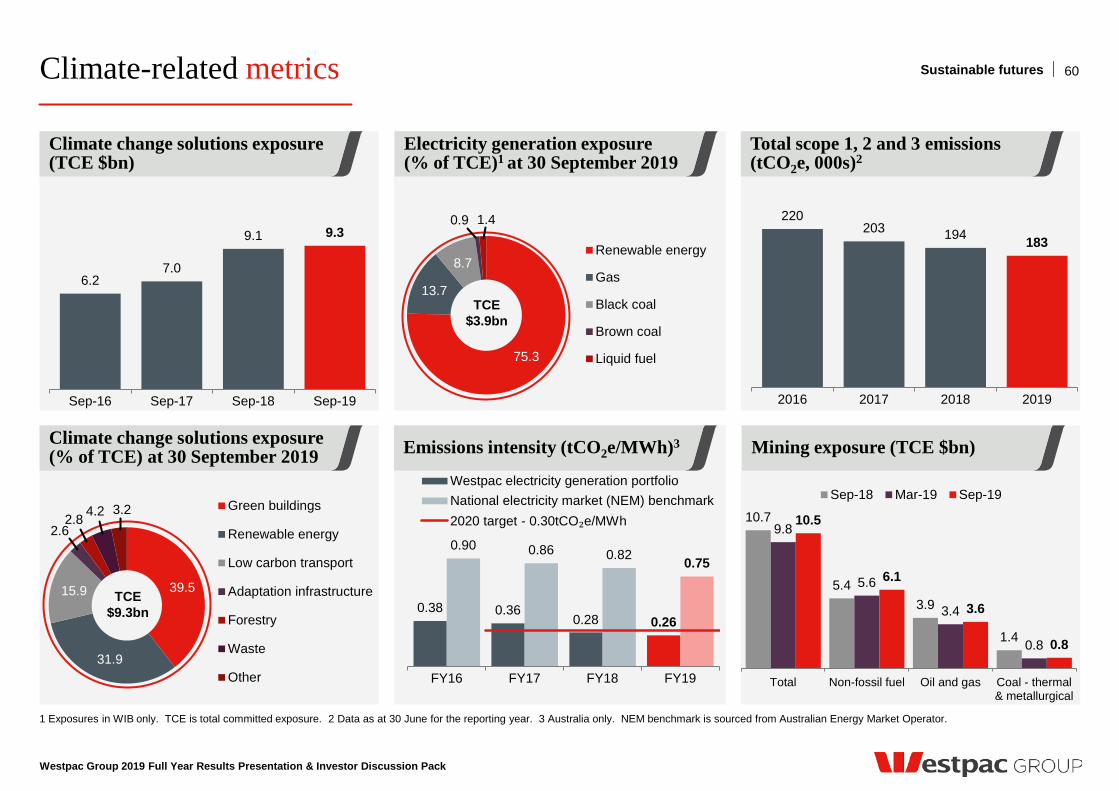
39.5
31.9
15.9
2.6 2.8 4.2 3.2 Green buildings
Renewable energy
Low carbon transport
Adaptation infrastructure
Forestry
Waste
Other
Climate-related metrics
Westpac Group 2019 Full Year Results Presentation & Investor Discussion Pack
1 Exposures in WIB only. TCE is total committed exposure. 2 Data as at 30 June for the reporting year. 3 Australia only. NEM benchmark is sourced from Australian Energy Market Operator.
60 Sustainable futures
Climate change solutions exposure (% of TCE) at 30 September 2019 Emissions intensity (tCO2e/MWh)3
Electricity generation exposure (% of TCE)1 at 30 September 2019
Total scope 1, 2 and 3 emissions (tCO2e, 000s)2
Climate change solutions exposure (TCE $bn)
Mining exposure (TCE $bn)
6.2 7.0
9.1 9.3
Sep-16 Sep-17 Sep-18 Sep-19
220 203 194 183
2016 2017 2018 2019
75.3
13.7
8.7
0.9 1.4
Renewable energy
Gas
Black coal
Brown coal
Liquid fuel
0.38 0.36 0.28 0.26
0.90 0.86 0.82 0.75
FY16 FY17 FY18 FY19
Westpac electricity generation portfolioNational electricity market (NEM) benchmark2020 target - 0.30tCO₂e/MWh 10.7
5.4 3.9
1.4
9.8
5.6
3.4
0.8
10.5
6.1
3.6
0.8
Total Non-fossil fuel Oil and gas Coal - thermal& metallurgical
Sep-18 Mar-19 Sep-19
TCE $3.9bn
TCE $9.3bn
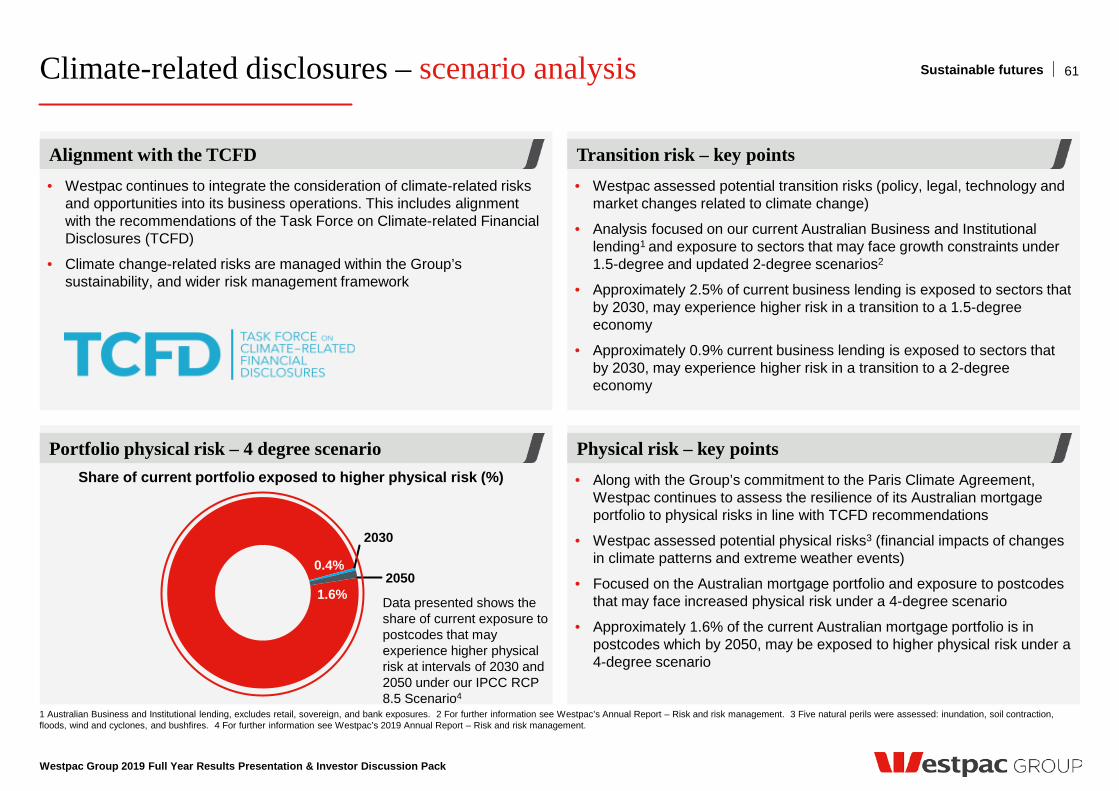
0.4%
1.6%
Westpac Group 2019 Full Year Results Presentation & Investor Discussion Pack
Transition risk – key points
Physical risk – key points
Alignment with the TCFD
Portfolio physical risk – 4 degree scenario
• Westpac assessed potential transition risks (policy, legal, technology and market changes related to climate change)
• Analysis focused on our current Australian Business and Institutional lending1 and exposure to sectors that may face growth constraints under 1.5-degree and updated 2-degree scenarios2
• Approximately 2.5% of current business lending is exposed to sectors that by 2030, may experience higher risk in a transition to a 1.5-degree economy
• Approximately 0.9% current business lending is exposed to sectors that by 2030, may experience higher risk in a transition to a 2-degree economy
• Along with the Group’s commitment to the Paris Climate Agreement, Westpac continues to assess the resilience of its Australian mortgage portfolio to physical risks in line with TCFD recommendations
• Westpac assessed potential physical risks3 (financial impacts of changes in climate patterns and extreme weather events)
• Focused on the Australian mortgage portfolio and exposure to postcodes that may face increased physical risk under a 4-degree scenario
• Approximately 1.6% of the current Australian mortgage portfolio is in postcodes which by 2050, may be exposed to higher physical risk under a 4-degree scenario
61
Share of current portfolio exposed to higher physical risk (%)
1 Australian Business and Institutional lending, excludes retail, sovereign, and bank exposures. 2 For further information see Westpac’s Annual Report – Risk and risk management. 3 Five natural perils were assessed: inundation, soil contraction, floods, wind and cyclones, and bushfires. 4 For further information see Westpac’s 2019 Annual Report – Risk and risk management.
Sustainable futures Climate-related disclosures – scenario analysis
2030
2050
• Westpac continues to integrate the consideration of climate-related risks and opportunities into its business operations. This includes alignment with the recommendations of the Task Force on Climate-related Financial Disclosures (TCFD)
• Climate change-related risks are managed within the Group’s sustainability, and wider risk management framework
Data presented shows the share of current exposure to postcodes that may experience higher physical risk at intervals of 2030 and 2050 under our IPCC RCP 8.5 Scenario4

Governance & Culture
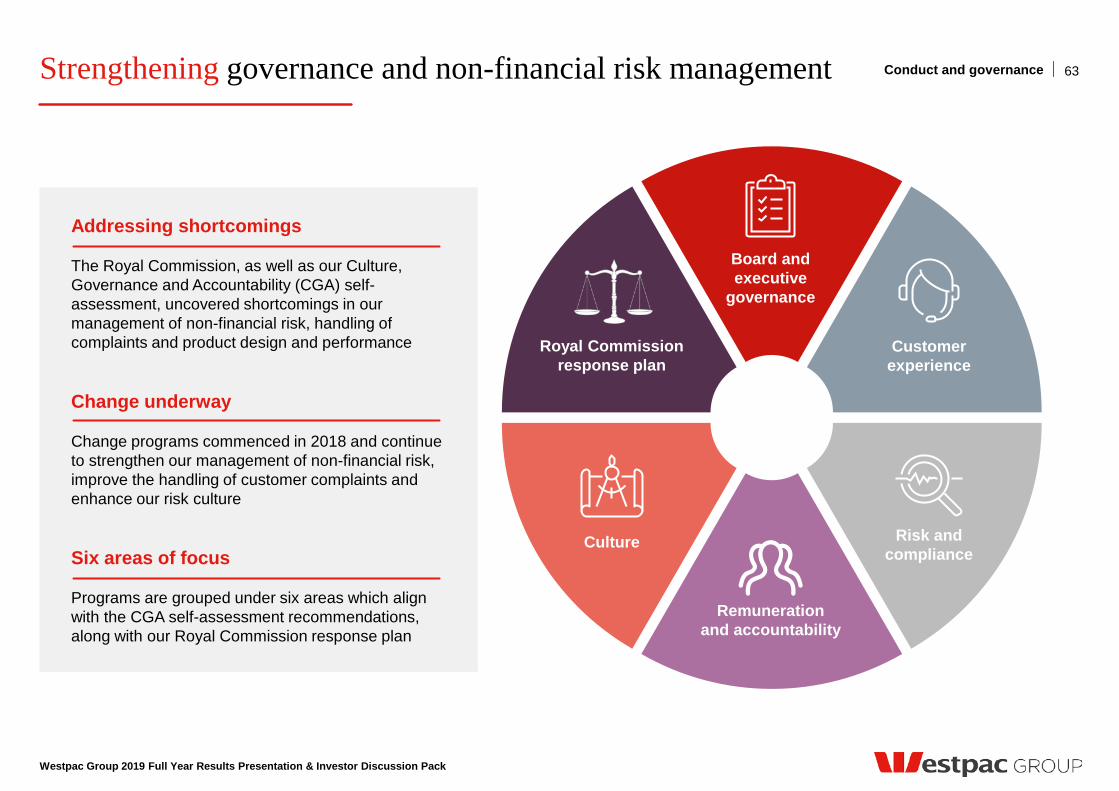
Westpac Group 2019 Full Year Results Presentation & Investor Discussion Pack
Strengthening governance and non-financial risk management 63 Conduct and governance
Remuneration and accountability
Culture
Royal Commission response plan
Customer experience
Addressing shortcomings The Royal Commission, as well as our Culture, Governance and Accountability (CGA) self-assessment, uncovered shortcomings in our management of non-financial risk, handling of complaints and product design and performance Change underway Change programs commenced in 2018 and continue to strengthen our management of non-financial risk, improve the handling of customer complaints and enhance our risk culture Six areas of focus Programs are grouped under six areas which align with the CGA self-assessment recommendations, along with our Royal Commission response plan
Board and executive
governance
Risk and compliance
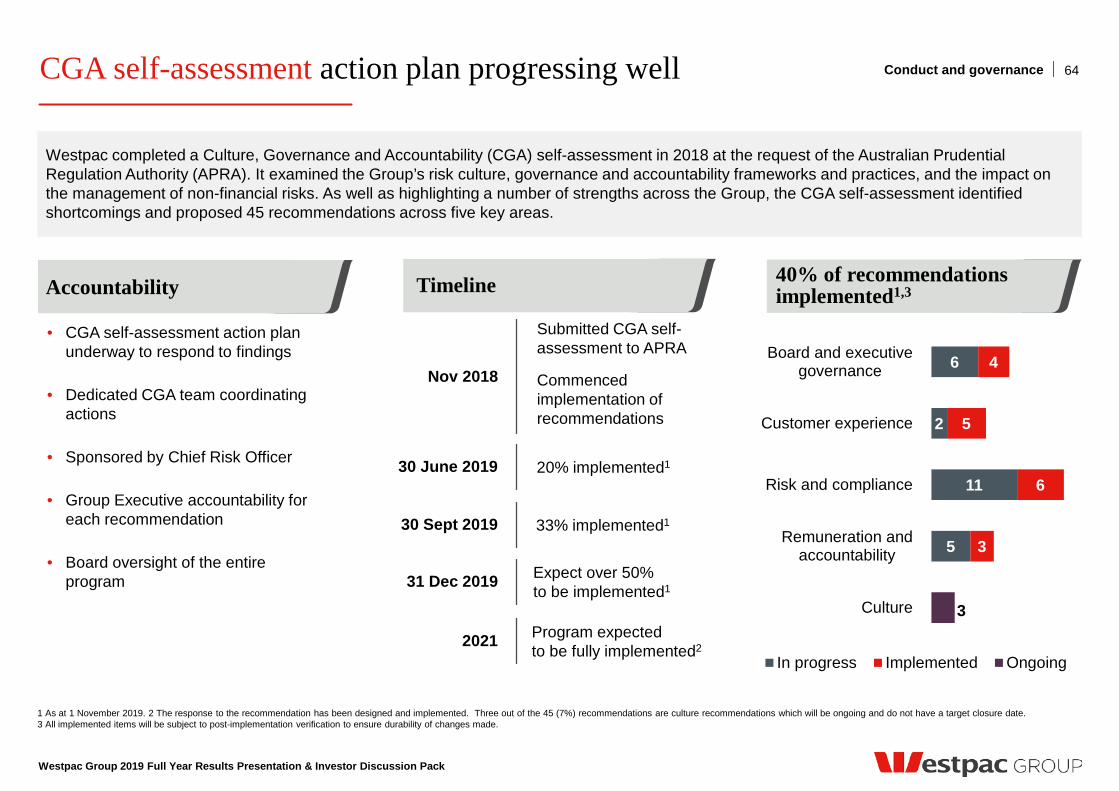
Accountability 40% of recommendations implemented1,3
1 As at 1 November 2019. 2 The response to the recommendation has been designed and implemented. Three out of the 45 (7%) recommendations are culture recommendations which will be ongoing and do not have a target closure date. 3 All implemented items will be subject to post-implementation verification to ensure durability of changes made.
CGA self-assessment action plan progressing well Conduct and governance
Timeline
6
2
11
5
4
5
6
3
3
Board and executivegovernance
Customer experience
Risk and compliance
Remuneration andaccountability
Culture
In progress Implemented Ongoing
• CGA self-assessment action plan underway to respond to findings
• Dedicated CGA team coordinating actions
• Sponsored by Chief Risk Officer
• Group Executive accountability for each recommendation
• Board oversight of the entire program
Westpac completed a Culture, Governance and Accountability (CGA) self-assessment in 2018 at the request of the Australian Prudential Regulation Authority (APRA). It examined the Group’s risk culture, governance and accountability frameworks and practices, and the impact on the management of non-financial risks. As well as highlighting a number of strengths across the Group, the CGA self-assessment identified shortcomings and proposed 45 recommendations across five key areas.
Nov 2018 Commenced implementation of recommendations
2021 Program expected to be fully implemented2
31 Dec 2019 Expect over 50% to be implemented1
30 June 2019 20% implemented1
Submitted CGA self- assessment to APRA
64
Westpac Group 2019 Full Year Results Presentation & Investor Discussion Pack
30 Sept 2019 33% implemented1
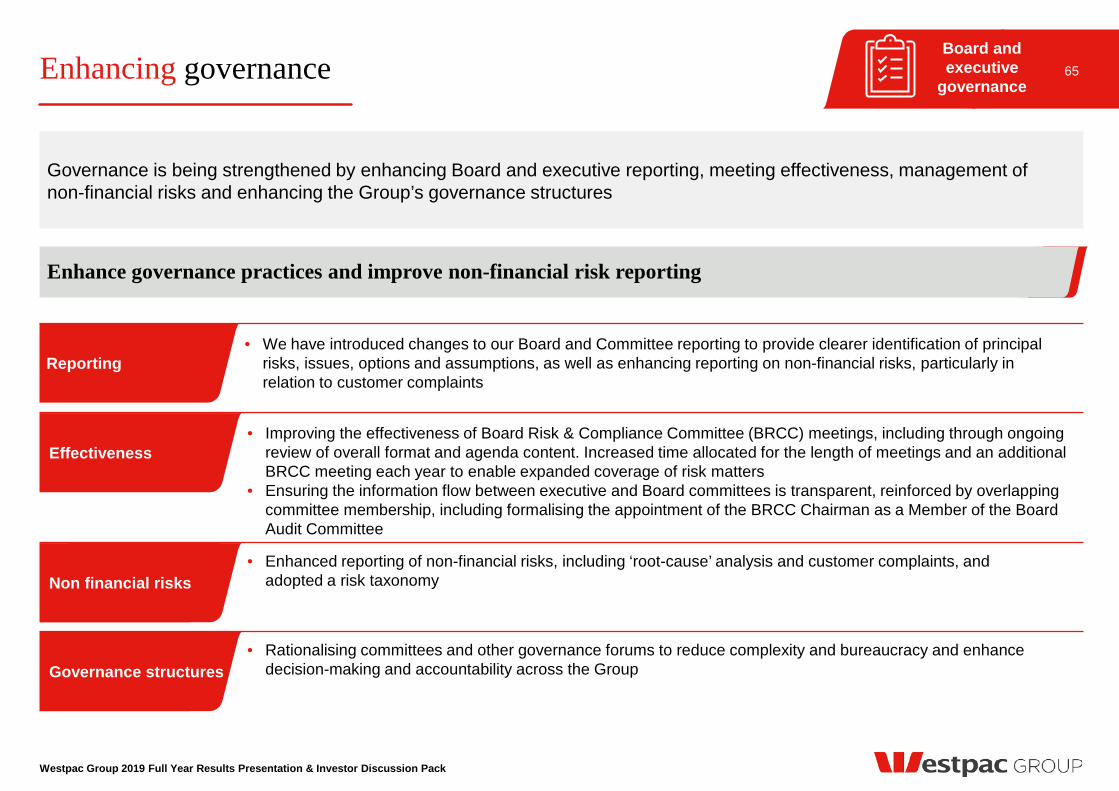
Westpac Group 2019 Full Year Results Presentation & Investor Discussion Pack
Enhancing governance
Governance is being strengthened by enhancing Board and executive reporting, meeting effectiveness, management of non-financial risks and enhancing the Group’s governance structures
65
Enhance governance practices and improve non-financial risk reporting
Reporting
Effectiveness
Non financial risks
• We have introduced changes to our Board and Committee reporting to provide clearer identification of principal risks, issues, options and assumptions, as well as enhancing reporting on non-financial risks, particularly in relation to customer complaints
• Enhanced reporting of non-financial risks, including ‘root-cause’ analysis and customer complaints, and adopted a risk taxonomy
• Improving the effectiveness of Board Risk & Compliance Committee (BRCC) meetings, including through ongoing review of overall format and agenda content. Increased time allocated for the length of meetings and an additional BRCC meeting each year to enable expanded coverage of risk matters
• Ensuring the information flow between executive and Board committees is transparent, reinforced by overlapping committee membership, including formalising the appointment of the BRCC Chairman as a Member of the Board Audit Committee
Board and executive
governance
Governance structures • Rationalising committees and other governance forums to reduce complexity and bureaucracy and enhance
decision-making and accountability across the Group
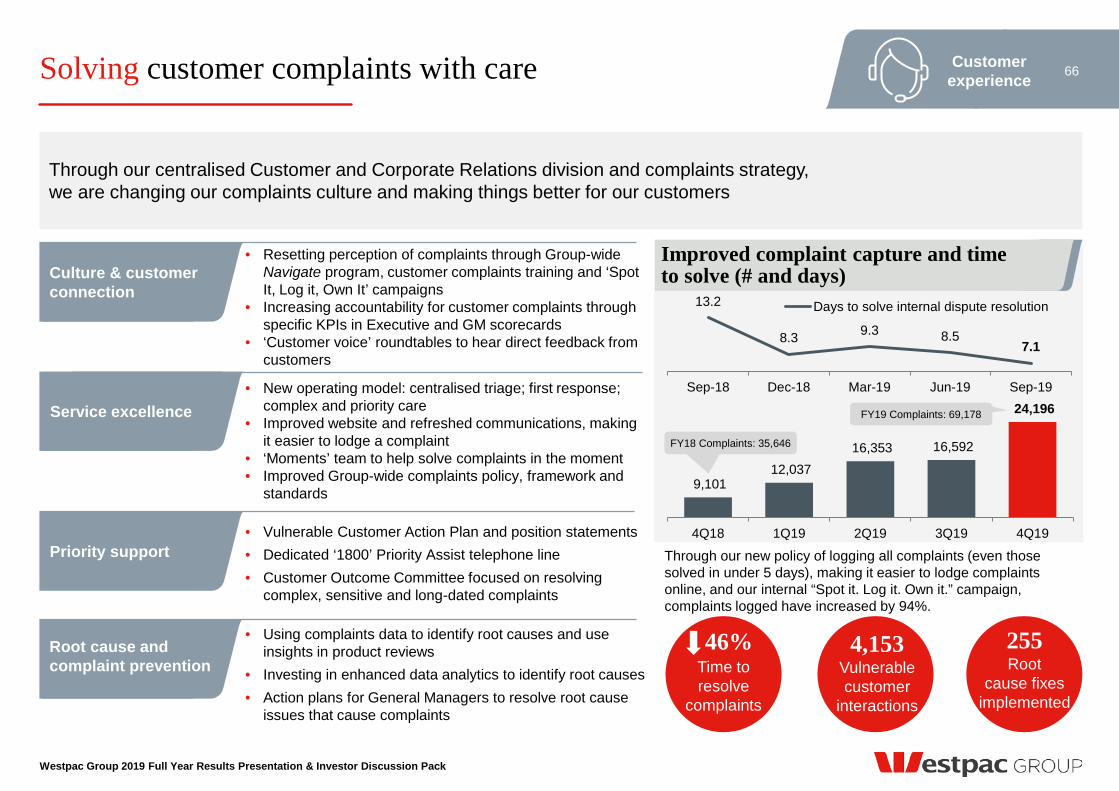
Solving customer complaints with care 66
Culture & customer connection
Service excellence
Priority support
• Resetting perception of complaints through Group-wide Navigate program, customer complaints training and ‘Spot It, Log it, Own It’ campaigns
• Increasing accountability for customer complaints through specific KPIs in Executive and GM scorecards
• ‘Customer voice’ roundtables to hear direct feedback from customers
• New operating model: centralised triage; first response; complex and priority care
• Improved website and refreshed communications, making it easier to lodge a complaint
• ‘Moments’ team to help solve complaints in the moment • Improved Group-wide complaints policy, framework and
standards
• Vulnerable Customer Action Plan and position statements • Dedicated ‘1800’ Priority Assist telephone line • Customer Outcome Committee focused on resolving
complex, sensitive and long-dated complaints
Root cause and complaint prevention
Improved complaint capture and time to solve (# and days)
• Using complaints data to identify root causes and use insights in product reviews
• Investing in enhanced data analytics to identify root causes • Action plans for General Managers to resolve root cause
issues that cause complaints
Customer experience
Through our centralised Customer and Corporate Relations division and complaints strategy, we are changing our complaints culture and making things better for our customers
Through our new policy of logging all complaints (even those solved in under 5 days), making it easier to lodge complaints online, and our internal “Spot it. Log it. Own it.” campaign, complaints logged have increased by 94%.
46% 4,153 Vulnerable customer
interactions
255 Root
cause fixes implemented
9,101 12,037
16,353 16,592
24,196
4Q18 1Q19 2Q19 3Q19 4Q19
FY18 Complaints: 35,646
Time to resolve
complaints
Westpac Group 2019 Full Year Results Presentation & Investor Discussion Pack
13.2
8.3 9.3 8.5 7.1
Sep-18 Dec-18 Mar-19 Jun-19 Sep-19
Days to solve internal dispute resolution
FY19 Complaints: 69,178
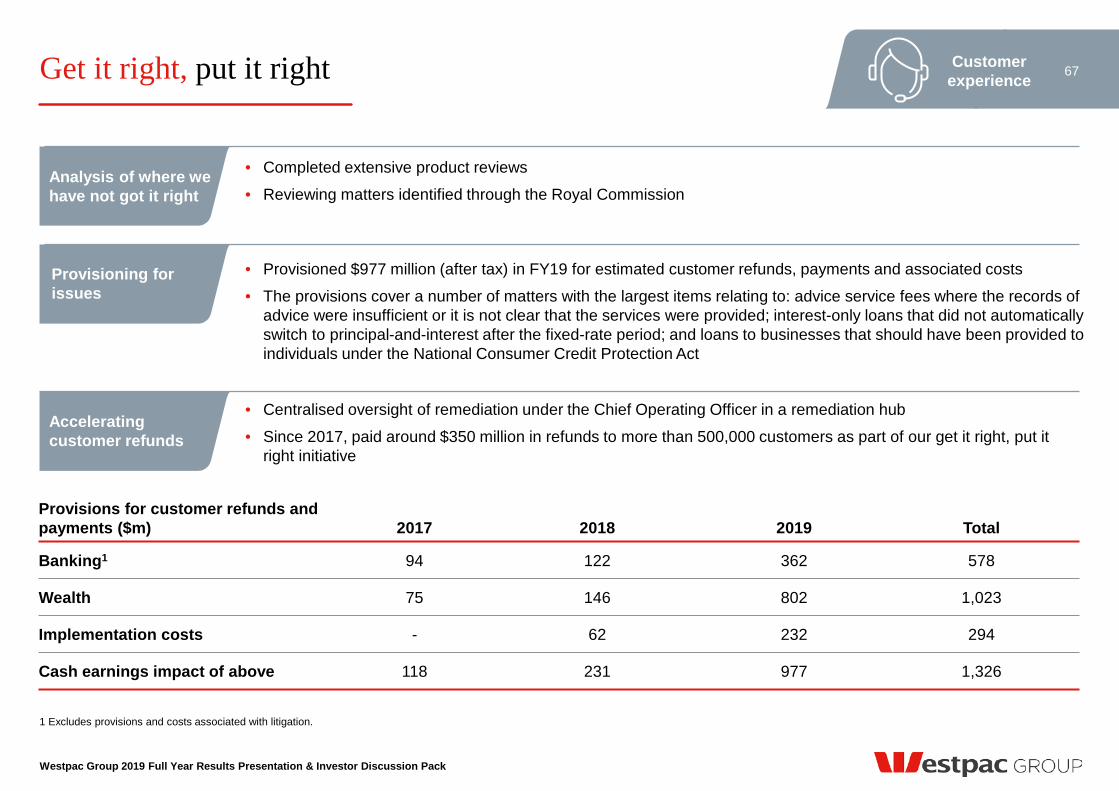
Westpac Group 2019 Full Year Results Presentation & Investor Discussion Pack
Get it right, put it right 67
Provisioning for issues
Accelerating customer refunds
1 Excludes provisions and costs associated with litigation.
Provisions for customer refunds and payments ($m) 2017 2018 2019 Total
Banking1 94 122 362 578
Wealth 75 146 802 1,023
Implementation costs - 62 232 294
Cash earnings impact of above 118 231 977 1,326
• Provisioned $977 million (after tax) in FY19 for estimated customer refunds, payments and associated costs
• The provisions cover a number of matters with the largest items relating to: advice service fees where the records of advice were insufficient or it is not clear that the services were provided; interest-only loans that did not automatically switch to principal-and-interest after the fixed-rate period; and loans to businesses that should have been provided to individuals under the National Consumer Credit Protection Act
Analysis of where we have not got it right
• Centralised oversight of remediation under the Chief Operating Officer in a remediation hub
• Since 2017, paid around $350 million in refunds to more than 500,000 customers as part of our get it right, put it right initiative
Customer experience
• Completed extensive product reviews
• Reviewing matters identified through the Royal Commission
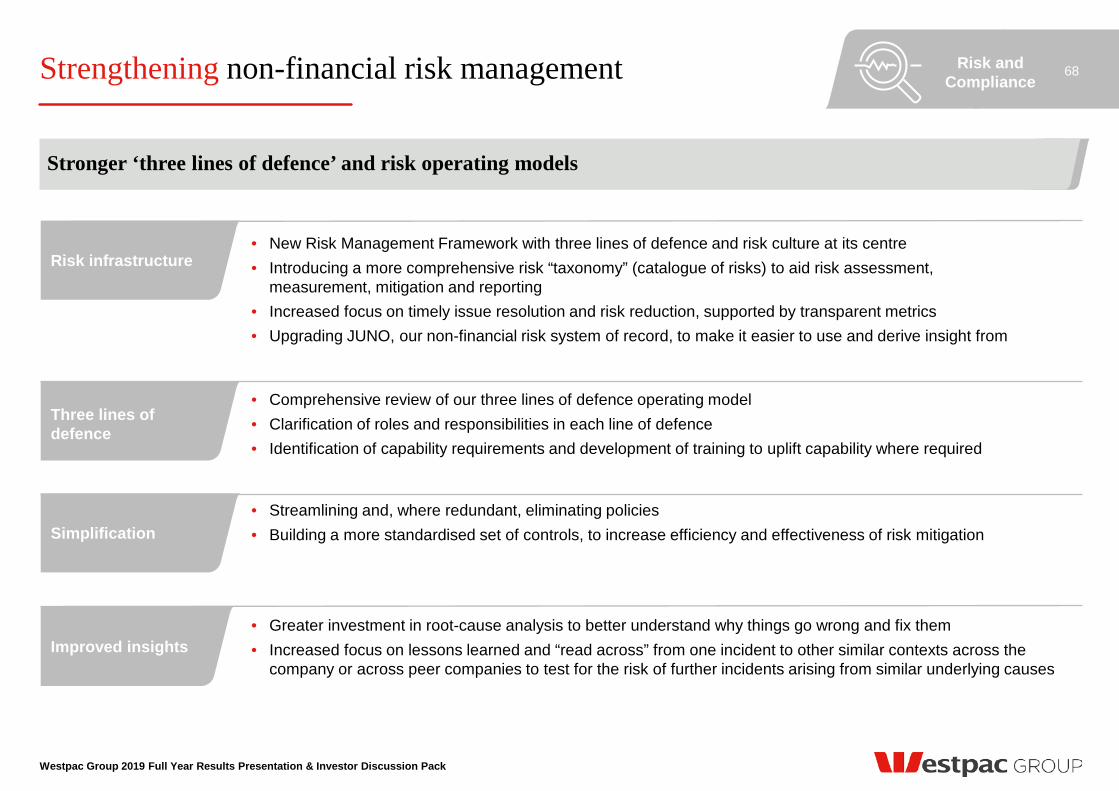
Strengthening non-financial risk management 68
Stronger ‘three lines of defence’ and risk operating models
• New Risk Management Framework with three lines of defence and risk culture at its centre • Introducing a more comprehensive risk “taxonomy” (catalogue of risks) to aid risk assessment,
measurement, mitigation and reporting • Increased focus on timely issue resolution and risk reduction, supported by transparent metrics • Upgrading JUNO, our non-financial risk system of record, to make it easier to use and derive insight from
• Comprehensive review of our three lines of defence operating model • Clarification of roles and responsibilities in each line of defence • Identification of capability requirements and development of training to uplift capability where required
• Streamlining and, where redundant, eliminating policies • Building a more standardised set of controls, to increase efficiency and effectiveness of risk mitigation
• Greater investment in root-cause analysis to better understand why things go wrong and fix them • Increased focus on lessons learned and “read across” from one incident to other similar contexts across the
company or across peer companies to test for the risk of further incidents arising from similar underlying causes
Risk infrastructure
Three lines of defence
Simplification
Improved insights
Risk and Compliance
Westpac Group 2019 Full Year Results Presentation & Investor Discussion Pack
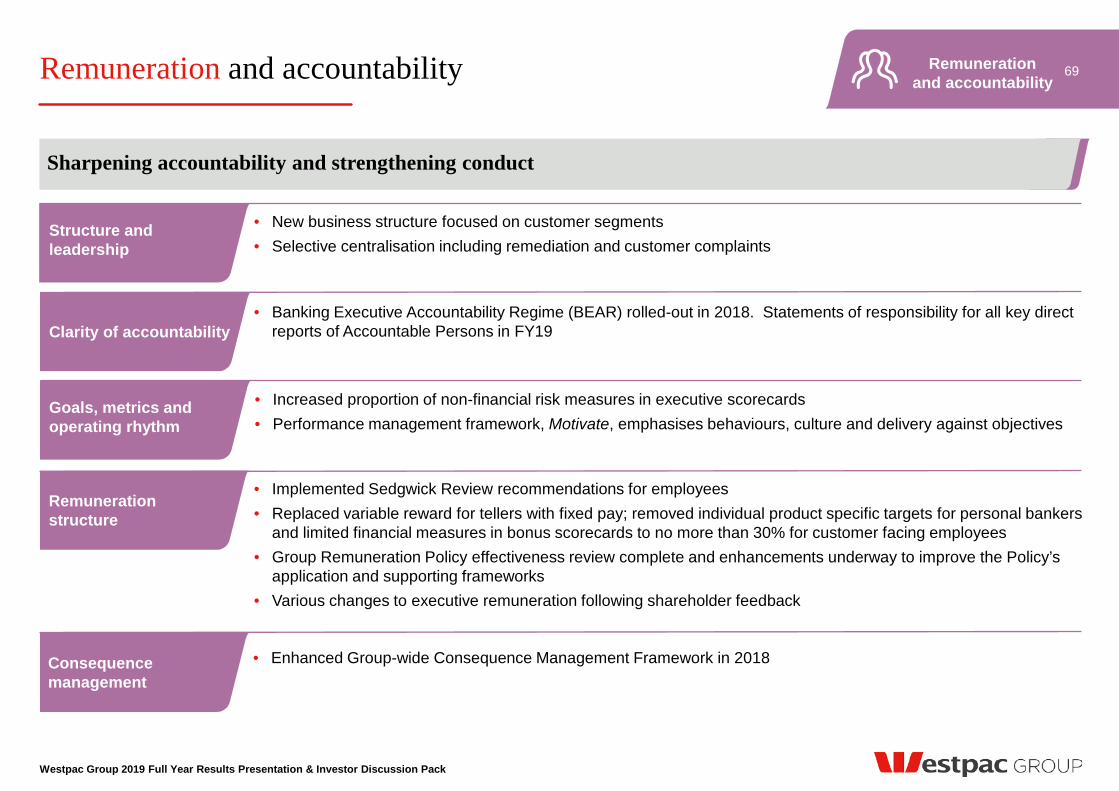
Westpac Group 2019 Full Year Results Presentation & Investor Discussion Pack
Remuneration and accountability 69
Sharpening accountability and strengthening conduct
Structure and leadership
Clarity of accountability
Goals, metrics and operating rhythm
• New business structure focused on customer segments • Selective centralisation including remediation and customer complaints
• Banking Executive Accountability Regime (BEAR) rolled-out in 2018. Statements of responsibility for all key direct reports of Accountable Persons in FY19
• Increased proportion of non-financial risk measures in executive scorecards • Performance management framework, Motivate, emphasises behaviours, culture and delivery against objectives
Remuneration structure
• Implemented Sedgwick Review recommendations for employees • Replaced variable reward for tellers with fixed pay; removed individual product specific targets for personal bankers
and limited financial measures in bonus scorecards to no more than 30% for customer facing employees • Group Remuneration Policy effectiveness review complete and enhancements underway to improve the Policy’s
application and supporting frameworks • Various changes to executive remuneration following shareholder feedback
Consequence management
• Enhanced Group-wide Consequence Management Framework in 2018
Remuneration and accountability
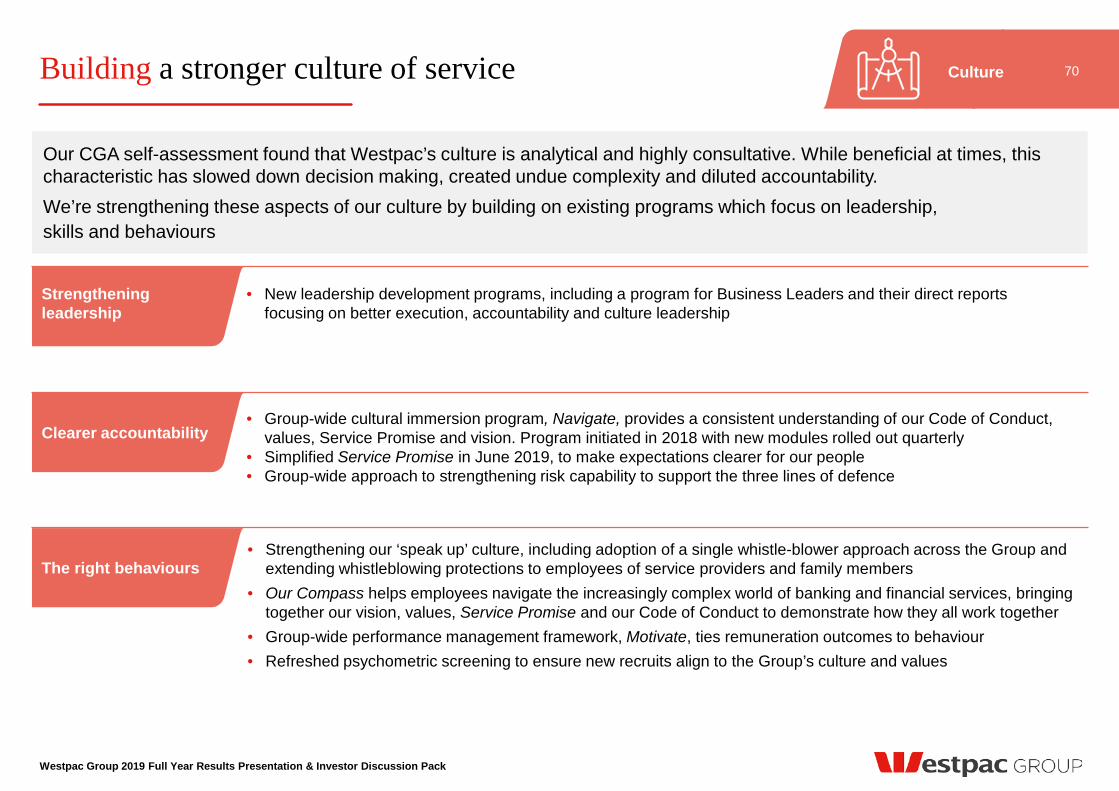
Westpac Group 2019 Full Year Results Presentation & Investor Discussion Pack
Building a stronger culture of service
Our CGA self-assessment found that Westpac’s culture is analytical and highly consultative. While beneficial at times, this characteristic has slowed down decision making, created undue complexity and diluted accountability. We’re strengthening these aspects of our culture by building on existing programs which focus on leadership, skills and behaviours
70
Strengthening leadership
Clearer accountability
• New leadership development programs, including a program for Business Leaders and their direct reports focusing on better execution, accountability and culture leadership
• Group-wide cultural immersion program, Navigate, provides a consistent understanding of our Code of Conduct, values, Service Promise and vision. Program initiated in 2018 with new modules rolled out quarterly
• Simplified Service Promise in June 2019, to make expectations clearer for our people • Group-wide approach to strengthening risk capability to support the three lines of defence
The right behaviours • Strengthening our ‘speak up’ culture, including adoption of a single whistle-blower approach across the Group and
extending whistleblowing protections to employees of service providers and family members • Our Compass helps employees navigate the increasingly complex world of banking and financial services, bringing
together our vision, values, Service Promise and our Code of Conduct to demonstrate how they all work together • Group-wide performance management framework, Motivate, ties remuneration outcomes to behaviour • Refreshed psychometric screening to ensure new recruits align to the Group’s culture and values
Culture
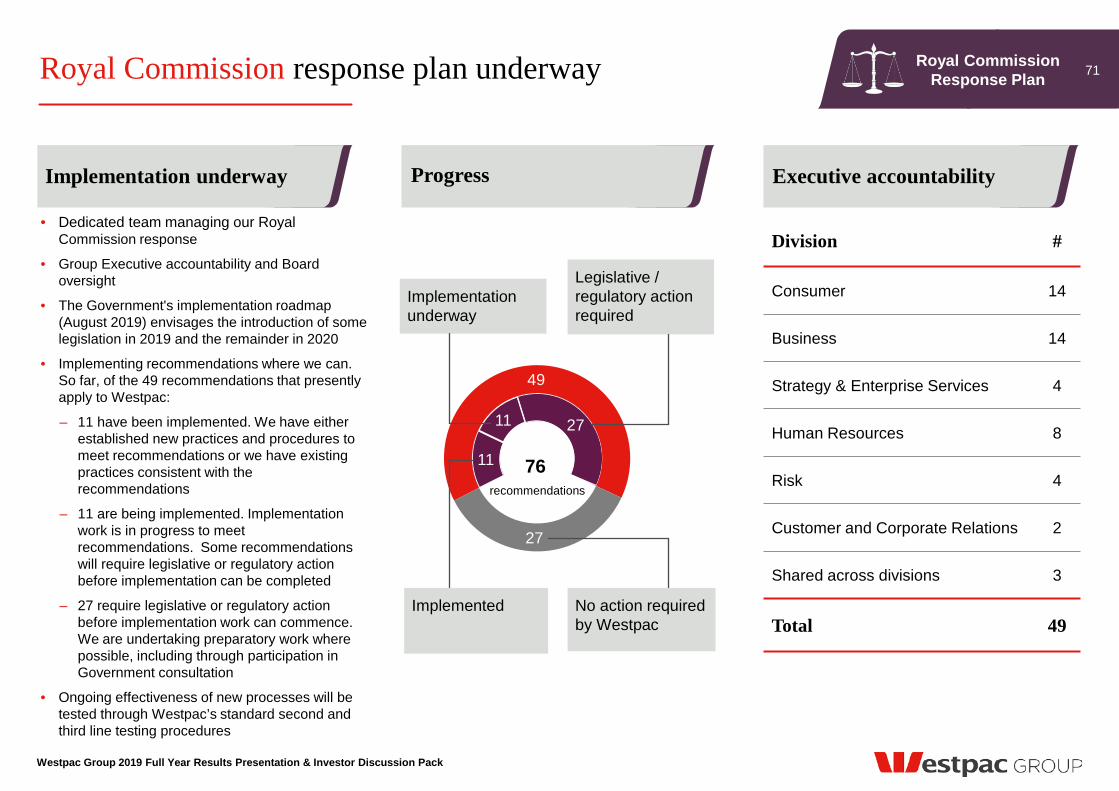
TCE AT 30 SEPTEMBER 2018 $3.5BN Implementation underway Executive accountability
Westpac Group 2019 Full Year Results Presentation & Investor Discussion Pack
Royal Commission response plan underway
Progress
11
11 27
49
27
recommendations
76
No action required by Westpac
Implemented
Implementation underway
Legislative / regulatory action required
Division #
Consumer 14
Business 14
Strategy & Enterprise Services 4
Human Resources 8
Risk 4
Customer and Corporate Relations 2
Shared across divisions 3
Total 49
Royal Commission Response Plan 71
• Dedicated team managing our Royal Commission response
• Group Executive accountability and Board oversight
• The Government's implementation roadmap (August 2019) envisages the introduction of some legislation in 2019 and the remainder in 2020
• Implementing recommendations where we can. So far, of the 49 recommendations that presently apply to Westpac:
– 11 have been implemented. We have either established new practices and procedures to meet recommendations or we have existing practices consistent with the recommendations
– 11 are being implemented. Implementation work is in progress to meet recommendations. Some recommendations will require legislative or regulatory action before implementation can be completed
– 27 require legislative or regulatory action before implementation work can commence. We are undertaking preparatory work where possible, including through participation in Government consultation
• Ongoing effectiveness of new processes will be tested through Westpac’s standard second and third line testing procedures

Earnings Drivers
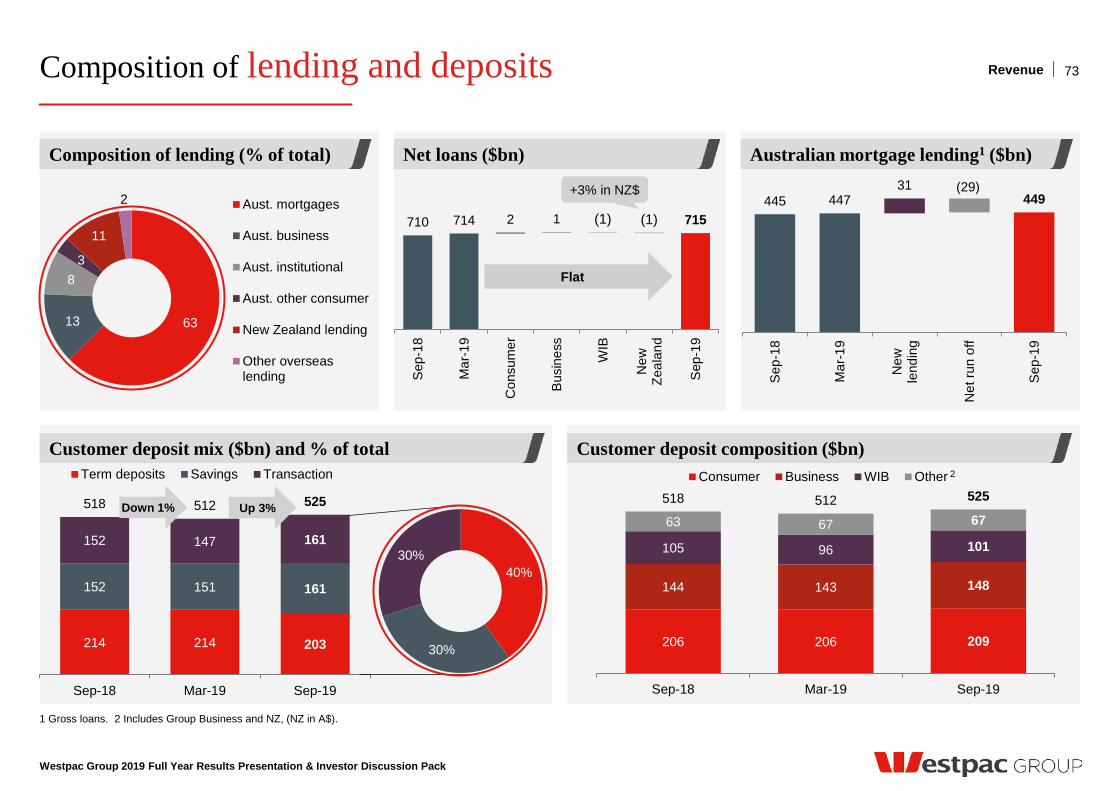
214 214 203
152 151 161
152 147 161
518 512 525
Sep-18 Mar-19 Sep-19
Term deposits Savings Transaction
40%
30%
30%
Composition of lending and deposits
Westpac Group 2019 Full Year Results Presentation & Investor Discussion Pack
Australian mortgage lending1 ($bn) Composition of lending (% of total) Net loans ($bn)
Customer deposit composition ($bn) Customer deposit mix ($bn) and % of total
73
63 13
8 3
11
2 Aust. mortgages
Aust. business
Aust. institutional
Aust. other consumer
New Zealand lending
Other overseaslending
710 714 2 1 715 (1) (1)
Sep
-18
Mar
-19
Con
sum
er
Bus
ines
s
WIB
New
Zeal
and
Sep
-19
Flat
Up 3% Down 1%
206 206 209
144 143 148
105 96 101
63 67 67 518 512 525
Sep-18 Mar-19 Sep-19
Consumer Business WIB Other
445 447 31
449 (29)
Sep
-18
Mar
-19
New
lend
ing
Net
run
off
Sep
-19
Revenue
1 Gross loans. 2 Includes Group Business and NZ, (NZ in A$).
2
+3% in NZ$
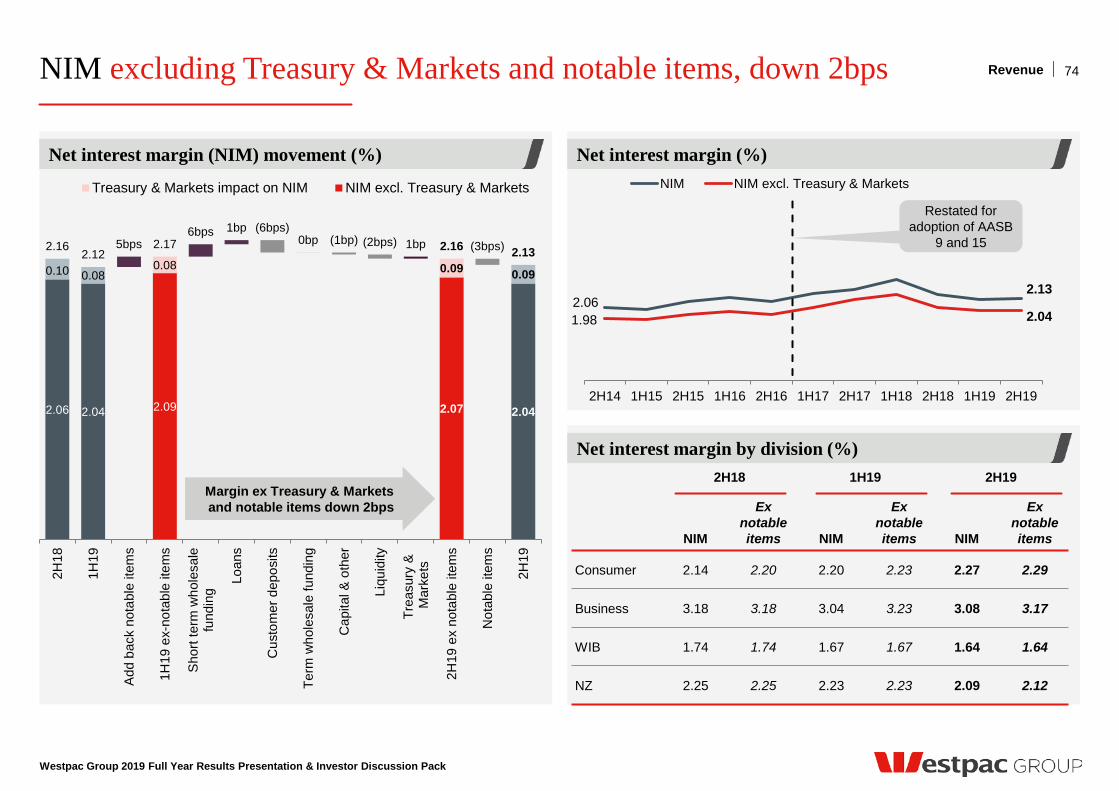
2.06 2.13
1.98 2.04
2H14 1H15 2H15 1H16 2H16 1H17 2H17 1H18 2H18 1H19 2H19
NIM NIM excl. Treasury & Markets
NIM excluding Treasury & Markets and notable items, down 2bps
Westpac Group 2019 Full Year Results Presentation & Investor Discussion Pack
Net interest margin by division (%)
Net interest margin (%) Net interest margin (NIM) movement (%)
74
2.06 2.04 2.09 2.07 2.04
0.10 0.08 0.08 0.09 0.09
2.16 2.12
5bps 2.17 6bps 1bp (6bps)
0bp (1bp) (2bps) 1bp 2.16 (3bps) 2.13
2H18
1H19
Add
bac
k no
tabl
e ite
ms
1H19
ex-
nota
ble
item
s
Sho
rt te
rm w
hole
sale
fund
ing
Loan
s
Cus
tom
er d
epos
its
Term
who
lesa
le fu
ndin
g
Cap
ital &
oth
er
Liqu
idity
Trea
sury
& M
arke
ts
2H19
ex
nota
ble
item
s
Not
able
item
s
2H19
Treasury & Markets impact on NIM NIM excl. Treasury & Markets
Revenue
Restated for adoption of AASB
9 and 15
Margin ex Treasury & Markets and notable items down 2bps
2H18 1H19 2H19
NIM
Ex notable items NIM
Ex notable items NIM
Ex notable items
Consumer 2.14 2.20 2.20 2.23 2.27 2.29
Business 3.18 3.18 3.04 3.23 3.08 3.17
WIB 1.74 1.74 1.67 1.67 1.64 1.64
NZ 2.25 2.25 2.23 2.23 2.09 2.12
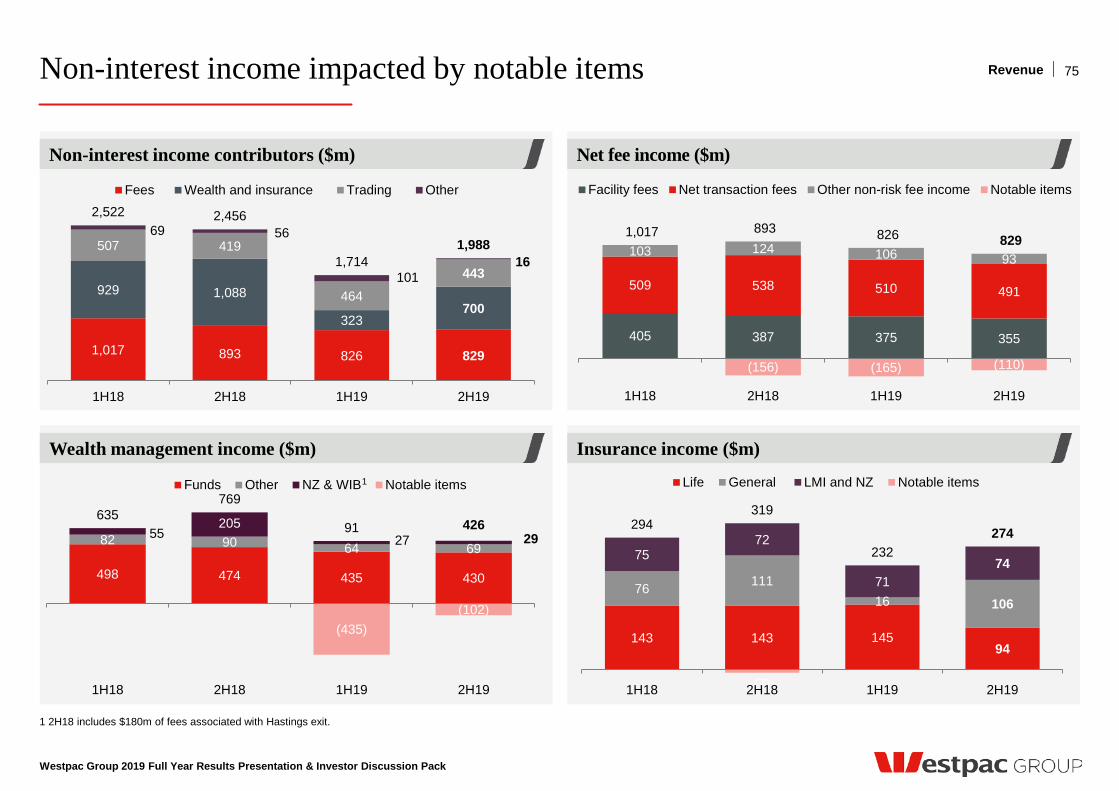
Non-interest income impacted by notable items
Westpac Group 2019 Full Year Results Presentation & Investor Discussion Pack
Net fee income ($m)
Insurance income ($m)
Non-interest income contributors ($m)
Wealth management income ($m)
1 2H18 includes $180m of fees associated with Hastings exit.
75 Revenue
1,017 893 826 829
929 1,088
323 700
507 419
464
443
69 56
101 16
2,522 2,456
1,714 1,988
1H18 2H18 1H19 2H19
Fees Wealth and insurance Trading Other
498 474 435 430
82 90 64 69 55
205 27 29
(435) (102)
635 769
91 426
1H18 2H18 1H19 2H19
Funds Other NZ & WIB Notable items
405 387 375 355
509 538 510 491
103 124 106 93
(156) (165) (110)
1,017 893 826 829
1H18 2H18 1H19 2H19
Facility fees Net transaction fees Other non-risk fee income Notable items
143 143 145 94
76 111 16 106
75 72
71 74
0
(7)
0 0
294 319
232 274
1H18 2H18 1H19 2H19
Life General LMI and NZ Notable items1
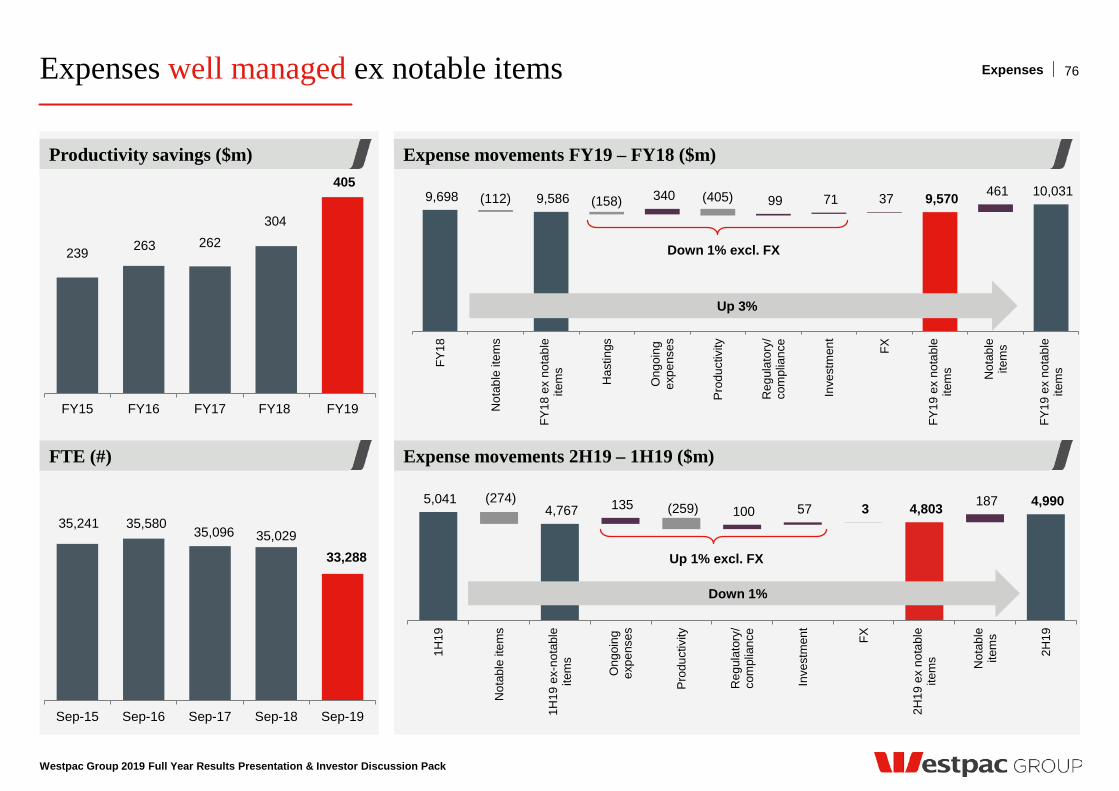
Expenses well managed ex notable items
Westpac Group 2019 Full Year Results Presentation & Investor Discussion Pack
Expense movements FY19 – FY18 ($m)
Expense movements 2H19 – 1H19 ($m)
76
9,698 9,586 340 99 71 37 9,570 461 10,031 (112) (158) (405)
FY18
Not
able
item
s
FY18
ex
nota
ble
item
s
Has
tings
Ong
oing
expe
nses
Pro
duct
ivity
Reg
ulat
ory/
com
plia
nce
Inve
stm
ent
FX
FY19
ex
nota
ble
item
s Not
able
item
s
FY19
ex
nota
ble
item
s
Up 3%
4,767 5,041 135 100 57 3 4,803 187 4,990 (274)
(259)
1H19
Not
able
item
s
1H19
ex-
nota
ble
item
s
Ong
oing
expe
nses
Pro
duct
ivity
Reg
ulat
ory/
com
plia
nce
Inve
stm
ent
FX
2H19
ex
nota
ble
item
s Not
able
item
s
2H19
Down 1%
Expenses
35,241 35,580 35,096 35,029 33,288
Sep-15 Sep-16 Sep-17 Sep-18 Sep-19
FTE (#)
239 263 262 304
405
FY15 FY16 FY17 FY18 FY19
Productivity savings ($m)
Down 1% excl. FX
Up 1% excl. FX
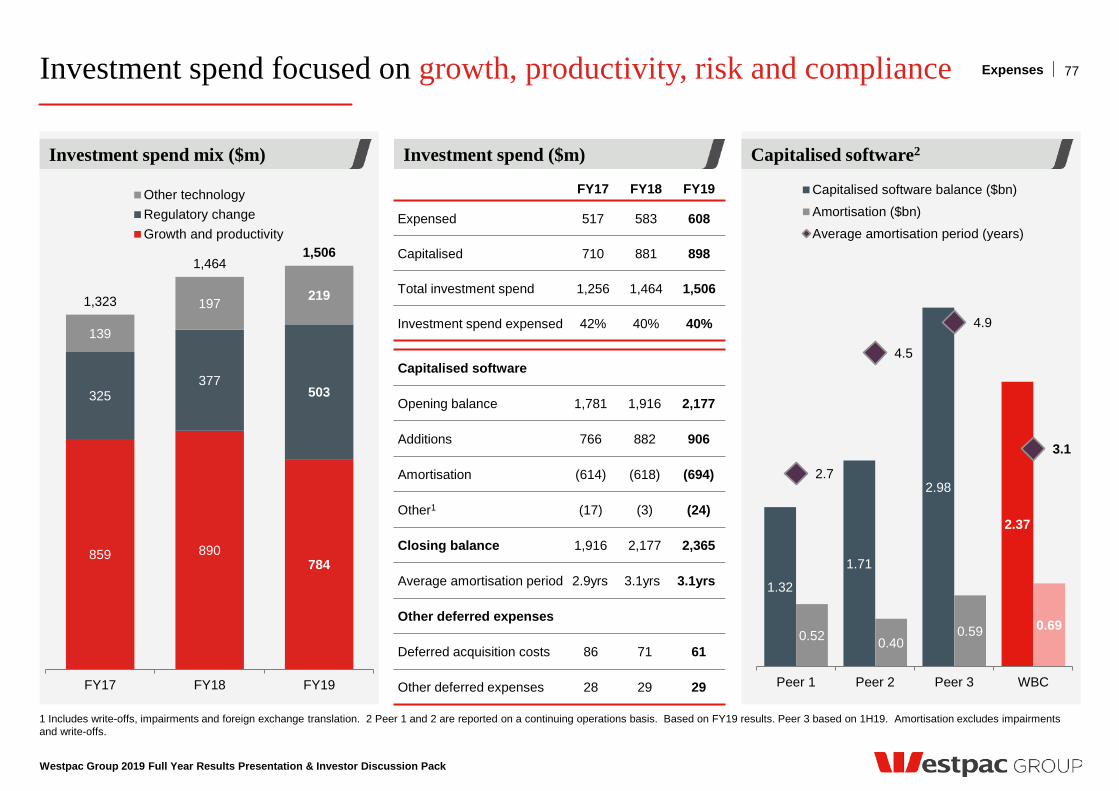
1.32
1.71
2.98
2.37
0.52 0.40 0.59 0.69
2.7
4.5
4.9
3.1
Peer 1 Peer 2 Peer 3 WBC
Capitalised software balance ($bn)
Amortisation ($bn)
Average amortisation period (years)
Investment spend focused on growth, productivity, risk and compliance
Westpac Group 2019 Full Year Results Presentation & Investor Discussion Pack
1 Includes write-offs, impairments and foreign exchange translation. 2 Peer 1 and 2 are reported on a continuing operations basis. Based on FY19 results. Peer 3 based on 1H19. Amortisation excludes impairments and write-offs.
Investment spend mix ($m)
77
Investment spend ($m) Capitalised software2
Expenses
859 890 784
325 377
503
139
197 219 1,323
1,464 1,506
FY17 FY18 FY19
Other technologyRegulatory changeGrowth and productivity
FY17 FY18 FY19
Expensed 517 583 608
Capitalised 710 881 898
Total investment spend 1,256 1,464 1,506
Investment spend expensed 42% 40% 40%
Capitalised software
Opening balance 1,781 1,916 2,177
Additions 766 882 906
Amortisation (614) (618) (694)
Other1 (17) (3) (24)
Closing balance 1,916 2,177 2,365
Average amortisation period 2.9yrs 3.1yrs 3.1yrs
Other deferred expenses
Deferred acquisition costs 86 71 61
Other deferred expenses 28 29 29
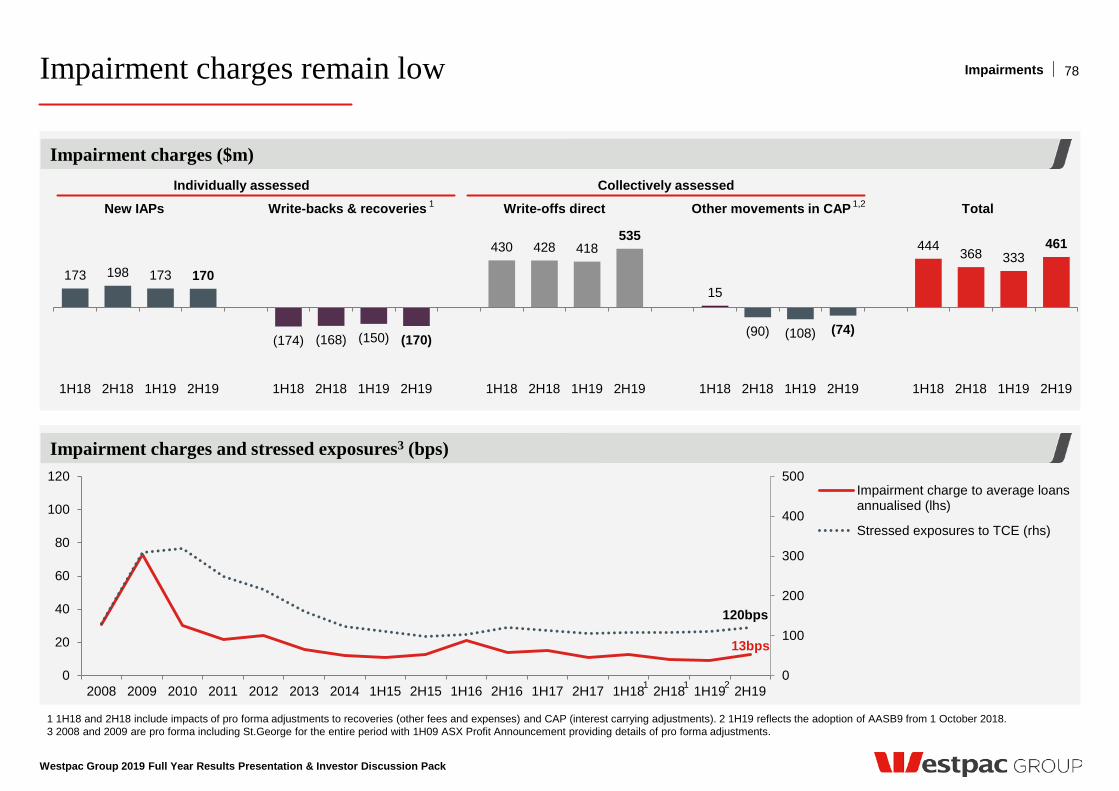
Impairment charges remain low
Westpac Group 2019 Full Year Results Presentation & Investor Discussion Pack
1 1H18 and 2H18 include impacts of pro forma adjustments to recoveries (other fees and expenses) and CAP (interest carrying adjustments). 2 1H19 reflects the adoption of AASB9 from 1 October 2018. 3 2008 and 2009 are pro forma including St.George for the entire period with 1H09 ASX Profit Announcement providing details of pro forma adjustments.
78
Impairment charges ($m)
Impairment charges and stressed exposures3 (bps)
New IAPs Write-backs & recoveries Write-offs direct Other movements in CAP Total
Individually assessed Collectively assessed
13bps
120bps
0
100
200
300
400
500
0
20
40
60
80
100
120
2008 2009 2010 2011 2012 2013 2014 1H15 2H15 1H16 2H16 1H17 2H17 1H18 2H18 1H19 2H19
Impairment charge to average loansannualised (lhs)
Stressed exposures to TCE (rhs)
Impairments
173 198 173 170
(174) (168) (150) (170)
430 428 418 535
15
(90) (108) (74)
444 368 333 461
1H18 2H18 1H19 2H19 1H18 2H18 1H19 2H19 1H18 2H18 1H19 2H19 1H18 2H18 1H19 2H19 1H18 2H18 1H19 2H19
1 1,2
1 1 2

Credit Quality
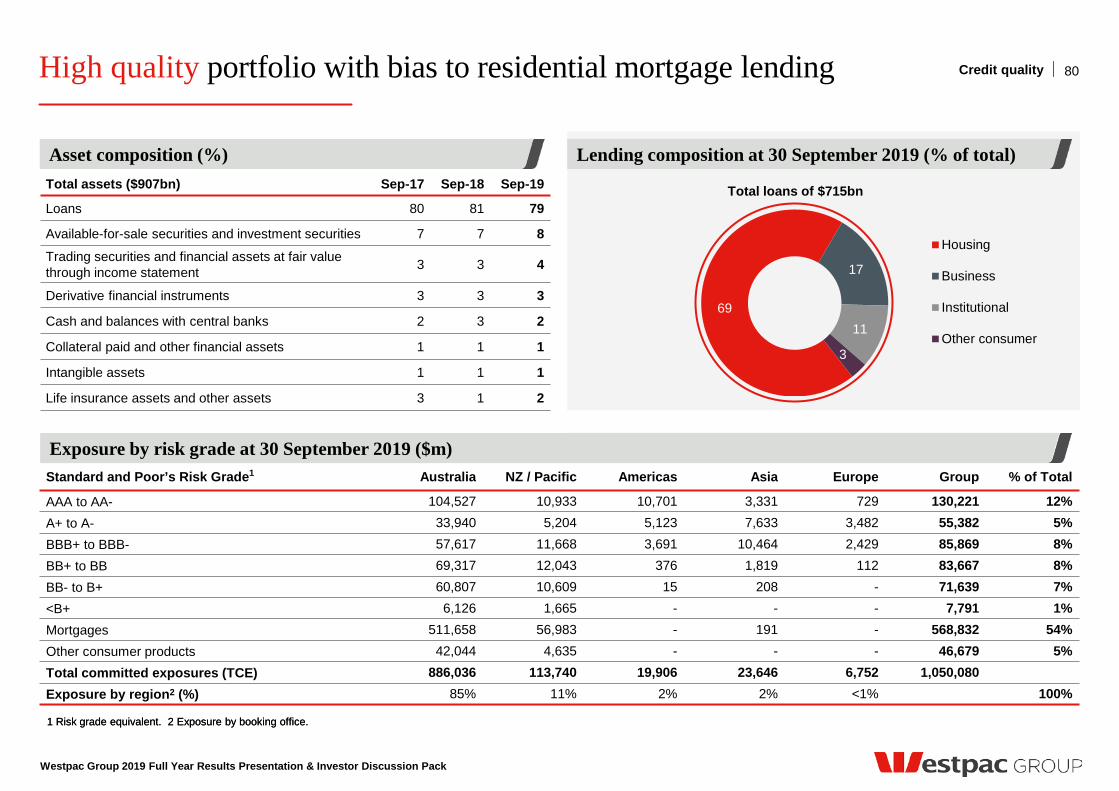
Standard and Poor’s Risk Grade1 Australia NZ / Pacific Americas Asia Europe Group % of Total
AAA to AA- 104,527 10,933 10,701 3,331 729 130,221 12% A+ to A- 33,940 5,204 5,123 7,633 3,482 55,382 5% BBB+ to BBB- 57,617 11,668 3,691 10,464 2,429 85,869 8% BB+ to BB 69,317 12,043 376 1,819 112 83,667 8% BB- to B+ 60,807 10,609 15 208 - 71,639 7% <B+ 6,126 1,665 - - - 7,791 1% Mortgages 511,658 56,983 - 191 - 568,832 54% Other consumer products 42,044 4,635 - - - 46,679 5% Total committed exposures (TCE) 886,036 113,740 19,906 23,646 6,752 1,050,080 Exposure by region2 (%) 85% 11% 2% 2% <1% 100%
High quality portfolio with bias to residential mortgage lending
Westpac Group 2019 Full Year Results Presentation & Investor Discussion Pack
1 Risk grade equivalent. 2 Exposure by booking office.
Lending composition at 30 September 2019 (% of total) Asset composition (%)
80 Credit quality
69
17
11
3
Housing
Business
Institutional
Other consumer
Total loans of $715bn
1 Risk grade equivalent. 2 Exposure by booking office.
Exposure by risk grade at 30 September 2019 ($m)
Total assets ($907bn) Sep-17 Sep-18 Sep-19
Loans 80 81 79
Available-for-sale securities and investment securities 7 7 8 Trading securities and financial assets at fair value through income statement 3 3 4
Derivative financial instruments 3 3 3
Cash and balances with central banks 2 3 2
Collateral paid and other financial assets 1 1 1
Intangible assets 1 1 1
Life insurance assets and other assets 3 1 2
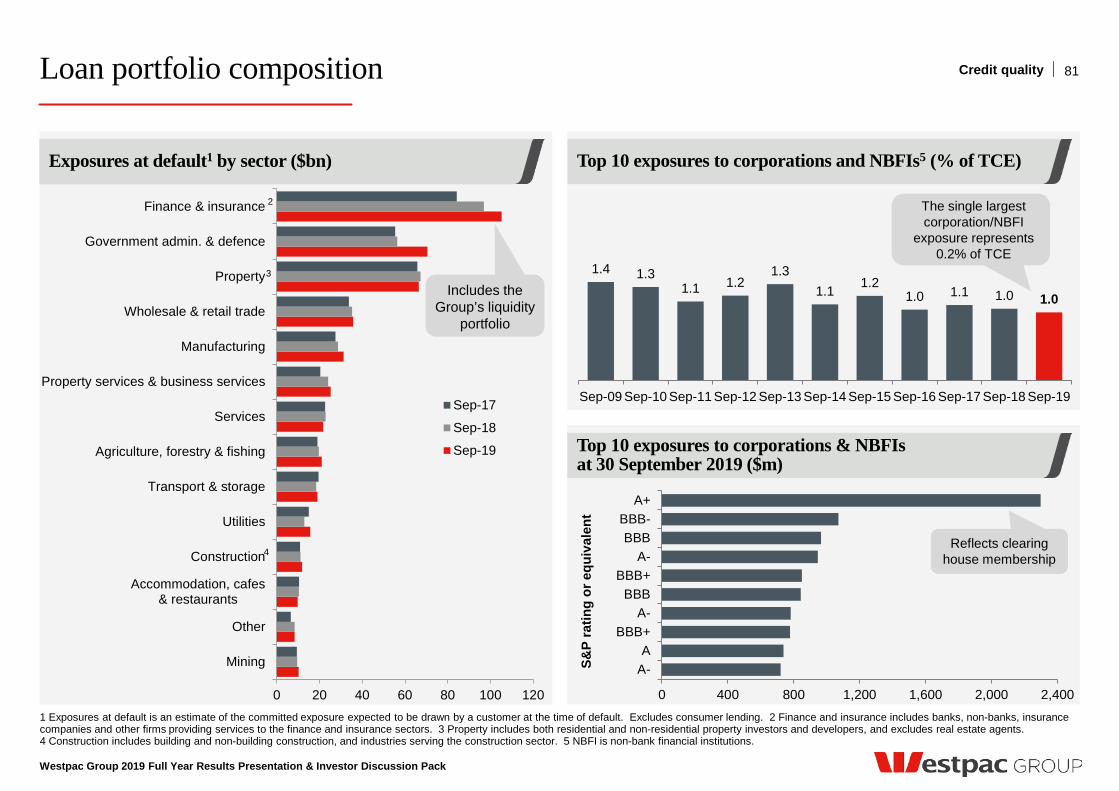
0 20 40 60 80 100 120
Mining
Other
Accommodation, cafes& restaurants
Construction
Utilities
Transport & storage
Agriculture, forestry & fishing
Services
Property services & business services
Manufacturing
Wholesale & retail trade
Property
Government admin. & defence
Finance & insurance
Sep-17
Sep-18
Sep-19
Loan portfolio composition
Westpac Group 2019 Full Year Results Presentation & Investor Discussion Pack
1 Exposures at default is an estimate of the committed exposure expected to be drawn by a customer at the time of default. Excludes consumer lending. 2 Finance and insurance includes banks, non-banks, insurance companies and other firms providing services to the finance and insurance sectors. 3 Property includes both residential and non-residential property investors and developers, and excludes real estate agents. 4 Construction includes building and non-building construction, and industries serving the construction sector. 5 NBFI is non-bank financial institutions.
1.4 1.3 1.1 1.2
1.3 1.1 1.2
1.0 1.1 1.0 1.0
Sep-09 Sep-10 Sep-11 Sep-12 Sep-13 Sep-14 Sep-15 Sep-16 Sep-17 Sep-18 Sep-19
Top 10 exposures to corporations and NBFIs5 (% of TCE)
Top 10 exposures to corporations & NBFIs at 30 September 2019 ($m)
81
Exposures at default1 by sector ($bn)
2
3
4
Credit quality
The single largest corporation/NBFI
exposure represents 0.2% of TCE
0 400 800 1,200 1,600 2,000 2,400
A-A
BBB+A-
BBBBBB+
A-BBB
BBB-A+
S&P
ratin
g or
equ
ival
ent
Includes the Group’s liquidity
portfolio
Reflects clearing house membership
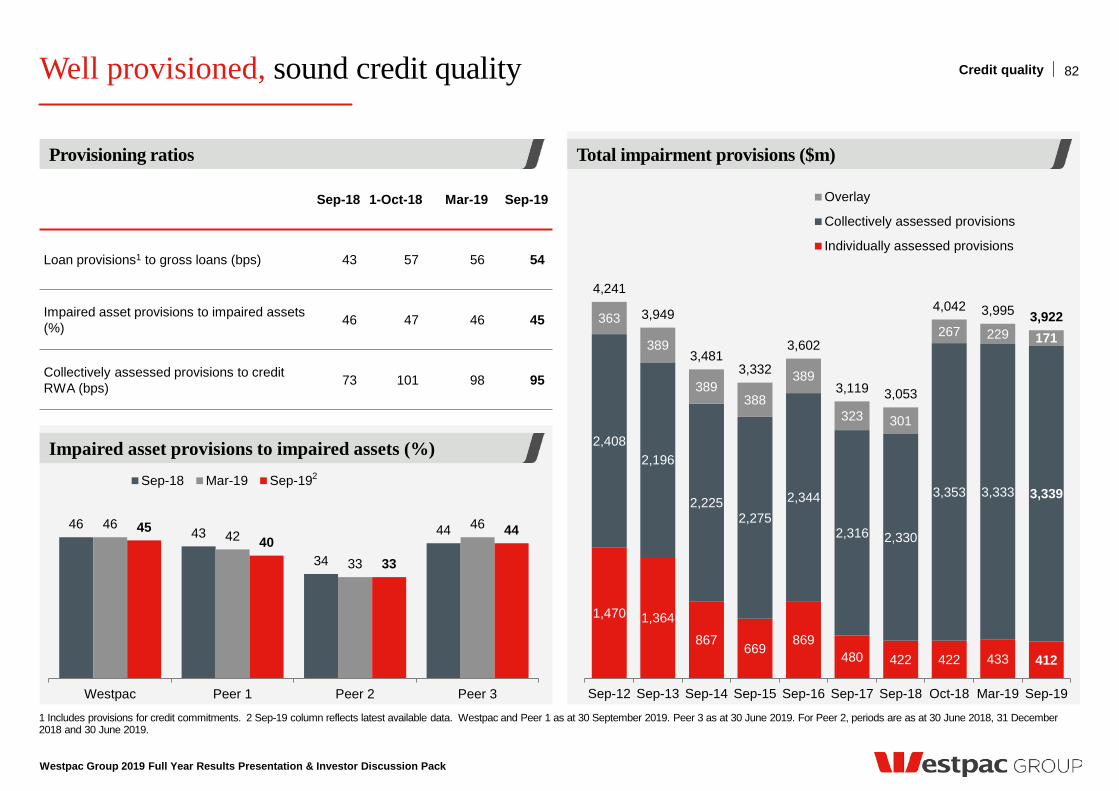
46 43
34
44 46 42
33
46 45 40
33
44
Westpac Peer 1 Peer 2 Peer 3
Sep-18 Mar-19 Sep-19
Well provisioned, sound credit quality
Westpac Group 2019 Full Year Results Presentation & Investor Discussion Pack
Provisioning ratios
Impaired asset provisions to impaired assets (%)
1 Includes provisions for credit commitments. 2 Sep-19 column reflects latest available data. Westpac and Peer 1 as at 30 September 2019. Peer 3 as at 30 June 2019. For Peer 2, periods are as at 30 June 2018, 31 December 2018 and 30 June 2019.
Total impairment provisions ($m)
82 Credit quality
Sep-18 1-Oct-18 Mar-19 Sep-19
Loan provisions1 to gross loans (bps) 43 57 56 54
Impaired asset provisions to impaired assets (%) 46 47 46 45
Collectively assessed provisions to credit RWA (bps) 73 101 98 95
1,470 1,364
867 669 869
480 422 422 433 412
2,408 2,196
2,225 2,275
2,344
2,316 2,330
3,353 3,333 3,339
363
389
389 388
389
323 301
267 229 171
4,241
3,949
3,481 3,332
3,602
3,119 3,053
4,042 3,995 3,922
Sep-12 Sep-13 Sep-14 Sep-15 Sep-16 Sep-17 Sep-18 Oct-18 Mar-19 Sep-19
Overlay
Collectively assessed provisions
Individually assessed provisions
2
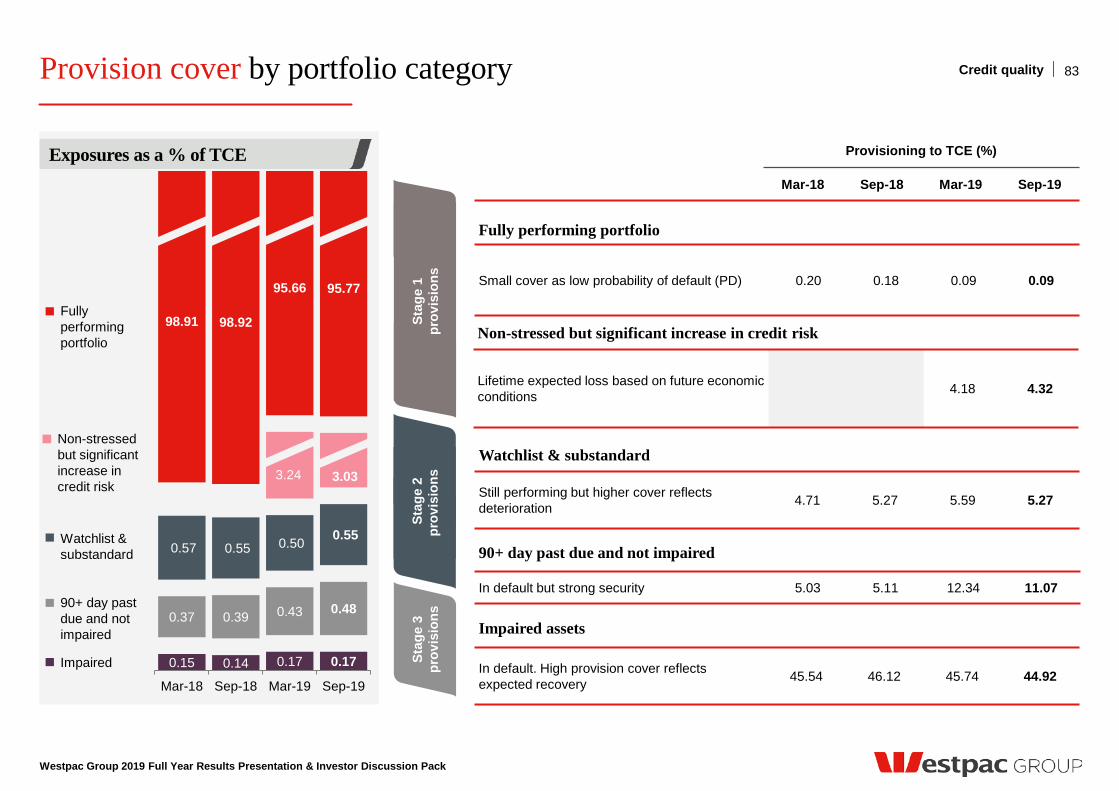
Provision cover by portfolio category
Westpac Group 2019 Full Year Results Presentation & Investor Discussion Pack
83
Exposures as a % of TCE
0.15 0.14 0.17 0.17
0.37 0.39 0.43 0.48
0.57 0.55 0.50 0.55
3.24 3.03
98.91 98.92
95.66 95.77
Mar-18 Sep-18 Mar-19 Sep-19
Fully performing portfolio
Watchlist & substandard
90+ day past due and not impaired
Impaired
Fully performing portfolio
Small cover as low probability of default (PD) 0.20 0.18 0.09 0.09
Provisioning to TCE (%)
Mar-18 Sep-18 Mar-19 Sep-19
Watchlist & substandard
Still performing but higher cover reflects deterioration 4.71 5.27 5.59 5.27
90+ day past due and not impaired
In default but strong security 5.03 5.11 12.34 11.07
Impaired assets
In default. High provision cover reflects expected recovery 45.54 46.12 45.74 44.92
Stag
e 3
prov
isio
ns
Credit quality
Sta
ge 2
pr
ovis
ions
St
age
1
prov
isio
ns
Non-stressed but significant increase in credit risk
Lifetime expected loss based on future economic conditions 4.18 4.32
Non-stressed but significant increase in credit risk
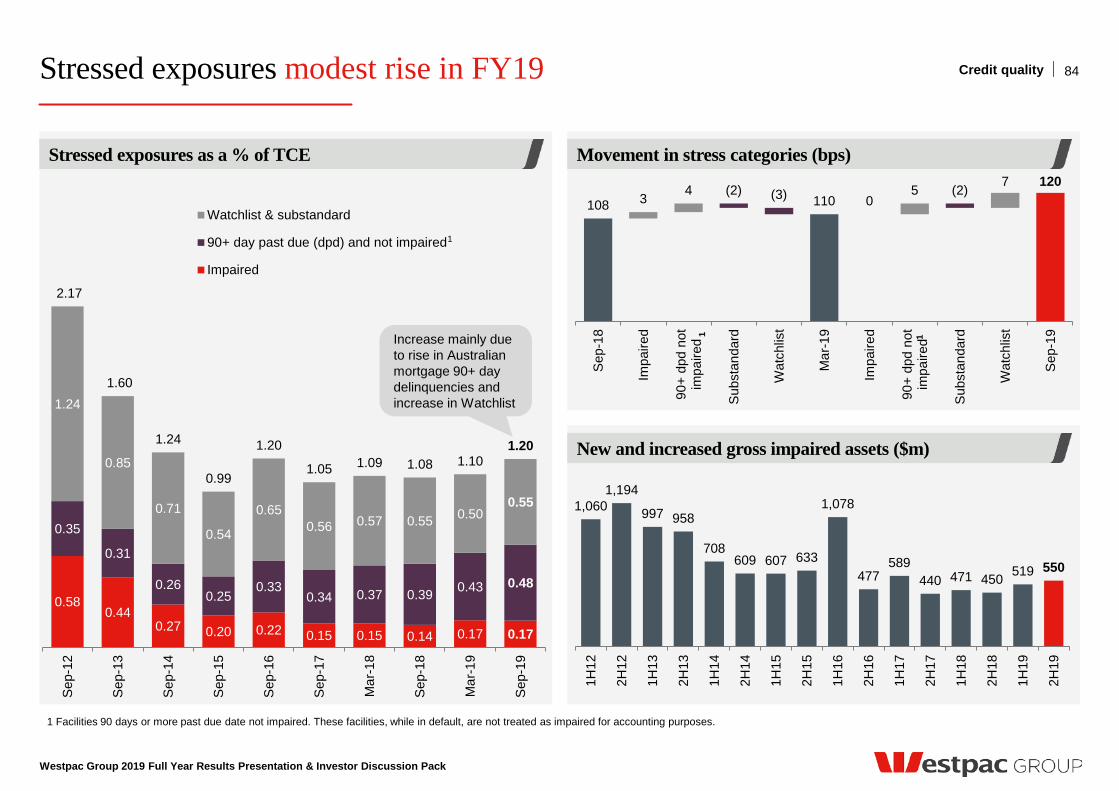
Stressed exposures modest rise in FY19
Westpac Group 2019 Full Year Results Presentation & Investor Discussion Pack
1 Facilities 90 days or more past due date not impaired. These facilities, while in default, are not treated as impaired for accounting purposes.
New and increased gross impaired assets ($m)
Movement in stress categories (bps) Stressed exposures as a % of TCE
84
108 3 4 (2) (3) 110 0 5 (2) 7 120
Sep
-18
Impa
ired
90+
dpd
not
impa
ired
Sub
stan
dard
Wat
chlis
t
Mar
-19
Impa
ired
90+
dpd
not
impa
ired
Sub
stan
dard
Wat
chlis
t
Sep
-19
1,060 1,194
997 958
708 609 607 633
1,078
477 589
440 471 450 519 550 1H
12
2H12
1H13
2H13
1H14
2H14
1H15
2H15
1H16
2H16
1H17
2H17
1H18
2H18
1H19
2H19
0.58 0.44
0.27 0.20 0.22 0.15 0.15 0.14 0.17 0.17
0.35
0.31
0.26 0.25
0.33 0.34 0.37 0.39 0.43 0.48
1.24
0.85
0.71
0.54
0.65 0.56 0.57 0.55 0.50
0.55
2.17
1.60
1.24
0.99
1.20
1.05 1.09 1.08 1.10 1.20
Sep
-12
Sep
-13
Sep
-14
Sep
-15
Sep
-16
Sep
-17
Mar
-18
Sep
-18
Mar
-19
Sep
-19
Watchlist & substandard
90+ day past due (dpd) and not impaired
Impaired
Increase mainly due to rise in Australian mortgage 90+ day delinquencies and increase in Watchlist
Credit quality
1 1
1
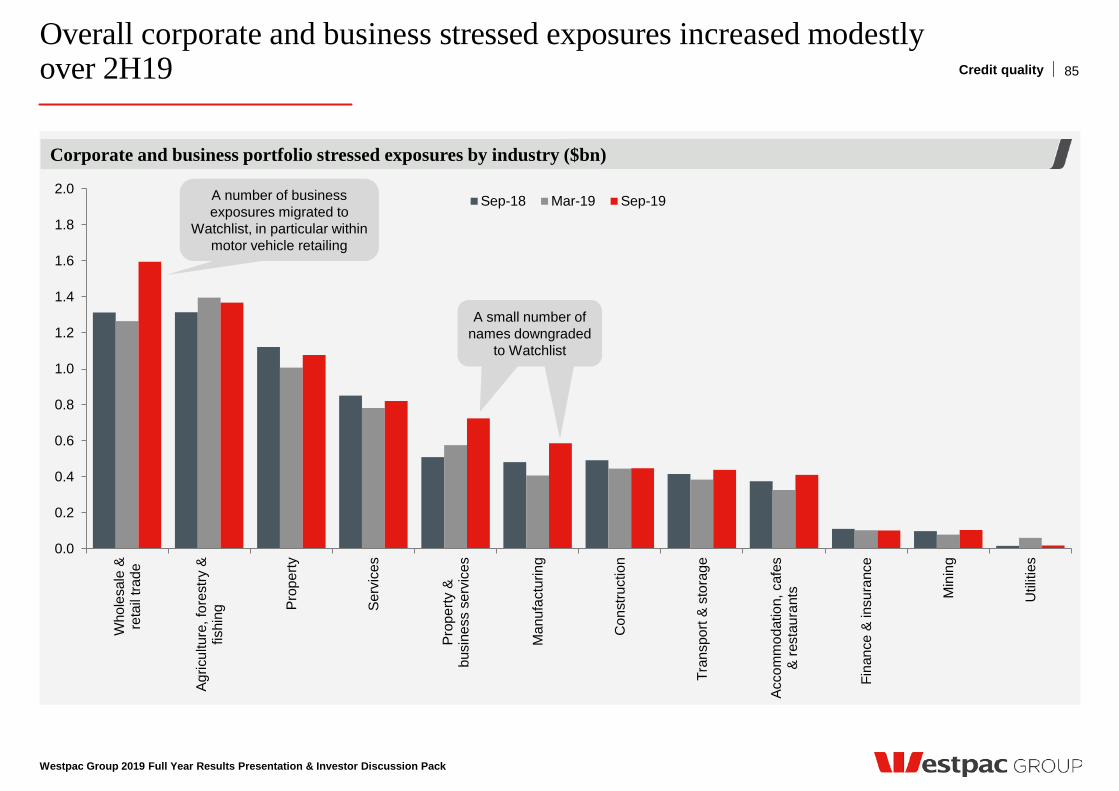
0.0
0.2
0.4
0.6
0.8
1.0
1.2
1.4
1.6
1.8
2.0
Who
lesa
le &
reta
il tra
de
Agric
ultu
re, f
ores
try &
fishi
ng
Prop
erty
Serv
ices
Prop
erty
&bu
sine
ss s
ervi
ces
Man
ufac
turin
g
Con
stru
ctio
n
Tran
spor
t & s
tora
ge
Acco
mm
odat
ion,
caf
es&
rest
aura
nts
Fina
nce
& in
sura
nce
Min
ing
Util
ities
Sep-18 Mar-19 Sep-19
Overall corporate and business stressed exposures increased modestly over 2H19
Westpac Group 2019 Full Year Results Presentation & Investor Discussion Pack
Corporate and business portfolio stressed exposures by industry ($bn)
85 Credit quality
A number of business exposures migrated to
Watchlist, in particular within motor vehicle retailing
A small number of names downgraded
to Watchlist
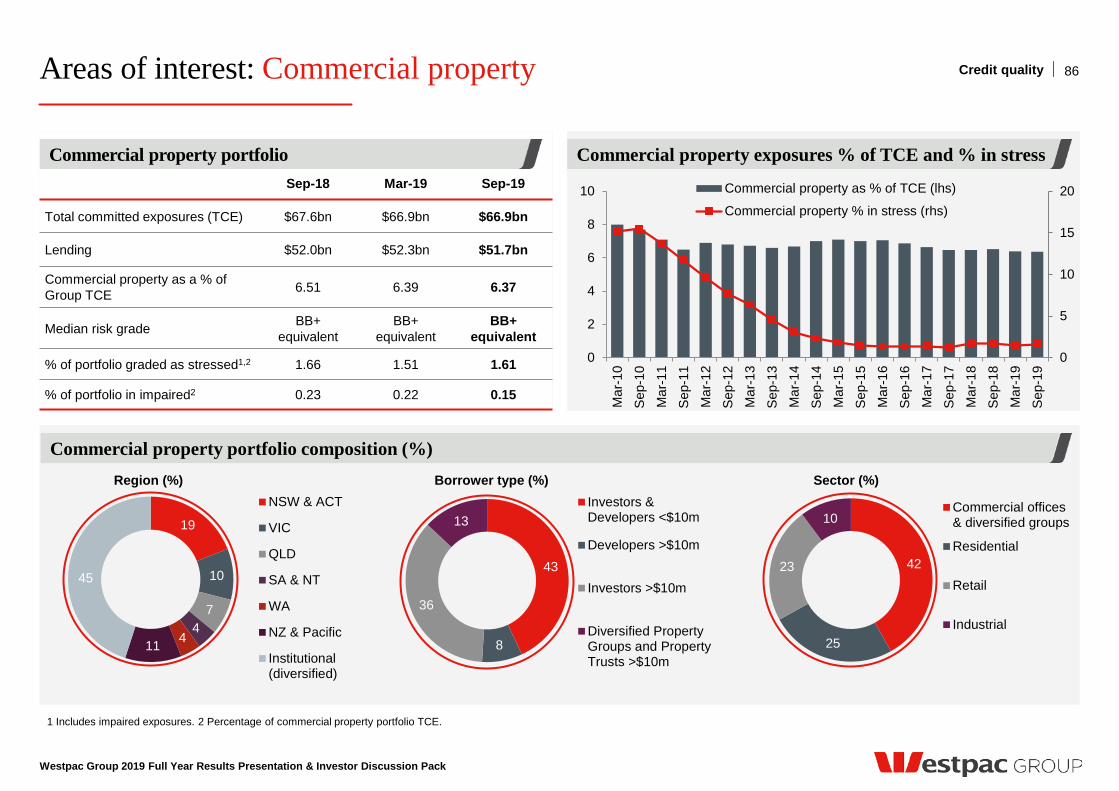
Areas of interest: Commercial property
Westpac Group 2019 Full Year Results Presentation & Investor Discussion Pack
1 Includes impaired exposures. 2 Percentage of commercial property portfolio TCE.
Commercial property portfolio composition (%)
Commercial property exposures % of TCE and % in stress Commercial property portfolio
86
0
5
10
15
20
0
2
4
6
8
10
Mar
-10
Sep
-10
Mar
-11
Sep
-11
Mar
-12
Sep
-12
Mar
-13
Sep
-13
Mar
-14
Sep
-14
Mar
-15
Sep
-15
Mar
-16
Sep
-16
Mar
-17
Sep
-17
Mar
-18
Sep
-18
Mar
-19
Sep
-19
Commercial property as % of TCE (lhs)
Commercial property % in stress (rhs)
Sep-18 Mar-19 Sep-19
Total committed exposures (TCE) $67.6bn $66.9bn $66.9bn
Lending $52.0bn $52.3bn $51.7bn
Commercial property as a % of Group TCE 6.51 6.39 6.37
Median risk grade BB+ equivalent
BB+ equivalent
BB+ equivalent
% of portfolio graded as stressed1,2 1.66 1.51 1.61
% of portfolio in impaired2 0.23 0.22 0.15
19
10
7 4
4 11
45
NSW & ACT
VIC
QLD
SA & NT
WA
NZ & Pacific
Institutional(diversified)
43
8
36
13 Investors &Developers <$10m
Developers >$10m
Investors >$10m
Diversified PropertyGroups and PropertyTrusts >$10m
42
25
23
10 Commercial offices& diversified groups
Residential
Retail
Industrial
Borrower type (%) Region (%) Sector (%)
Credit quality
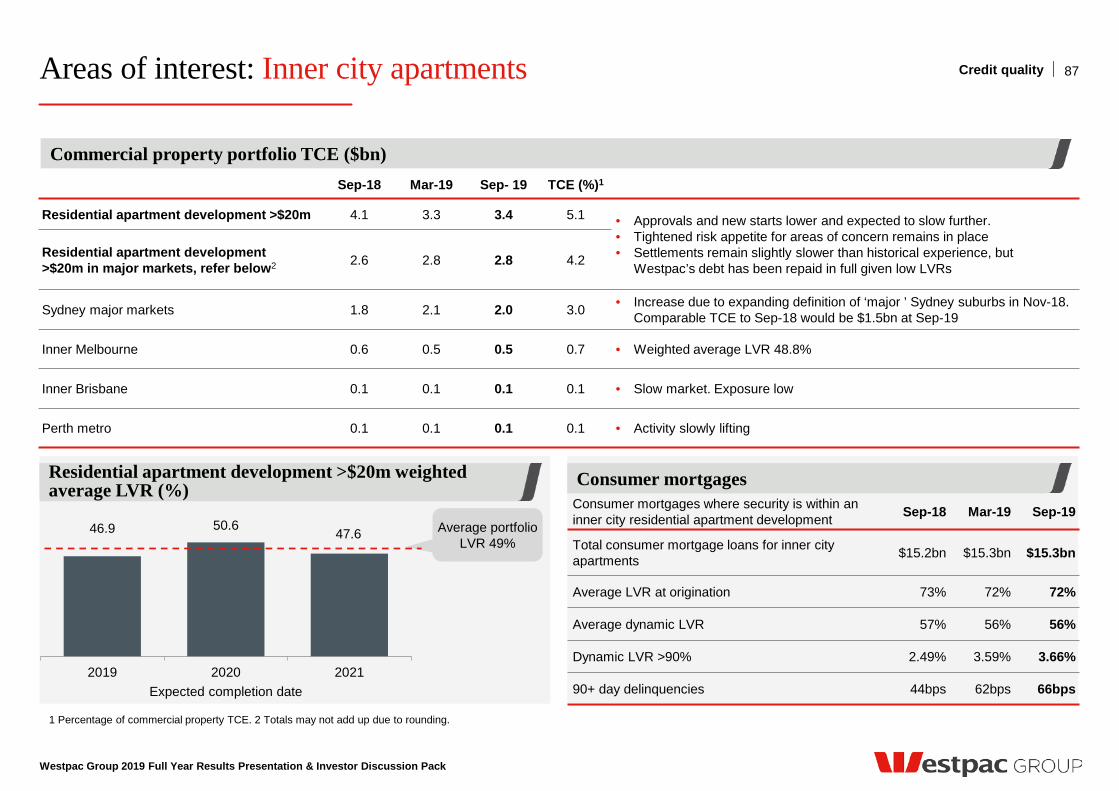
Areas of interest: Inner city apartments
Westpac Group 2019 Full Year Results Presentation & Investor Discussion Pack
87
1 Percentage of commercial property TCE. 2 Totals may not add up due to rounding.
Sep-18 Mar-19 Sep- 19 TCE (%)1
Residential apartment development >$20m 4.1 3.3 3.4 5.1 • Approvals and new starts lower and expected to slow further. • Tightened risk appetite for areas of concern remains in place • Settlements remain slightly slower than historical experience, but
Westpac’s debt has been repaid in full given low LVRs Residential apartment development >$20m in major markets, refer below2 2.6 2.8 2.8 4.2
Sydney major markets 1.8 2.1 2.0 3.0 • Increase due to expanding definition of ‘major ’ Sydney suburbs in Nov-18. Comparable TCE to Sep-18 would be $1.5bn at Sep-19
Inner Melbourne 0.6 0.5 0.5 0.7 • Weighted average LVR 48.8%
Inner Brisbane 0.1 0.1 0.1 0.1 • Slow market. Exposure low
Perth metro 0.1 0.1 0.1 0.1 • Activity slowly lifting
Consumer mortgages where security is within an inner city residential apartment development Sep-18 Mar-19 Sep-19
Total consumer mortgage loans for inner city apartments $15.2bn $15.3bn $15.3bn
Average LVR at origination 73% 72% 72%
Average dynamic LVR 57% 56% 56%
Dynamic LVR >90% 2.49% 3.59% 3.66%
90+ day delinquencies 44bps 62bps 66bps
Residential apartment development >$20m weighted average LVR (%) Consumer mortgages
Commercial property portfolio TCE ($bn)
46.9 50.6 47.6
2019 2020 2021Expected completion date
Credit quality
Average portfolio LVR 49%
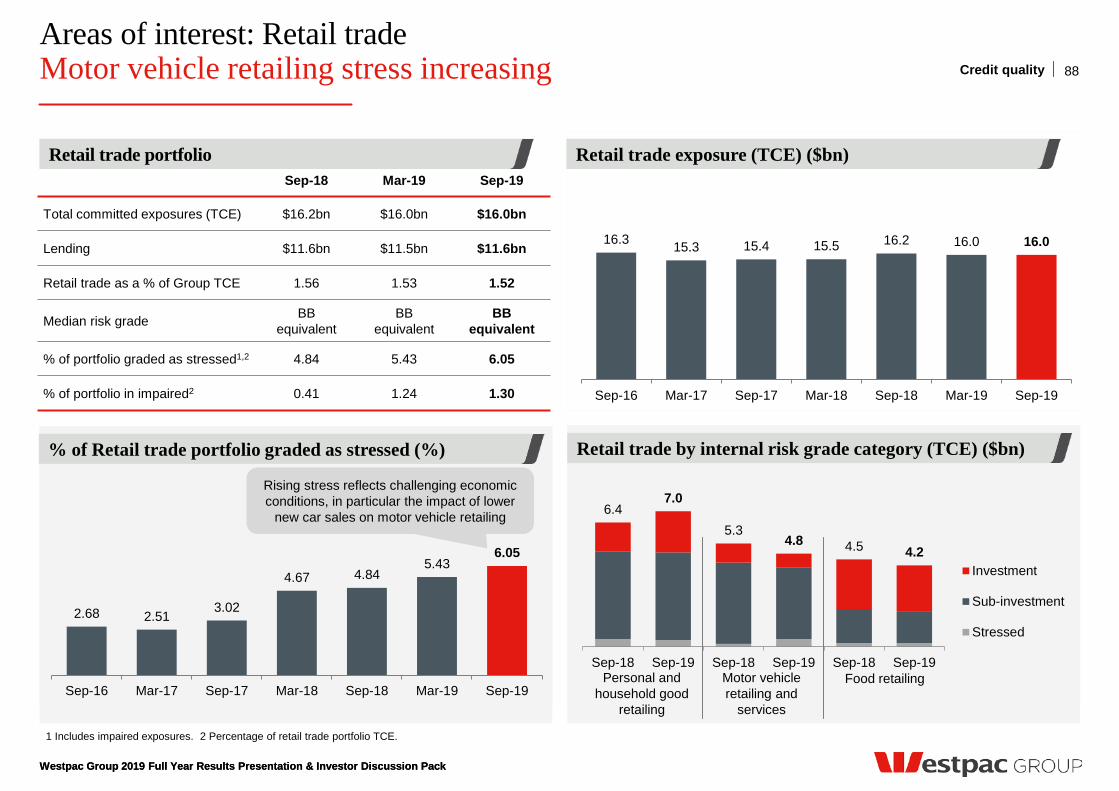
Areas of interest: Retail trade Motor vehicle retailing stress increasing
6.4 7.0
5.3 4.8 4.5 4.2
Sep-18 Sep-19 Sep-18 Sep-19 Sep-18 Sep-19
Investment
Sub-investment
Stressed
Retail trade by internal risk grade category (TCE) ($bn)
88
% of Retail trade portfolio graded as stressed (%)
Credit quality
Westpac Group 2019 Full Year Results Presentation & Investor Discussion Pack
1 Includes impaired exposures. 2 Percentage of retail trade portfolio TCE.
Sep-18 Mar-19 Sep-19
Total committed exposures (TCE) $16.2bn $16.0bn $16.0bn
Lending $11.6bn $11.5bn $11.6bn
Retail trade as a % of Group TCE 1.56 1.53 1.52
Median risk grade BB equivalent
BB equivalent
BB equivalent
% of portfolio graded as stressed1,2 4.84 5.43 6.05
% of portfolio in impaired2 0.41 1.24 1.30
Retail trade portfolio
16.3 15.3 15.4 15.5 16.2 16.0 16.0
Sep-16 Mar-17 Sep-17 Mar-18 Sep-18 Mar-19 Sep-19
2.68 2.51 3.02
4.67 4.84 5.43
6.05
Sep-16 Mar-17 Sep-17 Mar-18 Sep-18 Mar-19 Sep-19
Retail trade exposure (TCE) ($bn)
Rising stress reflects challenging economic conditions, in particular the impact of lower
new car sales on motor vehicle retailing
Personal and household good
retailing
Motor vehicle retailing and
services
Food retailing
Westpac Group 2019 Full Year Results Presentation & Investor Discussion Pack
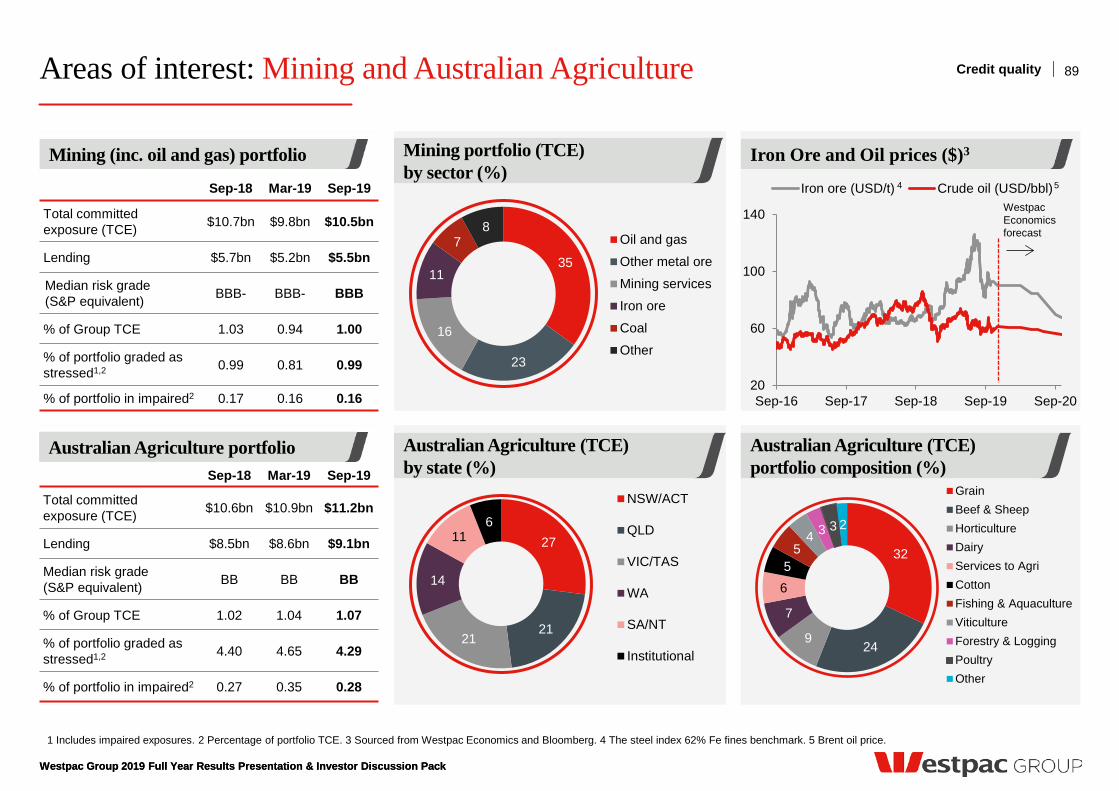
Areas of interest: Mining and Australian Agriculture
1 Includes impaired exposures. 2 Percentage of portfolio TCE. 3 Sourced from Westpac Economics and Bloomberg. 4 The steel index 62% Fe fines benchmark. 5 Brent oil price.
Australian Agriculture portfolio
Mining (inc. oil and gas) portfolio
89
Sep-18 Mar-19 Sep-19
Total committed exposure (TCE) $10.7bn $9.8bn $10.5bn
Lending $5.7bn $5.2bn $5.5bn
Median risk grade (S&P equivalent) BBB- BBB- BBB
% of Group TCE 1.03 0.94 1.00
% of portfolio graded as stressed1,2 0.99 0.81 0.99
% of portfolio in impaired2 0.17 0.16 0.16
Sep-18 Mar-19 Sep-19
Total committed exposure (TCE) $10.6bn $10.9bn $11.2bn
Lending $8.5bn $8.6bn $9.1bn
Median risk grade (S&P equivalent) BB BB BB
% of Group TCE 1.02 1.04 1.07
% of portfolio graded as stressed1,2 4.40 4.65 4.29
% of portfolio in impaired2 0.27 0.35 0.28
Credit quality
Iron Ore and Oil prices ($)3 Mining portfolio (TCE) by sector (%)
35
23
16
11
7 8
Oil and gas
Other metal ore
Mining services
Iron ore
Coal
Other
Australian Agriculture (TCE) by state (%)
Australian Agriculture (TCE) portfolio composition (%)
20
60
100
140
Sep-16 Sep-17 Sep-18 Sep-19 Sep-20
Iron ore (USD/t) Crude oil (USD/bbl)4 5
Westpac Economics forecast
Westpac Group 2019 Full Year Results Presentation & Investor Discussion Pack
27
21 21
14
11 6
NSW/ACT
QLD
VIC/TAS
WA
SA/NT
Institutional
32
24 9
7
6 5
5 4 3 3 2
GrainBeef & SheepHorticultureDairyServices to AgriCottonFishing & AquacultureViticultureForestry & LoggingPoultryOther
Westpac Group 2019 Full Year Results Presentation & Investor Discussion Pack
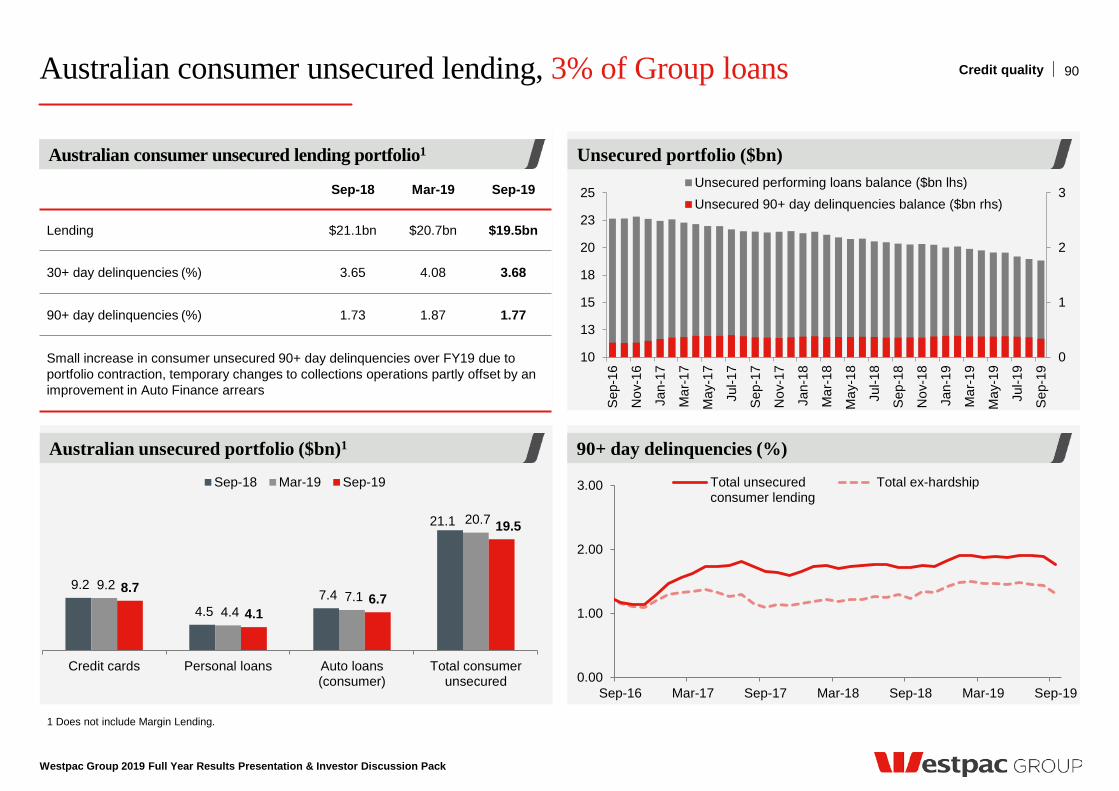
0.00
1.00
2.00
3.00
Sep-16 Mar-17 Sep-17 Mar-18 Sep-18 Mar-19 Sep-19
Total unsecuredconsumer lending
Total ex-hardship
Australian consumer unsecured lending, 3% of Group loans
Westpac Group 2019 Full Year Results Presentation & Investor Discussion Pack
90+ day delinquencies (%) Australian unsecured portfolio ($bn)1
1 Does not include Margin Lending.
90 Credit quality
Sep-18 Mar-19 Sep-19
Lending $21.1bn $20.7bn $19.5bn
30+ day delinquencies (%) 3.65 4.08 3.68
90+ day delinquencies (%) 1.73 1.87 1.77
Small increase in consumer unsecured 90+ day delinquencies over FY19 due to portfolio contraction, temporary changes to collections operations partly offset by an improvement in Auto Finance arrears
9.2
4.5 7.4
21.1
9.2
4.4 7.1
20.7
8.7
4.1 6.7
19.5
Credit cards Personal loans Auto loans(consumer)
Total consumerunsecured
Sep-18 Mar-19 Sep-19
Unsecured portfolio ($bn) Australian consumer unsecured lending portfolio1
0
1
2
3
10
13
15
18
20
23
25
Sep
-16
Nov
-16
Jan-
17
Mar
-17
May
-17
Jul-1
7
Sep
-17
Nov
-17
Jan-
18
Mar
-18
May
-18
Jul-1
8
Sep
-18
Nov
-18
Jan-
19
Mar
-19
May
-19
Jul-1
9
Sep
-19
Unsecured performing loans balance ($bn lhs)Unsecured 90+ day delinquencies balance ($bn rhs)
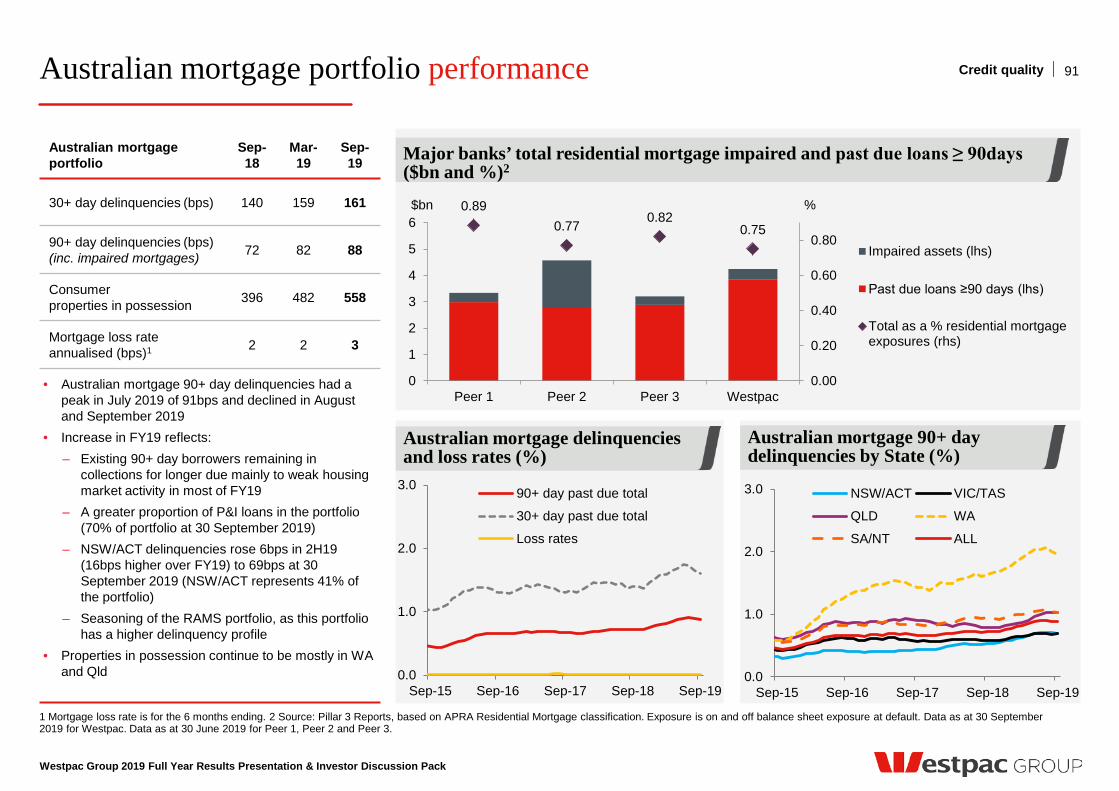
Westpac Group 2019 Full Year Results Presentation & Investor Discussion Pack
Australian mortgage portfolio performance 91 Credit quality
1 Mortgage loss rate is for the 6 months ending. 2 Source: Pillar 3 Reports, based on APRA Residential Mortgage classification. Exposure is on and off balance sheet exposure at default. Data as at 30 September 2019 for Westpac. Data as at 30 June 2019 for Peer 1, Peer 2 and Peer 3.
0.0
1.0
2.0
3.0
Sep-15 Sep-16 Sep-17 Sep-18 Sep-19
90+ day past due total
30+ day past due total
Loss rates
0.0
1.0
2.0
3.0
Sep-15 Sep-16 Sep-17 Sep-18 Sep-19
NSW/ACT VIC/TAS
QLD WA
SA/NT ALL
Australian mortgage portfolio
Sep-18
Mar-19
Sep-19
30+ day delinquencies (bps) 140 159 161
90+ day delinquencies (bps) (inc. impaired mortgages) 72 82 88
Consumer properties in possession 396 482 558
Mortgage loss rate annualised (bps)1 2 2 3
• Australian mortgage 90+ day delinquencies had a peak in July 2019 of 91bps and declined in August and September 2019
• Increase in FY19 reflects: – Existing 90+ day borrowers remaining in
collections for longer due mainly to weak housing market activity in most of FY19
– A greater proportion of P&I loans in the portfolio (70% of portfolio at 30 September 2019)
– NSW/ACT delinquencies rose 6bps in 2H19 (16bps higher over FY19) to 69bps at 30 September 2019 (NSW/ACT represents 41% of the portfolio)
– Seasoning of the RAMS portfolio, as this portfolio has a higher delinquency profile
• Properties in possession continue to be mostly in WA and Qld
0.89 0.77 0.82
0.75
0.00
0.20
0.40
0.60
0.80
0
1
2
3
4
5
6
Peer 1 Peer 2 Peer 3 Westpac
Impaired assets (lhs)
Past due loans ≥90 days (lhs)
Total as a % residential mortgageexposures (rhs)
Major banks’ total residential mortgage impaired and past due loans ≥ 90days ($bn and %)2
$bn %
Australian mortgage delinquencies and loss rates (%)
Australian mortgage 90+ day delinquencies by State (%)
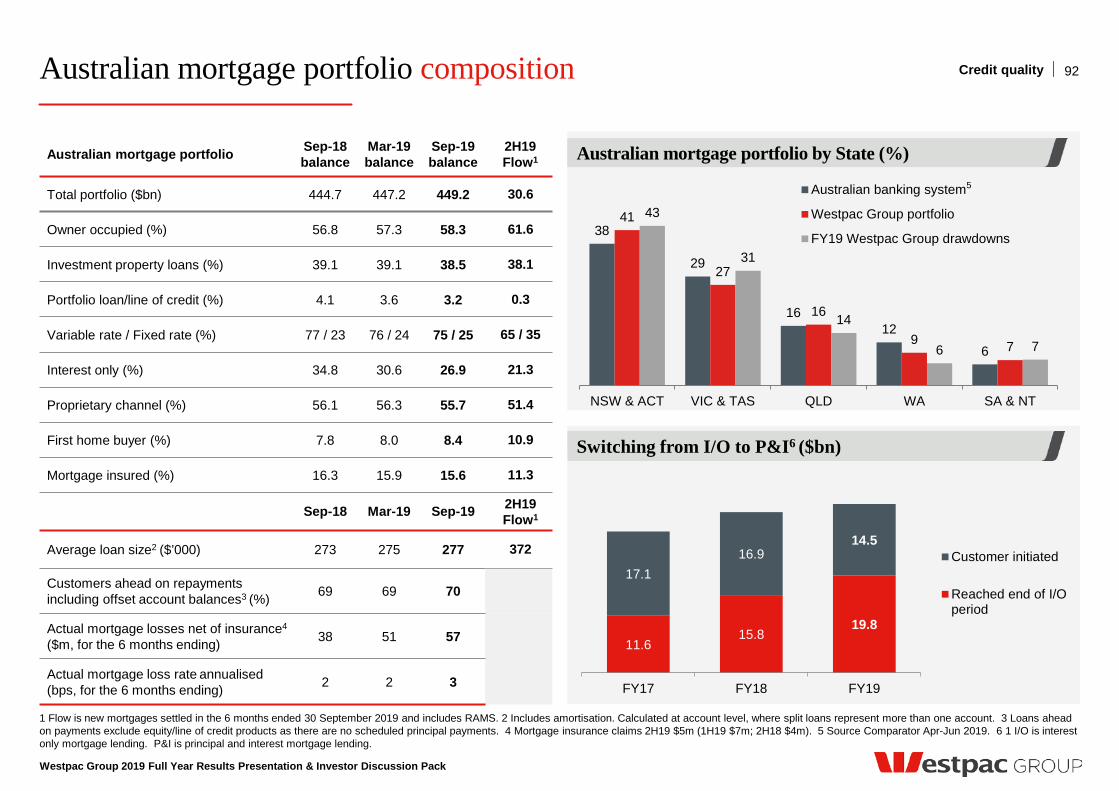
Australian mortgage portfolio composition
Westpac Group 2019 Full Year Results Presentation & Investor Discussion Pack
92 Credit quality
1 Flow is new mortgages settled in the 6 months ended 30 September 2019 and includes RAMS. 2 Includes amortisation. Calculated at account level, where split loans represent more than one account. 3 Loans ahead on payments exclude equity/line of credit products as there are no scheduled principal payments. 4 Mortgage insurance claims 2H19 $5m (1H19 $7m; 2H18 $4m). 5 Source Comparator Apr-Jun 2019. 6 1 I/O is interest only mortgage lending. P&I is principal and interest mortgage lending.
Australian mortgage portfolio Sep-18 balance
Mar-19 balance
Sep-19 balance
2H19 Flow1
Total portfolio ($bn) 444.7 447.2 449.2 30.6
Owner occupied (%) 56.8 57.3 58.3 61.6
Investment property loans (%) 39.1 39.1 38.5 38.1
Portfolio loan/line of credit (%) 4.1 3.6 3.2 0.3
Variable rate / Fixed rate (%) 77 / 23 76 / 24 75 / 25 65 / 35
Interest only (%) 34.8 30.6 26.9 21.3
Proprietary channel (%) 56.1 56.3 55.7 51.4
First home buyer (%) 7.8 8.0 8.4 10.9
Mortgage insured (%) 16.3 15.9 15.6 11.3
Sep-18 Mar-19 Sep-19 2H19 Flow1
Average loan size2 ($’000) 273 275 277 372
Customers ahead on repayments including offset account balances3 (%) 69 69 70
Actual mortgage losses net of insurance4
($m, for the 6 months ending) 38 51 57
Actual mortgage loss rate annualised (bps, for the 6 months ending) 2 2 3
Australian mortgage portfolio by State (%)
38
29
16 12
6
41
27
16
9 7
43
31
14
6 7
NSW & ACT VIC & TAS QLD WA SA & NT
Australian banking system
Westpac Group portfolio
FY19 Westpac Group drawdowns
5
Switching from I/O to P&I6 ($bn)
11.6 15.8
19.8
17.1 16.9
14.5
FY17 FY18 FY19
Customer initiated
Reached end of I/Operiod
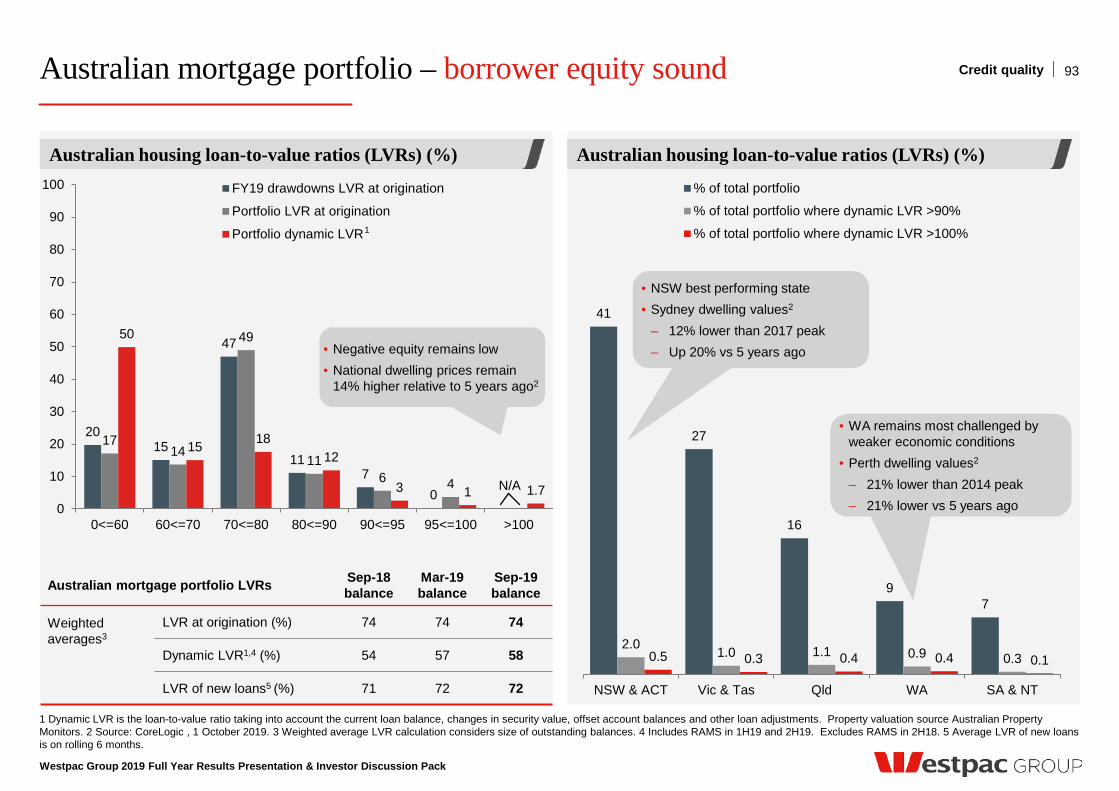
41
27
16
9 7
2.0 1.0 1.1 0.9 0.3 0.5 0.3 0.4 0.4 0.1
NSW & ACT Vic & Tas Qld WA SA & NT
% of total portfolio
% of total portfolio where dynamic LVR >90%
% of total portfolio where dynamic LVR >100%
Australian mortgage portfolio – borrower equity sound
Westpac Group 2019 Full Year Results Presentation & Investor Discussion Pack
93 Credit quality
1 Dynamic LVR is the loan-to-value ratio taking into account the current loan balance, changes in security value, offset account balances and other loan adjustments. Property valuation source Australian Property Monitors. 2 Source: CoreLogic , 1 October 2019. 3 Weighted average LVR calculation considers size of outstanding balances. 4 Includes RAMS in 1H19 and 2H19. Excludes RAMS in 2H18. 5 Average LVR of new loans is on rolling 6 months.
Australian housing loan-to-value ratios (LVRs) (%)
Australian mortgage portfolio LVRs Sep-18 balance
Mar-19 balance
Sep-19 balance
Weighted averages3
LVR at origination (%) 74 74 74
Dynamic LVR1,4 (%) 54 57 58
LVR of new loans5 (%) 71 72 72
20 15
47
11 7
0 N/A
17 14
49
11 6 4
50
15 18 12
3 1 1.7 0
10
20
30
40
50
60
70
80
90
100
0<=60 60<=70 70<=80 80<=90 90<=95 95<=100 >100
FY19 drawdowns LVR at origination
Portfolio LVR at origination
Portfolio dynamic LVR1
Australian housing loan-to-value ratios (LVRs) (%)
• WA remains most challenged by weaker economic conditions
• Perth dwelling values2 – 21% lower than 2014 peak – 21% lower vs 5 years ago
• NSW best performing state • Sydney dwelling values2
– 12% lower than 2017 peak
– Up 20% vs 5 years ago • Negative equity remains low • National dwelling prices remain
14% higher relative to 5 years ago2
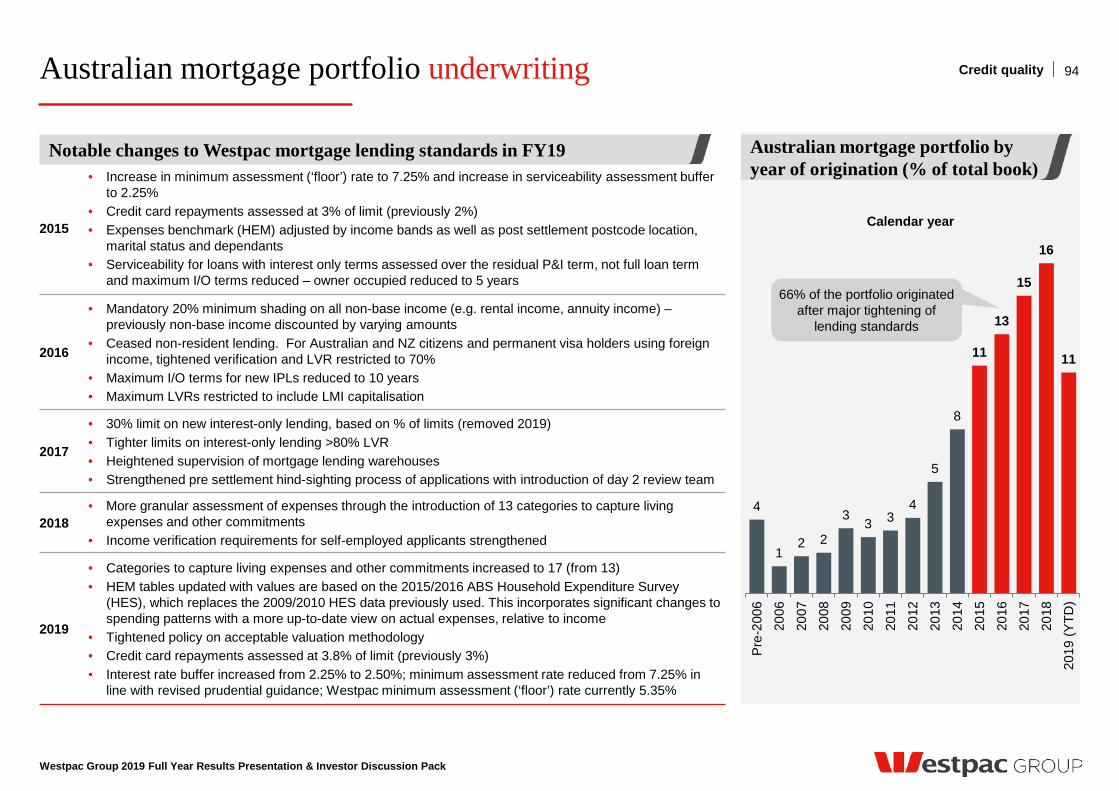
Australian mortgage portfolio underwriting
Westpac Group 2019 Full Year Results Presentation & Investor Discussion Pack
94 Credit quality
Notable changes to Westpac mortgage lending standards in FY19 Australian mortgage portfolio by year of origination (% of total book)
4
1 2 2
3 3 3 4
5
8
11
13
15
16
11
Pre
-200
6
2006
2007
2008
2009
2010
2011
2012
2013
2014
2015
2016
2017
2018
2019
(YTD
)
Calendar year
66% of the portfolio originated after major tightening of
lending standards
2015
• Increase in minimum assessment (‘floor’) rate to 7.25% and increase in serviceability assessment buffer to 2.25%
• Credit card repayments assessed at 3% of limit (previously 2%) • Expenses benchmark (HEM) adjusted by income bands as well as post settlement postcode location,
marital status and dependants • Serviceability for loans with interest only terms assessed over the residual P&I term, not full loan term
and maximum I/O terms reduced – owner occupied reduced to 5 years
2016
• Mandatory 20% minimum shading on all non-base income (e.g. rental income, annuity income) – previously non-base income discounted by varying amounts
• Ceased non-resident lending. For Australian and NZ citizens and permanent visa holders using foreign income, tightened verification and LVR restricted to 70%
• Maximum I/O terms for new IPLs reduced to 10 years • Maximum LVRs restricted to include LMI capitalisation
2017
• 30% limit on new interest-only lending, based on % of limits (removed 2019) • Tighter limits on interest-only lending >80% LVR • Heightened supervision of mortgage lending warehouses • Strengthened pre settlement hind-sighting process of applications with introduction of day 2 review team
2018 • More granular assessment of expenses through the introduction of 13 categories to capture living
expenses and other commitments • Income verification requirements for self-employed applicants strengthened
2019
• Categories to capture living expenses and other commitments increased to 17 (from 13) • HEM tables updated with values are based on the 2015/2016 ABS Household Expenditure Survey
(HES), which replaces the 2009/2010 HES data previously used. This incorporates significant changes to spending patterns with a more up-to-date view on actual expenses, relative to income
• Tightened policy on acceptable valuation methodology • Credit card repayments assessed at 3.8% of limit (previously 3%) • Interest rate buffer increased from 2.25% to 2.50%; minimum assessment rate reduced from 7.25% in
line with revised prudential guidance; Westpac minimum assessment (‘floor’) rate currently 5.35%
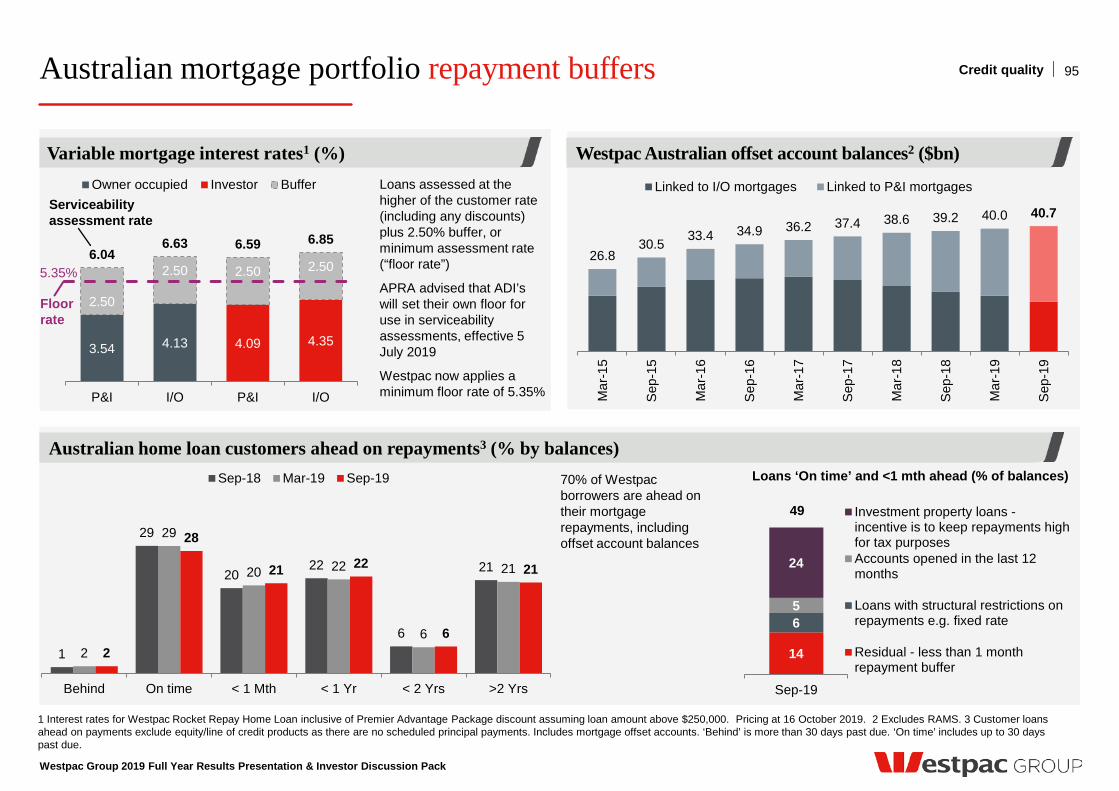
Australian mortgage portfolio repayment buffers
1 Interest rates for Westpac Rocket Repay Home Loan inclusive of Premier Advantage Package discount assuming loan amount above $250,000. Pricing at 16 October 2019. 2 Excludes RAMS. 3 Customer loans ahead on payments exclude equity/line of credit products as there are no scheduled principal payments. Includes mortgage offset accounts. ‘Behind’ is more than 30 days past due. ‘On time’ includes up to 30 days past due.
1
29
20 22
6
21
2
29
20 22
6
21
2
28
21 22
6
21
Behind On time < 1 Mth < 1 Yr < 2 Yrs >2 Yrs
Sep-18 Mar-19 Sep-19
Westpac Group 2019 Full Year Results Presentation & Investor Discussion Pack
95 Credit quality
Australian home loan customers ahead on repayments3 (% by balances) 70% of Westpac borrowers are ahead on their mortgage repayments, including offset account balances
Westpac Australian offset account balances2 ($bn)
14
6 5
24
Sep-19
Investment property loans -incentive is to keep repayments highfor tax purposesAccounts opened in the last 12months
Loans with structural restrictions onrepayments e.g. fixed rate
Residual - less than 1 monthrepayment buffer
Loans ‘On time’ and <1 mth ahead (% of balances)
49
26.8 30.5 33.4 34.9 36.2 37.4 38.6 39.2 40.0 40.7
Mar
-15
Sep
-15
Mar
-16
Sep
-16
Mar
-17
Sep
-17
Mar
-18
Sep
-18
Mar
-19
Sep
-19
Linked to I/O mortgages Linked to P&I mortgages .
3.54 4.13 4.09 4.35
2.50
2.50 2.50 2.50 6.04
6.63 6.59 6.85
P&I I/O P&I I/O
Owner occupied Investor Buffer .
Variable mortgage interest rates1 (%) Loans assessed at the higher of the customer rate (including any discounts) plus 2.50% buffer, or minimum assessment rate (“floor rate”)
APRA advised that ADI’s will set their own floor for use in serviceability assessments, effective 5 July 2019
Westpac now applies a minimum floor rate of 5.35%
Serviceability assessment rate
Floor rate
5.35%
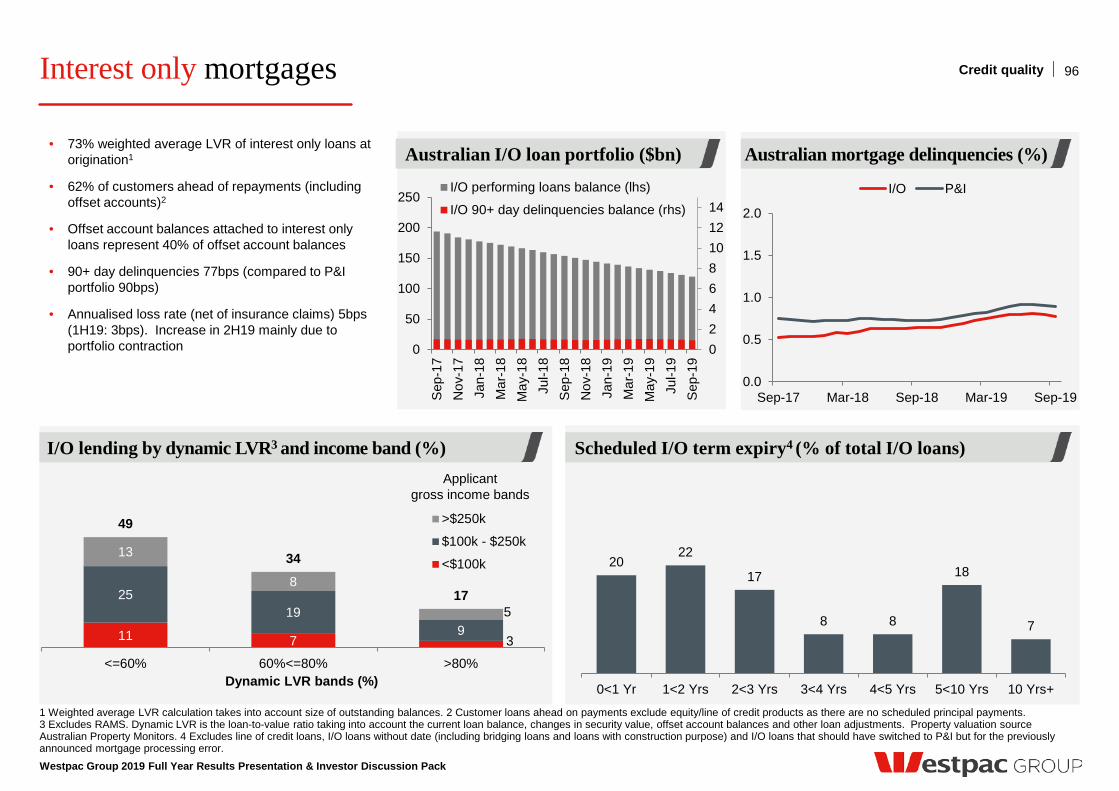
Westpac Group 2019 Full Year Results Presentation & Investor Discussion Pack
Interest only mortgages 96 Credit quality
1 Weighted average LVR calculation takes into account size of outstanding balances. 2 Customer loans ahead on payments exclude equity/line of credit products as there are no scheduled principal payments. 3 Excludes RAMS. Dynamic LVR is the loan-to-value ratio taking into account the current loan balance, changes in security value, offset account balances and other loan adjustments. Property valuation source Australian Property Monitors. 4 Excludes line of credit loans, I/O loans without date (including bridging loans and loans with construction purpose) and I/O loans that should have switched to P&I but for the previously announced mortgage processing error.
0.0
0.5
1.0
1.5
2.0
Sep-17 Mar-18 Sep-18 Mar-19 Sep-19
I/O P&I
Australian mortgage delinquencies (%) Australian I/O loan portfolio ($bn)
02468101214
0
50
100
150
200
250
Sep
-17
Nov
-17
Jan-
18M
ar-1
8M
ay-1
8Ju
l-18
Sep
-18
Nov
-18
Jan-
19M
ar-1
9M
ay-1
9Ju
l-19
Sep
-19
I/O performing loans balance (lhs)
I/O 90+ day delinquencies balance (rhs)
11 7 3
25 19
9
13
8
5
49
34
17
<=60% 60%<=80% >80%Dynamic LVR bands (%)
>$250k
$100k - $250k
<$100k
Applicant gross income bands
I/O lending by dynamic LVR3 and income band (%)
• 73% weighted average LVR of interest only loans at origination1
• 62% of customers ahead of repayments (including offset accounts)2
• Offset account balances attached to interest only loans represent 40% of offset account balances
• 90+ day delinquencies 77bps (compared to P&I portfolio 90bps)
• Annualised loss rate (net of insurance claims) 5bps (1H19: 3bps). Increase in 2H19 mainly due to portfolio contraction
Scheduled I/O term expiry4 (% of total I/O loans)
20 22
17
8 8
18
7
0<1 Yr 1<2 Yrs 2<3 Yrs 3<4 Yrs 4<5 Yrs 5<10 Yrs 10 Yrs+
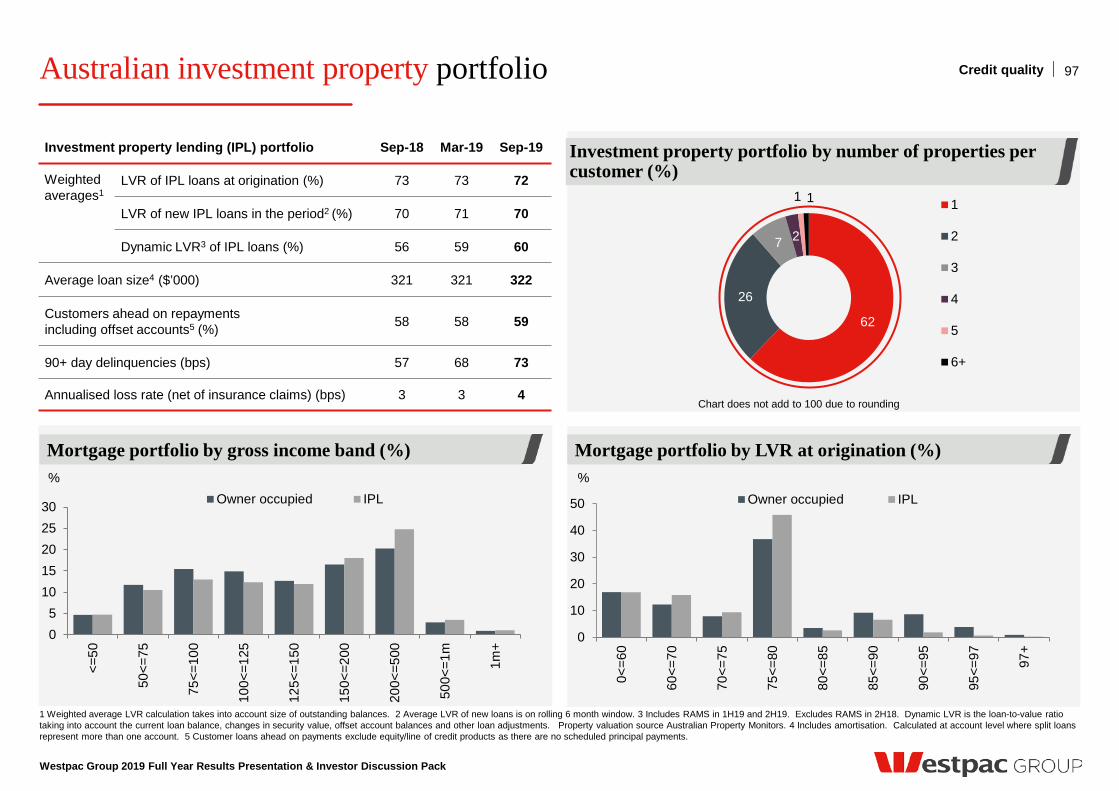
Westpac Group 2019 Full Year Results Presentation & Investor Discussion Pack
Australian investment property portfolio 97 Credit quality
1 Weighted average LVR calculation takes into account size of outstanding balances. 2 Average LVR of new loans is on rolling 6 month window. 3 Includes RAMS in 1H19 and 2H19. Excludes RAMS in 2H18. Dynamic LVR is the loan-to-value ratio taking into account the current loan balance, changes in security value, offset account balances and other loan adjustments. Property valuation source Australian Property Monitors. 4 Includes amortisation. Calculated at account level where split loans represent more than one account. 5 Customer loans ahead on payments exclude equity/line of credit products as there are no scheduled principal payments.
Investment property lending (IPL) portfolio Sep-18 Mar-19 Sep-19
Weighted averages1
LVR of IPL loans at origination (%) 73 73 72
LVR of new IPL loans in the period2 (%) 70 71 70
Dynamic LVR3 of IPL loans (%) 56 59 60
Average loan size4 ($’000) 321 321 322
Customers ahead on repayments including offset accounts5 (%) 58 58 59
90+ day delinquencies (bps) 57 68 73
Annualised loss rate (net of insurance claims) (bps) 3 3 4
0
10
20
30
40
50
0<=6
0
60<=
70
70<=
75
75<=
80
80<=
85
85<=
90
90<=
95
95<=
97 97+
Owner occupied IPL
05
1015202530
<=50
50<=
75
75<=
100
100<
=125
125<
=150
150<
=200
200<
=500
500<
=1m
1m+
Owner occupied IPL
Investment property portfolio by number of properties per customer (%)
62
26
7 2
1 1 1
2
3
4
5
6+
Chart does not add to 100 due to rounding
Mortgage portfolio by gross income band (%) Mortgage portfolio by LVR at origination (%) % %
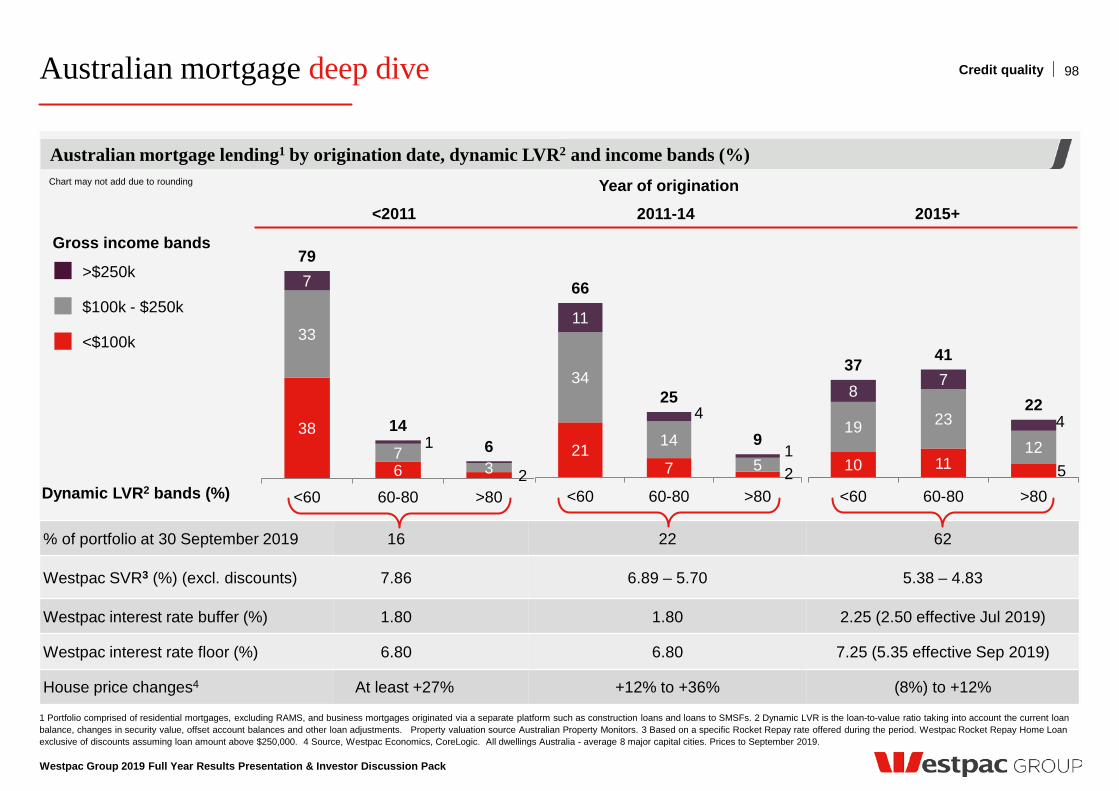
Australian mortgage deep dive
Westpac Group 2019 Full Year Results Presentation & Investor Discussion Pack
1 Portfolio comprised of residential mortgages, excluding RAMS, and business mortgages originated via a separate platform such as construction loans and loans to SMSFs. 2 Dynamic LVR is the loan-to-value ratio taking into account the current loan balance, changes in security value, offset account balances and other loan adjustments. Property valuation source Australian Property Monitors. 3 Based on a specific Rocket Repay rate offered during the period. Westpac Rocket Repay Home Loan exclusive of discounts assuming loan amount above $250,000. 4 Source, Westpac Economics, CoreLogic. All dwellings Australia - average 8 major capital cities. Prices to September 2019.
Australian mortgage lending1 by origination date, dynamic LVR2 and income bands (%)
98
21 7 2
34
14 5
11
4
1
66
25
9
<60 60-80 >80
38
6 2
33
7 3
7
1
79
14 6
<60 60-80 >80
10 11 5
19 23
12
8 7
4
37 41
22
<60 60-80 >80
% of portfolio at 30 September 2019 16 22 62
Westpac SVR3 (%) (excl. discounts) 7.86 6.89 – 5.70 5.38 – 4.83
Westpac interest rate buffer (%) 1.80 1.80 2.25 (2.50 effective Jul 2019)
Westpac interest rate floor (%) 6.80 6.80 7.25 (5.35 effective Sep 2019)
House price changes4 At least +27% +12% to +36% (8%) to +12%
<2011 2011-14 2015+
Dynamic LVR2 bands (%)
>$250k
$100k - $250k
<$100k
Gross income bands
Credit quality
Year of origination Chart may not add due to rounding
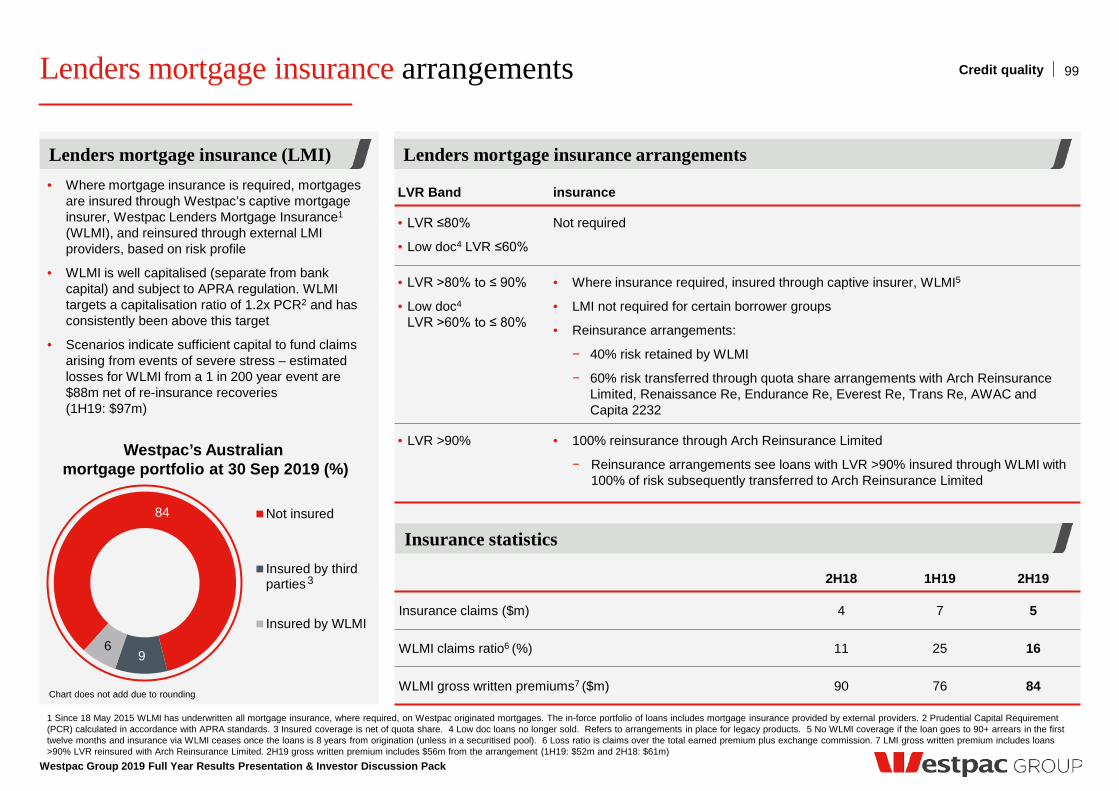
Lenders mortgage insurance arrangements
Westpac Group 2019 Full Year Results Presentation & Investor Discussion Pack
1 Since 18 May 2015 WLMI has underwritten all mortgage insurance, where required, on Westpac originated mortgages. The in-force portfolio of loans includes mortgage insurance provided by external providers. 2 Prudential Capital Requirement (PCR) calculated in accordance with APRA standards. 3 Insured coverage is net of quota share. 4 Low doc loans no longer sold. Refers to arrangements in place for legacy products. 5 No WLMI coverage if the loan goes to 90+ arrears in the first twelve months and insurance via WLMI ceases once the loans is 8 years from origination (unless in a securitised pool). 6 Loss ratio is claims over the total earned premium plus exchange commission. 7 LMI gross written premium includes loans >90% LVR reinsured with Arch Reinsurance Limited. 2H19 gross written premium includes $56m from the arrangement (1H19: $52m and 2H18: $61m)
Lenders mortgage insurance arrangements Lenders mortgage insurance (LMI)
99
LVR Band insurance
• LVR ≤80%
• Low doc4 LVR ≤60%
Not required
• LVR >80% to ≤ 90%
• Low doc4 LVR >60% to ≤ 80%
• Where insurance required, insured through captive insurer, WLMI5
• LMI not required for certain borrower groups
• Reinsurance arrangements:
− 40% risk retained by WLMI
− 60% risk transferred through quota share arrangements with Arch Reinsurance Limited, Renaissance Re, Endurance Re, Everest Re, Trans Re, AWAC and Capita 2232
• LVR >90% • 100% reinsurance through Arch Reinsurance Limited
− Reinsurance arrangements see loans with LVR >90% insured through WLMI with 100% of risk subsequently transferred to Arch Reinsurance Limited
2H18 1H19 2H19
Insurance claims ($m) 4 7 5
WLMI claims ratio6 (%) 11 25 16
WLMI gross written premiums7 ($m) 90 76 84
Insurance statistics
• Where mortgage insurance is required, mortgages are insured through Westpac’s captive mortgage insurer, Westpac Lenders Mortgage Insurance1
(WLMI), and reinsured through external LMI providers, based on risk profile
• WLMI is well capitalised (separate from bank capital) and subject to APRA regulation. WLMI targets a capitalisation ratio of 1.2x PCR2 and has consistently been above this target
• Scenarios indicate sufficient capital to fund claims arising from events of severe stress – estimated losses for WLMI from a 1 in 200 year event are $88m net of re-insurance recoveries (1H19: $97m)
Credit quality
84
9 6
Not insured
Insured by thirdparties
Insured by WLMI
Westpac’s Australian mortgage portfolio at 30 Sep 2019 (%)
3
Chart does not add due to rounding
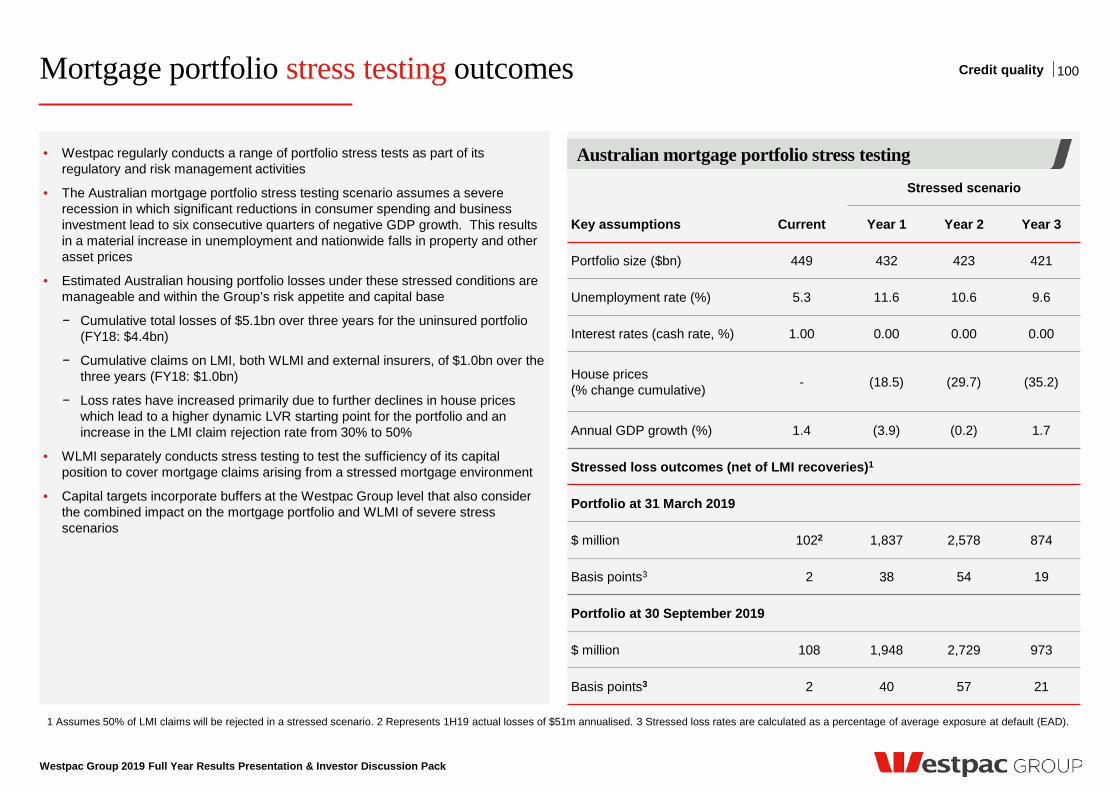
Mortgage portfolio stress testing outcomes
Westpac Group 2019 Full Year Results Presentation & Investor Discussion Pack
1 Assumes 50% of LMI claims will be rejected in a stressed scenario. 2 Represents 1H19 actual losses of $51m annualised. 3 Stressed loss rates are calculated as a percentage of average exposure at default (EAD).
100 Credit quality
Stressed scenario
Key assumptions Current Year 1 Year 2 Year 3
Portfolio size ($bn) 449 432 423 421
Unemployment rate (%) 5.3 11.6 10.6 9.6
Interest rates (cash rate, %) 1.00 0.00 0.00 0.00
House prices (% change cumulative) - (18.5) (29.7) (35.2)
Annual GDP growth (%) 1.4 (3.9) (0.2) 1.7
Stressed loss outcomes (net of LMI recoveries)1
Portfolio at 31 March 2019
$ million 1022 1,837 2,578 874
Basis points3 2 38 54 19
Portfolio at 30 September 2019
$ million 108 1,948 2,729 973
Basis points3 2 40 57 21
• Westpac regularly conducts a range of portfolio stress tests as part of its regulatory and risk management activities
• The Australian mortgage portfolio stress testing scenario assumes a severe recession in which significant reductions in consumer spending and business investment lead to six consecutive quarters of negative GDP growth. This results in a material increase in unemployment and nationwide falls in property and other asset prices
• Estimated Australian housing portfolio losses under these stressed conditions are manageable and within the Group’s risk appetite and capital base
− Cumulative total losses of $5.1bn over three years for the uninsured portfolio (FY18: $4.4bn)
− Cumulative claims on LMI, both WLMI and external insurers, of $1.0bn over the three years (FY18: $1.0bn)
− Loss rates have increased primarily due to further declines in house prices which lead to a higher dynamic LVR starting point for the portfolio and an increase in the LMI claim rejection rate from 30% to 50%
• WLMI separately conducts stress testing to test the sufficiency of its capital position to cover mortgage claims arising from a stressed mortgage environment
• Capital targets incorporate buffers at the Westpac Group level that also consider the combined impact on the mortgage portfolio and WLMI of severe stress scenarios
Australian mortgage portfolio stress testing

Capital, Funding and Liquidity
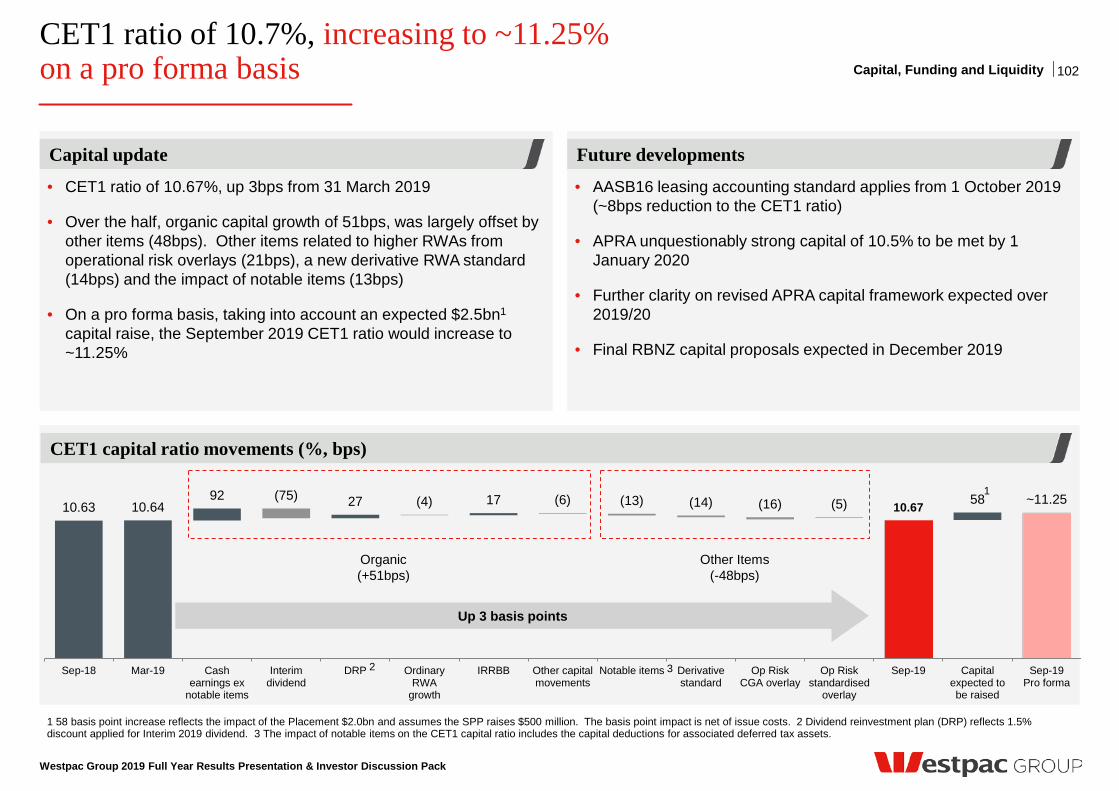
10.63 10.64 92 27 17 58 ~11.25 (75) (4) (6) (13) (14) (16) (5) 10.67
Sep-18 Mar-19 Cashearnings ex
notable items
Interimdividend
DRP OrdinaryRWA
growth
IRRBB Other capitalmovements
Notable items Derivativestandard
Op RiskCGA overlay
Op Riskstandardised
overlay
Sep-19 Capitalexpected tobe raised
Sep-19Pro forma
CET1 ratio of 10.7%, increasing to ~11.25% on a pro forma basis
Westpac Group 2019 Full Year Results Presentation & Investor Discussion Pack
1 58 basis point increase reflects the impact of the Placement $2.0bn and assumes the SPP raises $500 million. The basis point impact is net of issue costs. 2 Dividend reinvestment plan (DRP) reflects 1.5% discount applied for Interim 2019 dividend. 3 The impact of notable items on the CET1 capital ratio includes the capital deductions for associated deferred tax assets.
• AASB16 leasing accounting standard applies from 1 October 2019 (~8bps reduction to the CET1 ratio)
• APRA unquestionably strong capital of 10.5% to be met by 1 January 2020
• Further clarity on revised APRA capital framework expected over 2019/20
• Final RBNZ capital proposals expected in December 2019
• CET1 ratio of 10.67%, up 3bps from 31 March 2019
• Over the half, organic capital growth of 51bps, was largely offset by other items (48bps). Other items related to higher RWAs from operational risk overlays (21bps), a new derivative RWA standard (14bps) and the impact of notable items (13bps)
• On a pro forma basis, taking into account an expected $2.5bn1 capital raise, the September 2019 CET1 ratio would increase to ~11.25%
CET1 capital ratio movements (%, bps)
Future developments Capital update
102 Capital, Funding and Liquidity
Organic (+51bps)
Other Items (-48bps)
Up 3 basis points
2
1
3
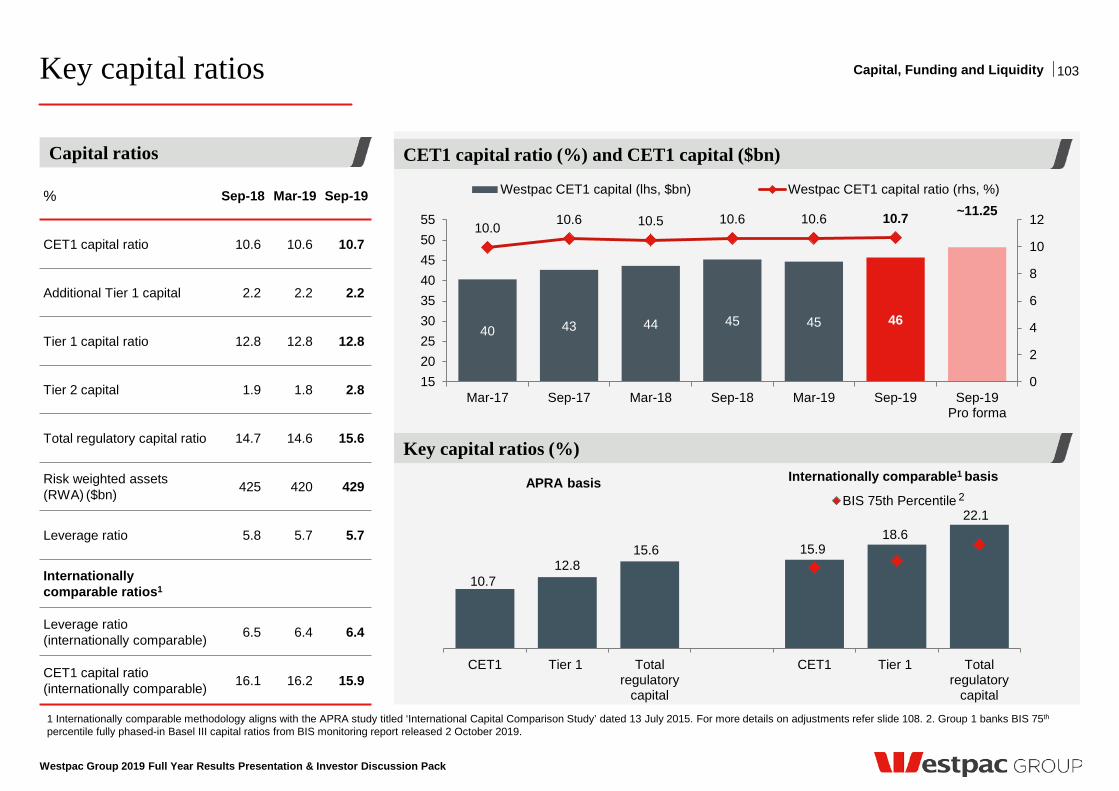
Key capital ratios
Westpac Group 2019 Full Year Results Presentation & Investor Discussion Pack
1 Internationally comparable methodology aligns with the APRA study titled ‘International Capital Comparison Study’ dated 13 July 2015. For more details on adjustments refer slide 108. 2. Group 1 banks BIS 75th percentile fully phased-in Basel III capital ratios from BIS monitoring report released 2 October 2019.
CET1 capital ratio (%) and CET1 capital ($bn)
Key capital ratios (%)
10.7 12.8
15.6 15.9 18.6
22.1
CET1 Tier 1 Totalregulatory
capital
CET1 Tier 1 Totalregulatory
capital
BIS 75th Percentile
103
40 43 44 45 45 46
10.0 10.6 10.5 10.6 10.6 10.7 ~11.25
0
2
4
6
8
10
12
152025303540455055
Mar-17 Sep-17 Mar-18 Sep-18 Mar-19 Sep-19 Sep-19Pro forma
Westpac CET1 capital (lhs, $bn) Westpac CET1 capital ratio (rhs, %)% Sep-18 Mar-19 Sep-19
CET1 capital ratio 10.6 10.6 10.7
Additional Tier 1 capital 2.2 2.2 2.2
Tier 1 capital ratio 12.8 12.8 12.8
Tier 2 capital 1.9 1.8 2.8
Total regulatory capital ratio 14.7 14.6 15.6
Risk weighted assets (RWA) ($bn) 425 420 429
Leverage ratio 5.8 5.7 5.7
Internationally comparable ratios1
Leverage ratio (internationally comparable) 6.5 6.4 6.4
CET1 capital ratio (internationally comparable) 16.1 16.2 15.9
APRA basis Internationally comparable1 basis
Capital, Funding and Liquidity
Capital ratios
2
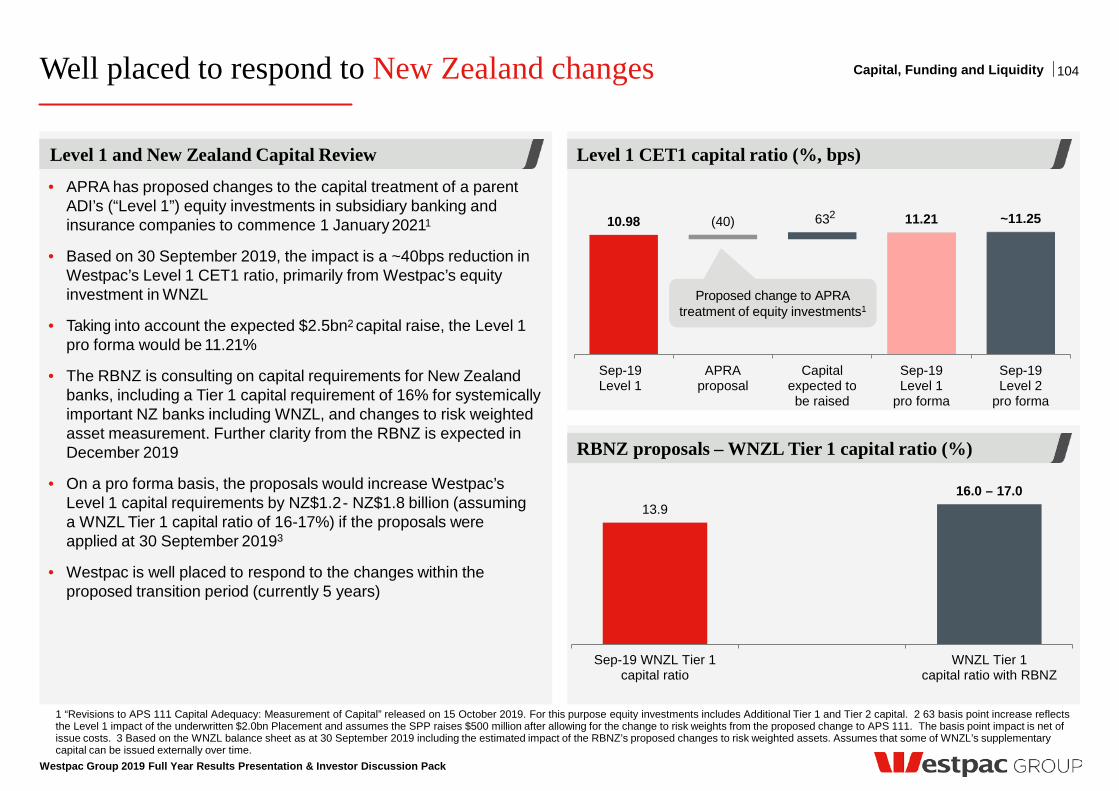
Well placed to respond to New Zealand changes
Westpac Group 2019 Full Year Results Presentation & Investor Discussion Pack
1 “Revisions to APS 111 Capital Adequacy: Measurement of Capital” released on 15 October 2019. For this purpose equity investments includes Additional Tier 1 and Tier 2 capital. 2 63 basis point increase reflects the Level 1 impact of the underwritten $2.0bn Placement and assumes the SPP raises $500 million after allowing for the change to risk weights from the proposed change to APS 111. The basis point impact is net of issue costs. 3 Based on the WNZL balance sheet as at 30 September 2019 including the estimated impact of the RBNZ’s proposed changes to risk weighted assets. Assumes that some of WNZL’s supplementary capital can be issued externally over time.
• APRA has proposed changes to the capital treatment of a parent ADI’s (“Level 1”) equity investments in subsidiary banking and insurance companies to commence 1 January 20211
• Based on 30 September 2019, the impact is a ~40bps reduction in Westpac’s Level 1 CET1 ratio, primarily from Westpac’s equity investment in WNZL
• Taking into account the expected $2.5bn2 capital raise, the Level 1 pro forma would be 11.21%
• The RBNZ is consulting on capital requirements for New Zealand banks, including a Tier 1 capital requirement of 16% for systemically important NZ banks including WNZL, and changes to risk weighted asset measurement. Further clarity from the RBNZ is expected in December 2019
• On a pro forma basis, the proposals would increase Westpac’s Level 1 capital requirements by NZ$1.2 - NZ$1.8 billion (assuming a WNZL Tier 1 capital ratio of 16-17%) if the proposals were applied at 30 September 20193
• Westpac is well placed to respond to the changes within the proposed transition period (currently 5 years)
RBNZ proposals – WNZL Tier 1 capital ratio (%)
Level 1 CET1 capital ratio (%, bps) Level 1 and New Zealand Capital Review
104
13.9 16.0 – 17.0
Sep-19 WNZL Tier 1capital ratio
WNZL Tier 1capital ratio with RBNZ
10.98 63 11.21 ~11.25 (40)
Sep-19Level 1
APRAproposal
Capitalexpected tobe raised
Sep-19Level 1
pro forma
Sep-19Level 2
pro forma
2
Proposed change to APRA treatment of equity investments1
Capital, Funding and Liquidity
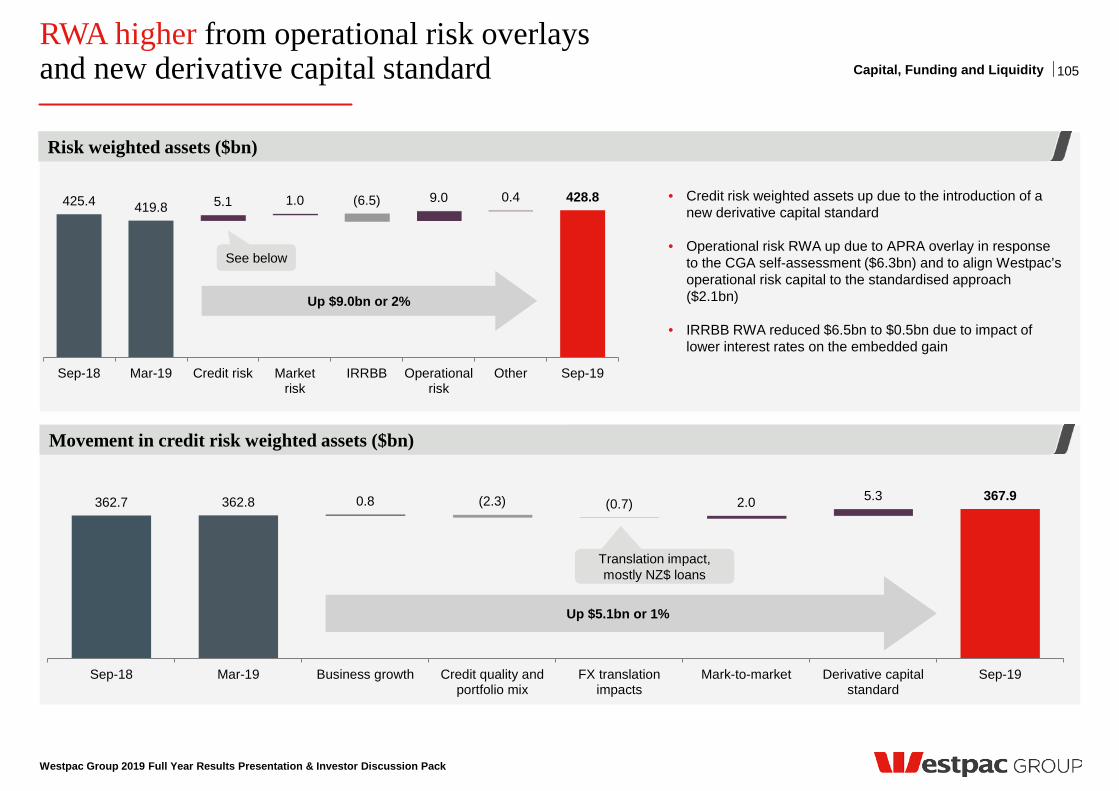
425.4 419.8 5.1 1.0 9.0 0.4 428.8 (6.5)
Sep-18 Mar-19 Credit risk Marketrisk
IRRBB Operationalrisk
Other Sep-19
Westpac Group 2019 Full Year Results Presentation & Investor Discussion Pack
Risk weighted assets ($bn)
Movement in credit risk weighted assets ($bn)
Capital, Funding and Liquidity
Up $9.0bn or 2%
362.7 362.8 0.8 2.0 5.3 367.9 (2.3) (0.7)
Sep-18 Mar-19 Business growth Credit quality andportfolio mix
FX translationimpacts
Mark-to-market Derivative capitalstandard
Sep-19
Up $5.1bn or 1%
See below
105
Translation impact, mostly NZ$ loans
RWA higher from operational risk overlays and new derivative capital standard
• Credit risk weighted assets up due to the introduction of a new derivative capital standard
• Operational risk RWA up due to APRA overlay in response
to the CGA self-assessment ($6.3bn) and to align Westpac’s operational risk capital to the standardised approach ($2.1bn)
• IRRBB RWA reduced $6.5bn to $0.5bn due to impact of lower interest rates on the embedded gain
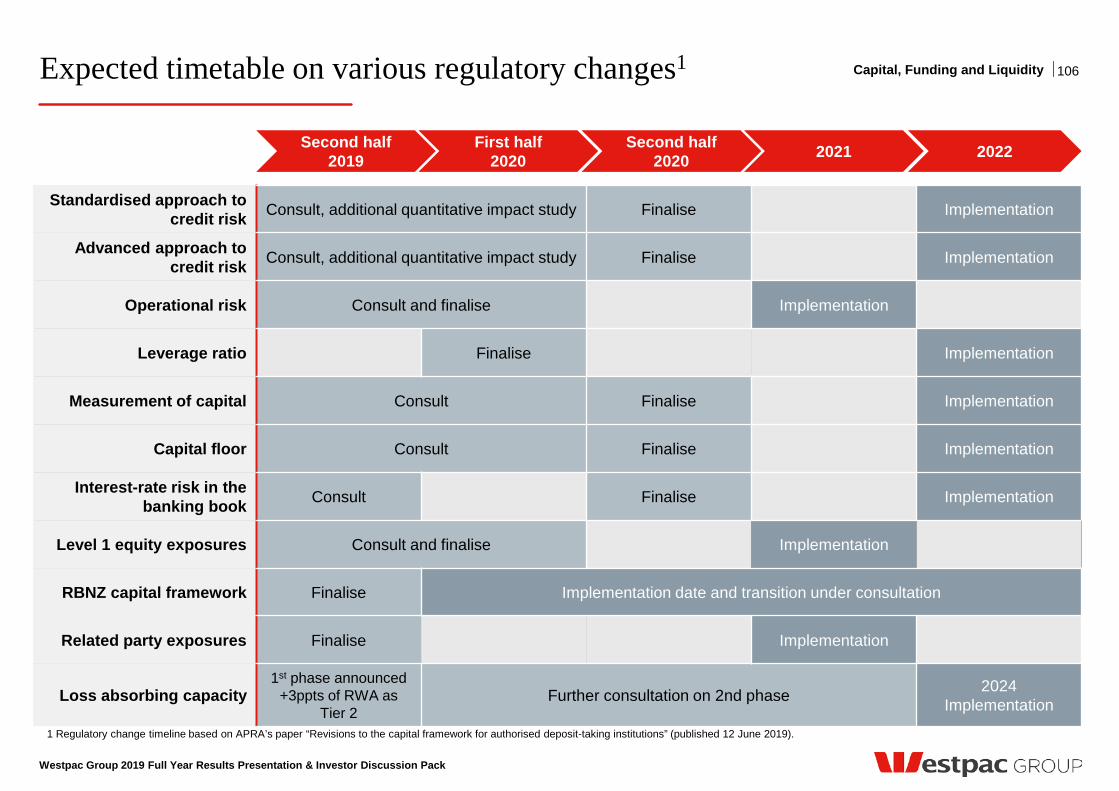
Expected timetable on various regulatory changes1
1 Regulatory change timeline based on APRA’s paper “Revisions to the capital framework for authorised deposit-taking institutions” (published 12 June 2019).
106
Westpac Group 2019 Full Year Results Presentation & Investor Discussion Pack
Standardised approach to credit risk Consult, additional quantitative impact study Finalise Implementation
Advanced approach to credit risk Consult, additional quantitative impact study Finalise Implementation
Operational risk Consult and finalise Implementation
Leverage ratio Finalise Implementation
Measurement of capital Consult Finalise Implementation
Capital floor Consult Finalise Implementation
Interest-rate risk in the banking book Consult Finalise Implementation
Level 1 equity exposures Consult and finalise Implementation
RBNZ capital framework Finalise Implementation date and transition under consultation
Related party exposures Finalise Implementation
Loss absorbing capacity 1st phase announced
+3ppts of RWA as Tier 2
Further consultation on 2nd phase 2024 Implementation
Capital, Funding and Liquidity
2022 First half 2020 2021 Second half
2020 Second half
2019
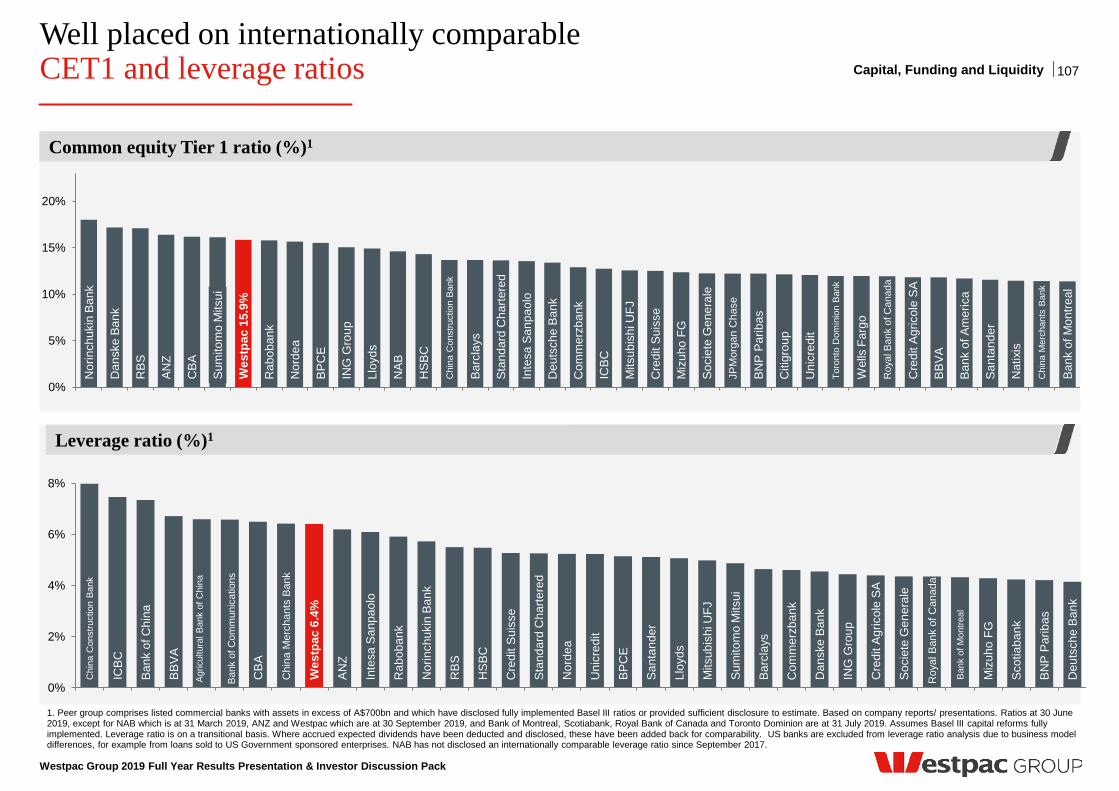
Well placed on internationally comparable CET1 and leverage ratios
Westpac Group 2019 Full Year Results Presentation & Investor Discussion Pack
1. Peer group comprises listed commercial banks with assets in excess of A$700bn and which have disclosed fully implemented Basel III ratios or provided sufficient disclosure to estimate. Based on company reports/ presentations. Ratios at 30 June 2019, except for NAB which is at 31 March 2019, ANZ and Westpac which are at 30 September 2019, and Bank of Montreal, Scotiabank, Royal Bank of Canada and Toronto Dominion are at 31 July 2019. Assumes Basel III capital reforms fully implemented. Leverage ratio is on a transitional basis. Where accrued expected dividends have been deducted and disclosed, these have been added back for comparability. US banks are excluded from leverage ratio analysis due to business model differences, for example from loans sold to US Government sponsored enterprises. NAB has not disclosed an internationally comparable leverage ratio since September 2017.
Common equity Tier 1 ratio (%)1
Leverage ratio (%)1
Capital, Funding and Liquidity 107 N
orin
chuk
in B
ank
Dan
ske
Ban
k
RB
S
AN
Z
CB
A
Sum
itom
o M
itsui
Wes
tpac
15.
9%
Rab
oban
k
Nor
dea
BP
CE
ING
Gro
up
Lloy
ds
NA
B
HS
BC
Chi
na C
onst
ruct
ion
Ban
k
Bar
clay
s
Sta
ndar
d C
harte
red
Inte
sa S
anpa
olo
Deu
tsch
e B
ank
Com
mer
zban
k
ICB
C
Mits
ubis
hi U
FJ
Cre
dit S
uiss
e
Miz
uho
FG
Soc
iete
Gen
eral
e
JPM
orga
n C
hase
BN
P P
arib
as
Citi
grou
p
Uni
cred
it
Toro
nto
Dom
inio
n B
ank
Wel
ls F
argo
Roy
al B
ank
of C
anad
a
Cre
dit A
gric
ole
SA
BB
VA
Ban
k of
Am
eric
a
San
tand
er
Nat
ixis
Chi
na M
erch
ants
Ban
k
Ban
k of
Mon
treal
0%
5%
10%
15%
20%
Chi
na C
onst
ruct
ion
Ban
k
ICB
C
Ban
k of
Chi
na
BB
VA
Agr
icul
tura
l Ban
k of
Chi
na
Ban
k of
Com
mun
icat
ions
CB
A
Chi
na M
erch
ants
Ban
k
Wes
tpac
6.4
%
AN
Z
Inte
sa S
anpa
olo
Rab
oban
k
Nor
inch
ukin
Ban
k
RB
S
HS
BC
Cre
dit S
uiss
e
Sta
ndar
d C
harte
red
Nor
dea
Uni
cred
it
BP
CE
San
tand
er
Lloy
ds
Mits
ubis
hi U
FJ
Sum
itom
o M
itsui
Bar
clay
s
Com
mer
zban
k
Dan
ske
Ban
k
ING
Gro
up
Cre
dit A
gric
ole
SA
Soc
iete
Gen
eral
e
Roy
al B
ank
of C
anad
a
Ban
k of
Mon
treal
Miz
uho
FG
Sco
tiaba
nk
BN
P P
arib
as
Deu
tsch
e B
ank
0%
2%
4%
6%
8%
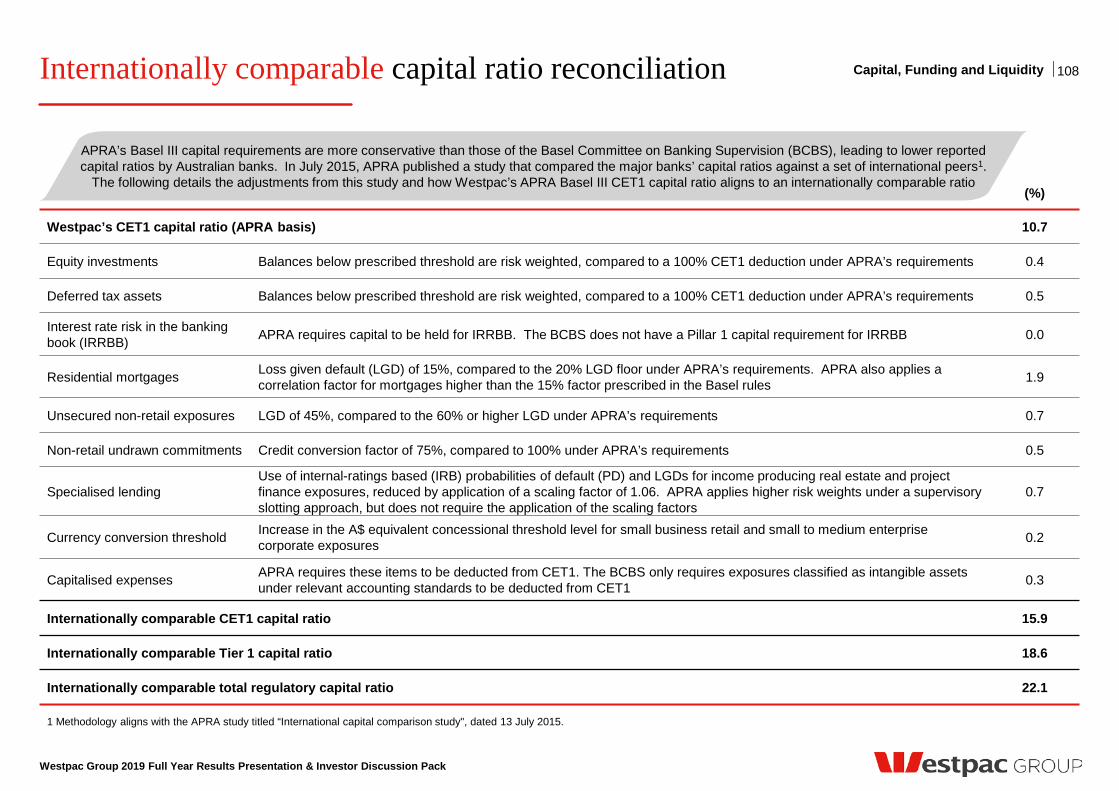
Internationally comparable capital ratio reconciliation
1 Methodology aligns with the APRA study titled “International capital comparison study", dated 13 July 2015.
Capital, Funding and Liquidity
(%)
Westpac’s CET1 capital ratio (APRA basis) 10.7
Equity investments Balances below prescribed threshold are risk weighted, compared to a 100% CET1 deduction under APRA’s requirements 0.4
Deferred tax assets Balances below prescribed threshold are risk weighted, compared to a 100% CET1 deduction under APRA’s requirements 0.5
Interest rate risk in the banking book (IRRBB) APRA requires capital to be held for IRRBB. The BCBS does not have a Pillar 1 capital requirement for IRRBB 0.0
Residential mortgages Loss given default (LGD) of 15%, compared to the 20% LGD floor under APRA’s requirements. APRA also applies a correlation factor for mortgages higher than the 15% factor prescribed in the Basel rules 1.9
Unsecured non-retail exposures LGD of 45%, compared to the 60% or higher LGD under APRA’s requirements 0.7
Non-retail undrawn commitments Credit conversion factor of 75%, compared to 100% under APRA’s requirements 0.5
Specialised lending Use of internal-ratings based (IRB) probabilities of default (PD) and LGDs for income producing real estate and project finance exposures, reduced by application of a scaling factor of 1.06. APRA applies higher risk weights under a supervisory slotting approach, but does not require the application of the scaling factors
0.7
Currency conversion threshold Increase in the A$ equivalent concessional threshold level for small business retail and small to medium enterprise corporate exposures 0.2
Capitalised expenses APRA requires these items to be deducted from CET1. The BCBS only requires exposures classified as intangible assets under relevant accounting standards to be deducted from CET1 0.3
Internationally comparable CET1 capital ratio 15.9
Internationally comparable Tier 1 capital ratio 18.6
Internationally comparable total regulatory capital ratio 22.1
APRA’s Basel III capital requirements are more conservative than those of the Basel Committee on Banking Supervision (BCBS), leading to lower reported capital ratios by Australian banks. In July 2015, APRA published a study that compared the major banks’ capital ratios against a set of international peers1.
The following details the adjustments from this study and how Westpac’s APRA Basel III CET1 capital ratio aligns to an internationally comparable ratio
Westpac Group 2019 Full Year Results Presentation & Investor Discussion Pack
108
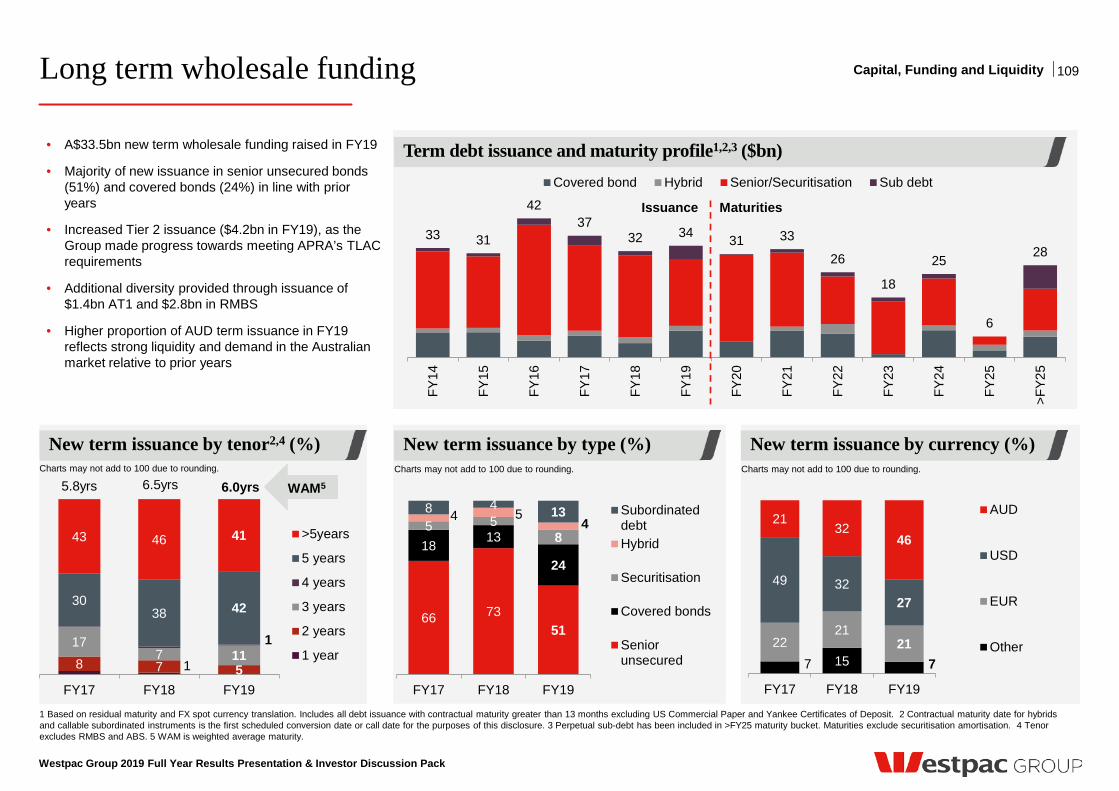
Long term wholesale funding 109
Westpac Group 2019 Full Year Results Presentation & Investor Discussion Pack
1 Based on residual maturity and FX spot currency translation. Includes all debt issuance with contractual maturity greater than 13 months excluding US Commercial Paper and Yankee Certificates of Deposit. 2 Contractual maturity date for hybrids and callable subordinated instruments is the first scheduled conversion date or call date for the purposes of this disclosure. 3 Perpetual sub-debt has been included in >FY25 maturity bucket. Maturities exclude securitisation amortisation. 4 Tenor excludes RMBS and ABS. 5 WAM is weighted average maturity.
1 8 7 5
17 7 11
1
30 38 42
43 46 41
FY17 FY18 FY19
>5years
5 years
4 years
3 years
2 years
1 year
5.8yrs
New term issuance by tenor2,4 (%)
6.5yrs WAM5
New term issuance by type (%) New term issuance by currency (%)
66 73 51
18 13
24
5 5 8
4 5 4
8 4 13
FY17 FY18 FY19
SubordinateddebtHybrid
Securitisation
Covered bonds
Seniorunsecured 7 15 7
22 21
21
49 32 27
21 32
46
FY17 FY18 FY19
AUD
USD
EUR
Other
Capital, Funding and Liquidity
Charts may not add to 100 due to rounding. Charts may not add to 100 due to rounding. Charts may not add to 100 due to rounding.
6.0yrs
33 31
42 37
32 34 31 33
26
18
25
6
28
FY14
FY15
FY16
FY17
FY18
FY19
FY20
FY21
FY22
FY23
FY24
FY25
>FY2
5
Covered bond Hybrid Senior/Securitisation Sub debt
Issuance Maturities
Term debt issuance and maturity profile1,2,3 ($bn) • A$33.5bn new term wholesale funding raised in FY19
• Majority of new issuance in senior unsecured bonds (51%) and covered bonds (24%) in line with prior years
• Increased Tier 2 issuance ($4.2bn in FY19), as the Group made progress towards meeting APRA’s TLAC requirements
• Additional diversity provided through issuance of $1.4bn AT1 and $2.8bn in RMBS
• Higher proportion of AUD term issuance in FY19 reflects strong liquidity and demand in the Australian market relative to prior years
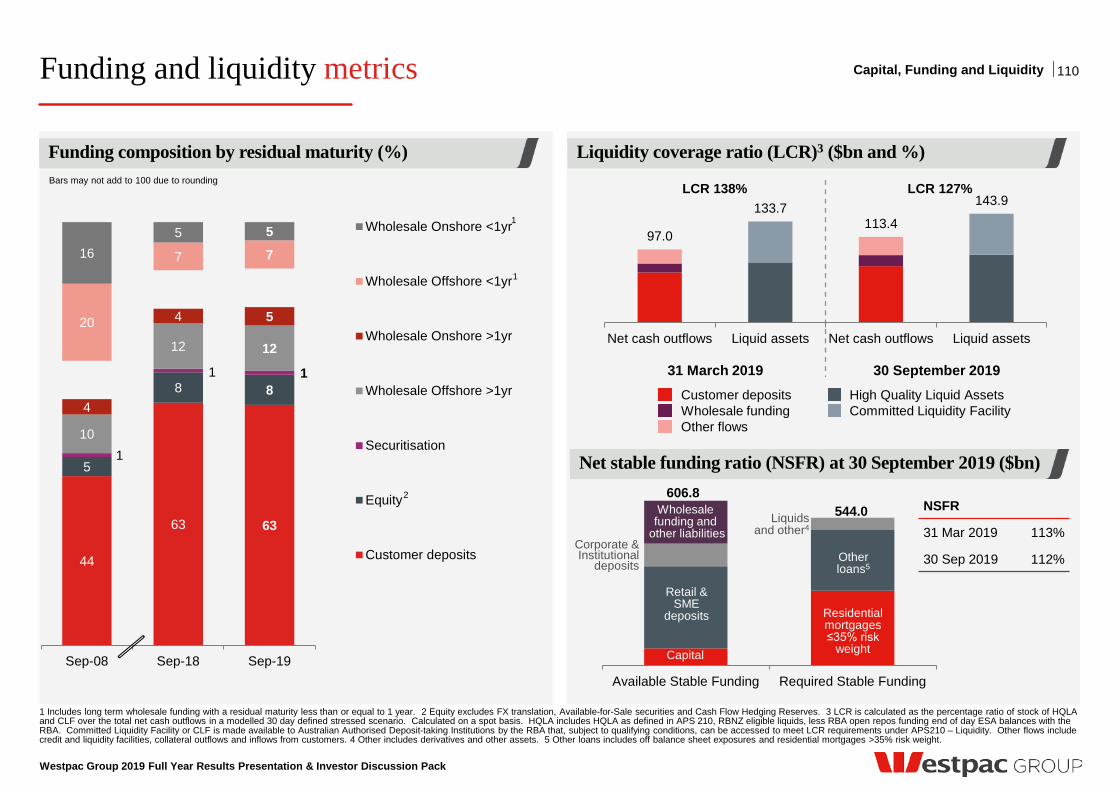
Westpac Group 2019 Full Year Results Presentation & Investor Discussion Pack
Funding and liquidity metrics
1 Includes long term wholesale funding with a residual maturity less than or equal to 1 year. 2 Equity excludes FX translation, Available-for-Sale securities and Cash Flow Hedging Reserves. 3 LCR is calculated as the percentage ratio of stock of HQLA and CLF over the total net cash outflows in a modelled 30 day defined stressed scenario. Calculated on a spot basis. HQLA includes HQLA as defined in APS 210, RBNZ eligible liquids, less RBA open repos funding end of day ESA balances with the RBA. Committed Liquidity Facility or CLF is made available to Australian Authorised Deposit-taking Institutions by the RBA that, subject to qualifying conditions, can be accessed to meet LCR requirements under APS210 – Liquidity. Other flows include credit and liquidity facilities, collateral outflows and inflows from customers. 4 Other includes derivatives and other assets. 5 Other loans includes off balance sheet exposures and residential mortgages >35% risk weight.
44
63 63
5
8 8
1
1 1
10
12 12
4
4 5 20
7 7 16 5 5
Sep-08 Sep-18 Sep-19
Wholesale Onshore <1yr
Wholesale Offshore <1yr
Wholesale Onshore >1yr
Wholesale Offshore >1yr
Securitisation
Equity
Customer deposits
110
Funding composition by residual maturity (%)
Net stable funding ratio (NSFR) at 30 September 2019 ($bn)
Available Stable Funding Required Stable Funding
606.8 544.0
Capital
Retail & SME
deposits
Corporate & Institutional
deposits
Wholesale funding and
other liabilities
Residential mortgages ≤35% risk
weight
Other loans5
Liquids and other4
31 March 2019 30 September 2019 Customer deposits High Quality Liquid Assets Wholesale funding Committed Liquidity Facility Other flows
NSFR
31 Mar 2019 113%
30 Sep 2019 112%
2
1
1
Capital, Funding and Liquidity
Bars may not add to 100 due to rounding
97.0
133.7 113.4
143.9
Net cash outflows Liquid assets Net cash outflows Liquid assets
Liquidity coverage ratio (LCR)3 ($bn and %)
LCR 138% LCR 127%

Divisional Results
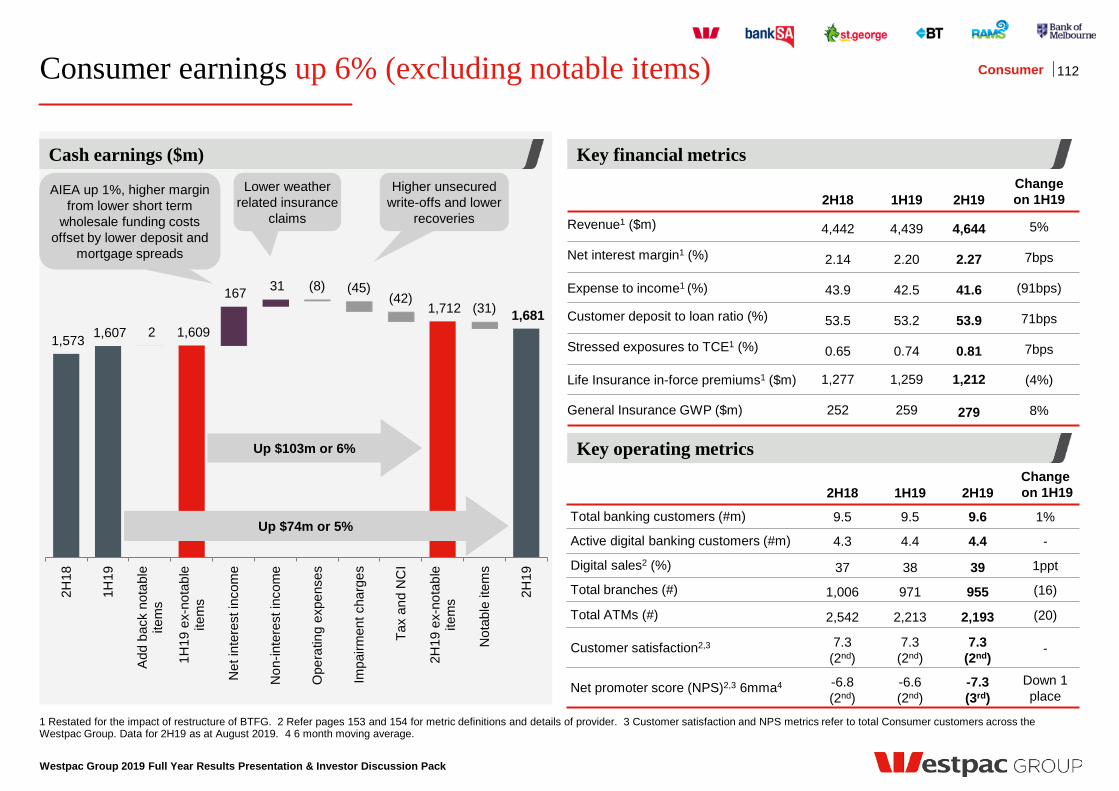
1,573 1,607 2 1,609
167 31
1,712 1,681
(8) (45) (42)
(31)
2H18
1H19
Add
bac
k no
tabl
eite
ms
1H19
ex-
nota
ble
item
s
Net
inte
rest
inco
me
Non
-inte
rest
inco
me
Ope
ratin
g ex
pens
es
Impa
irmen
t cha
rges
Tax
and
NC
I
2H19
ex-
nota
ble
item
s
Not
able
item
s
2H19
Consumer earnings up 6% (excluding notable items)
Westpac Group 2019 Full Year Results Presentation & Investor Discussion Pack
2H18 1H19 2H19 Change on 1H19
Revenue1 ($m) 4,442 4,439 4,644 5%
Net interest margin1 (%) 2.14 2.20 2.27 7bps
Expense to income1 (%) 43.9 42.5 41.6 (91bps)
Customer deposit to loan ratio (%) 53.5 53.2 53.9 71bps
Stressed exposures to TCE1 (%) 0.65 0.74 0.81 7bps
Life Insurance in-force premiums1 ($m) 1,277 1,259 1,212 (4%)
General Insurance GWP ($m) 252 259 279 8%
2H18 1H19 2H19 Change on 1H19
Total banking customers (#m) 9.5 9.5 9.6 1%
Active digital banking customers (#m) 4.3 4.4 4.4 -
Digital sales2 (%) 37 38 39 1ppt
Total branches (#) 1,006 971 955 (16)
Total ATMs (#) 2,542 2,213 2,193 (20)
Customer satisfaction2,3 7.3 (2nd)
7.3 (2nd)
7.3 (2nd)
-
Net promoter score (NPS)2,3 6mma4 -6.8 (2nd)
-6.6 (2nd)
-7.3 (3rd)
Down 1 place
Key operating metrics
Key financial metrics Cash earnings ($m)
112 Consumer
AIEA up 1%, higher margin from lower short term
wholesale funding costs offset by lower deposit and
mortgage spreads
Up $103m or 6%
Higher unsecured write-offs and lower
recoveries
Up $74m or 5%
Lower weather related insurance
claims
1 Restated for the impact of restructure of BTFG. 2 Refer pages 153 and 154 for metric definitions and details of provider. 3 Customer satisfaction and NPS metrics refer to total Consumer customers across the Westpac Group. Data for 2H19 as at August 2019. 4 6 month moving average.
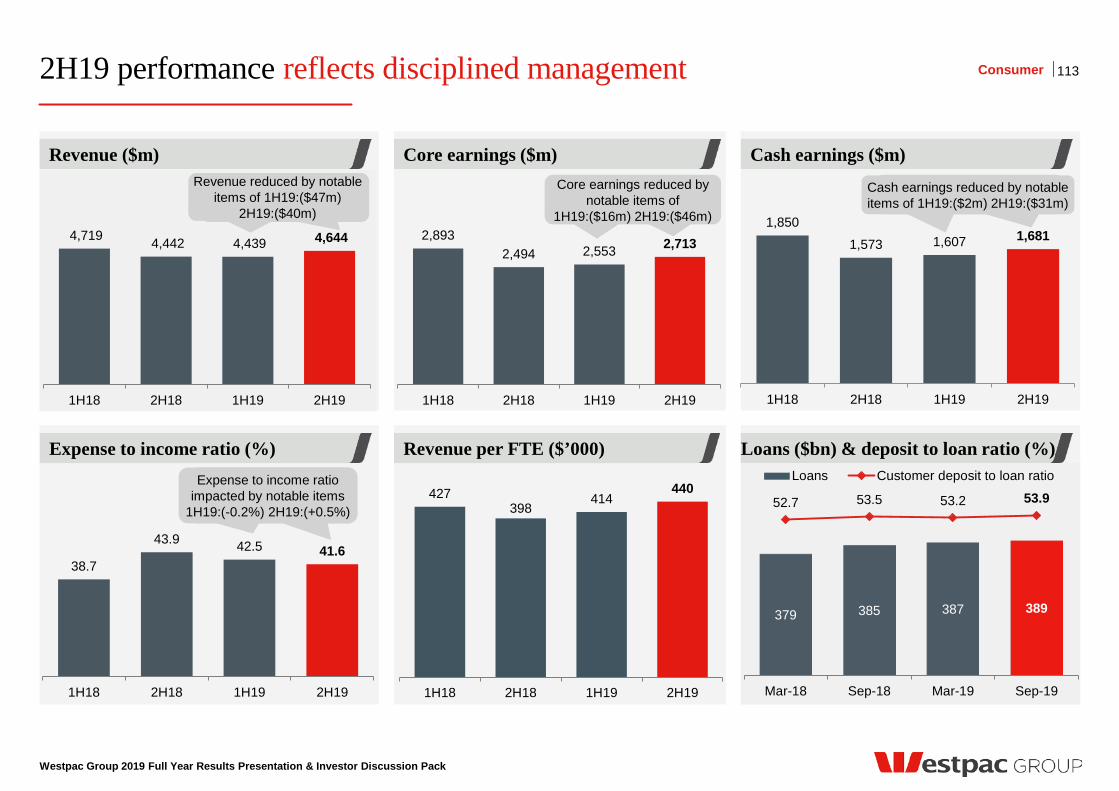
2,893 2,494 2,553 2,713
1H18 2H18 1H19 2H19
4,719 4,442 4,439 4,644
1H18 2H18 1H19 2H19
2H19 performance reflects disciplined management
Westpac Group 2019 Full Year Results Presentation & Investor Discussion Pack
Revenue per FTE ($’000) Loans ($bn) & deposit to loan ratio (%) Expense to income ratio (%)
Core earnings ($m) Cash earnings ($m) Revenue ($m)
113 Consumer
1,850
1,573 1,607 1,681
1H18 2H18 1H19 2H19
38.7
43.9 42.5 41.6
1H18 2H18 1H19 2H19
427 398
414 440
1H18 2H18 1H19 2H19
379 385 387 389
52.7 53.5 53.2 53.9
Mar-18 Sep-18 Mar-19 Sep-19
Loans Customer deposit to loan ratio
Core earnings reduced by notable items of
1H19:($16m) 2H19:($46m)
Cash earnings reduced by notable items of 1H19:($2m) 2H19:($31m)
Revenue reduced by notable items of 1H19:($47m)
2H19:($40m)
Expense to income ratio impacted by notable items
1H19:(-0.2%) 2H19:(+0.5%)
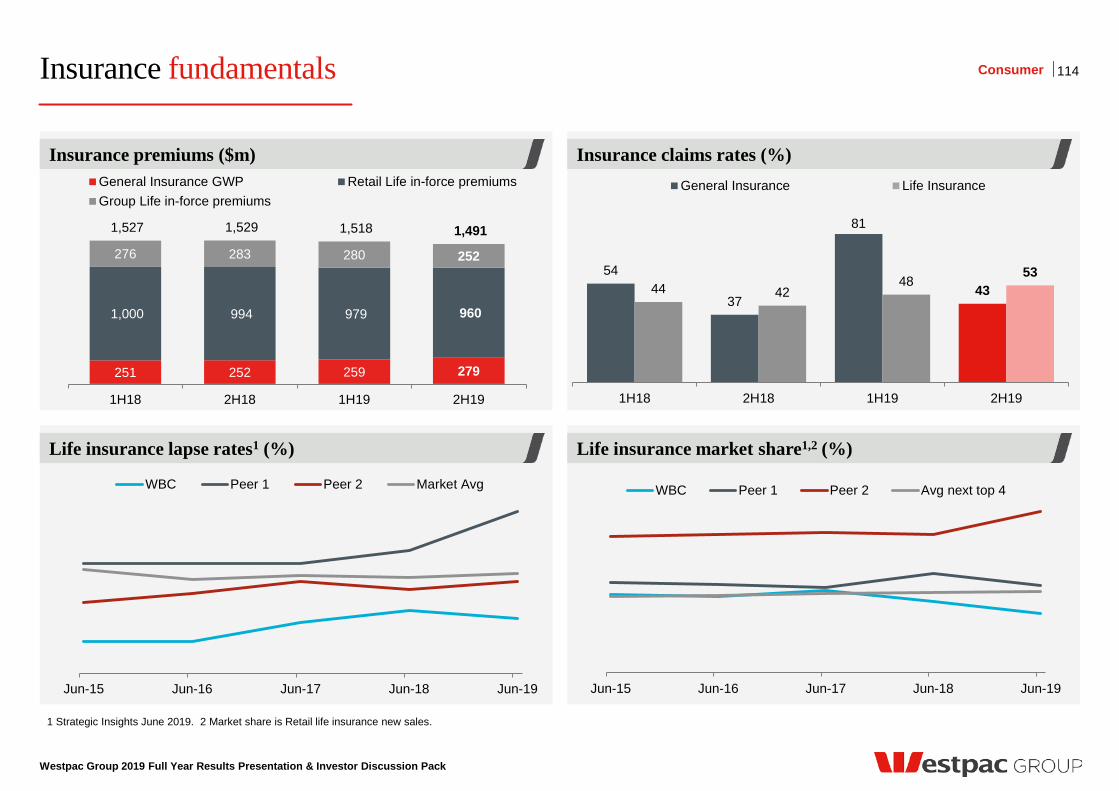
Jun-15 Jun-16 Jun-17 Jun-18 Jun-19
WBC Peer 1 Peer 2 Market Avg
Insurance fundamentals
Westpac Group 2019 Full Year Results Presentation & Investor Discussion Pack
Insurance claims rates (%)
Life insurance market share1,2 (%)
Insurance premiums ($m)
Life insurance lapse rates1 (%)
1 Strategic Insights June 2019. 2 Market share is Retail life insurance new sales.
114 Consumer
54
37
81
43 44 42 48
53
1H18 2H18 1H19 2H19
General Insurance Life Insurance
251 252 259 279
1,000 994 979 960
276 283 280 252
1,527 1,529 1,518 1,491
1H18 2H18 1H19 2H19
General Insurance GWP Retail Life in-force premiumsGroup Life in-force premiums
Jun-15 Jun-16 Jun-17 Jun-18 Jun-19
WBC Peer 1 Peer 2 Avg next top 4
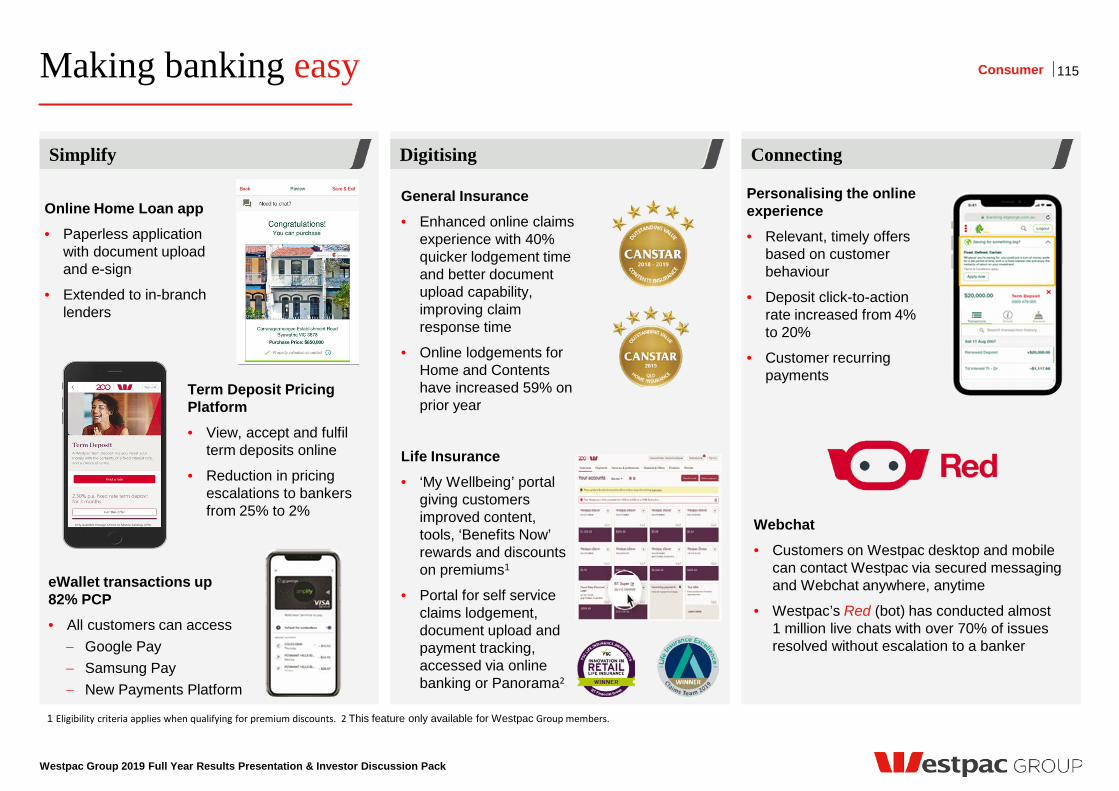
Making banking easy
Westpac Group 2019 Full Year Results Presentation & Investor Discussion Pack
1 Eligibility criteria applies when qualifying for premium discounts. 2 This feature only available for Westpac Group members.
Simplify
115
Digitising Connecting
Consumer
Online Home Loan app • Paperless application
with document upload and e-sign
• Extended to in-branch lenders
Term Deposit Pricing Platform • View, accept and fulfil
term deposits online
• Reduction in pricing escalations to bankers from 25% to 2%
eWallet transactions up 82% PCP • All customers can access
− Google Pay − Samsung Pay − New Payments Platform
General Insurance • Enhanced online claims
experience with 40% quicker lodgement time and better document upload capability, improving claim response time
• Online lodgements for Home and Contents have increased 59% on prior year
Life Insurance • ‘My Wellbeing’ portal
giving customers improved content, tools, ‘Benefits Now’ rewards and discounts on premiums1
• Portal for self service claims lodgement, document upload and payment tracking, accessed via online banking or Panorama2
Webchat • Customers on Westpac desktop and mobile
can contact Westpac via secured messaging and Webchat anywhere, anytime
• Westpac’s Red (bot) has conducted almost 1 million live chats with over 70% of issues resolved without escalation to a banker
Personalising the online experience • Relevant, timely offers
based on customer behaviour
• Deposit click-to-action rate increased from 4% to 20%
• Customer recurring payments
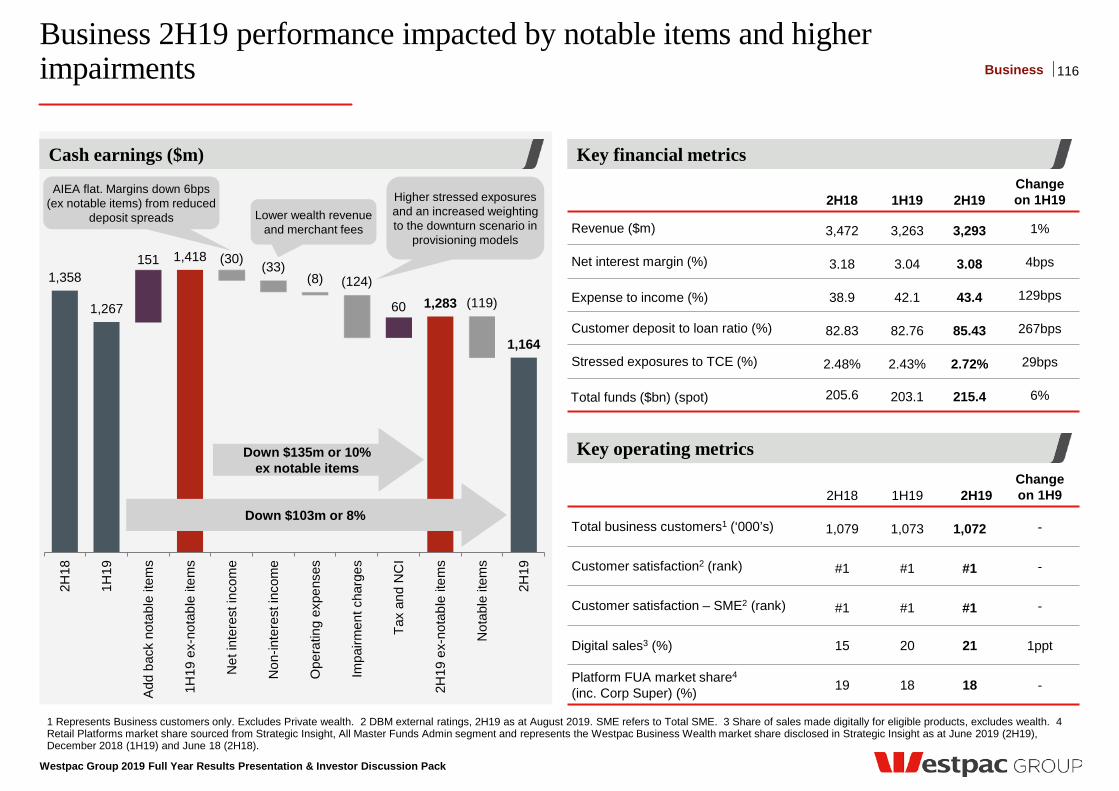
Business 2H19 performance impacted by notable items and higher impairments
Westpac Group 2019 Full Year Results Presentation & Investor Discussion Pack
1 Represents Business customers only. Excludes Private wealth. 2 DBM external ratings, 2H19 as at August 2019. SME refers to Total SME. 3 Share of sales made digitally for eligible products, excludes wealth. 4 Retail Platforms market share sourced from Strategic Insight, All Master Funds Admin segment and represents the Westpac Business Wealth market share disclosed in Strategic Insight as at June 2019 (2H19), December 2018 (1H19) and June 18 (2H18).
151 (30) 1,358
1,267
1,418
(124)
60
1,164
(33) (8)
(119) 1,283
2H18
1H19
Add
bac
k no
tabl
e ite
ms
1H19
ex-
nota
ble
item
s
Net
inte
rest
inco
me
Non
-inte
rest
inco
me
Ope
ratin
g ex
pens
es
Impa
irmen
t cha
rges
Tax
and
NC
I
2H19
ex-
nota
ble
item
s
Not
able
item
s
2H19
2H18 1H19 2H19 Change on 1H19
Revenue ($m) 3,472 3,263 3,293 1%
Net interest margin (%) 3.18 3.04 3.08 4bps
Expense to income (%) 38.9 42.1 43.4 129bps
Customer deposit to loan ratio (%) 82.83 82.76 85.43 267bps
Stressed exposures to TCE (%) 2.48% 2.43% 2.72% 29bps
Total funds ($bn) (spot) 205.6 203.1 215.4 6%
2H18 1H19 2H19 Change on 1H9
Total business customers1 (‘000’s) 1,079 1,073 1,072 -
Customer satisfaction2 (rank) #1 #1 #1 -
Customer satisfaction – SME2 (rank) #1 #1 #1 -
Digital sales3 (%) 15 20 21 1ppt
Platform FUA market share4
(inc. Corp Super) (%) 19 18 18 -
Key operating metrics
Key financial metrics Cash earnings ($m)
116 Business
AIEA flat. Margins down 6bps (ex notable items) from reduced
deposit spreads Lower wealth revenue and merchant fees
Down $103m or 8%
Higher stressed exposures and an increased weighting to the downturn scenario in
provisioning models
Down $135m or 10% ex notable items
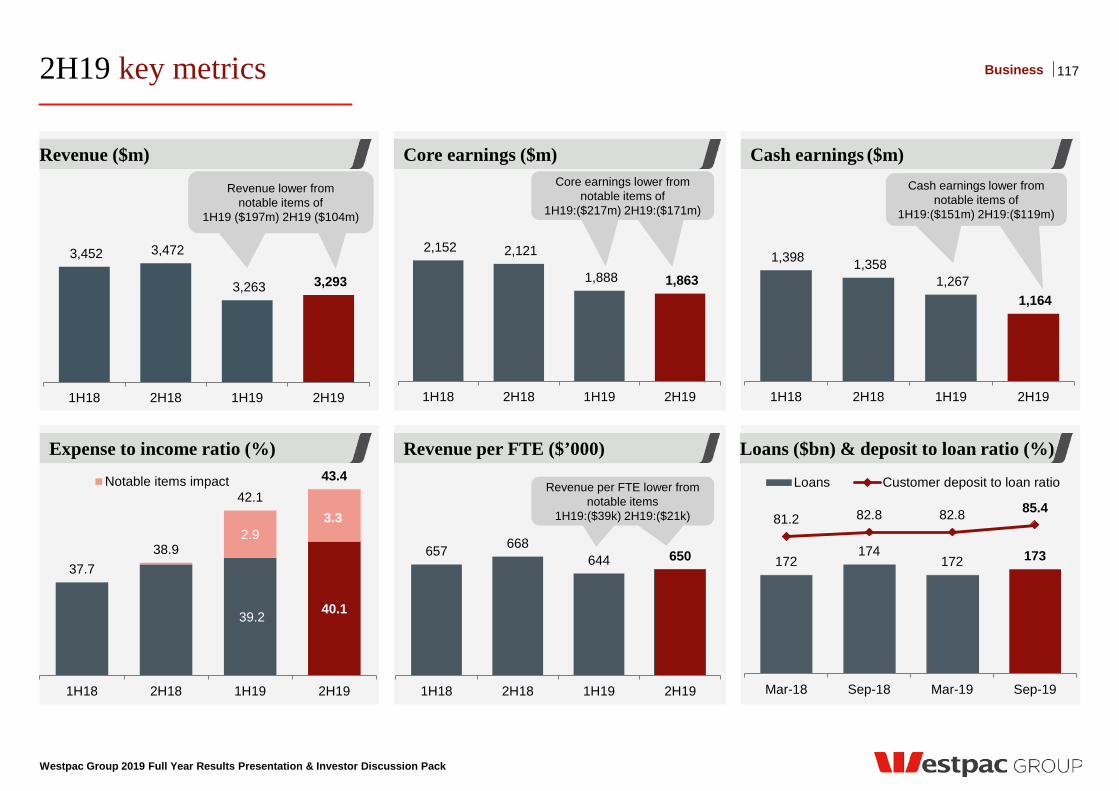
2H19 key metrics
Westpac Group 2019 Full Year Results Presentation & Investor Discussion Pack
1,398 1,358 1,267
1,164
1H18 2H18 1H19 2H19
172 174
172 173
81.2 82.8 82.8 85.4
Mar-18 Sep-18 Mar-19 Sep-19
Loans Customer deposit to loan ratio
3,452 3,472
3,263 3,293
1H18 2H18 1H19 2H19
39.2 40.1
2.9 3.3
37.7 38.9
42.1 43.4
1H18 2H18 1H19 2H19
Notable items impact
657 668 644 650
1H18 2H18 1H19 2H19
2,152 2,121
1,888 1,863
1H18 2H18 1H19 2H19
Revenue per FTE ($’000) Expense to income ratio (%)
Core earnings ($m) Cash earnings ($m)
117 Business
Core earnings lower from notable items of
1H19:($217m) 2H19:($171m)
Cash earnings lower from notable items of
1H19:($151m) 2H19:($119m)
Revenue lower from notable items of
1H19 ($197m) 2H19 ($104m)
Revenue ($m)
Loans ($bn) & deposit to loan ratio (%) Loans ($bn) & deposit to loan ratio (%)
Revenue per FTE lower from notable items
1H19:($39k) 2H19:($21k)
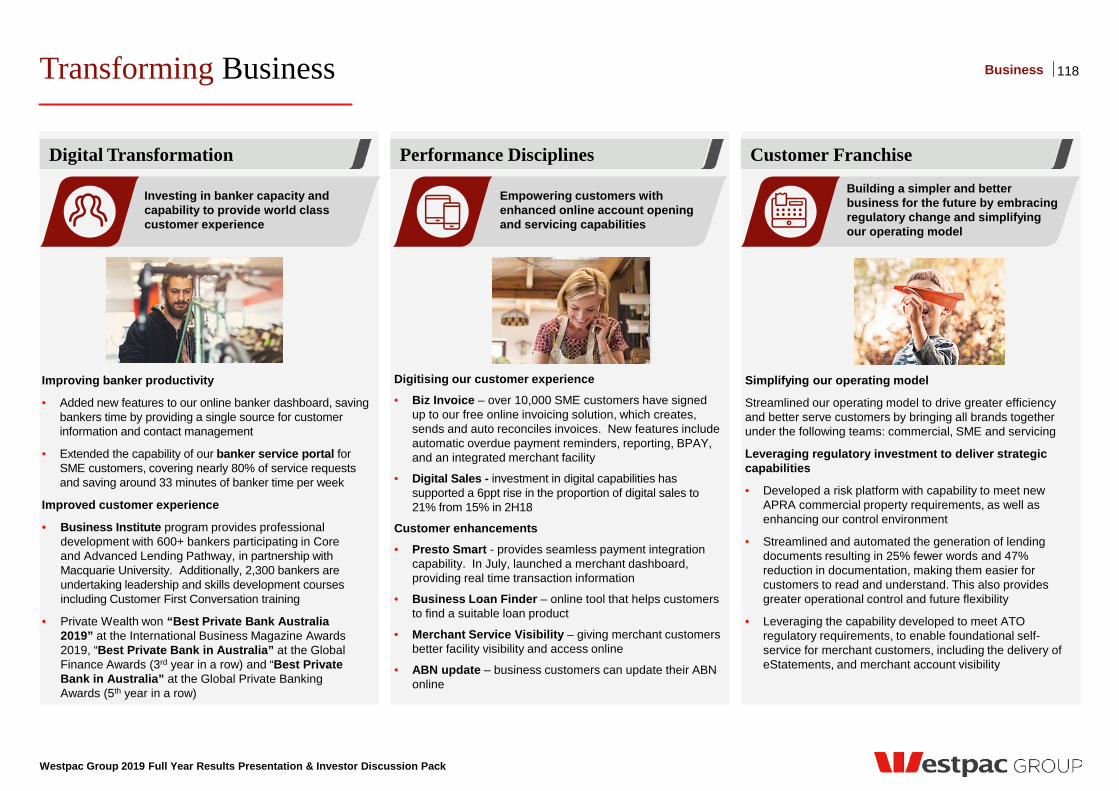
Transforming Business
Westpac Group 2019 Full Year Results Presentation & Investor Discussion Pack
Digitising our customer experience
• Biz Invoice – over 10,000 SME customers have signed up to our free online invoicing solution, which creates, sends and auto reconciles invoices. New features include automatic overdue payment reminders, reporting, BPAY, and an integrated merchant facility
• Digital Sales - investment in digital capabilities has supported a 6ppt rise in the proportion of digital sales to 21% from 15% in 2H18
Customer enhancements
• Presto Smart - provides seamless payment integration capability. In July, launched a merchant dashboard, providing real time transaction information
• Business Loan Finder – online tool that helps customers to find a suitable loan product
• Merchant Service Visibility – giving merchant customers better facility visibility and access online
• ABN update – business customers can update their ABN online
Digital Transformation
118
Simplifying our operating model
Streamlined our operating model to drive greater efficiency and better serve customers by bringing all brands together under the following teams: commercial, SME and servicing
Leveraging regulatory investment to deliver strategic capabilities
• Developed a risk platform with capability to meet new APRA commercial property requirements, as well as enhancing our control environment
• Streamlined and automated the generation of lending documents resulting in 25% fewer words and 47% reduction in documentation, making them easier for customers to read and understand. This also provides greater operational control and future flexibility
• Leveraging the capability developed to meet ATO regulatory requirements, to enable foundational self-service for merchant customers, including the delivery of eStatements, and merchant account visibility
Performance Disciplines
Business
Empowering customers with enhanced online account opening and servicing capabilities
Building a simpler and better business for the future by embracing regulatory change and simplifying our operating model
Investing in banker capacity and capability to provide world class customer experience
Improving banker productivity
• Added new features to our online banker dashboard, saving bankers time by providing a single source for customer information and contact management
• Extended the capability of our banker service portal for SME customers, covering nearly 80% of service requests and saving around 33 minutes of banker time per week
Improved customer experience
• Business Institute program provides professional development with 600+ bankers participating in Core and Advanced Lending Pathway, in partnership with Macquarie University. Additionally, 2,300 bankers are undertaking leadership and skills development courses including Customer First Conversation training
• Private Wealth won “Best Private Bank Australia 2019” at the International Business Magazine Awards 2019, “Best Private Bank in Australia” at the Global Finance Awards (3rd year in a row) and “Best Private Bank in Australia” at the Global Private Banking Awards (5th year in a row)
Customer Franchise
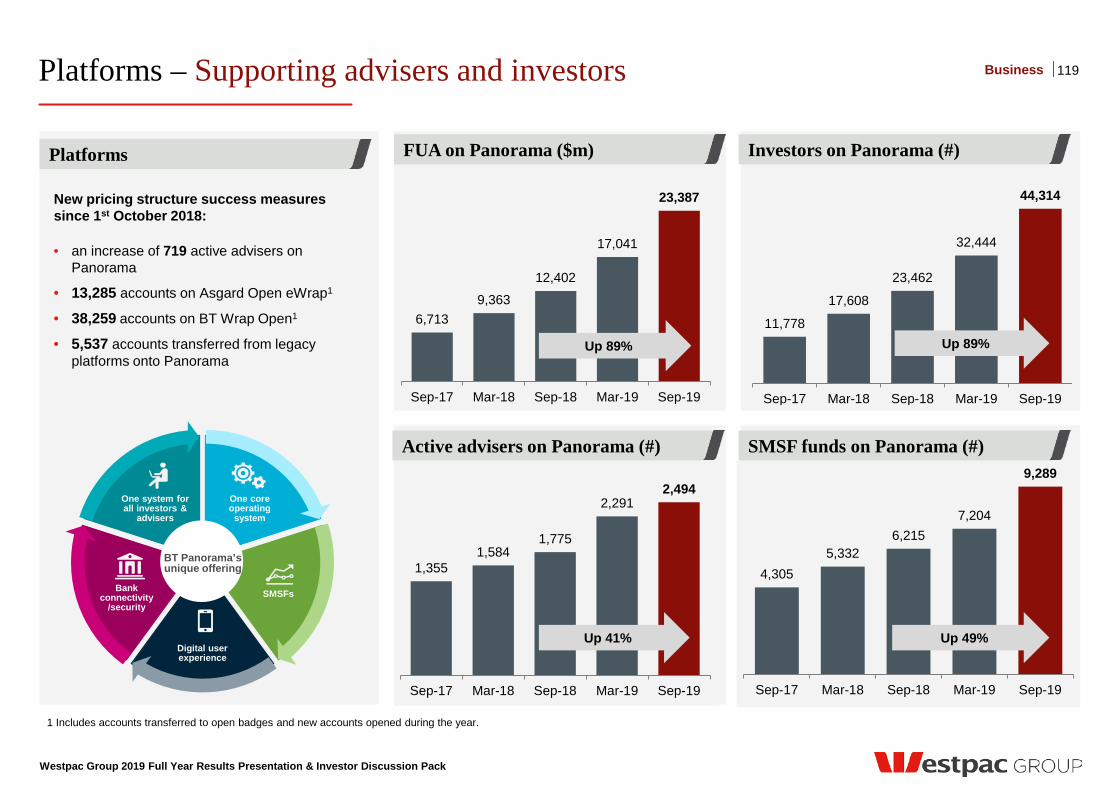
Platforms – Supporting advisers and investors
1 Includes accounts transferred to open badges and new accounts opened during the year.
Westpac Group 2019 Full Year Results Presentation & Investor Discussion Pack
11,778
17,608
23,462
32,444
44,314
Sep-17 Mar-18 Sep-18 Mar-19 Sep-19
Up 89%
Investors on Panorama (#)
Active advisers on Panorama (#) SMSF funds on Panorama (#)
FUA on Panorama ($m)
4,305 5,332
6,215 7,204
9,289
Sep-17 Mar-18 Sep-18 Mar-19 Sep-19
Up 49%
6,713 9,363
12,402
17,041
23,387
Sep-17 Mar-18 Sep-18 Mar-19 Sep-19
Up 89%
1,355 1,584
1,775
2,291 2,494
Sep-17 Mar-18 Sep-18 Mar-19 Sep-19
Up 41%
Business
Platforms
New pricing structure success measures since 1st October 2018: • an increase of 719 active advisers on
Panorama
• 13,285 accounts on Asgard Open eWrap1
• 38,259 accounts on BT Wrap Open1
• 5,537 accounts transferred from legacy platforms onto Panorama
One core operating
system
SMSFs
Digital user experience
Bank connectivity
/security
One system for all investors &
advisers
BT Panorama’s unique offering
119
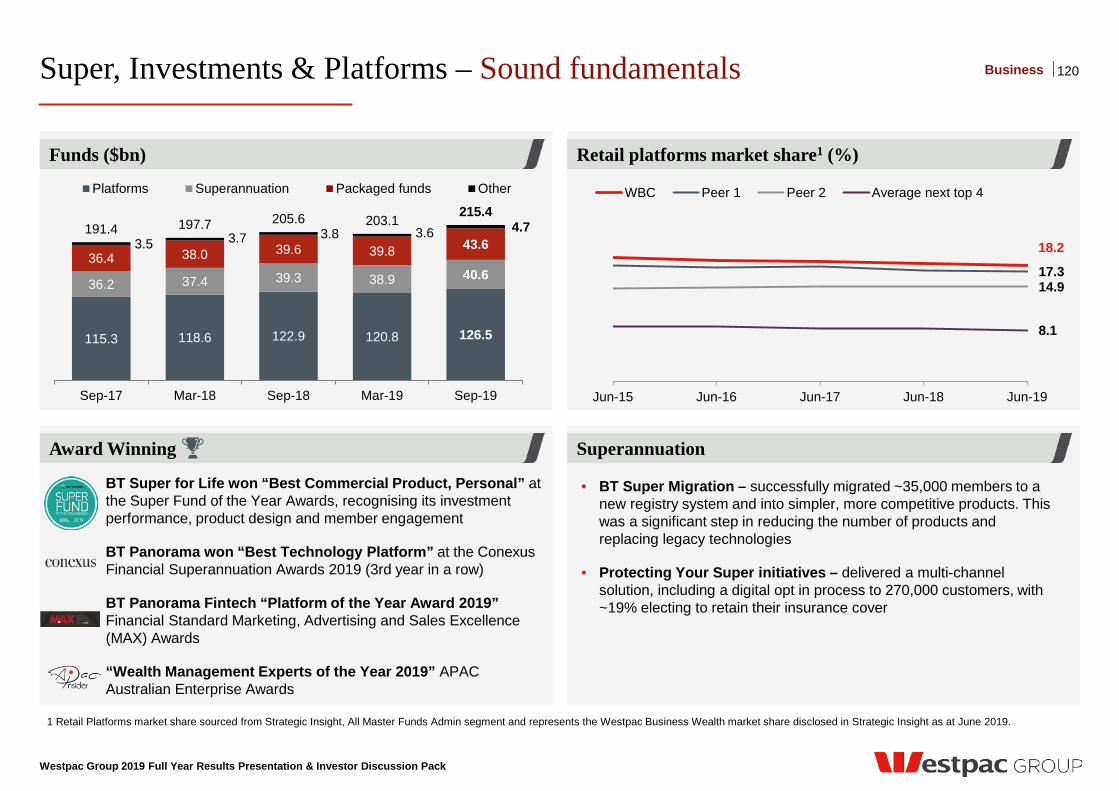
Super, Investments & Platforms – Sound fundamentals
Westpac Group 2019 Full Year Results Presentation & Investor Discussion Pack
Retail platforms market share1 (%)
Superannuation
Funds ($bn)
Award Winning
1 Retail Platforms market share sourced from Strategic Insight, All Master Funds Admin segment and represents the Westpac Business Wealth market share disclosed in Strategic Insight as at June 2019.
120
115.3 118.6 122.9 120.8 126.5
36.2 37.4 39.3 38.9 40.6 36.4 38.0 39.6 39.8 43.6 3.5 3.7 3.8 3.6 4.7 191.4 197.7 205.6 203.1
215.4
Sep-17 Mar-18 Sep-18 Mar-19 Sep-19
Platforms Superannuation Packaged funds Other
BT Super for Life won “Best Commercial Product, Personal” at the Super Fund of the Year Awards, recognising its investment performance, product design and member engagement
BT Panorama won “Best Technology Platform” at the Conexus Financial Superannuation Awards 2019 (3rd year in a row)
BT Panorama Fintech “Platform of the Year Award 2019” Financial Standard Marketing, Advertising and Sales Excellence (MAX) Awards
“Wealth Management Experts of the Year 2019” APAC Australian Enterprise Awards
• BT Super Migration – successfully migrated ~35,000 members to a new registry system and into simpler, more competitive products. This was a significant step in reducing the number of products and replacing legacy technologies
• Protecting Your Super initiatives – delivered a multi-channel solution, including a digital opt in process to 270,000 customers, with ~19% electing to retain their insurance cover
Business
18.2
17.3 14.9
8.1
Jun-15 Jun-16 Jun-17 Jun-18 Jun-19
WBC Peer 1 Peer 2 Average next top 4
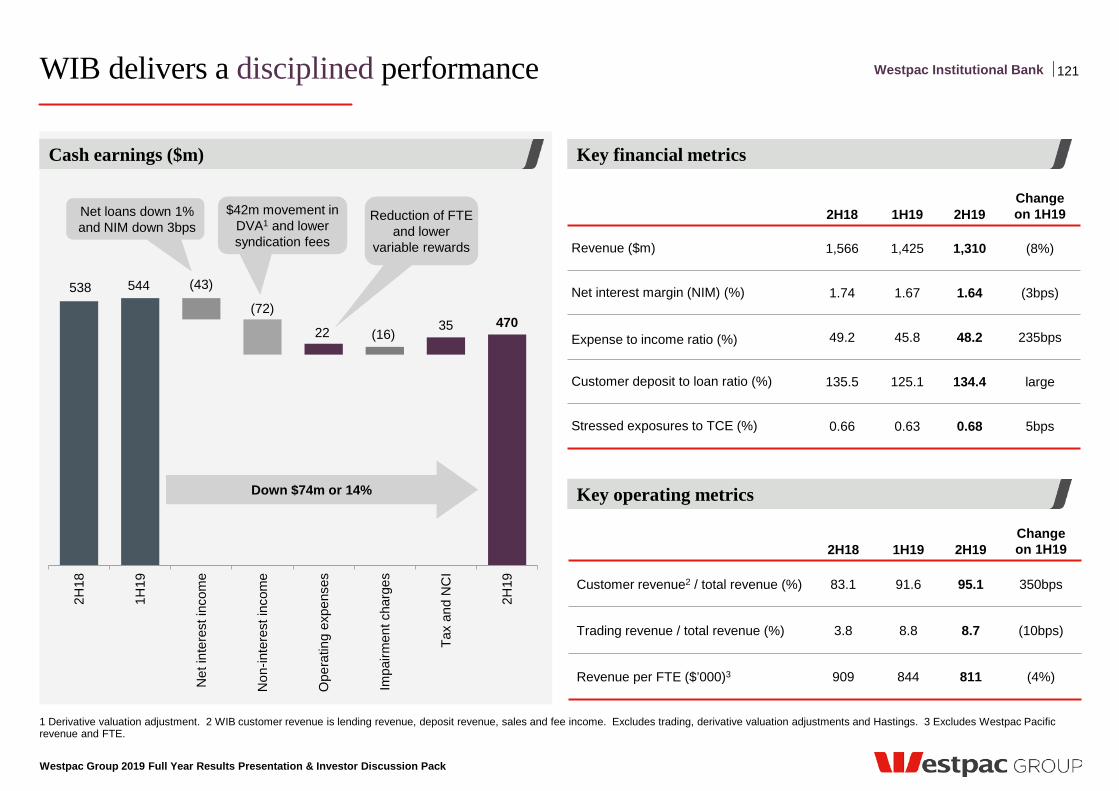
WIB delivers a disciplined performance
Westpac Group 2019 Full Year Results Presentation & Investor Discussion Pack
1 Derivative valuation adjustment. 2 WIB customer revenue is lending revenue, deposit revenue, sales and fee income. Excludes trading, derivative valuation adjustments and Hastings. 3 Excludes Westpac Pacific revenue and FTE.
Key financial metrics Cash earnings ($m)
121 Westpac Institutional Bank
2H18 1H19 2H19 Change on 1H19
Revenue ($m) 1,566 1,425 1,310 (8%)
Net interest margin (NIM) (%) 1.74 1.67 1.64 (3bps)
Expense to income ratio (%) 49.2 45.8 48.2 235bps
Customer deposit to loan ratio (%) 135.5 125.1 134.4 large
Stressed exposures to TCE (%) 0.66 0.63 0.68 5bps
2H18 1H19 2H19 Change on 1H19
Customer revenue2 / total revenue (%) 83.1 91.6 95.1 350bps
Trading revenue / total revenue (%) 3.8 8.8 8.7 (10bps)
Revenue per FTE ($’000)3 909 844 811 (4%)
Key operating metrics
538 544
470
(43)
(72)
22 (16) 35
2H18
1H19
Net
inte
rest
inco
me
Non
-inte
rest
inco
me
Ope
ratin
g ex
pens
es
Impa
irmen
t cha
rges
Tax
and
NC
I
2H19
Reduction of FTE and lower
variable rewards
Net loans down 1% and NIM down 3bps
Down $74m or 14%
$42m movement in DVA1 and lower syndication fees
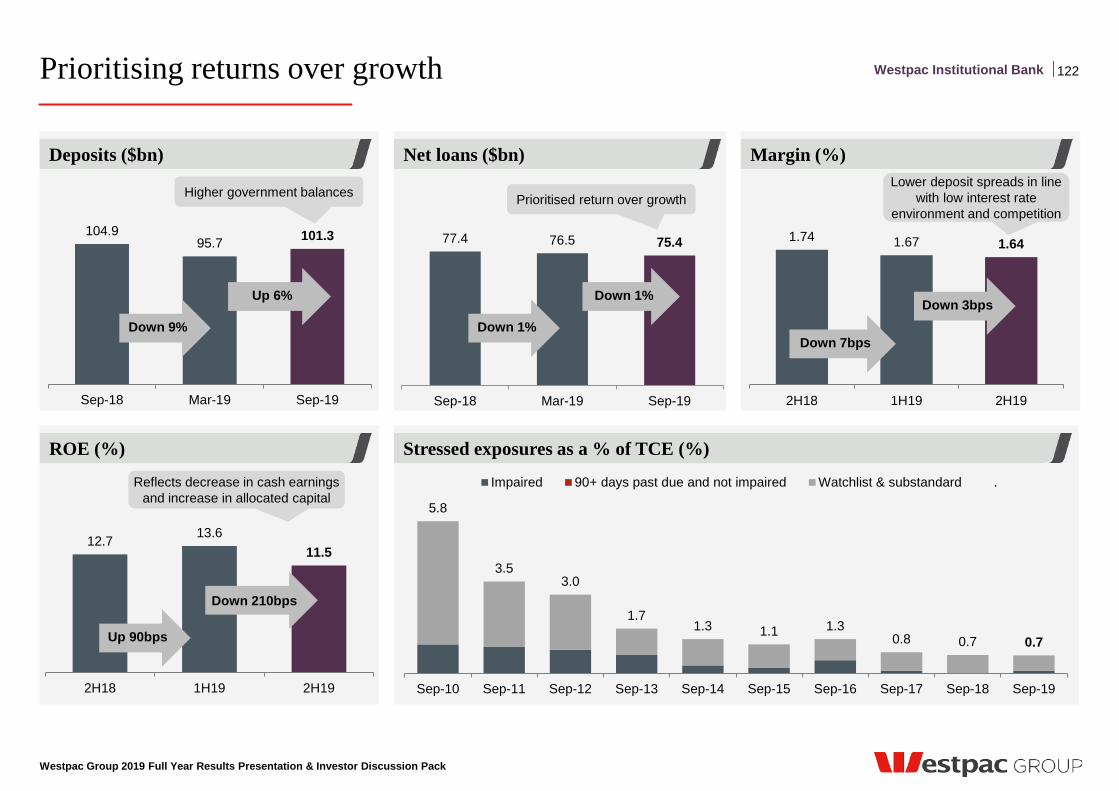
Prioritising returns over growth
Westpac Group 2019 Full Year Results Presentation & Investor Discussion Pack
ROE (%)
Net loans ($bn) Deposits ($bn)
122 Westpac Institutional Bank
77.4 76.5 75.4
Sep-18 Mar-19 Sep-19
104.9 95.7 101.3
Sep-18 Mar-19 Sep-19
12.7 13.6 11.5
2H18 1H19 2H19
1.74 1.67 1.64
2H18 1H19 2H19
Up 6%
Down 9%
Down 1%
Down 1% Down 3bps
Down 7bps
Down 210bps
Up 90bps
Higher government balances Prioritised return over growth Lower deposit spreads in line
with low interest rate environment and competition
Reflects decrease in cash earnings and increase in allocated capital
Margin (%)
Stressed exposures as a % of TCE (%)
5.8
3.5 3.0
1.7 1.3 1.1 1.3
0.8 0.7 0.7
Sep-10 Sep-11 Sep-12 Sep-13 Sep-14 Sep-15 Sep-16 Sep-17 Sep-18 Sep-19
Impaired 90+ days past due and not impaired Watchlist & substandard .
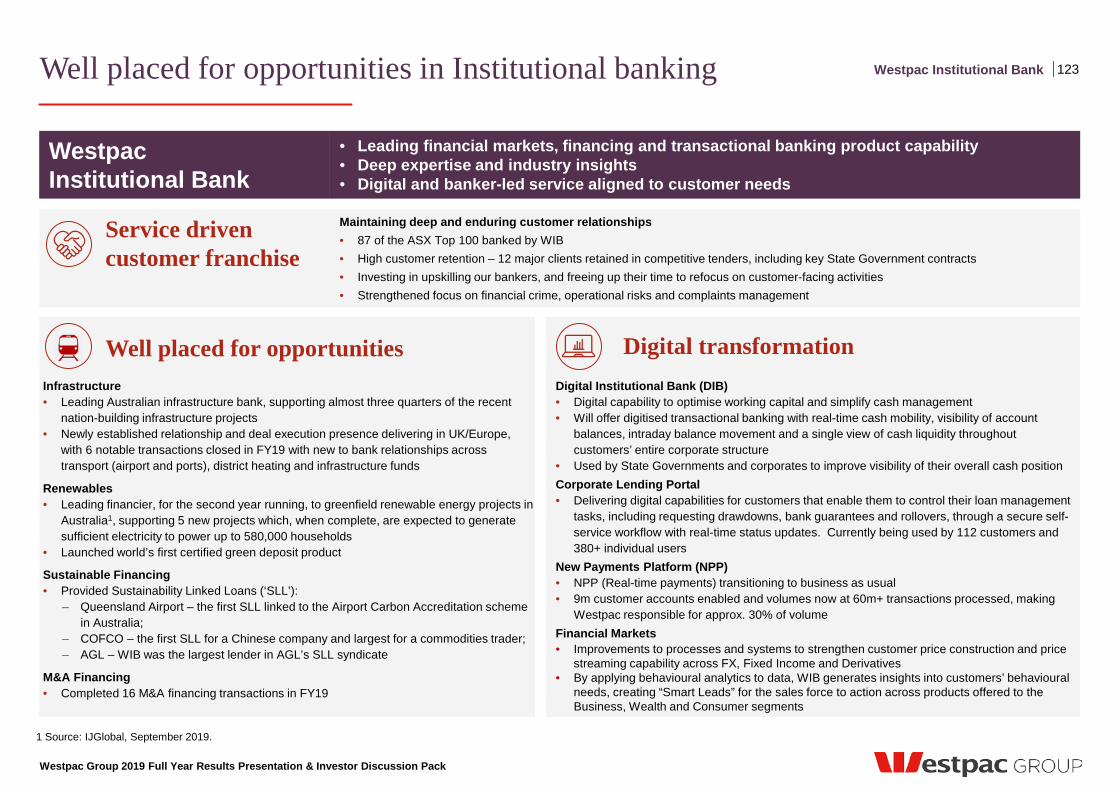
Well placed for opportunities in Institutional banking
Westpac Group 2019 Full Year Results Presentation & Investor Discussion Pack
123 Westpac Institutional Bank
• Leading financial markets, financing and transactional banking product capability • Deep expertise and industry insights • Digital and banker-led service aligned to customer needs
Westpac Institutional Bank
Service driven customer franchise
Maintaining deep and enduring customer relationships • 87 of the ASX Top 100 banked by WIB • High customer retention – 12 major clients retained in competitive tenders, including key State Government contracts • Investing in upskilling our bankers, and freeing up their time to refocus on customer-facing activities • Strengthened focus on financial crime, operational risks and complaints management
Digital Institutional Bank (DIB) • Digital capability to optimise working capital and simplify cash management • Will offer digitised transactional banking with real-time cash mobility, visibility of account
balances, intraday balance movement and a single view of cash liquidity throughout customers’ entire corporate structure
• Used by State Governments and corporates to improve visibility of their overall cash position Corporate Lending Portal • Delivering digital capabilities for customers that enable them to control their loan management
tasks, including requesting drawdowns, bank guarantees and rollovers, through a secure self-service workflow with real-time status updates. Currently being used by 112 customers and 380+ individual users
New Payments Platform (NPP) • NPP (Real-time payments) transitioning to business as usual • 9m customer accounts enabled and volumes now at 60m+ transactions processed, making
Westpac responsible for approx. 30% of volume Financial Markets • Improvements to processes and systems to strengthen customer price construction and price
streaming capability across FX, Fixed Income and Derivatives • By applying behavioural analytics to data, WIB generates insights into customers’ behavioural
needs, creating “Smart Leads” for the sales force to action across products offered to the Business, Wealth and Consumer segments
Digital transformation
1 Source: IJGlobal, September 2019.
Infrastructure • Leading Australian infrastructure bank, supporting almost three quarters of the recent
nation-building infrastructure projects • Newly established relationship and deal execution presence delivering in UK/Europe,
with 6 notable transactions closed in FY19 with new to bank relationships across transport (airport and ports), district heating and infrastructure funds
Renewables • Leading financier, for the second year running, to greenfield renewable energy projects in
Australia1, supporting 5 new projects which, when complete, are expected to generate sufficient electricity to power up to 580,000 households
• Launched world’s first certified green deposit product
Sustainable Financing • Provided Sustainability Linked Loans (‘SLL’):
– Queensland Airport – the first SLL linked to the Airport Carbon Accreditation scheme in Australia;
– COFCO – the first SLL for a Chinese company and largest for a commodities trader; – AGL – WIB was the largest lender in AGL’s SLL syndicate
M&A Financing • Completed 16 M&A financing transactions in FY19
Well placed for opportunities
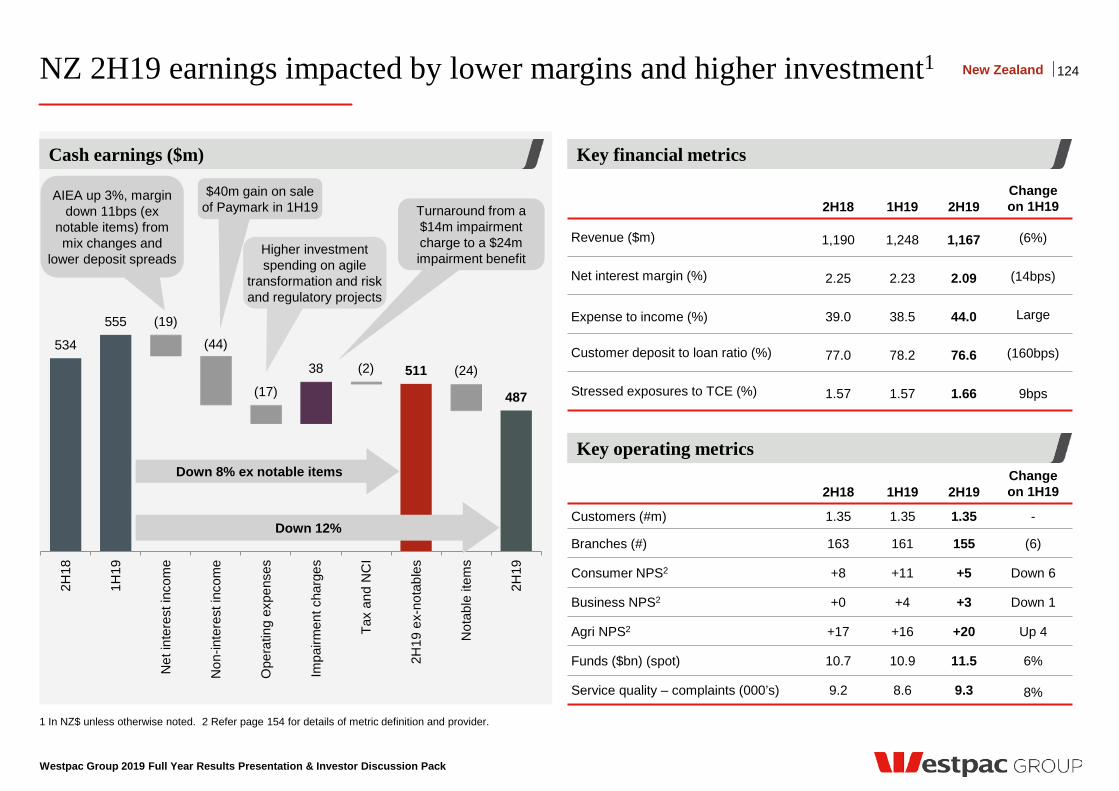
NZ 2H19 earnings impacted by lower margins and higher investment1
Westpac Group 2019 Full Year Results Presentation & Investor Discussion Pack
1 In NZ$ unless otherwise noted. 2 Refer page 154 for details of metric definition and provider.
2H18 1H19 2H19 Change on 1H19
Revenue ($m) 1,190 1,248 1,167 (6%)
Net interest margin (%) 2.25 2.23 2.09 (14bps)
Expense to income (%) 39.0 38.5 44.0 Large
Customer deposit to loan ratio (%) 77.0 78.2 76.6 (160bps)
Stressed exposures to TCE (%) 1.57 1.57 1.66 9bps
2H18 1H19 2H19 Change on 1H19
Customers (#m) 1.35 1.35 1.35 -
Branches (#) 163 161 155 (6)
Consumer NPS2 +8 +11 +5 Down 6
Business NPS2 +0 +4 +3 Down 1
Agri NPS2 +17 +16 +20 Up 4
Funds ($bn) (spot) 10.7 10.9 11.5 6%
Service quality – complaints (000’s) 9.2 8.6 9.3 8%
Key operating metrics
Key financial metrics Cash earnings ($m)
124 New Zealand
534
555
38 511
487
(19)
(44)
(17)
(2) (24)
2H18
1H19
Net
inte
rest
inco
me
Non
-inte
rest
inco
me
Ope
ratin
g ex
pens
es
Impa
irmen
t cha
rges
Tax
and
NC
I
2H19
ex-
nota
bles
Not
able
item
s
2H19
Turnaround from a $14m impairment charge to a $24m impairment benefit
$40m gain on sale of Paymark in 1H19
Down 8% ex notable items
AIEA up 3%, margin down 11bps (ex
notable items) from mix changes and
lower deposit spreads Higher investment spending on agile
transformation and risk and regulatory projects
Down 12%
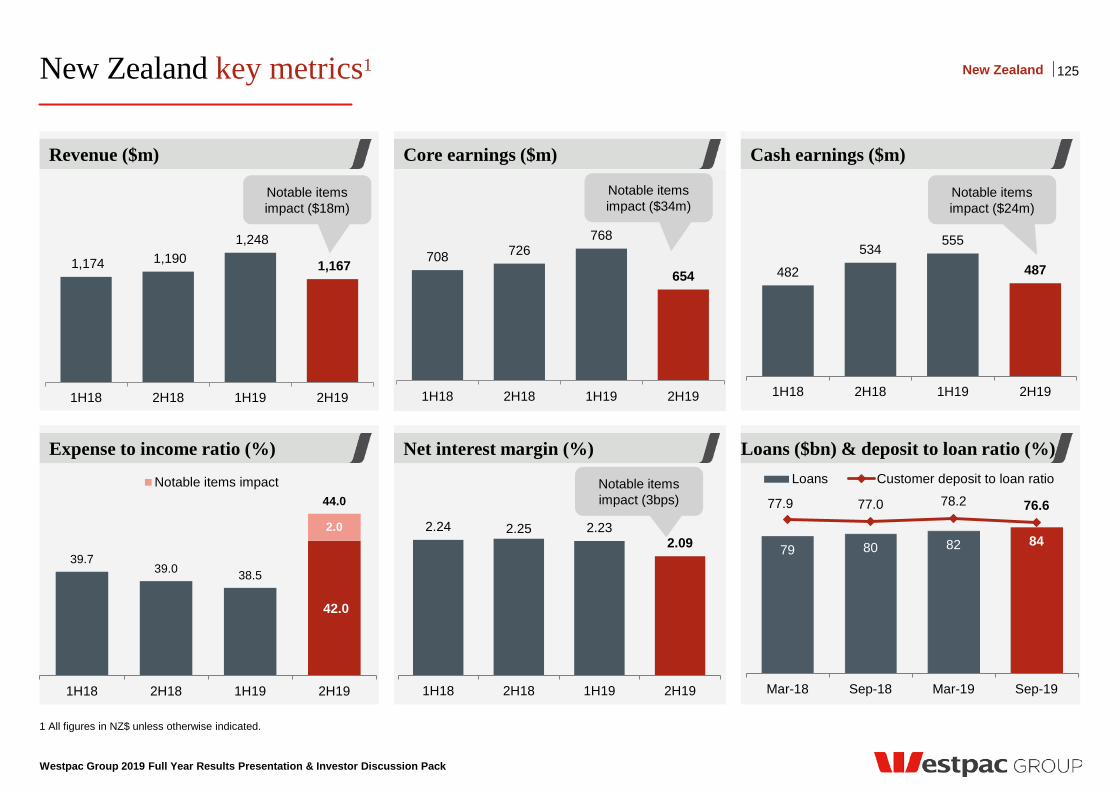
42.0
2.0
39.7 39.0 38.5
44.0
1H18 2H18 1H19 2H19
Notable items impact
New Zealand key metrics1
Westpac Group 2019 Full Year Results Presentation & Investor Discussion Pack
1 All figures in NZ$ unless otherwise indicated.
Core earnings ($m) Cash earnings ($m) Revenue ($m)
125 New Zealand
Net interest margin (%) Loans ($bn) & deposit to loan ratio (%) Expense to income ratio (%)
1,174 1,190 1,248
1,167
1H18 2H18 1H19 2H19
708 726 768
654
1H18 2H18 1H19 2H19
482
534 555
487
1H18 2H18 1H19 2H19
Notable items impact ($18m)
Notable items impact ($24m)
2.24 2.25 2.23 2.09
1H18 2H18 1H19 2H19
79 80 82 84
77.9 77.0 78.2 76.6
Mar-18 Sep-18 Mar-19 Sep-19
Loans Customer deposit to loan ratio
Notable items impact ($34m)
Notable items impact (3bps)
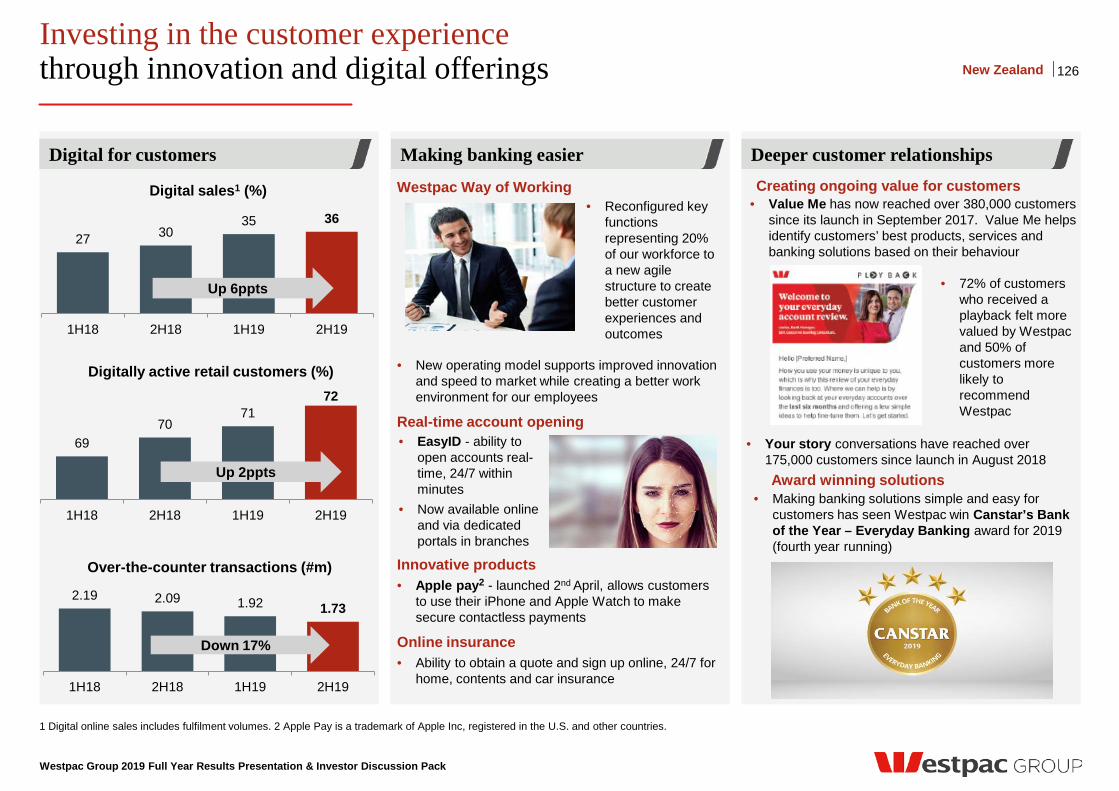
Investing in the customer experience through innovation and digital offerings
Westpac Group 2019 Full Year Results Presentation & Investor Discussion Pack
Digital for customers
126
Making banking easier Deeper customer relationships
New Zealand
27 30 35 36
1H18 2H18 1H19 2H19
1 Digital online sales includes fulfilment volumes. 2 Apple Pay is a trademark of Apple Inc, registered in the U.S. and other countries.
Up 6ppts
Digital for customers
Digital sales1 (%)
2.19 2.09 1.92 1.73
1H18 2H18 1H19 2H19
Down 17%
Over-the-counter transactions (#m)
Digitally active retail customers (%)
69 70
71 72
1H18 2H18 1H19 2H19
Up 2ppts
Award winning solutions
• Value Me has now reached over 380,000 customers since its launch in September 2017. Value Me helps identify customers’ best products, services and banking solutions based on their behaviour
Creating ongoing value for customers
• Making banking solutions simple and easy for customers has seen Westpac win Canstar’s Bank of the Year – Everyday Banking award for 2019 (fourth year running)
Westpac Way of Working
• New operating model supports improved innovation
and speed to market while creating a better work environment for our employees
Real-time account opening
Innovative products • Apple pay2 - launched 2nd April, allows customers
to use their iPhone and Apple Watch to make secure contactless payments
Online insurance • Ability to obtain a quote and sign up online, 24/7 for
home, contents and car insurance
• Reconfigured key functions representing 20% of our workforce to a new agile structure to create better customer experiences and outcomes
• EasyID - ability to open accounts real-time, 24/7 within minutes
• Now available online and via dedicated portals in branches
• Your story conversations have reached over 175,000 customers since launch in August 2018
• 72% of customers who received a playback felt more valued by Westpac and 50% of customers more likely to recommend Westpac
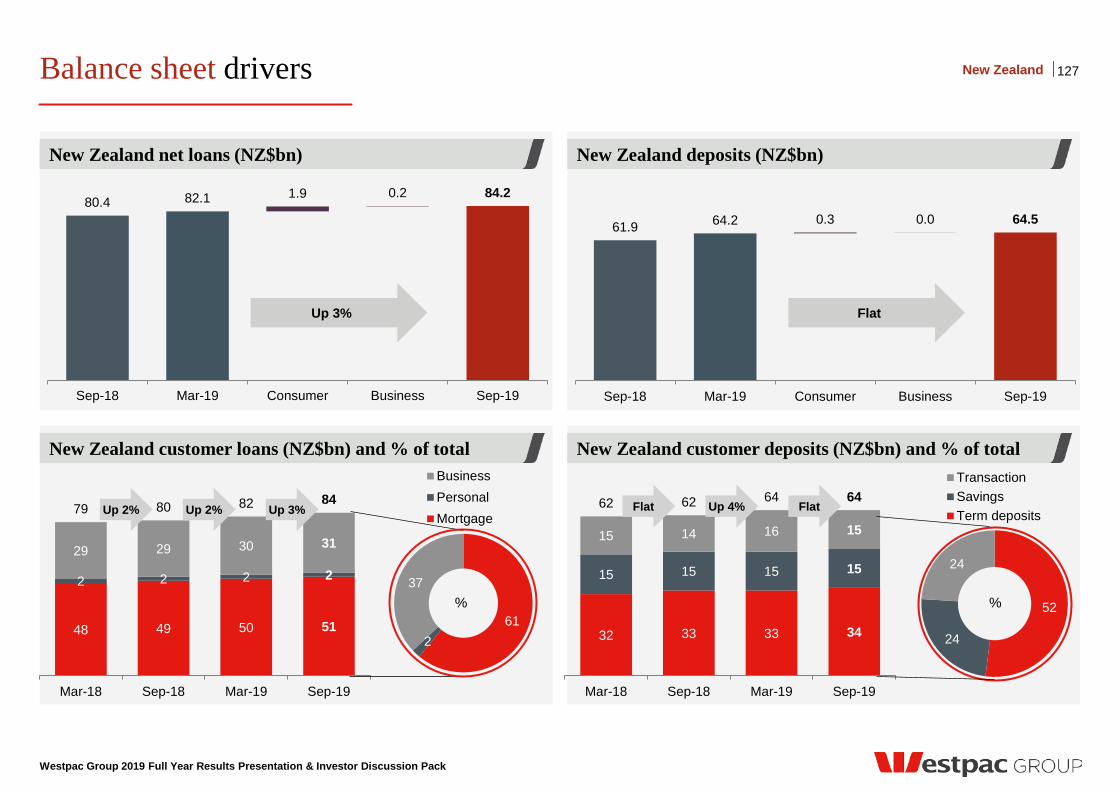
Balance sheet drivers
Westpac Group 2019 Full Year Results Presentation & Investor Discussion Pack
New Zealand deposits (NZ$bn)
New Zealand customer deposits (NZ$bn) and % of total
New Zealand net loans (NZ$bn)
New Zealand customer loans (NZ$bn) and % of total
127 New Zealand
80.4 82.1 1.9 0.2 84.2
Sep-18 Mar-19 Consumer Business Sep-19
32 33 33 34
15 15 15 15
15 14 16 15
62 62 64 64
Mar-18 Sep-18 Mar-19 Sep-19
TransactionSavingsTerm deposits
52
24
24
48 49 50 51
2 2 2 2
29 29 30 31
79 80 82 84
Mar-18 Sep-18 Mar-19 Sep-19
BusinessPersonalMortgage
61 2
37
Up 3%
61.9 64.2 0.3 0.0 64.5
Sep-18 Mar-19 Consumer Business Sep-19
Flat Up 3%
Up 2% Up 2% Flat Up 4% Flat
% %
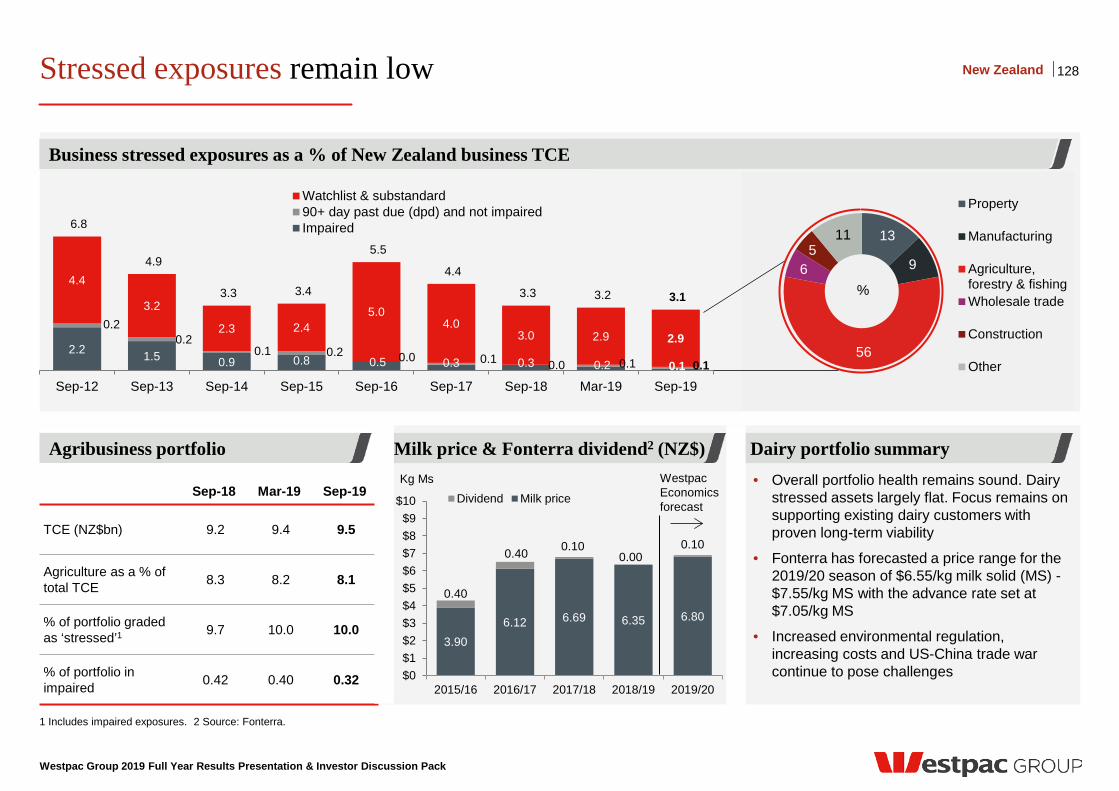
Stressed exposures remain low
Westpac Group 2019 Full Year Results Presentation & Investor Discussion Pack
1 Includes impaired exposures. 2 Source: Fonterra.
128
Business stressed exposures as a % of New Zealand business TCE
Agribusiness portfolio Milk price & Fonterra dividend2 (NZ$) Dairy portfolio summary
New Zealand
Sep-18 Mar-19 Sep-19
TCE (NZ$bn) 9.2 9.4 9.5
Agriculture as a % of total TCE 8.3 8.2 8.1
% of portfolio graded as ‘stressed’1 9.7 10.0 10.0
% of portfolio in impaired 0.42 0.40 0.32
Westpac Economics forecast
13
9
56
6 5
11
Property
Manufacturing
Agriculture,forestry & fishingWholesale trade
Construction
Other
• Overall portfolio health remains sound. Dairy stressed assets largely flat. Focus remains on supporting existing dairy customers with proven long-term viability
• Fonterra has forecasted a price range for the 2019/20 season of $6.55/kg milk solid (MS) - $7.55/kg MS with the advance rate set at $7.05/kg MS
• Increased environmental regulation, increasing costs and US-China trade war continue to pose challenges
2.2 1.5 0.9 0.8 0.5 0.3 0.3 0.2 0.1
0.2 0.2
0.1 0.2 0.0 0.1 0.0 0.1 0.1
4.4
3.2
2.3 2.4 5.0
4.0 3.0 2.9 2.9
6.8
4.9
3.3 3.4
5.5
4.4
3.3 3.2 3.1
Sep-12 Sep-13 Sep-14 Sep-15 Sep-16 Sep-17 Sep-18 Mar-19 Sep-19
Watchlist & substandard90+ day past due (dpd) and not impairedImpaired
3.90 6.12 6.69 6.35 6.80
0.40
0.40 0.10 0.00
0.10
$0$1$2$3$4$5$6$7$8$9
$10
2015/16 2016/17 2017/18 2018/19 2019/20
Kg Ms Dividend Milk price
%
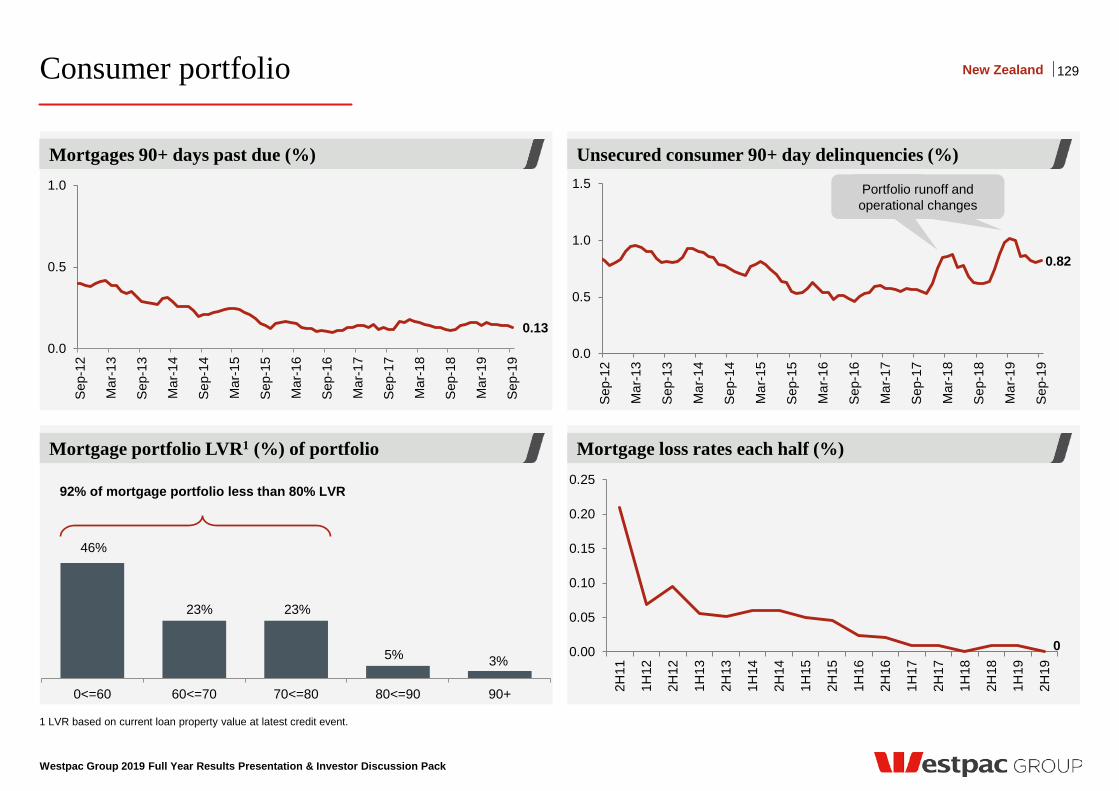
Westpac Group 2019 Full Year Results Presentation & Investor Discussion Pack
Unsecured consumer 90+ day delinquencies (%)
Mortgage loss rates each half (%)
Mortgage 90+ day delinquencies (%)
Mortgage portfolio LVR1 (%) of portfolio
1 LVR based on current loan property value at latest credit event.
129 New Zealand
Mortgages 90+ day delinquencies
46%
23% 23%
5% 3%
0<=60 60<=70 70<=80 80<=90 90+
92% of mortgage portfolio less than 80% LVR
Mortgages 90+ days past due (%)
0 0.00
0.05
0.10
0.15
0.20
0.25
2H11
1H12
2H12
1H13
2H13
1H14
2H14
1H15
2H15
1H16
2H16
1H17
2H17
1H18
2H18
1H19
2H19
Consumer portfolio
0.13 0.0
0.5
1.0
Sep
-12
Mar
-13
Sep
-13
Mar
-14
Sep
-14
Mar
-15
Sep
-15
Mar
-16
Sep
-16
Mar
-17
Sep
-17
Mar
-18
Sep
-18
Mar
-19
Sep
-19
0.82
0.0
0.5
1.0
1.5
Sep
-12
Mar
-13
Sep
-13
Mar
-14
Sep
-14
Mar
-15
Sep
-15
Mar
-16
Sep
-16
Mar
-17
Sep
-17
Mar
-18
Sep
-18
Mar
-19
Sep
-19
Portfolio runoff and operational changes

Economics
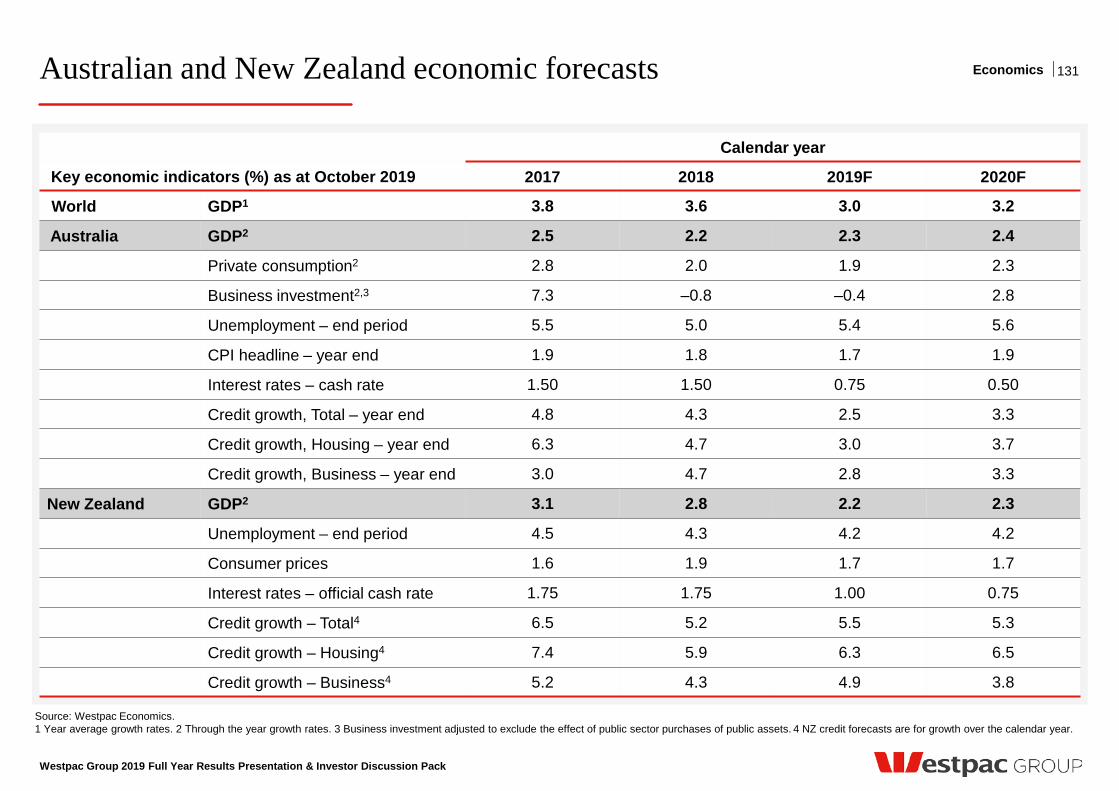
Westpac Group 2019 Full Year Results Presentation & Investor Discussion Pack
Australian and New Zealand economic forecasts 131
Calendar year
Key economic indicators (%) as at October 2019 2017 2018 2019F 2020F
World GDP1 3.8 3.6 3.0 3.2
Australia GDP2 2.5 2.2 2.3 2.4
Private consumption2 2.8 2.0 1.9 2.3
Business investment2,3 7.3 –0.8 –0.4 2.8
Unemployment – end period 5.5 5.0 5.4 5.6
CPI headline – year end 1.9 1.8 1.7 1.9
Interest rates – cash rate 1.50 1.50 0.75 0.50
Credit growth, Total – year end 4.8 4.3 2.5 3.3
Credit growth, Housing – year end 6.3 4.7 3.0 3.7
Credit growth, Business – year end 3.0 4.7 2.8 3.3
New Zealand GDP2 3.1 2.8 2.2 2.3
Unemployment – end period 4.5 4.3 4.2 4.2
Consumer prices 1.6 1.9 1.7 1.7
Interest rates – official cash rate 1.75 1.75 1.00 0.75
Credit growth – Total4 6.5 5.2 5.5 5.3
Credit growth – Housing4 7.4 5.9 6.3 6.5
Credit growth – Business4 5.2 4.3 4.9 3.8
Source: Westpac Economics. 1 Year average growth rates. 2 Through the year growth rates. 3 Business investment adjusted to exclude the effect of public sector purchases of public assets. 4 NZ credit forecasts are for growth over the calendar year.
Economics
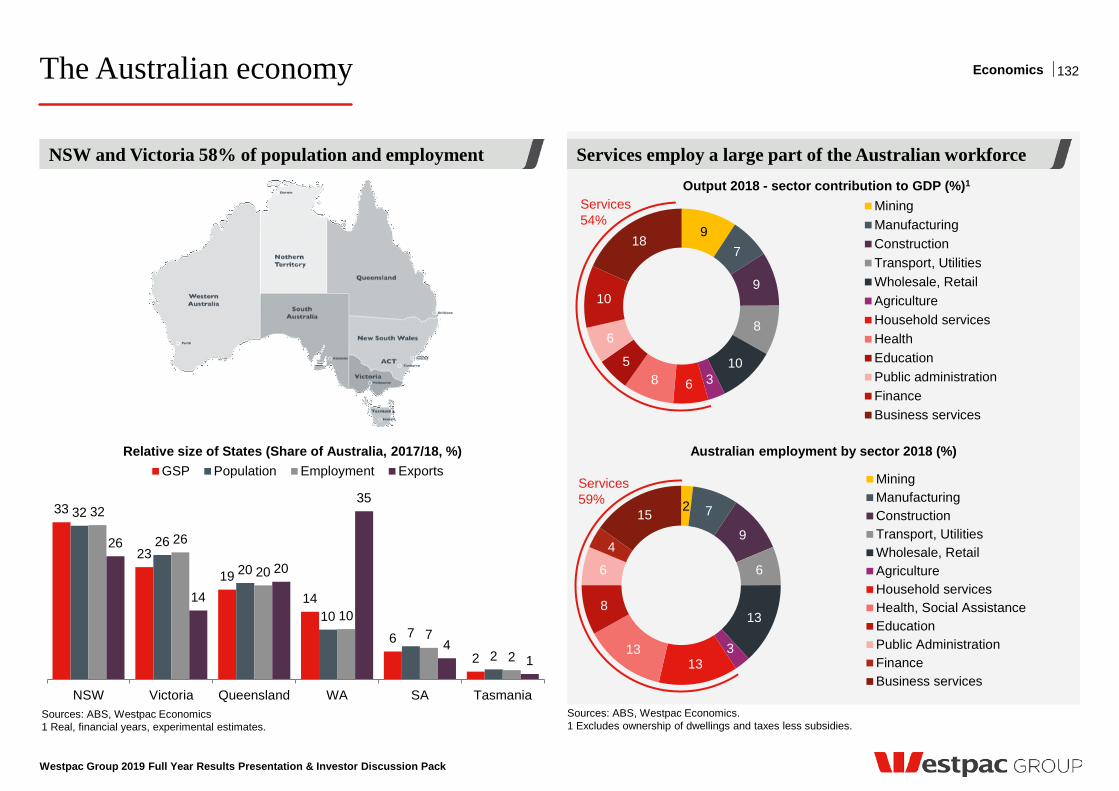
The Australian economy
33
23
19
14
6 2
32
26
20
10 7
2
32
26
20
10 7
2
26
14
20
35
4 1
NSW Victoria Queensland WA SA Tasmania
GSP Population Employment Exports
Sources: ABS, Westpac Economics 1 Real, financial years, experimental estimates.
NSW and Victoria 58% of population and employment
Relative size of States (Share of Australia, 2017/18, %)
Sources: ABS, Westpac Economics. 1 Excludes ownership of dwellings and taxes less subsidies.
9 7
9
8
10 3 6 8
5
6
10
18
MiningManufacturingConstructionTransport, UtilitiesWholesale, RetailAgricultureHousehold servicesHealthEducationPublic administrationFinanceBusiness services
Output 2018 - sector contribution to GDP (%)1
Services 54%
2 7
9
6
13
3 13
13
8
6
4
15
MiningManufacturingConstructionTransport, UtilitiesWholesale, RetailAgricultureHousehold servicesHealth, Social AssistanceEducationPublic AdministrationFinanceBusiness services
Australian employment by sector 2018 (%)
Services 59%
Services employ a large part of the Australian workforce
Westpac Group 2019 Full Year Results Presentation & Investor Discussion Pack
132 Economics
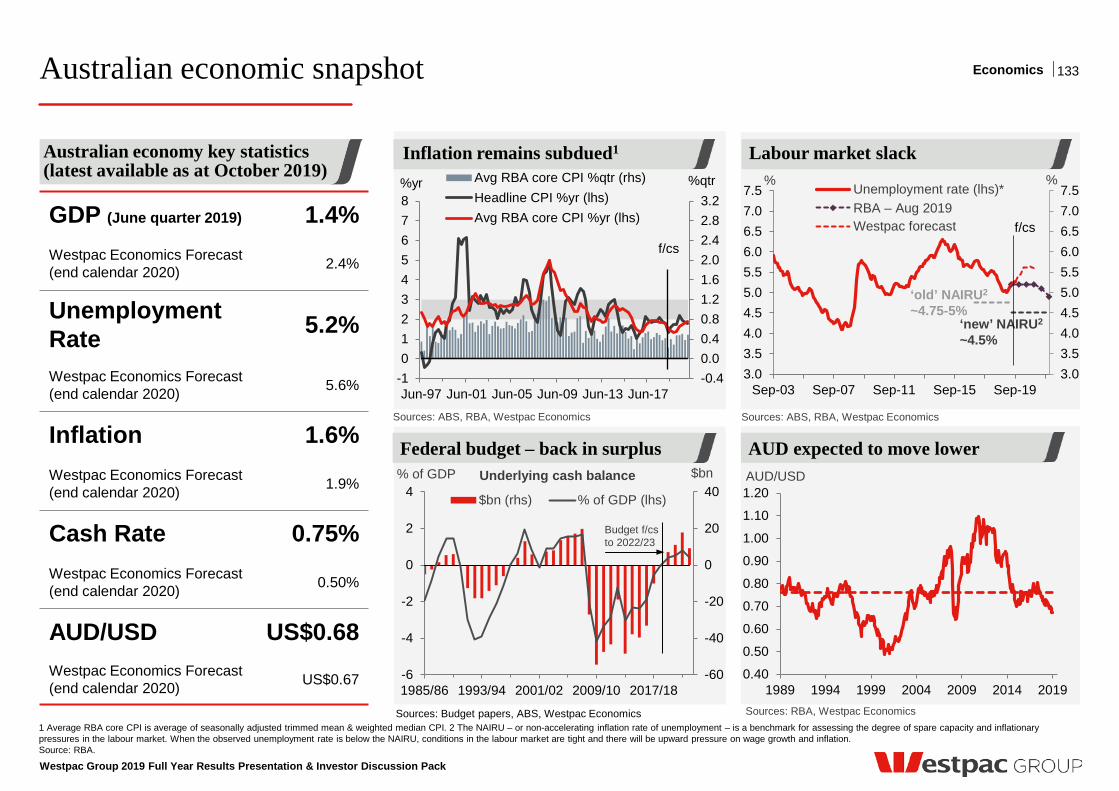
Australian economic snapshot
Inflation remains subdued1 Labour market slack
1 Average RBA core CPI is average of seasonally adjusted trimmed mean & weighted median CPI. 2 The NAIRU – or non-accelerating inflation rate of unemployment – is a benchmark for assessing the degree of spare capacity and inflationary pressures in the labour market. When the observed unemployment rate is below the NAIRU, conditions in the labour market are tight and there will be upward pressure on wage growth and inflation. Source: RBA.
-0.40.00.40.81.21.62.02.42.83.2
-1012345678
Jun-97 Jun-01 Jun-05 Jun-09 Jun-13 Jun-17
%qtr %yr Avg RBA core CPI %qtr (rhs)Headline CPI %yr (lhs)Avg RBA core CPI %yr (lhs)
f/cs
Sources: ABS, RBA, Westpac Economics
Australian economy key statistics (latest available as at October 2019)
Sources: ABS, RBA, Westpac Economics
Sources: RBA, Westpac Economics
0.40
0.50
0.60
0.70
0.80
0.90
1.00
1.10
1.20
1989 1994 1999 2004 2009 2014 2019
AUD/USD
AUD expected to move lower
3.03.54.04.55.05.56.06.57.07.5
3.03.54.04.55.05.56.06.57.07.5
Sep-03 Sep-07 Sep-11 Sep-15 Sep-19
% % Unemployment rate (lhs)*RBA – Aug 2019 Westpac forecast
‘old’ NAIRU2 ~4.75-5%
‘new’ NAIRU2 ~4.5%
f/cs
Sources: Budget papers, ABS, Westpac Economics
Federal budget – back in surplus
-60
-40
-20
0
20
40
-6
-4
-2
0
2
4
1985/86 1993/94 2001/02 2009/10 2017/18
$bn
$bn (rhs) % of GDP (lhs)
Underlying cash balance
Budget f/cs to 2022/23
% of GDP
Westpac Group 2019 Full Year Results Presentation & Investor Discussion Pack
133
GDP (June quarter 2019) 1.4% Westpac Economics Forecast (end calendar 2020) 2.4%
Unemployment Rate 5.2%
Westpac Economics Forecast (end calendar 2020) 5.6%
Inflation 1.6% Westpac Economics Forecast (end calendar 2020) 1.9%
Cash Rate 0.75% Westpac Economics Forecast (end calendar 2020) 0.50%
AUD/USD US$0.68 Westpac Economics Forecast (end calendar 2020) US$0.67
Economics
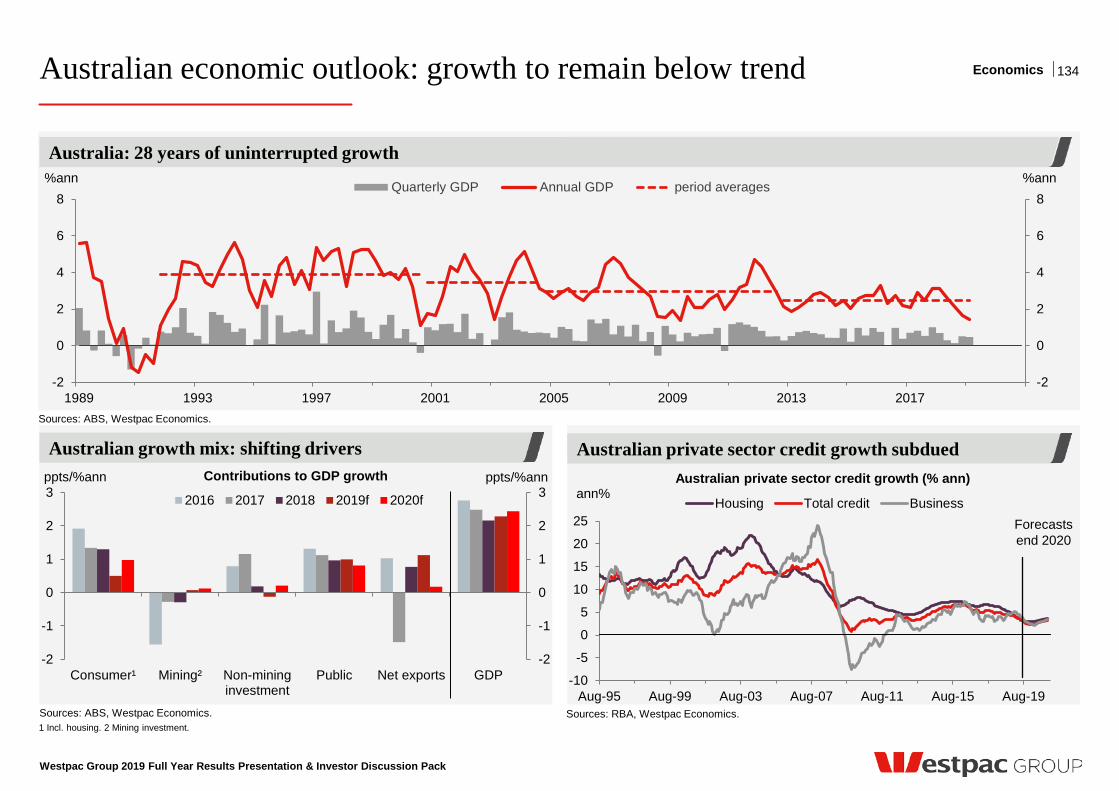
Australian economic outlook: growth to remain below trend
Westpac Group 2019 Full Year Results Presentation & Investor Discussion Pack
134
Sources: ABS, Westpac Economics.
-2
-1
0
1
2
3
-2
-1
0
1
2
3
Consumer¹ Mining² Non-mininginvestment
Public Net exports GDP
ppts/%ann ppts/%ann
2016 2017 2018 2019f 2020f
Contributions to GDP growth
Australian growth mix: shifting drivers Australian private sector credit growth subdued
Australia: 28 years of uninterrupted growth
Sources: ABS, Westpac Economics.
-2
0
2
4
6
8
-2
0
2
4
6
8
1989 1993 1997 2001 2005 2009 2013 2017
%ann %ann Quarterly GDP Annual GDP period averages
Sources: RBA, Westpac Economics.
ann% Australian private sector credit growth (% ann)
-10
-5
0
5
10
15
20
25
Aug-95 Aug-99 Aug-03 Aug-07 Aug-11 Aug-15 Aug-19
Housing Total credit BusinessForecasts end 2020
1 Incl. housing. 2 Mining investment.
Economics
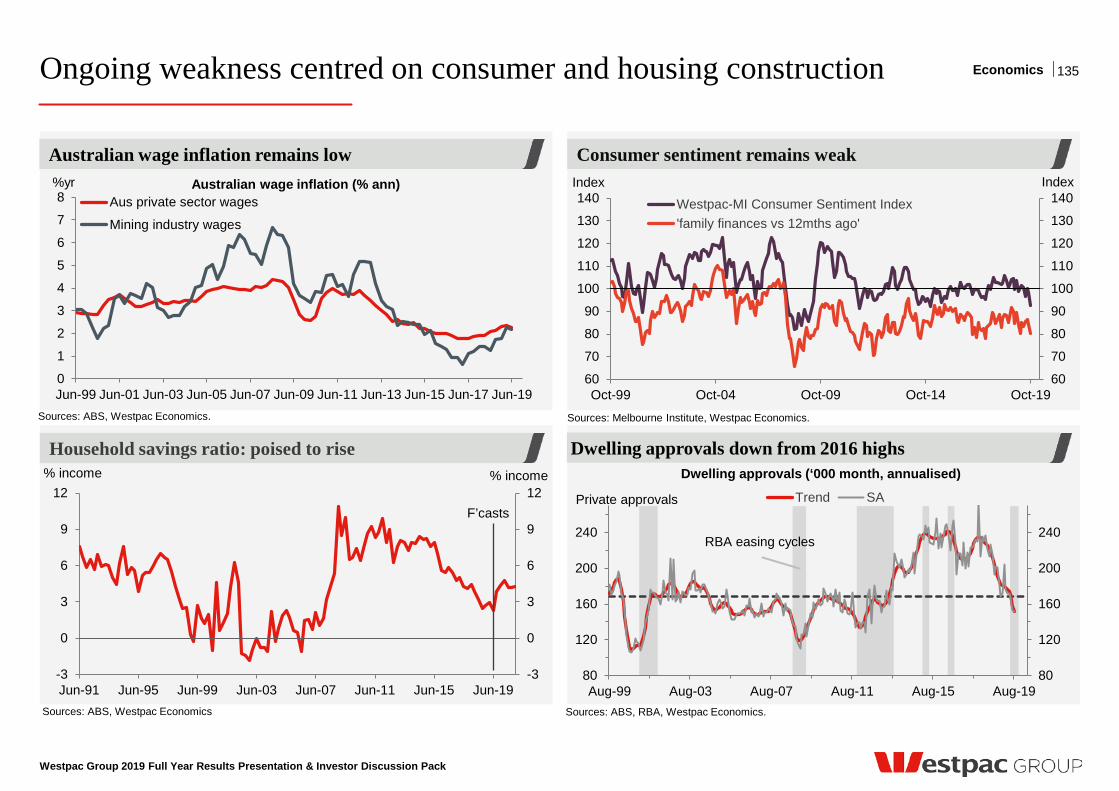
Ongoing weakness centred on consumer and housing construction
Westpac Group 2019 Full Year Results Presentation & Investor Discussion Pack
135
Australian wage inflation remains low
Sources: ABS, Westpac Economics.
Australian wage inflation (% ann)
0
1
2
3
4
5
6
7
8
Jun-99 Jun-01 Jun-03 Jun-05 Jun-07 Jun-09 Jun-11 Jun-13 Jun-15 Jun-17 Jun-19
%yr Aus private sector wages
Mining industry wages
Household savings ratio: poised to rise
Sources: ABS, Westpac Economics
Sources: Melbourne Institute, Westpac Economics.
60
70
80
90
100
110
120
130
140
60
70
80
90
100
110
120
130
140
Oct-99 Oct-04 Oct-09 Oct-14 Oct-19
Index Index Westpac-MI Consumer Sentiment Index'family finances vs 12mths ago'
-3
0
3
6
9
12
-3
0
3
6
9
12
Jun-91 Jun-95 Jun-99 Jun-03 Jun-07 Jun-11 Jun-15 Jun-19
% income % income
F’casts
Consumer sentiment remains weak
Dwelling approvals down from 2016 highs
Sources: ABS, RBA, Westpac Economics.
Dwelling approvals (‘000 month, annualised)
80
120
160
200
240
80
120
160
200
240
Aug-99 Aug-03 Aug-07 Aug-11 Aug-15 Aug-19
Trend SAPrivate approvals
RBA easing cycles
Economics
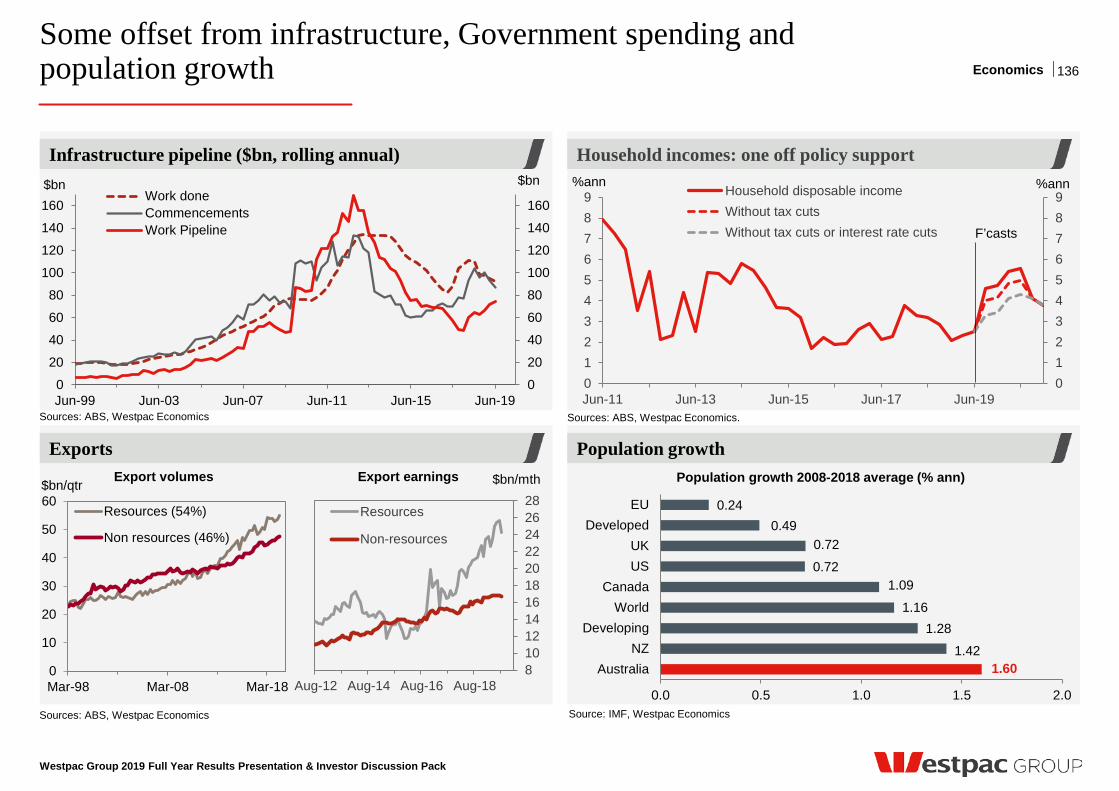
Some offset from infrastructure, Government spending and population growth
Westpac Group 2019 Full Year Results Presentation & Investor Discussion Pack
Household incomes: one off policy support Infrastructure pipeline ($bn, rolling annual)
Exports
136
Sources: ABS, Westpac Economics
0
20
40
60
80
100
120
140
160
0
20
40
60
80
100
120
140
160
Jun-99 Jun-03 Jun-07 Jun-11 Jun-15 Jun-19
$bn $bn Work doneCommencementsWork Pipeline
Sources: ABS, Westpac Economics
810121416182022242628
Aug-12 Aug-14 Aug-16 Aug-18
Resources
Non-resources
$bn/mth
0
10
20
30
40
50
60
Mar-98 Mar-08 Mar-18
Resources (54%)
Non resources (46%)
$bn/qtr Export volumes Export earnings
Population growth Population growth 2008-2018 average (% ann)
1.60 1.42
1.28 1.16
1.09 0.72
0.72 0.49
0.24
0.0 0.5 1.0 1.5 2.0
AustraliaNZ
DevelopingWorld
CanadaUSUK
DevelopedEU
Source: IMF, Westpac Economics
Sources: ABS, Westpac Economics.
0123456789
0123456789
Jun-11 Jun-13 Jun-15 Jun-17 Jun-19
%ann %ann Household disposable incomeWithout tax cutsWithout tax cuts or interest rate cuts F’casts
Economics
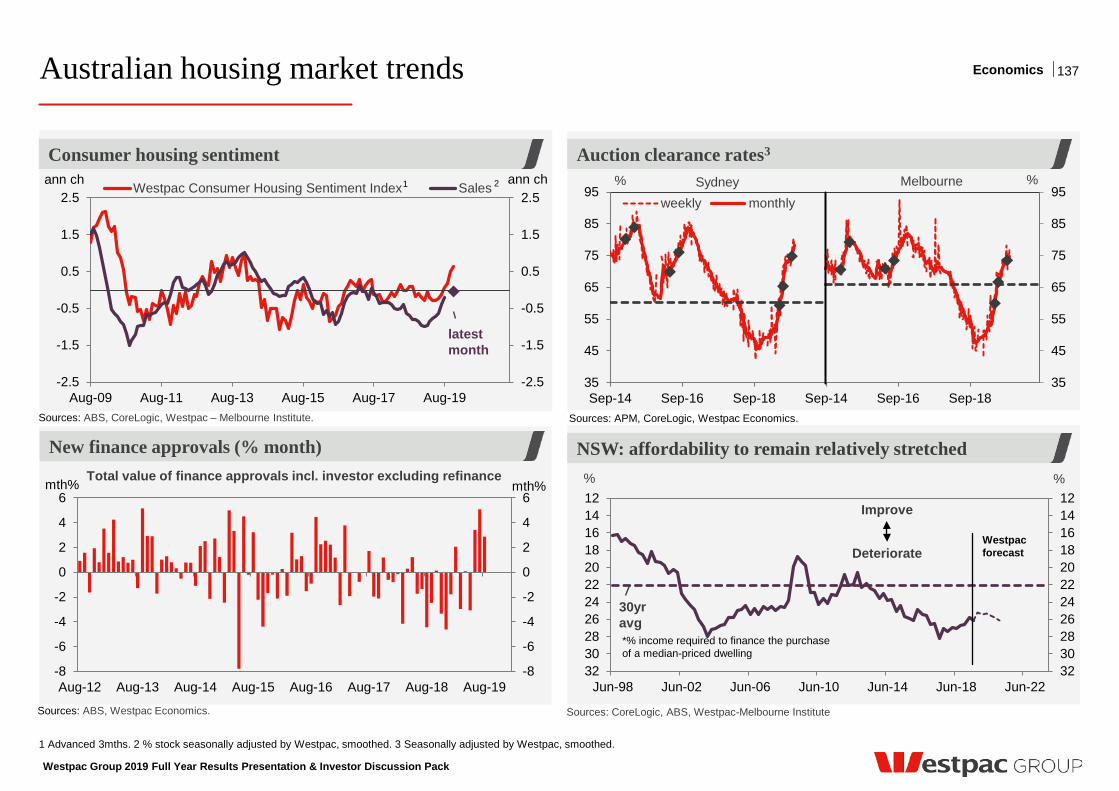
1214161820222426283032
1214161820222426283032
Jun-98 Jun-02 Jun-06 Jun-10 Jun-14 Jun-18 Jun-22
% %
Australian housing market trends
Westpac Group 2019 Full Year Results Presentation & Investor Discussion Pack
137
Consumer housing sentiment
Sources: ABS, CoreLogic, Westpac – Melbourne Institute.
Auction clearance rates3
NSW: affordability to remain relatively stretched
1 Advanced 3mths. 2 % stock seasonally adjusted by Westpac, smoothed. 3 Seasonally adjusted by Westpac, smoothed.
-2.5
-1.5
-0.5
0.5
1.5
2.5
-2.5
-1.5
-0.5
0.5
1.5
2.5
Aug-09 Aug-11 Aug-13 Aug-15 Aug-17 Aug-19
ann ch ann ch Westpac Consumer Housing Sentiment Index Sales
latest month
Sources: APM, CoreLogic, Westpac Economics.
35
45
55
65
75
85
95
35
45
55
65
75
85
95
Sep-14 Sep-16 Sep-18 Sep-14 Sep-16 Sep-18
% %
weekly monthlySydney Melbourne
Sources: CoreLogic, ABS, Westpac-Melbourne Institute
*% income required to finance the purchase of a median-priced dwelling
30yr avg
Deteriorate
Improve
Westpac forecast
New finance approvals (% month)
Sources: ABS, Westpac Economics.
-8
-6
-4
-2
0
2
4
6
-8
-6
-4
-2
0
2
4
6
Aug-12 Aug-13 Aug-14 Aug-15 Aug-16 Aug-17 Aug-18 Aug-19
mth% mth% Total value of finance approvals incl. investor excluding refinance
1 2
Economics
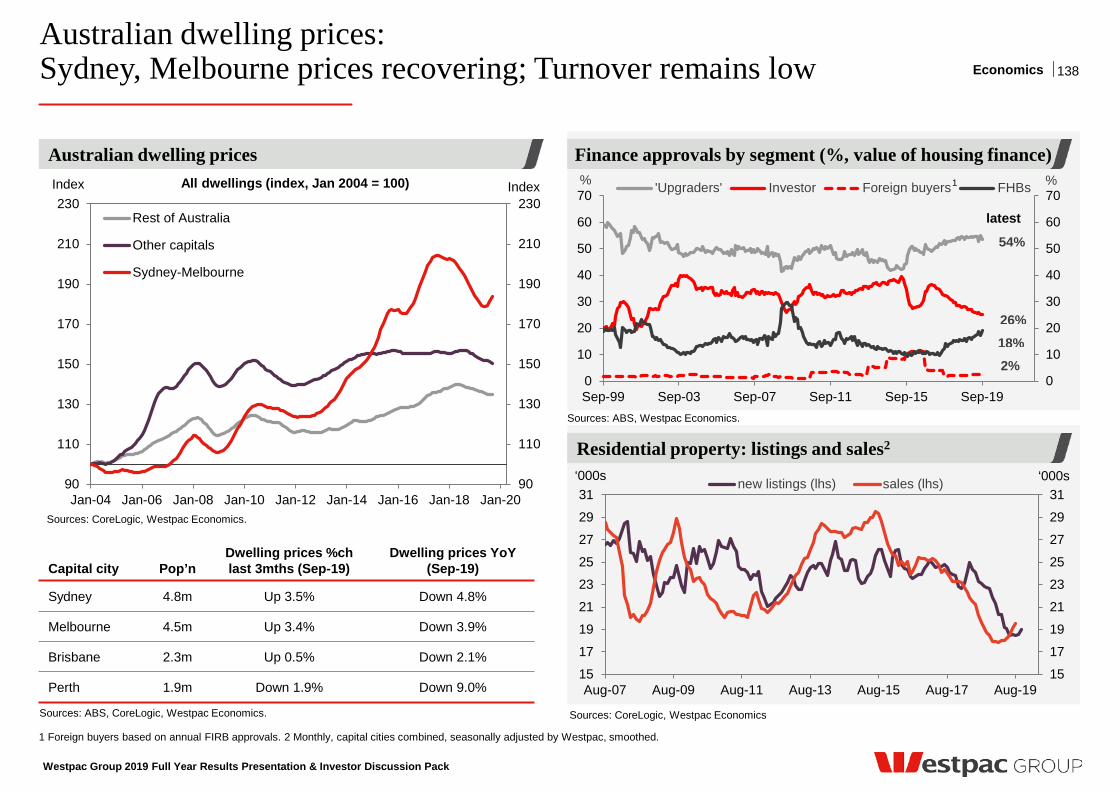
Australian dwelling prices: Sydney, Melbourne prices recovering; Turnover remains low
Westpac Group 2019 Full Year Results Presentation & Investor Discussion Pack
138
Australian dwelling prices
Sources: ABS, CoreLogic, Westpac Economics.
Sources: CoreLogic, Westpac Economics.
Capital city Pop’n Dwelling prices %ch last 3mths (Sep-19)
Dwelling prices YoY (Sep-19)
Sydney 4.8m Up 3.5% Down 4.8%
Melbourne 4.5m Up 3.4% Down 3.9%
Brisbane 2.3m Up 0.5% Down 2.1%
Perth 1.9m Down 1.9% Down 9.0%
Finance approvals by segment (%, value of housing finance)
Residential property: listings and sales2
90
110
130
150
170
190
210
230
90
110
130
150
170
190
210
230
Jan-04 Jan-06 Jan-08 Jan-10 Jan-12 Jan-14 Jan-16 Jan-18 Jan-20
Index
Rest of Australia
Other capitals
Sydney-Melbourne
All dwellings (index, Jan 2004 = 100)
Sources: CoreLogic, Westpac Economics
Index
1 Foreign buyers based on annual FIRB approvals. 2 Monthly, capital cities combined, seasonally adjusted by Westpac, smoothed.
15
17
19
21
23
25
27
29
31
15
17
19
21
23
25
27
29
31
Aug-07 Aug-09 Aug-11 Aug-13 Aug-15 Aug-17 Aug-19
‘000s ‘000s new listings (lhs) sales (lhs)
Sources: ABS, Westpac Economics.
0
10
20
30
40
50
60
70
0
10
20
30
40
50
60
70
Sep-99 Sep-03 Sep-07 Sep-11 Sep-15 Sep-19
% % 'Upgraders' Investor Foreign buyers FHBs
54%
26%
2% 18%
latest
1
Economics
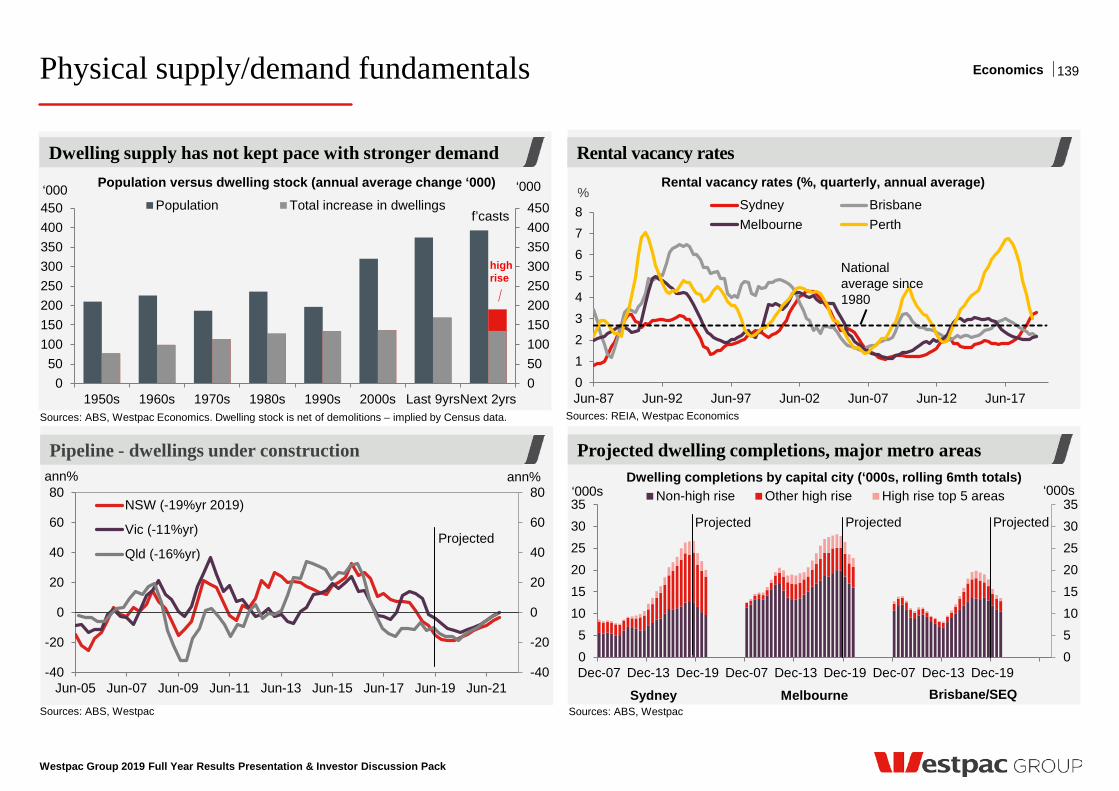
Physical supply/demand fundamentals
Sources: ABS, Westpac Economics. Dwelling stock is net of demolitions – implied by Census data.
Population versus dwelling stock (annual average change ‘000)
Dwelling supply has not kept pace with stronger demand
Projected dwelling completions, major metro areas
050100150200250300350400450
050
100150200250300350400450
1950s 1960s 1970s 1980s 1990s 2000s Last 9yrsNext 2yrs
‘000 ‘000 Population Total increase in dwellings
high rise
f’casts
05101520253035
05
101520253035
Dec-07 Dec-13 Dec-19 Dec-07 Dec-13 Dec-19 Dec-07 Dec-13 Dec-19
‘000s ‘000s Non-high rise Other high rise High rise top 5 areasDwelling completions by capital city (‘000s, rolling 6mth totals)
Projected
Sydney Brisbane/SEQ Melbourne
Projected
Rental vacancy rates
Sources: REIA, Westpac Economics
Rental vacancy rates (%, quarterly, annual average)
012345678
Jun-87 Jun-92 Jun-97 Jun-02 Jun-07 Jun-12 Jun-17
% Sydney BrisbaneMelbourne Perth
National average since 1980
Pipeline - dwellings under construction
Sources: ABS, Westpac
-40
-20
0
20
40
60
80
-40
-20
0
20
40
60
80
Jun-05 Jun-07 Jun-09 Jun-11 Jun-13 Jun-15 Jun-17 Jun-19 Jun-21
ann% ann%
NSW (-19%yr 2019)
Vic (-11%yr)
Qld (-16%yr)Projected
Projected
Westpac Group 2019 Full Year Results Presentation & Investor Discussion Pack
139
Sources: ABS, Westpac
Economics
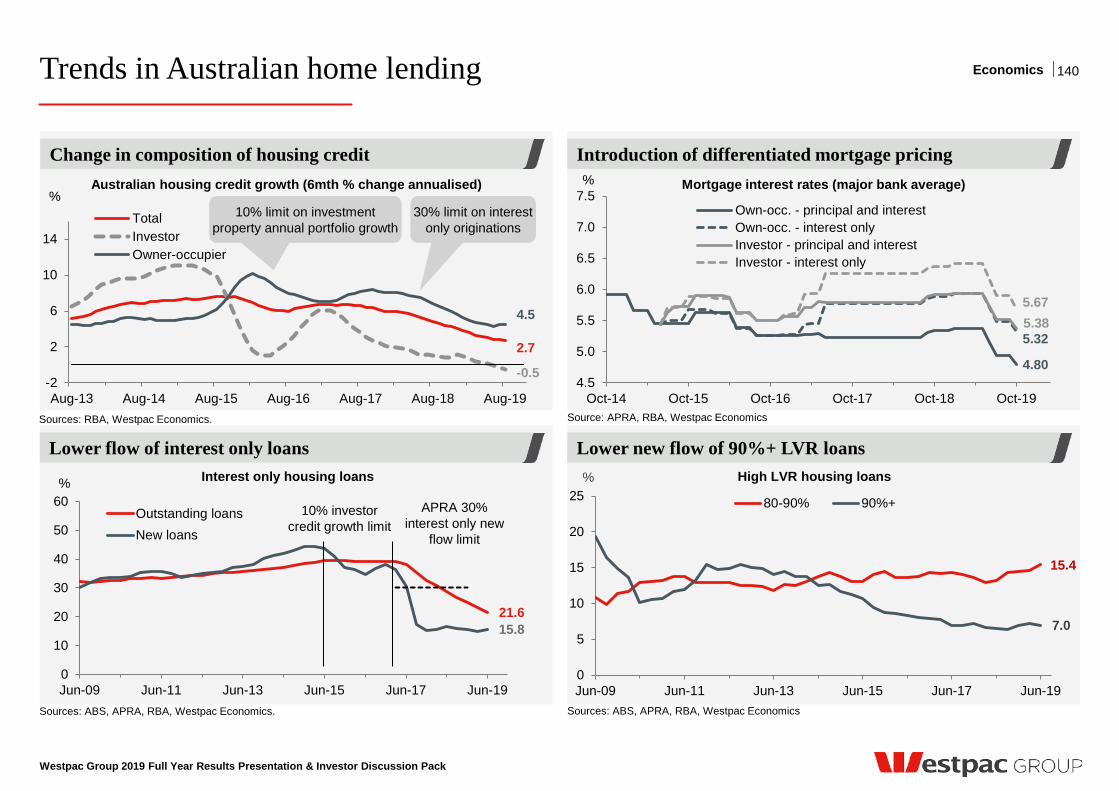
Trends in Australian home lending
Westpac Group 2019 Full Year Results Presentation & Investor Discussion Pack
Lower new flow of 90%+ LVR loans
Change in composition of housing credit
Lower flow of interest only loans
140
Sources: RBA, Westpac Economics.
Sources: ABS, APRA, RBA, Westpac Economics. Sources: ABS, APRA, RBA, Westpac Economics
Source: APRA, RBA, Westpac Economics
High LVR housing loans
4.80
5.32 5.38 5.67
4.5
5.0
5.5
6.0
6.5
7.0
7.5
Oct-14 Oct-15 Oct-16 Oct-17 Oct-18 Oct-19
%
Own-occ. - principal and interestOwn-occ. - interest onlyInvestor - principal and interestInvestor - interest only
Mortgage interest rates (major bank average)
21.6 15.8
0
10
20
30
40
50
60
Jun-09 Jun-11 Jun-13 Jun-15 Jun-17 Jun-19
%
Outstanding loansNew loans
10% investor credit growth limit
APRA 30% interest only new
flow limit
15.4
7.0
0
5
10
15
20
25
Jun-09 Jun-11 Jun-13 Jun-15 Jun-17 Jun-19
%
80-90% 90%+
Interest only housing loans
Introduction of differentiated mortgage pricing
2.7
-0.5
4.5
-2
2
6
10
14
Aug-13 Aug-14 Aug-15 Aug-16 Aug-17 Aug-18 Aug-19
TotalInvestorOwner-occupier
Australian housing credit growth (6mth % change annualised) %
10% limit on investment property annual portfolio growth
30% limit on interest only originations
Economics
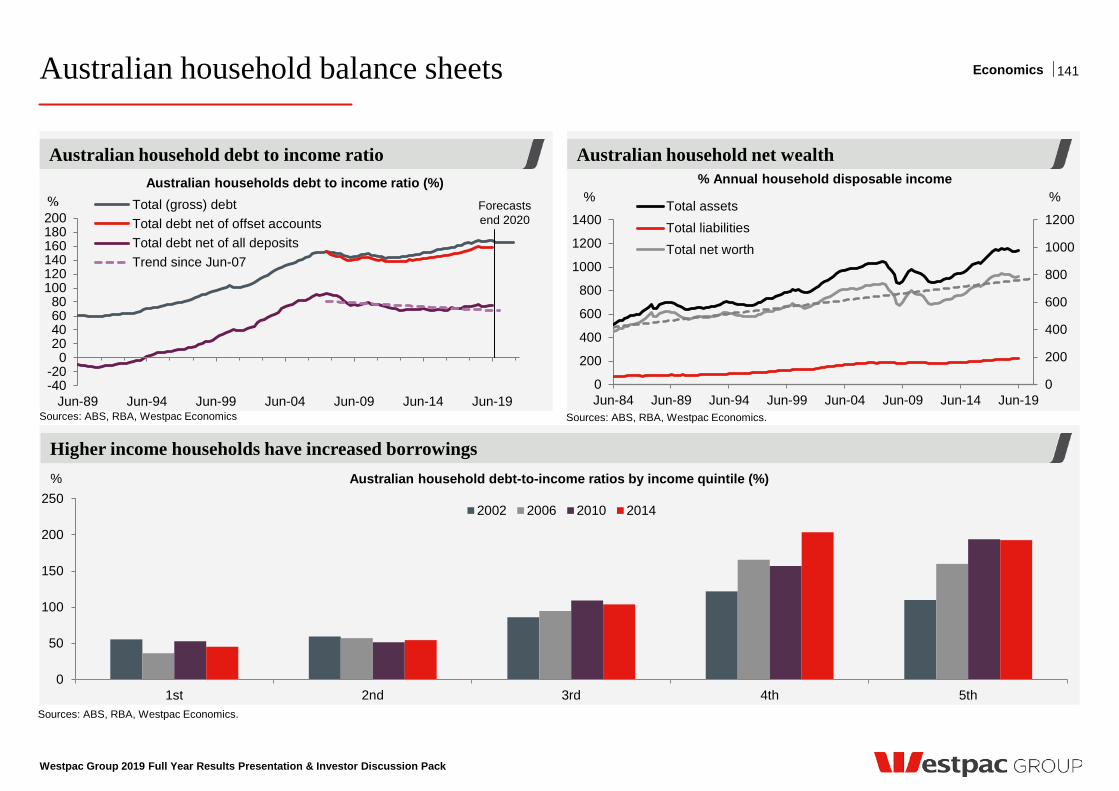
Australian household balance sheets
Westpac Group 2019 Full Year Results Presentation & Investor Discussion Pack
Higher income households have increased borrowings
Australian household net wealth
141
Australian household debt to income ratio
Sources: ABS, RBA, Westpac Economics.
Sources: ABS, RBA, Westpac Economics.
0
200
400
600
800
1000
1200
1400
Jun-84 Jun-89 Jun-94 Jun-99 Jun-04 Jun-09 Jun-14 Jun-190
200
400
600
800
1000
1200
% % Total assetsTotal liabilitiesTotal net worth
% Annual household disposable income
Australian household debt-to-income ratios by income quintile (%)
0
50
100
150
200
250
1st 2nd 3rd 4th 5th
2002 2006 2010 2014
%
Sources: ABS, RBA, Westpac Economics
Australian households debt to income ratio (%)
-40-20
020406080
100120140160180200
Jun-89 Jun-94 Jun-99 Jun-04 Jun-09 Jun-14 Jun-19
Total (gross) debtTotal debt net of offset accountsTotal debt net of all depositsTrend since Jun-07
Forecasts end 2020
Economics
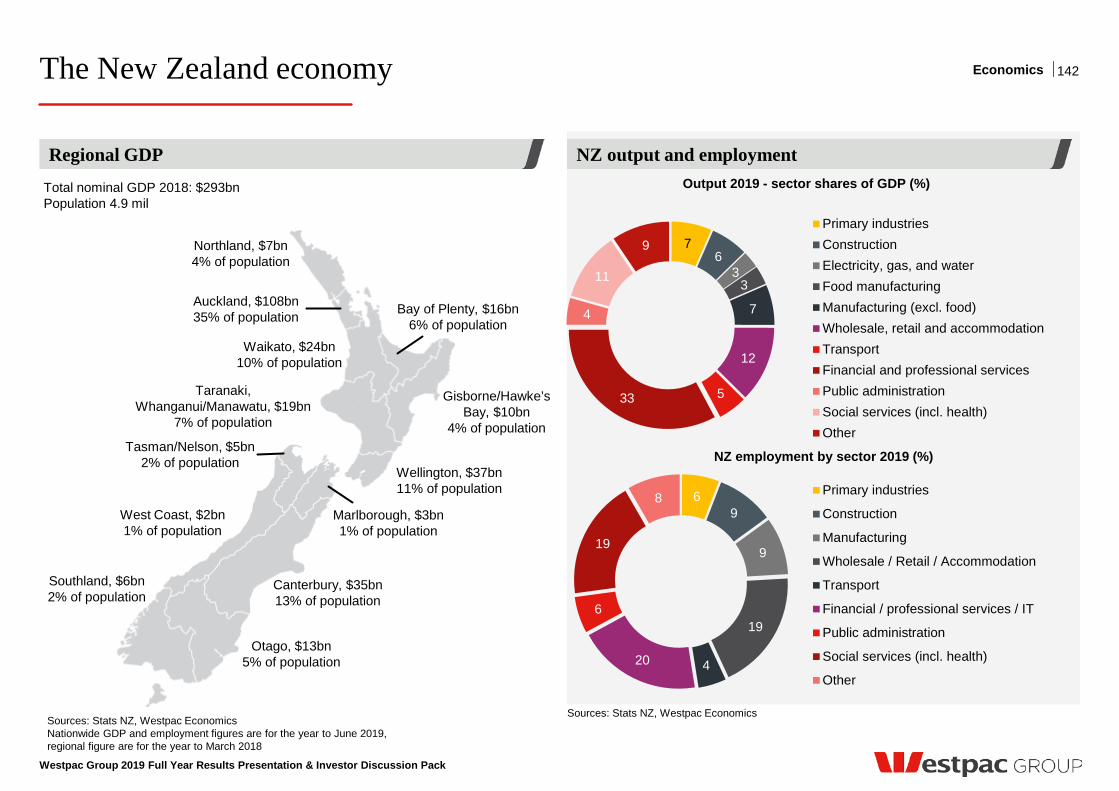
The New Zealand economy
Sources: Stats NZ, Westpac Economics Nationwide GDP and employment figures are for the year to June 2019, regional figure are for the year to March 2018
Regional GDP
Sources: Stats NZ, Westpac Economics
Output 2019 - sector shares of GDP (%)
NZ employment by sector 2019 (%)
NZ output and employment
Northland, $7bn 4% of population
Auckland, $108bn 35% of population
Waikato, $24bn 10% of population
Taranaki, Whanganui/Manawatu, $19bn
7% of population
Wellington, $37bn 11% of population
Bay of Plenty, $16bn 6% of population
Gisborne/Hawke’s Bay, $10bn
4% of population
Southland, $6bn 2% of population
Otago, $13bn 5% of population
Canterbury, $35bn 13% of population
West Coast, $2bn 1% of population
Tasman/Nelson, $5bn 2% of population
Marlborough, $3bn 1% of population
Total nominal GDP 2018: $293bn Population 4.9 mil
7 6
3 3
7
12
5 33
4
11
9 Primary industriesConstructionElectricity, gas, and waterFood manufacturingManufacturing (excl. food)Wholesale, retail and accommodationTransportFinancial and professional servicesPublic administrationSocial services (incl. health)Other
6 9
9
19
4 20
6
19
8 Primary industries
Construction
Manufacturing
Wholesale / Retail / Accommodation
Transport
Financial / professional services / IT
Public administration
Social services (incl. health)
Other
Westpac Group 2019 Full Year Results Presentation & Investor Discussion Pack
142 Economics
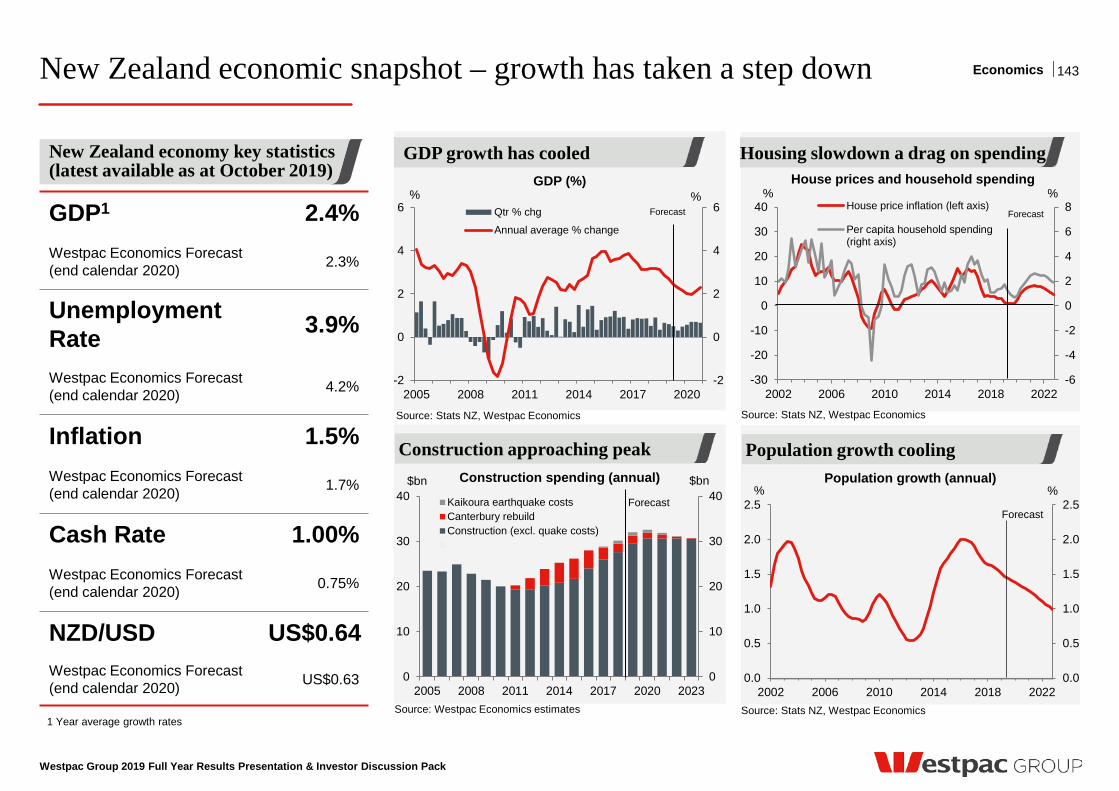
New Zealand economic snapshot – growth has taken a step down
New Zealand economy key statistics (latest available as at October 2019)
GDP1 2.4% Westpac Economics Forecast (end calendar 2020) 2.3%
Unemployment Rate 3.9%
Westpac Economics Forecast (end calendar 2020) 4.2%
Inflation 1.5% Westpac Economics Forecast (end calendar 2020) 1.7%
Cash Rate 1.00% Westpac Economics Forecast (end calendar 2020) 0.75%
NZD/USD US$0.64
Westpac Economics Forecast (end calendar 2020) US$0.63 0
10
20
30
40
0
10
20
30
40
2005 2008 2011 2014 2017 2020 2023
$bn $bn
Kaikoura earthquake costsCanterbury rebuildConstruction (excl. quake costs)
Construction spending (annual)
Source: Westpac Economics estimates Source: Stats NZ, Westpac Economics
Population growth (annual)
0.0
0.5
1.0
1.5
2.0
2.5
0.0
0.5
1.0
1.5
2.0
2.5
2002 2006 2010 2014 2018 2022
% %
Population growth cooling Construction approaching peak
Forecast Forecast
GDP growth has cooled
-2
0
2
4
6
-2
0
2
4
6
2005 2008 2011 2014 2017 2020
Qtr % chg
Annual average % change
Forecast
GDP (%) % %
Housing slowdown a drag on spending
-6
-4
-2
0
2
4
6
8
-30
-20
-10
0
10
20
30
40
2002 2006 2010 2014 2018 2022
House price inflation (left axis)
Per capita household spending(right axis)
% % Forecast
Source: Stats NZ, Westpac Economics Source: Stats NZ, Westpac Economics
House prices and household spending
1 Year average growth rates
Westpac Group 2019 Full Year Results Presentation & Investor Discussion Pack
143 Economics
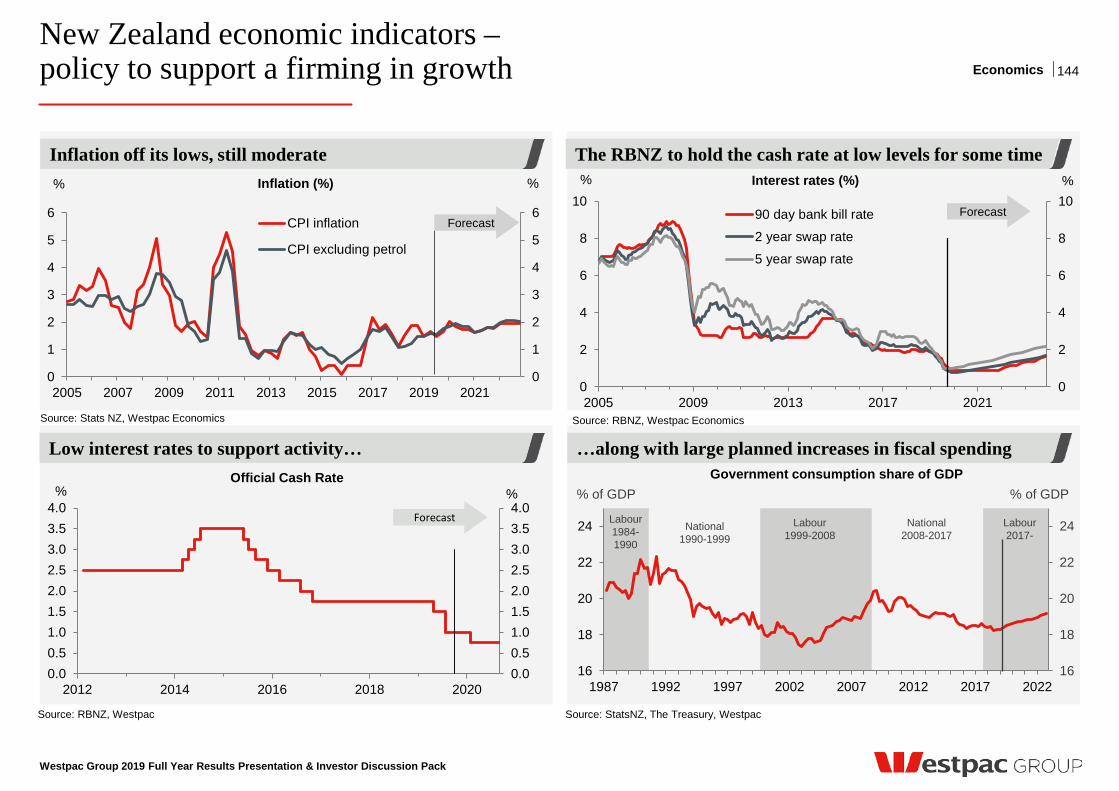
New Zealand economic indicators – policy to support a firming in growth
Westpac Group 2019 Full Year Results Presentation & Investor Discussion Pack
144
The RBNZ to hold the cash rate at low levels for some time Inflation off its lows, still moderate
0
1
2
3
4
5
6
0
1
2
3
4
5
6
2005 2007 2009 2011 2013 2015 2017 2019 2021
% %
CPI inflation
CPI excluding petrol
0
2
4
6
8
10
0
2
4
6
8
10
2005 2009 2013 2017 2021
% %
90 day bank bill rate
2 year swap rate
5 year swap rate
Inflation (%)
Source: Stats NZ, Westpac Economics Source: RBNZ, Westpac Economics
Forecast Forecast
Interest rates (%)
…along with large planned increases in fiscal spending Low interest rates to support activity…
Government consumption share of GDP
Source: RBNZ, Westpac Source: StatsNZ, The Treasury, Westpac
16
18
20
22
24
16
18
20
22
24
1987 1992 1997 2002 2007 2012 2017 2022
% of GDP % of GDP
National 1990-1999
National 2008-2017
Labour 2017-
Labour 1999-2008
Labour 1984- 1990
Official Cash Rate
0.00.51.01.52.02.53.03.54.0
0.00.51.01.52.02.53.03.54.0
2012 2014 2016 2018 2020
% %
Forecast
Economics
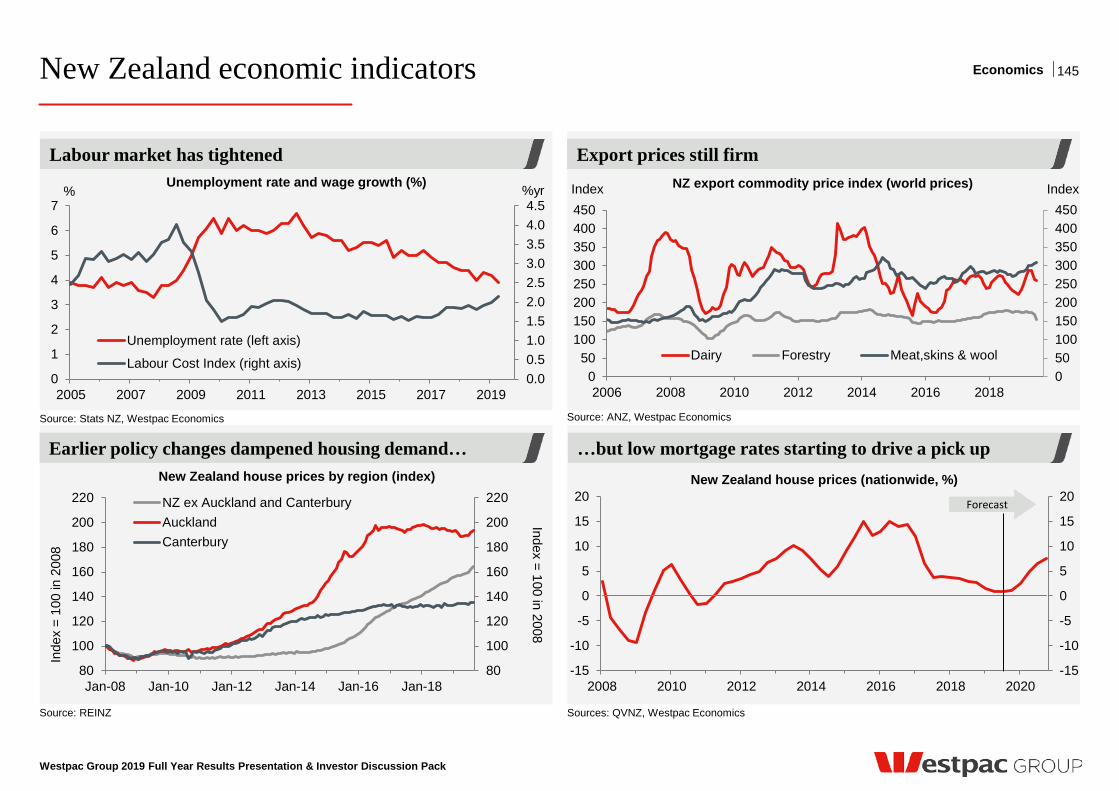
0.00.51.01.52.02.53.03.54.04.5
0
1
2
3
4
5
6
7
2005 2007 2009 2011 2013 2015 2017 2019
%yr %
Unemployment rate (left axis)
Labour Cost Index (right axis)
New Zealand economic indicators
Westpac Group 2019 Full Year Results Presentation & Investor Discussion Pack
145
Labour market has tightened Export prices remain favourable
050100150200250300350400450
050
100150200250300350400450
2006 2008 2010 2012 2014 2016 2018
Dairy Forestry Meat,skins & wool
Index Index
Source: ANZ, Westpac Economics
NZ export commodity price index (world prices) Unemployment rate and wage growth (%)
Source: Stats NZ, Westpac Economics
Labour market has tightened Export prices still firm
-15
-10
-5
0
5
10
15
20
-15
-10
-5
0
5
10
15
20
2008 2010 2012 2014 2016 2018 2020
Forecast
New Zealand house prices by region (index)
…but low mortgage rates starting to drive a pick up Earlier policy changes dampened housing demand…
Source: REINZ Sources: QVNZ, Westpac Economics
New Zealand house prices (nationwide, %)
80
100
120
140
160
180
200
220
80
100
120
140
160
180
200
220
Jan-08 Jan-10 Jan-12 Jan-14 Jan-16 Jan-18
NZ ex Auckland and CanterburyAucklandCanterbury
Inde
x =
100
in 2
008
Index = 100 in 2008
Economics

Appendix and Disclaimer
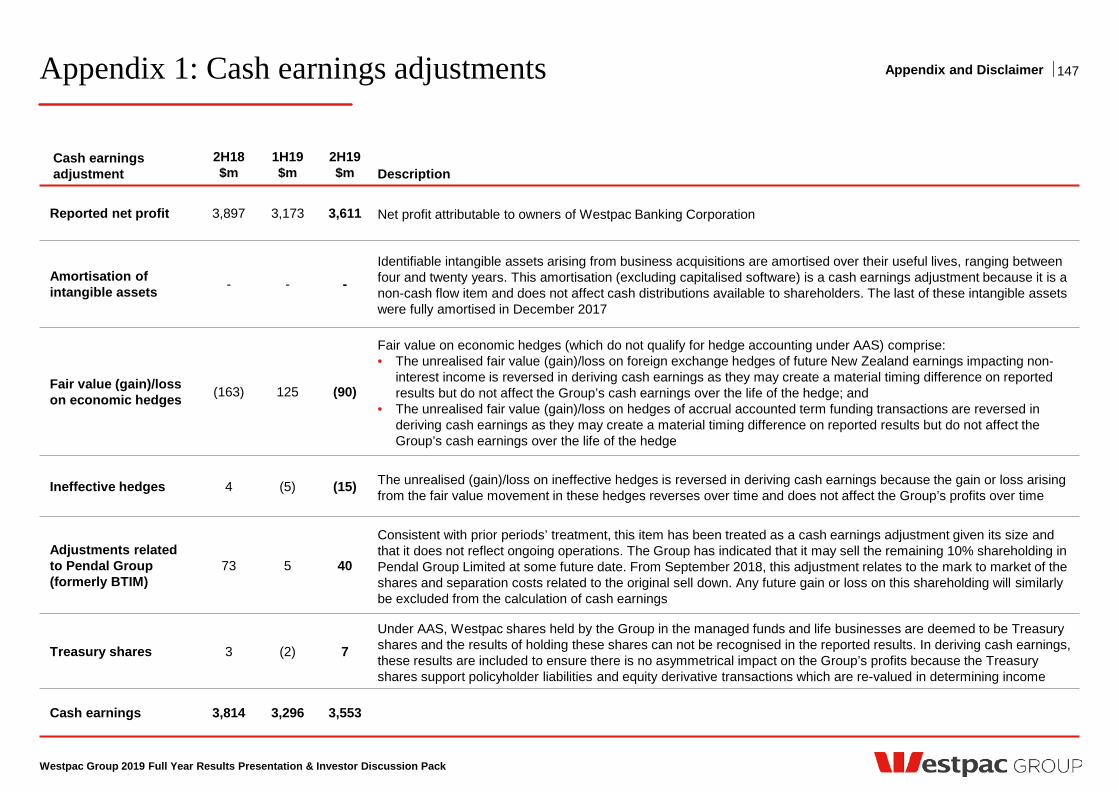
Appendix 1: Cash earnings adjustments Appendix and Disclaimer
Cash earnings adjustment
2H18 $m
1H19$m
2H19$m Description
Reported net profit 3,897 3,173 3,611 Net profit attributable to owners of Westpac Banking Corporation
Amortisation of intangible assets - - -
Identifiable intangible assets arising from business acquisitions are amortised over their useful lives, ranging between four and twenty years. This amortisation (excluding capitalised software) is a cash earnings adjustment because it is a non-cash flow item and does not affect cash distributions available to shareholders. The last of these intangible assets were fully amortised in December 2017
Fair value (gain)/loss on economic hedges (163) 125 (90)
Fair value on economic hedges (which do not qualify for hedge accounting under AAS) comprise: • The unrealised fair value (gain)/loss on foreign exchange hedges of future New Zealand earnings impacting non-
interest income is reversed in deriving cash earnings as they may create a material timing difference on reported results but do not affect the Group’s cash earnings over the life of the hedge; and
• The unrealised fair value (gain)/loss on hedges of accrual accounted term funding transactions are reversed in deriving cash earnings as they may create a material timing difference on reported results but do not affect the Group’s cash earnings over the life of the hedge
Ineffective hedges 4 (5) (15) The unrealised (gain)/loss on ineffective hedges is reversed in deriving cash earnings because the gain or loss arising from the fair value movement in these hedges reverses over time and does not affect the Group’s profits over time
Adjustments related to Pendal Group (formerly BTIM)
73 5 40
Consistent with prior periods’ treatment, this item has been treated as a cash earnings adjustment given its size and that it does not reflect ongoing operations. The Group has indicated that it may sell the remaining 10% shareholding in Pendal Group Limited at some future date. From September 2018, this adjustment relates to the mark to market of the shares and separation costs related to the original sell down. Any future gain or loss on this shareholding will similarly be excluded from the calculation of cash earnings
Treasury shares 3 (2) 7 Under AAS, Westpac shares held by the Group in the managed funds and life businesses are deemed to be Treasury shares and the results of holding these shares can not be recognised in the reported results. In deriving cash earnings, these results are included to ensure there is no asymmetrical impact on the Group’s profits because the Treasury shares support policyholder liabilities and equity derivative transactions which are re-valued in determining income
Cash earnings 3,814 3,296 3,553
Westpac Group 2019 Full Year Results Presentation & Investor Discussion Pack
147
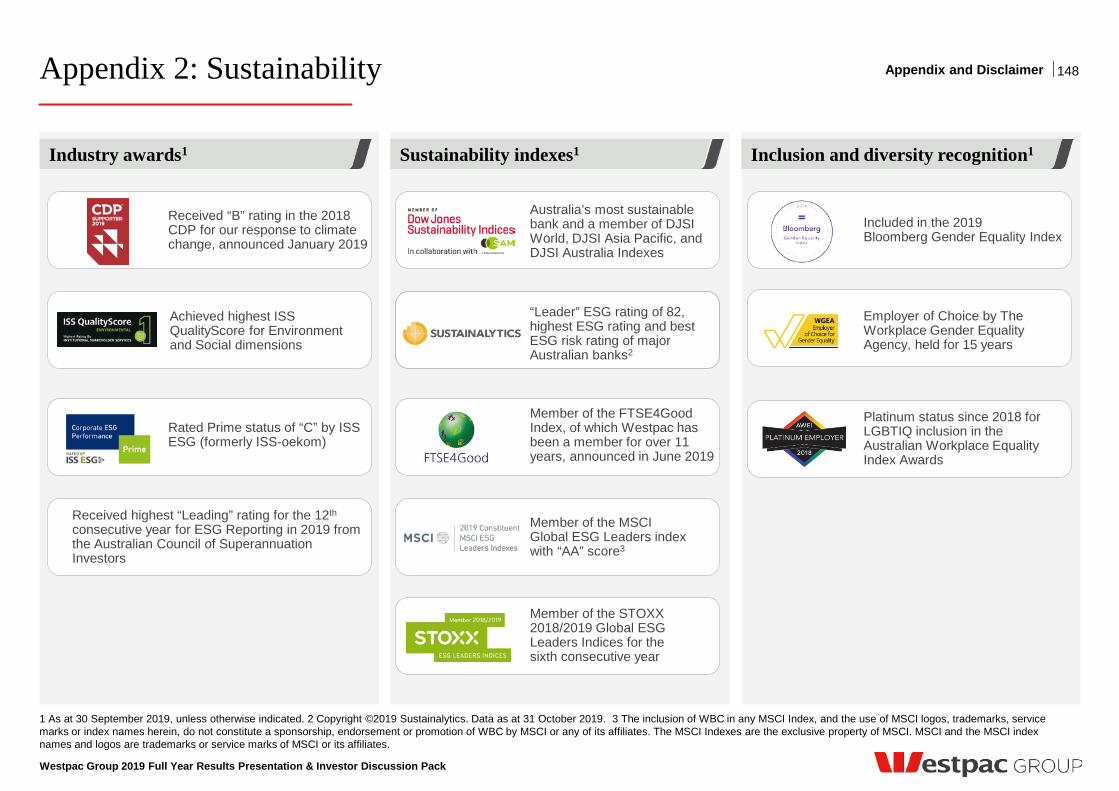
Appendix 2: Sustainability
Westpac Group 2019 Full Year Results Presentation & Investor Discussion Pack
1 As at 30 September 2019, unless otherwise indicated. 2 Copyright ©2019 Sustainalytics. Data as at 31 October 2019. 3 The inclusion of WBC in any MSCI Index, and the use of MSCI logos, trademarks, service marks or index names herein, do not constitute a sponsorship, endorsement or promotion of WBC by MSCI or any of its affiliates. The MSCI Indexes are the exclusive property of MSCI. MSCI and the MSCI index names and logos are trademarks or service marks of MSCI or its affiliates.
Industry awards1
148
Sustainability indexes1 Inclusion and diversity recognition1
Appendix and Disclaimer
Rated Prime status of “C” by ISS ESG (formerly ISS-oekom)
Member of the FTSE4Good Index, of which Westpac has been a member for over 11 years, announced in June 2019
Platinum status since 2018 for LGBTIQ inclusion in the Australian Workplace Equality Index Awards
Received highest “Leading” rating for the 12th consecutive year for ESG Reporting in 2019 from the Australian Council of Superannuation Investors
Member of the MSCI Global ESG Leaders index with “AA” score3
Member of the STOXX 2018/2019 Global ESG Leaders Indices for the sixth consecutive year
Received “B” rating in the 2018 CDP for our response to climate change, announced January 2019
Australia’s most sustainable bank and a member of DJSI World, DJSI Asia Pacific, and DJSI Australia Indexes
Included in the 2019 Bloomberg Gender Equality Index
Achieved highest ISS QualityScore for Environment and Social dimensions
“Leader” ESG rating of 82, highest ESG rating and best ESG risk rating of major Australian banks2
Employer of Choice by The Workplace Gender Equality Agency, held for 15 years
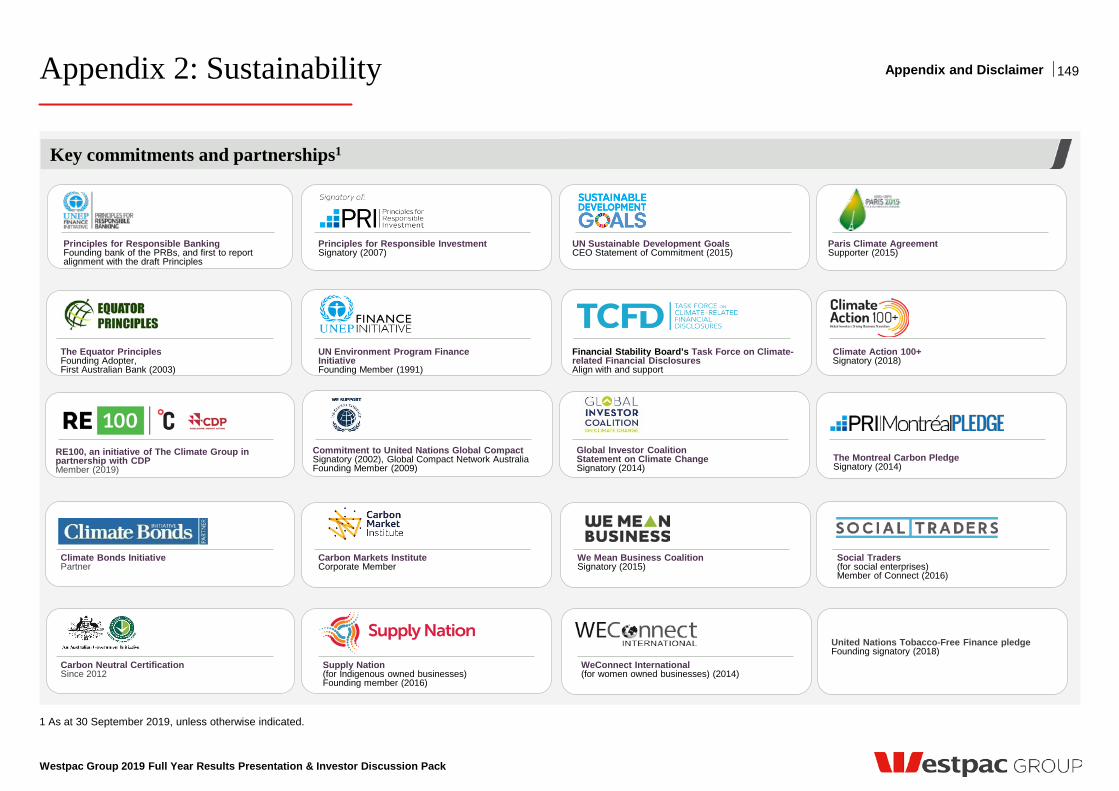
Appendix 2: Sustainability
Westpac Group 2019 Full Year Results Presentation & Investor Discussion Pack
1 As at 30 September 2019, unless otherwise indicated.
Key commitments and partnerships1
149 Appendix and Disclaimer
The Equator Principles Founding Adopter, First Australian Bank (2003)
Carbon Markets Institute Corporate Member
We Mean Business Coalition Signatory (2015)
Global Investor Coalition Statement on Climate Change Signatory (2014)
WeConnect International (for women owned businesses) (2014)
Climate Action 100+ Signatory (2018)
The Montreal Carbon Pledge Signatory (2014)
Social Traders (for social enterprises) Member of Connect (2016)
Financial Stability Board’s Task Force on Climate-related Financial Disclosures Align with and support
UN Environment Program Finance Initiative Founding Member (1991)
Commitment to United Nations Global Compact Signatory (2002), Global Compact Network Australia Founding Member (2009)
Principles for Responsible Investment Signatory (2007)
Climate Bonds Initiative Partner
Carbon Neutral Certification Since 2012
Supply Nation (for Indigenous owned businesses) Founding member (2016)
Principles for Responsible Banking Founding bank of the PRBs, and first to report alignment with the draft Principles
UN Sustainable Development Goals CEO Statement of Commitment (2015)
Paris Climate Agreement Supporter (2015)
United Nations Tobacco-Free Finance pledge Founding signatory (2018)
RE100, an initiative of The Climate Group in partnership with CDP Member (2019)
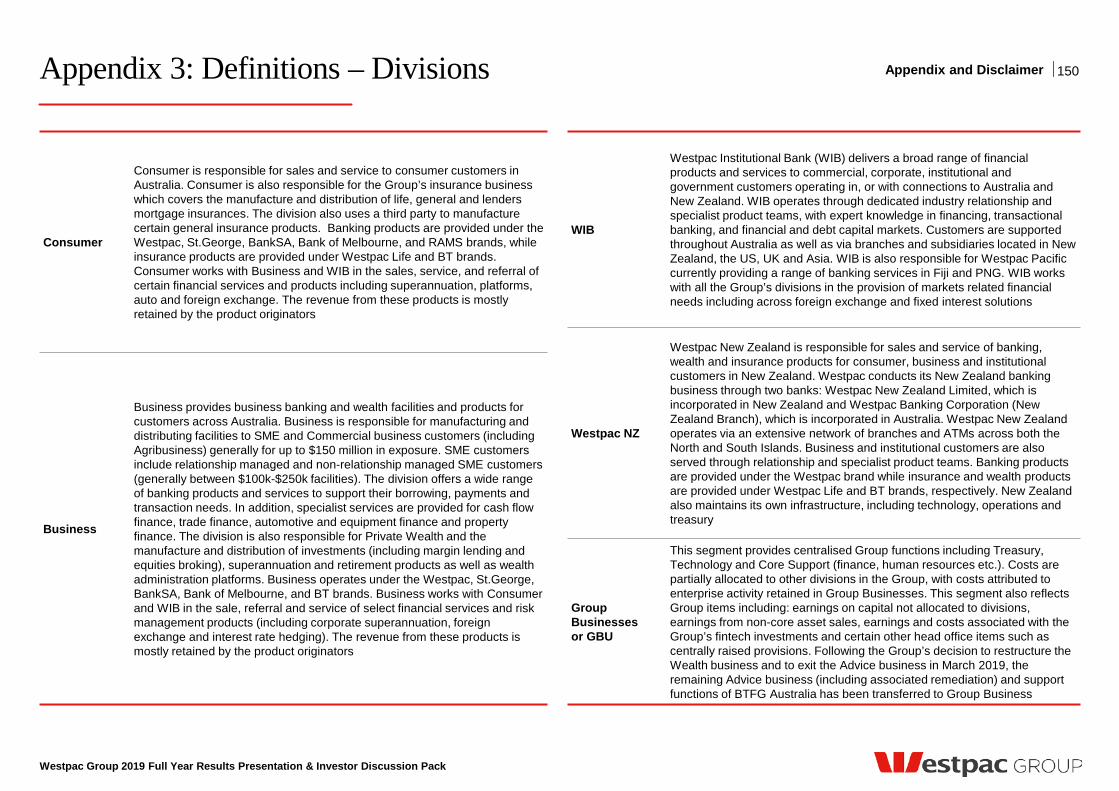
Appendix 3: Definitions – Divisions
Westpac Group 2019 Full Year Results Presentation & Investor Discussion Pack
Consumer
Consumer is responsible for sales and service to consumer customers in Australia. Consumer is also responsible for the Group’s insurance business which covers the manufacture and distribution of life, general and lenders mortgage insurances. The division also uses a third party to manufacture certain general insurance products. Banking products are provided under the Westpac, St.George, BankSA, Bank of Melbourne, and RAMS brands, while insurance products are provided under Westpac Life and BT brands. Consumer works with Business and WIB in the sales, service, and referral of certain financial services and products including superannuation, platforms, auto and foreign exchange. The revenue from these products is mostly retained by the product originators
Business
Business provides business banking and wealth facilities and products for customers across Australia. Business is responsible for manufacturing and distributing facilities to SME and Commercial business customers (including Agribusiness) generally for up to $150 million in exposure. SME customers include relationship managed and non-relationship managed SME customers (generally between $100k-$250k facilities). The division offers a wide range of banking products and services to support their borrowing, payments and transaction needs. In addition, specialist services are provided for cash flow finance, trade finance, automotive and equipment finance and property finance. The division is also responsible for Private Wealth and the manufacture and distribution of investments (including margin lending and equities broking), superannuation and retirement products as well as wealth administration platforms. Business operates under the Westpac, St.George, BankSA, Bank of Melbourne, and BT brands. Business works with Consumer and WIB in the sale, referral and service of select financial services and risk management products (including corporate superannuation, foreign exchange and interest rate hedging). The revenue from these products is mostly retained by the product originators
WIB
Westpac Institutional Bank (WIB) delivers a broad range of financial products and services to commercial, corporate, institutional and government customers operating in, or with connections to Australia and New Zealand. WIB operates through dedicated industry relationship and specialist product teams, with expert knowledge in financing, transactional banking, and financial and debt capital markets. Customers are supported throughout Australia as well as via branches and subsidiaries located in New Zealand, the US, UK and Asia. WIB is also responsible for Westpac Pacific currently providing a range of banking services in Fiji and PNG. WIB works with all the Group’s divisions in the provision of markets related financial needs including across foreign exchange and fixed interest solutions
Westpac NZ
Westpac New Zealand is responsible for sales and service of banking, wealth and insurance products for consumer, business and institutional customers in New Zealand. Westpac conducts its New Zealand banking business through two banks: Westpac New Zealand Limited, which is incorporated in New Zealand and Westpac Banking Corporation (New Zealand Branch), which is incorporated in Australia. Westpac New Zealand operates via an extensive network of branches and ATMs across both the North and South Islands. Business and institutional customers are also served through relationship and specialist product teams. Banking products are provided under the Westpac brand while insurance and wealth products are provided under Westpac Life and BT brands, respectively. New Zealand also maintains its own infrastructure, including technology, operations and treasury
Group Businesses or GBU
This segment provides centralised Group functions including Treasury, Technology and Core Support (finance, human resources etc.). Costs are partially allocated to other divisions in the Group, with costs attributed to enterprise activity retained in Group Businesses. This segment also reflects Group items including: earnings on capital not allocated to divisions, earnings from non-core asset sales, earnings and costs associated with the Group’s fintech investments and certain other head office items such as centrally raised provisions. Following the Group’s decision to restructure the Wealth business and to exit the Advice business in March 2019, the remaining Advice business (including associated remediation) and support functions of BTFG Australia has been transferred to Group Business
150 Appendix and Disclaimer
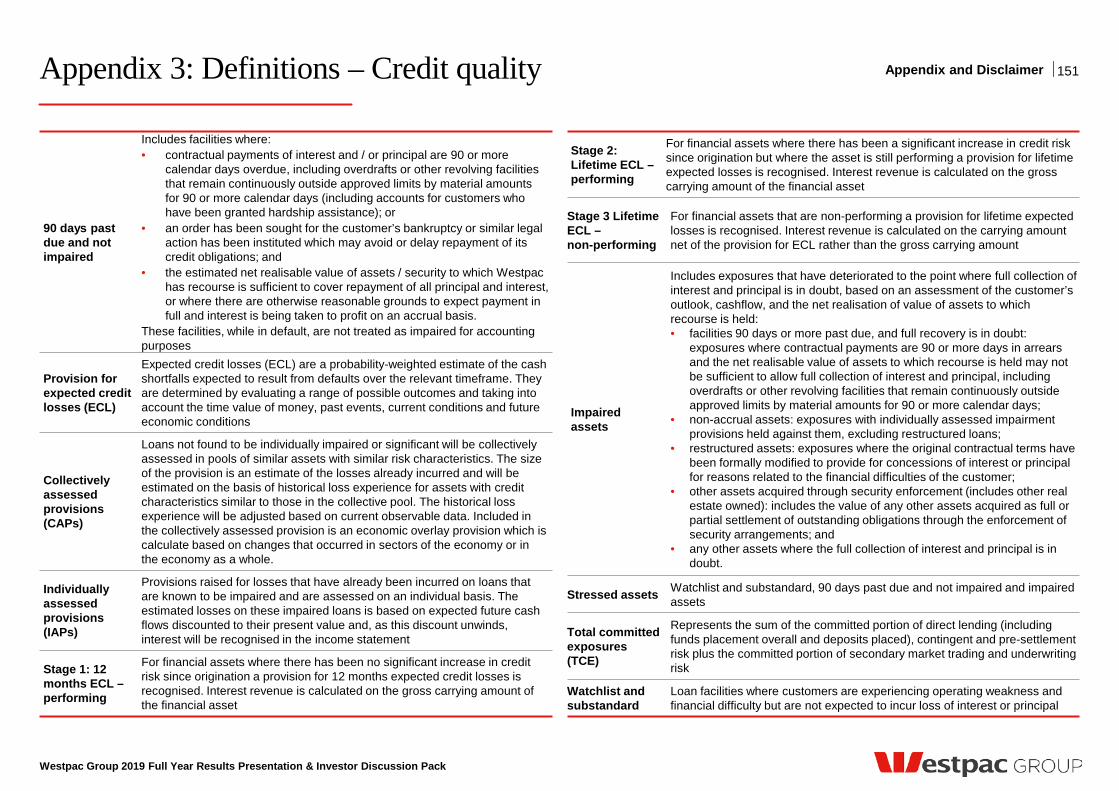
Appendix 3: Definitions – Credit quality
Westpac Group 2019 Full Year Results Presentation & Investor Discussion Pack
Stage 2: Lifetime ECL – performing
For financial assets where there has been a significant increase in credit risk since origination but where the asset is still performing a provision for lifetime expected losses is recognised. Interest revenue is calculated on the gross carrying amount of the financial asset
Stage 3 Lifetime ECL – non-performing
For financial assets that are non-performing a provision for lifetime expected losses is recognised. Interest revenue is calculated on the carrying amount net of the provision for ECL rather than the gross carrying amount
Impaired assets
Includes exposures that have deteriorated to the point where full collection of interest and principal is in doubt, based on an assessment of the customer’s outlook, cashflow, and the net realisation of value of assets to which recourse is held: • facilities 90 days or more past due, and full recovery is in doubt:
exposures where contractual payments are 90 or more days in arrears and the net realisable value of assets to which recourse is held may not be sufficient to allow full collection of interest and principal, including overdrafts or other revolving facilities that remain continuously outside approved limits by material amounts for 90 or more calendar days;
• non-accrual assets: exposures with individually assessed impairment provisions held against them, excluding restructured loans;
• restructured assets: exposures where the original contractual terms have been formally modified to provide for concessions of interest or principal for reasons related to the financial difficulties of the customer;
• other assets acquired through security enforcement (includes other real estate owned): includes the value of any other assets acquired as full or partial settlement of outstanding obligations through the enforcement of security arrangements; and
• any other assets where the full collection of interest and principal is in doubt.
Stressed assets Watchlist and substandard, 90 days past due and not impaired and impaired assets
Total committed exposures (TCE)
Represents the sum of the committed portion of direct lending (including funds placement overall and deposits placed), contingent and pre-settlement risk plus the committed portion of secondary market trading and underwriting risk
Watchlist and substandard
Loan facilities where customers are experiencing operating weakness and financial difficulty but are not expected to incur loss of interest or principal
90 days past due and not impaired
Includes facilities where: • contractual payments of interest and / or principal are 90 or more
calendar days overdue, including overdrafts or other revolving facilities that remain continuously outside approved limits by material amounts for 90 or more calendar days (including accounts for customers who have been granted hardship assistance); or
• an order has been sought for the customer’s bankruptcy or similar legal action has been instituted which may avoid or delay repayment of its credit obligations; and
• the estimated net realisable value of assets / security to which Westpac has recourse is sufficient to cover repayment of all principal and interest, or where there are otherwise reasonable grounds to expect payment in full and interest is being taken to profit on an accrual basis.
These facilities, while in default, are not treated as impaired for accounting purposes
Provision for expected credit losses (ECL)
Expected credit losses (ECL) are a probability-weighted estimate of the cash shortfalls expected to result from defaults over the relevant timeframe. They are determined by evaluating a range of possible outcomes and taking into account the time value of money, past events, current conditions and future economic conditions
Collectively assessed provisions (CAPs)
Loans not found to be individually impaired or significant will be collectively assessed in pools of similar assets with similar risk characteristics. The size of the provision is an estimate of the losses already incurred and will be estimated on the basis of historical loss experience for assets with credit characteristics similar to those in the collective pool. The historical loss experience will be adjusted based on current observable data. Included in the collectively assessed provision is an economic overlay provision which is calculate based on changes that occurred in sectors of the economy or in the economy as a whole.
Individually assessed provisions (IAPs)
Provisions raised for losses that have already been incurred on loans that are known to be impaired and are assessed on an individual basis. The estimated losses on these impaired loans is based on expected future cash flows discounted to their present value and, as this discount unwinds, interest will be recognised in the income statement
Stage 1: 12 months ECL – performing
For financial assets where there has been no significant increase in credit risk since origination a provision for 12 months expected credit losses is recognised. Interest revenue is calculated on the gross carrying amount of the financial asset
151 Appendix and Disclaimer
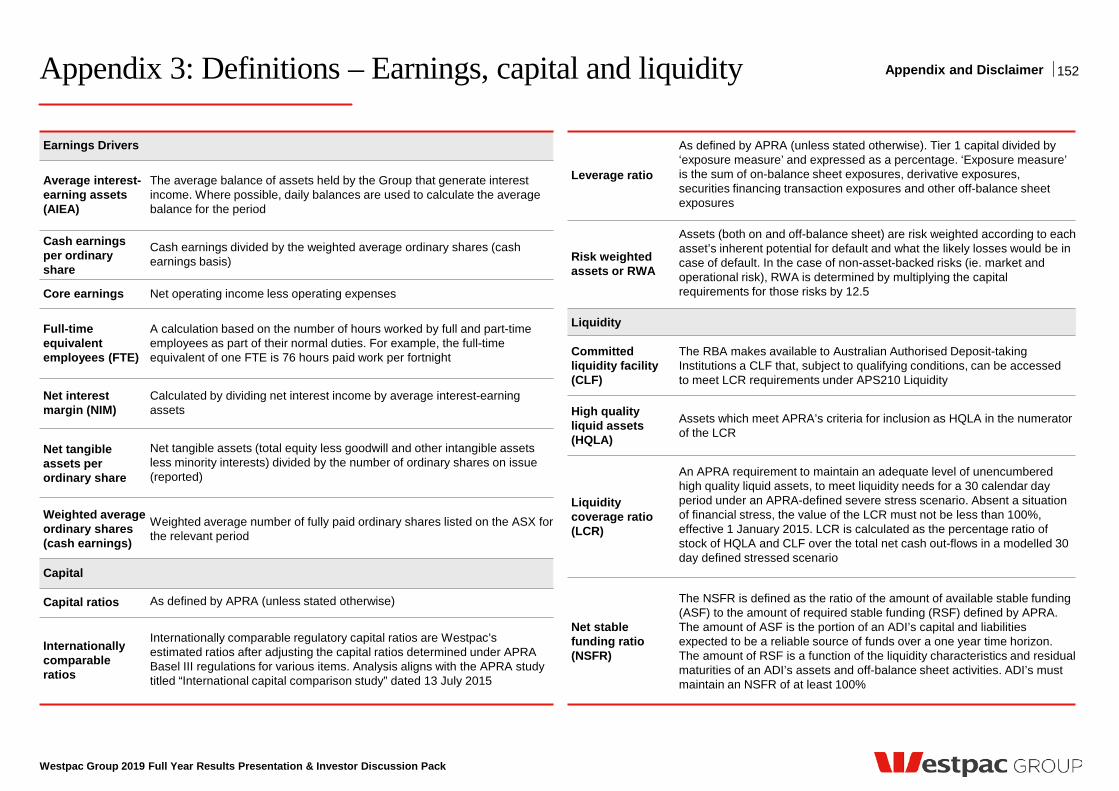
Appendix 3: Definitions – Earnings, capital and liquidity
Westpac Group 2019 Full Year Results Presentation & Investor Discussion Pack
Earnings Drivers
Average interest-earning assets (AIEA)
The average balance of assets held by the Group that generate interest income. Where possible, daily balances are used to calculate the average balance for the period
Cash earnings per ordinary share
Cash earnings divided by the weighted average ordinary shares (cash earnings basis)
Core earnings Net operating income less operating expenses
Full-time equivalent employees (FTE)
A calculation based on the number of hours worked by full and part-time employees as part of their normal duties. For example, the full-time equivalent of one FTE is 76 hours paid work per fortnight
Net interest margin (NIM)
Calculated by dividing net interest income by average interest-earning assets
Net tangible assets per ordinary share
Net tangible assets (total equity less goodwill and other intangible assets less minority interests) divided by the number of ordinary shares on issue (reported)
Weighted average ordinary shares (cash earnings)
Weighted average number of fully paid ordinary shares listed on the ASX for the relevant period
Capital
Capital ratios As defined by APRA (unless stated otherwise)
Internationally comparable ratios
Internationally comparable regulatory capital ratios are Westpac’s estimated ratios after adjusting the capital ratios determined under APRA Basel III regulations for various items. Analysis aligns with the APRA study titled “International capital comparison study” dated 13 July 2015
Leverage ratio
As defined by APRA (unless stated otherwise). Tier 1 capital divided by ‘exposure measure’ and expressed as a percentage. ‘Exposure measure’ is the sum of on-balance sheet exposures, derivative exposures, securities financing transaction exposures and other off-balance sheet exposures
Risk weighted assets or RWA
Assets (both on and off-balance sheet) are risk weighted according to each asset’s inherent potential for default and what the likely losses would be in case of default. In the case of non-asset-backed risks (ie. market and operational risk), RWA is determined by multiplying the capital requirements for those risks by 12.5
Liquidity
Committed liquidity facility (CLF)
The RBA makes available to Australian Authorised Deposit-taking Institutions a CLF that, subject to qualifying conditions, can be accessed to meet LCR requirements under APS210 Liquidity
High quality liquid assets (HQLA)
Assets which meet APRA’s criteria for inclusion as HQLA in the numerator of the LCR
Liquidity coverage ratio (LCR)
An APRA requirement to maintain an adequate level of unencumbered high quality liquid assets, to meet liquidity needs for a 30 calendar day period under an APRA-defined severe stress scenario. Absent a situation of financial stress, the value of the LCR must not be less than 100%, effective 1 January 2015. LCR is calculated as the percentage ratio of stock of HQLA and CLF over the total net cash out-flows in a modelled 30 day defined stressed scenario
Net stable funding ratio (NSFR)
The NSFR is defined as the ratio of the amount of available stable funding (ASF) to the amount of required stable funding (RSF) defined by APRA. The amount of ASF is the portion of an ADI’s capital and liabilities expected to be a reliable source of funds over a one year time horizon. The amount of RSF is a function of the liquidity characteristics and residual maturities of an ADI’s assets and off-balance sheet activities. ADI’s must maintain an NSFR of at least 100%
152 Appendix and Disclaimer
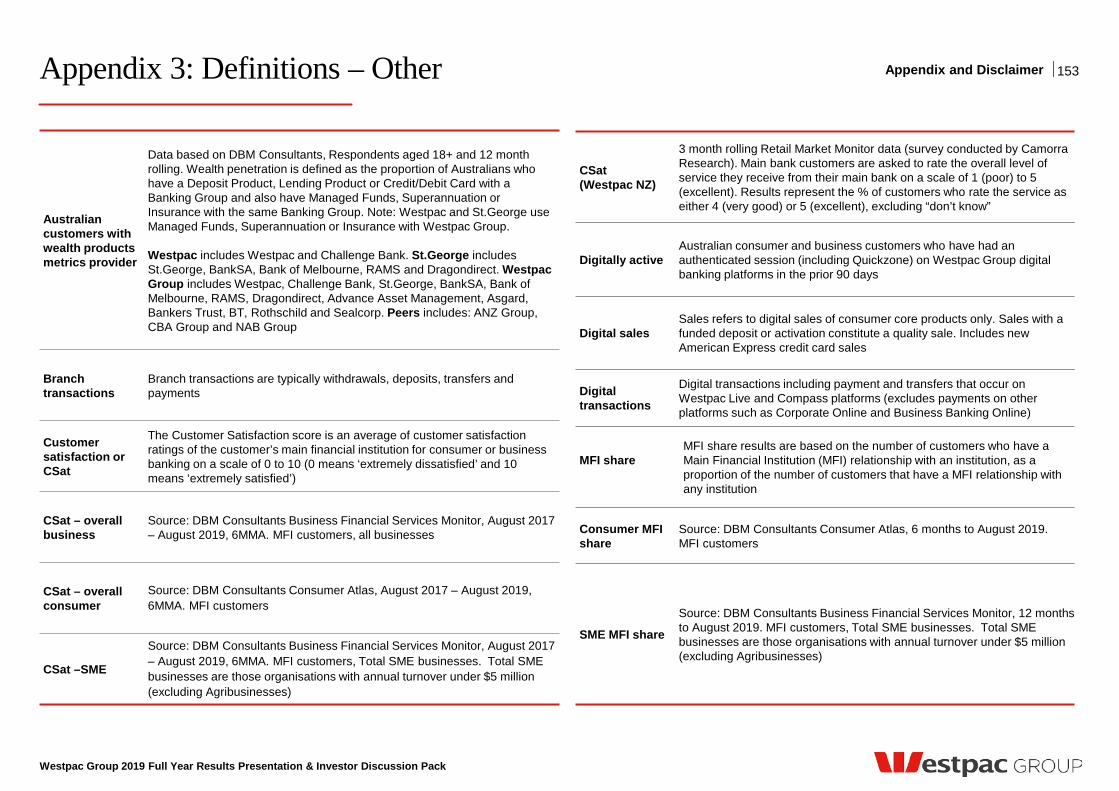
Appendix 3: Definitions – Other
Westpac Group 2019 Full Year Results Presentation & Investor Discussion Pack
Australian customers with wealth products metrics provider
Data based on DBM Consultants, Respondents aged 18+ and 12 month rolling. Wealth penetration is defined as the proportion of Australians who have a Deposit Product, Lending Product or Credit/Debit Card with a Banking Group and also have Managed Funds, Superannuation or Insurance with the same Banking Group. Note: Westpac and St.George use Managed Funds, Superannuation or Insurance with Westpac Group. Westpac includes Westpac and Challenge Bank. St.George includes St.George, BankSA, Bank of Melbourne, RAMS and Dragondirect. Westpac Group includes Westpac, Challenge Bank, St.George, BankSA, Bank of Melbourne, RAMS, Dragondirect, Advance Asset Management, Asgard, Bankers Trust, BT, Rothschild and Sealcorp. Peers includes: ANZ Group, CBA Group and NAB Group
Branch transactions
Branch transactions are typically withdrawals, deposits, transfers and payments
Customer satisfaction or CSat
The Customer Satisfaction score is an average of customer satisfaction ratings of the customer’s main financial institution for consumer or business banking on a scale of 0 to 10 (0 means ‘extremely dissatisfied’ and 10 means ‘extremely satisfied’)
CSat – overall business
Source: DBM Consultants Business Financial Services Monitor, August 2017 – August 2019, 6MMA. MFI customers, all businesses
CSat – overall consumer
Source: DBM Consultants Consumer Atlas, August 2017 – August 2019, 6MMA. MFI customers
CSat –SME
Source: DBM Consultants Business Financial Services Monitor, August 2017 – August 2019, 6MMA. MFI customers, Total SME businesses. Total SME businesses are those organisations with annual turnover under $5 million (excluding Agribusinesses)
CSat (Westpac NZ)
3 month rolling Retail Market Monitor data (survey conducted by Camorra Research). Main bank customers are asked to rate the overall level of service they receive from their main bank on a scale of 1 (poor) to 5 (excellent). Results represent the % of customers who rate the service as either 4 (very good) or 5 (excellent), excluding “don’t know”
Digitally active Australian consumer and business customers who have had an authenticated session (including Quickzone) on Westpac Group digital banking platforms in the prior 90 days
Digital sales Sales refers to digital sales of consumer core products only. Sales with a funded deposit or activation constitute a quality sale. Includes new American Express credit card sales
Digital transactions
Digital transactions including payment and transfers that occur on Westpac Live and Compass platforms (excludes payments on other platforms such as Corporate Online and Business Banking Online)
MFI share
MFI share results are based on the number of customers who have a Main Financial Institution (MFI) relationship with an institution, as a proportion of the number of customers that have a MFI relationship with any institution
Consumer MFI share
Source: DBM Consultants Consumer Atlas, 6 months to August 2019. MFI customers
SME MFI share
Source: DBM Consultants Business Financial Services Monitor, 12 months to August 2019. MFI customers, Total SME businesses. Total SME businesses are those organisations with annual turnover under $5 million (excluding Agribusinesses)
153 Appendix and Disclaimer
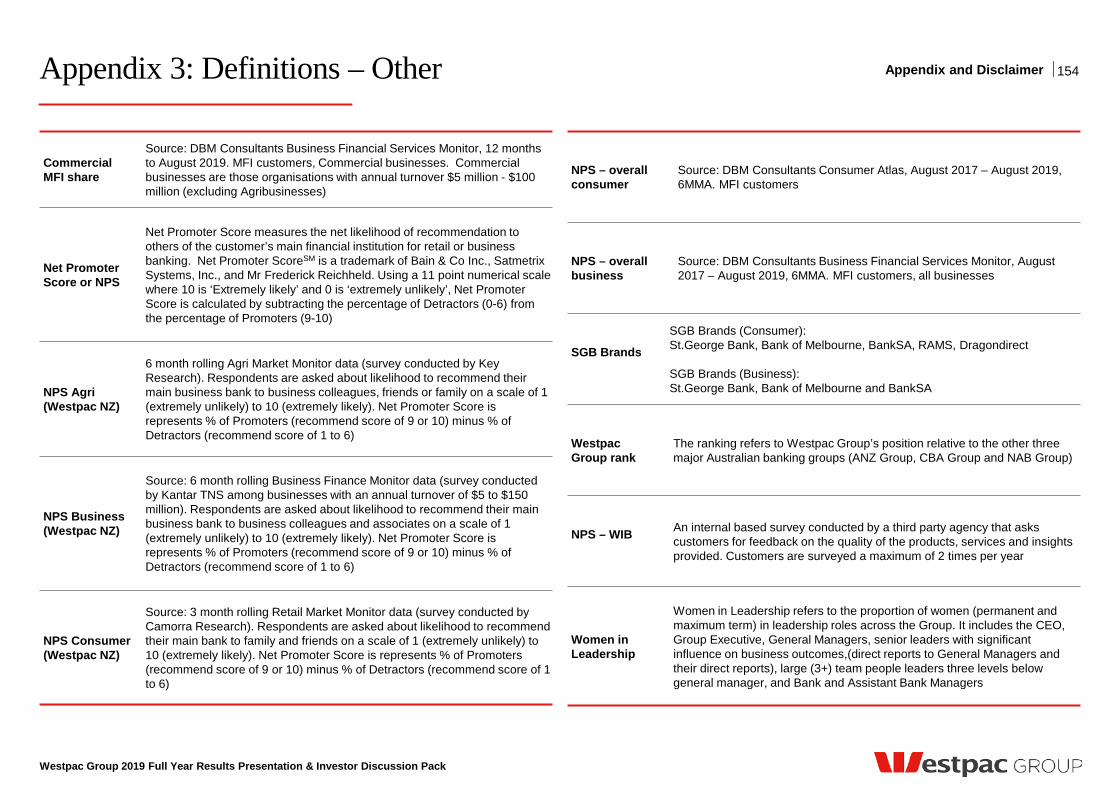
Appendix 3: Definitions – Other
Westpac Group 2019 Full Year Results Presentation & Investor Discussion Pack
NPS – overall consumer
Source: DBM Consultants Consumer Atlas, August 2017 – August 2019, 6MMA. MFI customers
NPS – overall business
Source: DBM Consultants Business Financial Services Monitor, August 2017 – August 2019, 6MMA. MFI customers, all businesses
SGB Brands
SGB Brands (Consumer): St.George Bank, Bank of Melbourne, BankSA, RAMS, Dragondirect SGB Brands (Business): St.George Bank, Bank of Melbourne and BankSA
Westpac Group rank
The ranking refers to Westpac Group’s position relative to the other three major Australian banking groups (ANZ Group, CBA Group and NAB Group)
NPS – WIB
An internal based survey conducted by a third party agency that asks customers for feedback on the quality of the products, services and insights provided. Customers are surveyed a maximum of 2 times per year
Women in Leadership
Women in Leadership refers to the proportion of women (permanent and maximum term) in leadership roles across the Group. It includes the CEO, Group Executive, General Managers, senior leaders with significant influence on business outcomes,(direct reports to General Managers and their direct reports), large (3+) team people leaders three levels below general manager, and Bank and Assistant Bank Managers
Commercial MFI share
Source: DBM Consultants Business Financial Services Monitor, 12 months to August 2019. MFI customers, Commercial businesses. Commercial businesses are those organisations with annual turnover $5 million - $100 million (excluding Agribusinesses)
Net Promoter Score or NPS
Net Promoter Score measures the net likelihood of recommendation to others of the customer’s main financial institution for retail or business banking. Net Promoter ScoreSM is a trademark of Bain & Co Inc., Satmetrix Systems, Inc., and Mr Frederick Reichheld. Using a 11 point numerical scale where 10 is ‘Extremely likely’ and 0 is ‘extremely unlikely’, Net Promoter Score is calculated by subtracting the percentage of Detractors (0-6) from the percentage of Promoters (9-10)
NPS Agri (Westpac NZ)
6 month rolling Agri Market Monitor data (survey conducted by Key Research). Respondents are asked about likelihood to recommend their main business bank to business colleagues, friends or family on a scale of 1 (extremely unlikely) to 10 (extremely likely). Net Promoter Score is represents % of Promoters (recommend score of 9 or 10) minus % of Detractors (recommend score of 1 to 6)
NPS Business (Westpac NZ)
Source: 6 month rolling Business Finance Monitor data (survey conducted by Kantar TNS among businesses with an annual turnover of $5 to $150 million). Respondents are asked about likelihood to recommend their main business bank to business colleagues and associates on a scale of 1 (extremely unlikely) to 10 (extremely likely). Net Promoter Score is represents % of Promoters (recommend score of 9 or 10) minus % of Detractors (recommend score of 1 to 6)
NPS Consumer (Westpac NZ)
Source: 3 month rolling Retail Market Monitor data (survey conducted by Camorra Research). Respondents are asked about likelihood to recommend their main bank to family and friends on a scale of 1 (extremely unlikely) to 10 (extremely likely). Net Promoter Score is represents % of Promoters (recommend score of 9 or 10) minus % of Detractors (recommend score of 1 to 6)
154 Appendix and Disclaimer
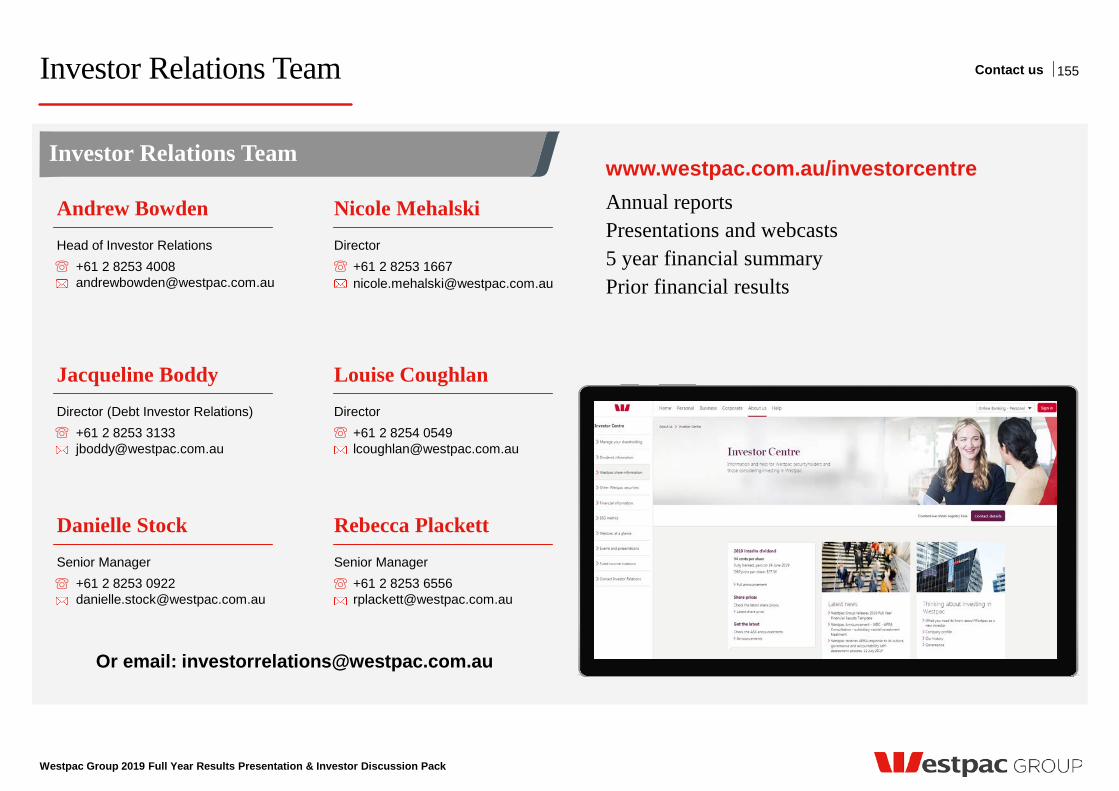
Westpac Group 2019 Full Year Results Presentation & Investor Discussion Pack
Investor Relations Team
155 Contact us
Investor Relations Team
Nicole Mehalski Director +61 2 8253 1667 [email protected]
Andrew Bowden Head of Investor Relations +61 2 8253 4008 [email protected]
Louise Coughlan Director +61 2 8254 0549 [email protected]
Jacqueline Boddy Director (Debt Investor Relations) +61 2 8253 3133 [email protected]
Rebecca Plackett Senior Manager +61 2 8253 6556 [email protected]
Danielle Stock Senior Manager +61 2 8253 0922 [email protected]
Or email: [email protected]
www.westpac.com.au/investorcentre Annual reports Presentations and webcasts 5 year financial summary Prior financial results
Westpac Group 2019 Full Year Results Presentation & Investor Discussion Pack
Disclaimer
The material contained in this presentation is intended to be general background information on Westpac Banking Corporation (Westpac) and its activities.
The information is supplied in summary form and is therefore not necessarily complete. It is not intended that it be relied upon as advice to investors or potential investors, who should consider seeking independent professional advice depending upon their specific investment objectives, financial situation or particular needs. The material contained in this presentation may include information derived from publicly available sources that have not been independently verified. No representation or warranty is made as to the accuracy, completeness or reliability of the information.
All amounts are in Australian dollars unless otherwise indicated.
Unless otherwise noted, financial information in this presentation is presented on a cash earnings basis. Cash earnings is a non-GAAP measure. Refer to Westpac’s 2019 Full Year Financial Results (incorporating the requirements of Appendix 4E) for the twelve months ended 30 September 2019 available at www.westpac.com.au for details of the basis of preparation of cash earnings. Refer to page 42 for an explanation of cash earnings and Appendix 1 page 147 for a reconciliation of reported net profit to cash earnings.
This presentation contains statements that constitute “forward-looking statements” within the meaning of Section 21E of the US Securities Exchange Act of 1934. Forward-looking statements are statements about matters that are not historical facts. Forward-looking statements appear in a number of places in this presentation and include statements regarding our intent, belief or current expectations with respect to our business and operations, market conditions, results of operations and financial condition, including, without limitation, future loan loss provisions, financial support to certain borrowers, indicative drivers, forecasted economic indicators and performance metric outcomes.
We use words such as ‘will’, ‘may’, ‘expect’, ‘intend’, ‘seek’, ‘would’, ‘should’, ‘could’, ‘continue’, ‘plan’, ‘estimate’, ‘anticipate’, ‘believe’, ‘probability’, ‘risk’, ‘aim’, or other similar words to identify forward-looking statements. These forward-looking statements reflect our current views with respect to future events and are subject to change, certain risks, uncertainties and assumptions which are, in many instances, beyond our control, and have been made based upon management’s expectations and beliefs concerning future developments and their potential effect upon us. There can be no assurance that future developments will be in accordance with our expectations or that the effect of future developments on us will be those anticipated. Actual results could differ materially from those which we expect, depending on the outcome of various factors. Factors that may impact on the forward-looking statements made include, but are not limited to, those described in the section titled ‘Risk factors' in Westpac’s 2019 Annual Report for the year ended 30 September 2019 available at www.westpac.com.au. When relying on forward-looking statements to make decisions with respect to us, investors and others should carefully consider such factors and other uncertainties and events. We are under no obligation to update any forward-looking statements contained in this presentation, whether as a result of new information, future events or otherwise, after the date of this presentation.
This presentation does not constitute an offer to sell, or the solicitation of an offer to buy, any securities in the United States. The securities to be offered and sold under the capital raising have not been, and will not be, registered under the U.S. Securities Act of 1933 (the “U.S. Securities Act”) or the securities laws of any state or other jurisdiction of the United States. The securities to be offered in the Placement may not be offered or sold, directly or indirectly, to any person in the United States, except pursuant to an exemption from, or in a transaction not subject to, the registration requirements of the U.S. Securities Act and any other applicable U.S. state securities laws. Securities to be offered under the SPP may not be offered or sold, directly or indirectly, to any person in the United States or any person that is acting for the account or benefit of a person in the United States.
156


![[ PowerPoint Template ]](https://img.pdfslide.net/doc/110x75/631afe995d5809cabd0fa04b/-powerpoint-template-.jpg)


