Embed Size (px)
Citation preview

Chapter 6: Instrumentation for Research and Management in Animal Agriculture
Roger A. Eigenberg, Ray A. Bucklin, Tami M. Brown-Brandl
Introduction All living organisms respond to their environment through sensible and latent heat
exchange processes. Many problems in animal agriculture involve interactions with environmental factors—temperature, humidity, solar radiation, and wind—which gov-ern these processes. The interplay among temperature, humidity, and solar radiation can be critical, as there is a defined range of thermal conditions within which animals can maintain homeothermy through behavioral and physiological means, while con-tinuing to consume feed at levels needed to maintain production and health (Hahn, 1999). Management decisions for livestock or environmental control systems require accurate environmental measurements. Livestock research also requires accurate monitoring and control of environment to develop needed relationships between such measures for developing models of animal performance.
Instrumentation plays a vital role in the monitoring of physiological responses of animals to their environment. Some of the important responses measured are feed and water intake, heat production, hormone levels, heart rate, respiration rate, body weight, body temperature, and behavioral changes. Some responses, such as respiration rate, can be measured by traditional means, for example using a stop watch while counting flank movements. However, long-term studies requiring frequent measurements can become tedious and labor intensive. Instrumentation to monitor physiological re-sponses is desirable in order to: (1) increase the frequency of measurements to evalu-ate the dynamics of responses, (2) provide consistent and unbiased data, (3) avoid pos-sible influence of an observer on the animal, and (4) reduce labor requirements for data collection.

132 Chapter 6: Instrumentation for Research and Management in Animal Agriculture
Modern instrumentation offers many options for researchers to collect and interpret data on an animal’s environment and its response to that environment. The challenge is to select the appropriate instrumentation for the application at hand. The discussions that follow provide guidance for that task.
Physiological Measurements Body Temperature
Body temperature is an important parameter when studying livestock stress. For most purposes, measurement of the deep body or core temperature is desired. Up until the 1980s, most measurements of the deep body temperatures of livestock were made using mercury rectal thermometers. After 1980, reliable and affordable electronic dataloggers became available and were used with thermocouples, infrared sensors, and thermistor temperature sensors to replace short-term measurements using mercury thermometers. Continuous temperature measurements are now made using several techniques. Rectal Temperature
Rectal temperatures are measured with a temperature sensor mounted on a rectal probe inserted into the rectum. Rectal probes are easy to insert and are non-invasive. However, rectal probes can only be inserted for a short period of time (2-3 days maximum) without irritating tissue, and measurements can be affected by cool blood returning from the lower extremities, insulation by feces, and heat produced by bowel organisms. Rectal temperatures are usually a few tenths of a degree higher than arte-rial blood temperatures. Dynamic rectal temperatures have been collected for nearly all livestock and poultry species (Hahn et al., 1990; Brown-Brandl et al., 1997; Brown-Brandl et al., 2001; Brown-Brandl et al., 2003a; Silanikove, 2000; Lin et al., 2005b; Lin et al., 2005a; Ott, 2005; Marai et al., 2007; Piccione et al., 2007). Tympanic Temperature
The temperature of the tympanic membrane within the ear closely approximates hypothalamic temperature and is a reliable method of measuring core temperature although the accuracy of tympanic temperature probes can be limited by wax in the ear canal (Guidry and McDowell, 1965; Wiersma and Stott, 1983; Hahn et al., 1990; Brown-Brandl et al., 1999; Paul et al., 1999; Bergen and Kennedy, 2000; Mader, 2005). These probes may be periodically switched between ears to obtain continuous long-term records.
Skill is required to properly place tympanic probes. They need to be reinstalled every 7 to 10 days to avoid ear infections. However, the process of inserting the probe becomes increasingly stressful for the animal. The probes can be secured by either prosthetic foam, which expands and fills the ear canal, or by a modified ear-tag button, which secures the probe by using nylon tie straps and the ear tag (Brown-Brandl, 1999).
This method has been used successfully in cattle, sheep, and pigs. Pigs need to be placed under anesthetic to allow for proper placement. Vaginal Temperature
Vaginal temperatures can also be used for monitoring body temperature (Bray et al., 1990; Bray et al.,1991; Bray et al., 1993; Bergen and Kennedy, 2000; Brouk et al.,

Livestock Energetics and Thermal Environmental Management 133
2005a; Brouk et al., 2005b; Hillman et al., 2005). The temperature sensors can either transmit signals to an external receiver coupled to a datalogger or the sensor can be an integrated sensor/logger combined in a single package (e.g., Onset Computer Cor-poration). Irritation and infection resulting from the inserted devices can be minimized by placing the sensor unit in a flexible plasitsol sleeve (Hillman et al., 2005). Vaginal temperatures have been collected for up to three weeks with only minimal irritiation using the flexible sleeve and the combined sensor datalogger. The flexible sleeve with datalogger method has been used in both dairy cows and beef heifers. The system is too large for using in smaller species. Digestive Tract Temperature
Temperature sensors combined with dataloggers or radio transmitters can be swal-lowed by livestock to measure temperatures in the digestive tract (Hicks et al., 2001; Schoenig et al., 2004). Sensors remain within the rumen or reticulum of ruminants or eventually pass through the digestive tract of non-ruminant mammals. When used with poultry, these sensors remain in the gizzard. The overall size of ingestible temperature sensors is usually governed by the size of the required battery. Sensors that pass through the digestive tract can be small, but if the sensor remains in the rumen or giz-zard, and measurements are desired over a prolonged period, battery size increases. The presence of toxic materials in batteries and sensor components is a concern for the use of sensors involving animals that will enter the food chain.
Temperatures in the digestive tract vary over time and typically differ from other organs. Food in the stomach affects temperature readings and rumen temperatures are affected by fermentation processes. Temperature sensors can sometimes be regurgi-tated, particularly by ruminants. Temperature sensors in poultry have a lifetime of not more than a few days because of the grinding action of the gizzard. Implanted Sensors
Temperature sensors coupled with radio transmitters can be implanted in body cavities of animals to give continuous readings over prolonged periods (Lefcourt and Adams, 1996, 1998; Hamrita et al., 1998; Hicks et al., 2001; Brown-Brandl et al., 2003b; Mitchell et al., 2005). Overall size and implant life is largely governed by bat-tery size. Surgery is required to implant the sensors and veterinary assistance is usu-ally required. Batteries and sensor components are also an issue for field trials or commercial use of sensors involving animals that will enter the food chain. Implanted systems are expensive and require a high level of veterinary and technical support to operate. Many available implantable sensors are equipped with transmitters with short ranges, requiring a receiver and datalogger to be strapped to the animal.
A new field of MEMS (micro-electro-mechanical systems) technology offers the potential to greatly improve the usability of implanted sensors. MEMS devices and sensors have sizes ranging from nanometers to millimeters. MEMS sensors can be powered by energy emitted from adjacent antennas and eliminate the need to implant batteries. MEMS devices are much less invasive than presently available sensors and have the potential to provide separate readings for particular organs in an animal. A specific limitation is the need to have an antenna mounted in close proximity to the animal. If continuous monitoring is not required, periodic readings may be obtained by mounting an antenna on a gate or chute.

134 Chapter 6: Instrumentation for Research and Management in Animal Agriculture
Respiration For most mammals (homeotherms), respiratory heat transfer is a significant mecha-
nism of heat loss under a wide range of environmental conditions (Ingram and Mount, 1975). Respiration rate is of particular interest as a physiological response because a large body of research shows a positive correlation between respiration rate and dry-bulb temperature (Kibler and Brody, 1949; Webster, 1974; Ingram and Mount, 1975; Morrison and Lofgreen, 1979; Liao and Veum, 1994; Hahn et al., 1997; Brown-Brandl et al., 1998; Mader et al., 1999; Gaughan et al., 2000; Mitlöhner et al., 2001; Eigen-berg et al., 2005) Additionally, an increased respiration rate has been associated with an increase in solar radiation (Spain and Spiers, 1996), increased relative humidity (McLean, 1973), and decreased wind speed (Mader and Davis, 2002).
The respiration rate has been shown to be a good indicator of thermal stress and has the advantage of being readily observable in a production setting. It demonstrates little lag time relative to dry-bulb temperature, so it readily reflects an animal’s thermal status. Furthermore, respiration rate has a demonstrated capacity to be useful in distin-guishing among stress-susceptible cattle in feedlots. The relative stress level, as meas-ured by respiration rate, is influenced by genotype (especially differences in genotype associated with hide color differences), health history, and temperament. Monitoring of respiration rate shows promise in precision animal management for identifying animals that may be vulnerable to heat stress. Monitoring allows those animals to be sorted and treated differently than the main herd. Automated Monitoring of Respiration Rate in Cattle
An example (Eigenberg et al., 2000) of an automated cattle respiration rate monitor is included here to document the methodology. A thin-film transducer (designed for human application) is incorporated into a silicone rubber strain assembly and used to sense changing thoracic or abdominal circumference in cattle. The device is mounted with two bungee cords that span the abdominal circumference (Figure 1), with each
Figure 1. The cattle abdominal expansion sensor is held in place by using two lightweight bungee cords to span the abdominal circumference. The datalogger is secured in a pocket on the harness assembly (Eigenberg et al., 2000).

Livestock Energetics and Thermal Environmental Management 135
Figure 2. The swine acoustic sensor microphone is held in place under the pig’s neck with elastic bandag-ing. The datalogger is secured in a pocket on the upper harness assembly (Eigenberg et al., 2002).
end of the cords attached to a ring on either side of the sensor. The cords form a belt, providing a constant tension and holding the sensor in place. The respiratory-effort transducer used for cattle generates a variable resistance in response to respiration. Amplification and offset compensation produce a signal that is compatible with the voltage range requirements of the datalogger, which is attached to the animal via a harness assembly. Automated Monitoring of Respiration Rate in Swine
An automated device to measure respiration rate in swine has also been demon-strated (Eigenberg et al., 2002). An expansion sensor similar to that used on cattle proved unsuccessful in measuring respiration rate of swine because swine spend much of their time in the recumbent position and have less definitive respiratory movements than cattle. Tests determined that an audible component of the pig’s respiration has the potential of being detected and recorded. Thus, the sensor is a small microphone that is placed under the throat of the pig and held with standard elastic bandaging (Figure 2). Sensor location is critical for maximum response and reduced noise. The acoustic signal is conditioned to produce a signal compatible with the datalogger attached to the pig via a harness assembly.
Behavioral Measurements Animal presence, activity, and to some extent behavior has been successfully moni-
tored using various electronic devices. Activity such as standing versus recumbent be-havior has been electronically documented using an ultrasonic positioning range-finding device. This device measures the distance between the sensor and an object which has been used to monitor animal presence in a stall (Hillman et al., 2000) and animal activity in a confined space (Brown-Brandl et al., 2000).
Animal behavior is much more complex than simply presence or activity in an area. For a comparatively simple example, measuring the huddling area of piglets requires a digital image of the animals. This can be analyzed for the huddling area occupied by the piglets using machine vision (Zhang and Xin, 2005). Actually being able to elec-tronically recognize a specific animal behavior requires the development and training

136 Chapter 6: Instrumentation for Research and Management in Animal Agriculture
of a computer vision system. In order to assess images for behavior the images must be collected with relatively high frequency. Information can be collected using these digitized images by defining key components of the image using numerical equations. The system is then calibrated by assigning behaviors based on visual observation and then determining the values of the parameters from the numerical equations. Then, in subsequent videos the behaviors can be identified based solely on the values of the parameters (Leroy et al., 2006; Xue and Henderson, 2006)
Meteorological Measurements Air Temperature
Air temperature is a major factor influencing the metabolism of livestock. It is of particular importance when ambient air temperatures are outside the animal’s ther-moneutral zone. Outdoor weather conditions vary from approximately –50°C in the winter in northern areas to 50°C in arid areas near the equator. Temperatures inside livestock housing are normally kept above freezing and should not exceed the upper limit of the thermoneutral zone, but temperatures approaching 40°C may be observed in some poorly managed facilities.
Environmental monitoring requires the measurement of ambient air temperature. Whatever type of sensing element is used, care must be taken that the actual ambient air temperature is measured. Temperature sensing elements are sensitive to the effects of radiation and must be shielded from objects either hotter or colder than the air tem-perature. The most common object fitting this definition is the sun. However, any ob-ject in the field of view of a thermometer at a temperature differing from the air tem-perature will exchange energy by radiation with the sensor and affect the reading. An unshielded temperature sensor located outside on a summer day will indicate tempera-tures well above the actual air temperature. This effect can be avoided by placing a reflective ventilated shield between the sun and the sensor. The temperature sensor must also be located in a well-ventilated area to provide a true measure of ambient air temperature. In some cases, this will require the use of a small fan located downstream of the sensor to move air over the sensing element. Care should also be taken to not mount temperature sensing elements directly onto metal surfaces that easily conduct heat to or away from the sensor.
Devices that measure temperature rely on the change in some physical property with temperature (Mitchell, 1983; Doebelin, 1990; ASHRAE 2001). The temperature of a given object is related to its degree of molecular motion; the more disorder that exists in the random motions of an object’s molecules, the higher are the heat content and tem-perature of that object. An object’s temperature may be registered by any property that depends on that object’s thermal state. Such properties range widely and include volume (at constant pressure), electrical resistance, semiconductor junction potential, resistivity of a pure metal, resistivity of oxides of transition metals, thermal voltage associated with dissimilar metals, and even visible color, since objects become luminous when their temperatures rise sufficiently. The assignment of a particular number value to a given temperature state is arbitrary but for research applications the Celsius or centigrade scale (in which freezing water is 0°C and boiling water is 100°C) is used.

Livestock Energetics and Thermal Environmental Management 137
Table 1. Air temperature measurement methods.
Type Principle Typical
Accuracy Typical Stability
Electronic Interface Comments
Approx.Range
Rela-tive Cost
Expansion: Liquid
measure expansion of a
liquid
very accurate and
are used as standards
very repeat-
able
no direct electrical
output
slow response time, fragile, expensive,
narrow range
wide me-dium
Expansion: Gas
measure the volume variation
of a gas
very accurate and used as standards
very repeat-
able
no direct electrical
output
bulky, ex-pensive
wide high
Expansion: Bimetallic strip
spring-like mechanism made
of metals with differing thermal
expansion coefficients
1.0°C exhibit hystere-sis and are not very
precise
no direct electrical
output
rugged, slow reaction time, inexpensive
wide low
Electrical resistance: Thermistor
semiconductor compounds that
exhibit large resistance changes
as temperature changes
0.1 to 0.5°C, depending on signal condi-
tioning design
repeat-able
requires signal conditioning and response is non-linear
moderate response times and
depends on self-heating
effects
wide low
Electrical resistance: Resistance temperature de-tectors (RTD)
fine coil of platinum or
nickel alloy as sensing element
0.1°C repeat-able
very linear, requires signal conditioning to interface to
computer
slow response times, more expensive
than thermis-tors
wide me-dium
Thermocouples dissimilar metals produce voltage
dependent on junction
temperatures
0.1 to 0.5°C, depending on cold bridge junction,
amplification, and # ADC
bits
stable requires signal amplification and condition-
ing
response dependent on gauge size;
rugged, adaptable to many appli-
cations
wide low
Radiation: Infrared thermocouples
thermocouplesin series
depends on knowledge of emissivity of
target
stable direct interface/ non-linear
no physical contact,
rugged, fast response; averages
temperature over field of view (FOV)
wide high
Radiation: Infrared thermometer
measures energy emitted from
target
depends on knowledge of emissivity of
target
stable direct interface
no physical contact with target, fast response, averages
temperature over field of view (FOV)
wide high
Semiconductor thermometer
semiconductor junction voltage
or current directly related to
temperature
0.1°C stable direct inter-face, linear
output
linear output; generally, slow re-sponse
-25 to200°C
low

138 Chapter 6: Instrumentation for Research and Management in Animal Agriculture
When observing animal responses, it is desirable to measure conditions as close to the animal as possible, and thus destruction of sensors by livestock is a common prob-lem. Another problem is that animal environments are often dusty and dust accumula-tion can affect the accuracy of sensors.
Table 1 lists some pertinent characteristics of various temperature sensors. Tem-peratures of environments surrounding animals within housing structures or in open lot settings can be measured successfully using thermocouples or thermistors. Ther-mocouples (T/C) offer advantages of durability, relatively low cost and versatility. Grids of thermocouples can easily be assembled using equal length T/C wire con-nected in parallel to a single wire. This wire can be run a suitable distance to the data-logger where the average temperature of all T/C connections in the grid can be meas-ured. Thermistors offer a good solution where a small number of measurement points can be connected to a suitable datalogger located near the sample points.
Air Speed Air speed is measured in an open environment to understand macroscale wind pat-
terns around livestock buildings. It is also measured locally in ducts and around air-handling devices to understand air movement in housing facilities. It is measured in the neighborhood of livestock to understand the heat and mass exchanges of the ani-mal. High wind speeds (velocities over 50 m/s, as in storms) are important considera-tions for structural analysis and design of buildings. However, the air speeds of inter-est for livestock are below 10 m/s. Wind speeds below 0.2 m/s are typically regarded to be still air.
The terminology associated with measurement of air movement describes air veloc-ity as a vector quantity possessing magnitude and a direction. Air speed is simply the magnitude of air velocity (Mitchell, 1983; Doebelin, 1990; ASHRAE 2001).
Air speed can be measured in a number of ways based on mechanical methods, pressure relationships, thermal principles, and the Doppler effect. Air speed is meas-ured by anemometers. A wide variety of anemometers are available, including numer-ous versions of the following major types: rotational, pressure, deflection, thermoelec-tric, and Doppler.
Some anemometers are non-directional and give only the maximum speed, some use wind vanes to orient instruments and measure direction, and others combine mul-tiple sensors to obtain both magnitude and direction to yield velocity. Air speeds usu-ally fluctuate and consideration should be given to the instrument response time if the goal is to measure gusts or other rapid changes in speed. Another consideration is that anemometers are usually delicate instruments and must be protected if located close to animals. Often only hand-held instruments are used in close proximity to animals. Also, the sensing mechanisms of anemometers are easily affected by coatings of dust.
Rotational cup anemometers are a good choice for wind speed measurements at outdoor sites such as near feedlots or other outdoor meteorological sites. Air speed measurements in buildings may require a more sensitive measurement as achieved by a hot wire anemometer. Any instruments used for monitoring environmental condi-tions near animal locations must be protected from direct access by the animals. Table 2 lists various options for air speed measurement.

Livestock Energetics and Thermal Environmental Management 139
Table 2. Air speed measurement methods.
Type Principle Typical
AccuracyTypical Stability
Electronic Interface Comments
Approx.Range
Relative Cost
Cup anemometer
wind powered turbine in the form of cups mounted on radial spokes
1 m/s stable pulse count into logger
omni-directional in plane of
rotation of cups
wide low
Propeller anemometer
wind powered turbine in the
form of a propeller
1 m/s stable pulse or voltage out to logger
more responsive to gusts than
cup anemometers,
must be oriented into
the wind
1 to 40 m/s
medium
Pressure plate anemometer
plate pivots about horizontal axis above center of gravity, angular
deflection is measure of air velocity
5 m/s stable difficult to interface
must be oriented into the wind, have natural
resonant frequency re-sulting in flut-
tering
1 to 40 m/s
low
Pitot tube and orifice plates
measure differ-ence between dynamic and
static pressure of air based on
pressure difference
1 m/s stable requires pressure
transducers to provide interface
pitot tube must be aligned with the air stream
1 to 40 m/s
medium
Thermo- electric: Hot wire anemometer
airflow over heated wire cools the wire by con-
vection and changes the resistance
0.1 m/s requires frequent calibra-
tion
requires interface
measures very low air speeds since can re-
spond to small changes; orien-tation sensitive
0.1 to 20 m/s
medium
Doppler: Sonic anemometer
time difference between an ultra-sonic wave trav-ersing through
moving air and a reference signal
1 m/s stable requires interface
no moving parts; can take thousands of readings per
second
1 to 100 m/s
high
Laser anemometer
measure Doppler shift of moving airborne particle
(such as dust)
1 m/s stable requires interface
can measure air velocity profiles
up to 150 m from instru-
ment; complex circuitry
1 to 100 m/s
high
Humidity Clean, dry air is a mixture of atmospheric gases that includes N2 (78.08%), O2
(20.95%), Ar (0.93%) and other trace gases in much smaller quantities (Harrison, 1963). Water vapor (H2O) is the most variable constituent of the atmosphere. Its per-centage by volume relative to all other gaseous constituents may range from as little as
140 Chapter 6: Instrumentation for Research and Management in Animal Agriculture
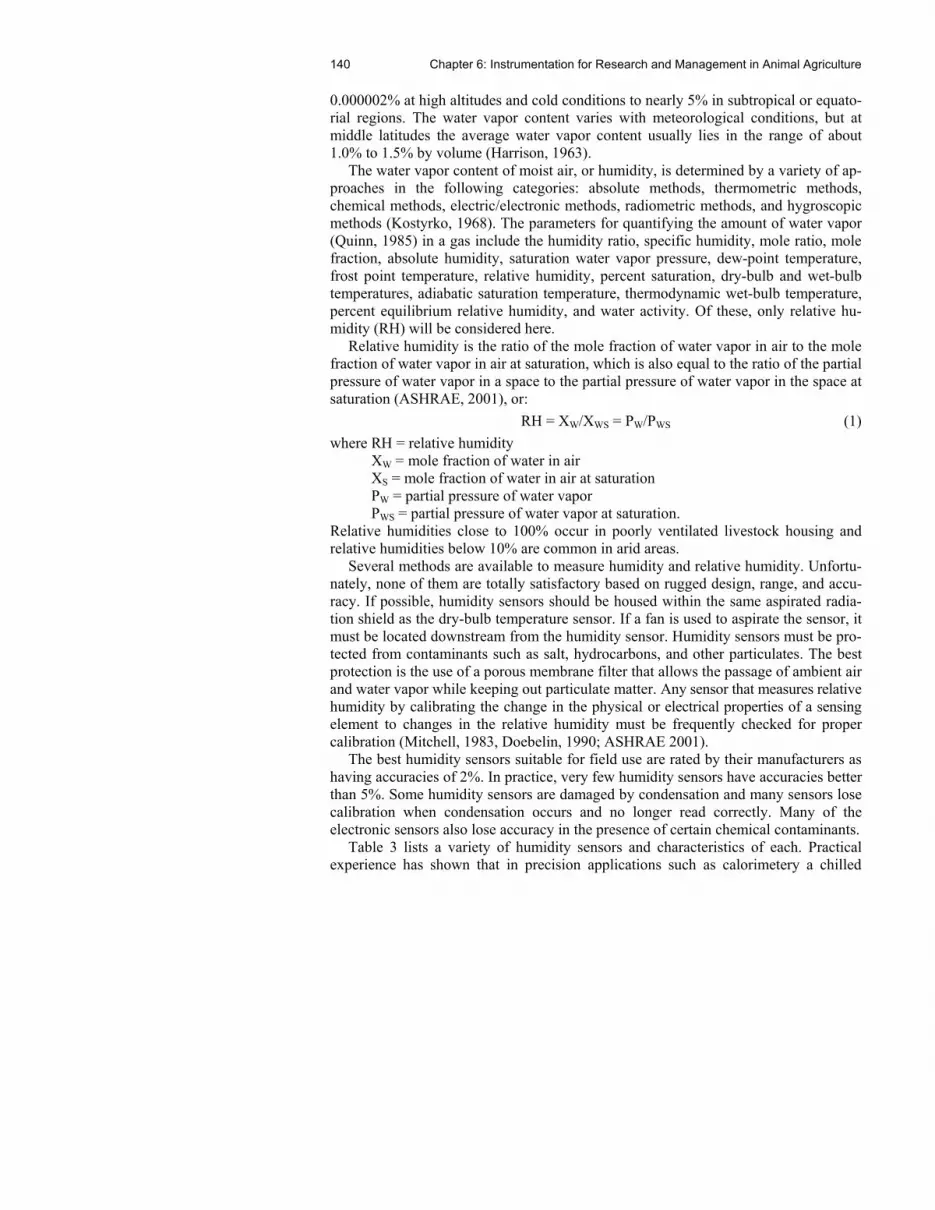
0.000002% at high altitudes and cold conditions to nearly 5% in subtropical or equato-rial regions. The water vapor content varies with meteorological conditions, but at middle latitudes the average water vapor content usually lies in the range of about 1.0% to 1.5% by volume (Harrison, 1963).
The water vapor content of moist air, or humidity, is determined by a variety of ap-proaches in the following categories: absolute methods, thermometric methods, chemical methods, electric/electronic methods, radiometric methods, and hygroscopic methods (Kostyrko, 1968). The parameters for quantifying the amount of water vapor (Quinn, 1985) in a gas include the humidity ratio, specific humidity, mole ratio, mole fraction, absolute humidity, saturation water vapor pressure, dew-point temperature, frost point temperature, relative humidity, percent saturation, dry-bulb and wet-bulb temperatures, adiabatic saturation temperature, thermodynamic wet-bulb temperature, percent equilibrium relative humidity, and water activity. Of these, only relative hu-midity (RH) will be considered here.
Relative humidity is the ratio of the mole fraction of water vapor in air to the mole fraction of water vapor in air at saturation, which is also equal to the ratio of the partial pressure of water vapor in a space to the partial pressure of water vapor in the space at saturation (ASHRAE, 2001), or: RH = XW/XWS = PW/PWS (1) where RH = relative humidity
XW = mole fraction of water in air XS = mole fraction of water in air at saturation PW = partial pressure of water vapor PWS = partial pressure of water vapor at saturation.
Relative humidities close to 100% occur in poorly ventilated livestock housing and relative humidities below 10% are common in arid areas.
Several methods are available to measure humidity and relative humidity. Unfortu-nately, none of them are totally satisfactory based on rugged design, range, and accu-racy. If possible, humidity sensors should be housed within the same aspirated radia-tion shield as the dry-bulb temperature sensor. If a fan is used to aspirate the sensor, it must be located downstream from the humidity sensor. Humidity sensors must be pro-tected from contaminants such as salt, hydrocarbons, and other particulates. The best protection is the use of a porous membrane filter that allows the passage of ambient air and water vapor while keeping out particulate matter. Any sensor that measures relative humidity by calibrating the change in the physical or electrical properties of a sensing element to changes in the relative humidity must be frequently checked for proper calibration (Mitchell, 1983, Doebelin, 1990; ASHRAE 2001).
The best humidity sensors suitable for field use are rated by their manufacturers as having accuracies of 2%. In practice, very few humidity sensors have accuracies better than 5%. Some humidity sensors are damaged by condensation and many sensors lose calibration when condensation occurs and no longer read correctly. Many of the electronic sensors also lose accuracy in the presence of certain chemical contaminants.
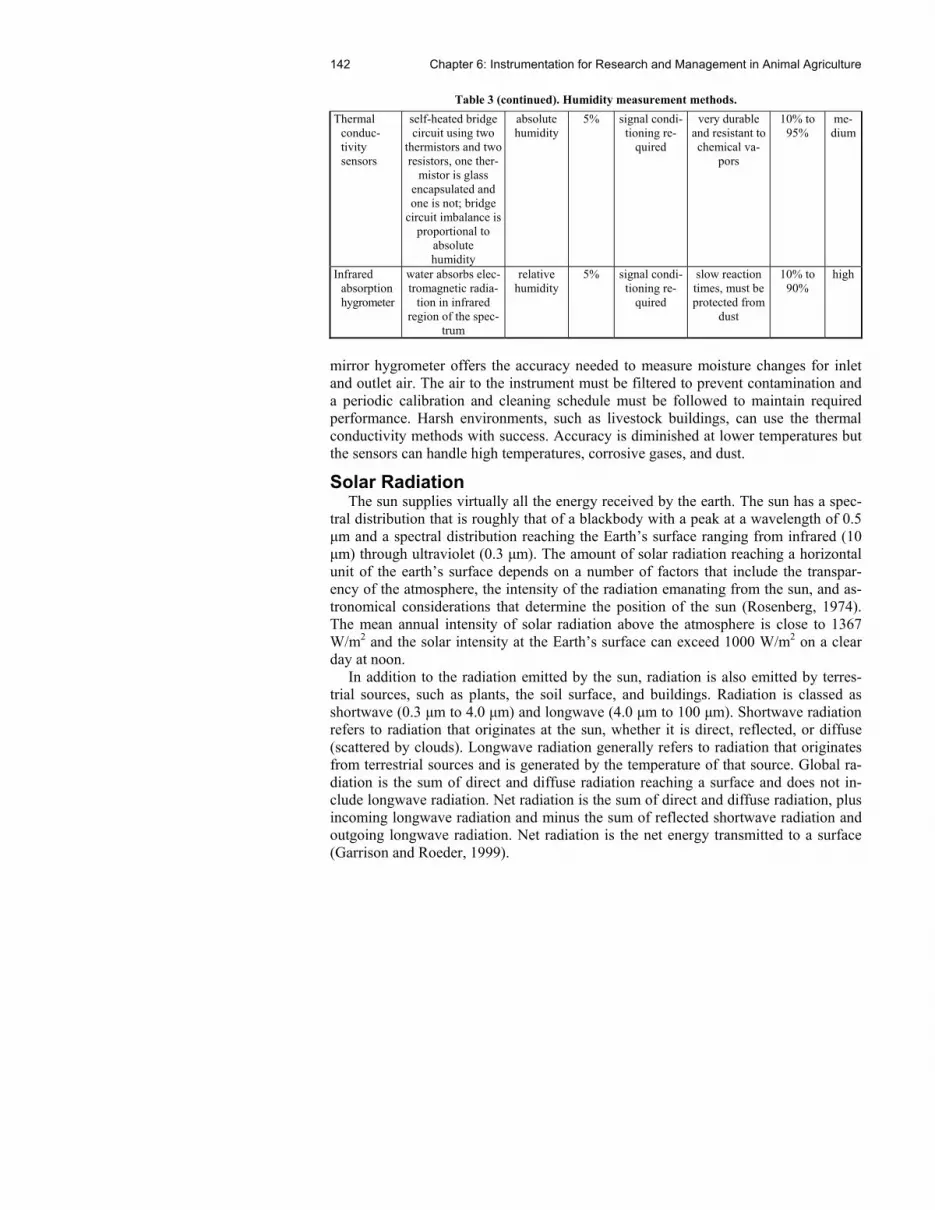
Table 3 lists a variety of humidity sensors and characteristics of each. Practical experience has shown that in precision applications such as calorimetery a chilled

Livestock Energetics and Thermal Environmental Management 141
Table 3. Humidity measurement methods.
Type Principle Direct
Measure
Typical Accu-racy
Electronic Interface Comments
Approx. Range
Rela-tive Cost
Wet-bulb psychro- meter
aspirated wetted wick attached to
temperature sensor
wet-bulb temperature
0.1°C with suitable
temperature sensor
wick must be clean, not good in dusty envi-
ronments; needs continuous
supply of water, minimum air velocity over
wick, and dry-bulb tempera-ture upstream.
wet-bulbtemper-
ature above
freezing
low
Chilled mirror hygrometer
mirror chilled ther-moelectrically until moisture forms on surface, change in mirror optics trig-gers mirror (dew-point) temperature
measurement
dew point 0.1°C sophisticated cooling and
sensing required
very accurate, used for stan-
dards, not good in dusty envi-
ronments
dew points above
freezing
high
Surface acoustic wave sensor
piezoelectric trans-ducer generates
acoustic wave that changes propaga-tion characteristics
as dew forms
dew point 1% sophisticated cooling and
sensing required
less affectedby contamina-
tion than chilled mirror
with faster response times
dew points above
freezing
high
Hair hygrometer
diffusion equilib-rium between hair’s water content and
water vapor content of air causes hair to lengthen and con-
tract
relative humidity
10% not easily interfaced
require frequent calibration, fragile; not
recommended in livestock
facilities
10% to 90%
low
Capacitance hygrometer
change of dielectric constant between capacitor plates in response to humid-
ity changes
relative humidity
10% signal conditioning
required
not recom-mended in livestock facilities
10% to 90%
me-dium
Substrate or polymer- based sensors
electrical impedance of a hygroscopic medium such as a
conductive polymer changes with hu-
midity
relative humidity
10% signal conditioning
required
short lifetime in the presence of
chemically active vapors found in live-stock facilities
10% to 90%
me-dium
Lithium chloride-based sensors
electrical current is passed through lithium chloride until equilibrium
temperature is reached; equilib-
rium temperature is dependent on rela-
tive humidity
relative humidity
1% signal conditioning
required
needs frequent calibration,
recommended for laboratory
use only
5% to 95%
high
142 Chapter 6: Instrumentation for Research and Management in Animal Agriculture
Table 3 (continued). Humidity measurement methods. Thermal
conduc-tivity sensors
self-heated bridge circuit using two
thermistors and two resistors, one ther-
mistor is glass encapsulated and one is not; bridge
circuit imbalance is proportional to
absolute humidity
absolute humidity
5% signal condi-tioning re-
quired
very durable and resistant to chemical va-
pors
10% to 95%
me-dium
Infrared absorption hygrometer
water absorbs elec-tromagnetic radia-
tion in infrared region of the spec-
trum
relative humidity
5% signal condi-tioning re-
quired
slow reaction times, must be protected from
dust
10% to 90%
high
mirror hygrometer offers the accuracy needed to measure moisture changes for inlet and outlet air. The air to the instrument must be filtered to prevent contamination and a periodic calibration and cleaning schedule must be followed to maintain required performance. Harsh environments, such as livestock buildings, can use the thermal conductivity methods with success. Accuracy is diminished at lower temperatures but the sensors can handle high temperatures, corrosive gases, and dust.
Solar Radiation The sun supplies virtually all the energy received by the earth. The sun has a spec-
tral distribution that is roughly that of a blackbody with a peak at a wavelength of 0.5 μm and a spectral distribution reaching the Earth’s surface ranging from infrared (10 μm) through ultraviolet (0.3 μm). The amount of solar radiation reaching a horizontal unit of the earth’s surface depends on a number of factors that include the transpar-ency of the atmosphere, the intensity of the radiation emanating from the sun, and as-tronomical considerations that determine the position of the sun (Rosenberg, 1974). The mean annual intensity of solar radiation above the atmosphere is close to 1367 W/m2 and the solar intensity at the Earth’s surface can exceed 1000 W/m2 on a clear day at noon.
In addition to the radiation emitted by the sun, radiation is also emitted by terres-trial sources, such as plants, the soil surface, and buildings. Radiation is classed as shortwave (0.3 μm to 4.0 μm) and longwave (4.0 μm to 100 μm). Shortwave radiation refers to radiation that originates at the sun, whether it is direct, reflected, or diffuse (scattered by clouds). Longwave radiation generally refers to radiation that originates from terrestrial sources and is generated by the temperature of that source. Global ra-diation is the sum of direct and diffuse radiation reaching a surface and does not in-clude longwave radiation. Net radiation is the sum of direct and diffuse radiation, plus incoming longwave radiation and minus the sum of reflected shortwave radiation and outgoing longwave radiation. Net radiation is the net energy transmitted to a surface (Garrison and Roeder, 1999).

Livestock Energetics and Thermal Environmental Management 143
Table 4. Solar thermal radiation measurement methods.
Type Principle Typical
AccuracyTypical Stability
Electronic Interface Comments
Approx.Range
Relative Cost
Eppley pyrano-meter
thermopile with hot and cold areas (black and
white); sensor enclosed in
glassed dome that permits
solar radiation to reach sensor
high stable compensation for temperature
required
millivolt output nearly linear
with solar radiation flux density; glass dome is a lens
that corrects for cosine effects
0.2 to 4.5 μm
medium
Black globe radiation
Vernon globe thermometer
consists of 15-cm globe
sphere coated with flat black
paint with a thermocouple at the center
0.2°C stable same as for thermocouple
slow response (20 to 30 min); temperature at center of globe is a measure of mean radiant temperature
when air veloc-ity is zero
0.3 to 10 μm
low
Silicon photo- diode pyrano-meter sensors
calibrated photoelectric
sensor
5% stable needs a preci-sion resistor to convert current to voltage out-
put
less expensive than pyranome-
ters; fast re-sponse; usually designed only for solar radia-
tion
0.4 to 1.1 μm
medium
Solar radiation instruments for general use include devices that measure direct ra-
diation from the sun, total or global radiation coming from the sky hemisphere, and diffuse radiation (global radiation with the direct radiation removed) (Table 4). Radi-ant energy is commonly measured by detecting temperature changes of a surface ex-posed to radiation or by the response of a photoelectric cell. Instruments should be located so that their view is free of obstructions above the horizontal plane of the in-strument and care should be taken to ensure that walls or other surfaces do not reflect light onto the instrument. Livestock facilities are dusty and instruments must be checked and cleaned regularly for proper operation. Also, instruments located close to animals can be damaged.
Pyranometers are the most common type of instrument used to measure solar radia-tion for studies involving livestock. Pyranometers measure total direct and diffuse solar radiation. A pyranometer has a glass dome that allows the solar spectrum to heat white and black areas. The glass dome is also a lens which corrects for cosine effects at various sun angles. A differential thermopile is installed beneath the white/black regions. The difference in temperature measured by the thermopile is linearly corre-lated with solar radiation flux density.

144 Chapter 6: Instrumentation for Research and Management in Animal Agriculture
Devices based on silicon photocells are also used to measure solar radiation. They are less expensive but also less accurate than instruments based on thermopiles. Their spectral response is usually limited to wavelengths from 0.4 μm to 1.1 μm. Photocell sensors have zero sensitivity above about 1.1μm and their spectral response below 1.1μm is not as constant as thermopile-based instruments.
The globe temperature device integrates radiant heat exchange and convective heat-ing or cooling into a single value that can be used to calculate the mean radiant tem-perature (ISO, 2001). The Vernon Globe Thermometer (Vernon, 1932) is the standard instrument for measuring the globe temperature. The Vernon Globe consists of a 15-cm hollow copper sphere with 0.056 cm thick walls painted flat (matte) black on the outside and containing an unshielded dry-bulb thermometer or its equivalent in the center of the sphere. Globe thermometers include solar and terrestrial radiation, and are quite useful in that regard. The emissive characteristics of skin approach those of a black sphere, so the temperature balance of the sphere is a measure of the net radiative heat transfer of livestock (Bond and Kelly, 1955). Air velocity measurement is re-quired to obtain radiation measures from black globes. Black globes of other diameters also can be used in livestock studies (Bond and Kelly, 1955), but as globe size de-creases the relative contributions of air temperature and velocity to the heat balance of the globe increase.
Integrative Systems Many livestock production facilities exist in environments that may differ signifi-
cantly from the conditions at the closest weather station. Furthermore, hot weather advisories for livestock producers using the Livestock Weather Safety Index (LWSI; LCI, 1970), related to the Temperature Humidity Index (see Chapter 5 for more de-tail), is no longer available over commercial radio or television broadcasts for most livestock production areas. There is a need to integrate local weather data, as collected by a dedicated weather station located at a feedlot, into a single livestock safety factor accessible to livestock producers for management decisions.
Livestock Weather Safety Monitor To meet a need for the feedlot cattle industry, Eigenberg et al., (2007) used a com-
mercial weather station to gather real-time, on-site measures of ambient temperature, relative humidity, solar radiation, and wind speed every 15 minutes. The weather sta-tion was interfaced with a microcomputer through a user-designed interface board and an output screen. The microcomputer was programmed to perform routine tasks in-cluding communications with the weather station and generating estimated cattle res-piration rates (RR). The predicted respiration rate was calculated from an equation developed by Eigenberg et al (2005) based on dry-bulb temperature, dew-point tem-perature, solar thermal radiation, and wind speed. The equation is presented as Equa-tion 4 on page 122 of Chapter 5. The estimated RR was related to the Temperature Humidity Index (THI). The THI stress categories (Table 5) range from normal, alert, danger, and emergency and are related to RR as developed by Eigenberg et al. (2005). The complete assembly of the Livestock Safety Monitor is shown in Figure 3. Its out-put displays both the predicted RR and the heat stress category.

Livestock Energetics and Thermal Environmental Management 145
Table 5. Heat stress categories related to predicted respiration rate of cattle (Eigenberg et al., 2005).
Heat Stress Category Predicted Respiration Rate,
breaths/min Normal up to 90
Alert 90 to 110 Danger 110 to 130
Emergency 130 and higher
Figure 3. Livestock Safety Monitor showing commercial weather station and display unit, from Ei-genberg et al. (2007).
Web Page for Cattle Heat Stress Forecasts Until the mid 1990s, livestock producers had access to National Weather Service
(NWS) livestock weather warnings through local news outlets. After this service was discontinued, producers were left to interpret weather data on their own. To fill this void, livestock weather warnings (based on the THI) were made available through several university web sites. The Livestock Safety Monitor provides an alternative approach based on a physiological-based model by Eigenberg et al. (2005) to predict the level of heat stress for unshaded cattle at temperatures above 25°C. A website was developed using the Eigenberg et al. (2005) index (Table 5). The website uses seven-

146 Chapter 6: Instrumentation for Research and Management in Animal Agriculture
day weather forecast information, available from the NWS, to predict the intensity of summer heat events for the U.S. Central Plains region (South Dakota, Nebraska, Iowa, Western Colorado, Kansas, Missouri, Oklahoma, and Northern Texas) up to a week in advance. The prediction equation in combination with the NWS weather data is dis-played as a color-coded livestock stress map with four stress categories (normal, alert, danger, and emergency) depicted across the Central Plains region. This graphical dis-play has been available on the USMARC website since June, 2007. To access it, go to www.usmarc.usda.gov then click on Cattle Heat Stress. The results of this work pro-vide guidance in management decisions for cattle feeding operators.
Perspectives for the Future Future animal agriculture is likely to increasingly use sensors, electronic identifica-
tion systems (ID), wireless communication, global positioning systems (GPS), etc. Sensors will need to be rugged, inexpensive, and accurate. Sensors will likely com-municate with each other wirelessly providing micro and macro environmental data to smaller, more powerful computing machines. These advances will allow new concepts such as precision animal management to be developed further.
Precision management of livestock will result from integration of electronic identi-fication (EID) and GPS systems into production management schemes to track and record individual animal performance and movement. These performance records will allow the ration, medication, and shipping history to be reviewed for each individual animal to maximize performance, health, and well-being of the herd. External infor-mation such as environmental factors and management decisions can be integrated into the individual animal’s database.
Having individual animal data presents an additional opportunity for genetic mark-ers to be determined for specific traits. Improved genetics offers greater opportunity for animal producers to provide a safe and desirable product to consumers. Such re-search requires the use of large animal numbers to perform the statistical correlations. Under the evolving technology, these methods are likely to become commonplace.
References ASHRAE. 2001. Handbook of Fundamentals. Atlanta, Ga.: American Society of Heating, Refrigeration and
Air Conditioning Engineers. Bergen, R. D., and A. D. Kennedy. 2000. Relationships between vaginal and tympanic membrane
temperature in beef heifers. Canadian J. Anim. Sci. 80: 3, 515-518. Bond, T. E., and C. F. Kelly. 1955. The globe thermometer in agricultural research. Agric. Eng. 36(4): 251. Bray, D. R., D. K. Beede, M. A. DeLorenzo, D. Wolfenson, R. G. Giesy, R. A. Bucklin, and S. Means.
1990. Environmental Modification Update, Proc. 27th Annual Florida Dairy Production Conf. Available at: dairy.ifas.ufl.edu/dpc.html.
Bray, D. R., D. K. Beede, M. A. DeLorenzo, D. Wolfenson, R. G. Giesy, R. A. Bucklin, R. A. Nordstedt and S. Means. 1991. Environmental Modification Update, Proc. 28th Annual Florida Dairy Production Conf. Available at: dairy.ifas.ufl.edu/dpc.html.
Bray, D. R., D. K. Beede, M. A. DeLorenzo, R. A. Bucklin, R. A. Nordstedt, R. Montoya, and R. Giesy. 1993. Environmental Modifications for Reducing Summer Stress on Florida Dairy Farms, Proc. 30th Annual Florida Dairy Production Conference. Available at: dairy.ifas.ufl. edu/dpc.html.
Brouk, M., B. Cvetkovic, J. Smith, and J. Harner. 2005a. Utilizing data loggers and vaginal temperature data to evaluate heat stress of dairy cattle. J. Anim. Sci. 83, Suppl. 1; J. Dairy Sci. 88, Suppl. 1:339.

Livestock Energetics and Thermal Environmental Management 147
Brouk, M., J. Smith, D. Armstrong, M. VanBaale, D. Bray, and J. Harner, 2005b. Combining air cooling and feedline soaking for heat abatement of lactating dairy cattle housed in north central Florida. J. Anim. Sci.. 83: Suppl. 1; J. Dairy Sci. 88, Suppl. 1: 339.
Brown-Brandl, T. M., M. M. Beck, D. D. Schulte, A. M. Parkhurst, and J. A. DeShazer. 1997. Temperature humidity index for growing tom turkeys. Trans. ASAE 40(1): 203-209.
Brown-Brandl, T. M., J. A. Nienaber, and L. W. Turner. 1998. Acute heat stress effects on heat production and respiration rate in swine. Trans. ASAE 41(3): 789-793.
Brown-Brandl, T. M., R. A. Eigenberg, G. L. Hahn, and J. A. Nienaber. 1999. Measurements of bioenergetic responses in livestock. ASAE Paper No. 994210. St. Joseph, Mich.: ASAE.
Brown-Brandl, T. M., R. A. Eigenberg, and J. A. Nienaber. 2000. Non-contact activity monitoring system for individually penned animals. ASAE Paper No. 004019. St. Joseph, Mich.: ASAE.
Brown-Brandl, T. M., R. A. Eigenberg, J. A. Nienaber, and S. D. Kachman. 2001. Thermoregulatory profile of a newer genetic line of pigs. Livestock Prod. Sci. 71: 253-260.
Brown-Brandl, T. M., J. A. Nienaber, R. A. Eigenberg, G. L. Hahn, and H. C. Freetly. 2003a. Thermoregulatory responses of feeder cattle. J. Thermal Biol. 28: 149-157.
Brown-Brandl, T. M., T. Yanagi, H. Xin, R. S. Gates, R. A. Bucklin, and G. Ross. 2003b. A new telemetry system for measuring core body temperature in livestock and poultry. Trans. ASAE. 19(5): 583-589.
Doebelin, E. O. 1990. Measurement Systems, Application and Design. New York, N.Y.: McGraw-Hill. Eigenberg, R. A., G. L. Hahn, J. A. Nienaber, and T. M. Brown-Brandl. 2000. Development of a respiration
rate monitor for cattle. Trans. ASAE 43(3): 723-728. Eigenberg, R. A., T. M. Brown-Brandl, and J. A. Nienaber. 2002. Development of a respiration rate monitor
for swine. Trans. ASAE 45(5): 1599-1603. Eigenberg, R. A., T. M. Brown-Brandl, J. A. Nienaber, and G. L. Hahn. 2005. Dynamic response indicators
of heat stress in shaded and non-shaded feedlot cattle. Part 2: Predictive relationships. J.Biosystems Eng. 91(1): 111-118.
Eigenberg, R. A., T. M. Brown-Brandl, and J. A. Nienaber. 2007. Development of a livestock weather safety monitor for feedlot cattle. Applied Eng. Agric. 23(5): 657-660.
Garrison, J. D., and S. B. W. Roeder. 1999. Section 73.1: Meteorological measurement. In The Measurement, Instrumentation and Sensors Handbook. J. G. Webster, ed. New York, N.Y.: Springer.
Gaughan, J. B., S. M. Holt, G. L. Hahn, T. L. Mader, and R. A. Eigenberg. 2000. Respiration rate: Is it a good measure of heat stress in cattle? Asian-Australian J. Anim. Sci. 13(Supplement C): 329-332.
Guidry, A. J., and R. E. McDowell. 1965. Tympanic membrane temperature for indicating rapid changes in body temperature. J. Dairy Sci. 49: 74-77.
Hahn, G.L. 1999. Dynamic responses of cattle to thermal heat loads. J. Anim. Sci. 77(suppl. 2):10-20. Hahn, G. L., R. A. Eigenberg, J. A. Neinaber, and E. T. Littledike. 1990. Measuring physiological responses
of animals to environmental stressors using a microcomputer based portable data logger. J. Anim. Sci. 68: 2658-2665.
Hahn, G. L., A. M. Parkhurst, and J. B. Gaughan. 1997. Cattle respiration rate as a function of ambient temperature. ASAE Paper No. MC97-121. St. Joseph, Mich.:ASAE.
Hamrita, T. K., G. Van Wicklen, M. Czarick, and M. Lacy. 1998. Monitoring poultry deep body temperature using biotelemetry. Applied Eng. Agric. 14(3): 327-331.
Harrison, L. P. 1963. Fundamental concepts and definitions relating to humidity. In Humidity and Moisture, Measurement and Control in Science and Industry, 3: 3-27. A. Wexler and W. A. Wildhack, eds. New York, N.Y.: Rheinhold Publ., London, UK: Chapman & Hall.
Hicks, L. C., W. S. Hick, R. A. Bucklin, J. K. Shearer, D. R. Bray, P. Solo, and V. Corvalho. 2001. Comparison of methods of measuring deep body temperatures of dairy cows. In Livestock Environment ronment V1, Proc. 6th Intl. Livestock Environment Symposium, 432-438. R. Stowell, R. Bucklin and R.W. Botcher, eds.
Hillman, P. E., K. G. Gebremedhin, D. Aneshansley, and A. Landers. 2000. Design of a new cooling system for dairy cows in freestall facilities. ASAE Paper No. 004110. St. Joseph, Mich.: ASAE.
Hillman, P., K. Gebremedhin, T. M. Brown-Brandl, and C. N. Lee. 2005. Thermal analysis and behavioral activity of heifers in shade or sunlight. In Livestock Environment VII, Proc. 7th Intl. Livestock Environment Symposium. T. Brown-Brandl and R. Maghirang, eds. St. Joseph, Mich.: ASAE.
Ingram, D. L., and L. E. Mount. 1975. Man and Animals in Hot Environments, Chapter 2, 5-23. New York/Heidelberg/Berlin: Springer-Verlag.
InterAg. 2007. Available at: www.cidr.com. New York, N.Y.: Pfizer Animal Health.

148 Chapter 6: Instrumentation for Research and Management in Animal Agriculture
ISO. 2001. ISO 7726: Ergonomics of the thermal environment-Instruments for measuring physical quantities. Geneva, Switzerland: ISO.
Kibler, H. H., and S. Brody. 1949. Influence of temperature, 50 to 5°F and 50 to 95°F, on heat production and cardiorespiratory activities in Brahman, Jersey and Holstein cows. Res. Bul. 450 (Envron. Physio. and Shelter Engineering Series VII). Columbia, Mo.: Agric. Exp. Sta., Univ. of Misouri.
Kostyrko, K. 1968. Measurement and control of gas humidity. In Modern Methods for the Control and Measurement of Humidity and Moisture, 5-89. M. Lapinski, K. Kostyrko, and W. Wlodarski, eds. WNT, Warsaw: Poland Ohmic Instruments.
LCI. 1970. Patterns of transit losses. Omaha, Nebr.: Livestock Conservation. Lefcourt A. M., and W. R. Adams. 1998. Radiotelemetric measurement of body temperature in feedlot
steers during winter. J. Anim. Sci. 76: 1830-1837. Lefcourt, A.. M., and W. R. Adams 1996. Radiotelemetry measurement of body temperatures of feedlot
steers during summer. J. Anim. Sci. 74(11): 2633-2640. Leroy, T., E. Vranken, A. Van Brecht, E. Struelens, B. Sonck, and D. Berckmans. 2006. A computer vision
method for on-line behavioral quanitications of individually caged poultry. Trans. ASABE 49(3): 795-802.
Liao, C. W., and T. L. Veum. 1994. Effects of dietary energy intake by gilts and heat stress from days 3 to 24 or 30 days after mating on embryo survival and nitrogen and energy balance. J. Anim. Sci. 72(9): 2369-2377.
Lin, H., H. F. Zhang, R. Du, X. H. Gu, Z. Y. Zhang, J. Buyse, and E. Decuypere. 2005a. Thermoregulation responses of broiler chickens to humidity at different ambient temperatures: II. Four weeks of age. Poult. Sci. 84(8): 1173-1178.
Lin, H., H. F. Zhang, H. C. Jiao, T. Zhao, S. J. Sui, X. H. Gu, Z. Y. Zhang, J. Buyse, and E. Decuypere. 2005b. Thermoregulation responses of broiler chickens to humidity at different ambient temperatures: I. One week of age. Poult. Sci. 84(8): 1166-1172.
Mader, T. L. 2005. Tympanic temperature and behavior associated with moving feedlot cattle. Professional Animal Scientist 21: 339-344.
Mader, T. L., and M. S. Davis. 2002 Wind speed and solar radiation corrections for the temperature-humidity index. In 15th Conf. on Biometeorology and Aerobiology Joint with16th Intl. Congress on Biometeorology. R. E. Davis and W. Decker, eds. Boston, Mass.: American Meteorological Society.
Mader, T. L., J. M. Dahlquist, G. L. Hahn, and J. B. Gaughan. 1999. Shade and wind barrier effects on summertime feedlot cattle performance. J. Anim. Sci. 77: 2065-2072.
Marai, I. F. M., A. A. El-Darawany, A. Fadiel, and M. A. M. Bdel-Hafez. 2007. Physiological traits as affected by heat stress in sheep: A review. Small Ruminant Res. 71(1-3): 1-12.
McLean, J. A. 1973. Loss of heat by evaporation. In Heat Loss from Animals and Man, 19-31. In Proc. 20th Easter School Agric. Sci. J. L. Monteith and L. E. Mount , eds. London, UK: Butterworths.
Mitchell, B. W., ed. 1983. Instrumentation and Measurement for Environmental Sciences. ASAE Special Publication 13-82. St Joseph, Mich.: ASAE.
Mitchell, M. A., P. J. Kettlewell, J. C. Lowe, R. R. Hunter, T. King, M. Ritchie, and J. Bracken. 2005. Remote physiological monitoring of livestock: An implantable radio-telemetry system. In Livestock Environment VII, Proc. 7th Intl. Livestock Environment Symposium. T. Brown-Brandl and R. Maghirang, eds. St. Joseph, Mich.: ASABE.
Morrison, S., and G. Lofgreen. 1979. Beef cattle response to air temperature. Trans. ASAE 22(4): 861-862, 872.
Mitlöhner, F. B., J. L. Morrow, J. W. Dailey, S. C. Wilson, M. L. Galyean, M. F. Miller, and J. J. McGlone. 2001. Shade and water misting effects on behavior, physiology, performance, and carcass traits of heat-stressed feedlot cattle. J. Anim. Sci. 79: 2327-2335.
Ott, E. A. 2005. Influence of temperature stress on the energy and protein metabolism and requirements of the working horse. Livestock Prod. Sci. 92(2): 123-130.
Paul, R. M., L. W. Turner, and B. L. Larson. 1999. Effects of shade on tympanic temperatures and production parameters of grazing beef cows. ASAE Paper No. 994216. St. Joseph, Mich.: ASAE.
Piccione, G., G. Caola, and R. Refinetti. 2007. Annual rhythmicity and maturation of physiological parameters in goats. Res. in Vet. Sci. 83(2): 239-243.
Quinn, F. C. 1985. The most common problem of moisture/humidity measurement and control. In Proc. 1985 Intl. Symp. on Moisture and Humidity, 1-5. Research Triangle Park, N.C.: Instrument Society of America.

Livestock Energetics and Thermal Environmental Management 149
Rosenberg, N. J. 1974. Micro-Climate: The Biological Environment, 44-59. New York, N.Y.: John Wiley & Sons.
Schoenig, S. A., T. S. Hildreth, L. Nagl, H. Erickson, M. Spire, D. Andresen, and S. Warren. 2004. Ambulatory instrumentation suitable for long-term monitoring of cattle health. In 26th Annual Conf. IEEE Engineering in Medicine and Biology Society.
Silanikove, N. 2000. Effects of heat stress on the welfare of extensively managed domestic ruminants. Livestock Prod. Sci. 67(1-2): 1-18.
Spain, J. N., and D. E. Spiers. 1996. Effects of supplemental shade on thermoregulatory response of calves to heat challenge in a hutch environment. J. Dairy Sci. 79: 639-646.
Vernon, H. M. 1932. The measurement of radiant heat in relation to human comfort. J. Ind. Hyg. 14: 95-111.
Webster, A. F. J. 1974. Chapter 10: Heat loss from cattle with particular emphasis on the effects of cold. In Heat Loss from Animals and Man, 205-231. J. L. Monteith and L. E. Mount, eds. In Proc. 20th Easter School Agric. Sci. J. L. Monteith and L. E. Mount , eds. London, UK: Butterworths.
Wiersma, F., and G. Stott. 1983. A technique for securing a temperature probe adjacent to the tympanic membrane in bovine. Trans. ASAE 26: 185-187.
Xue, X., and T. C. Henderson. 2006. Video-based animal behavior analysis from multiple cameras. Heidelberg, Germany: IEEE.
Zhang, Q., and H. Xin. 2005. Resting behavior of piglets in farrowing crates equipped with heat mats. Applied Eng. Agric. 21(6): 1067-1071.