Embed Size (px)
Citation preview

integrated rural development in Nigeria
The Funtua Agricultural
Development Project is the oldest
World Bank financed rural development project in Nigeria.
This article evaluates the impact of
the project on the area and its
implications as a prototype for rural
development in Nigeria. Increased
agricultural production has not
occurred to the extent and in the
direction that the project expected.
The project’s activities appear to be
concentrated on large-scale and
progressive farmers rather than on
the traditional farmer which could
result in increased income differentials and the creation of a
‘landless’ class. The costs of the
project are too high for the benefits
involved. Extension of the project
to other parts of the country would
be difficult to organize and manage
due to the lack of trained
manpower.
Brian D’Silva is Lecturer and Rafique
Raza is Senior Lecturer/Senior
Research Fellow in the Faculty of
Agriculture/Institute for Agricultural
Research, Admadu Belle University,
Zaria, Nigeria.
’ Anonymous, Third National Development Plan, 1975-1980, Vol 1, Federal Republic of Nigeria, Lagos, 1975 ’ Food and Agriculture Organization, Land Reform, Land Settlement and Cooperatives, Vol 1, FAO, Rome, 1979.
The Funtua Project
Brian C. D’Silva and M. Rafique Raza
Nigeria’s Third National Development Plan (1975-80) has emphasized programmes that would benefit the rural population. These programmes include large-scale irrigation schemes and projects intended to benefit the smallholder. Among these programmes are:-
0 The National Accelerated Food Production Program (NAFPP). 0 Operation Feed the Nation (OFN). 0 Fertilizer procurement and distribution. 0 National grains and root crop production companies. 0 Various river basin development authorities. 0 World Bank financed integrated rural development projects.’
This article analyses the effect of the Integrated Rural Development approach on rural development in Nigeria. This is undertaken with an analysis of the performance of the oldest of the World Bank financed projects, the Funtua Agricultural Development Project.
Integrated rural development
The international development community has undergone an evolution in their strategies for rural development as emphasized by the Director-General of FAO at the recent UN World Conference on Agrarian Reform and Rural Development. Integrated Rural Development has been the slogan since it was coined in the early 1970s after the Community Development approach of the 1950s and the green revolution strategies of the 196Os.* In the early 197Os, Barbara Ward espoused a development strategy designed primarily to raise the well-being of the rural poor, ‘ . . . by increasing their ability to participate in the development process through such measures as the encouragement of labour-intensive production technologies and broad access to education, health and credit facilities that could accelerate, rather than hinder economic growth’.3 This strategy was quickly adopted by aid institutions such as the World Bank in the design and emphasis of their programmes and activities.
A strategy similar to that suggested by Barbara Ward was the
282 0306-9192/80/040282-16 $02.00 0 1980 IPC Business Press

‘Barbara Ward, A *People Strategy’ Development, Overseas Development Councrl, Washmgton DC, 1973 “United Nations Research for Social Development, lntegrated Approach to Rural Development in Africa, Vol 1. UN, Geneva, 197 1. 5 Ibid. 6 D. Olatunbosun, Nigeria’s Neglected Rural Majority, Oxford University Press, Ibadan. 1975, p 157. ‘Three other projects (Gombe, Ayangba and Lafra) started later. Two more projects (Bida and Ilorin) have already been apprarsed. Feasibility studres have already been completed for Oyo North,
Ekitr/Akoko and Egbade. The federal government intends to have similar projects rn all states of the Federation (Olusegun Famoriyo, ‘Instrtutional per- spectives for food production policies In Nigeria in the 1980s’. paper presented at the 12th Annual Conference of the Nutrition Society of Nigeria, Benin City, Nigeria, 28 November-l December 1979, Pll). a Ibid.
Integrated rural development in Nigeria
central theme of the Moshi conference, whose main focus was the improvement of the welfare of Africa’s rural majorities.4 In this conference, factors influencing rural development were defined as those related to:
l Geography and ecology, such as climate, healthy drinking water, transportation facilities, etc.
0 Economic and technological, such as production technologies, prices, conditions of storage, processing, marketing, etc.
0 Sociological and psychological factors, such as customs, social status, role of women, etc.
0 Institutional factors, such as credit and cooperative organizations, power structure, etc.
0 Factors of innovation, such as change agents within and outside the system, etc.5
These factors singularly and interactively suggest that rural development is a comprehensive self-sustaining development of rural areas undertaken through a set of projects that affect the factors and in turn raise the welfare of the rural population. This approach can be further defined as ‘an integrated approach to rural development’, incorporating integration and cooperation at all levels (local, regional, national and international) in a structural and systematic exercise for affecting the welfare of the rural population.
The Nigerian experience In discussing rural development in Nigeria, Olatunbosun states:
In order to improve the quality of life of the neglected rural majority in Nigeria, an integrated approach comprising of various programs need to be introduced. These programs should concern agricultural production: health care and delivery; investment in rural nonfarm activities; education and training; co-operatives; water supply: rural credit and road construction. These projects should be planned and implemented in an integrated manner so that an integrated approach to rural development may take place.6
Within the framework of the ‘integrated’ approach, the Federal Government of Nigeria, with the help and assistance of the World Bank, commissioned two agricultural development projects in 1975 at Funtua and Gusau.’ The major objectives were to increase agricultural productivity and incomes of the rural people, and to improve the standard of living of the rural masses.8
The Fun&a Project It is with reference to the above framework concerning rural development that the Funtua Project will be studied. The Funtua Agricultural Development Project (FADP) is located in Kaduna State and covers an area of 7 590 square kilometres (nearly 10% of the State’s area) which includes over 80 000 farming families. The project area is spread over 5 districts in the Funtua and Malumfashi Local Government Areas of Kaduna State.
The stated means to achieve the broad objectives of the project include:
0 Construction of about 1500 kilometres of low cost agricultural extraction roads, 85 earth dams, 160 ponds and associated soil conservation structures.
0 Constructing an administrative centre in Funtua, 5 development
FOOD POLICY November 1980 283

Integrated rural development in Nigeria
Table 1. Estimated acreage of crops and crop mixtures by percentage of cultivated acreage in the Funtua project area (1976-771.
Crop enterprise Estimated % of total acreage (ha) cultivated
Sorghum/millet 112921 24.2 Sorghum a4 924 12.2 Cotton 36 396 7.8 Cotton/cowpeas 16 332 3.5 Cotton/millet 13 999 3.0 Cowpeas/sorghum/millet 12 132 3.0 Rice 11 199 2.6 Cowpeaslsorghum 7 933 2.6 Groundnuts/sorghum 7 933 1.7 Cottonlcowpeas/miIlet 7 933 1.7 Peppers 7 466 1.6 Others 46 200 30.3
Source: See text, Ukpabio, op cit. Ref 9. Total 371 000 100.0
centres (in each district) and 77 farm service centres in the area. 0 Provision of adequate farmer extension, credit and marketing
services, including staff, vehicles and equipment. 0 The establishment of unit to evaluate the project. 0 Preparation of plans for the continued provision of project
services after the initial investment phase of the project.
The planned expenditure of the project was #36 million ($57.6 million) over the 1975-80 investment period of which 5 1% would be a World Bank loan; Kaduna State and the federal government contributed the remainder.9
Project area characteristics The average farm size in the project area is 4.1 hectares with the average household having 4.11 fields. Intercropping (the growing of crops in mixtures) is a common feature of the cropping system. Since the provision of food needs is a major objective of the majority of farmers in the area, sorghum and millet are the predominant food crops, while cotton and groundnuts are the predominant cash crops (Table 1).
9 Godswill E. Ukpabio, Productivity Differentials Between Small and Large Scale Farmers: A case study of the Funtua Agricultural Project Area, MSc Thesis, Ahmadu Belle University, 1978. lo ‘A farming system IS an agricultural system that has evolved over trme as a result of the interactions among the soil, water and climatic base, human capabilities, and markets in the region’, National Academy of Sciences, World Food and Nutrifion Study, Vol II, Washington DC, 1977 ” Federal MInistry of Agriculture and Rural Development, Funtua, Gusau and Gombe, Agricultural Development Projects Progress Report Summary, 1 July to 30 September, 1977, p 4.
Impact on the Funtua area
Changes in area’s farming systemlo In an effort to increase agricultural production in the area, the project emphasizes the need to change the farming system:
The traditional farming systems have satisfied the peasant farmer but cannot stand up to the change of a growing population and a rapidly developing country.”
In an attempt to change the present farming system, the project introduces the farmer to improved varieties of seeds, fertilizers, herbicides and other agronomic practices. This is undertaken through farm service centres which provide the inputs and an impressive network of extension service. Demonstration plots are organized by the farm service centres to inculcate in farmers the need for changing their farming system, utilizing improved technological packages that the project is providing. The crops for which packages are provided for include sorghum, maize, groundnuts and cotton.
204 FOOD POLICY November 1980

Crop production
Integrated rural development in Nigeria
Maize, sorghum, cotton and groundnuts were the major crops that were emphasized for increasing agricultural production. Previously, maize had not been grown in large quantities in the project area. But the Guinea Savannah zone in which the project lies has been identified as having the greatest potential for increasing maize in the country.‘* Table 2 shows that demand exists for maize as imports are increasing.
The extent to which desired changes have been achieved can be discerned by Table 3, which provides estimates of production for major crops compared to pre-project projections over the years 1976. 77 to 1978-79. The pre-project projections indicate the benefits which would accrue from the project, while the actual production estimates indicate the benefits that have accrued from the project over the past three years.i3
Pre-project projections show that by 1978/79 maize, cotton and groundnuts would be the crops that would constitute the greatest share of the value of production. However, it appears that sorghum in 1978/79 accounts for nearly 67% of the value of production compared to the pre-project estimate of 26%. At the same time, maize, cotton and groundnuts have reached only 50% of their projected value of production. This suggests that there appear to be problems with the production of these three crops. Some of these problems could be attributed to disease, bad weather, farmers not following recommended planting dates for cotton and particularly marketing problems associated with maize.
The increase in the magnitude of sorghum production suggests that farmers have increased acreage sown and could have also achieved higher yields as shown in Table 4. A major proportion of this increase in sorghum production does not appear to come from those farmers that the project terms ‘improved’.i4 These ‘improved’ farmers cannot be the ones who are growing improved sorghum or ‘short kaura’. In a special report on farmers growing ‘short kaura’ in 1978/79, the project estimated that 1 000 farmers grew short kaura for a total acreage of 2 620 acres. i5 This is in conflict with data reported on improved farmers growing sorghum in another project document which states that 19 562 were improved farmers growing 46 616 hectares or 111 675 acres.i6
Over 70% of maize production in 1978/79 came from improved farmers, compared to only 19% in 1976/77, demonstrating a shift in production patterns of maize. However, maize production in the project area has achieved only 58% of the pre-project projection, after three years of the project.
It appears that the project is not achieving its objectives (Table 3). For example, increase in production has taken place for sorghum, a crop for which increased production was not envisaged. Similarly, maize production in the area has not achieved the desired level. Before analysing the possible reason for the non-achievement of the production targets, a brief description of the manner in which the project tries to increase crop production and productivity is necessary.
The project has classified farmers in the area into three categories: large-scale farmers who usually have a large farm acreage (about 100 hectares) and are commercially oriented; progressive farmers” who could have small acreages but are responsive to project extension advice and grow improved varieties; and traditional farmers who are
Table 2. Imports of maize by quantity and value.
Year Quantity (KgIa
1974 2 440 336 1975 2211 110 1976 9 861 382
Value
608 289 419 999
1 422 338
1977b 20 171 827 3490 112
Notes: a Unmilled: b January-August.
Source: See text, Abalu and D’Silva, op cit. Ref 12, p 3.
‘* G.O.I. Abalu and 8. D’Silva, ‘Nigeria’s food situation: problems and prospects, Food Policy. Vol 5, No 1, February 1980, pp 49-60. r3Value of production is used as an indicator of benefits by the World Bank in their project appraisal. Hence, this is an attempt to measure project performance using the Bank’s criteria, even though we do not completely subscribe to this method of appraisal. Production of crops for all years is valued at 1976/77 prices. ‘4 There appears to be some confusion as to exactly what the project means by the use of the word ‘improved’. A project report defines improved farmers as those using Improved seed. However, data on sorghum following this definition is confusing as seen above (Federal Ministry of Agriculture and Rural Development, Quarterly Report, 1 October to 31 December 1978). l5 Kaduna State, Ministry of Agriculture, FADP Evaluation Unit, Farmers Growing Short Kaura. Report on 1978/79 season.- l6 Kaduna State, Ministry of Agriculture, FADP Quarterly Report, 1 January to 31 March 1979, p 18. ” Large-scale farmers are progressive farmers, but not all progressive farmers are large-scale farmers. However, the project’s objective is to eventually convert all progressrve into large-scale farmers (2.0. Tiyem, A Study of Extension Services in Funtua Agricultural Development Project, HND paper, College of Agnculture, Ahmadu Belle University, Zaria, Nigena, 1979).
FOOD POLICY November 1980 285

Tab
le 3
. C
om
pat
tso
n o
f p
re-p
roje
ct p
roj~
ctlo
os
and
act
ual
pro
du
ctio
n
of
mat
or
cro
ps
m t
he
Fu
ntu
a p
roje
ct a
rea
(187
6/77
-197
8/7~
).
PW
. p
ro)e
cte
pro
ject
ion
So
rQh
um
90
250
Maz
e 7
662
Cot
ton
31 53
2
Gro
un
dn
uts
17
280
Caw
pea
s 2
225
c_
1976
177
--a-
Val
ue
Tec
hn
ical
(#
x1&
es
tim
atea
V
alu
e W
Xl&
17 7
32.5
18
6 41
0 24
233
.3
(39.
69)C
(5
1.66
1 1
838.
8 3
300
7 92
0 0X
!2)
(16,
881
9 45
9.6
3212
3 9
636.
9 (3
2.00
1 12
0.54
1 60
4%
11 6
93
4 09
2.5
120.
46)
18.7
2)
480.
6 4
716
1 01
8.6
(I.6
21
(2.1
7) I
I---
---‘
Pre
- p
roje
cta
pro
ject
ron
90 5
00
17 3
65
44 4
88
21 3
60
2 57
5
---.
-197
7i78
~
Vat
ueb
fe
chm
cal
&x1
93)
esti
mat
e
fl
765
132
484
(31.
53)
4 16
7 6
13 2
48
fl1.
16)
13 3
46.4
t5
9c5
(35.
77)
7 47
6 18
376
(2
0 03
1 55
6.2
1 80
0 (I
,49
1
Val
oeb
W
lll3)
17 2
22.9
(5
3.83
) 3
1795
19
93)
4
770
(14.
90)
6 43
7.6
(20.
10)
388.
8 (1
.211
I Pre
- p
roje
ct
pro
ject
ion
o4
000
40 6
25
55 8
25
23 6
40
2 92
5
_ 19
7817
9 --
----
-__1
12 2
20
(25.
65)
9 75
0 (2
0.47
) 16
747
.5
(X.1
61
3 27
4 (1
7.37
) 63
1.8
(1.3
21
Tec
hn
ical
V
alu
eb
estr
mat
e w
x103
~
253
743
32 9
86.5
(6
6.36
) 23
554
5
652.
9 01
.37)
17
008
5 10
2.4
(IO
.261
14
000
4900
(9
.85)
4
907
1059
9 12
.13)
Val
ue
of
pro
du
ctio
n
ove
r 3
year
per
tod
Pre
- p
roje
ct
Tec
ho
i#l
pro
ject
ion
es
tim
ate
35 7
17.5
74
442
.7
(31.
191
157
88)
15 7
56.4
16
752
.4
(13,
762
(13.
02)
39 5
53.5
19
509
.3
(34.
64)
(10.
501
21 7
98
15 4
24.1
(19.
03)
(11.
99)
1 66
8.6
2 46
7.3
(1.4
5)
r191
1
Tab
le 4
. C
om
~rat
iye
~rfo
rman
ce
of
tmp
rove
d e
nd
tta
dlt
ioo
al
farm
ers
in t
he
Fu
ntu
a p
roje
ct a
rea
tlS
76/7
7-19
78~9
).
So
rgh
um
im
pro
ved
Tre
dit
ton
al
To
tat
Mai
ze
Imp
rove
d
Tra
dit
ron
al
----
- 19
7817
9 1
Nu
mb
er
of
gro
wer
s
Area
Ih
a)
6 00
0 16
000
16.9
7ia
15.5
89
80 0
00
270
504
197.
03)
194.
42)
86 0
00
286
504
373
689
13.2
81
(13.
42)
$0 9
77
4 44
4 19
2.72
) (8
6.5&
l I1
35
0 51
33
cotto
n Im
pro
ved
Tra
dtt
ton
at
To
tal
960
2 17
7 (1
.2)
(2 2
61
79 0
40
93 9
46
(98.
8)
(97.
74)
8oO
wJ
96
123
3 G
~o~o
dn
uts
r Im
pro
ved
12
oO
Q
(33.
331
G;
Tra
dit
Ion
al
24 0
00
!z
(66
67)
To
tal
3600
0
10 0
00
(40.
43)
14 7
30
159.
57)
24 7
30
Yie
ld
(kg
/ha)
800
642
651
903
603
643
1 05
4
318
334
750
285
475
Tot
al
Nu
mb
er
pro
du
ctio
n
of
(to
nn
es)
gro
wer
s
Are
a Y
ield
(h
a)
(kg
/ha)
1280
0 22
000
33 4
50
(6.8
6)
(14.
36)
(12.
75)
173
610
73 6
45
228
776
(93
141
(85.
643
(8?
.2%
J $8
6 42
0 86
000
26
2 22
6
622
3 26
9 4
575
(18
84)
118.
33)
143.
w
2 67
8 14
560
5
895
(81.
161
(81.
67)
(56
31)
3 30
0 17
829
10
470
2 29
4 1
796
3 50
8 (7
.141
(2
.24)
(3
.40)
29
8’2
9 78
204
99
383
19
2 86
) 19
7.76
) 19
6.6)
32
12
3 80
000
10
2 89
0
7 50
0 16
000
12
000
(6
4 14
) (1
9.75
) (1
7.00
) 4
193
65 0
00
58 5
50
135.
86)
(80.
25)
183.
001
11 6
93
81 0
00
70 5
65
800
462
505
1 86
5
800
1 26
5
792
132
155
800
150
262
fota
f N
um
ber
p
rod
uct
ion
o
f It
on
nes
) g
row
ers
Are
a
Yie
ld
(ha)
(k
g/h
a)
26 7
60
19 5
62
46 6
14
(7.0
19)
12
2.74
) (1
2.85
) 10
5 72
4 66
438
31
5 87
6 (7
9.81
F
(77
26)
187.
15)
132
484
86 0
00
362
490
8 53
2 6
521
7 46
6 (6
4 40
1 (2
2.86
1 (4
6.99
) 4
716
22 0
00
8 47
0 13
5.61
17
7.14
) E
3.01
) 13
24%
28
521
15
956
2 77
3 1
486
2 92
2 (1
7.44
) (2
.41
I (3
.74)
23
127
60
000
75
000
(8
2 56
) (9
7.59
) (9
6.26
) 15
900
61 4
86
77 9
22
9 60
0 19
562
25
824
(5
.221
(2
4.15
1 (3
0 38
) 8
776
61 4
38
59
176
(94.
78)
175.
85)
(69.
62)
18 3
76
8l
000
85o
oo
800
685
700
2 25
2
800
1 48
3
918
191
218
300
106
165
Tot
al
pro
du
ctio
n
(to
nn
es)
37 2
91
(14.
69)
216
452
(85
31)
251
743
16 8
16
(71.
39)
6 73
8 i2
8.61
) 23
554
284
(15.
78)
f4
24
184.
221
17 0
8
7 77
(5
5.31
6
25
(44.
6)
24 0
0

Integrated rural development in Nigeria
Table 5. Extension visits of FADF staff to category of farmers (1978/79).
Type of farmer Number in % of Extension visits % of total
group total by project staff visits
Farm management (large-scale) 185 0.186 3 092 1.21
Progressive 19 562 22.7 154 235 60.11 Traditional 66 438 77.2 99 267 38.69
Source: Ref Total 86050 100.00 256 594 100.00
See text, op tit, 16
following traditional farming patterns and have not adopted improved packages.
The project estimated that there were 186 large-scale farmers in 1978-79, 19 562 farmers were identified as progressive farmers and the rest (66 438) were traditional farmers.18 The project deals with each category of farmers in a different manner. While all farmers may take advantage, in theory, of project services like purchase of inputs” (seed, fertilizer, herbicide) or loans for tractor hire and ox-ploughs, the project concentrates its efforts on the progressive and large-scale
Notes to Table 3: farmers. An indicator of this is the number of extension visits paid to a In tonnes; each category of farmers shown in Table 5. b Using 1976-77 prices in N per tonne. Table 5 shows that nearlv 60% of the extension visits were Sorghum 130; Marze. 240; Cotton. 300, Groundnuts. 350: Cowpeas: 2 16;
concentrated on the progressiie farmers, who constitute only 22.7%
C Figures rn parentheses represent of all farmers in the area. The project also assists the large-scale
percentage of total value of productron for farmers with intensive extension advice, covering the design, the year. Source. See text, op cit. Ref 16 Prices
implementation and supervision of farm plans.*O
obtained from Ukpabio, op cit. Ref 9. Given the emphasis of extension advice for progressive farmers, a comparison of their performance with that of the traditional farmer is
Notes to Table 4. necessary, This is undertaken with respect to the production of a Figures in parentheses represent improved sorghum and improved maize. percentage of total from each group. Source: See text, op cit. Ref 16.
Sorghum
The project has estimated that one thousand farmers (progressive and large-scale farmers) grew improved sorghum and achieved a total production of 1 122 tonnes for an average yield of 954 lbs per acre during the 1978/79 season. However, the total production of sorghum
‘* Op cit. Ref 16. ” Fertrlizer and seed can only be
in 1978/79 in the project area was estimated at 253 743 tonnes.”
purchased for cash, while sprayers and This suggests that a majority of the output in sorghum can be ox-ploughs can be purchased for cash or attributed to the traditional farmer. Given the importance of sorghum credrt. The project has not yet set up a tractor hiring unit in the area.
as a food crop, this is not surprising. Furthermore, the yield
‘a J.A. Sani, The Study of Large-Scale performance of progressive farmers is also questionable since studies Farmlng in Funtua Agricultural in the area have shown that average yields of 1680 kilogrammes per Development Project, HND paper, College of Agnculture, Ahmadu Bello
heclare or 1 540 lbs per acre have been achieved using the improved
Unrversity. Zana, Nigeria, 1979. sorghum technology on farmer’s fields.** *’ Op cit. Ref 16. There are definite reasons why farmers may not be growing ” D.W. Norman, et al. ‘The feasibilitv of improved sole crop sorghum production
improved sorghum in increased quantities.23 Among these are the fact
technology for the small-scale farmers in that the price of improved sorghum is consistently lower than that of the Northern Guinea Zone of Nigeria’, the traditional varietv. ‘fara-fara’. Hence, marketing. of the grain could 1976. 23 Based on preliminary field work
be a problem. There-also appears to be a problem related 6 the ‘food 24 undertaken by the Department of value’ of improved sorghum. In the rainy season, it appears (to
Agricultural Economics and Rural Sociology In conjunction with the NAFPP
farmers) that imuroved sorghum provides less food value than the
sorghum programme. traditional variety. While these are preliminary results, it appears that
24 Some farmers define this as the farmers are aware of these problems and hence may not be adopting amount of pounded grain value. improved sorghum to the extent that the project anticipated.
FOOD POLICY November 1980 287

Integrated rural development in Nigeria
Table 6. Average area devoted to major crops by small-scale and large-scale farmers in the
project area.
Sorghum Cotton Groundnut Maize
Small-scale Large-scale
Area (ha) % of acreage Area (ha) % of acreage growna grownb
1.49 37.6 29.87 31.53 1.32 33.2 32.12 22.90 0.63 15.83 11.95 12.61 0.53 13.33 20.79 21.94
Notes: a n=30; b n=58.
Source. See text, Ukpabio. op cit. Ref 9 Total 3.97 100.00 94.73 100.00
25These steps included an initial price guarantee, extension advice concentrated on malze production, and assistance in the marketing of maize. 26 Op c/t, Ref 22. 27 Op cit. Ref 9. 28 Op cit. Ref 16, p 17 == Ibid. 30 Ibid
Maize
As stated above traditional maize has only been grown in small quantities before the advent of the project in the Funtua area. In fact, less than 1% of the total cultivated area was devoted to maize production in the 1976-77 season (maize was grown intercropped rather than sole). However, the project has tried to introduce a new variety of sole-cropped maize. But, the adoption of maize also does not seem to be occurring to the extent that the project had hoped. Project estimates (as seen previously in Table 3) show that in 1978/79 only 57.8% of projected (pre-project planning estimate) output of maize was realized. This is in spite of the fact that the project has undertaken specific steps to achieve increased output.25
Project maize is grown mainly by large-scale and progressive farmers rather than small-scale farmers as shown in Table 6.
This relative absence of maize in the cropping pattern for small- scale farmers could be attributed to the importance that these farmers place on subsistence food needs, traditionally met by sorghum.26 On the other hand, large-scale farmers are commercially oriented and hence income generating crops would be expected to be present in their cropping pattern. The project has emphasized this by guaran- teeing a price of 24 kobo per kilogramme or W240 per tonne in 1976/77 for maize. This price was greater than the price of the other prominent food crop (sorghum) which was 13 kobo per kilogramme or W 130 per tonne. 27 This relative price differential, with the commercial orientation of large-scale farmers, suggests that the increase in overall maize production in the area could be attributed to large-scale farmers.
In the 1978/79 harvest, problems with the marketing of maize were discovered since ‘the local markets were saturated’.28 This has led to larger farmers having difficulty ‘in disposing of their crop at the price they were expecting’.29 This occurred in spite of the fact that estimated maize output was less than the originally projected output for the year. The project also wished to guarantee the purchase of maize in 1979/80 ‘to encourage further increase in production’.30 Hence, it appears that by guaranteeing a price initially, the project has probably put itself into a position from which it may have difficulty in extricating itself. The project’s desire to increase maize production could be attributed to the fact that initially one of the benefits accruing from the project was to be the increased output of maize. This situation must be viewed critically if large-scale farmers are encouraged to grow maize, then large-scale farmers will expect the project to purchase the maize. This could lead to marketing problems and to increasing income differentials in rural areas. Reasons for non-
288 FOOD POLICY November 1980

Notes: a n = 30; bn = 58. Source See text, Ukpabio, op cit. Ref 9, p 80.81, and 83.
3’ Based on discussrons by a member of staff, Department of Agricultural Economics and Rural Sociology, wrth farmers in selected project villages. X2 G 0.1. Abalu and B. D’Silva, ‘Socio- economic analysis of existrng farming systems and practices in Northern Nigeria’, paper presented at Workshop on Socio-Economrc Constraints to Development of Semi-Arid Tropical Agriculture, ICRISAT, Hyderabad, Indra, 19-23 February, 1979. 33 Letter from Chief Project Evaluation Officer to Staff member, Department of Agricultural Economics and Rural Sociology, 15 May. 1978.
Integrated rural development in Nigeria
Table 7. Comparative resource base of smallxale and large-scale farmers in the Funtua area.
Resource Small-scales
Land (ha) 3.975
Labour utilized (average mandays/ha) 31.98 Naira spent per ha for available inputs (for 8.28
most prominent crop) (Sorghum)
Large-scaleb
94.75 70.94 14.89 (Maize)
adoption of project maize need to be viewed with care and are discussed below.
Reasons for the low adoption rate of maize3’ Project maize requires fertilizer, both before planting and after the first weeding. These fertilizer requirements amount to 200 kilograms per hectare. Since fertilizer has been in short supply, and the project does not provide fertilizer on credit, traditional farmers desiring to use improved maize would face a cash constraint in the purchase and use of fertilizer (Table 7). Currently, this constraint could be greater as the subsidy on fertilizer has been reduced from 75% to 50% by the federal government. Another problem related to the acceptance of project maize is its taste preference. Consumers do not like to eat project maize fresh or roasted, while they do eat it boiled. Local maize, on the other hand is preferred whether boiled or roasted.
From the above discussion, it is evident that the project is having difficulty in achieving its stated goals concerning increased agricultural production. Definite problems exist with regard to the adoption of some improved technologies. These could be related to factors such as the technologies themselves, the manner in which technologies are demonstrated to the farmer-, and priorities and objectives of the farmers which may be different from those of the project.
For example, while mixed cropping is predominant in the farming system, all of the improved technologies introduced by the project emphasize sole cropping. Since mixed cropping follows the rationale of being a risk aversion, income maximization and nutritional strategy on part of the traditional farmer, 32 the transition to sole cropping would be difficult to achieve.
Project extension activities An important aspect of the project is the development of an effective extension service to demonstrate the new ‘improved packages’ to the farmers. The FADP extension effort concentrates on individual farmers and not on groups of farmers. This is due to the following premises the project staff have stated:33
We doubt the long-term effectiveness of group extension. Without suitable glue, like the offer of credit for fertilizer, groups tend to split up. We prefer the trickle-down approach from farmer to farmer, accepting that some will thereby benefit later than others. As a consequence of this preference, we concentrate on our notorious ‘progressive’ farmers. For organization and administrative reasons we must choose a reasonably small section at first.
FOOD POLICY November 1980 289
Integrated rural development in Nigeria
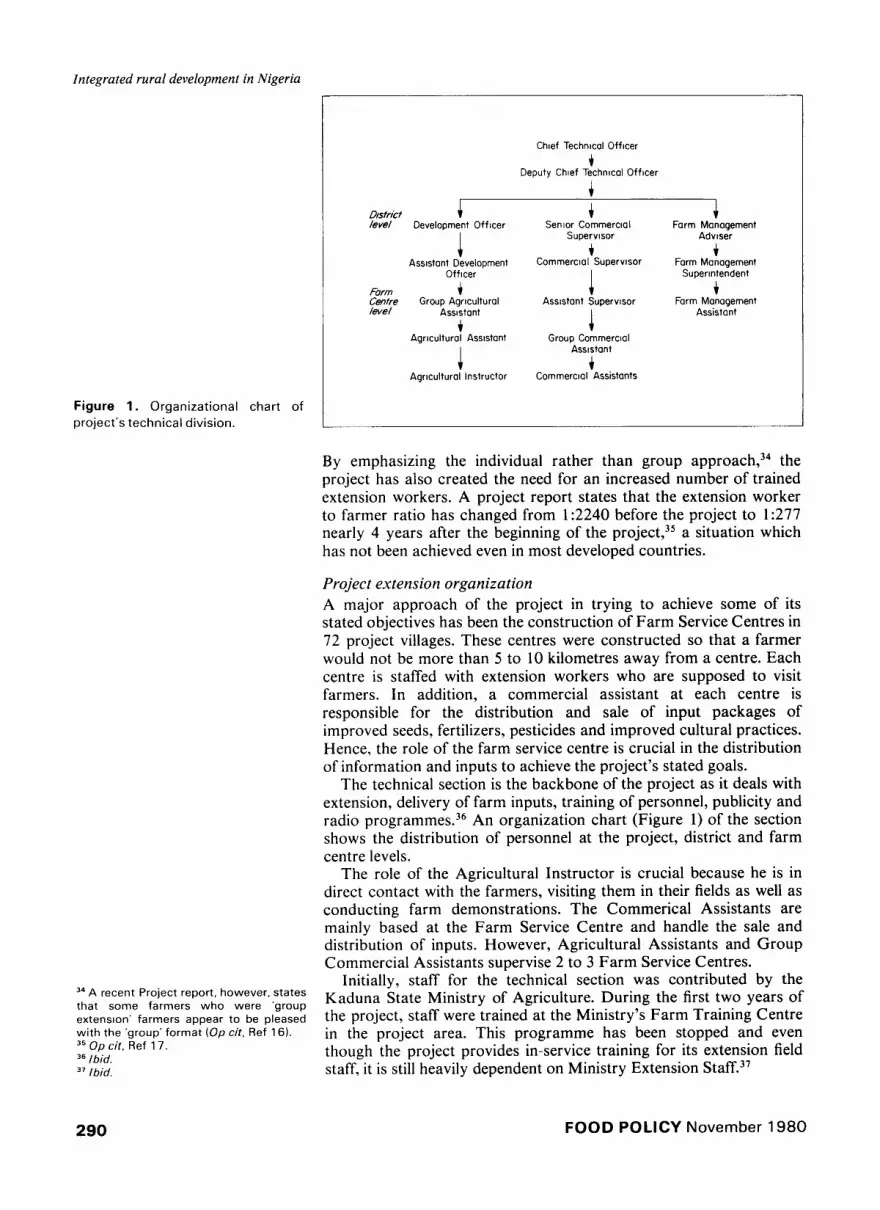
Figure 1. Organizational chart of
project’s technical division.
MA recent Project report, however, states that some farmers who were ‘group extension’ farmers appear to be pleased with the ‘group’ format (Op cit. Ref 16). 35 Op cit. Ref 17. 36 Ibid. 37 Ibid.
290
Chief Techmcal Officer
4 Deputy Chief Techmcal Officer
i
4 J Senior Commerclol Farm Management
Superwsor Adviser
4 + Cornmercml Superwsor Form Management
I Supermtendent
y$f 4 Development Officer
I Assistant Development
Officer
Farm i Cenfre Group Agrwlturol level AssIstant
+ Agrwltural Assistant
4 Agrwlturol Instructor
4 c Assistant Superwsor Farm Management
I Assistant
4 Group Commercial
AssIstant
4 Commercial Assistants
By emphasizing the individual rather than group approach,34 the project has also created the need for an increased number of trained extension workers. A project report states that the extension worker to farmer ratio has changed from 1:2240 before the project to 1:277 nearly 4 years after the beginning of the project,35 a situation which has not been achieved even in most developed countries.
Project extension organization A major approach of the project in trying to achieve some of its stated objectives has been the construction of Farm Service Centres in 72 project villages. These centres were constructed so that a farmer would not be more than 5 to 10 kilometres away from a centre. Each centre is staffed with extension workers who are supposed to visit farmers. In addition, a commercial assistant at each centre is responsible for the distribution and sale of input packages of improved seeds, fertilizers, pesticides and improved cultural practices. Hence, the role of the farm service centre is crucial in the distribution of information and inputs to achieve the project’s stated goals.
The technical section is the backbone of the project as it deals with extension, delivery of farm inputs, training of personnel, publicity and radio programmes. 36 An organization chart (Figure 1) of the section shows the distribution of personnel at the project, district and farm centre levels.
The role of the Agricultural Instructor is crucial because he is in direct contact with the farmers, visiting them in their fields as well as conducting farm demonstrations. The Commerical Assistants are mainly based at the Farm Service Centre and handle the sale and distribution of inputs. However, Agricultural Assistants and Group Commercial Assistants supervise 2 to 3 Farm Service Centres.
Initially, staff for the technical section was contributed by the Kaduna State Ministry of Agriculture. During the first two years of the project, staff were trained at the Ministry’s Farm Training Centre in the project area. This programme has been stopped and even though the project provides in-service training for its extension field staff, it is still heavily dependent on Ministry Extension Staff.37
FOOD POLICY November 1980
Integrated rural development in Nigeria
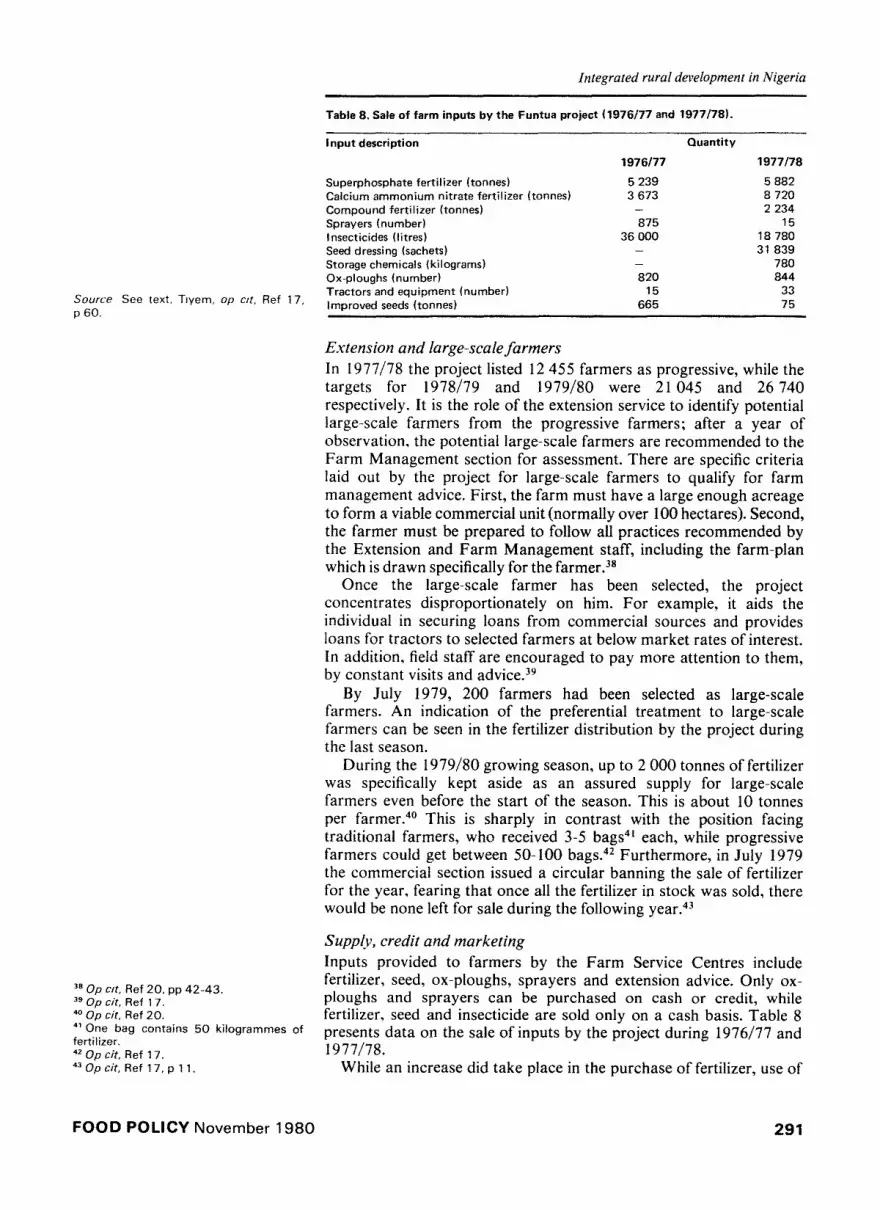
Table 8. Sale of farm inputs by the Funtua project t1976/77 and 1977178).
Input description Quantity
Superphosphate fertilizer (tonnes) Calcium ammonium nitrate fertilizer (tonnes) Compound fertilizer (tonnes) Sprayers (number) Insecticides (litrest Seed dressing (sachets) Storage chemicals (kilograms) Ox-doughs (number)
1976177 1977178
5 239 5 882
3 673 8 720
- 2 234
875 15
36 000 18 780
_ 31 839 _ 780 820 844
Source See text, Tlyem, op c/t, Ref 17, Tractors-and equipment (number) 15 33
p 60. Improved seeds (tonnes) 665 75
Extension and large-scale farmers In 1977/78 the project listed 12 455 farmers as progressive, while the targets for 1978/79 and 1979/80 were 2 1 045 and 26 740 respectively. It is the role of the extension service to identify potential large-scale farmers from the progressive farmers; after a year of observation, the potential large-scale farmers are recommended to the Farm Management section for assessment. There are specific criteria laid out by the project for large-scale farmers to qualify for farm management advice. First, the farm must have a large enough acreage to form a viable commercial unit (normally over 100 hectares). Second, the farmer must be prepared to follow all practices recommended by the Extension and Farm Management staff, including the farm-plan which is drawn specifically for the farmer.38
Once the large-scale farmer has been selected, the project concentrates disproportionately on him. For example, it aids the individual in securing loans from commercial sources and provides loans for tractors to selected farmers at below market rates of interest. In addition, field staff are encouraged to pay more attention to them, by constant visits and advice.39
By July 1979, 200 farmers had been selected as large-scale farmers. An indication of the preferential treatment to large-scale farmers can be seen in the fertilizer distribution by the project during the last season.
During the 1979,&O growing season, up to 2 000 tonnes of fertilizer was specifically kept aside as an assured supply for large-scale farmers even before the start of the season. This is about 10 tonnes per farmer. 4o This is sharply i n contrast with the position facing traditional farmers, who received 3-5 bags4i each, while progressive farmers could get between 50-100 bags.42 Furthermore, in July 1979 the commercial section issued a circular banning the sale of fertilizer for the year, fearing that once all the fertilizer in stock was sold, there would be none left for sale during the following year.43
Supp&, credit and mar~eii~g Inputs provided to farmers by the Farm Service Centres include
38 Up at. Ref 20. pp 42-43. fertilizer, seed, ox-ploughs, sprayers and extension advice. Only ox-
39 op cit. Ref 17. ploughs and sprayers can be purchased on cash or credit, while 4o Qp cif, Ref 20. 4’ One bag contains 50 kilogrammes of
fertilizer, seed and insecticide are sold only on a cash basis. Table 8
fertilizer. presents data on the sale of inputs by the project during 1976177 and
” Op cit. Ref 17. 1977178. 43 Op cif, Ref 17, p 1 1. While an increase did take place in the purchase of fertilizer, use of
FOOD POLICY November 1980 291

Itttegrated rural development in Nigeria
Table 9. Comparative distribution of fertilizer in the FADP area and the rest of Kaduna State (1976/77 to 1978/79).
Year FADP area Rest of Kaduna (tonnes) State (tonnes)
1976177 8912 23 005 1977178 16 836 26 016 1978179 15 839 20 434
Source, See text, Tlyem, op cit. Ref 17; Abalu, op cit. Ref 54; op cit. Ref 55.
Q Kaduna State, Mimstry of Agriculture, FADP Quarterly Report, 1 January to 31 March 1978. 45 Ibid. 46 Op cit. Ref 44, p 1 1.
insecticides and sprayers dropped considerably. Use of fertilizer is related to the availability of cash since the project does not provide credit for fertilizer purchase. This, with the fact that the average amount spent on variable inputs by small-scale farmers was #8 per hectare, suggests that the availability of cash could be a constraint to fertilizer utilization. Furthermore, individuals with access to cash could purchase large amounts of fertilizer and ‘buy if off the market’, thereby creating further fertilizer shortages. Large-scale farmers growing cash crops would therefore be at an advantage compared to the traditional cash-poor farmer.
With concentrated extension activity, fertilizer distribution in the project area was proportionally much greater than fertilizer distribution in the rest of the state (Table 9).
The drop in the sale of sprayers and insecticides could be related to the poor cotton growing conditions which existed in 1977. Since sprayers are purchased on credit, repayment of credit and new purchases could be related to income derived from the sale of cotton. In the 1977/78 growing season, cotton yields were only 50% of the previous years’ yields; but, in spite of the reduced output, marketing of cotton was a problem. 44 This forced many farmers to sell to middle men at lower prices further affecting their income. During this time the project administration also felt that, ‘farmers are not being convinced of the merits of spraying to achieve higher yields’.45
This position with poor marketing progressed into 1978 to the extent that the project administration felt that ‘farmers were seriously affected and the situation became very pathetic and explosive’.46
The problems with cotton marketing are of interest because the project is involved in the cotton marketing system, having set-up permanent cotton buying markets. In the year 1977/78 the project purchased 7 288 tonnes or 40.5% of the total production in the area. Also, production of cotton in the project area has been well below the pre-project projections for 1977/78 and 1978/79. If the projected production levels had actually materialized, the marketing position would have been further aggravated.
Institutions and infrastructure Any development strategy aiming at integrated rural development should incorporate institutions and services which directly affect the welfare of rural people. Such an approach contributes to agricultural development in the long run. With the presence of these institutional services and amenities, the rural people will have a sense of participation in their own environment. Thereby, they may obtain a degree of satisfaction, which could counteract the strong pull of an urban environment, and arrest the drift to it.
In a study in the project area, structural information about institutional and infrastructural facilities present in 1966 and 1977 in sixty-six of seventy-two villages was collected from village heads and is shown in Table 10. It was observed that some of the basic institutional services and amenities like piped-water supply, maternity centres, stores selling patent medicines, post primary schools, postal agencies and electricity were present only in few villages. Improvement in spreading these facilities over an eleven year period (including the two years since the beginning of the project) has been slow.
292 FOOD POLICY November 1980

Integrated rural development in Nigeria
Table 10. Villages with selected institutional services in the Funtua project area (1966 and 19771.
Institutional services % of villages with services 1966 1977
Pipe-borne water supply 8 11
Postal agencies 3 3
Dispensaries open regularly 30 38
Customary court 8 9
Post-primary schools 2 6
Junior primary schools 45 98
Electricity 3 3
Newspaper vendors 5 5
Stores selling patent medicine 6 14
Commercial transport 32 61
Tarred roads 30 38
Laterite roads 67 83
Public radio 9 8
Community centres 17 27
People owning motorized vehicles 59 91
Maternity centre with permanent regular staff 9 15
Bicycle repair shops 83 94
Blacksmith shops 88 92
Source: M.R. Raza, unpublished data, Retail stores 26 33
Department of Agricultural Economics Cottage industries 6 11
and Rural Sociology, Ahmadu Bello Weekly market 36 26
Umversity, Zaria, Nigeria. Biweekly market 50 58
However, in terms of primary education there has been a remarkable increase, due to the Universal Primary Education Scheme started by the federal government in 1976.
A high proportion of villages had stores or shops dealing with traditional crafts, while cottage industries in the real sense were prevalent in few villages. Craftsmen (eg blacksmiths) were found in a majority of villages.
Villages were well served with infrastructural facilities such as tarred roads, laterite roads, commercial transport, weekly and biweekly markets. A fairly high percentage of villages had people owning motorized vehicles. Given the emphasis by the project on infrastructural development greater mobility and communication could have been achieved as well as more effective distribution of inputs and evacuation of crop produce, had it met its target of 1500 kilometres of road construction. However, by March 1978 only 275 kilometres of roads were constructed, while in March 1979, 408 kilometre of roads were completed. It is estimated that by 1980, road construction may reach 520 kilometres.47
The same report states that the target for road construction is now 700 kilometres indicating that earlier project estimates have been revised. The shortfall even from the revised figure will be up to 25%. This suggests that the socioeconomic and sociopsychological climate which could have been generated by infrastructural development has fallen short because the project has had difficulty in achieving its stated targets.
a’ Op cit. Ref 16.
Project financing, monitoring and evaluation
The total estimated cost of the project during its 5 years investment phase was #36 million, of which #I9 million or 63% would be a World Bank loan. Up to 3 1 March 1979, the project had spent a total of W32.37 million or 88% of its initial planned expenditure, and a year
FOOD POLICY November 1980 293

Integrated rural development in Nigeria
Table 11. Estimated and actual expenditure by category (1977/78, 1978/79 and cumulative total).
Vehicles, plant and equipment
Farm inputs
Salaries and allowances External staff
Local staff
Buildings, houses and construction materials
Vehicles and plant operating costs
General services costs
Total 6 071.1 9 247.2 152 7 168.4 6 274.4 87 31 473.3
Estimate Actual
250.4 484.7
2 040 3 297
175.4 143.4 82 200.6 208.4 104
1 197.0 1 197.0 140 1 595.8 1 944.4 122
783.6 1 829.3 233 873 1 403 161
823.6 925.4 112 1 057.3 676.4 64
800.2 883.4 110 762.4 723.1 95
1977178 1978179 Cumulative totalC
%a 193
167
1 224.9
1 456.6
Actual %
482.7 39
836.4 58
Estimate Actual
3 615.5 3 321.1 (11.49)b (IO.281
10 315.2 7 952.2 (32.77) (24.56)
662.4 843.5 (2.07) (2.60)
4 277.8 5 296.6 (13.59) (16.36) 7 530.6 10 484.4 (23.92) (32.38) 2 538.0 1 929.1
(8.00) (5.95) 2 542.8 2 545.2
(8.07) (7.86)
32 371.9 (100.00)
%
92
77
129
124
139
76
100
103
Notes:
a Actual as percent of estimate: b Figures in parentheses are percent of total; c Since beginning of the project to 31 March 1979.
Source. See text, op cit. Ref 16; op cit. Ref 44.
of the initial investment period still remained (Table 11). Hence, the project appears to have overrun its expenditure.
A breakdown of expenditures by item show that while 32.77% of the budget was estimated to be expended on farm inputs, only 24.56% was spent, in spite of the overall cost overrun. Building construction had the largest share of actual costs and, with salaries for locally recruited staff, had larger actual shares of expenditure than initially anticipated. Hence, it appears that the project is not achieving its objective with respect to input purchase and distribution, a major component of the integrated rural development programme.
An important factor considering the valuation of benefits due to the costs incurred should also be mentioned here. As seen in Table 4, pre- project projections anticipated increased production of maize, groundnuts and cotton which has not occurred over the 1976/77 to 1978/79 period. This suggests that if it were not for increased sorghum production in the project area (an event that the project did not foresee), the benefits from the project would really be overvalued. Hence, a more thorough financial appraisal of the project is necessary before decisions concerning its extension to other parts of the state or the country are made.
The project is also plagued with a cash flow problem. Numerous project reports emphasize the delays in either federal or state financing. This is especially evident in the report for the quarter ending 3 I December 1978, which states that the financial situation is in the ‘doldrums and the state government is unable to pay it’s own share’.48 A recent quarterly report 49 states that the financial situation of the project continued to deteriorate: unless funds were forthcoming from state and federal sources, the project would be forced to cut down on its level of activities; and, this would have an adverse effect on the proposed state-wide project.
48 Kaduna State, Ministry of Agriculture, Monitoring and evaluation FADP Quarterly Report, 1 October to 31 December 1978. A central evaluation and monitoring unit exists for all the World 49 Op cit. Ref 16. Bank rural development projects in the northern states. This unit also
294 FOOD POLICY November 1980

Integrated rural development in Nigeria
oversees each project’s own evaluation section. Data are collected by field staff in each project area and then passed on to the central unit through each project’s evaluation unit. There are serious problems with the analysis of the data. This is due to the various stages that the data collection and analysis process involves as well as the magnitude of data collected and the lack of trained computer programmers.50
Each project conducts numerous surveys as part of the monitoring and evaluation process. For example, the Funtua project has conducted a baseline, mainline, punchline and deadline survey. But, only results from the baseline and mainline surveys have been produced. Since the monitoring and evaluation process is an integral part of the project, a steady flow of data is required to analyse the effect of the project and to monitor changes that have been taken place. The apparent inability of the central monitoring unit to perform its role satisfactorily suggests that this organizational set-up should be re-examined. These problems could assume a greater magnitude when the project is extended to the rest of Kaduna State or to other states in the country.
SO Until July 1979, only one full-time computer programmer was employed by the central unit. 5’ V.W. Ruttan, ‘Integrated Rural Development Programme: A sceptical perspective’, International Develooment Review, Vol 17. No 4,1975, pp 9-l 6. 52 Erik Eckholm, The Dispossessed of the Earth: Land Reform and Sustainable Development, Worldwatch Institute. Washlngton DC, 1979.
Implications
Project objectives While the project claims to be an integrated rural development project, this philosophy is not well adhered to. The conceptual isolation of agricultural development from rural development has resulted in heavy emphasis on production-related activities by the project to the apparent neglect of institutional services and amenities. Concern about projects of this nature has been voiced by Ruttan:5’
. . . the concern today with integrated rural development in the developing world represents, in part, a reaction against the distributions produced by production oriented (Green Revolution) rural development efforts of 1960s. Thus, a seed fertilizer programme or tractor loan service could keep progressive farmers while reducing the income of smaller farmers or increasing the landless.
It appears that Ruttan’s fears are being realized in the project area. The emphasis of extension advice on progressive and large-scale farmers to the detriment of the traditional farmers will lead to increasing rural income differentials. Large-scale farmers aided with farm management plans, tractor loans, access to inputs and commercial loans will displace the traditional cash-poor farmer who will continue producing for subsistence and hence may not be able to break out of the vicious cycle of poverty. The emergence of a landless class is a possibility for the first time in this area. Eckholm warns of the implications of the existence of a landless class:52
The huge and growing number of landless people lacking any prospects for a decent life ensure that the issue will become increasingly acute. The achievement of needed reforms will always be an intensely political, conflict-ridden process: it will often follow the mobilisation of long quiescent social groups and the overturning of traditional power structures.
A degree of uncertainty is also reflected in the conceptualization of the project as seen in the title of the Annual Reports. For example, in
1977 a report on the projects was entitled Northern Integrated Agricultural Development Projects, while in 1978 the same report was entitled Integrated Rural Development Projects. The latter title
FOOD POLICY November 1980 295

Integrated rural development in Nigeria
suggest that the project is emphasizing comprehensive rural development, which is not the case.
An important aspect of rural development is the creation of a climate of self-sustainment, towards which the project has made negligible progress. Since the investment phase of the project is nearly completed and as the World Bank project management withdraw, the lack of self-sustainment may adversely affect some of the project’s achievements.
Changes in the farming system The introduction of sole crop improved technologies in an area where mixed cropping has been a predominant feature of the farming system could lead to the breakdown of the existing ecological balance. The sole crop varieties require increased quantities of chemical fertilizer which could lead to increased acidification of the soi1.53
The improved varieties are also less resistant to the local weed (striga) than the traditional varieties. Hand weeding rather than herbicide use is the predominant practice in the area. Hence, use of improved technologies also accentuates the existing scarcity of farm labour during the labour bottleneck period. Lack of labour could therefore lead to reduced crop yields. Large-scale farmers in the area have reported that hired labour is the highest source of variable costs since labour is utilized for their planting, fertilizer application and weeding operations. Large-scale and progressive farmers, with their comparatively greater cash resources could attract wage-labour by paying higher wages, further affecting income distribution in the area and also contributing to the creation to a ‘wage-labour’ landless class.
Furthermore, the attempt to use ‘progressive’ farmers as sources of information and opinion leaders for the traditional farmer may not achieve its desired effect, since changes in the farming system are introduced specifically for progressive farmers with greater resources.
Costs and benejits While the extension of the project to the rest of the state and to other states may be physically possible, the economics of such a proposition needs careful analysis. Of primary importance will be the source of funds. To what extent will the federal government provide funds for similar projects? Where would the state governments obtain funds for these projects? Even if we assume that the project will be streamlined in its extension to the rest of Kaduna State, the total cost may well exceed MOO million,54 a significant portion of which would be in foreign exchange.
Increased agricultural production has been a major benefit as a result of the project. This increase has, however, not taken place to the level anticipated for crops like maize and cotton. Increased
53 G 0 I. Abalu and B D’Silva. ‘Integrated rural development and the environment:
production has also led to a fall in crop prices, which may benefit the
some lessons from an Integrated Rural urban consumers but not producers. While increased production has Development Project in Northern Nigeria’, resulted in increases in farm income, it has also affected the paper presented at the International Conference on the Enwronment, Arlon,
distribution of income.
Belgium, 23-29 September, 1979 The construction of feeder roads and the high extension worker to 54 G.O.I. Abalu, et al, Economic Survey of farmer ratio can be viewed as benefits accruing from the project. Kaduna State: Agriculture, Department of Agricultural Economics and Rural
Through the provision of inputs, especially fertilizer, the project has
Sociology, Ahmadu Belle University, provided farmers with the opportunity to achieve increased crop Zana, Nlgena, 1979. production and incomes. The increase in the magnitude of sorghum
296 FOOD POLICY November 1980

Integrated rural development in Nigeria
production by the traditional farmers could be the result of fertilizer availability.
In view of these tangible benefits, the project has generated expectations both among farmers in the project area and those in surrounding areas. These expectations may be difficult to meet, given the problems with the project and manpower constraints.
However, while there are benefits from the project, there are also costs. The question is, are the costs too great?
Manpower A project like the Funtua requires not only an administrative structure, but people to fill the positions in this structure. The project has four types of manpower requirements: managerial, supervisory, field and technical staff. With the planned extension of the project to the rest of the state and other states, manpower requirements would become a major constraint in the successful duplication of the project. Project reports themselves often mention problems associated with locating suitable staff. A recent report states:
. . . the continued absence of a Senior Evaluation Officer is very serious . . . no work with the Kaduna State project can be contemplated until suitable staff are found . . . 55
Given the high extension worker to farmer ratio in the project, a lower extension worker to farmer ratio (1:500) in the rest of Kaduna State would still require an additional 1300 extension workers. To obtain this number of extension workers would be extremely difficult with the limited agricultural training facilities that are currently available. If the project were to be extended to other states, the manpower requirements (even of trained extension workers) would be staggering.
To achieve a high degree of efficiency in the maintenance and functioning of input distribution services, a highly skilled technical staff is required. This would be equally difficult to meet with the existing level of technical training institutes in the country.
The capital requirements and problems associated with projects like Funtua raise the question: should such an approach be followed by other developing countries to achieve rural development? Nigeria can afford large capital outlays owing to its position as a petroleum producer and exporter. However, most developing countries may not be as fortunate though some have already adopted this strategy. Hence, extension of this model to other developing countries should be critically examined.
Recent evidence from Ghana on a project similar to Funtua has led the Ghanaians to argue that the World Bank ‘ . . . simply imported (an) inappropriate plan from Nigeria. It (the Bank) made sweeping and sometimes erroneous assumptions about local agricultural practices and then proposed outmoded’ green revolution solutions.56
In view of our evaluation of the Funtua Project, the concerns of the Ghanaians appear to be justified and relevant not only for Ghana but for Nigeria and other developing countries as well.
Alternatively, the question of approaches to integrated rural ” Kaduna State, Ministry of Agriculture, development may be raised, which may have the same effect as the FADP Quarterly Report: 1 July to 30 September 1979.
Funtua Project, but at far lower cost. These questions need to be
56 Joseph Hanlon, ‘World Bank and OOM answered before a decision can be made on the extension of the slammed over Ghana project’, Third project to other parts of Kaduna State, to other states in Nigeria and WorldAgriculture, July 1979. to other developing countries.
FOOD POLICY November 1980


