Embed Size (px)
Citation preview

Journal of Research in Personality 61 (2016) 99–108
Contents lists available at ScienceDirect
Journal of Research in Personality
journal homepage: www.elsevier .com/ locate/ j rp
Intelligence and Extraversion in the neural evaluation of delayedrewards
http://dx.doi.org/10.1016/j.jrp.2016.02.0060092-6566/� 2016 Elsevier Inc. All rights reserved.
⇑ Corresponding author at: Radboud University, Donders Institute for Brain,Cognition and Behaviour, Centre for Cognitive Neuroimaging, Kapittelweg 29, 6525EN Nijmegen, The Netherlands.
E-mail address: [email protected] (C. Civai).1 Present address: Universität Hamburg, Fakultät für Wirtschafts- und
Sozialwissenschaften, Von-Melle Park 5 (Raum 3076), 20146 Hamburg, Germany.
Claudia Civai a,⇑, Daniel R. Hawes b,1, Colin G. DeYoung c, Aldo Rustichini a
aUniversity of Minnesota, Department of Economics, 4-101 Hanson Hall, 1925 4th St South, Minneapolis, MN 55455, USAbUniversity of Minnesota, Department of Applied Economics, 1994 Buford Ave, Falcon Heights, MN 55108, USAcUniversity of Minnesota, Department of Psychology, 75 E River Rd, Minneapolis, MN 55455, USA
a r t i c l e i n f o
Article history:Received 19 December 2015Revised 16 February 2016Accepted 26 February 2016Available online 27 February 2016
Keywords:IntelligenceExtraversionTemporal discountingDecision preferenceFunctional connectivityChoiceEvaluation networkCaudate nucleusVMPFC
a b s t r a c t
Temporal discounting (TD), the preference for earlier, smaller rewards over delayed, larger rewards, is apervasive phenomenon that covaries with Big Five personality traits and Intelligence (IQ). This studyprovides novel insight by identifying correlates for IQ and Extraversion in the neural representation ofTD preferences. An intertemporal choice task was employed, where offers were sequentially presented,distinguishing between one evaluation phase (first offer is presented) and one comparison phase (secondoffer is presented and values are compared). IQ correlated with responses of caudate nucleus to thesubjective values of the offers, suggesting a role of cognitive abilities in modulating reward responses.Extraversion correlated with the strength of functional connectivity of a reward evaluation networkcentered on ventromedial prefrontal cortex.
� 2016 Elsevier Inc. All rights reserved.
1. Introduction
The consequences of our decisions are not always immediate.Many decisions specifically require us to evaluate current optionsfor their future outcomes. When future outcomes are positive—that is, rewards—human and non-human animals reveal a prefer-ence, all else being equal, for earlier delivery (see Frederick,Loewenstein, & O’donoghue, 2002 for a review). Later rewardsare thus discounted relative to sooner rewards. Relatively stableindividual differences in this temporal discounting (TD) tendencyare linked to a number of life outcomes. Preference for largerdelayed rewards over smaller immediate rewards (i.e., reducedTD) has been shown to predict both income and academic perfor-mance (Duckworth & Seligman, 2005; Duckworth, Tsukayama, &Kirby, 2013; Evans & Rosenbaum, 2008). TD also serves as a riskfactor for externalizing problems, including substance abuse disor-ders, aggression, and delinquency (Krueger, Caspi, Moffitt, Silva, &
McGee, 1996; Verdejo-García, Lawrence, & Clark, 2008). A betterunderstanding of the underlying factors contributing to stable indi-vidual differences in TD can contribute critically to understandinghuman decision-making, as well as potentially lead to improve-ments in both clinical treatment and social intervention.
A promising pathway toward understanding the source of indi-vidual variations in TD is to link it simultaneously to well-studied,broad dimensions of psychological variation and at the same timeto associated underlying neural substrates. Variations in TD, asmodeled by decision theory, can be interpreted and understoodwithin the broader frame of personality theory, and the additionof the neural underpinnings allows a deeper understanding ofthe decision-making mechanisms. This extension aids us inattributing the sources of the individual differences in choice todeeper individual differences in information processing and con-trol functions (DeYoung, 2015), clarifying for instance the roles ofExtraversion and intelligence. Toward this end, we carried out astudy of the neural basis of TD in relation to the Big Five personal-ity traits and intelligence. TD is robustly associated with intelli-gence (IQ); meta-analysis has estimated the correlation atr = �.23 (Shamosh & Gray, 2008). TD has also been linked to BigFive traits (most often Extraversion), but less strongly (Hirsh,Guindon, Morisano, & Peterson, 2010; Hirsh, Morisano, &

100 C. Civai et al. / Journal of Research in Personality 61 (2016) 99–108
Peterson, 2008; Ostaszewski, 1996). One very large study(N = 5888) found that TD was associated positively with Extraver-sion and Neuroticism and negatively with Conscientiousness andOpenness/Intellect (and unrelated to Agreeableness), but the stron-gest effect (for Extraversion) was only equivalent to a correlation of.10 (Mahalingam, Stillwell, Kosinski, Rust, & Kogan, 2014).Nonetheless, theories of the psychological functions underlyingthe Big Five render these associations intelligible (e.g., DeYoung,2015). Extraversion appears to reflect sensitivity to reward(Depue & Collins, 1999), which may increase the desirability ofsooner rewards relative to later rewards, whereas Neuroticismappears to reflect sensitivity to threat (Gray & McNaughton,2000), which may increase the aversiveness of waiting for adelayed reward (in part due to the threat posed by uncertainty;Hirsh & Inzlicht, 2008). Conscientiousness reflects self-disciplineand the tendency to resist distraction and act deliberatively, whichare clearly conceptually opposed to TD. Openness/Intellect is theBig Five trait most strongly related to intelligence, which probablyexplains its association with TD (which was the weakest of the foureffects found by Mahalingam et al. (2014)).
Research on the neurobiology of TD provides additional guid-ance for developing hypotheses regarding TD’s link to the Big Fiveand intelligence. In-depth research has been carried out on the neu-ral processes that subserve intertemporal decision-making (seePeters and Büchel, 2011, for a review). Most of this research hasbeen organized around the differentiation between two systemsthought to be central to value-based decisions. The first is a coreevaluation network, including ventral striatum and ventromedialprefrontal cortex (VMPFC), which represents neural subjectivevalue signals (Kable & Glimcher, 2007; McClure, Laibson,Loewenstein, & Cohen, 2004; for a review on VMPFC and the repre-sentation of unified subjective value see Rangel & Clithero, 2013).The second is a modulating control network, including dorsal andventral lateral prefrontal areas and the dorsal anterior cingulate(ACC), which engages in maintaining information in working mem-ory and inhibiting prepotent responses (Figner et al., 2010; Hare,Camerer, & Rangel, 2009; Kable & Glimcher, 2009). Recent researchshowed that functional connectivity between VMPFC and dorsolat-eral prefrontal cortex (DLPFC) plays an important role in determin-ing intertemporal choice. A study by Hare, Hakimi, and Rangel(2014) found that the DLPFC was more strongly connected to theVMPFC at the moment of choice and, in particular, during selectionof later rewards, suggesting that DLPFC may contribute to revealedpreferences by modulating VMPFC value signals during decision-making. This interpretation is supported by brain stimulation data(Figner et al., 2010), which demonstrates that delivering TMS overthe DLPFC and disrupting its activation decreases the choice ofdelayed rewards without changing participants’ ratings of howmuch they like those same rewards.
These two brain systems involved in TD clearly implicate theknown neural substrates of Extraversion and Intelligence, preciselythe two basic traits that appear to be most strongly linked to TDbehaviorally. Many studies have now shown that Extraversion isrelated to the sensitivity of the dopaminergic reward system thatis the core of the evaluation network (Depue & Fu, 2013;DeYoung, 2013; Wacker & Smillie, 2015). (Dopaminergic neuronsin the midbrain send signals reflecting reward value via axonsextending to the ventral striatum and VMPFC.) In functional mag-netic resonance imaging (fMRI), Extraversion has been found topredict increased neural activity in the ventral striatum in antici-pation of reward (Wu, Samanez-Larkin, Katovich, & Knutson,2014), and several structural MRI studies have found that Extraver-sion is positively correlated with volume of VMPFC (Cremers et al.,2011; DeYoung et al., 2010; Grodin & White, 2015; Omura,Constable, & Canli, 2005; although other studies have not repli-cated this finding: Bjørnebekk et al., 2013; Hu et al., 2011;
Kapogiannis, Sutin, Davatzikos, Costa, & Resnick, 2013; Liu et al.,2013).
Intelligence has been strongly linked to the cognitive controlnetwork with nodes in lateral PFC, dorsal ACC, and parietal lobes(Deary, Penke, & Johnson, 2010; Jung & Haier, 2007). Workingmemory appears to be the cognitive process most important forintelligence, and variation in the well-studied neural substratesof working memory appears to be crucial for IQ (Choi et al.,2008). Of particular relevance to the present study, one fMRI studyfound that neural activity in the lateral PFC during a working mem-ory task predicted both TD and intelligence assessed outside thescanner (Shamosh et al., 2008). Further, IQ has been linked to boththe functional reward response and the anatomical volume of thecaudate nucleus in the striatum (Grazioplene et al., 2015; Hawes,DeYoung, Gray, & Rustichini, 2014). The association of IQ withthe caudate may reflect that Intelligence modulates howprediction-error signals in this region respond to the perceived sta-tistical features of the environment, given that higher intelligenceis likely to afford enhanced evaluation of the context of reward.Such modulation may provide a mechanism by which intelligencebecomes linked to preferences through processes of basicreinforcement (Chen, 2014; Hawes et al., 2014).
Based on the clear correspondence between neural systemsinvolved in TD and those involved in Extraversion and intelligence,the current study aimed at combining personality and fMRI data toproduce a more integrated understanding of individual differencesin TD. Our primary hypothesis was that Extraversion and IQ wouldpredict distinguishable patterns of neural activity during intertem-portal choice. We developed a new variation of the basic intertem-poral choice task, in which we presented two payment options, oneearlier and smaller and one later and larger, sequentially, beforerequiring participants to choose between them. The sequentialpresentation was novel and made it possible to distinguish a firstphase of evaluation—when only a single option is known—from asecond phase of integration—when the second and last optionbecomes known and during which the two options and their valuescan be compared. Differentiating these two phases allows a betterunderstanding of the different contributions of the evaluation andthe cognitive control systems in processing delayed rewards.
2. Methods
2.1. Participants
A sample of 304 right-handed participants between the ages of20 and 40 years was scanned in fMRI as part of a larger study. Ofthese, only 250 (123 female; age: M = 26.31 years, SD = 4.96) hadusable data for our analyses of the TD task; 46 were excludeddue to computer or operator errors in MRI data collection; 2 wereexcluded for excessive movement during MRI; 4 were missing datafrom intelligence or personality measures; 2 were excluded formissing data in the connectivity analysis. Participants wererecruited from the larger community around the twin cities ofMinneapolis and St. Paul, Minnesota, using a regional classifiedadvertisements website (Craigslist). During recruitment, potentialparticipants were excluded for current use of psychotropic medica-tions, including antipsychotics, anticonvulsants, and stimulants, aswell as for history of neurologic or psychiatric disorders or currentdrug or alcohol problems. MRI contraindications (e.g., ferromag-netic implants, pacemakers) were also exclusionary. Participantswere paid $50 dollars per hour for the scanning session, plus anyamount gained in the task, as well as $20 per hour for a separateassessment session in which they completed questionnaires andcognitive tests. The ethical review board at the University ofMinnesota approved the study.

C. Civai et al. / Journal of Research in Personality 61 (2016) 99–108 101
Our target sample size (300) was chosen to enable approxi-mately 80% power for detecting small to medium effects, evenallowing some attrition and exclusion of participants whose MRIdata were unusable (for example, a sample of 269 yields 80%power to detect a correlation of .17). Only about 1/3 of significanteffects reported in psychology are smaller than .2, and this cantherefore be considered a rough boundary between small andmedium effect sizes (Hemphill, 2003). It was not until long afterthe study design was fixed that we encountered the article byMahalingam et al. (2014) reporting in a very large sample thatthe correlation between TD and Extraversion was only about .1.In light of this finding, we were underpowered to detect this effect(power = 35% with N = 250), despite our relatively large samplesize by the standards of neuroimaging research; our investigationof it in this sample must therefore be considered preliminary,but given the difficulty of collecting large MRI samples, we believeit is worth reporting nonetheless.
2.2. Procedure
All participants completed two experimental sessions. The firstsession of behavioral assessments lasted 4.5–5 h and included thepersonality and intelligence assessments used in the present anal-yses as well as other measures unrelated to the questionsaddressed here. Approximately two weeks later, participantsunderwent MRI, during which they lay supine in the scanner forapproximately 1 h and 20 min completing structural and func-tional scans. Experimental tasks were presented using E-prime2.0 software (Psychology Software Tools, Inc.); a Sanyo projectormounted outside of the room projected through a waveguide to ascreen placed in the bore of the scanner behind the subject’s head,which was viewed through a mirror; participants enteredresponses via a 4-button response pad with USB interface (CurrentDesigns, Philadelphia, PA).
2.3. Materials
2.3.1. PersonalityTwo questionnaires were used to assess the Big Five, the Big
Five Inventory (BFI; John, Naumann, & Soto, 2008) and the Big FiveAspect Scales (BFAS; DeYoung, Quilty, & Peterson, 2007). Both wereadministered with 5-point Likert scales. The BFI uses 8–10 items tomeasure each of the Big Five, whereas the BFAS uses 20 items tomeasure each of the Big Five, with 10 items measuring each ofthe two major subfactors within each dimension. Composite scoresfor each of the Big Five were created by averaging each BFI scalewith the two BFAS scales from the same dimension. Analysesinvolving the Big Five include only 249 participants because onewas excluded for improper scale use (using only one responseoption or never using either of the two most extreme responseoptions).
Intelligence was assessed using four subtests of the WechslerAdult Intelligence Scale (Wais-IV): Block Design, Matrix Reasoning,Vocabulary, and Similarities (Wechsler, 2008). These four subtestsprovide a good estimate of total IQ.
2.3.2. Intertemporal choice taskWe applied a novel design, which is a modification of a standard
TD task. Two payment options—always marked by a numericamount x in $US and a temporal delay t in Days, so that an optionmay be completely described by a pair (x, t)—were presentedsequentially, for a total of 54 trials. Each trial featured one optionfor a smaller reward delivered sooner (Early) and one option fora larger reward delivered later (Late); among the Early options,25 were immediate (Immediate-Early). Table 1 shows the combina-tion of amount and delay for each trial, and Fig. 1 shows a sequence
of screen-shots of how options appeared to subjects, as well as thetimeline.
This design allowed for differentiation between value-relatedprocesses that coincide with the direct comparison of two rewards(at second offer) and processes that relate to the subjective value ofa single option in isolation (at first offer), which occur before therelevant information for an explicit comparison has been received.We first computed a numeric subjective value for each option,which was based on the assumption of a hyperbolic utility functionfor time and a fitted logit model as described in further detailbelow. We then considered brain activity related to the subjectivevalue of the first option in each trial, as well as brain activityrelated to the subjective value of the second option on display.Because an explicit comparison of both options can take place onlyonce the second option is known, neural signals when the firstoption is presented are subjective value signals produced beforeopportunity for explicit comparison, and those occurring inresponse to the second option are subjective value signals afteropportunity for comparison.
For part of the sample (N = 155), participants always saw theEarly offer first and the Late offer second (ordered presentation).This procedure resembles previous designs (e.g., Ballard &Knutson, 2009; Kable & Glimcher, 2007), in that the moment ofthe choice occurs exactly at the presentation of the Late offer. Inorder to eliminate this potential confound, we modified theprocedure for another subsample of participants (N = 95), so thatthe presentation order of the two types of offers was randomizedand both the Early and the Late offers were randomly presentedas the first (First) or the second option (Second) (randompresentation). Note that it was always known to the participantwhich type of offer was presented at each moment because theEarly option was always depicted in blue and the Late option in yel-low. As shown in Fig. 1, after the presentation of each offer individ-ually, we presented participants with a third screen in which thetwo offers appeared together; at this point, participants indicatedtheir choice by pressing either the blue or the yellow button onthe response system, corresponding to Early or the Late offer.Having a third response step that is separated from the momentwhen all information has been presented serves as a potential purecontrol phase and aides in eliminating potential confounds ofmotor activation at the moment of the presentation of the secondoffer.
The intertemporal choice task was divided into two runs of 27choices each and lasted on average 15 min. Each offer was pre-sented for 2 s; the duration of the choice screen was self-paced,but was displayed for a maximum of 6 s, after which the words‘‘Choose faster” were displayed. A jitter between 2 and 4 s wasadded between each screen, and between each trial.
2.4. Behavioral analysis
We summarized subjective value with the hyperbolic TDfunction:
Uðx; tÞ ¼ x1þ kt
ð1Þ
where the subjective value of a delayed reward, x, is assumed to berepresented by a utility function U(x, t) of the monetary reward, x,hyperbolically scaled according to its delay t and a subjectiveparameter k. We assumed a soft-max choice rule for each subjectin which the offer (x, t) is chosen noisily over the offer (y, s), when-ever U(x, t) is larger than U(y, s). The noise of the softmax rule isadded to the difference between U(x, t) and U(y, s). In summarythe probability of choosing (x, t) over (y, t) is assumed to be:
pððx; tÞ; ðy; sÞÞ ¼ 1=ð1þ expð�sðUðx; tÞ � Uðy; sÞÞÞ ð2Þ
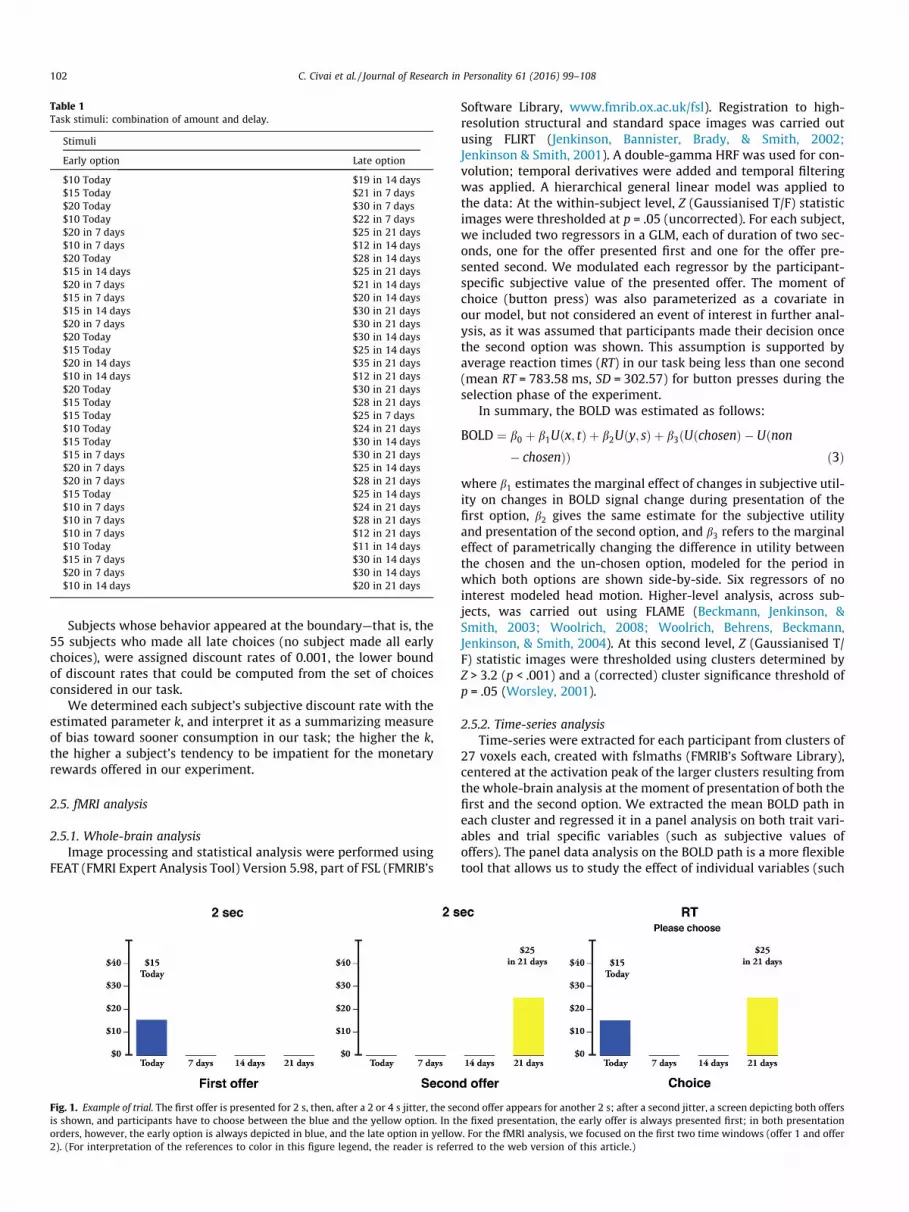
Table 1Task stimuli: combination of amount and delay.
Stimuli
Early option Late option
$10 Today $19 in 14 days$15 Today $21 in 7 days$20 Today $30 in 7 days$10 Today $22 in 7 days$20 in 7 days $25 in 21 days$10 in 7 days $12 in 14 days$20 Today $28 in 14 days$15 in 14 days $25 in 21 days$20 in 7 days $21 in 14 days$15 in 7 days $20 in 14 days$15 in 14 days $30 in 21 days$20 in 7 days $30 in 21 days$20 Today $30 in 14 days$15 Today $25 in 14 days$20 in 14 days $35 in 21 days$10 in 14 days $12 in 21 days$20 Today $30 in 21 days$15 Today $28 in 21 days$15 Today $25 in 7 days$10 Today $24 in 21 days$15 Today $30 in 14 days$15 in 7 days $30 in 21 days$20 in 7 days $25 in 14 days$20 in 7 days $28 in 21 days$15 Today $25 in 14 days$10 in 7 days $24 in 21 days$10 in 7 days $28 in 21 days$10 in 7 days $12 in 21 days$10 Today $11 in 14 days$15 in 7 days $30 in 14 days$20 in 7 days $30 in 14 days$10 in 14 days $20 in 21 days
102 C. Civai et al. / Journal of Research in Personality 61 (2016) 99–108
Subjects whose behavior appeared at the boundary—that is, the55 subjects who made all late choices (no subject made all earlychoices), were assigned discount rates of 0.001, the lower boundof discount rates that could be computed from the set of choicesconsidered in our task.
We determined each subject’s subjective discount rate with theestimated parameter k, and interpret it as a summarizing measureof bias toward sooner consumption in our task; the higher the k,the higher a subject’s tendency to be impatient for the monetaryrewards offered in our experiment.
2.5. fMRI analysis
2.5.1. Whole-brain analysisImage processing and statistical analysis were performed using
FEAT (FMRI Expert Analysis Tool) Version 5.98, part of FSL (FMRIB’s
Fig. 1. Example of trial. The first offer is presented for 2 s, then, after a 2 or 4 s jitter, the seis shown, and participants have to choose between the blue and the yellow option. In thorders, however, the early option is always depicted in blue, and the late option in yellow2). (For interpretation of the references to color in this figure legend, the reader is refer
Software Library, www.fmrib.ox.ac.uk/fsl). Registration to high-resolution structural and standard space images was carried outusing FLIRT (Jenkinson, Bannister, Brady, & Smith, 2002;Jenkinson & Smith, 2001). A double-gamma HRF was used for con-volution; temporal derivatives were added and temporal filteringwas applied. A hierarchical general linear model was applied tothe data: At the within-subject level, Z (Gaussianised T/F) statisticimages were thresholded at p = .05 (uncorrected). For each subject,we included two regressors in a GLM, each of duration of two sec-onds, one for the offer presented first and one for the offer pre-sented second. We modulated each regressor by the participant-specific subjective value of the presented offer. The moment ofchoice (button press) was also parameterized as a covariate inour model, but not considered an event of interest in further anal-ysis, as it was assumed that participants made their decision oncethe second option was shown. This assumption is supported byaverage reaction times (RT) in our task being less than one second(mean RT = 783.58 ms, SD = 302.57) for button presses during theselection phase of the experiment.
In summary, the BOLD was estimated as follows:
BOLD ¼ b0 þ b1Uðx; tÞ þ b2Uðy; sÞ þ b3ðUðchosenÞ � Uðnon� chosenÞÞ ð3Þ
where b1 estimates the marginal effect of changes in subjective util-ity on changes in BOLD signal change during presentation of thefirst option, b2 gives the same estimate for the subjective utilityand presentation of the second option, and b3 refers to the marginaleffect of parametrically changing the difference in utility betweenthe chosen and the un-chosen option, modeled for the period inwhich both options are shown side-by-side. Six regressors of nointerest modeled head motion. Higher-level analysis, across sub-jects, was carried out using FLAME (Beckmann, Jenkinson, &Smith, 2003; Woolrich, 2008; Woolrich, Behrens, Beckmann,Jenkinson, & Smith, 2004). At this second level, Z (Gaussianised T/F) statistic images were thresholded using clusters determined byZ > 3.2 (p < .001) and a (corrected) cluster significance threshold ofp = .05 (Worsley, 2001).
2.5.2. Time-series analysisTime-series were extracted for each participant from clusters of
27 voxels each, created with fslmaths (FMRIB’s Software Library),centered at the activation peak of the larger clusters resulting fromthe whole-brain analysis at the moment of presentation of both thefirst and the second option. We extracted the mean BOLD path ineach cluster and regressed it in a panel analysis on both trait vari-ables and trial specific variables (such as subjective values ofoffers). The panel data analysis on the BOLD path is a more flexibletool that allows us to study the effect of individual variables (such
cond offer appears for another 2 s; after a second jitter, a screen depicting both offerse fixed presentation, the early offer is always presented first; in both presentation. For the fMRI analysis, we focused on the first two time windows (offer 1 and offerred to the web version of this article.)

C. Civai et al. / Journal of Research in Personality 61 (2016) 99–108 103
as IQ) and their interactions (such as that between IQ and subjec-tive value).
2.5.3. Functional connectivityIn order to run the beta-series connectivity analysis, a new
model was run in AFNI2 (Cox, 1996), in which a single-trial beta(two beta coefficients for each trial, one corresponding to the firstand one to the second offer) was computed in a whole-brain analy-sis. Each offer (first and second) was considered an event of interest,so that 108 parameters functioned as separate regressors in an initialGLM that included also one regressor to model the average responseto the choice screen, and 6 regressors of no interest to model headmotion. Subjective value was not used to modulate the offers in thisanalysis. The resulting 108 parameter estimates were collected as asingle series of beta-values for each subject, which then provided thebasis for a functional connectivity analysis as described in Rissman,Gazzaley, and D’Esposito (2004). The assumption of this method isthat the regions whose beta-series are correlated during a certainevent of interest (for example, the second offer) are considered tobe functionally interacting for that event (see Rissman et al., 2004,p. 755 for the test of the validity of the assumption).
The anatomically defined VMPFC was used as the seed regionfor our functional connectivity analysis. This area was chosenbecause the whole-brain analysis revealed its significant activationat the display of the second offer, confirming its well-known role inrepresenting decision-values (Levy & Glimcher, 2012), and becauseits volume has been shown repeatedly to be associated withExtraversion.
We proceeded to consider individual differences in strength ofconnectivity. For each subject we computed separately the beta-series estimates only for the regions functionally connected tothe VMPFC at the group-level, and we performed a correlationbetween VMPFC beta-series and the extracted beta-series fromthese regions. The parameter of correlation (Pearson’s r, Fisher-transformed) measures the subject-specific strength of correlation,or strength of functional connectivity, between VMPFC and eacharea.
3 In-depth analysis and interpretation of the sequential choice paradigm, focusingon general decision-making processes rather than individual differences, will bereported as a separate study, as the scope of the current report is to discuss therelation of personality to the neural underpinnings of TD.
4
3. Results
3.1. Behavioral results
Our design allows identification of a hyperbolic discount factor(k in Eq. (1)) larger than kmin = 0.0071. 55 of our subjects chose theoption with a late payment in all trials, so they have a k value smal-ler than kmin. Note that the variability on the estimated subjectivevalue for subjects with k in the interval is for any option less than13 percent, with an average of 6 percent. The estimated discountvalues (k) provide a good summary of preferences and predictbehavior reasonably well in our task; for example, the R2 of theregression of the fraction of choice of late options on the estimateddiscount factor is .76. The respective distributions for k did not dif-fer between groups that saw a random (early and late offers ran-domly presented as the first or the second option in thesequence) versus ordered (early and late offers always presentedas first and second options in the sequence, respectively) presenta-tion of rewards (ordered: M = �1.72, SD = 0.96; random:M = �1.84, SD = 0.68; t(248) = �1.198, p = .232).
Extraversion and IQ were correlated with the log of k in a man-ner consistent with past results (E: Spearman’s rho = .11, p = .092;IQ: rho = �.32, p < .001). (Nonparametric correlations were usedbecause k values were not normally distributed even after log
2 The change in software was due to relative convenience of the process for dealingwith beta-series for the functional connectivity analysis in AFNI as compared to FSL.
transformation, due to the 55 participants who always chose thelate option.) Note that although the association with Extraversiondid not reach significance at p < .05, it was almost exactly the samemagnitude as reported in a very large sample by Mahalingam et al.(2014). Correlations with the other Big Five traits were weaker;N = .04, C = .06, O = �.08, A: �.07. Given that our neural hypothesesinvolved only Extraversion and IQ, we did not analyze the other BigFive traits in further analyses.
3.2. fMRI results
3.2.1. Whole-brain analysisWe identified neural correlates of subjective value U(x, t) (see
Section 2) for each offer being presented. Fig. 2A and Table 2 showthat activation during the presentation of the first offer was pro-portional to the estimated subjective value of the first offer withina large cluster extending from right middle to right inferior frontalgyrus (right DLPFC extending to ventrolateral PFC), a smaller clus-ter in the left middle frontal gyrus (left DLPFC), clusters in the mid-paracingulate gyrus, bilateral anterior insula (AI) and bilateralstriatum (caudate). Fig. 2B and Table 3 show that positive correla-tions with subjective value of the second offer, during its presenta-tion, were present in the VMPFC, dACC, posterior cingulate (PCC),bilateral striatum, and bilateral anterior middle frontal gyrus(DLPFC).
We found significant differences in modulated brain activity,depending on whether an offer was shown first (isolated evalua-tion phase) or second (integration phase). The contrast of paramet-rically modulated activation responses revealed a significantlymore pronounced response to subjective value for VMPFC andparts of the caudate during integration (Fig. 2C and Table 4a).The reverse contrast showed greater activation within a smallregion of the left superior parietal lobe during isolated evaluation,suggesting greater importance of this region for choice preparationpre-integration, before the alternative choice object becomes avail-able (Fig. 2D and Table 4b).
No differences in activation were found for ordered versus ran-dom presentation, suggesting that our results are related to thesequential presentation of the options, and not to whether a sooneror a later option is shown first. This result is mentioned in partic-ular because subjects knew whether an offer was early or late for agiven choice in our design, so that first options in the random pre-sentation order should not have been treated by default as early.3
3.2.2. Functional connectivityContrasts of parameters from the Rissman method (see Sec-
tion 2) of functional connectivity with VMPFC as a seed showedsignificantly greater functional connectivity during presentationof the second offer for multiple connected brain regions. After cor-rection for spatial correlation using a Monte Carlo simulation-based estimator4 (AFNI 3dClustSim (Forman et al., 1995; Ward,2000)), clusters showing stronger functional connectivity to VMPFCduring the presentation of the second offer (contrasted with thefirst) corresponded anatomically to the left middle frontal gyrus(DLPFC) (BA 46 and BA 6), left insula, right parietal lobe (peakingat the superior parietal lobule (SPL)), left inferior parietal lobule,and mid-cingulate gyrus (mACC) (Fig. 3, Table 5). No region was
A family-wise error (FWE) correction at p < .05 was achieved with a cluster-defining threshold of two-tailed p < .0007 and a cluster size of at least 83 voxels. Thesmall p-value was chosen in light of the high power of the study (Woo, Krishnan, &Wager, 2014).

Fig. 2. Activations from whole-brain analysis. Areas that increase their activation with the subjective value of (A) offer 1 and of (B) offer 2, at the moment of presentation of thestimuli. The lower part of the figure shows the areas that increase their activation more for the subjective value of offer 2 compared to offer 1 (C) and vice versa (D).
Table 2Areas whose activation survived FSL cluster correction (z = 3.2, p < 0.001) at themoment of the presentation of the first offer. The coordinates are anatomical MNI,and the areas have been identified with FSL Harvard–Oxford atlas.
First offer (SV modulated)
Local maxima Voxels P Z-MAX x y z
13477 0.0001R Occipital Pole 7.17 16 �96 10L Occipital Pole 6.4 �8 �100 12L Lingual Gyrus 6.01 �16 �66 �2L Intracalcarine cortex 5.96 �10 �76 6R Precuneus 5.95 18 �68 42
7969 0.0001R Ant Insula/OFC 7.11 34 22 �8Paracingulate Gyrus 6.58 8 30 42R Inferior Frontal Gyrus 6.19 52 20 26R Middle Frontal Gyrus 6.18 30 8 56R Middle Frontal Gyrus 6.06 54 30 24Paracingulate/ACC 5.11 �4 34 30
619 0.00564L Ant Insula 6.81 �32 18 �6
573 0.00765L Inferior Frontal Gyrus 4.26 �46 20 18L Middle Front Gyrus 4.18 �48 20 30L Middle Front Gyrus 3.51 �48 10 34
422 0.0221R Caudate 5.55 12 12 4
104 C. Civai et al. / Journal of Research in Personality 61 (2016) 99–108
identified as more functionally connected to VMPFC during presen-tation of the first offer with respect to the second.
3.3. Correlations with personality of neural activity and connectivity
3.3.1. Neural activity (time-series analysis)We analyzed the correlation of IQ and Extraversion with activa-
tion corresponding to the evaluation of the subjective value of thetwo offers in a set of 8 anatomical regions. From each region weselected a smaller cluster of 27 voxels in a cube of 9 mm per side,centered at the peak activation in that region.
IQ was significantly correlated with neural response to the sub-jective values of offers in the bilateral caudate. In particular wefound that the response to the subjective value of the first offer(SVO1) could be decomposed into a positive coefficient for subjec-tive value (standardized coefficient b = .02, p < .001), a negativecoefficient for IQ (b = �.36, p = .001) and a negative interactionwith SVO1 (b = �.011, p = .013; the ratio between the coefficientsof interaction and IQ is 0.03). All coefficients, except that for theinteraction between SVO1 and IQ, are significantly different fromzero at the 5 percent level after correction for multiple compar-isons. Similar responses, but weaker, are found in the VMPFC(b = .01, p < .001 for SVO1, b = �.16, p .09 for IQ, b = �.007,p = .066 for interaction between IQ and SVO1). Extraversion didnot predict activation in any cluster.

Table 3Areas whose activation survived FSL cluster correction (z = 3.2, p < 0.001) at themoment of the presentation of the second offer. The coordinates are anatomical MNI,and the areas have been identified with FSL Harvard–Oxford atlas.
Second offer (SV modulated)
Local maxima Voxels P Z-MAX x y z
10105 0.0001L Caudate 5.93 �8 6 �6L Thalamus 5.38 0 �6 8R Caudate 5.3 6 10 �2L Putamen 5.26 �18 8 �4L Caudate 5.18 �16 10 16
3804 0.0001L Occipital Pole 7.49 �10 �104 12R Occipital Pole 7.1 14 �100 10L Cerebellum 4.79 �34 �80 �28
1492 0.0001L Superior Frontal Gyrus 5.61 �22 34 40L Middle Frontal Gyrus 5.48 �30 20 50L Superior Frontal Gyrus 5.22 �22 30 50L Middle Frontal Gyrus 3.92 �44 20 40
1213 0.0002L Inferior Temporal Gyrus 5.35 �58 �50 �12L Middle Temporal Gyrus 4.76 �62 �40 �10L Middle Temporal Gyrus 4.29 �66 �28 �16
1069 0.0003L Lateral Occipital Cortex 6.26 �40 �74 38L Angular Gyrus 4.25 �56 �58 30
591 0.005Cingulate Gyrus, posterior 4.5 �2 �36 34
527 0.009R Frontal Orbital Cortex 4.66 52 30 �16R Frontal Pole 4.5 28 36 �18R Frontal Orbital Cortex 3.76 42 32 �18R Inferior Frontal Gyrus 3.55 54 32 �6
508 0.01R Lateral Occipital Cortex 4.56 48 �66 40R Angular Gyrus 4.25 56 �54 38
508 0.01R Middle Temporal Gyrus 4.66 62 �36 �10R Middle Temporal Gyrus 4.06 64 �18 �14
Table 4Areas whose activation survived FSL cluster correction (z = 3.2, p < 0.001) for contrasts(a) (Second offer – First offer) and (b) (First offer – Second offer). The coordinates areanatomical MNI, and the areas have been identified with FSL Harvard–Oxford atlas.
Local maxima Voxels P Z-MAX x y z
(a) Second offer – first offer1527 <0.0001
L Caudate 5.2 �18 8 18L Caudate 5.16 �20 �4 22L Frontal Pole 4.72 �20 �36 �8L Frontal Medial Cortex 4.1 �16 32 �20L Putamen 3.6 �22 �2 12
885 0.0001R Caudate 5.38 20 2 22R Caudate 4.86 20 22 12R Caudate 4.54 18 28 �6
465 0.01R Occipital Gyrus 4.49 6 �84 �24R Occipital Gyrus 4.36 10 �92 �18L Lingual Gyrus 4.02 �8 �88 �24
(b) First offer – second offer6791 <0.0001
R Intracalcarine Cortex 6.31 14 �72 16R Intracalcarine Cortex 5.84 20 �70 10R Cuneal Cortex 5.75 18 �76 36L Lingual Gyrus 5.67 �18 �68 �2L Intracalcarine Cortex 5.58 �14 �70 12
583 0.005R Occipital Gyrus 4.57 �46 �20 48R Occipital Gyrus 4.26 �32 �32 48L Lingual Gyrus 3.87 �44 �42 �44
C. Civai et al. / Journal of Research in Personality 61 (2016) 99–108 105
3.3.2. Functional connectivityFive regions were identified by significant functional connectiv-
ity to VMPFC at the presentation of the second offer; thus, weexamined the strength of correlations of the five connectivity vari-ables characterizing the strength of these functional connectionswith Extraversion and IQ. Three of the five regions showed correla-tions with Extraversion in the range of .10–.15 (with p-values rang-ing from .035 to .059). Correlations with IQ were weaker, with onlyone approaching significance (r = �.11, p = .071). Because the fiveconnectivity variables were highly intercorrelated, we performeda principal components analysis, which was justified in view ofthe large squared multiple correlation of the variables (rangingfrom .68 to .84; Kaiser–Meyer–Olkin measure of sampling ade-quacy: 0.74). The eigenvalues clearly indicated a single general fac-tor (eigenvalues = 3.53, 0.89, 0.30, 0.18, 0.08), which explained70.6% of the variance, with loadings ranging from .77 to .90. We,therefore, created a composite index of VMPFC connectivity byaveraging across the 5 regions, and this score was positively corre-lated with Extraversion, r = .13, p = .039. The correlation with IQwas �.07, p = .229.
4. Discussion
Intelligence and Extraversion are known to predict TD, and thisstudy tested the hypothesis that these two traits would be linkedto the neural underpinnings of intertemporal choice, based on
parallels between what is known about the neural correlates ofTD and the neural correlates of IQ and Extraversion. In our analysisof behavior, we found an association of higher intelligence withgreater patience (reduced TD), confirming well-established find-ings (Burks, Carpenter, Goette, & Rustichini, 2009; Shamosh &Gray, 2008). We additionally found a positive correlation betweengreater Extraversion and impatience (increased TD) of the samemagnitude reported in a sample of 5888 (Mahalingam et al.,2014), although it did not quite reach significance given our sam-ple size. Despite being underpowered to study this Extraversioneffect, we decided to examine its neural correlates to provide atleast a preliminary evaluation of that component of ourhypothesis.
We focused on subjective value as our behaviorally elicitedindex of TD and showed that subjective value signals were presentin the brain for each option as these were shown to participants.Signals corresponding to subjective value were stronger in VMPFCwhen comparison between options occurred, and were substan-tially weaker in our analysis during presentation of the first optionbefore such explicit comparison could take place. This result sug-gests that the process of explicit comparison contributes distinctlyto the unified subjective value signals that guide decision inVMPFC, when (as in our design) evaluation and comparison canbe separately identified. This does not rule out, however, that suchvalue signals may also be present in the absence of explicitcomparison.
Subjective value signals in the ventral striatum were similarlypresent during presentation of both the first and second option(differently from VMPFC, where activation was significantly stron-ger during presentation of the second option). This is consistentwith the literature concerning the ventral striatum’s associationwith anticipatory reward responses in proportion to their expectedmagnitude (Knutson & Peterson, 2005) and with subjective valuein general (Kable & Glimcher, 2007). Intelligence was negativelyassociated with modulated activation of the bilateral caudate, afinding that is consistent with previous results linking intelligence

Fig. 3. Activations from functional connectivity analysis. Areas whose functional connectivity with VMPFC is higher at the presentation of the second offer compared to the firstoffer.
Table 5Areas whose activation survived 3dClustSim estimation for the connectivity withVMPFC at the moment of the presentation of the second offer (FWE = 0.05, p(uncorrected) = 0.0007). The coordinates are MNI, and the anatomical regions havebeen identified with AFNI atlas.
Connectivity (anatomical VMPFC seed)
Peak Voxels x y z
R Superior Parietal Lobule 3508 19 �69 55L Insula 399 �37 �16 �1L Inferior Parietal Lobule 291 �40 �41 41Cingulate Gyrus, Anterior Dorsal 240 9 12 37L Middle Frontal Gyrus (BA 46) 169 �33 40 13L Middle Frontal Gyrus (BA 6) 107 �26 �2 55
106 C. Civai et al. / Journal of Research in Personality 61 (2016) 99–108
to neural response to rewards in the caudate (Hawes et al., 2014)and to the volume of this subcortical structure (Graziopleneet al., 2015). Our results are consistent with the idea that intelli-gence contributes to modulation of prediction error signals in thecaudate, and that these modulatory effects impact value represen-tation during decision, perhaps by assisting adaptive representa-tion of reward values in context versus in isolation (i.e.representation of the relevant properties of the environment)(Rustichini, 2015). Assuming such an adaptation mechanism con-tributes indiscriminately to reward representation during evalua-tion of delayed rewards and probabilistic rewards, thisexplanation may extend to observed correlations of IQ with impul-sivity and risk aversion also (Burks et al., 2009; Rustichini, 2009).
The analysis of functional connectivity revealed a network ofregions functionally connected to the VMPFC during the offer com-parison phase; the network encompassed regions of the left DLPFC,left insula, ACC, and bilateral parietal lobule. The identified regionin the DLPFC encompasses areas that have been considered func-tionally critical to self-control (see Hare et al., 2009, although thepeak of our activation is a bit more anterior), and the fact thatthe connectivity between VMPFC and left DLPFC was strongerwhen participants were presented with the second option relativeto the first suggests that the involvement of DLPFC for intertempo-ral choice behavior was specific to the comparison of rewards. Thisresult is consistent with previous findings identifying the func-tional circuit encompassing VMPFC and DLPFC as crucial for thelast stage of the decision-making process (Figner et al., 2010;Hare, Malmaud, & Rangel, 2011; Hare et al., 2009, 2014). The acti-vations of insula, ACC and inferior parietal lobe have also been
found associated with evaluation of rewarding stimuli (Paulus &Frank, 2003), and their connectivity with VMPFC during the com-parison phase presumably represents their contribution to thevalue computation.
We found that Extraversion positively predicted the strength ofthis functional network, consistent with previous findings linkingExtraversion to anatomical variation in VMPFC (Cremers et al.,2011; DeYoung et al., 2010; Grodin & White, 2015; Omura et al.,2005) and theories of Extraversion that link it to sensitivity toreward (e.g., Depue & Collins, 1999; DeYoung, 2015). Nonetheless,this association was weak, and our study was not well powered todetect it. Future research on this effect should use a larger sample.
5. Conclusions
The results reported in this paper identify relations betweenbehavior in delay-discounting choices, neural substrates of rewardevaluation, and individual differences in personality, and they sug-gest avenues for their further investigation. They suggest thatunderstanding caudate function will be particularly important forunderstanding the association of intelligence with TD. They alsosuggest that the association between Extraversion and TD is linkedto the role that a network centered on VMPFC plays in evaluatingrewards. More broadly, these results are relevant for psychologicaltheory, as they move us toward an integrated understanding of theneural basis of individual differences: personality theory offers atheoretical frame in which individual differences in decision-making can be interpreted, while decision theory offers formalmodels of the outcome (the choice) of a process that is not explicitlymodeled in personality psychology. The integration of these theo-ries may lead to an understanding of the fundamental linksbetween personality traits and economic preferences, therebyallowing, for example, a better prediction of economic and personalsuccess (Rustichini, DeYoung, Anderson, & Burks, 2012). The inclu-sion of neuroscientific data is crucial in order to understand themechanisms underlying the overt choice, such as reward process-ing and choice evaluation, known to be correlatedwith specific per-sonality profiles. Our findings support the importance of rewardand prediction-error signals for coordinating the representation ofvalue, in particular during direct comparison of rewards, whileadditionally illustrating the relevance of individual differences tounderstanding variation in this functional mechanism.

C. Civai et al. / Journal of Research in Personality 61 (2016) 99–108 107
Acknowledgments
This study was supported by a grant to Colin DeYoung from theNational Institute on Drug Abuse (NIDA; R03 DA029177-01A1) andto Colin DeYoung and Aldo Rustichini from the National ScienceFoundation (SES-1061817). We thank Matt Paffel and RachaelGrazioplene for their help with subject recruitment and datacollection.
References
Ballard, K., & Knutson, B. (2009). Dissociable neural representations of futurereward magnitude and delay during temporal discounting. Neuroimage, 45(1),143–150.
Beckmann, C. F., Jenkinson, M., & Smith, S. M. (2003). General multilevel linearmodeling for group analysis in FMRI. Neuroimage, 20(2), 1052–1063.
Bjørnebekk, A., Fjell, A. M., Walhovd, K. B., Grydeland, H., Torgersen, S., & Westlye, L.T. (2013). Neuronal correlates of the five factor model (FFM) of humanpersonality: Multimodal imaging in a large healthy sample. NeuroImage, 65,194–208.
Burks, S. V., Carpenter, J. P., Goette, L., & Rustichini, A. (2009). Cognitive skills affecteconomic preferences, strategic behavior, and job attachment. Proceedings of theNational Academy of Sciences, 106(19), 7745–7750.
Chen, C. (2014). Intelligence moderates reinforcement learning: A mini-review ofthe neural evidence. Journal of Neurophysiology. jn-00600.
Choi, Y. Y., Shamosh, N. A., Cho, S. H., DeYoung, C. G., Lee, M. J., Lee, J. M., ... Lee, K. H.(2008). Multiple bases of human intelligence revealed by cortical thickness andneural activation. The Journal of Neuroscience, 28(41), 10323–10329.
Cox, R. W. (1996). AFNI: Software for analysis and visualization of functionalmagnetic resonance neuroimages. Computers and Biomedical Research, 29,162–173.
Cremers, H., van Tol, M. J., Roelofs, K., Aleman, A., Zitman, F. G., van Buchem, M. A., ...van der Wee, N. J. (2011). Extraversion is linked to volume of the orbitofrontalcortex and amygdala. PLoS ONE, 6(12), e28421.
Deary, I. J., Penke, L., & Johnson, W. (2010). The neuroscience of human intelligencedifferences. Nature Reviews Neuroscience, 11(3), 201–211.
Depue, R. A., & Collins, P. F. (1999). Neurobiology of the structure of personality:Dopamine, facilitation of incentive motivation, and extraversion. Behavioral andBrain Sciences, 22(03), 491–517.
Depue, R. A., & Fu, Y. (2013). On the nature of extraversion: Variation in conditionedcontextual activation of dopamine-facilitated affective, cognitive, and motorprocesses. Frontiers in Human Neuroscience, 7.
DeYoung, C. G. (2013). The neuromodulator of exploration: A unifying theory of therole of dopamine in personality. Frontiers in Human Neuroscience, 7.
DeYoung, C. G. (2015). Cybernetic big five theory. Journal of Research in Personality,56, 33–58.
DeYoung, C. G., Hirsh, J. B., Shane, M. S., Papademetris, X., Rajeevan, N., & Gray, J. R.(2010). Testing predictions from personality neuroscience: Brain structure andthe Big Five. Psychological Science, 21, 820–828.
DeYoung, C. G., Quilty, L. C., & Peterson, J. B. (2007). Between facets and domains: 10aspects of the Big Five. Journal of Personality and Social Psychology, 93, 880–896.
Duckworth, A. L., & Seligman, M. E. P. (2005). Self-discipline outdoes IQ in predictingacademic performance of adolescents. Psychological Science, 16, 939–944.
Duckworth, A. L., Tsukayama, E., & Kirby, T. A. (2013). Is it really self-control?Examining the predictive power of the delay of gratification task. Personalityand Social Psychology Bulletin. 0146167213482589.
Evans, G. W., & Rosenbaum, J. (2008). Self-regulation and the income-achievementgap. Early Childhood Research Quarterly, 23, 504–514.
Figner, B., Knoch, D., Johnson, E. J., Krosch, A. R., Lisanby, S. H., Fehr, E., &Weber, E. U.(2010). Lateral prefrontal cortex and self-control in intertemporal choice.Nature Neuroscience, 13, 538–539.
Forman, S. D., Cohen, J. D., Fitzgerald, M., Eddy, W. F., Mintun, M. A., & Noll, D. C.(1995). Improved assessment of significant activation in functional magneticresonance imaging (fMRI): Use of a cluster-size threshold. Magnetic Resonancein Medicine, 33(5), 636–647.
Frederick, S., Loewenstein, G., & O’donoghue, T. (2002). Time discounting and timepreference: A critical review. Journal of Economic Literature, 351–401.
Gray, J. A., & McNaughton, N. (2000). The neuropsychology of anxiety: An enquiry intothe function of the septo-hippocampal system.New York: Oxford University Press.
Grazioplene, R. G., Ryman, S. G., Gray, J. R., Rustichini, A., Jung, R. E., & DeYoung, C. G.(2015). Subcortical intelligence: Caudate volume predicts IQ in healthy adults.Human Brain Mapping, 36, 1407–1416.
Grodin, E. N., & White, T. L. (2015). The neuroanatomical delineation of agentic andaffiliative extraversion. Cognitive, Affective, & Behavioral Neuroscience, 15(2),321–334.
Hare, T. A., Camerer, C. F., & Rangel, A. (2009). Self-Control in decision-makingInvolves modulation of the vmPFC valuation system. Science, 324, 646–648.
Hare, T. A., Hakimi, S., & Rangel, A. (2014). Activity in dlPFC and its effectiveconnectivity to vmPFC are associated with temporal discounting. Frontiers inNeuroscience, 8.
Hare, T. A., Malmaud, J., & Rangel, A. (2011). Focusing attention on the healthaspects of foods changes value signals in vmPFC and improves dietary choice.Journal of Neuroscience., 31, 11077–11087.
Hawes, D. R., DeYoung, C. G., Gray, J. R., & Rustichini, A. (2014). Intelligencemoderates neural responses to monetary reward and punishment. Journal ofNeurophysiology, 111, 1823–1832.
Hemphill, J. F. (2003). Interpreting the magnitudes of correlation coefficients.American Psychologist, 58(1), 78–79.
Hirsh, J. B., Guindon, A., Morisano, D., & Peterson, J. B. (2010). Positive mood effectson delay discounting. Emotion, 10(5), 717.
Hirsh, J. B., & Inzlicht, M. (2008). The devil you know neuroticism predicts neuralresponse to uncertainty. Psychological Science, 19(10), 962–967.
Hirsh, J. B., Morisano, D., & Peterson, J. B. (2008). Delay discounting: Interactionsbetween personality and cognitive ability. Journal of Research in Personality, 42,1646–1650.
Hu, X., Erb, M., Ackermann, H., Martin, J. A., Grodd, W., & Reiterer, S. M. (2011).Voxel-based morphometry studies of personality: Issue of statistical modelspecification-effect of nuisance covariates. NeuroImage, 54(3), 1994–2005.
Jenkinson, M., Bannister, P., Brady, M., & Smith, S. (2002). Improved optimization forthe robust and accurate linear registration and motion correction of brainimages. Neuroimage, 17(2), 825–841.
Jenkinson, M., & Smith, S. (2001). A global optimisation method for robust affineregistration of brain images. Medical Image Analysis, 5(2), 143–156.
John, O. P., Naumann, L. P., & Soto, C. J. (2008). Paradigm shift to the integrative BigFive trait taxonomy. Handbook of Personality: Theory and Research, 3, 114–158.
Jung, R. E., & Haier, R. J. (2007). The Parieto-Frontal Integration Theory (P-FIT) ofintelligence: Converging neuroimaging evidence. Behavioral and Brain Sciences,30(02), 135–154.
Kable, J. W., & Glimcher, P. W. (2007). The neural correlates of subjective valueduring intertemporal choice. Nature Neuroscience, 10, 1625–1633.
Kable, J. W., & Glimcher, P. W. (2009). The neurobiology of decision: Consensus andcontroversy. Neuron, 63, 733–745.
Kapogiannis, D., Sutin, A., Davatzikos, C., Costa, P., & Resnick, S. (2013). The fivefactors of personality and regional cortical variability in the Baltimorelongitudinal study of aging. Human Brain Mapping, 34(11), 2829–2840.
Knutson, B., & Peterson, R. (2005). Neurally reconstructing expected utility. Gamesand Economic Behavior, 52, 305–315.
Krueger, R. F., Caspi, A., Moffitt, T. E., Silva, P. A., & McGee, R. (1996). Personalitytraits are differentially linked to mental disorders: A multitrait-multidiagnosisstudy of an adolescent birth cohort. Journal of Abnormal Psychology, 105,299–312.
Levy, D. J., & Glimcher, P. W. (2012). The root of all value: A neural commoncurrency for choice. Current Opinion in Neurobiology, 22(6), 1027–1038.
Liu, W.-Y., Weber, B., Reuter, M., Markett, S., Chu, W.-C., & Montag, C. (2013). The bigfive of personality and structural imaging revisited: A VBM-DARTEL study.NeuroReport, 24(7), 375–380.
Mahalingam, V., Stillwell, D., Kosinski, M., Rust, J., & Kogan, A. (2014). Who can waitfor the future? A personality perspective. Social Psychological and PersonalityScience, 5(5), 573–583.
McClure, S. M., Laibson, D. I., Loewenstein, G., & Cohen, J. D. (2004). Separate neuralsystems value immediate and delayed monetary rewards. Science, 306,503–507.
Omura, K., Constable, R. T., & Canli, T. (2005). Amygdala gray matter concentrationis associated with Extraversion and neuroticism. NeuroReport, 16(17),1905–1908.
Ostaszewski, P. (1996). The relation between temperament and rate of temporaldiscounting. European Journal of Personality, 10, 161–172.
Paulus, M. P., & Frank, L. R. (2003). Ventromedial prefrontal cortex activation iscritical for preference judgments. Neuroreport, 14(10), 1311–1315.
Peters, J., & Büchel, C. (2011). The neural mechanisms of inter-temporal decision-making: Understanding variability. Trends in Cognitive Sciences, 15, 227–239.
Rangel, A., & Clithero, J. A. (2013). The computation of stimulus values in simplechoice. Neuroeconomics: Decision Making and the Brain, 2.
Rissman, J., Gazzaley, A., & D’Esposito, M. (2004). Measuring functional connectivityduring distinct stages of a cognitive task. NeuroImage, 23, 752–763.
Rustichini, A. (2009). Neuroeconomics: What have we found, and what should wesearch for. Current Opinion in Neurobiology, 19(6), 672–677.
Rustichini, A. (2015). The role of intelligence in economic decision-making. CurrentOpinion in Behavioral Sciences, 5, 32–36.
Rustichini, A., DeYoung, C. G., Anderson, J. E., & Burks, S. V. (2012). Toward theintegration of personality theory and decision theory in the explanation of economicand health behavior (No. 6750).Chicago: Institute for the Study of Labor (IZA).
Shamosh, N. A., DeYoung, C. G., Green, A. E., Reis, D. L., Johnson, M. R., Conway, A. R.,... Gray, J. R. (2008). Individual differences in delay discounting relation tointelligence, working memory, and anterior prefrontal cortex. PsychologicalScience, 19(9), 904–911.
Shamosh, N. A., & Gray, J. R. (2008). Delay discounting and intelligence: A meta-analysis. Intelligence, 36, 289–305.
Verdejo-García, A., Lawrence, A. J., & Clark, L. (2008). Impulsivity as a vulnerabilitymarker for substance-use disorders: Review of findings from high-risk research,problem gamblers and genetic association studies. Neuroscience & BiobehavioralReviews, 32, 777–810.
Wacker, J., & Smillie, L. D. (2015). Trait extraversion and dopamine function. Socialand Personality Psychology Compass, 9(6), 225–238.

108 C. Civai et al. / Journal of Research in Personality 61 (2016) 99–108
Ward, B. D. (2000). Simultaneous inference for fMRI data. AFNI 3dDeconvolveDocumentation, Medical College of Wisconsin.
Wechsler, D. (2008). Wechsler adult intelligence scale–Fourth Edition (WAIS–IV).SanAntonio, TX: NCS Pearson.
Woo, C. W., Krishnan, A., &Wager, T. D. (2014). Cluster-extent based thresholding infMRI analyses: Pitfalls and recommendations. Neuroimage, 91, 412–419.
Woolrich, M. (2008). Robust group analysis using outlier inference. Neuroimage, 41(2), 286–301.
Woolrich, M. W., Behrens, T. E., Beckmann, C. F., Jenkinson, M., & Smith, S. M. (2004).Multilevel linear modelling for FMRI group analysis using Bayesian inference.Neuroimage, 21(4), 1732–1747.
Worsley, K. J. (2001). Statistical analysis of activation images. Functional MRI: AnIntroduction to Methods, 14, 251–270.
Wu, C. C., Samanez-Larkin, G. R., Katovich, K., & Knutson, B. (2014). Affective traitslink to reliable neural markers of incentive anticipation. NeuroImage, 84,279–289.


