Embed Size (px)
Citation preview
IS
SNa
b
N
a
A
R
R
1
A
P
K
A
D
F
t
M
1
T(ltcml2s
0d
e u r o p e a n j o u r n a l o f p h a r m a c e u t i c a l s c i e n c e s 3 5 ( 2 0 0 8 ) 371–382
avai lab le at www.sc iencedi rec t .com
journa l homepage: www.e lsev ier .com/ locate /e jps
nteraction of mitoxantrone with human serum albumin:pectroscopic and molecular modeling studies
hahper N. Khana, Barira Islama, Ragothaman Yennamalli b, Abdullah Sultana,aidu Subbaraob, Asad U. Khana,∗
Interdisciplinary Biotechnology Unit, Aligarh Muslim University, Aligarh 202002, IndiaCentre for Computational Biology and Bioinformatics, School of Information Technology Jawaharlal Nehru University,ew Delhi 110067, India
r t i c l e i n f o
rticle history:
eceived 3 May 2008
eceived in revised form
9 July 2008
ccepted 22 July 2008
ublished on line 13 August 2008
eywords:
ntitumor
rug binding pocket
luorescence resonance energy
a b s t r a c t
Mitoxantrone (MTX) is a clinically used antitumor anthracycline, which is made available to
the target tissues by transport protein human serum albumin (HSA). Being less toxic unlike
other member of this family, its binding characteristics are therefore of immense interest.
The circular dichroism (CD), fluorescence and Fourier transform infrared (FTIR) spectro-
scopies were employed to elucidate the mode and the mechanism for this interaction. MTX
binding is characterized by one high affinity binding site with the association constants of
the order of 105. Correlation between stability of N-MTX (drug bound N form of HSA) and B-
MTX (drug bound B form of HSA) complexes with drug distribution has been discussed. The
molecular distance, r, between donor (HSA) and acceptor (MTX) was estimated according
to Forster’s theory of non-radiation energy transfer. The features of MTX induced structural
perturbation of human serum albumin (HSA) has been studied in detail by CD and FTIR
ransfer
olecular modeling
analysis. Domain I was assigned to possess high affinity binding site for MTX. Molecular
docking showed that the MTX binds HSA to a non-classical drug binding site. The binding
dynamics was expounded by synchronous fluorescence, thermodynamic parameters and
molecular modeling, which entails that hydrophobic interactions, hydrogen bonding and
electrostatic forces, stabilizes the interaction.
2001). However, these levels can be modified by the pres-
. Introduction
he anthracenedione-based anticancer drug mitoxantroneMTX) (IUPAC name: 5,8-bis[2-(2-hydroxyethylamino)ethy-amino]anthracene-1,4,9,10-tetrol), a synthetic analogue ofhe anthracycline antibiotics (Fig. 1), has shown significantlinical effectiveness in the treatment of a range of humanalignancies, mostly metastatic breast cancer, acute myeloid
eukemia and non-hodgkins lymphoma (Hagemeister et al.,005; Tsavaris et al., 2005). MTX is also used to treat multipleclerosis (Buttinelli et al., 2007). In contrast to other anthracy-
∗ Corresponding author. Tel.: +91 571 2723088; fax: +91 571 2721776.E-mail address: [email protected] (A.U. Khan).
928-0987/$ – see front matter © 2008 Published by Elsevier B.V.oi:10.1016/j.ejps.2008.07.010
© 2008 Published by Elsevier B.V.
clines, MTX lacks amino sugar moiety and also produces fewerside-effects as compared to other anthracyclines (Cornbleet etal., 1984; Neidhart et al., 1984), which bring its wide applicabil-ity. Human serum albumin (HSA) is the principal extracellularprotein as it is responsible for transporting many exoge-nous and endogenous substances, including many drugs witha relative constant level of 3.5–4.5% (w/v) (Quevedo et al.,
ence of different pathologies, which diminish its plasmaconcentrations (Shargel and Yu, 1999). Crystallographic anal-yses revealed that HSA is a single polypeptide chain of 585
372 e u r o p e a n j o u r n a l o f p h a r m a c e u t i c
Fig. 1 – Structure of mitoxantrone, an anthracycline
antibiotic.amino acids with a largely-helical (67%) triple-domain struc-ture that assemble to form a heart-shaped molecule. Othermammalian albumins are highly homologous with humanalbumin, all of which contain 17 disulfide bridges. The pro-tein contains three homologous �-helix domains (I–III) (Carterand Ho, 1994). Each domain contains 10 �-helices and isdivided into six-helix and four-helix subdomains (A and B);the first four helices of A and B form similar antiparallel�-helix bundle (Curry et al., 1998). Serum albumin has twowell-known ligand binding sites, site I and site II. Site I islocated within subdomain II A and is known as azapropa-zone warfarin site (Fehske et al., 1981). On the other hand, siteII, also known as the indole-benzodiazepine site, is locatedwithin subdomain III A (Rahim and Aubry, 1995). Site II ismuch more specific than site I, binding drugs such as ben-zodiazepines. Sites III and IV have a more restricted clinicalrelevancy, being specific for tamoxifen and digitoxin, respec-tively (Ojingwa et al., 1994). The binding of a drug to HSAinfluences its metabolism, distribution, and elimination fromthe circulation. Co-binding of two drugs or displacement ofone drug by another may alter the therapeutic drug leveland can lead to serious health conditions. Thus, detailedknowledge of the binding interaction of a drug on albuminand of their relative strengths is important especially for thedrugs given in combination regimes. Due to the difficulties formeasuring the bound fraction of drugs by means of in vivomethods, some in vitro techniques ones have been developedsuch as ultrafiltration, equilibrium dialysis and gel filtration,but results using these methods can differ significantly. Forexample, studying the binding of fleroxacin by means of equi-librium dialysis showed that 23% of the drug was bound, whilethe same study carried out using the ultrafiltration methodreported it as 47% (Brunt et al., 1990). The molecular interac-tions are often monitored by spectroscopic techniques (Khanet al., 2007; Karnaukhova, 2007) because these methods aresensitive and relatively easy to use. They have advantagesover conventional approaches such as affinity and size exclu-sion chromatography, equilibrium dialysis, ultrafiltration andultracentrifugation, which suffer from lack of sensitivity, longanalysis time or both and use of protein concentrations farin excess of the dissociation constant for the drug–proteincomplex and for drug–protein interaction studies (Ojingwa
et al., 1994; Epps et al., 1998). Also, this is the first report inregards of investigating MTX induced protein structural alter-ation and first to report binding mode and mechanism of thisdrug.a l s c i e n c e s 3 5 ( 2 0 0 8 ) 371–382
2. Materials and methods
2.1. Materials
HSA and hemin (HM) was purchased from Sigma–Aldrich,U.S.A. MTX, warfarin (WRN), diazepam (DZP) was pur-chased from Ranbaxy Pharmaceutical (India) and daunomycin(DM) from Biochemie Pharmaceutical (India). The solutionsHSA were prepared in 10 mM phosphate buffer of pH 7.4.HSA solutions were prepared based on their molecularweights of 66,500. All other materials were of analyticalreagent grade and double distilled water was used through-out.
2.2. Methods
2.2.1. Purification of HSAThe higher molecular weight aggregates associated with com-mercial preparations of HSA were removed by size exclusionchromatography on a G-100 Sephadex column (120 cm × 1 cm)pre-equilibrated with 60 mM phosphate buffer pH 7.4. Frac-tions of 1 ml were collected at a flow rate of 10 ml h−1 and thepurity was ascertained by SDS/PAGE. Protein concentration ofthe HSA fractions was determined spectrophotometrically at398 nm using a value of 5.30 for E1% at 278 nm (Clark et al.,1962).
2.2.2. Preparation of different HSA conformersHSA exits in different Isomeric forms as native (N), basic (B),fast moving (F) and urea induced intermediate (I) (Ahmad etal., 2006). The N, B, F and I conformations were prepared bymixing 20 �l of HSA monomer stock solution (250 �M) with980 �l of pH 7 (60 mM phosphate), pH 9 (10 mM glycine–NaOH),pH 3.5 (10 mM acetate) buffers and 10 M urea was preparedand used as per the required concentration. Different iso-mers in the experimental preparations were confirmedwith various spectroscopic properties of different formsviz., �max of N form = 344(ext.295 nm), 339.3(ext.280 nm);�max of B form = 340(ext.295 nm), 334(ext.280 nm); �max
of F form = 344(ext.295 nm), 334.6(ext.280 nm); �max of Iform = 344(ext.295 nm), 341(ext.280 nm) and fluorescenceintensity of N, B, F and I forms are 101, 96, 115 and 71,respectively, with excitation and emission slits at 5 and10 nm.
2.2.3. Steady state fluorescence spectroscopyFluorescence measurements were made on a Shimadzu spec-trofluorometer, model RF-5301PC (Shimadzu, Japan) equippedwith a 150 W Xenon lamp. The fluorescence quenching of HSAat increasing concentration of MTX was recorded in the wave-length range 290–600 nm after exciting the protein solutionat 280 nm, using 3 nm/3 nm as slit widths. The HSA concen-tration was fixed at 3 �M and the drug concentration wasvaried from 3 to 30 �M. To evaluate the effect of temperature at
HAS–MTX interaction, fluorescence was recorded at three dif-ferent temperatures i.e. 25, 33 and 37 ◦C. The instrument wasthermostatically controlled by a Neslab RTE-110 circulatingwater bath.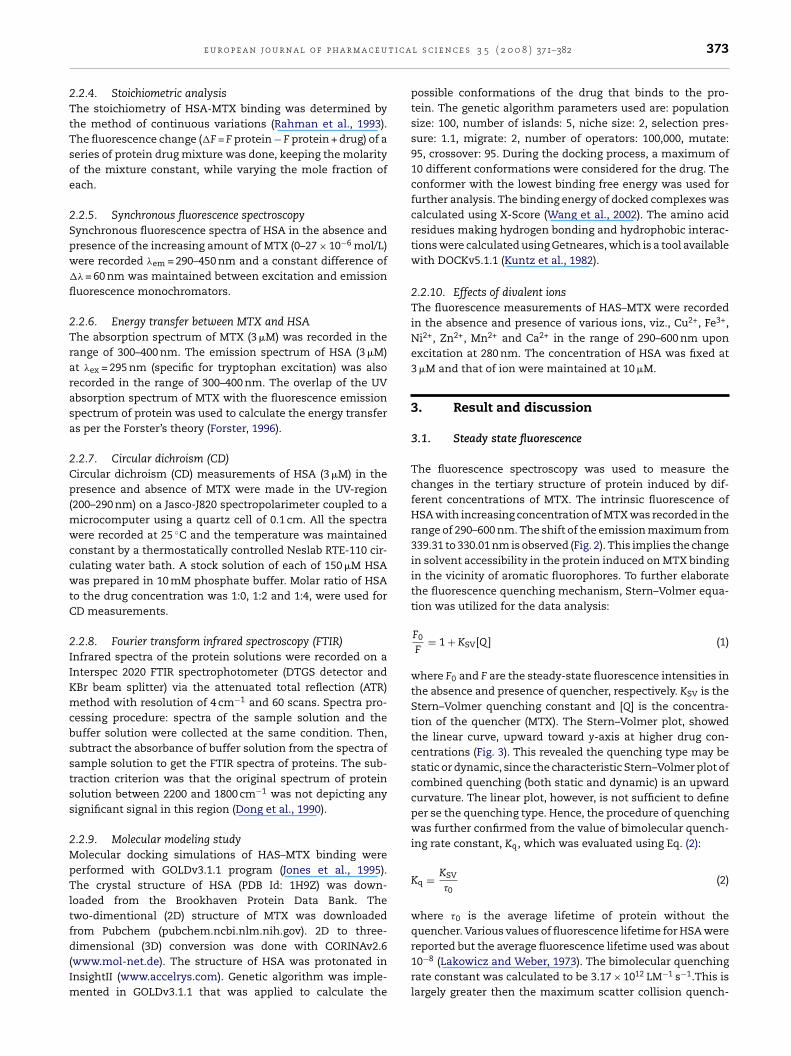
t i c a
2TtTsoe
2Spw�
fl
2Trarasa
2Cp(mwccwtC
2IIKmcbsstss
2MpTltfd(Im
e u r o p e a n j o u r n a l o f p h a r m a c e u
.2.4. Stoichiometric analysishe stoichiometry of HSA-MTX binding was determined by
he method of continuous variations (Rahman et al., 1993).he fluorescence change (�F = F protein − F protein + drug) of aeries of protein drug mixture was done, keeping the molarityf the mixture constant, while varying the mole fraction ofach.
.2.5. Synchronous fluorescence spectroscopyynchronous fluorescence spectra of HSA in the absence andresence of the increasing amount of MTX (0–27 × 10−6 mol/L)ere recorded �em = 290–450 nm and a constant difference of� = 60 nm was maintained between excitation and emissionuorescence monochromators.
.2.6. Energy transfer between MTX and HSAhe absorption spectrum of MTX (3 �M) was recorded in theange of 300–400 nm. The emission spectrum of HSA (3 �M)t �ex = 295 nm (specific for tryptophan excitation) was alsoecorded in the range of 300–400 nm. The overlap of the UVbsorption spectrum of MTX with the fluorescence emissionpectrum of protein was used to calculate the energy transfers per the Forster’s theory (Forster, 1996).
.2.7. Circular dichroism (CD)ircular dichroism (CD) measurements of HSA (3 �M) in theresence and absence of MTX were made in the UV-region
200–290 nm) on a Jasco-J820 spectropolarimeter coupled to aicrocomputer using a quartz cell of 0.1 cm. All the spectraere recorded at 25 ◦C and the temperature was maintained
onstant by a thermostatically controlled Neslab RTE-110 cir-ulating water bath. A stock solution of each of 150 �M HSAas prepared in 10 mM phosphate buffer. Molar ratio of HSA
o the drug concentration was 1:0, 1:2 and 1:4, were used forD measurements.
.2.8. Fourier transform infrared spectroscopy (FTIR)nfrared spectra of the protein solutions were recorded on anterspec 2020 FTIR spectrophotometer (DTGS detector andBr beam splitter) via the attenuated total reflection (ATR)ethod with resolution of 4 cm−1 and 60 scans. Spectra pro-
essing procedure: spectra of the sample solution and theuffer solution were collected at the same condition. Then,ubtract the absorbance of buffer solution from the spectra ofample solution to get the FTIR spectra of proteins. The sub-raction criterion was that the original spectrum of proteinolution between 2200 and 1800 cm−1 was not depicting anyignificant signal in this region (Dong et al., 1990).
.2.9. Molecular modeling studyolecular docking simulations of HAS–MTX binding were
erformed with GOLDv3.1.1 program (Jones et al., 1995).he crystal structure of HSA (PDB Id: 1H9Z) was down-
oaded from the Brookhaven Protein Data Bank. Thewo-dimentional (2D) structure of MTX was downloadedrom Pubchem (pubchem.ncbi.nlm.nih.gov). 2D to three-
imensional (3D) conversion was done with CORINAv2.6www.mol-net.de). The structure of HSA was protonated innsightII (www.accelrys.com). Genetic algorithm was imple-
ented in GOLDv3.1.1 that was applied to calculate the
l s c i e n c e s 3 5 ( 2 0 0 8 ) 371–382 373
possible conformations of the drug that binds to the pro-tein. The genetic algorithm parameters used are: populationsize: 100, number of islands: 5, niche size: 2, selection pres-sure: 1.1, migrate: 2, number of operators: 100,000, mutate:95, crossover: 95. During the docking process, a maximum of10 different conformations were considered for the drug. Theconformer with the lowest binding free energy was used forfurther analysis. The binding energy of docked complexes wascalculated using X-Score (Wang et al., 2002). The amino acidresidues making hydrogen bonding and hydrophobic interac-tions were calculated using Getneares, which is a tool availablewith DOCKv5.1.1 (Kuntz et al., 1982).
2.2.10. Effects of divalent ionsThe fluorescence measurements of HAS–MTX were recordedin the absence and presence of various ions, viz., Cu2+, Fe3+,Ni2+, Zn2+, Mn2+ and Ca2+ in the range of 290–600 nm uponexcitation at 280 nm. The concentration of HSA was fixed at3 �M and that of ion were maintained at 10 �M.
3. Result and discussion
3.1. Steady state fluorescence
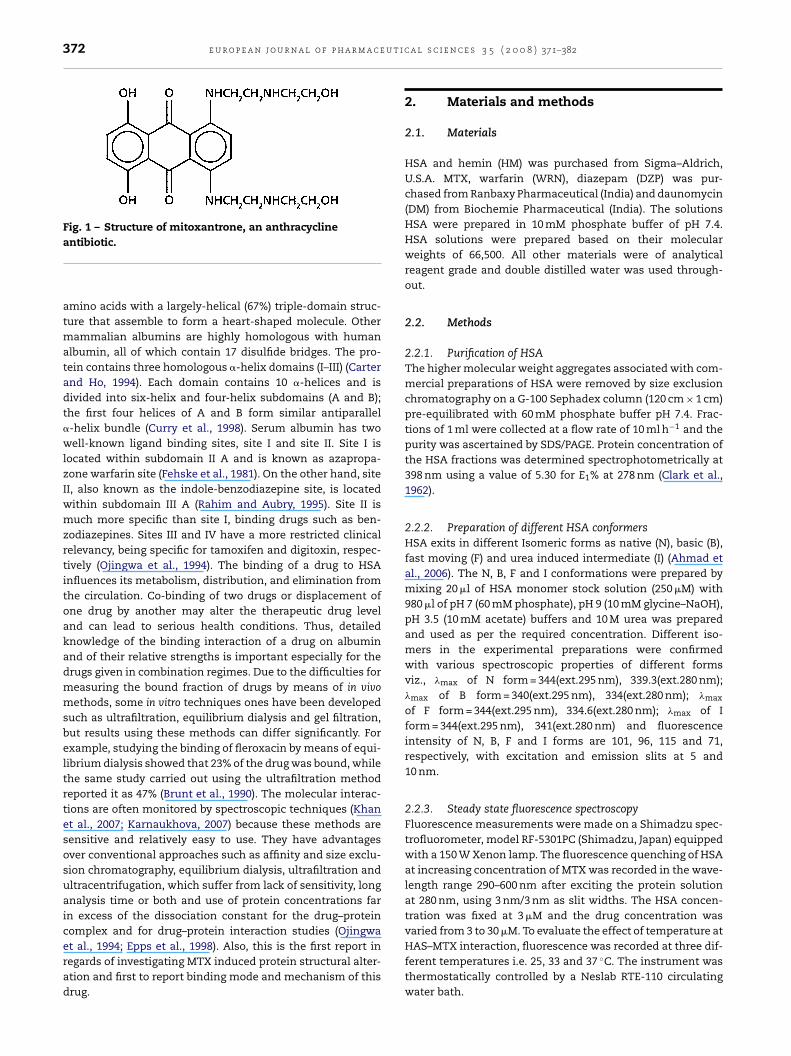
The fluorescence spectroscopy was used to measure thechanges in the tertiary structure of protein induced by dif-ferent concentrations of MTX. The intrinsic fluorescence ofHSA with increasing concentration of MTX was recorded in therange of 290–600 nm. The shift of the emission maximum from339.31 to 330.01 nm is observed (Fig. 2). This implies the changein solvent accessibility in the protein induced on MTX bindingin the vicinity of aromatic fluorophores. To further elaboratethe fluorescence quenching mechanism, Stern–Volmer equa-tion was utilized for the data analysis:
F0
F= 1 + KSV[Q] (1)
where F0 and F are the steady-state fluorescence intensities inthe absence and presence of quencher, respectively. KSV is theStern–Volmer quenching constant and [Q] is the concentra-tion of the quencher (MTX). The Stern–Volmer plot, showedthe linear curve, upward toward y-axis at higher drug con-centrations (Fig. 3). This revealed the quenching type may bestatic or dynamic, since the characteristic Stern–Volmer plot ofcombined quenching (both static and dynamic) is an upwardcurvature. The linear plot, however, is not sufficient to defineper se the quenching type. Hence, the procedure of quenchingwas further confirmed from the value of bimolecular quench-ing rate constant, Kq, which was evaluated using Eq. (2):
Kq = KSV
�0(2)
where �0 is the average lifetime of protein without thequencher. Various values of fluorescence lifetime for HSA were
reported but the average fluorescence lifetime used was about10−8 (Lakowicz and Weber, 1973). The bimolecular quenchingrate constant was calculated to be 3.17 × 10¹² LM−1 s−1.This islargely greater then the maximum scatter collision quench-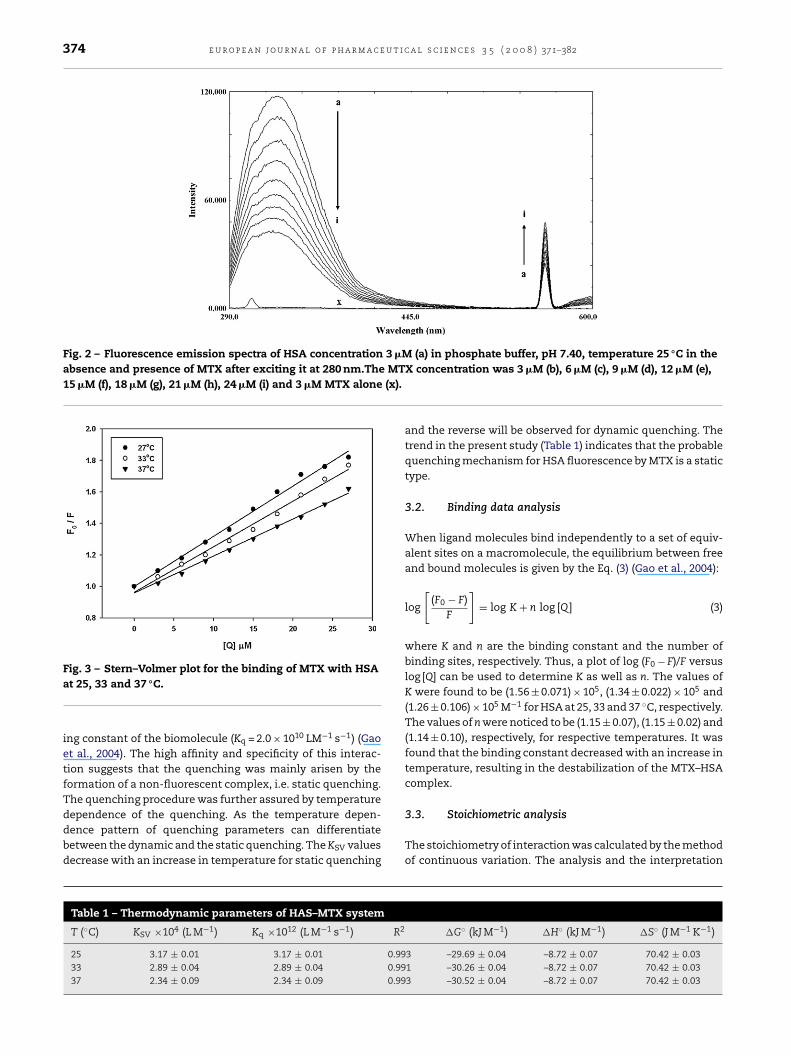
374 e u r o p e a n j o u r n a l o f p h a r m a c e u t i c a l s c i e n c e s 3 5 ( 2 0 0 8 ) 371–382
Fig. 2 – Fluorescence emission spectra of HSA concentration 3 �M (a) in phosphate buffer, pH 7.40, temperature 25 ◦C in theabsence and presence of MTX after exciting it at 280 nm.The MT15 �M (f), 18 �M (g), 21 �M (h), 24 �M (i) and 3 �M MTX alone (x).
Fig. 3 – Stern–Volmer plot for the binding of MTX with HSA
at 25, 33 and 37 ◦C.ing constant of the biomolecule (Kq = 2.0 × 10¹⁰ LM−1 s−1) (Gaoet al., 2004). The high affinity and specificity of this interac-tion suggests that the quenching was mainly arisen by theformation of a non-fluorescent complex, i.e. static quenching.The quenching procedure was further assured by temperature
dependence of the quenching. As the temperature depen-dence pattern of quenching parameters can differentiatebetween the dynamic and the static quenching. The KSV valuesdecrease with an increase in temperature for static quenchingTable 1 – Thermodynamic parameters of HAS–MTX system
T (◦C) KSV ×104 (L M−1) Kq ×1012 (L M−1 s−1) R2
25 3.17 ± 0.01 3.17 ± 0.01 0.9933 2.89 ± 0.04 2.89 ± 0.04 0.9937 2.34 ± 0.09 2.34 ± 0.09 0.99
X concentration was 3 �M (b), 6 �M (c), 9 �M (d), 12 �M (e),
and the reverse will be observed for dynamic quenching. Thetrend in the present study (Table 1) indicates that the probablequenching mechanism for HSA fluorescence by MTX is a statictype.
3.2. Binding data analysis
When ligand molecules bind independently to a set of equiv-alent sites on a macromolecule, the equilibrium between freeand bound molecules is given by the Eq. (3) (Gao et al., 2004):
log
[(F0 − F)
F
]= log K + n log [Q] (3)
where K and n are the binding constant and the number ofbinding sites, respectively. Thus, a plot of log (F0 − F)/F versuslog [Q] can be used to determine K as well as n. The values ofK were found to be (1.56 ± 0.071) × 105, (1.34 ± 0.022) × 105 and(1.26 ± 0.106) × 105 M−1 for HSA at 25, 33 and 37 ◦C, respectively.The values of n were noticed to be (1.15 ± 0.07), (1.15 ± 0.02) and(1.14 ± 0.10), respectively, for respective temperatures. It wasfound that the binding constant decreased with an increase intemperature, resulting in the destabilization of the MTX–HSAcomplex.
3.3. Stoichiometric analysis
The stoichiometry of interaction was calculated by the methodof continuous variation. The analysis and the interpretation
�G◦ (kJ M−1) �H◦ (kJ M−1) �S◦ (J M−1 K−1)
3 –29.69 ± 0.04 –8.72 ± 0.07 70.42 ± 0.031 –30.26 ± 0.04 –8.72 ± 0.07 70.42 ± 0.033 –30.52 ± 0.04 –8.72 ± 0.07 70.42 ± 0.03
e u r o p e a n j o u r n a l o f p h a r m a c e u t i c a l s c i e n c e s 3 5 ( 2 0 0 8 ) 371–382 375
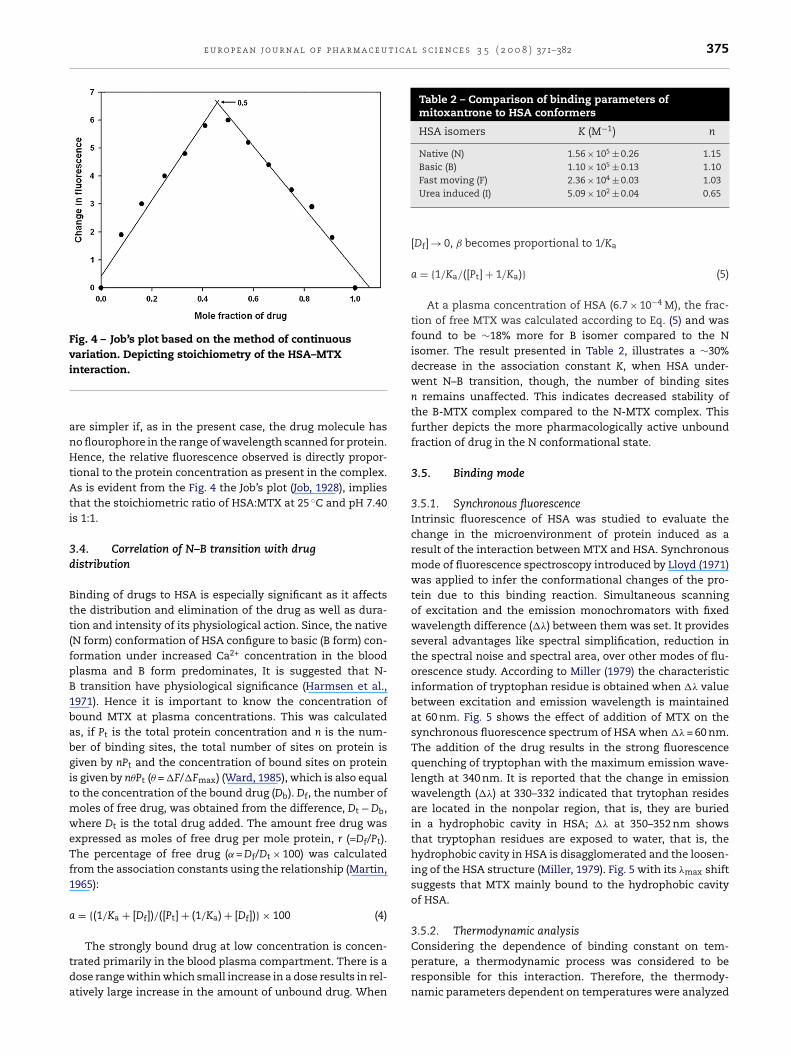
Fig. 4 – Job’s plot based on the method of continuousvariation. Depicting stoichiometry of the HSA–MTXi
anHtAti
3d
Btt(fpB1babgitmweTf1
a
tda
Table 2 – Comparison of binding parameters ofmitoxantrone to HSA conformers
HSA isomers K (M−1) n
Native (N) 1.56 × 10⁵ ± 0.26 1.15Basic (B) 1.10 × 10⁵ ± 0.13 1.10
nteraction.
re simpler if, as in the present case, the drug molecule haso flourophore in the range of wavelength scanned for protein.ence, the relative fluorescence observed is directly propor-
ional to the protein concentration as present in the complex.s is evident from the Fig. 4 the Job’s plot (Job, 1928), implies
hat the stoichiometric ratio of HSA:MTX at 25 ◦C and pH 7.40s 1:1.
.4. Correlation of N–B transition with drugistribution
inding of drugs to HSA is especially significant as it affectshe distribution and elimination of the drug as well as dura-ion and intensity of its physiological action. Since, the nativeN form) conformation of HSA configure to basic (B form) con-ormation under increased Ca2+ concentration in the bloodlasma and B form predominates, It is suggested that N-transition have physiological significance (Harmsen et al.,
971). Hence it is important to know the concentration ofound MTX at plasma concentrations. This was calculateds, if Pt is the total protein concentration and n is the num-er of binding sites, the total number of sites on protein isiven by nPt and the concentration of bound sites on proteins given by n�Pt (� = �F/�Fmax) (Ward, 1985), which is also equalo the concentration of the bound drug (Db). Df, the number of
oles of free drug, was obtained from the difference, Dt − Db,here Dt is the total drug added. The amount free drug was
xpressed as moles of free drug per mole protein, r (=Df/Pt).he percentage of free drug (˛ = Df/Dt × 100) was calculated
rom the association constants using the relationship (Martin,965):
= {(1/Ka + [Df])/([Pt] + (1/Ka) + [Df])} × 100 (4)
The strongly bound drug at low concentration is concen-rated primarily in the blood plasma compartment. There is aose range within which small increase in a dose results in rel-tively large increase in the amount of unbound drug. When
Fast moving (F) 2.36 × 10⁴ ± 0.03 1.03Urea induced (I) 5.09 × 10² ± 0.04 0.65
[Df] → 0, ˇ becomes proportional to 1/Ka
a = {1/Ka/([Pt] + 1/Ka)} (5)
At a plasma concentration of HSA (6.7 × 10⁻⁴ M), the frac-tion of free MTX was calculated according to Eq. (5) and wasfound to be ∼18% more for B isomer compared to the Nisomer. The result presented in Table 2, illustrates a ∼30%decrease in the association constant K, when HSA under-went N–B transition, though, the number of binding sitesn remains unaffected. This indicates decreased stability ofthe B-MTX complex compared to the N-MTX complex. Thisfurther depicts the more pharmacologically active unboundfraction of drug in the N conformational state.
3.5. Binding mode
3.5.1. Synchronous fluorescenceIntrinsic fluorescence of HSA was studied to evaluate thechange in the microenvironment of protein induced as aresult of the interaction between MTX and HSA. Synchronousmode of fluorescence spectroscopy introduced by Lloyd (1971)was applied to infer the conformational changes of the pro-tein due to this binding reaction. Simultaneous scanningof excitation and the emission monochromators with fixedwavelength difference (��) between them was set. It providesseveral advantages like spectral simplification, reduction inthe spectral noise and spectral area, over other modes of flu-orescence study. According to Miller (1979) the characteristicinformation of tryptophan residue is obtained when �� valuebetween excitation and emission wavelength is maintainedat 60 nm. Fig. 5 shows the effect of addition of MTX on thesynchronous fluorescence spectrum of HSA when �� = 60 nm.The addition of the drug results in the strong fluorescencequenching of tryptophan with the maximum emission wave-length at 340 nm. It is reported that the change in emissionwavelength (��) at 330–332 indicated that trytophan residesare located in the nonpolar region, that is, they are buriedin a hydrophobic cavity in HSA; �� at 350–352 nm showsthat tryptophan residues are exposed to water, that is, thehydrophobic cavity in HSA is disagglomerated and the loosen-ing of the HSA structure (Miller, 1979). Fig. 5 with its �max shiftsuggests that MTX mainly bound to the hydrophobic cavityof HSA.
3.5.2. Thermodynamic analysis
Considering the dependence of binding constant on tem-perature, a thermodynamic process was considered to beresponsible for this interaction. Therefore, the thermody-namic parameters dependent on temperatures were analyzed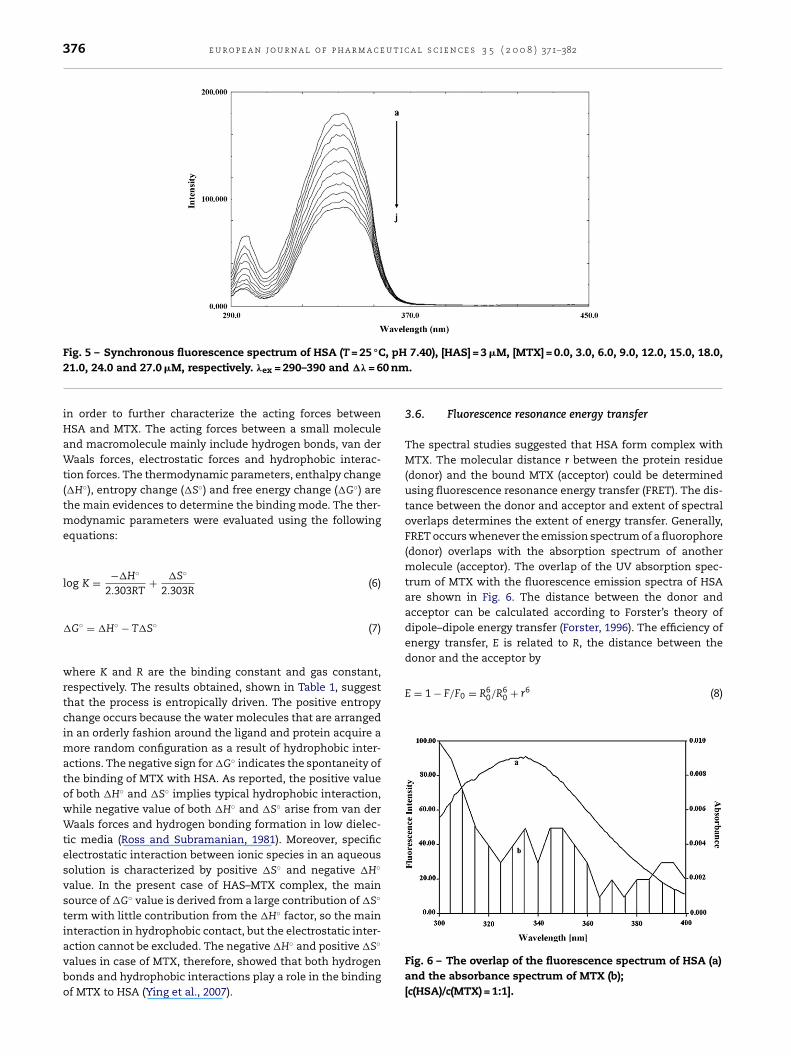
376 e u r o p e a n j o u r n a l o f p h a r m a c e u t i c a l s c i e n c e s 3 5 ( 2 0 0 8 ) 371–382
, pH0 nm
donor and the acceptor by
E = 1 − F/F0 = R60/R6
0 + r6 (8)
Fig. 5 – Synchronous fluorescence spectrum of HSA (T = 25 ◦C21.0, 24.0 and 27.0 �M, respectively. �ex = 290–390 and �� = 6
in order to further characterize the acting forces betweenHSA and MTX. The acting forces between a small moleculeand macromolecule mainly include hydrogen bonds, van derWaals forces, electrostatic forces and hydrophobic interac-tion forces. The thermodynamic parameters, enthalpy change(�H◦), entropy change (�S◦) and free energy change (�G◦) arethe main evidences to determine the binding mode. The ther-modynamic parameters were evaluated using the followingequations:
log K = −�H◦
2.303RT+ �S◦
2.303R(6)
�G◦ = �H◦ − T�S◦ (7)
where K and R are the binding constant and gas constant,respectively. The results obtained, shown in Table 1, suggestthat the process is entropically driven. The positive entropychange occurs because the water molecules that are arrangedin an orderly fashion around the ligand and protein acquire amore random configuration as a result of hydrophobic inter-actions. The negative sign for �G◦ indicates the spontaneity ofthe binding of MTX with HSA. As reported, the positive valueof both �H◦ and �S◦ implies typical hydrophobic interaction,while negative value of both �H◦ and �S◦ arise from van derWaals forces and hydrogen bonding formation in low dielec-tic media (Ross and Subramanian, 1981). Moreover, specificelectrostatic interaction between ionic species in an aqueoussolution is characterized by positive �S◦ and negative �H◦
value. In the present case of HAS–MTX complex, the main
source of �G◦ value is derived from a large contribution of �S◦term with little contribution from the �H◦ factor, so the maininteraction in hydrophobic contact, but the electrostatic inter-action cannot be excluded. The negative �H◦ and positive �S◦
values in case of MTX, therefore, showed that both hydrogenbonds and hydrophobic interactions play a role in the bindingof MTX to HSA (Ying et al., 2007).
7.40), [HAS] = 3 �M, [MTX] = 0.0, 3.0, 6.0, 9.0, 12.0, 15.0, 18.0,.
3.6. Fluorescence resonance energy transfer
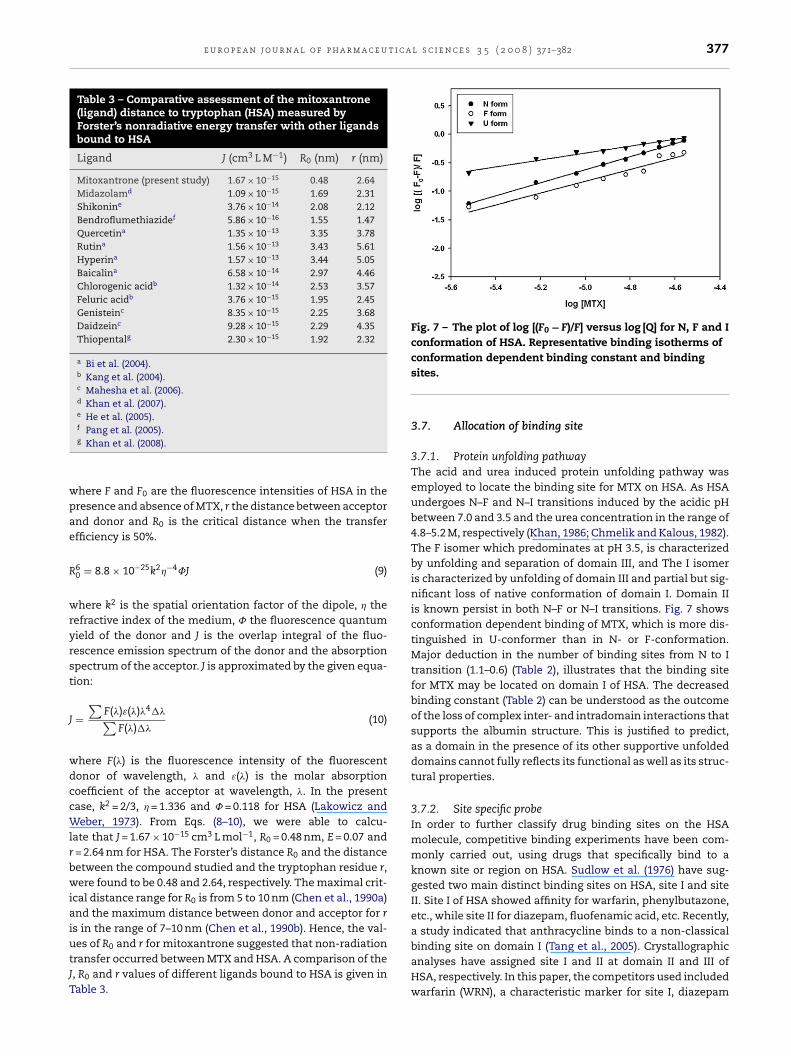
The spectral studies suggested that HSA form complex withMTX. The molecular distance r between the protein residue(donor) and the bound MTX (acceptor) could be determinedusing fluorescence resonance energy transfer (FRET). The dis-tance between the donor and acceptor and extent of spectraloverlaps determines the extent of energy transfer. Generally,FRET occurs whenever the emission spectrum of a fluorophore(donor) overlaps with the absorption spectrum of anothermolecule (acceptor). The overlap of the UV absorption spec-trum of MTX with the fluorescence emission spectra of HSAare shown in Fig. 6. The distance between the donor andacceptor can be calculated according to Forster’s theory ofdipole–dipole energy transfer (Forster, 1996). The efficiency ofenergy transfer, E is related to R, the distance between the
Fig. 6 – The overlap of the fluorescence spectrum of HSA (a)and the absorbance spectrum of MTX (b);[c(HSA)/c(MTX) = 1:1].
e u r o p e a n j o u r n a l o f p h a r m a c e u t i c a l s c i e n c e s 3 5 ( 2 0 0 8 ) 371–382 377
Table 3 – Comparative assessment of the mitoxantrone(ligand) distance to tryptophan (HSA) measured byForster’s nonradiative energy transfer with other ligandsbound to HSA
Ligand J (cm3 L M−1) R0 (nm) r (nm)
Mitoxantrone (present study) 1.67 × 10⁻¹⁵ 0.48 2.64Midazolamd 1.09 × 10⁻¹⁵ 1.69 2.31Shikonine 3.76 × 10⁻¹⁴ 2.08 2.12Bendroflumethiazidef 5.86 × 10⁻¹⁶ 1.55 1.47Quercetina 1.35 × 10⁻¹³ 3.35 3.78Rutina 1.56 × 10⁻¹³ 3.43 5.61Hyperina 1.57 × 10⁻¹³ 3.44 5.05Baicalina 6.58 × 10⁻¹⁴ 2.97 4.46Chlorogenic acidb 1.32 × 10⁻¹⁴ 2.53 3.57Feluric acidb 3.76 × 10⁻¹⁵ 1.95 2.45Genisteinc 8.35 × 10⁻¹⁵ 2.25 3.68Daidzeinc 9.28 × 10⁻¹⁵ 2.29 4.35Thiopentalg 2.30 × 10⁻¹⁵ 1.92 2.32
a Bi et al. (2004).b Kang et al. (2004).c Mahesha et al. (2006).d Khan et al. (2007).e He et al. (2005).
wpae
R
wryrst
J
wdccWlrbwiaiutJT
Fig. 7 – The plot of log [(F0 − F)/F] versus log [Q] for N, F and Iconformation of HSA. Representative binding isotherms of
binding site on domain I (Tang et al., 2005). Crystallographic
f Pang et al. (2005).g Khan et al. (2008).
here F and F0 are the fluorescence intensities of HSA in theresence and absence of MTX, r the distance between acceptornd donor and R0 is the critical distance when the transferfficiency is 50%.
60 = 8.8 × 10⁻²⁵k2�−4˚J (9)
here k2 is the spatial orientation factor of the dipole, � theefractive index of the medium, ˚ the fluorescence quantumield of the donor and J is the overlap integral of the fluo-escence emission spectrum of the donor and the absorptionpectrum of the acceptor. J is approximated by the given equa-ion:
=∑
F(�)ε(�)�4��∑F(�)��
(10)
here F(�) is the fluorescence intensity of the fluorescentonor of wavelength, � and ε(�) is the molar absorptionoefficient of the acceptor at wavelength, �. In the presentase, k2 = 2/3, � = 1.336 and ˚ = 0.118 for HSA (Lakowicz andeber, 1973). From Eqs. (8–10), we were able to calcu-
ate that J = 1.67 × 10⁻¹⁵ cm3 L mol−1, R0 = 0.48 nm, E = 0.07 and= 2.64 nm for HSA. The Forster’s distance R0 and the distanceetween the compound studied and the tryptophan residue r,ere found to be 0.48 and 2.64, respectively. The maximal crit-
cal distance range for R0 is from 5 to 10 nm (Chen et al., 1990a)nd the maximum distance between donor and acceptor for rs in the range of 7–10 nm (Chen et al., 1990b). Hence, the val-es of R0 and r for mitoxantrone suggested that non-radiation
ransfer occurred between MTX and HSA. A comparison of the, R0 and r values of different ligands bound to HSA is given inable 3.conformation dependent binding constant and bindingsites.
3.7. Allocation of binding site
3.7.1. Protein unfolding pathwayThe acid and urea induced protein unfolding pathway wasemployed to locate the binding site for MTX on HSA. As HSAundergoes N–F and N–I transitions induced by the acidic pHbetween 7.0 and 3.5 and the urea concentration in the range of4.8–5.2 M, respectively (Khan, 1986; Chmelik and Kalous, 1982).The F isomer which predominates at pH 3.5, is characterizedby unfolding and separation of domain III, and The I isomeris characterized by unfolding of domain III and partial but sig-nificant loss of native conformation of domain I. Domain IIis known persist in both N–F or N–I transitions. Fig. 7 showsconformation dependent binding of MTX, which is more dis-tinguished in U-conformer than in N- or F-conformation.Major deduction in the number of binding sites from N to Itransition (1.1–0.6) (Table 2), illustrates that the binding sitefor MTX may be located on domain I of HSA. The decreasedbinding constant (Table 2) can be understood as the outcomeof the loss of complex inter- and intradomain interactions thatsupports the albumin structure. This is justified to predict,as a domain in the presence of its other supportive unfoldeddomains cannot fully reflects its functional as well as its struc-tural properties.
3.7.2. Site specific probeIn order to further classify drug binding sites on the HSAmolecule, competitive binding experiments have been com-monly carried out, using drugs that specifically bind to aknown site or region on HSA. Sudlow et al. (1976) have sug-gested two main distinct binding sites on HSA, site I and siteII. Site I of HSA showed affinity for warfarin, phenylbutazone,etc., while site II for diazepam, fluofenamic acid, etc. Recently,a study indicated that anthracycline binds to a non-classical
analyses have assigned site I and II at domain II and III ofHSA, respectively. In this paper, the competitors used includedwarfarin (WRN), a characteristic marker for site I, diazepam
378 e u r o p e a n j o u r n a l o f p h a r m a c e u t i c a l s c i e n c e s 3 5 ( 2 0 0 8 ) 371–382
Fig. 8 – The comparative binding isotherms of fluorescencedata. The trend lines shows the comparative bindingpattern of HSA with MTX (©), DM (�), HM (�), WRN (�) and
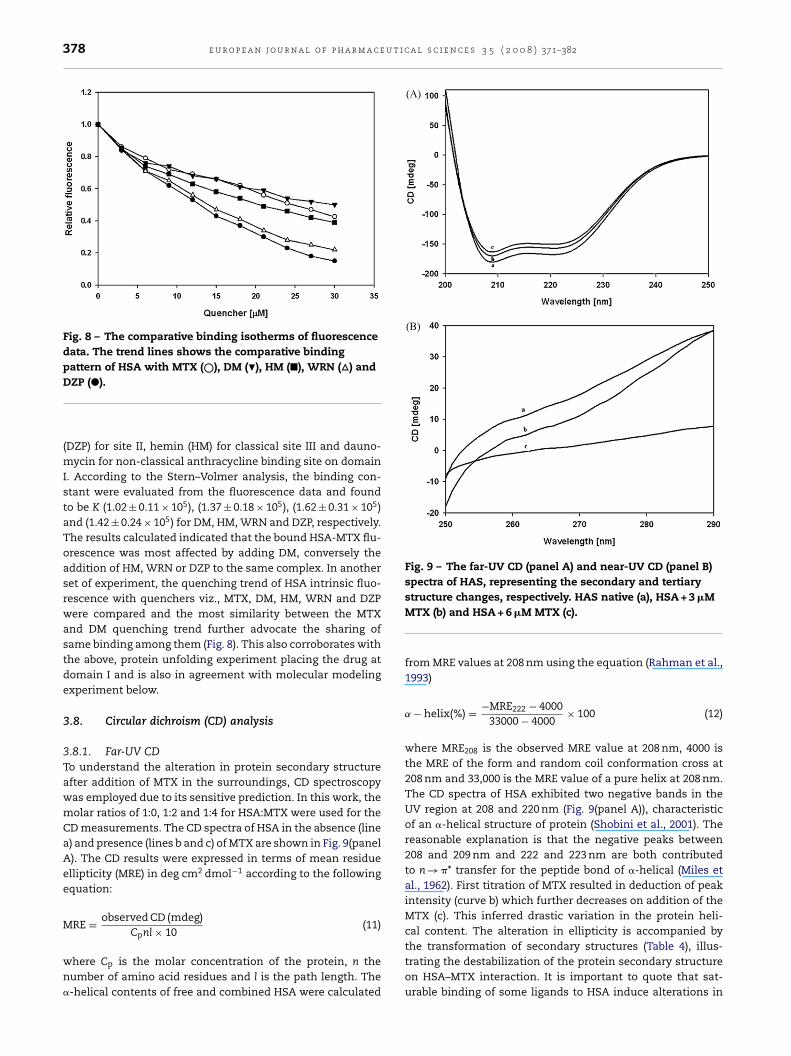
Fig. 9 – The far-UV CD (panel A) and near-UV CD (panel B)spectra of HAS, representing the secondary and tertiary
DZP (�).
(DZP) for site II, hemin (HM) for classical site III and dauno-mycin for non-classical anthracycline binding site on domainI. According to the Stern–Volmer analysis, the binding con-stant were evaluated from the fluorescence data and foundto be K (1.02 ± 0.11 × 10⁵), (1.37 ± 0.18 × 10⁵), (1.62 ± 0.31 × 10⁵)and (1.42 ± 0.24 × 10⁵) for DM, HM, WRN and DZP, respectively.The results calculated indicated that the bound HSA-MTX flu-orescence was most affected by adding DM, conversely theaddition of HM, WRN or DZP to the same complex. In anotherset of experiment, the quenching trend of HSA intrinsic fluo-rescence with quenchers viz., MTX, DM, HM, WRN and DZPwere compared and the most similarity between the MTXand DM quenching trend further advocate the sharing ofsame binding among them (Fig. 8). This also corroborates withthe above, protein unfolding experiment placing the drug atdomain I and is also in agreement with molecular modelingexperiment below.
3.8. Circular dichroism (CD) analysis
3.8.1. Far-UV CDTo understand the alteration in protein secondary structureafter addition of MTX in the surroundings, CD spectroscopywas employed due to its sensitive prediction. In this work, themolar ratios of 1:0, 1:2 and 1:4 for HSA:MTX were used for theCD measurements. The CD spectra of HSA in the absence (linea) and presence (lines b and c) of MTX are shown in Fig. 9(panelA). The CD results were expressed in terms of mean residueellipticity (MRE) in deg cm2 dmol−1 according to the followingequation:
MRE = observed CD (mdeg)Cpnl × 10
(11)
where Cp is the molar concentration of the protein, n thenumber of amino acid residues and l is the path length. The�-helical contents of free and combined HSA were calculated
structure changes, respectively. HAS native (a), HSA + 3 �MMTX (b) and HSA + 6 �M MTX (c).
from MRE values at 208 nm using the equation (Rahman et al.,1993)
˛ − helix(%) = −MRE222 − 400033000 − 4000
× 100 (12)
where MRE208 is the observed MRE value at 208 nm, 4000 isthe MRE of the form and random coil conformation cross at208 nm and 33,000 is the MRE value of a pure helix at 208 nm.The CD spectra of HSA exhibited two negative bands in theUV region at 208 and 220 nm (Fig. 9(panel A)), characteristicof an �-helical structure of protein (Shobini et al., 2001). Thereasonable explanation is that the negative peaks between208 and 209 nm and 222 and 223 nm are both contributedto n → �* transfer for the peptide bond of �-helical (Miles etal., 1962). First titration of MTX resulted in deduction of peakintensity (curve b) which further decreases on addition of theMTX (c). This inferred drastic variation in the protein heli-cal content. The alteration in ellipticity is accompanied by
the transformation of secondary structures (Table 4), illus-trating the destabilization of the protein secondary structureon HSA–MTX interaction. It is important to quote that sat-urable binding of some ligands to HSA induce alterations in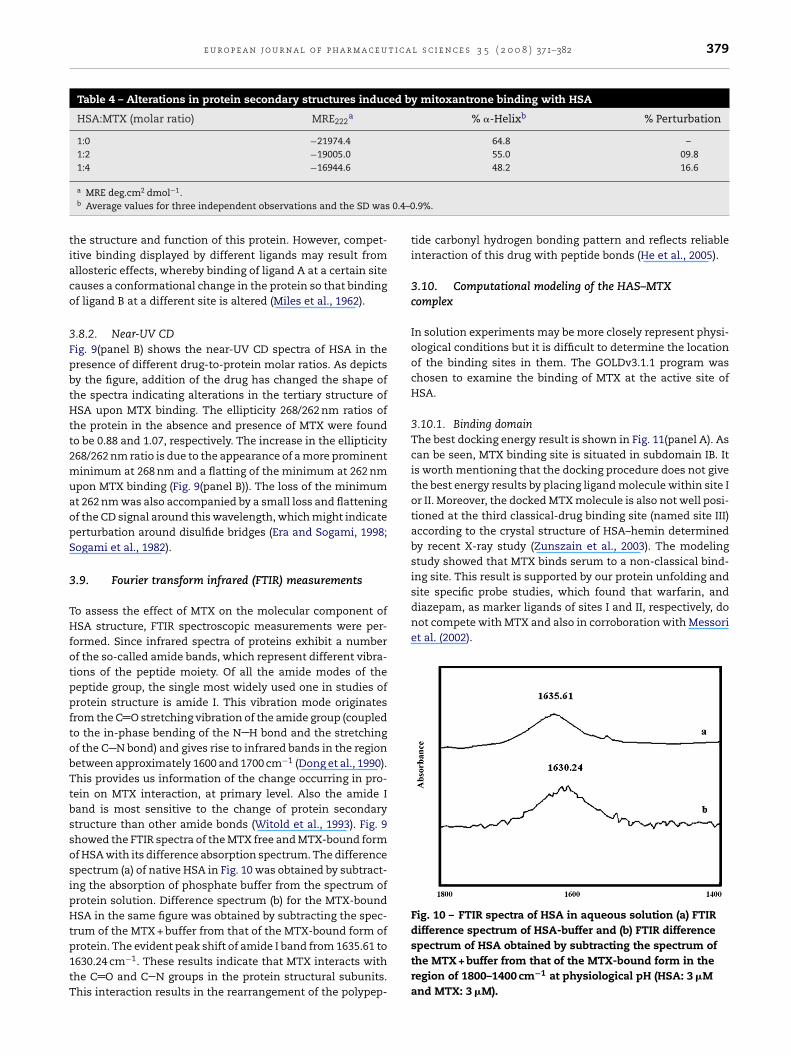
e u r o p e a n j o u r n a l o f p h a r m a c e u t i c a l s c i e n c e s 3 5 ( 2 0 0 8 ) 371–382 379
Table 4 – Alterations in protein secondary structures induced by mitoxantrone binding with HSA
HSA:MTX (molar ratio) MRE222a % �-Helixb % Perturbation
1:0 −21974.4 64.8 –1:2 −19005.0 55.0 09.81:4 −16944.6 48.2 16.6
0.4–0
tiaco
3FpbtHtt2muaopS
3
THfotppftobTtbssosipHtp1tT
site specific probe studies, which found that warfarin, anddiazepam, as marker ligands of sites I and II, respectively, donot compete with MTX and also in corroboration with Messoriet al. (2002).
Fig. 10 – FTIR spectra of HSA in aqueous solution (a) FTIRdifference spectrum of HSA-buffer and (b) FTIR difference
a MRE deg.cm2 dmol−1.b Average values for three independent observations and the SD was
he structure and function of this protein. However, compet-tive binding displayed by different ligands may result fromllosteric effects, whereby binding of ligand A at a certain siteauses a conformational change in the protein so that bindingf ligand B at a different site is altered (Miles et al., 1962).
.8.2. Near-UV CDig. 9(panel B) shows the near-UV CD spectra of HSA in theresence of different drug-to-protein molar ratios. As depictsy the figure, addition of the drug has changed the shape ofhe spectra indicating alterations in the tertiary structure ofSA upon MTX binding. The ellipticity 268/262 nm ratios of
he protein in the absence and presence of MTX were foundo be 0.88 and 1.07, respectively. The increase in the ellipticity68/262 nm ratio is due to the appearance of a more prominentinimum at 268 nm and a flatting of the minimum at 262 nm
pon MTX binding (Fig. 9(panel B)). The loss of the minimumt 262 nm was also accompanied by a small loss and flatteningf the CD signal around this wavelength, which might indicateerturbation around disulfide bridges (Era and Sogami, 1998;ogami et al., 1982).
.9. Fourier transform infrared (FTIR) measurements
o assess the effect of MTX on the molecular component ofSA structure, FTIR spectroscopic measurements were per-
ormed. Since infrared spectra of proteins exhibit a numberf the so-called amide bands, which represent different vibra-ions of the peptide moiety. Of all the amide modes of theeptide group, the single most widely used one in studies ofrotein structure is amide I. This vibration mode originatesrom the C O stretching vibration of the amide group (coupledo the in-phase bending of the N H bond and the stretchingf the C N bond) and gives rise to infrared bands in the regionetween approximately 1600 and 1700 cm−1 (Dong et al., 1990).his provides us information of the change occurring in pro-
ein on MTX interaction, at primary level. Also the amide Iand is most sensitive to the change of protein secondarytructure than other amide bonds (Witold et al., 1993). Fig. 9howed the FTIR spectra of the MTX free and MTX-bound formf HSA with its difference absorption spectrum. The differencepectrum (a) of native HSA in Fig. 10 was obtained by subtract-ng the absorption of phosphate buffer from the spectrum ofrotein solution. Difference spectrum (b) for the MTX-boundSA in the same figure was obtained by subtracting the spec-
rum of the MTX + buffer from that of the MTX-bound form of
rotein. The evident peak shift of amide I band from 1635.61 to630.24 cm−1. These results indicate that MTX interacts withhe C O and C N groups in the protein structural subunits.his interaction results in the rearrangement of the polypep-.9%.
tide carbonyl hydrogen bonding pattern and reflects reliableinteraction of this drug with peptide bonds (He et al., 2005).
3.10. Computational modeling of the HAS–MTXcomplex
In solution experiments may be more closely represent physi-ological conditions but it is difficult to determine the locationof the binding sites in them. The GOLDv3.1.1 program waschosen to examine the binding of MTX at the active site ofHSA.
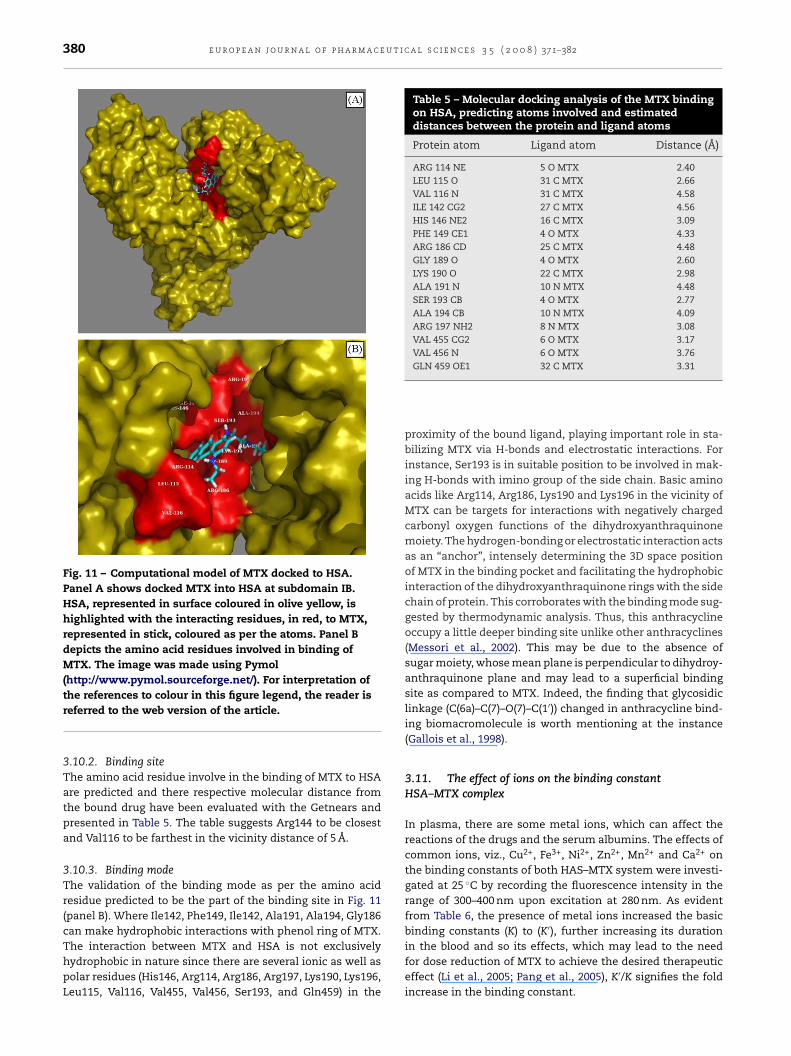
3.10.1. Binding domainThe best docking energy result is shown in Fig. 11(panel A). Ascan be seen, MTX binding site is situated in subdomain IB. Itis worth mentioning that the docking procedure does not givethe best energy results by placing ligand molecule within site Ior II. Moreover, the docked MTX molecule is also not well posi-tioned at the third classical-drug binding site (named site III)according to the crystal structure of HSA–hemin determinedby recent X-ray study (Zunszain et al., 2003). The modelingstudy showed that MTX binds serum to a non-classical bind-ing site. This result is supported by our protein unfolding and
spectrum of HSA obtained by subtracting the spectrum ofthe MTX + buffer from that of the MTX-bound form in theregion of 1800–1400 cm−1 at physiological pH (HSA: 3 �Mand MTX: 3 �M).
380 e u r o p e a n j o u r n a l o f p h a r m a c e u t i c a l s c i e n c e s 3 5 ( 2 0 0 8 ) 371–382
Fig. 11 – Computational model of MTX docked to HSA.Panel A shows docked MTX into HSA at subdomain IB.HSA, represented in surface coloured in olive yellow, ishighlighted with the interacting residues, in red, to MTX,represented in stick, coloured as per the atoms. Panel Bdepicts the amino acid residues involved in binding ofMTX. The image was made using Pymol(http://www.pymol.sourceforge.net/). For interpretation of
Table 5 – Molecular docking analysis of the MTX bindingon HSA, predicting atoms involved and estimateddistances between the protein and ligand atoms
Protein atom Ligand atom Distance (Å)
ARG 114 NE 5 O MTX 2.40LEU 115 O 31 C MTX 2.66VAL 116 N 31 C MTX 4.58ILE 142 CG2 27 C MTX 4.56HIS 146 NE2 16 C MTX 3.09PHE 149 CE1 4 O MTX 4.33ARG 186 CD 25 C MTX 4.48GLY 189 O 4 O MTX 2.60LYS 190 O 22 C MTX 2.98ALA 191 N 10 N MTX 4.48SER 193 CB 4 O MTX 2.77ALA 194 CB 10 N MTX 4.09ARG 197 NH2 8 N MTX 3.08VAL 455 CG2 6 O MTX 3.17VAL 456 N 6 O MTX 3.76GLN 459 OE1 32 C MTX 3.31
binding constants (K) to (K′), further increasing its duration
the references to colour in this figure legend, the reader isreferred to the web version of the article.
3.10.2. Binding siteThe amino acid residue involve in the binding of MTX to HSAare predicted and there respective molecular distance fromthe bound drug have been evaluated with the Getnears andpresented in Table 5. The table suggests Arg144 to be closestand Val116 to be farthest in the vicinity distance of 5 Å.
3.10.3. Binding modeThe validation of the binding mode as per the amino acidresidue predicted to be the part of the binding site in Fig. 11(panel B). Where Ile142, Phe149, Ile142, Ala191, Ala194, Gly186can make hydrophobic interactions with phenol ring of MTX.
The interaction between MTX and HSA is not exclusivelyhydrophobic in nature since there are several ionic as well aspolar residues (His146, Arg114, Arg186, Arg197, Lys190, Lys196,Leu115, Val116, Val455, Val456, Ser193, and Gln459) in theproximity of the bound ligand, playing important role in sta-bilizing MTX via H-bonds and electrostatic interactions. Forinstance, Ser193 is in suitable position to be involved in mak-ing H-bonds with imino group of the side chain. Basic aminoacids like Arg114, Arg186, Lys190 and Lys196 in the vicinity ofMTX can be targets for interactions with negatively chargedcarbonyl oxygen functions of the dihydroxyanthraquinonemoiety. The hydrogen-bonding or electrostatic interaction actsas an “anchor”, intensely determining the 3D space positionof MTX in the binding pocket and facilitating the hydrophobicinteraction of the dihydroxyanthraquinone rings with the sidechain of protein. This corroborates with the binding mode sug-gested by thermodynamic analysis. Thus, this anthracyclineoccupy a little deeper binding site unlike other anthracyclines(Messori et al., 2002). This may be due to the absence ofsugar moiety, whose mean plane is perpendicular to dihydroy-anthraquinone plane and may lead to a superficial bindingsite as compared to MTX. Indeed, the finding that glycosidiclinkage (C(6a)–C(7)–O(7)–C(1′)) changed in anthracycline bind-ing biomacromolecule is worth mentioning at the instance(Gallois et al., 1998).
3.11. The effect of ions on the binding constantHSA–MTX complex
In plasma, there are some metal ions, which can affect thereactions of the drugs and the serum albumins. The effects ofcommon ions, viz., Cu2+, Fe3+, Ni2+, Zn2+, Mn2+ and Ca2+ onthe binding constants of both HAS–MTX system were investi-gated at 25 ◦C by recording the fluorescence intensity in therange of 300–400 nm upon excitation at 280 nm. As evidentfrom Table 6, the presence of metal ions increased the basic
in the blood and so its effects, which may lead to the needfor dose reduction of MTX to achieve the desired therapeuticeffect (Li et al., 2005; Pang et al., 2005), K′/K signifies the foldincrease in the binding constant.
e u r o p e a n j o u r n a l o f p h a r m a c e u t i c a
Table 6 – The binding constants K′ (L mol−1) betweenMTX and HSA at 298 K in the presence of ions
System R2 K (×105)
HSA + MTX 0.9984 1.55HSA + MTX + Ca 0.9755 0.14HSA + MTX + Mn 0.9980 0.16
4
It7pib1ivdcmptbsifTiwIuw
A
Woi3I
r
A
B
B
HSA + MTX + Zn 0.9969 0.11HSA + MTX + Cu 0.9825 0.12HSA + MTX + Ni 0.9893 0.15
. Conclusion
n summary, the interaction of MTX with HSA has been inves-igated in vitro under simulated physiological conditions (pH.4, ionic strength 10 mM) using different optical and com-utational techniques. The data of fluorescence spectroscopy
ndicated the changes in microenvironment of HSA inducedy the binding of MTX and revealed a complex formation at:1 mole ratio. Drug interactions at protein binding level willn most cases significantly affect the apparent distributionolume of the drugs and also affect the elimination rate andetermine the therapeutic affectivity of drugs. At plasma con-entration of HSA the fraction of free drug was found to be 18%ore for B isomer than N isomer. The experimental and com-
utational results suggest that MTX could bind HSA throughhe hydrophobic force, electrostatic interactions and hydrogenonding. They also designate domain I to possess the bindingite for MTX. The binding study of drugs with HSA is of greatmportance in understanding chemico-biological interactionsor drug design, pharmacy, pharmacology and biochemistry.his study is expected to provide important insight into the
nteractions of the physiologically important protein HSAith an important drug used in various therapeutic regimes.
nformation is also obtained about pharmacologically activenbound drug and the effect of environment on HSA structure,hich may be correlated to its physiological activity.
cknowledgements
e are thankful to the Central Instrumentation Facility (CIF)f IBU and also acknowledge the CIF of Department of Chem-
stry, AMU. This work was supported by the CSIR sanction no.7(1209)04 EMR II. SNK acknowledge the fellowship from CSIR,ndia.
e f e r e n c e s
hmad, B., Parveen, S., Khan, R.H., 2006. Effect of albuminconformation on the binding of ciprofloxacin to humanserum albumin: a novel approach directly assigning bindingsite. Biomacromolecules 4, 350–1356.
i, S., Ding, L., Tian, Y., Song, D., Zhou, X., Liu, X., Zhang, H., 2004.Investigation of the interaction between flavonoids and
human serum albumin. J. Mol. Struct. 703, 37–45.runt, E., Limberg, J., Derendorf, H., 1990. High performanceliquid chromatographic-assay and erythrocyte partitioning offleroxacin, a new fluoroquinolon antibiotic. J. Pharm. Biomed.Anal. 8, 67–71.
l s c i e n c e s 3 5 ( 2 0 0 8 ) 371–382 381
Buttinelli, C., Clemenzi, A., Borriello, G., Denaro, F., Pozzilli, C.,Fieschi, C., 2007. Mitoxantrone treatment in multiplesclerosis: a 5-year clinical and MRI follow-up. Eur. J. Neurol.14, 1281–1287.
Carter, D.C., Ho, J.X., 1994. Structure of Serum Albumin. Advancesin Protein Chemistry, 45. Academic Press, New York, pp.53–203.
Chen, G.Z., Huang, X.Z., Xu, J.G., Wang, Z.B., Zheng, Z.Z., 1990a.Method of Fluorescent Analysis, 2nd ed. Science Press,Beijing, pp. 126.
Chen, G.Z., Huang, X.Z., Xu, J.G., Wang, Z.B., Zheng, Z.Z., 1990b.Method of Fluorescent Analysis, 2nd ed. Science Press,Beijing, pp. 123.
Chmelik, J., Kalous, V., 1982. Polarographic investigation ofconformational changes of human serum albumin.Bioelectrochem. Bioenerg. 9, 7–13.
Clark, P., Rachinsky, M.R., Foster, J.F., 1962. Moving boundaryelectrophoresis behavior and acid isomerization of humanmercaptalbumin. J. Biol. Chem. 237, 2509–2513.
Cornbleet, M.A., Stuart-Harris, R.C., Smith, I.E., Coleman, R.E.,Rubens, R.D., Mc Donald, M., Mouridsen, H.T., Rainer, H., vanOosterom, A.T., Smyth, J.F., 1984. Mitoxantrone for thetreatment of advanced breast cancer: single-agent therapy inpreviously untreated patients. Eur. J. Cancer. Clin. Oncol. 20,1141–1146.
Curry, S., Mandelkow, H., Brick, P., Franks, N., 1998. Crystalstructure of human serum albumin complexed withmonounsaturated and polyunsaturated fatty acid. Nat. Struct.Biol. 5, 827–835.
Dong, C., Huang, P., Caughey, W.S., 1990. Protein secondarystructures in water from second-derivative amide I infraredspectra. Biochemistry 29, 3303–3308.
Epps, D.E., Raub, T.J., Caiolfa, V., Chiari, A., Zamai, M., 1998.Determination of the affinity of drugs toward serum albuminby measurement of the quenching of the intrinsic tryptophanfluorescence of the protein. J. Pharm. Pharmacol. 51,41–48.
Era, S., Sogami, M., 1998. H-NMR and CD studies on the structuraltransition of serum albumin in the acidic region–the N → Ftransition. J. Pept. Res. 52, 431–442.
Fehske, K.J., Mullar, W.E., Wollart, U., 1981. The location of drugbinding sites in human serum albumin. Biochem. Pharmacol.30, 687–692.
Forster, T., 1996. In: Sinanoglu, O. (Ed.), Modern QuantumChemistry, 3. Academic Press, New York, pp. 93–137.
Gallois, L., Fiallo, M., Garnier-Suillerot, A., 1998. Comparison ofthe interaction of doxorubicin, daunorubicin, idarubicin andidarubicinol with large unilamellar vesicles. Circulardichroism study. Biochim. Biophys. Acta 1370, 31–40.
Gao, H., Lei, L., Liu, J., Qin, K., Chen, X., Hu, Z., 2004. The study onthe interaction between human serum albumin and a newreagent with antitumour activity by spectrophotometricmethods. J. Photochem. Photobiol. A 167, 213–221.
Hagemeister, F., Cabanillas, F., Coleman, M., Gregory, S.A.,Zinzani, P.L., 2005. The role of mitoxantrone in the treatmentof indolent lymphomas. Oncologist 10, 109–150.
Harmsen, B.J., De Bruin, S.H., Janssen, L.H., Rodrigues de Miranda,J.F., Van Os, G.A., 1971. pK change of imidazole groups inbovine serum albumin due to the conformational change atneutral pH. Biochemistry 10, 3217–3221.
He, W.Y., Li, Y., Tian, J.N., Liu, H.X., Hu, Z.D., Chen, X.G., 2005.Spectroscopic studies on binding of shikonin to human serumalbumin. Photochem. Photobiol. 174, 53–61.
Job, P., 1928. Formation and stability of inorganic complexes in
solution. Ann. Chim. 9, 113–203.Jones, G., Willett, P., Glen, R.C., 1995. Molecular recognition ofreceptor sites using a genetic algorithm with a description ofdesolvation. J. Mol. Biol. 245, 43–53.
u t i c
Biochim. Biophys. Acta 1774, 51–58.
382 e u r o p e a n j o u r n a l o f p h a r m a c e
Kang, J., Liu, Y., Xie, M.X., Li, S., Jiang, M., Wang, Y.D., 2004.Interactions of human serum albumin with chlorogenic acidand ferulic acid. Biochim. Biophys. Acta 1674, 205–214.
Karnaukhova, E., 2007. Interactions of human serum albuminwith retinoic acid, retinal and retinyl acetate. Biochem.Pharmacol. 73, 901–910.
Khan, M.Y., 1986. Direct evidence for involvement of domain III inthe N-F transition of bovine serum albumin. Biochem. J. 236,307–310.
Khan, S.N., Islam, B., Khan, A.U., 2007. Probing midazolaminteraction with human serum albumin and its effect onstructural state of protein. Int. J. Integr. Biol. 1, 102–112.
Khan, S.N., Islam, B., Rajeswari, M.R., Usmani, H., Khan, A.U.,2008. Characterizing the interaction of anesthetic supplementthiopental with human serum albumin. Acta Biochim. Pol. 55(2), 399–409.
Kuntz, I.D., Blaney, J.M., Oatley, S.J., Langridge, R., Ferrin, T.E.,1982. A geometric approach to macromolecule-ligandinteractions. J. Mol. Biol. 161, 269–288.
Lakowicz, J.R., Weber, G., 1973. Quenching of fluorescence byoxygen. A probe for structural fluctuations inmacromolecules. Biochemistry 12, 4161–4170.
Li, Y., He, W., Liu, J., Sheng, F., Hu, Z., Chen, X., 2005. Binding ofthe bioactive component jatrorrhizine to human serumalbumin. Biochim. Biophys. Acta 1722, 15–21.
Lloyd, J.B.F., 1971. Synchronized excitation of fluorescenceemission spectra. Nat. Phys. Sci. 231, 64–65.
Mahesha, H.G., Singh, S.A., Srinivasan, N., Rao, A.G., 2006. Aspectroscopic study of the interaction of isoflavones withhuman serum albumin. FEBS J. 273, 451–467.
Martin, B.K., 1965. Potential effect of the plasma proteins on drugdistribution. Nature 207, 274–276.
Messori, L., Piccioli, F., Gabrielli, S., Orioli, P., Angeloni, L., DiBugno, C., 2002. The disaccharide anthracycline MEN 10755binds human serum albumin to a non-classical drug bindingsite. Bioorg. Med. Chem. 10, 3425–3430.
Miles, J.L., Morey, E., Crain, F., Gross, S., San Julian, J., Canady, W.J.,1962. Inhibition of �-chymotrypsin by diethyl ether andcertain alcohols: a new type of competitive inhibition. J. Biol.Chem. 237, 1319–1322.
Miller, J.N., 1979. Recent advances in molecular luminescenceanalysis. Proc. Anal. Div. Chem. Soc. 16, 203–208.
Neidhart, J.A., Gochnour, D., Roach, R.W., Young, D., Steinberg,J.A., 1984. A comparative trial of mitoxantrone anddoxorubicin in patients with minimally pretreated breastcancer. Semin. Oncol. 11, 11–14.
Ojingwa, J.C., Sphan-Langguth, H., Benet, L.Z., 1994. Reversiblebinding of tolmetin, zomepirac, and their glucuronideconjugates to human serum albumin and plasma. J.Pharmacokinet. Biopharm. 22, 19–40.
Pang, Y.H., Yang, L.L., Shuang, S.M., Dong, C., Thompson, M.,2005. Interaction of human serum albumin with
bendroflumethiazide studied by fluorescence spectroscopy. J.Photochem. Photobiol. B 80, 139–144.Quevedo, M.A., Moroni, G.N., Brinonl, M.C., 2001. Human serumalbumin binding of novel antiretroviral nucleoside derivativesof AZT. Biochem. Biophys. Res. Commun. 288,954–960.
a l s c i e n c e s 3 5 ( 2 0 0 8 ) 371–382
Rahim, S., Aubry, A.F., 1995. Location of binding sites onimmobilized human serum albumin for some nonsteroidalanti-inflammatory drugs. J. Pharm. Sci. 84, 949–952.
Rahman, M.H., Maruyama, T., Okada, T., Yamasaki, K., Otagiri, M.,1993. Study of interaction of carprofen and its enantiomerswith human serum albumin-I. Stereoselective site-to-sitedisplacement of carprofen by ibuprofen. Biochem. Pharmacol.46, 1721–1731.
Ross, P.D., Subramanian, S., 1981. Thermodynamics of proteinassociation reactions: forces contributing of stability.Biochemistry 20, 3096–3102.
Shargel, L., Yu, A.B., 1999. Applied Biopharmaceutics andPharmacokinetics, 4th ed. Appleton-Century-Crafts, Norwalk,CT, Chap. 11.
Shobini, J., Mishra, A.K., Sandhya, K., Chandra, N., 2001.Interaction of coumarin derivatives with human serumalbumin: investigation by fluorescence spectroscopictechnique and modeling studies. Spectrochimica. Acta A 57,1133–1147.
Sogami, M., Era, S., Nagaoka, S., Inouye, H., 1982. Circular dichroicand fluoropolarimetric studies on tryptophyl residues inacid-induced isomerization of bovine plasma albumin. Int. J.Pept. Protein Res. 19, 263–269.
Sudlow, G., Birkett, D.J., Wade, D.N., 1976. Furthercharacterization of specific drug binding site on humanserum albumin. Mol. Pharmacol. 12, 1052–1061.
Tang, K., Qin, Y.-M., Lin, A.-H., Hu, X., Zou, G.-L., 2005. Interactionof daunomycin antibiotic with human serum albumin:investigation by resonant mirror biosensor technique,fluorescence spectroscopy and molecular modeling methods.J. Pharma. Biomed. Anal. 39, 404–410.
Tsavaris, N., Kosmas, C., Kavantzas, N., Lazaris, A., Skopelitis, E.,Dimitrakopoulos, A., Siakantaris, M.P., Papalambros, E.,Diamantis, N., Patsouris, E., Pangalis, G.A., 2005. Breast cancerfollowing curative chemotherapy for non-Hodgkin’slymphoma and the effect of drug resistance proteins to thefinal outcome. A retrospective study. J. BUON 10, 71–76.
Wang, R., Lai, L., Wang, S., 2002. Further development andvalidation of empirical scoring functions for structure basedbinding affinity prediction. J. Comput. Aided Mol. Des. 16,11–26.
Ward, L.D., 1985. Measurement of ligand binding to proteins byfluorescence spectroscopy. Methods Enzymol. 117, 400–414.
Witold, K.S., Henry, H.M., Dennis, C., 1993. Determination ofprotein secondary structure by e-transform infraredspectroscopy: a critical assessment. Biochemistry 32, 389–394.
Ying, L., Xiaojun, Y., Jing, J., Xingguo, C., Zhide, H., 2007.Interaction of rhein with human serum albumin investigationby optical spectroscopic technique and modeling studies.
Zunszain, P.A., Ghuman, J., Komatsu, T., Tsuchida, E., Curry, S.,2003. Crystal structural analysis of human serum albumincomplexed with hemin and fatty acid. BMC Struct. Biol. 3,6–14.