Embed Size (px)
Citation preview

Vision Research 40 (2000) 2579–2588
Interactions between flicker thresholds and luminance pedestals
Andrew J. Anderson, Algis J. Vingrys *Department of Optometry and Vision Sciences, Uni6ersity of Melbourne, Victoria 3010, Australia
Received 26 October 1999; received in revised form 28 January 2000
Abstract
We investigated the interactions between flicker thresholds and luminance pedestals using threshold versus contrast (TvC) andmethod of constant stimuli paradigms. High amplitude luminance pedestals were found to elevate flicker thresholds, but lowamplitude luminance pedestals were unable to reduce flicker thresholds. Luminance pedestals elevated flicker thresholds more atlow temporal frequencies. A simple model based on local light adaptation was able to capture the general form of the TvCfunctions. Our results suggest that flicker thresholds derived in the presence of a luminance pedestal (luminance-pedestal flicker)may vary from those obtained by modulating about a mean luminance (mean-modulated flicker). © 2000 Elsevier Science Ltd.All rights reserved.
Keywords: Contrast discrimination functions; Light adaptation; Luminance pedestal flicker; Masking; Facilitation
www.elsevier.com/locate/visres
1. Introduction
Investigations into the temporal responsiveness of thevisual system use two types of flickering stimuli, namelymean-modulated and luminance-pedestal flicker (Fig.1). Mean-modulated stimuli vary luminance about abackground level and so effect no change in the time-averaged luminance. Luminance-pedestal flicker isachieved by modulating a luminance increment overtime, resulting in both a flickering component and achange in the time-averaged luminance (a luminancepedestal). At some temporal frequencies, the onset andoffset of the luminance pedestal is more detectable thanis the flickering component (Vingrys, Demirel & Kallo-niatis, 1995).
One issue that needs to be considered is whetherluminance-pedestal flicker thresholds are equivalent tomean-modulated flicker thresholds. The two thresholdswill be equivalent only if the luminance pedestal has noeffect on threshold outcomes. This seems unlikely,given recent work that suggests that luminancepedestals can alter flicker thresholds (Eisner, 1995; Eis-
ner, Shapiro & Middleton, 1998). Also, flicker sensitiv-ity changes with light adaptation (DeLange, 1958;Kelly, 1961; Roufs, 1972), so it could be expected thatthe local increase in luminance effected by the lumi-nance pedestal will alter flicker thresholds.
Luminance pedestals facilitate the detection of lumi-nous contrast at low pedestal amplitudes and raisedetection thresholds at high pedestal amplitudes, givinga characteristic dipper-shaped threshold versus contrast(TvC) function (e.g. Cornsweet & Pinsker, 1965; Whit-tle & Swanston, 1974; Whittle, 1986). When counter-phase flicker gratings are presented on counterphaseflicker pedestals, similarly shaped TvCs result (Boynton& Foley, 1999). These findings suggest that both staticluminous contrast and flickering contrast are processedvia S-shaped transducer functions (Nachmias & Sans-bury, 1974; Wilson, 1980; Foley & Legge, 1981;Switkes, Bradley & DeValois, 1988; Yang & Makous,1995).
Recent modelling of TvC functions have incorpo-rated both excitatory and divisive inhibitory inputs tothe transducer functions processing contrast (Foley,1994; Boynton & Foley, 1999). In these models, facilita-tion occurs when a pedestal has excitatory effects onthe transducer function. What is not known is whethera luminance pedestal can excite the flicker transducer,thereby causing facilitation, in the same way it does the
* Corresponding author: Tel.:+61-3-93497406; fax:+61-3-93497498.
E-mail address: [email protected] (A.J. Vin-grys).
0042-6989/00/$ - see front matter © 2000 Elsevier Science Ltd. All rights reserved.PII: S 0 0 4 2 -6989 (00 )00121 -8

A.J. Anderson, A.J. Vingrys / Vision Research 40 (2000) 2579–25882580
static transducer. Bodis-Wollner and Hendley (1979)presented 8 Hz flickering gratings upon static gratingpedestals, but their study had insufficient power todetermine the presence of facilitory effects. Pantle(1983) also presented flickering gratings upon staticgrating pedestals and failed to show facilitation at lowpedestal amplitudes. However, as his study used testand masking gratings of differing spatial frequency, theabsence of facilitation could be due to this spatialdiscrepancy. Consistent with this possibility, his staticgratings on static pedestals show no facilitation either(Fig. 3; Pantle, 1983). Georgeson and Georgeson (1987)found that the facilitory effect present with static grat-ings (1 c/deg) disappeared when the test grating waspresented as a single cycle of 40 Hz flicker, althoughthreshold elevation at high pedestal amplitudes re-mained. This finding implies that static luminous con-trast is unable to directly excite the flicker contrasttransducer for grating stimuli, but can elevate flickerthresholds. Given that certain aspects of contrast dis-crimination in low spatial frequency gratings can bepredicted from local luminance responses (Kingdom &Whittle, 1996), it may be expected that luminous-con-trast/flicker-contrast interactions for small spot targetswould show a similar pattern to those found for grat-ings. It is not clear, however, what effect temporalfrequency has on these interactions.
We investigated the interactions between luminancepedestals and flicker thresholds over a range of tempo-ral frequencies for spot targets using a TvC paradigmand by establishing psychometric functions. We presenta model, based on local light adaptation, that describesthe main effects found in our data.
2. General methods
2.1. Subjects
Six subjects (20–30 years) participated in the experi-ments; five in Experiment 1 and four in Experiment 2.All had best corrected visual acuities of 6/6 or betterand no history of ocular disease or migraine (McK-endrick, Badcock, Heywood & Vingrys, 1998). All sub-jects wore their habitual spectacle correction for testingand used monocular viewing with natural pupils. Foreccentric targets (15°) only nasal locations were tested.The study complied with the tenets of the Declarationof Helsinki, with subjects giving written informed con-sent prior to participation.
2.2. Apparatus and procedure
Stimuli were generated using a Cambridge ResearchSystems VSG 2/3 graphics card (Cambridge ResearchSystems Ltd., Kent, UK) and displayed on a gammacorrected Hitachi™ HM-47231-D colour monitor(mean luminance 25 cd/m2; frame rate 120 Hz). Thevisible area of the monitor subtended 19.3°×13.7°(w×h) at 1 m, and was surrounded by a 4 cd/m2
square white background that subtended 53° horizon-tally. Spatial variations in the output of the monitor(Metha, Vingrys & Badcock, 1993) were avoided byhaving subjects alter their fixation for eccentrically pre-sented targets.
In Experiment 1, thresholds were measured using atwo-interval forced choice paradigm and a ZEST proce-dure (King-Smith, Grigsby, Vingrys, Benes & Supowit,1994) of 30 trials, allowing thresholds falling outsidethe realisable gamut to be predicted. Stimuli were pre-sented in a pseudo-random order and thresholds weredetermined from an average of two estimates (logthreshold) made at different times. In Experiment 2, atwo-interval forced choice method of constant stimuliwith 100 trials per intensity was used to determinepsychometric functions. Preliminary investigations sug-gested that eight intensities, separated by 0.23 log units,adequately described the psychometric function. Asuprathreshold trial (maximum intensity) was includedto determine false negative rates. In all experiments, thebeginning of each interval was indicated by an auditorytone, and auditory feedback was provided after eachtrial.
All stimuli and pedestals were 0.5° diameter white(1931 CIE, x=0.283, y=0.319) sharp-edged spots,presented at either 0 or 15° eccentricity. Square waveflicker was used at temporal frequencies of 4, 7.5, 12and 20 Hz, with thresholds given as mean-to-peakamplitudes. Flickering stimuli were presented with theirpositive going phase at onset. All luminance pedestalswere presented at the same time as the flickering stimu-
Fig. 1. Schematic representations of mean-modulated (upper panel)and luminance-pedestal (lower panel) flicker. The dashed lines repre-sent the time-averaged luminance during the presentation of theflicker, B represents the background luminance. Note in the lowerpanel, that the time-averaged luminance is greater than the back-ground by an amount that is the luminance pedestal.

A.J. Anderson, A.J. Vingrys / Vision Research 40 (2000) 2579–2588 2581
Table 1Average 9SEM threshold (a) and slope (b) of the best fitting Weibull functions for different types of stimulus–pedestal and backgroundluminance
a bStimulus–pedestal type and background luminance Pedestal luminance (cd/m2)
0.1890.03Static–static 2.3990.3000.0990.024 (cd/m2) 1.5090.12*0.10.7290.10*2.15 1.1390.03*3.8290.23*21.54 1.0990.12*
0.0990.02Flicker–static 3.1890.3700.0790.014 (cd/m2) 2.3490.240.460.7190.07* 3.0490.5621.54
Flicker–flicker 0 0.3890.05 3.5290.700.2290.040.46 1.2590.10*27 (cd/m2)
10 1.7190.15* 1.4390.14*
* Denotes that the parameter is significantly different (PB0.05) from the zero pedestal condition.
lus. For all experiments, three stimulus-pedestal combi-nations were used: luminance increment stimuli on lumi-nance pedestals, flickering stimuli on flickering pedestalsand flickering stimuli on luminance pedestals, the latterbeing termed the luminance-pedestal flicker condition.For stimuli presented on luminance pedestals, a 4 cd/m2
background was used to maximise the range of pedestalsthat could be investigated. In contrast, as flicker requiresboth incremental and decremental luminance excursions,a higher background (27 cd/m2) was used for flickeringpedestals (see Table 1). All luminances were constrainedto lie above the lower 5% of the monitor’s range, toavoid the ‘dark-light’ of the monitor (Metha et al., 1993).
2.3. Stimulus timing
The effects of stimulus duration and inter-stimulusinterval (ISI) were determined by empirical investiga-tion. For luminance increment stimuli, durations of 8.3ms (1 frame) to 1000 ms (120 frames) were investigated.For flickering stimuli, durations ranged from a singlecycle up to 2000 ms, with all durations giving an integerof flicker cycles. Only the extremes of temporal fre-quency (4 and 20 Hz) and pedestal magnitude wereinvestigated.
The effect of stimulus duration is shown in Fig. 2. Asexpected, the data for the luminance increment detectiontask (filled circles) shows a characteristic Bloch’s lawresponse (Hart, 1987) with constant thresholds beyond100 ms. However, thresholds for a luminance incrementpresented on a luminance pedestal (unfilled circles) arelargely unaffected by duration. This suggests that lumi-nance discrimination is achieved when the stimulus is afixed proportion greater than the pedestal, regardless ofduration. The results obtained at 15° eccentricity (notshown) were of a similar form to the centrally collecteddata. We decided to use a 200 ms stimulus for allsubsequent investigations involving luminance incre-ments.
The 4 and 20 Hz luminance-pedestal flicker thresholds(squares and triangles, respectively) both decrease up toa critical duration (�700–800 ms). These changes inthreshold are larger than would be expected from prob-ability summation over time (Watson, 1979) and suggestthat the luminance pedestal raises thresholds initially butthat its effect is redressed over time. The results for aflickering stimulus presented on a flickering pedestal ofthe same frequency (not plotted) gave a flat response asseen with the luminance discrimination task (Fig. 2,unfilled circles). Trends were the same for both centraland eccentric data sets. We decided to use a stimulusduration of 750 ms for all flicker investigations, exceptfor the 7.5 Hz stimulus where the longer duration of 800ms was used. These durations allowed an integer offlicker cycles to be presented in all cases.
Using the stimulus durations determined above, theeffect of ISI (8.3 ms (1 frame) to 1000 ms) was investi-
Fig. 2. Effect of stimulus duration on threshold for a 20 Hz lumi-nance-pedestal flicker stimulus (triangles), a 4 Hz luminance-pedestalflicker stimulus (squares), a luminance increment on a luminancepedestal (unfilled circles) and a luminance increment detection task(filled circles). Inter-stimulus interval for all conditions was 1000 msand all luminance pedestals were 21.54 cd/m2. The 4 and 20 Hz datawere obtained at 15° eccentricity whereas the other data were ob-tained centrally. Data points give the mean of five observers9SEM.
A.J. Anderson, A.J. Vingrys / Vision Research 40 (2000) 2579–25882582
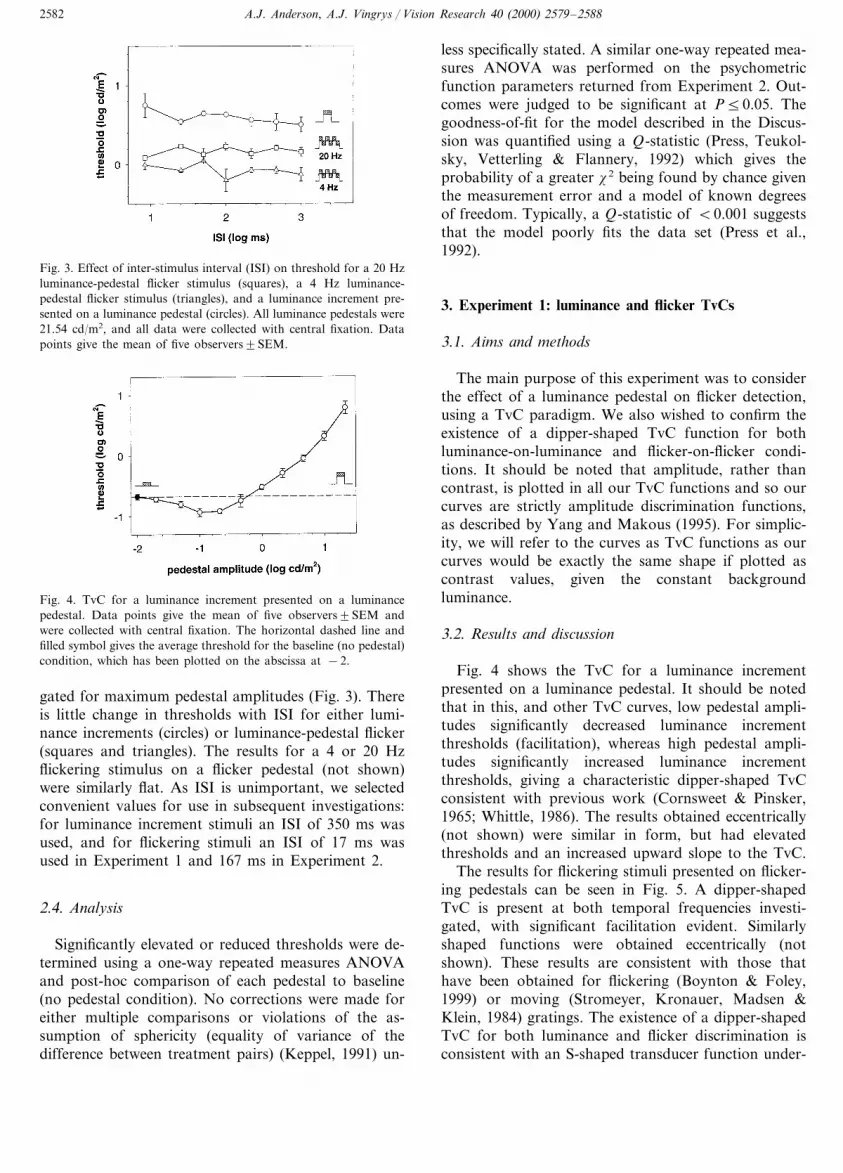
Fig. 3. Effect of inter-stimulus interval (ISI) on threshold for a 20 Hzluminance-pedestal flicker stimulus (squares), a 4 Hz luminance-pedestal flicker stimulus (triangles), and a luminance increment pre-sented on a luminance pedestal (circles). All luminance pedestals were21.54 cd/m2, and all data were collected with central fixation. Datapoints give the mean of five observers9SEM.
less specifically stated. A similar one-way repeated mea-sures ANOVA was performed on the psychometricfunction parameters returned from Experiment 2. Out-comes were judged to be significant at P50.05. Thegoodness-of-fit for the model described in the Discus-sion was quantified using a Q-statistic (Press, Teukol-sky, Vetterling & Flannery, 1992) which gives theprobability of a greater x2 being found by chance giventhe measurement error and a model of known degreesof freedom. Typically, a Q-statistic of B0.001 suggeststhat the model poorly fits the data set (Press et al.,1992).
3. Experiment 1: luminance and flicker TvCs
3.1. Aims and methods
The main purpose of this experiment was to considerthe effect of a luminance pedestal on flicker detection,using a TvC paradigm. We also wished to confirm theexistence of a dipper-shaped TvC function for bothluminance-on-luminance and flicker-on-flicker condi-tions. It should be noted that amplitude, rather thancontrast, is plotted in all our TvC functions and so ourcurves are strictly amplitude discrimination functions,as described by Yang and Makous (1995). For simplic-ity, we will refer to the curves as TvC functions as ourcurves would be exactly the same shape if plotted ascontrast values, given the constant backgroundluminance.
3.2. Results and discussion
Fig. 4 shows the TvC for a luminance incrementpresented on a luminance pedestal. It should be notedthat in this, and other TvC curves, low pedestal ampli-tudes significantly decreased luminance incrementthresholds (facilitation), whereas high pedestal ampli-tudes significantly increased luminance incrementthresholds, giving a characteristic dipper-shaped TvCconsistent with previous work (Cornsweet & Pinsker,1965; Whittle, 1986). The results obtained eccentrically(not shown) were similar in form, but had elevatedthresholds and an increased upward slope to the TvC.
The results for flickering stimuli presented on flicker-ing pedestals can be seen in Fig. 5. A dipper-shapedTvC is present at both temporal frequencies investi-gated, with significant facilitation evident. Similarlyshaped functions were obtained eccentrically (notshown). These results are consistent with those thathave been obtained for flickering (Boynton & Foley,1999) or moving (Stromeyer, Kronauer, Madsen &Klein, 1984) gratings. The existence of a dipper-shapedTvC for both luminance and flicker discrimination isconsistent with an S-shaped transducer function under-
Fig. 4. TvC for a luminance increment presented on a luminancepedestal. Data points give the mean of five observers9SEM andwere collected with central fixation. The horizontal dashed line andfilled symbol gives the average threshold for the baseline (no pedestal)condition, which has been plotted on the abscissa at −2.
gated for maximum pedestal amplitudes (Fig. 3). Thereis little change in thresholds with ISI for either lumi-nance increments (circles) or luminance-pedestal flicker(squares and triangles). The results for a 4 or 20 Hzflickering stimulus on a flicker pedestal (not shown)were similarly flat. As ISI is unimportant, we selectedconvenient values for use in subsequent investigations:for luminance increment stimuli an ISI of 350 ms wasused, and for flickering stimuli an ISI of 17 ms wasused in Experiment 1 and 167 ms in Experiment 2.
2.4. Analysis
Significantly elevated or reduced thresholds were de-termined using a one-way repeated measures ANOVAand post-hoc comparison of each pedestal to baseline(no pedestal condition). No corrections were made foreither multiple comparisons or violations of the as-sumption of sphericity (equality of variance of thedifference between treatment pairs) (Keppel, 1991) un-

A.J. Anderson, A.J. Vingrys / Vision Research 40 (2000) 2579–2588 2583
Fig. 5. TvC for a flickering stimulus presented on a flickering pedestal(4 Hz squares and 20 Hz circles). Data points give the mean of fiveobservers9SEM and were collected with central fixation. For clarity,the 20 Hz data have been displaced upwards by 0.4 log units. Otherdetails as per Fig. 4.
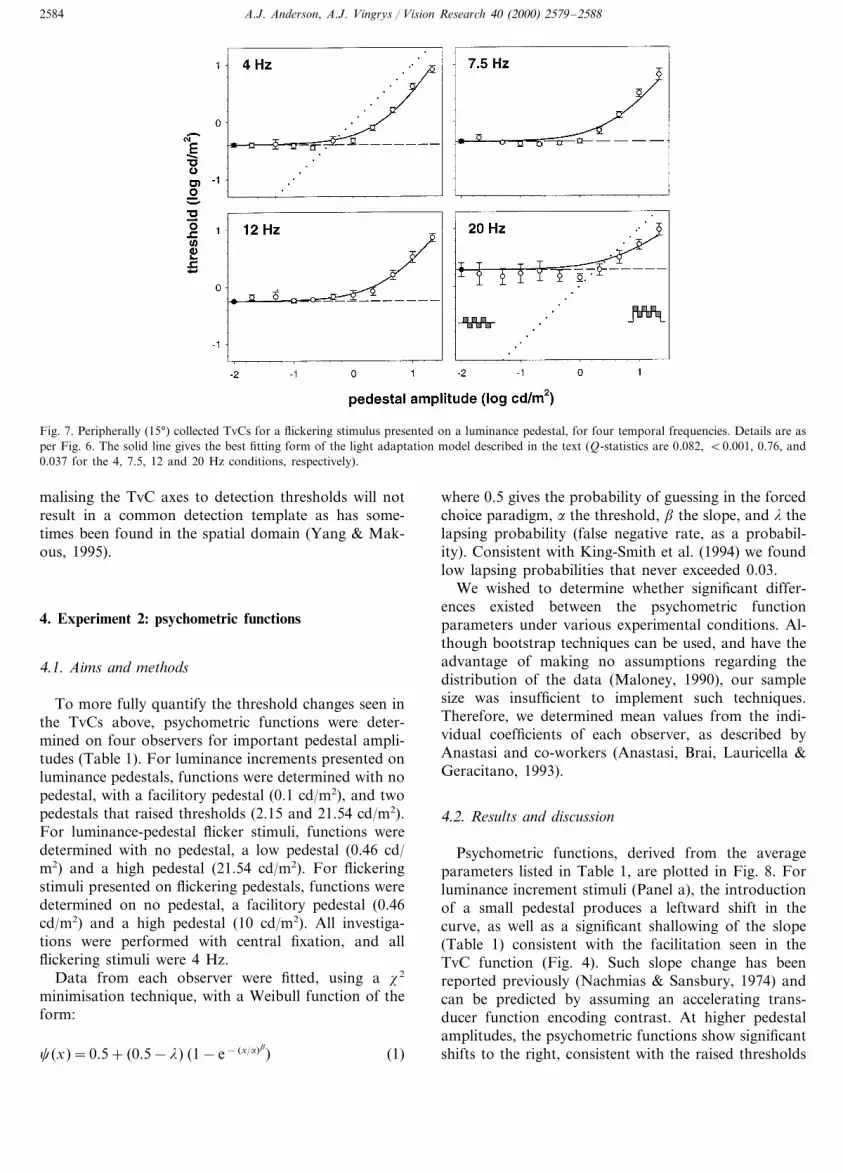
luminance-on-luminance or flicker-on-flicker condition.Correcting for multiple comparisons within theANOVA (Dunnett’s Method) also gave significant re-sults. The absence of a consistent facilitory effect is notdue to low power in the ANOVA: for an effect of 0.167log units (smaller than those seen in Figs. 4 and 5),power exceeded 0.80 for all temporal frequencies. Theresults for luminance-pedestal flicker presented eccentri-cally are given in Fig. 7. No significant facilitation isevident at low pedestal amplitudes, and the TvC up-ward slopes are increased eccentrically when comparedwith those obtained with central fixation (Fig. 7 vs. Fig.6). For both the central and eccentric data, the upwardslopes of the TvCs reduce as temporal frequencyincreases.
These results suggest that the luminance pedestalpresent in luminance-pedestal flicker is not able toexcite the flicker transducer (Ross & Speed, 1991;Boynton & Foley, 1999), but can influence the flickermechanism in a way that produces threshold elevation,possibly via an adaptational process (Ross & Speed,1991). As temporal frequency increases, the upwardslopes of the luminance-pedestal flicker TvCs decrease,which is consistent with increased linearity of the flickermechanism as temporal frequency increases (DeLange,1958; Kelly, 1961; Roufs, 1972). Therefore, it seemsthat local light adaptation (i.e. background pluspedestal) may be involved in the effect exerted by theluminance pedestal. It should be noted that, becausethe TvC slope changes with temporal frequency, nor-
lying both forms of contrast processing. Therefore, is itpossible for a luminance pedestal to directly excite theflicker contrast transducer and so produce a similardipper-shaped TvC?
The TvCs for luminance-pedestal flicker presentedcentrally are shown in Fig. 6. The most obvious differ-ence between these TvCs and those of Figs. 4 and 5 isthe absence of facilitation at low pedestal amplitudes.Only two points (marked with asterisks) showed signifi-cant facilitation, being the −0.66 log pedestal condi-tion at 7.5 Hz and the −0.33 log pedestal condition at12 Hz, and the magnitude of this facilitation wasapproximately one half to one third of that found in the
Fig. 6. Centrally collected TvCs for flickering stimuli presented on a luminance pedestal for four temporal frequencies. Points marked withasterisks show significant facilitation when compared to baseline. The solid line gives the best fitting form of the light adaptation model describedin the text (Q-statistics are B0.001, B0.001, B0.001 and 0.93 for the 4, 7.5, 12 and 20 Hz conditions, respectively). The dotted line gives thelocus of stimuli that can be produced by square-wave modulation of a luminance pedestal with a 50% duty cycle. Other details as per Fig. 4.
A.J. Anderson, A.J. Vingrys / Vision Research 40 (2000) 2579–25882584
Fig. 7. Peripherally (15°) collected TvCs for a flickering stimulus presented on a luminance pedestal, for four temporal frequencies. Details are asper Fig. 6. The solid line gives the best fitting form of the light adaptation model described in the text (Q-statistics are 0.082, B0.001, 0.76, and0.037 for the 4, 7.5, 12 and 20 Hz conditions, respectively).
malising the TvC axes to detection thresholds will notresult in a common detection template as has some-times been found in the spatial domain (Yang & Mak-ous, 1995).
4. Experiment 2: psychometric functions
4.1. Aims and methods
To more fully quantify the threshold changes seen inthe TvCs above, psychometric functions were deter-mined on four observers for important pedestal ampli-tudes (Table 1). For luminance increments presented onluminance pedestals, functions were determined with nopedestal, with a facilitory pedestal (0.1 cd/m2), and twopedestals that raised thresholds (2.15 and 21.54 cd/m2).For luminance-pedestal flicker stimuli, functions weredetermined with no pedestal, a low pedestal (0.46 cd/m2) and a high pedestal (21.54 cd/m2). For flickeringstimuli presented on flickering pedestals, functions weredetermined on no pedestal, a facilitory pedestal (0.46cd/m2) and a high pedestal (10 cd/m2). All investiga-tions were performed with central fixation, and allflickering stimuli were 4 Hz.
Data from each observer were fitted, using a x2
minimisation technique, with a Weibull function of theform:
c(x)=0.5+ (0.5−l) (1−e− (x/a)b
) (1)
where 0.5 gives the probability of guessing in the forcedchoice paradigm, a the threshold, b the slope, and l thelapsing probability (false negative rate, as a probabil-ity). Consistent with King-Smith et al. (1994) we foundlow lapsing probabilities that never exceeded 0.03.
We wished to determine whether significant differ-ences existed between the psychometric functionparameters under various experimental conditions. Al-though bootstrap techniques can be used, and have theadvantage of making no assumptions regarding thedistribution of the data (Maloney, 1990), our samplesize was insufficient to implement such techniques.Therefore, we determined mean values from the indi-vidual coefficients of each observer, as described byAnastasi and co-workers (Anastasi, Brai, Lauricella &Geracitano, 1993).
4.2. Results and discussion
Psychometric functions, derived from the averageparameters listed in Table 1, are plotted in Fig. 8. Forluminance increment stimuli (Panel a), the introductionof a small pedestal produces a leftward shift in thecurve, as well as a significant shallowing of the slope(Table 1) consistent with the facilitation seen in theTvC function (Fig. 4). Such slope change has beenreported previously (Nachmias & Sansbury, 1974) andcan be predicted by assuming an accelerating trans-ducer function encoding contrast. At higher pedestalamplitudes, the psychometric functions show significantshifts to the right, consistent with the raised thresholds

A.J. Anderson, A.J. Vingrys / Vision Research 40 (2000) 2579–2588 2585
found in the TvC data. A similar pattern is seen for theflickering stimulus presented on a flickering pedestal(Panel c).
The results for the luminance-pedestal flicker stimu-lus are given in Panel b. As expected from the absenceof a facilitory effect in the TvC, the presence of a smallpedestal (thin solid line) has no significant effect on theshape or position of the psychometric function. At thehigher pedestal, the curve shifts rightward, as expected.No significant difference was found between the slopesof the psychometric functions of Panel b, indicatingthat the slope does not alter in the presence of aluminance pedestal.
5. Discussion
The results from Experiment 1 suggest that indepen-dent S-shaped transducer functions exists for both lu-minance and flickering contrasts. This is evident fromthe fact that luminance and flicker pedestals can excitetheir own transducers, causing facilitation, but a lumi-nance pedestal is unable to exert an excitatory effect onthe flicker transducer. Nevertheless, the luminancepedestal is able to elevate flicker thresholds. This latterfinding is consistent with the work of Eisner (1997) whofound that a luminance pedestal suppressed flicker sen-sitivity. The dependence on temporal frequency of theTvC’s upward slope is suggestive of light adaptationand the following section explores how well a model oflocal light adaptation can predict these TvC functions.
5.1. A light adaptation model for luminance-pedestalflicker
If mean-modulated flicker thresholds are determinedat two different background luminances, the adaptationcharacteristic of the flicker response can be described bythe following equation,
A= log�T2
T1
�/log
�B2
B1
�(2)
where B2 and B1 are the higher and lower backgrounds,respectively, and T2 and T1 are the flicker thresholdsobtained at these backgrounds. The adaptation charac-teristic, A, is equivalent to unity under Weberian adap-tation. In luminance-pedestal flicker, we propose thatthe local luminance (i.e. background plus pedestal) isimportant in setting the level of adaptation of theflicker mechanism. A similar argument has been suc-cessfully applied to chromatic stimuli presented onintense luminance pedestals (Cole, Stromeyer & Kro-nauer, 1990). The following equation results:
A= log� Tped
Tmean
�/�B+P
B�
(3)
where Tped and Tmean are the flicker thresholds underluminance-pedestal and mean-modulated conditions re-spectively, B is the background luminance, and P is theluminance pedestal. Solving for Tped gives:
Tped=Tmean×10(A× log(B+P/B)) (4)
Eq. (4) was fitted to the data in Figs. 6 and 7 byminimising the x2 statistic, and is shown by the solidcurves. As the parameter Tmean was set to the mean-modulated flicker threshold, the equation had only onefree parameter, A. It is apparent that this model cancapture the general form of the experimental data. Fig.9 shows how parameters A and Tmean change withtemporal frequency. The adaptation characteristic, A,declines as temporal frequency increases, and is of
Fig. 8. Average psychometric functions for several stimulus/pedestalcombinations. Conditions are: (a) a luminance increment on a lumi-nance pedestal; (b) luminance-pedestal flicker; and (c) a flickeringstimulus on a flickering pedestal. In all panels the solid horizontal lineidentifies the no pedestal baseline. Pedestal magnitudes (cd/m2) areshown by different lines, namely: (a) thin solid line, 0.1; dashed line,2.15; dashed/dotted line, 21.54; (b) thin solid line, 0.46; dashed line,21.54; (c) thin solid line, 0.46; dashed line, 10.

A.J. Anderson, A.J. Vingrys / Vision Research 40 (2000) 2579–25882586
Fig. 9. Parameters A and Tmean from the fitted curves in Fig. 6(circles, central) and Fig. 7 (squares, 15° peripheral). See text fordetails.
Panel b, the local luminance was 25.54 cd/m2 whereasin the zero pedestal condition of Panel c it was 27cd/m2. Given these luminances, a local adaptationmodel would predict similar thresholds. However thedata of Table 1 shows that, although the slopes of thepsychometric functions are not different (3.04 vs. 3.52,P=0.57), the threshold parameter a is significantlyhigher (0.71 vs. 0.38, P=0.05) in the luminance-pedestal condition, contrary to model predictions. Itseems that other factors influence luminance-pedestalflicker thresholds, and these may relate to the loss ofsurround matching (Spehar & Zaidi, 1997) or inhibitoryeffects from surrounding photoreceptors (e.g. Gold-berg, Frumkes & Nygaard, 1983; Alexander & Fish-man, 1984; Coletta & Adams, 1984).
5.2. Determining flicker thresholds
Some psychophysical investigations generate lumi-nance-pedestal flicker by ‘chopping’ a luminance incre-ment, using a 50% duty cycle (for example, Alexander& Fishman, 1984; Coletta & Adams, 1984). The resul-tant flicker has a modulation amplitude of 100% and atime averaged luminance pedestal equivalent to themean-to-peak amplitude of the flicker signal (for exam-ple, Fig. 1, lower panel). If the flicker amplitude isplotted against the pedestal amplitude, the dotted lineson Figs. 6 and 7 result. The thresholds for these stimulican be determined from the intersection of these dottedlines and the TvC functions. As these lines intersect atthresholds similar to the mean-modulated thresholds,this suggests that modulation amplitude thresholds areroughly equivalent for mean-modulated and luminance-pedestal (50% duty cycle) stimuli. The only investiga-tion to concurrently determine flicker thresholds usingmean-modulated and luminance-pedestal stimuli(Frumkes, Lange, Denny & Beczkowska, 1992) foundsimilar thresholds and data patterns for each type offlicker, consistent with our prediction.
Presenting stimuli at eccentricities greater than 15° orat very high temporal frequencies would be expected tomove the intersection point progressively onto the up-ward slope of the TvC function, producing luminance-pedestal flicker thresholds that are elevated whencompared with mean-modulated thresholds. However,of greater importance is the use of luminance-pedestalflicker in the investigation of ocular disease. Lumi-nance-pedestal flicker thresholds have been shown to bereduced in cases of ocular disease and migraine even inthe presence of normal increment thresholds (Mc-Kendrick et al., 1998; Phipps, Guymer & Vingrys, 1999;Vingrys & Pesudovs, 1999). Depending upon how ocu-lar disease affects the shape or position of the TvC, it ispossible that sensitivity losses to luminance-pedestalflicker could be greater than to mean-modulated flicker,allowing earlier detection of disease processes.
consistently higher magnitude for the datapresented eccentrically. The curve for Tmean returns thetemporal sensitivity function to a mean-modulatedstimulus.
Given these results, it seems that the luminancepedestal in luminance-pedestal flicker raises flickerthresholds primarily through a process of light adapta-tion. Consistent with this, the time course of the dura-tion functions (Fig. 2) are similar to those for lightadaptation, as determined by stimulus onset asyn-chrony paradigms (e.g. Crawford, 1947). Likewise, thecapacity of a luminance pedestal to raise thresholds isincreased for eccentric stimuli (Fig. 9, upper panel).This most likely reflects the stimulus appearing physio-logically smaller in the periphery, due to increasedreceptive field dimensions with eccentricity (Hubel &Wiesel, 1974), as it is known that small stimuli candefeat adaptational processes and cause saturating re-sponses (Buss, Hayhoe & Stromeyer, 1982; Tyler & Liu,1996).
However, the adaptation model appears to over-esti-mate thresholds at moderate pedestal amplitudes. Thisis reflected in the Q-statistics for the model (see figurelegends), which are sufficiently low in some cases (B0.001; Press et al., 1992) to suggest that other determi-nants of luminance pedestal-flicker interactions need tobe sought. The failure of local light adaptation to fullyexplain the data can also be seen in the psychometricfunctions of Fig. 8. In the high pedestal condition of
A.J. Anderson, A.J. Vingrys / Vision Research 40 (2000) 2579–2588 2587
5.3. The origin of facilitation
The absence of a facilitory effect in the luminance-pedestal flicker TvCs provides information about theorigin of the facilitory effect seen in the flicker-on-flicker and luminance-on-luminance conditions. Facili-tation has been attributed by some authors, notablyPelli (1985), to a reduction in spatial or temporaluncertainty effected by the presence of the pedestal. Ifthis were true, it would be expected that the pedestalshould reduce uncertainty under all conditions includ-ing luminance-pedestal flicker. However, this was notthe case (Figs. 6 and 7). It is possible that the increasedduration of the luminance pedestal in Fig. 6. (750 vs.200 ms for Fig. 4) resulted in an increase in temporaluncertainty, thereby negating any facilitory effect.However, this is not likely as an extended pedestal (750ms) was able to produce significant facilitation (Fig. 5).It is more likely that facilitation results from an S-shaped transducer encoding contrast within the visualsystem.
Acknowledgements
Dr Joanne Wood (QUT) provided advice on theexperimental protocols. This research was supported byan ARC-SPIRT grant to Algis J. Vingrys.
References
Alexander, K. R., & Fishman, G. A. (1984). Rod–cone interaction inflicker perimetry. British Journal of Ophthalmology, 68, 303–309.
Anastasi, M., Brai, M., Lauricella, M., & Geracitano, R. (1993).Methodological aspects of the application of the Naka–Rushtonequation to clinical electroretinogram. Ophthalmic Research, 25,145–156.
Bodis-Wollner, I., & Hendley, C. D. (1979). On the separability oftwo mechanisms involved in the detection of grating patterns inhumans. Journal of Physiology, 291, 251–263.
Boynton, G. M., & Foley, J. M. (1999). Temporal sensitivity ofhuman luminance pattern mechanisms determined by maskingwith temporally modulated stimuli. Vision Research, 39, 1641–1656.
Buss, C. M., Hayhoe, M. M., & Stromeyer, C. F. III (1982). Lateralinteractions in the control of visual sensitivity. Vision Research,22, 693–709.
Cole, G. R., Stromeyer, C. F. III, & Kronauer, R. E. (1990). Visualinteractions with luminance and chromatic stimuli. Journal of theOptical Society of America, A, 7, 128–140.
Coletta, N. J., & Adams, A. J. (1984). Rod–cone interaction in flickerdetection. Vision Research, 24, 1333–1340.
Cornsweet, T. N., & Pinsker, H. M. (1965). Luminance discrimina-tion of brief flashes under various conditions of adaptation.Journal of Physiology, 176, 294–310.
Crawford, B. H. (1947). Visual adaptation in relation to brief condi-tioning stimuli. Proceedings of the Royal Society of London (Biol-ogy), 134, 283–302.
DeLange, H. (1958). Research into the dynamic nature of the humanfovea–cortex systems with intermittent and modulated light. I.Attenuation characteristics with white and colored light. Journalof the Optical Society of America, 48, 777–784.
Eisner, A. (1995). Suppression of flicker response with increasing testilluminance: roles of temporal waveform, modulation depth andfrequency. Journal of the Optical Society of America, A, 12,214–224.
Eisner, A (1997). Equivalence of temporal frequency and modulationdepth for flicker response suppression: preliminary results. In V.Lakshminarayanan Jr, Basic and clinical applications of 6isionscience (pp. 149–152). Dordrecht: Kluwer.
Eisner, A., Shapiro, A. G., & Middleton, J. (1998). Equivalencebetween temporal frequency and modulation depth for flickerresponse suppression: analysis of a three-process model of visualadaptation. Journal of the Optical Society of America, A, 15,1987–2002.
Foley, J. M. (1994). Human luminance pattern-vision mechanisms:masking experiments require a new model. Journal of the OpticalSociety of America, A, 11, 1710–1719.
Foley, J. M., & Legge, G. E. (1981). Contrast detection and near-threshold discrimination in human vision. Vision Research, 21,1041–1053.
Frumkes, T., Lange, G., Denny, N., & Beczkowska, I. (1992). Influ-ence of rod adaptation upon cone responses to light offset inhumans. I. Results in normal observers. Visual Neuroscience, 8,83–89.
Georgeson, M. A., & Georgeson, J. M. (1987). Facilitation andmasking of briefly presented gratings: time-course and contrastdependence. Vision Research, 27, 369–379.
Goldberg, S. H., Frumkes, T. E., & Nygaard, R. W. (1983). In-hibitory influence of unstimulated rods in the human retina:evidence provided by examining cone flicker. Science, 221, 180–182.
Hart, W. M. Jr (1987). The temporal responsiveness of vision. In R.Moses, & W. Hart, Adler ’s physiology of the eye (pp. 429–457).St. Louis: The CV Mosby Company.
Hubel, D. H., & Wiesel, T. N. (1974). Uniformity of monkey striatecortex: a parallel relationship between field size, scatter andmagnification factor. Journal of Comparati6e Neurology, 158,295–305.
Kelly, D. H. (1961). Visual responses to time-dependant stimuli I.Amplitude sensitivity measurements. Journal of the Optical Soci-ety of America, 51, 422–429.
Keppel, G. (1991). Design and analysis: a researcher ’s handbook (pp.351–353). New Jersey: Prentice Hall.
King-Smith, P. E., Grigsby, S. S., Vingrys, A. J., Benes, S. C., &Supowit, A. (1994). Efficient and unbiased modifications of theQUEST threshold method: theory, simulations, experimental eval-uation and practical implementation. Vision Research, 34, 885–912.
Maloney, L. T. (1990). Confidence intervals for the parameters ofpsychometric functions. Perception and Psychophysics, 47, 127–134.
McKendrick, A. M., Badcock, D. R., Heywood, J., & Vingrys, A. J.(1998). Effects of migraine on visual function. Australian and NewZealand Journal of Ophthalmology, 26, S111–S113.
Metha, A. B., Vingrys, A. J., & Badcock, D. R. (1993). Calibration ofa color monitor for visual psychophysics. Beha6iour ResearchMethods, Instruments and Computers, 25, 371–383.
Nachmias, J., & Sansbury, R. V. (1974). Grating contrast: discrimina-tion may be better than detection. Vision Research, 14, 1039–1042.
Pantle, A. J. (1983). Temporal determinants of spatial sine-wavemasking. Vision Research, 23, 749–757.
Pelli, D. G. (1985). Uncertainty explains many aspects of visualcontrast detection and discrimination. Journal of the OpticalSociety of America, A, 2, 1508–1531.

A.J. Anderson, A.J. Vingrys / Vision Research 40 (2000) 2579–25882588
Phipps, J. A., Guymer, R. H., & Vingrys, A. J. (1999). Temporalsensitivity deficits in patients with high-risk drusen. Australian andNew Zealand Journal of Ophthalmology, 27, 265–267.
Press, W. H., Teukolsky, S. A., Vetterling, W. T., & Flannery, B. P.(1992). Numerical recipes in C. The art of scientific computing (pp.659–661). Cambridge: Cambridge University Press.
Ross, J., & Speed, H. D. (1991). Contrast adaptation and contrastmasking in human vision. Proceedings of the Royal Society ofLondon, B, 246, 61–69.
Roufs, J. A. J. (1972). Dynamic properties of vision-I. Experimentalrelationships between flicker and flash thresholds. Vision Re-search, 12, 261–278.
Spehar, B., & Zaidi, Q. (1997). Surround effects on the shape of thetemporal contrast sensitivity function. Journal of the OpticalSociety of America, A, 14, 2517–2525.
Stromeyer, C. F. III, Kronauer, R. E., Madsen, J. C., & Klein, S. A.(1984). Opponent-movement mechanisms in human vision. Jour-nal of the Optical Society of America, A, 1, 876–884.
Switkes, E., Bradley, A., & DeValois, K. K. (1988). Contrast depen-dence and mechanisms of masking interaction among chromaticand luminance gratings. Journal of the Optical Society of America,A, 15, 1149–1162.
Tyler, C. W., & Liu, L. (1996). Saturation revealed by clamping thegain of the retinal light response. Vision Research, 36, 2553–2562.
Vingrys, A. J., Demirel, S., & Kalloniatis, M. (1995). Multi-dimen-sional color, flicker and increment perimetry. In: R. Mills, & M.Wall. Perimetry update 1994/95. Proceedings of the XIth Interna-tional Perimetric Society Meeting (pp. 159–166). Amsterdam:Kugler Publications.
Vingrys, A. J., & Pesudovs, K. (1999). Localized scotomata detectedwith temporal modulation perimetry in central serous chori-oretinopathy. Australian and New Zealand Journal of Ophthalmol-ogy, 27, 109–116.
Watson, A. B. (1979). Probability summation over time. VisionResearch, 19, 515–522.
Whittle, P. (1986). Increments and decrements: luminance discrimina-tion. Vision Research, 26, 1677–1691.
Whittle, P., & Swanston, M. J. (1974). Luminance discrimination ofseparated flashes: the effect of background luminance and theshapes of T.V.I. curves. Vision Research, 14, 713–719.
Wilson, H. R. (1980). A transducer function for threshold andsuprathreshold human vision. Biological Cybernetics, 38, 171–178.
Yang, J., & Makous, W. (1995). Modeling pedestal experiments withamplitude instead of contrast. Vision Research, 35, 1979–1989.
.


