Embed Size (px)
Citation preview
INTERCOLLEGIATE ATHLETES AND EFFECTIVEEDUCATIONAL PRACTICES: Winning Combinationor Losing Effort?
Paul D. Umbach,*,§ Megan M. Palmer,** George D. Kuh,†and Stephanie J. Hannah‡
................................................................................................................................................................................................
Scrutiny of intercollegiate athletics has intensified in recent years. This studycompares student-athletes with those of non-athletes in terms of their engagementin effective educational practices. Contrary to many reports in the popular media,the findings from this study indicate that, on balance, student-athletes across alarge number of colleges and universities do not differ greatly from their peers interms of their participation in effective educational practices. In most instances,when differences do exist, they favor athletes.
................................................................................................................................................................................................KEY WORDS: student-athletes; student engagement; effective education practices.
INTRODUCTION
Intercollegiate athletics at colleges and universities have been referredto as ‘‘American higher education’s ‘peculiar institution.’ Their presenceis pervasive, yet their proper balance with academics remains puzzling’’(Thelin, 1994, p. 1). For a host of reasons, scrutiny of this ‘‘peculiarinstitution’’—intercollegiate athletics—has intensified in recent years.Such articles as ‘‘Jock Majors’’ (Suggs, 2003a) and ‘‘Grades and Money’’(Suggs, 2003b) lament that academics and athletics are out of balance.
*Department of Educational Policy and Leadership Studies, University of Iowa, Iowa, IA,
USA.
**Indiana University Purdue University Indianapolis, Indianapolis, IN, USA.
�Indiana University Center for Postsecondary Research, Bloomington, IN, USA.
�National Collegiate Athletic Association, Indianapolis, IN, USA.
§Address correspondence to: Paul D. Umbach, Department of Educational Policy and
Leadership Studies, University of Iowa, N491 Lindquist Center, Iowa, IA 52242-1529, USA.
E-mail: [email protected]
709
0361-0365 ⁄ 06 ⁄ 0900-0709 ⁄ 0 � 2006 Springer Science+Business Media, Inc.
Research in Higher Education, Vol. 47, No. 6, September 2006 (� 2006)DOI: 10.1007/s11162-006-9012-9
The recent scandal at the University of Colorado, Boulder (Jacobson,2004) highlights the almost weekly reports of problems in athleticdepartments across the country. Calls for reforms (e.g., Bowen andLevin, 2003) are coming from inside and outside the academy as wellas from the National Collegiate Athletics Association (NCAA)national office. Even federal legislation has been contemplated to bringintercollegiate athletics back into proper perspective.Some of the most scathing and influential critiques of college athletics
are by Shulman and Bowen (2001) and Bowen and Levin (2003). Theirresearch suggests that student-athletes routinely receive preferentialtreatment in the admissions process and are more likely to be academi-cally under-prepared than their peers. As a result, student-athletes earnlower grades in college. Additionally, they argue that institutions allowstudent-athletes to create their own subculture and that it flourishes,isolated and insulated from the larger campus culture.
PREVIOUS RESEARCH ON THE COLLEGE EXPERIENCEOF STUDENT-ATHLETES
The findings from studies other than Shulman and Bowen (2001) andBowen and Levin (2003) are somewhat less pejorative in terms of theeffects of participating in intercollegiate athletics on the quality of theundergraduate experience. For example, competing in intercollegiatesports appears to have little influence on such college outcomes as learn-ing for self-understanding, higher-order cognitive activities, and motiva-tion to succeed academically (Wolniak, Pierson, and Pascarella, 2001).Other studies reveal no differences between student-athletes and non-athletes with regard to cognitive development (Pascarella, Bohr, Nora,and Terenzini, 1995; Terenzini, Pascarella, and Blimling, 1996), gradesin college (Hood, Craig, and Ferguson, 1992), or time devoted tostudying or attending class (Richards and Aries, 1999). For example,Richards and Aries found no significant difference in GPA betweenathletes and non-athletes despite the fact that athletes entered collegewith significantly lower SAT scores. But other studies, like the work ofShulman and Bowen (2001) and Bowen and Levine (2003), report thatstudent-athletes competing in Division III athletics at Ivy League insti-tutions perform at lower levels academically than non-athletes. Suchdifferences are less evident for female student-athletes and student-ath-letes in non-revenue generating sports (Pascarella et al., 1999) as com-pared to male student-athletes and athletes playing revenue-generatingsports, such as football and men’s basketball.
710 UMBACH, PALMER, KUH, AND HANNAH
The NCAA suggests that colleges and universities are to maintain anenvironment in which the athlete and the athletics program play anessential role in the student body, thereby creating social bonds betweenand among student-athlete and non-athlete (National Collegiate AthleticAssociation [NCAA], n.d.). Yet, concerns remain that participating inintercollegiate athletics may lead to social isolation (Riemer, Beal, andSchroeder, 2000; Wolf-Wendel, Toma, and Morphew, 2001). For exam-ple, spending time with teammates may strengthen bonds betweenathletes, but limit interaction with non-athletes (Wolf-Wendel et al.,2001). Despite this possible isolation, numerous researchers havereported that student-athletes were often more satisfied and involvedthan their non-athlete peers (Astin, 1993; Pascarella and Smart, 1991;Ryan, 1989). In addition, the findings are mixed in terms of whetherparticipating in athletics is negatively associated with self-understandingand openness to diversity (Wolniak et al., 2001), or whether student-athletes interact effectively with people from diverse backgroundsbecause ‘‘athletes compete with and against people from socioeconomic,racial and ethnic, and religious backgrounds other than theirs’’ (Wolf-Wendel et al., 2001, p. 385).Given their demanding training and practice routines, it’s not
surprising that student-athletes devote significantly more time to extra-curricular activities than members of other groups and have acquiredvaluable time management skills (Richards and Aries, 1999). Even so,in his study of NCAA Division III male basketball players at a small,private, liberal arts college, Schroeder (2000) concluded that athleteswere highly engaged in their academics, spending an average of15 hours per week studying with the majority earning grade pointaverages exceeding 3.0.While the harsh critiques of Shulman and Bowen (2001) and Bowen
and Levin (2003) may apply to some athletics programs and institu-tions, not enough is known about the extent to which intercollegiateathletes devote time and energy to activities that are empirically linkedto desired outcomes of college. Most of the previous work on the colle-giate experiences of student-athletes focuses on a small segment of high-er education drawing from elite Ivy League colleges (Bowen and Levin,2003; Shulman and Bowen, 2001) or the experiences of athletes at onlya small number of institutions (Pascarella et al., 1995, 1999; Wolniaket al., 2001). Thus, it is difficult to get a clear, definitive grasp of thenature and quality of the undergraduate experiences of intercollegiateathletes across a large number of colleges and universities and whetherathletes are, as some claim, shortchanged in terms of learning andpersonal development.
INTERCOLLEGIATE ATHLETES AND EFFECTIVE EDUCATIONAL PRACTICES 711
STUDENT ENGAGEMENT
According to Pascarella and Terenzini (2005), the impact of college islargely determined by the degree to which students engage in various in-class and out-of-class activities. Student engagement is a function of boththe individual effort of each student and institutional practices and poli-cies that encourage students to participate in educationally purposefulactivities (Astin, 1993; Kuh, 2001; Kuh et al., 2005; Pace, 1984, Pascarellaand Terenzini, 1991, 2005). Such activities range from traditionalacademic pursuits, such as reading and writing, preparing for class, andinteracting with instructors about various matters as well as other activi-ties considered important outcomes of college, such as learning how toeffectively collaborate with peers on problem solving tasks and workingproductively together in community service activities (Kuh, 2001). Thus,participating in educationally purposeful activities directly influences thequality of students’ learning and their overall educational experience. Inaddition, ‘‘students who are involved in educationally productive activi-ties in college are developing habits of the mind and heart that enlargetheir capacity for continuous learning and personal development’’ (Kuh,2003, p. 24). Edgerton and Shulman (2002, p. 4) extend the concept ofengagement, proposing it as a desired end in itself as well as an indirectindicator of learning (see also Shulman, 2002):
We need to learn more about the forms and conditions of engagement that relateto student competence and commitment in arenas of practice. There are impor-tant questions, too, about engagement not as a means to an end...but as an expe-rience worth having in itself. We go to the symphony, after all, not to improveourselves but to hear the music, to have the experience. Similarly, there are as-pects of the college experience—participating in a seminar, for instance, or a rolein student governance—that have a kind of value we have not yet learned todescribe in detail or to document.
PURPOSE OF THE STUDY
This study compares the engagement of student-athletes in effectiveeducational practices with that of their non-athlete counterparts byusing a national sample of undergraduates. Three research questions,derived from the theories that underpin the construct of student engage-ment, guide the study:
1. How do the educational experiences of student-athletes compare withthose of non-athletes?
2. If the experiences of student-athletes differ from those of non-ath-letes, do these differences vary significantly by institution attended?
712 UMBACH, PALMER, KUH, AND HANNAH
3. What is the relationship between the level of competition (NCAAdivision, NAIA membership) and engagement in good practices inundergraduate education, perceptions of the campus environment,and self reported gains?
METHODS
Data Source and Instrument
We use data from The National Survey of Student Engagement(NSSE) to compare the collegiate experiences of student-athletes withthose of their non-athlete peers. Pace’s (1984) concept of quality ofstudent effort, Chickering and Gamson’s (1987) ‘‘Seven Principles ofGood Practice in Undergraduate Education,’’ and Astin’s (1984) theoryof student involvement serve as the foundation from which the concep-tual framework of NSSE was drawn.The NSSE database is especially well-suited for this study because as
previously discussed, research on the college student experience indicatesthat students learn more when they are engaged at reasonably highlevels in a variety of educationally purposeful activities (Astin, 1984;Kuh et al., 1991; Kuh, Douglas, Lund, and Ramin-Gyurnek, 1994;Pascarella and Terenzini, 1991, 2005; Tinto, 1987).NSSE was specifically designed to assess the extent to which students
engage in empirically derived good educational practices and what theygain from their college experience (Kuh, 2001). Although NSSE doesnot assess student learning outcomes directly, the main content of theNSSE instrument, The College Student Report, represents studentbehaviors that are highly correlated with many desirable learning andpersonal development outcomes of college.NSSE collects information directly from random samples of first-year
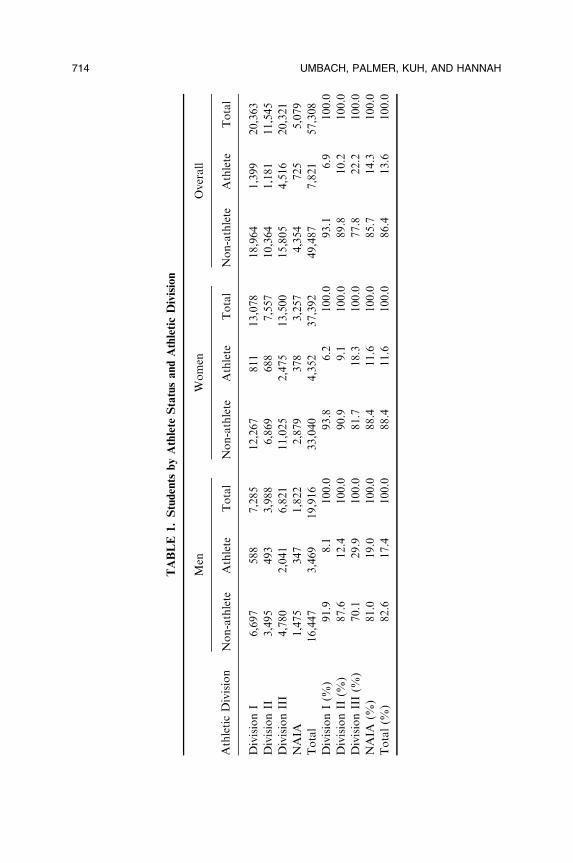
and senior undergraduates at four-year institutions. Because of thepotential bias introduced among student-athletes due to attrition to thesenior year, this study focuses only on first-year students. Table 1displays student-athlete status,1 gender, and athletic division for thesample used for the study. Included in the sample are 57,308 undergrad-uate students—7,821 student-athletes and 49,407 non-athletes—whocompleted NSSE in the spring of 2003. Students from 395 four-year col-leges and universities were represented. Of these institutions, 107 areNCAA Division I, 93 are NCAA Division II, 145 are NCAA DivisionIII, and 50 are NAIA schools.
INTERCOLLEGIATE ATHLETES AND EFFECTIVE EDUCATIONAL PRACTICES 713
TABLE
1.Students
byAthlete
StatusandAthleticDivision
AthleticDivision
Men
Women
Overall
Non-athlete
Athlete
Total
Non-athlete
Athlete
Total
Non-athlete
Athlete
Total
DivisionI
6,697
588
7,285
12,267
811
13,078
18,964
1,399
20,363
DivisionII
3,495
493
3,988
6,869
688
7,557
10,364
1,181
11,545
DivisionIII
4,780
2,041
6,821
11,025
2,475
13,500
15,805
4,516
20,321
NAIA
1,475
347
1,822
2,879
378
3,257
4,354
725
5,079
Total
16,447
3,469
19,916
33,040
4,352
37,392
49,487
7,821
57,308
DivisionI(%
)91.9
8.1
100.0
93.8
6.2
100.0
93.1
6.9
100.0
DivisionII
(%)
87.6
12.4
100.0
90.9
9.1
100.0
89.8
10.2
100.0
DivisionIII(%
)70.1
29.9
100.0
81.7
18.3
100.0
77.8
22.2
100.0
NAIA
(%)
81.0
19.0
100.0
88.4
11.6
100.0
85.7
14.3
100.0
Total(%
)82.6
17.4
100.0
88.4
11.6
100.0
86.4
13.6
100.0
714 UMBACH, PALMER, KUH, AND HANNAH
Data Analysis
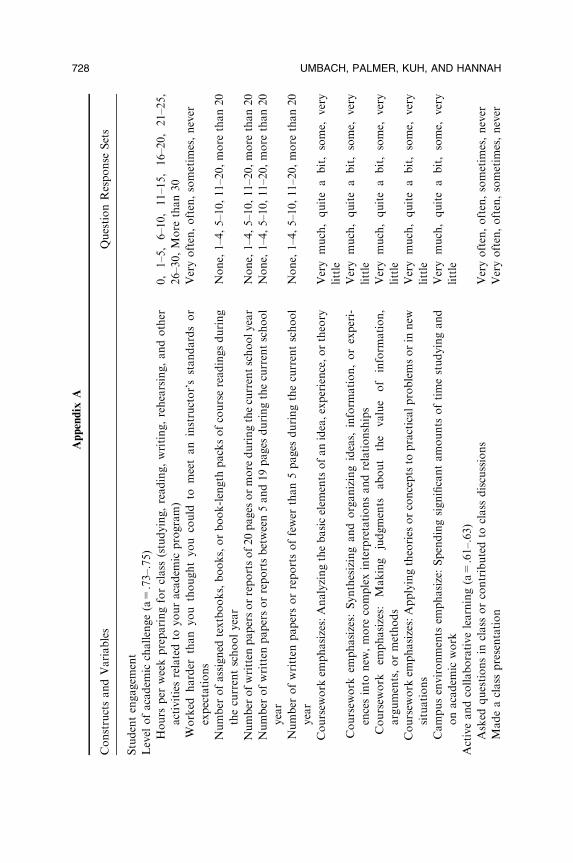
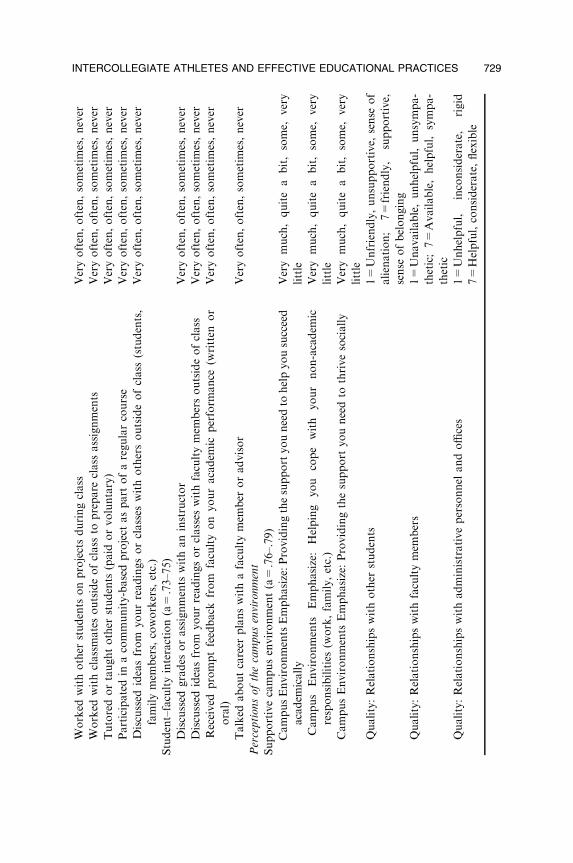
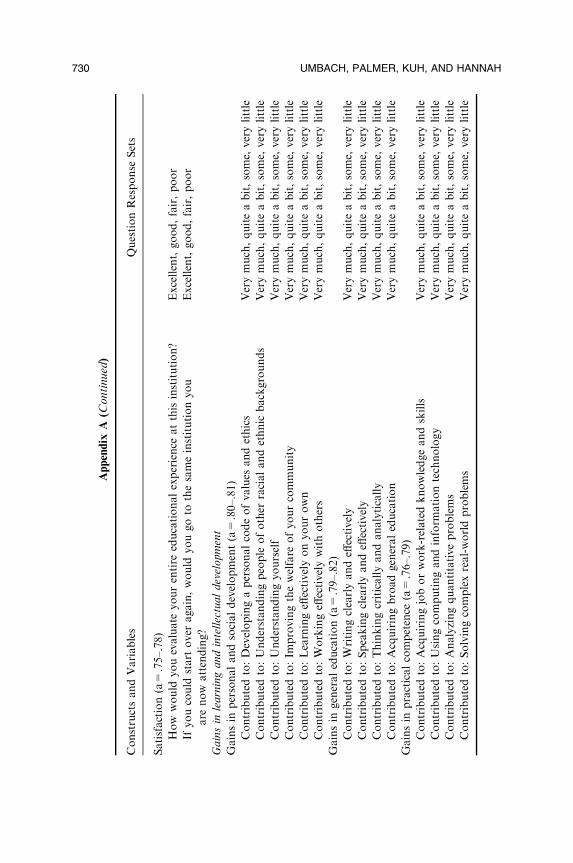
We conducted a series of hierarchical linear models (HLM) to explorethe effects of being a student-athlete on the collegiate experience. Thedependent variables fall into four categories: student engagement, per-ceptions of campus environment, self-reported gains, and grade pointaverage. Student engagement is measured using three scales: (1) levelacademic challenge, (2) student–faculty interactions, and (3) active andcollaborative learning (see Appendix A for a listing of the constructsused as dependent variables in the models and the items contributing toeach measure). The perceived campus environment category includestwo measures: a supportive campus environment scale and an overallsatisfaction with college scale. Students’ gains in learning and intellec-tual development are represented by three scales: gains in personal andsocial development, gains in general education knowledge, and gains inpractical competencies. Our final set of models predicts student-reportedgrades.2
Pascarella et al. (1995, 1999) and Wolniak et al. (2001) have notedthat studies collegiate experiences of student athletes should account forboth individual background characteristics (e.g., race/ethnicity, socialorigins) and institutional contexts (e.g., NCAA division). This followsthe logic of Astin (1993), Kuh (2001), Kuh et al. (2005), Pace (1984),and Pascarella and Terenzini (1991, 2005), that student engagement isboth a function of the individual effort of each student and institutionalpractices and policies. However, as we have noted, previous researchstudying student athletes often deals with small numbers of institutionspreventing researchers from making any confident claims about theeffect that institutions might have on the college experiences of collegeathletes.Additionally, much of the previous work may have used inappropri-
ate statistical procedures to estimate college effects. In most studies oforganizational or institutional effects, researchers must decide about theappropriate unit of analysis (Hu and Kuh, 2004; Raudenbush and Bryk,2002). Should they build regression models by aggregating to the insti-tution level, or should they attach institution-level characteristics toindividuals? If researchers build models at the institution level, they areprone to the ‘‘ecologically fallacy,’’ whereby individual differences aremasked (Hu and Kuh, 2003; King, 1999; Kreft and De Leeuw, 1998).For example, an analysis aggregated to the college level might revealthat athletes at Division III institutions are more engaged in effectiveeducational practices than students at Division I institutions; yet ananalysis of Division I colleges might reveal that athletes are as engaged
INTERCOLLEGIATE ATHLETES AND EFFECTIVE EDUCATIONAL PRACTICES 715
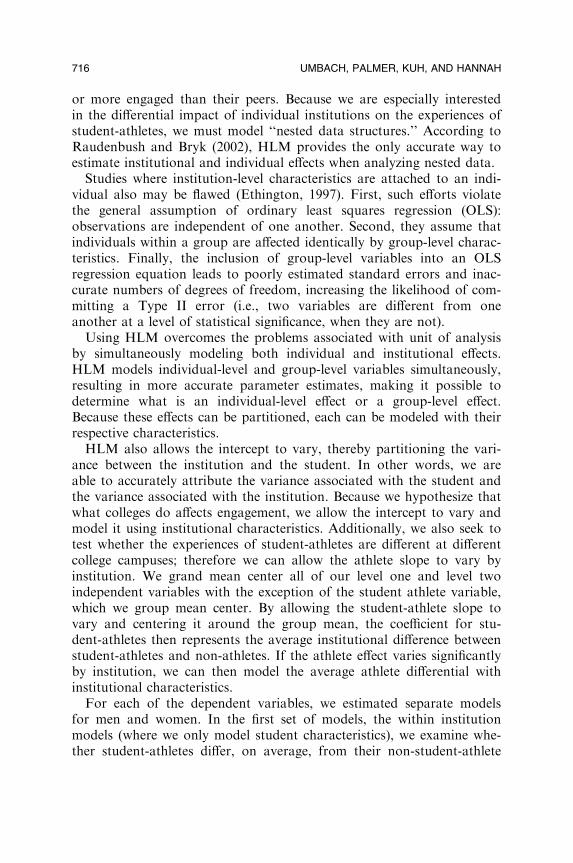
or more engaged than their peers. Because we are especially interestedin the differential impact of individual institutions on the experiences ofstudent-athletes, we must model ‘‘nested data structures.’’ According toRaudenbush and Bryk (2002), HLM provides the only accurate way toestimate institutional and individual effects when analyzing nested data.Studies where institution-level characteristics are attached to an indi-
vidual also may be flawed (Ethington, 1997). First, such efforts violatethe general assumption of ordinary least squares regression (OLS):observations are independent of one another. Second, they assume thatindividuals within a group are affected identically by group-level charac-teristics. Finally, the inclusion of group-level variables into an OLSregression equation leads to poorly estimated standard errors and inac-curate numbers of degrees of freedom, increasing the likelihood of com-mitting a Type II error (i.e., two variables are different from oneanother at a level of statistical significance, when they are not).Using HLM overcomes the problems associated with unit of analysis
by simultaneously modeling both individual and institutional effects.HLM models individual-level and group-level variables simultaneously,resulting in more accurate parameter estimates, making it possible todetermine what is an individual-level effect or a group-level effect.Because these effects can be partitioned, each can be modeled with theirrespective characteristics.HLM also allows the intercept to vary, thereby partitioning the vari-
ance between the institution and the student. In other words, we areable to accurately attribute the variance associated with the student andthe variance associated with the institution. Because we hypothesize thatwhat colleges do affects engagement, we allow the intercept to vary andmodel it using institutional characteristics. Additionally, we also seek totest whether the experiences of student-athletes are different at differentcollege campuses; therefore we can allow the athlete slope to vary byinstitution. We grand mean center all of our level one and level twoindependent variables with the exception of the student athlete variable,which we group mean center. By allowing the student-athlete slope tovary and centering it around the group mean, the coefficient for stu-dent-athletes then represents the average institutional difference betweenstudent-athletes and non-athletes. If the athlete effect varies significantlyby institution, we can then model the average athlete differential withinstitutional characteristics.For each of the dependent variables, we estimated separate models
for men and women. In the first set of models, the within institutionmodels (where we only model student characteristics), we examine whe-ther student-athletes differ, on average, from their non-student-athlete
716 UMBACH, PALMER, KUH, AND HANNAH
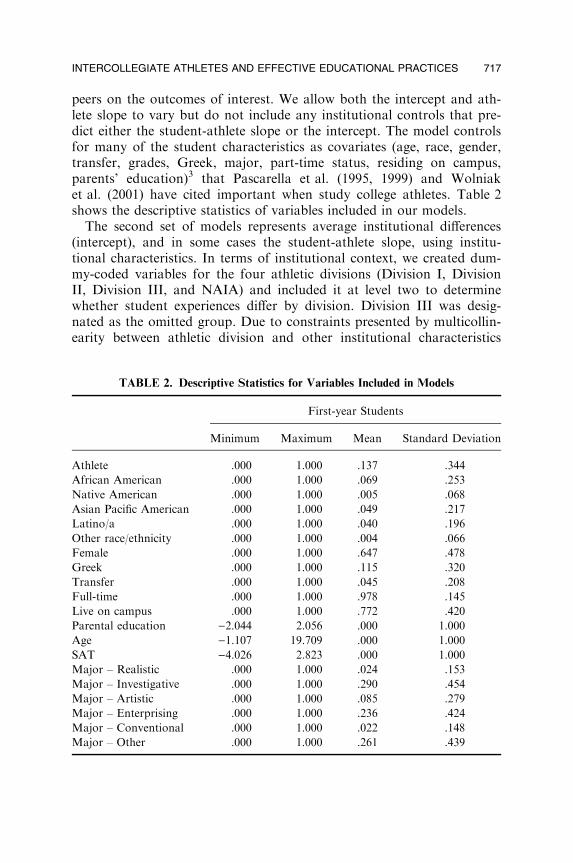
peers on the outcomes of interest. We allow both the intercept and ath-lete slope to vary but do not include any institutional controls that pre-dict either the student-athlete slope or the intercept. The model controlsfor many of the student characteristics as covariates (age, race, gender,transfer, grades, Greek, major, part-time status, residing on campus,parents’ education)3 that Pascarella et al. (1995, 1999) and Wolniaket al. (2001) have cited important when study college athletes. Table 2shows the descriptive statistics of variables included in our models.The second set of models represents average institutional differences
(intercept), and in some cases the student-athlete slope, using institu-tional characteristics. In terms of institutional context, we created dum-my-coded variables for the four athletic divisions (Division I, DivisionII, Division III, and NAIA) and included it at level two to determinewhether student experiences differ by division. Division III was desig-nated as the omitted group. Due to constraints presented by multicollin-earity between athletic division and other institutional characteristics
TABLE 2. Descriptive Statistics for Variables Included in Models
First-year Students
Minimum Maximum Mean Standard Deviation
Athlete .000 1.000 .137 .344
African American .000 1.000 .069 .253
Native American .000 1.000 .005 .068
Asian Pacific American .000 1.000 .049 .217
Latino/a .000 1.000 .040 .196
Other race/ethnicity .000 1.000 .004 .066
Female .000 1.000 .647 .478
Greek .000 1.000 .115 .320
Transfer .000 1.000 .045 .208
Full-time .000 1.000 .978 .145
Live on campus .000 1.000 .772 .420
Parental education )2.044 2.056 .000 1.000
Age )1.107 19.709 .000 1.000
SAT )4.026 2.823 .000 1.000
Major – Realistic .000 1.000 .024 .153
Major – Investigative .000 1.000 .290 .454
Major – Artistic .000 1.000 .085 .279
Major – Enterprising .000 1.000 .236 .424
Major – Conventional .000 1.000 .022 .148
Major – Other .000 1.000 .261 .439
INTERCOLLEGIATE ATHLETES AND EFFECTIVE EDUCATIONAL PRACTICES 717
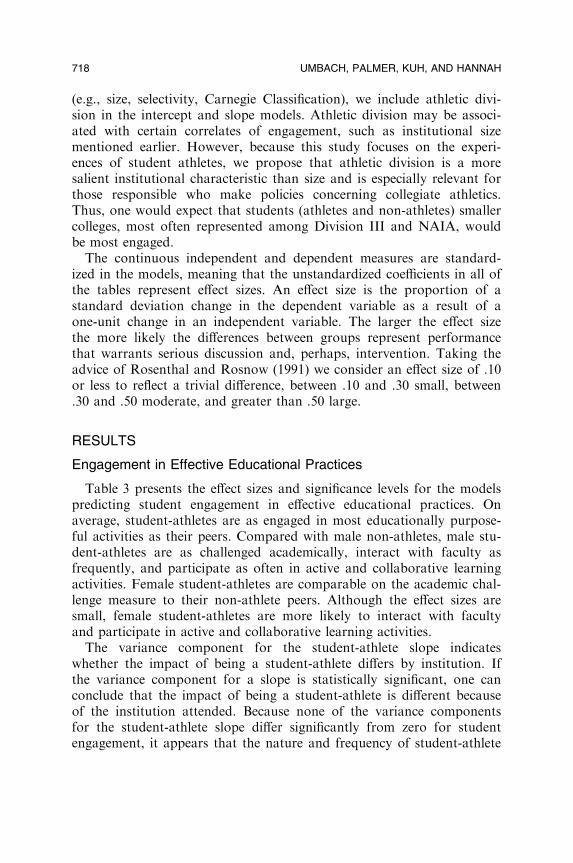
(e.g., size, selectivity, Carnegie Classification), we include athletic divi-sion in the intercept and slope models. Athletic division may be associ-ated with certain correlates of engagement, such as institutional sizementioned earlier. However, because this study focuses on the experi-ences of student athletes, we propose that athletic division is a moresalient institutional characteristic than size and is especially relevant forthose responsible who make policies concerning collegiate athletics.Thus, one would expect that students (athletes and non-athletes) smallercolleges, most often represented among Division III and NAIA, wouldbe most engaged.The continuous independent and dependent measures are standard-
ized in the models, meaning that the unstandardized coefficients in all ofthe tables represent effect sizes. An effect size is the proportion of astandard deviation change in the dependent variable as a result of aone-unit change in an independent variable. The larger the effect sizethe more likely the differences between groups represent performancethat warrants serious discussion and, perhaps, intervention. Taking theadvice of Rosenthal and Rosnow (1991) we consider an effect size of .10or less to reflect a trivial difference, between .10 and .30 small, between.30 and .50 moderate, and greater than .50 large.
RESULTS
Engagement in Effective Educational Practices
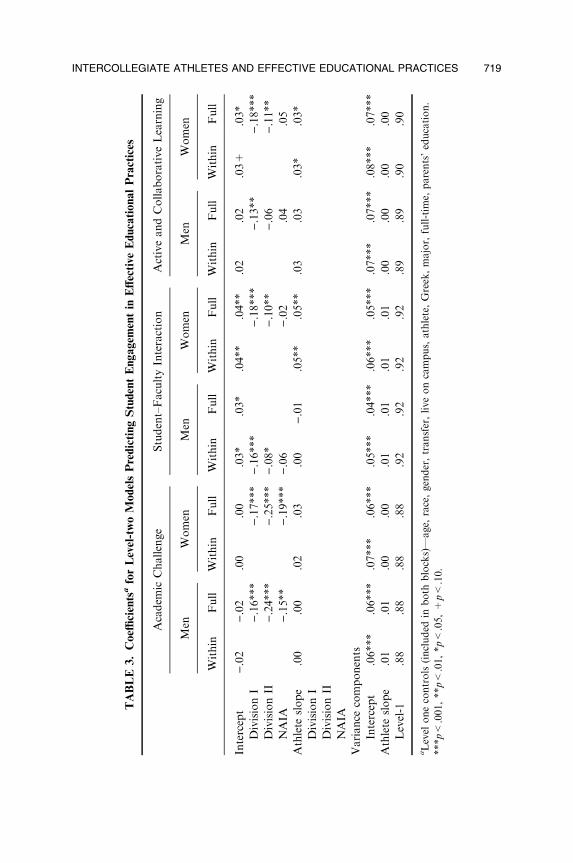
Table 3 presents the effect sizes and significance levels for the modelspredicting student engagement in effective educational practices. Onaverage, student-athletes are as engaged in most educationally purpose-ful activities as their peers. Compared with male non-athletes, male stu-dent-athletes are as challenged academically, interact with faculty asfrequently, and participate as often in active and collaborative learningactivities. Female student-athletes are comparable on the academic chal-lenge measure to their non-athlete peers. Although the effect sizes aresmall, female student-athletes are more likely to interact with facultyand participate in active and collaborative learning activities.The variance component for the student-athlete slope indicates
whether the impact of being a student-athlete differs by institution. Ifthe variance component for a slope is statistically significant, one canconclude that the impact of being a student-athlete is different becauseof the institution attended. Because none of the variance componentsfor the student-athlete slope differ significantly from zero for studentengagement, it appears that the nature and frequency of student-athlete
718 UMBACH, PALMER, KUH, AND HANNAH
TABLE
3.Coeffi
cientsaforLevel-twoModelsPredictingStudentEngagem
entin
Effective
EducationalPractices
Academ
icChallenge
Student–FacultyInteraction
ActiveandCollaborativeLearning
Men
Women
Men
Women
Men
Women
Within
Full
Within
Full
Within
Full
Within
Full
Within
Full
Within
Full
Intercept
).02
).02
.00
.00
.03*
.03*
.04**
.04**
.02
.02
.03+
.03*
DivisionI
).16***
).17***
).16***
).18***
).13**
).18***
DivisionII
).24***
).25***
).08*
).10**
).06
).11**
NAIA
).15**
).19***
).06
).02
.04
.05
Athlete
slope
.00
.00
.02
.03
.00
).01
.05**
.05**
.03
.03
.03*
.03*
DivisionI
DivisionII
NAIA
Variance
components
Intercept
.06***
.06***
.07***
.06***
.05***
.04***
.06***
.05***
.07***
.07***
.08***
.07***
Athlete
slope
.01
.01
.00
.00
.01
.01
.01
.01
.00
.00
.00
.00
Level-1
.88
.88
.88
.88
.92
.92
.92
.92
.89
.89
.90
.90
aLevel
onecontrols(included
inboth
blocks)—age,
race,gender,transfer,liveoncampus,athlete,Greek,major,full-tim
e,parents’education.
***p<
.001,**p<
.01,*p<
.05,+p<
.10.
INTERCOLLEGIATE ATHLETES AND EFFECTIVE EDUCATIONAL PRACTICES 719
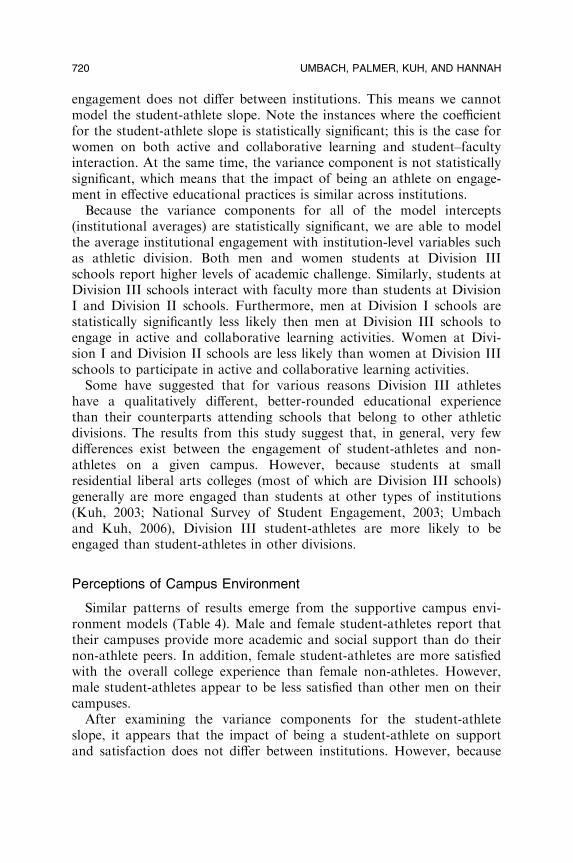
engagement does not differ between institutions. This means we cannotmodel the student-athlete slope. Note the instances where the coefficientfor the student-athlete slope is statistically significant; this is the case forwomen on both active and collaborative learning and student–facultyinteraction. At the same time, the variance component is not statisticallysignificant, which means that the impact of being an athlete on engage-ment in effective educational practices is similar across institutions.Because the variance components for all of the model intercepts
(institutional averages) are statistically significant, we are able to modelthe average institutional engagement with institution-level variables suchas athletic division. Both men and women students at Division IIIschools report higher levels of academic challenge. Similarly, students atDivision III schools interact with faculty more than students at DivisionI and Division II schools. Furthermore, men at Division I schools arestatistically significantly less likely then men at Division III schools toengage in active and collaborative learning activities. Women at Divi-sion I and Division II schools are less likely than women at Division IIIschools to participate in active and collaborative learning activities.Some have suggested that for various reasons Division III athletes
have a qualitatively different, better-rounded educational experiencethan their counterparts attending schools that belong to other athleticdivisions. The results from this study suggest that, in general, very fewdifferences exist between the engagement of student-athletes and non-athletes on a given campus. However, because students at smallresidential liberal arts colleges (most of which are Division III schools)generally are more engaged than students at other types of institutions(Kuh, 2003; National Survey of Student Engagement, 2003; Umbachand Kuh, 2006), Division III student-athletes are more likely to beengaged than student-athletes in other divisions.
Perceptions of Campus Environment
Similar patterns of results emerge from the supportive campus envi-ronment models (Table 4). Male and female student-athletes report thattheir campuses provide more academic and social support than do theirnon-athlete peers. In addition, female student-athletes are more satisfiedwith the overall college experience than female non-athletes. However,male student-athletes appear to be less satisfied than other men on theircampuses.After examining the variance components for the student-athlete
slope, it appears that the impact of being a student-athlete on supportand satisfaction does not differ between institutions. However, because
720 UMBACH, PALMER, KUH, AND HANNAH
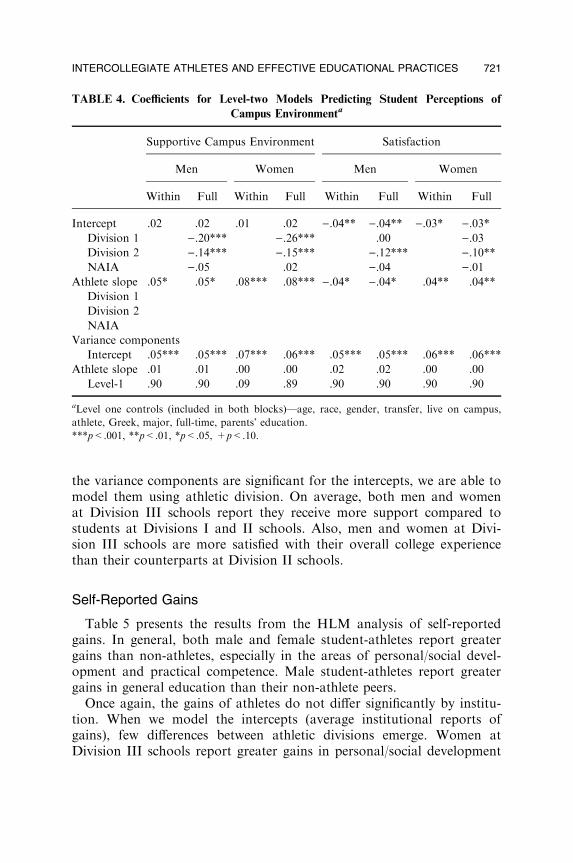
the variance components are significant for the intercepts, we are able tomodel them using athletic division. On average, both men and womenat Division III schools report they receive more support compared tostudents at Divisions I and II schools. Also, men and women at Divi-sion III schools are more satisfied with their overall college experiencethan their counterparts at Division II schools.
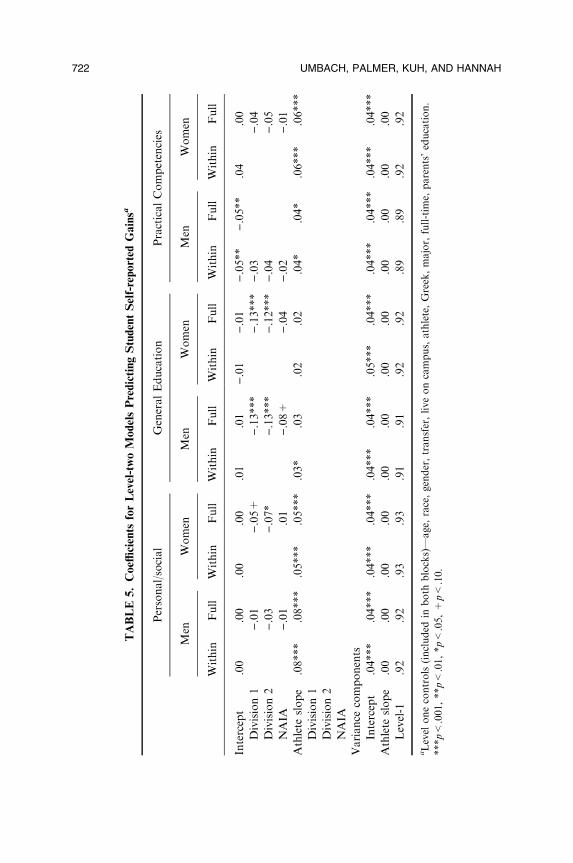
Self-Reported Gains
Table 5 presents the results from the HLM analysis of self-reportedgains. In general, both male and female student-athletes report greatergains than non-athletes, especially in the areas of personal/social devel-opment and practical competence. Male student-athletes report greatergains in general education than their non-athlete peers.Once again, the gains of athletes do not differ significantly by institu-
tion. When we model the intercepts (average institutional reports ofgains), few differences between athletic divisions emerge. Women atDivision III schools report greater gains in personal/social development
TABLE 4. Coefficients for Level-two Models Predicting Student Perceptions of
Campus Environmenta
Supportive Campus Environment Satisfaction
Men Women Men Women
Within Full Within Full Within Full Within Full
Intercept .02 .02 .01 .02 ).04** ).04** ).03* ).03*Division 1 ).20*** ).26*** .00 ).03Division 2 ).14*** ).15*** ).12*** ).10**NAIA ).05 .02 ).04 ).01
Athlete slope .05* .05* .08*** .08*** ).04* ).04* .04** .04**
Division 1
Division 2
NAIA
Variance components
Intercept .05*** .05*** .07*** .06*** .05*** .05*** .06*** .06***
Athlete slope .01 .01 .00 .00 .02 .02 .00 .00
Level-1 .90 .90 .09 .89 .90 .90 .90 .90
aLevel one controls (included in both blocks)—age, race, gender, transfer, live on campus,
athlete, Greek, major, full-time, parents’ education.
***p<.001, **p<.01, *p<.05, +p<.10.
INTERCOLLEGIATE ATHLETES AND EFFECTIVE EDUCATIONAL PRACTICES 721
TABLE
5.Coeffi
cients
forLevel-twoModelsPredictingStudentSelf-reported
Gainsa
Personal/social
GeneralEducation
PracticalCompetencies
Men
Women
Men
Women
Men
Women
Within
Full
Within
Full
Within
Full
Within
Full
Within
Full
Within
Full
Intercept
.00
.00
.00
.00
.01
.01
).01
).01
).05**
).05**
.04
.00
Division1
).01
).05+
).13***
).13***
).03
).04
Division2
).03
).07*
).13***
).12***
).04
).05
NAIA
).01
.01
).08+
).04
).02
).01
Athlete
slope
.08***
.08***
.05***
.05***
.03*
.03
.02
.02
.04*
.04*
.06***
.06***
Division1
Division2
NAIA
Variance
components
Intercept
.04***
.04***
.04***
.04***
.04***
.04***
.05***
.04***
.04***
.04***
.04***
.04***
Athlete
slope
.00
.00
.00
.00
.00
.00
.00
.00
.00
.00
.00
.00
Level-1
.92
.92
.93
.93
.91
.91
.92
.92
.89
.89
.92
.92
aLevel
onecontrols(included
inboth
blocks)—
age,
race,gender,transfer,liveoncampus,athlete,Greek,major,full-tim
e,parents’education.
***p<
.001,**p<
.01,*p<
.05,+p<
.10.
722 UMBACH, PALMER, KUH, AND HANNAH
than women at Division I schools. Both men and women at Division IIIschools report greater gains in general education than students atDivision I and II schools.
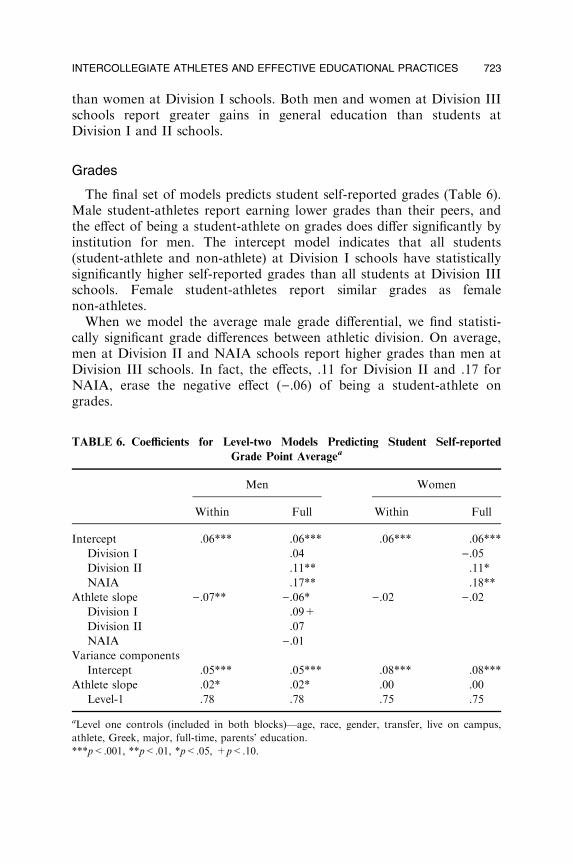
Grades
The final set of models predicts student self-reported grades (Table 6).Male student-athletes report earning lower grades than their peers, andthe effect of being a student-athlete on grades does differ significantly byinstitution for men. The intercept model indicates that all students(student-athlete and non-athlete) at Division I schools have statisticallysignificantly higher self-reported grades than all students at Division IIIschools. Female student-athletes report similar grades as femalenon-athletes.When we model the average male grade differential, we find statisti-
cally significant grade differences between athletic division. On average,men at Division II and NAIA schools report higher grades than men atDivision III schools. In fact, the effects, .11 for Division II and .17 forNAIA, erase the negative effect ().06) of being a student-athlete ongrades.
TABLE 6. Coefficients for Level-two Models Predicting Student Self-reported
Grade Point Averagea
Men Women
Within Full Within Full
Intercept .06*** .06*** .06*** .06***
Division I .04 ).05Division II .11** .11*
NAIA .17** .18**
Athlete slope ).07** ).06* ).02 ).02Division I .09+
Division II .07
NAIA ).01Variance components
Intercept .05*** .05*** .08*** .08***
Athlete slope .02* .02* .00 .00
Level-1 .78 .78 .75 .75
aLevel one controls (included in both blocks)—age, race, gender, transfer, live on campus,
athlete, Greek, major, full-time, parents’ education.
***p<.001, **p<.01, *p<.05, +p<.10.
INTERCOLLEGIATE ATHLETES AND EFFECTIVE EDUCATIONAL PRACTICES 723
LIMITATIONS
This study is limited in four ways. The first is related to the valid-ity of the self-reported gains used in our models. As Pascarella (2001)and others point out, gain scores may be confounded by students’entering characteristics. However, Pike (1999) provides some evidenceto suggest that gain scores are not significantly related to enteringability. A fair amount of research (Baird, 1976; Berdie, 1971; Pace,1985; Pike, 1995; Pohlmann, 1974) has shown that self-reports arelikely to be valid if (1) the information requested is known to therespondents, (2) the questions are phrased clearly and unambiguously,(3) the questions refer to recent activities, (4) the respondents thinkthe questions merit a serious and thoughtful response, and (5)answering the questions does not threaten, embarrass, or violate theprivacy of the respondent or encourage the respondent to respond insocially desirable ways (Kuh, 2001). The NSSE survey was designedto satisfy all of these conditions. Although the concerns aboutself-reported data are legitimate, the gains measures are only one ofseveral sets of dependent variables used in this study.A second limitation is the way in which the NSSE survey identifies
student-athletes. Students respond to the question, ‘‘Are you a student-athlete on a team sponsored by your institution?’’ It is possible thatsome students participating in sports not sponsored by their institution(e.g., club sports) responded affirmatively to the question. However,given the size of our data set the impact of the error introduced byincorrect coding of athletes is likely to be minimal.Third, we cannot determine the sport(s) in which the athlete respon-
dents participated. Thus, we are unable to compare the experiences ofathletes competing in revenue-generating or non-revenue generatingsports. Some previous research (Pascarella et al., 1995,1999) suggeststhat there are significant differences in the experiences of athletes innon-revenue and revenue generating sports.Finally, given that cross-sectional data are used in this study, we are
unable to control for self selection. For example, it is possible that ath-letes and non-athletes who matriculate at Division III colleges are morepredisposed to seek out campuses where they are surrounded by peoplewho are highly engaged. Some of the divisional differences we see maybe due, in part, to a self-selection bias. While not likely, it is possibleand warrants a cautionary note.
724 UMBACH, PALMER, KUH, AND HANNAH
DISCUSSION AND IMPLICATIONS
Much has been made recently about the Bowen and Levin (2003)report that student-athletes who attend highly selective institutions donot experience campus life in the same qualitatively beneficial ways asdo their non-athlete peers. This infers that athletes do not engage ineffective educational practices at the same level as other students and,therefore, may are not gain as much from college. Results from thisstudy do not support such a sweeping conclusion. One reason may bethat Bowen and Levine’s sample—limited to students attending IvyLeague schools—differs from the national sample used for this study.Our results show that student-athletes are at least as engaged overall,
and in some areas are more engaged, compared with their non-athletepeers. In addition, student-athletes report that they perceived their cam-pus environment to be more supportive of their academic and socialneeds, and they report making greater gains since starting college in sev-eral areas. This is consistent with evidence that NCAA student-athletesgraduate at slightly higher rates than non-athletes, about 62% for stu-dent-athletes compared with 60% for the general student body (NCAA,2004). The difference in six-year graduation rates and perceptions of thecampus environment may be partially explained by the amount of tutor-ing and other academic support many campuses provide to student-ath-letes. Nonetheless, the pattern of findings in this study corroboratesother recent research into the collegiate experiences and outcomesassociated with being a student athlete (Pascarella et al., 1995, 1999;Wolniak et al., 2001).Of special interest are the results that illuminate the impact of being an
athlete at different types of institutions. Where differences exist betweenathletes and non-athletes, the impact of being an athlete, on average, isthe same across all institutions. In only one instance—self-reportedgrades of male athletes and non-athletes—did student athletes differfrom other students at a statistically significant level.Interpreting institutional effects and athlete status is more complicated
when we consider average institutional engagement, campus support,and gains. The experiences of athletes appear to differ only slightly fromtheir non-athlete counterparts, especially across athletic divisions.Because all students at Division III schools are—on average—more en-gaged, feel more supported, and report greater gains than their peers atother types of schools, it stands to reason that athletes at Division IIIinstitutions would be more engaged than students (both athletes andnon athletes) at other types of institutions.
INTERCOLLEGIATE ATHLETES AND EFFECTIVE EDUCATIONAL PRACTICES 725
Given the great variation in most aspects of student life, it is almostcertain that some student-athletes on a given campus are short changedin non-trivial ways in terms of what they put into and get out of college(Umbach and Kuh, 2004). This is more likely to be the case for malestudent-athletes at larger institutions where arguably athletics requires agreater commitment of time, both in and out-of-season. Unfortunately,the NSSE database in 2003 did not make it possible to identify thesport in which the student-athletes participated. Perhaps in subsequentyears we will find systematic differences between student-athleteswho play high and low profile sports, such as football and fencing,respectively.
Implications
The findings from this study tell a different story of student-athletesthan the one typically featured in the national media. Most of the recentdiscussions have emphasized the problems that athletes create or fromwhich they suffer. Many of the deleterious effects are associated withDivision I revenue-generating sports. Granted, our results indicate thatmale athletes may earn slightly lower grades than their peers; at thesame time, they appear to have similar or perhaps better quality educa-tional experiences than their non-athlete counterparts in other ways.This same pattern of neutral or positive findings hold for women aswell, in as much as female athletes are more engaged, report greatergains, feel more supported, and earn grades similar to non-athletewomen. This is not to say that abuses do not occur or that athletes incertain sports or competing for certain institutions are not short-changed. Certainly, unethical behavior exists within intercollegiate ath-letic programs, just as it does in research laboratories, fraternity andsorority houses, and classrooms including the widespread reports ofcyber-plagiarism (National Survey of Student Engagement, 2003). Atthe same time, it does not seem fair to tar all athletes and institutionsthat host athletic programs with the brush of ignominy.We hope the results of this study encourage productive dialogue
about the benefits of participating in intercollegiate athletics as well asidentifying areas in which institutions should aim for improvement. Oneof these concerns are the lower grades reported by male athletes. Evenafter controlling for pre-college achievement (SAT), male athletes earnlower grades. This gap between male athletes and male non-athletes isgreatest at Division III and NAIA schools and warrants further study.Given the mounting evidence of the importance of student engage-
ment in effective educational practices, the debate about the proper role
726 UMBACH, PALMER, KUH, AND HANNAH
of athletics and student success should include more than grades andclass rank. As important as grades are, it is noteworthy that student-athletes generally are as engaged, and is some instances more engaged,than their non-athlete peers in a variety of educationally purposefulactivities. Perhaps this information will motivate those working direc-tory with intercollegiate athletes and athletic programs to seek ways toincrease this favorable margin of performance.In addition to adding to the literature on intercollegiate athletics, our
findings may offer some comfort to high school athletes. It appears thatwhatever college they choose, the odds are that their experiences proba-bly will not differ greatly from other students on their campus.Finally, it is incumbent on colleges and universities to learn more
about the experiences of their student-athletes and determine whetherthey are taking part in educationally sound activities and benefiting indesired ways from college at levels commensurate with their non-athletepeers. After all, we know a good deal about how student-athletes per-form on the playing field. We should also keep score as to the quality oftheir educational activities elsewhere on campus (Umbach and Kuh,2004).
CONCLUSION
For such a popular topic, it is surprising that there is so littleevidence at the national level about what student-athletes do during col-lege and how their behavior compares to other students. For example,until recently we knew almost nothing about how athletes spend theirtime when not on the playing fields and courts. Contrary to manyreports in the popular media, the findings from this study indicate that,on balance, student-athletes across a large number of colleges anduniversities do not differ greatly from their peers in terms of theirparticipation in effective educational practices. In most instances, whendifferences do exist, they favor athletes. That is a very different picturethan what is routinely presented in the popular press.
END NOTES
1. Student-athletes are defined as anyone who responded yes to the following question: ‘‘Are
you a student-athlete on a team sponsored by your athletics department?’’
2. Student responses to the following question: What have most of your grades been up to
now at this institution? A, A), B+, B, B)/C+, C/C)/or lower.3. Because of missing data, we include SAT as a control only for models self-reported
grades.
INTERCOLLEGIATE ATHLETES AND EFFECTIVE EDUCATIONAL PRACTICES 727
Appendix
A
ConstructsandVariables
QuestionResponse
Sets
Studentengagem
ent
Level
ofacadem
icchallenge(a=
.73
–.75)
Hours
per
weekpreparingforclass
(studying,reading,writing,rehearsing,andother
activitiesrelatedto
youracadem
icprogram)
0,1
–5,6
–10,11
–15,16–20,21
–25,
26–30,More
than30
Worked
harder
than
you
thoughtyou
could
tomeetan
instructor’sstandardsor
expectations
Veryoften,often,sometim
es,never
Number
ofassigned
textbooks,books,orbook-length
packsofcoursereadingsduring
thecurrentschoolyear
None,
1–4,5
–10,11
–20,more
than20
Number
ofwritten
papersorreportsof20pages
ormore
duringthecurrentschoolyear
None,
1–4,5
–10,11
–20,more
than20
Number
ofwritten
papersorreportsbetween5and19pages
duringthecurrentschool
year
None,
1–4,5
–10,11
–20,more
than20
Number
ofwritten
papersorreportsoffewer
than5pages
duringthecurrentschool
year
None,
1–4,5
–10,11
–20,more
than20
Coursew
ork
emphasizes:Analyzingthebasicelem
entsofanidea,experience,ortheory
Very
much,quite
abit,some,
very
little
Coursew
ork
emphasizes:
Synthesizingandorganizingideas,
inform
ation,orexperi-
encesinto
new
,more
complexinterpretationsandrelationships
Very
much,quite
abit,some,
very
little
Coursew
ork
emphasizes:
Making
judgments
about
the
value
of
inform
ation,
arguments,ormethods
Very
much,quite
abit,some,
very
little
Coursew
ork
emphasizes:Applyingtheories
orconceptsto
practicalproblemsorin
new
situations
Very
much,quite
abit,some,
very
little
Campusenvironments
emphasize:Spendingsignificantamounts
oftimestudyingand
onacadem
icwork
Very
much,quite
abit,some,
very
little
Activeandcollaborativelearning(a=
.61–.63)
Asked
questionsin
class
orcontributedto
class
discussions
Veryoften,often,sometim
es,never
Madeaclass
presentation
Veryoften,often,sometim
es,never
728 UMBACH, PALMER, KUH, AND HANNAH
Worked
withother
students
onprojectsduringclass
Veryoften,often,sometim
es,never
Worked
withclassmatesoutsideofclass
toprepare
class
assignments
Veryoften,often,sometim
es,never
Tutoredortaughtother
students
(paid
orvoluntary)
Veryoften,often,sometim
es,never
Participatedin
acommunity-basedproject
aspart
ofaregularcourse
Veryoften,often,sometim
es,never
Discussed
ideasfrom
yourreadingsorclasses
withothersoutsideofclass
(students,
familymem
bers,coworkers,etc.)
Veryoften,often,sometim
es,never
Student–facultyinteraction(a=
.73
–75)
Discussed
grades
orassignments
withaninstructor
Veryoften,often,sometim
es,never
Discussed
ideasfrom
yourreadingsorclasses
withfacultymem
bersoutsideofclass
Veryoften,often,sometim
es,never
Received
promptfeedback
from
facultyonyouracadem
icperform
ance
(written
or
oral)
Veryoften,often,sometim
es,never
Talked
aboutcareer
planswithafacultymem
ber
oradvisor
Veryoften,often,sometim
es,never
Perceptionsofthecampusenvironment
Supportivecampusenvironment(a=
.76
–.79)
CampusEnvironmentsEmphasize:Providingthesupportyouneedto
helpyousucceed
academ
ically
Very
much,quite
abit,some,
very
little
Campus
Environments
Emphasize:Helping
you
cope
with
your
non-academ
ic
responsibilities(w
ork,family,etc.)
Very
much,quite
abit,some,
very
little
CampusEnvironments
Emphasize:Providingthesupport
youneedto
thrivesocially
Very
much,quite
abit,some,
very
little
Quality:Relationshipswithother
students
1=
Unfriendly,unsupportive,
sense
of
alienation;
7=
friendly,
supportive,
sense
ofbelonging
Quality:Relationshipswithfacultymem
bers
1=
Unavailable,unhelpful,
unsympa-
thetic;7=
Available,helpful,
sympa-
thetic
Quality:Relationshipswithadministrativepersonnel
andoffices
1=
Unhelpful,
inconsiderate,
rigid
7=
Helpful,considerate,flexible
INTERCOLLEGIATE ATHLETES AND EFFECTIVE EDUCATIONAL PRACTICES 729
Appendix
A(C
ontinued)
ConstructsandVariables
QuestionResponse
Sets
Satisfaction(a=
.75–.78)
How
would
youevaluate
yourentire
educationalexperience
atthisinstitution?
Excellent,good,fair,poor
Ifyoucould
start
over
again,would
yougoto
thesameinstitutionyou
are
now
attending?
Excellent,good,fair,poor
Gainsin
learningandintellectualdevelopment
Gainsin
personalandsocialdevelopment(a=
.80
–.81)
Contributedto:Developingapersonalcodeofvalues
andethics
Verymuch,quiteabit,some,
verylittle
Contributedto:Understandingpeople
ofother
racialandethnic
backgrounds
Verymuch,quiteabit,some,
verylittle
Contributedto:Understandingyourself
Verymuch,quiteabit,some,
verylittle
Contributedto:Im
provingthewelfare
ofyourcommunity
Verymuch,quiteabit,some,
verylittle
Contributedto:Learningeff
ectivelyonyourown
Verymuch,quiteabit,some,
verylittle
Contributedto:Workingeff
ectivelywithothers
Verymuch,quiteabit,some,
verylittle
Gainsin
generaleducation(a=
.79–.82)
Contributedto:Writingclearlyandeff
ectively
Verymuch,quiteabit,some,
verylittle
Contributedto:Speakingclearlyandeff
ectively
Verymuch,quiteabit,some,
verylittle
Contributedto:Thinkingcriticallyandanalytically
Verymuch,quiteabit,some,
verylittle
Contributedto:Acquiringbroadgeneraleducation
Verymuch,quiteabit,some,
verylittle
Gainsin
practicalcompetence
(a=
.76–.79)
Contributedto:Acquiringjoborwork-relatedknowledgeandskills
Verymuch,quiteabit,some,
verylittle
Contributedto:Usingcomputingandinform
ationtechnology
Verymuch,quiteabit,some,
verylittle
Contributedto:Analyzingquantitativeproblems
Verymuch,quiteabit,some,
verylittle
Contributedto:Solvingcomplexreal-worldproblems
Verymuch,quiteabit,some,
verylittle
730 UMBACH, PALMER, KUH, AND HANNAH
REFERENCES
Astin, A. W. (1984). Student involvement: A developmental theory for higher education.
Journal of College Student Personnel 25(4): 297–308.
Astin, A. W. (1993). What Matters in College? Four Critical Years Revisited, Jossey-Bass, San
Francisco.
Baird, L. L. (1976). Biographical and educational correlates of graduate and professional school
admissions test scores. Educational and Psychological Measurement 36(2): 415–420.
Berdie, R. F. (1971). Self-claimed and tested knowledge. Educational and Psychological
Measurement 31(3): 629–636.
Bowen, W. G., and Levin, S. A. (2003). Reclaiming the Game: College Sports and Educational
Values, Princeton University Press, Princeton, NJ.
Chickering, A. W., and Gamson, Z. F. (1987). Seven principles for good practice in
undergraduate education. AAHE Bulletin 7(3): 3–7.
Edgerton, R., and Shulman, L. S. (2002). Foreword: From promise to progress: Exploring
engagement. In National Survey of Student Engagement, From promise to progress: How
colleges and universities are using student engagement results to improve collegiate quality.
Indiana University Center for Postsecondary Research, Bloomington, IN.
Ethington, C. A. (1997). A hierarchical linear modeling approach to studying college effects.
In: Smart, J. (ed.),Higher Education Handbook of Theory and Research (Vol. 12), Agathon.9,
Edison, NJ, pp. 165–194.
Hood, A. B., Craig, A. F., and Ferguson, B. W. (1992). The impact of athletics, part-time
employment, and other activities on academic achievement. Journal of College Student
Development 33: 447–453.
Hu, S., and Kuh, G. D. (2003). Maximizing what students get out of college: Testing a learning
productivity model. Journal of College Student Development 44: 185–203.
Hu, S., and Kuh, G. D. (2004). Untangling organization-individual level conundrum: Toward
higher-level credibility research in higher education. Paper presented at the annual meeting of
the American Educational Research Association, San Diego.
Jacobsen, J. (2004). Panel blasts U. of Colorado for handling of scandal. Chronicle of Higher
Education 50(38): A1May 28.
King, G. (1999). A Solution to the Ecological Inference Problem: Reconstructing Individual
Behavior from Aggregate Data, Princeton University Press, Princeton, NJ.
Kreft, I., and Leeuw, J.De (1998). Introducing Multilevel Modeling, Sage, Thousand Oaks, CA.
Kuh, G. D. (2001). Assessing what really matters to student learning: Inside the National
Survey of Student Engagement. Change 33(3): 10–17, 66.
Kuh, G. D. (2003). What we’re learning about student engagement from NSSE. Change 35(2):
24–32.
Kuh, G. D., Douglas, K. B., Lund, J. P., and Ramin-Gyurnek, J. (1994). Student Learning
Outside the Classroom: Transcending Artificial Boundaries, (Vol. 8), George Washington
University Graduate School of Education, Washington, D.C.
Kuh, G. D., Kinzie, J., Schuh, J. H., Whitt, E. J. and Associates (2005). Student Success in
College: Creating Conditions that Matter, Jossey-Bass, San Francisco.
Kuh, G. D., Schuh, J. H., Whitt, E. J. and Associates (1991). Involving Colleges: Successful
Approaches to Fostering Learning and Personal Development Outside the Classroom, Jossey-
Bass, San Francisco.
National Collegiate Athletic Association (2004). NCAA division I graduation rates continue to
exceed general student body. Retrieved June 27, 2005, from http://www2.ncaa.org/
media_and_events/press_room/2004/october/20041025_grad_rates_release.html.
INTERCOLLEGIATE ATHLETES AND EFFECTIVE EDUCATIONAL PRACTICES 731
National Collegiate Athletic Association Purpose (n.d.). Retrieved July 21, 2004, from http://
www.ncaa.org/.
and National Survey of Student Engagement (2003). Converting Data into Action: Expanding
the Boundaries of Institutional Improvement, Indiana University Center for Postsecondary
Research, Bloomington, IN.
Pace, C. R. (1984). Measuring the Quality of College Student Experiences, Center for the Study
of Evaluation, University of California Los Angeles, Los Angeles.
Pace, C. R. (1985). The Credibility of Student Self-reports, Center for the Study of Evaluation,
University of California Los Angeles, Los Angeles.
Pascarella, E. T. (2001). Using student self-reported gains to estimate college impact: A
cautionary tale. Journal of College Student Development 42(5): 488–492.
Pascarella, E. T., Truckenmiller, R., Nora, A., Terenzini, P. T., Edison, M., and Hagedorn,
L. S. (1999). Cognitive impacts of intercollegiate athletic participation: Some further
evidence. Journal of Higher Education 70(1): 1–26.
Pascarella, E. T., Bohr, L., Nora, A., and Terenzini, P. T. (1995). Intercollegiate athletic
participation and freshmen-year cognitive outcomes. Journal of Higher Education 66(4):
369–387.
Pascarella, E. T., and Terenzini, P. T. (1991). How College Affects Students, Jossey-Bass, San
Francisco.
Pascarella, E. T., and Terenzini, P. T. (2005). How College Affects Students: A Third Decade of
Research, Jossey-Bass, San Francisco.
Pascarella, E. T., and Smart, J. C. (1991). Impact of intercollegiate athletic participation for
African American and Caucasian Men: Some further evidence. Journal of College Student
Development 32(2): 123–130.
Pike, G. R. (1995). The relationship between self reports of college experiences and achievement
test scores. Research in Higher Education 36(1): 1–21.
Pike, G. R. (1999). The constant error of the halo in educational outcomes research. Research in
Higher Education 40(1): 61–86.
Pohlmann, J. T. (1974). A description of effective college teaching in five disciplines as measured
by student ratings. Research in Higher Education 4(4): 335–346.
Raudenbush, S. W., and Bryk, A. S. (2002). Hierarchical Linear Models: Applications and Data
Analysis Methods, Sage, Thousand Oaks, CA.
Richards, S., and Aries, E. (1999). The division III student-athlete: Academic performance,
campus involvement, and growth. Journal of College Student Development 40(3): 211–218.
Riemer, B. A., Beal, B., and Schroeder, P. (2000). The influences of peer and university culture
on female student-athletes’ perceptions of career termination, professionalization, and social
isolation. Journal of Sport Behavior 23(4): 364–378.
Rosenthal, R., and Rosnow, R. L. (1991). Essentials of Behavioral Research: Methods and Data
Analysis, 2McGraw-Hill, New York.
Ryan, F. (1989). Participation in intercollegiate athletics: Affective outcomes. Journal of College
Student Development 30(2): 122–128.
Schroeder, P. J. (2000). An assessment of student involvement among selected NCAA division
III basketball players. Journal of College Student Development 41(6): 616–626.
Shulman, L. S. (2002). Making differences: A table of learning. Change 34(6): 36–44.
Shulman, J. L., and Bowen, W. G. (2001). The Game of Life: College Sports and Educational
Values, Princeton University Press, Princeton, NJ.
Suggs, W. (2003a). Grades and money: NCAA considers new rules that would tie sports
participation to academic performance. Chronicle of Higher Education 49(32): A43, April 18.
Suggs, W. (2003b). Jock majors: Many colleges allow football players to take the easy way out.
Chronicle of Higher Education 49(19): A33, January 17.
732 UMBACH, PALMER, KUH, AND HANNAH
Terenzini, P. T., Pascarella, E. T., and Blimling, G. S. (1996). Students’ out-of-classroom
experiences and their influence on learning and cognitive development: A literature review.
Journal of College Student Development 37(2): 149–162.
Thelin, J. R. (1994). Games Colleges Play: Scandal and Reform in Intercollegiate Athletics, Johns
Hopkins University Press, Baltimore.
Tinto, V. (1987). Leaving College: Rethinking the Causes and Cures of Student Attrition,
University of Chicago Press, Chicago.
Umbach, P. D., and Kuh, G. D. (2004). Disengaged jocks: Myth or reality? LiberalArtsOnline,
4, (4). http://liberalarts.wabash.edu/cila/home.cfm?news_id=1593.
Umbach, P. D., and Kuh, G. D. (2006). Student experiences with diversity at liberal arts
colleges: Another claim for distinctiveness. The Journal of Higher Education 77(1): 169–192.
Wolf-Wendel, L. E., Toma, J. D., and Morphew, C. C. (2001). There’s no ‘‘I’’ in ‘‘Team’’:
Lessons from athletes on community building. The Review of Higher Education 24(4):
369–396.
Wolniak, G. C., Pierson, C. T., and Pascarella, E. T. (2001). Effects of intercollegiate athletics
participation on male orientations toward learning. Journal of College Student Development
42(6): 604–624.
Received February 1, 2005.
INTERCOLLEGIATE ATHLETES AND EFFECTIVE EDUCATIONAL PRACTICES 733