Embed Size (px)
Citation preview
Internationalization of U.S. Doctorate Education
John Bound University of Michigan and NBER
Sarah Turner
University of Virginia and NBER
Patrick Walsh Saint Michael’s College
Population Studies Center Research Report 09-675
March 2009
DISCLAIMER: The use of NSF data does not imply NSF endorsement of the research methods or conclusions contained in this report.
We would like to thank Richard Freeman, Daniel Goroff, Bill Kerr, and Michael Rothschild for helpful comments. We are grateful to our colleagues who helped us to understand particular country circumstances and locate international data including Michael Baker, Olivier Blanchard, Michael Elsby, Al Hermalin, Lutz Killian, Albert Park, Steve Pishke and Yu Xie. Our research has been supported by grants from the Andrew W. Mellon Foundation and the Science and Engineering Workforce Project at NBER, funded by the Alfred P. Sloan Foundation. This work was finished while Bound was a fellow at the Center for Advanced Study in the Behavioral Sciences, Stanford University.
Internationalization of U.S. Doctorate Education 2
ABSTRACT
The representation of a large number of students born outside the United States among the ranks of doctorate recipients from U.S. universities is one of the most significant transformations in U.S. graduate education and the international market for highly-trained workers in science and engineering in the last quarter century. Students from outside the U.S. accounted for 51% of PhD recipients in science and engineering fields in 2003, up from 27% in 1973. In the physical sciences, engineering and economics the representation of foreign students among PhD recipients is yet more striking; among doctorate recipients in 2003, those from outside the U.S. accounted for 50% of degrees in the physical sciences, 67% in engineering and 68% in economics. Our analysis highlights the important role of changes in demand among foreign born in explaining the growth and distribution of doctorates awarded in science and engineering. Expansion in undergraduate degree receipt in many countries has a direct effect on the demand for advanced training in the U.S. Changes in the supply side of the U.S. graduate education market may also differentially affect the representation of foreign students in U.S. universities. Supply shocks such as increases in federal support for the sciences will have relatively large effects on the representation in the U.S. of doctorate students from countries where demand is relatively elastic. Understanding the determinants – and consequences – of changes over time in the representation of foreign born students among doctorate recipients from U.S. universities informs the design of policies affecting the science and engineering workforce.
Internationalization of U.S. Doctorate Education 3
INTRODUCTION
The representation of a large number of students born outside the United States among the ranks of PhD recipients from U.S. universities is one of the most significant transformations in the international market for higher education in the last quarter century. Students from outside the U.S. accounted for 51% of PhD recipients in science and engineering fields in 2003, up from 27% in 1973.1 The primary objective of this research is to understand the factors effecting this growth. We wish to understand the pattern of flows into U.S. PhD programs both across countries and over time.
Variation across countries and over time in the demand for graduate study in the United States affects the number and distribution of students by country of origin at universities in the United States. It is also the case that the representation of foreign students in U.S. PhD programs is a function of the resources available to these programs or the “supply side” of the PhD market. In the post-war years, substantial federal and state subsidies increased both the excellence and scale of U.S. graduate education. The growth of graduate education in the sciences at U.S. research universities has fundamentally changed international access to doctorate level training in the last half century. In motivating this analysis, we note that it is not uncommon to find rhetoric suggesting that the relative erosion in the quality of education afforded to young people in the U.S. is a primary cause of the decline in share of doctorate degrees in science and engineering awarded to U.S. students.2 Our interpretation of the available evidence is that such claims have little empirical basis. Natural economic forces of supply and demand, with these effects varying considerably in magnitude across countries, go a significant distance in explaining the observed changes in doctorate receipt among students from abroad and the U.S.
1 Tabulations presented in publications such as Science and Engineering Indicators show a
somewhat lower representation of students from outside the U.S. among PhD recipients in science and engineering for two reasons. First, we include only engineering, life sciences, physical sciences and economics in our definition of science and engineering, excluding social science fields like sociology and political science which have not drawn substantial number of foreign students. Secondly, we classify students as foreign if they did complete high school in the United States, which results in some overstatement of the aggregate counts of the foreign representation of doctorate recipients as respondents missing information on high school location are included in this count. The conclusions of the paper and the statements about trends are invariant to the choice of classification of cases with unreported citizenship or high school location.
2 Bowen, Kurzweil and Tobin (2005, p. 38) note that presidential and national commissions tend to urge policy changes “to counteract the alleged rising tide of mediocrity.” A recently released report from the National Academy of Sciences titled Rising Above the Gathering Storm: Energizing and Employing America for a Brighter Economic Future notes, “Having reviewed trends in the United States and abroad, the committee is deeply concerned that the scientific and technical building blocks of our economic leadership are eroding at a time when many other nations are gathering strength.”
Internationalization of U.S. Doctorate Education 4
In the first section, we outline the basic trends in PhD degree attainment and set forth the institutional context of doctorate education in the United States. The second section considers the differential cross-sectional representation of students by country at the graduate level in the U.S. The analysis of the determinants of the growth over time in foreign participation in U.S. doctorate study in the sciences follows in the third section. The fourth section turns to the analysis of the determinants of participation of U.S. students in graduate education in the sciences.
In understanding the substantial foreign share of doctorate recipients from U.S. institutions, we address two related questions. The first concerns the distribution of doctorate recipients by country of origin, as students from Asian countries tend to be overrepresented on a per capita basis and distributed somewhat differently by type of institution than students from Europe and other parts of the world. The second question concerns the determinants of changes over time in the number of foreign students receiving doctorate degrees in the U.S. Changes in demand – generated by increased undergraduate degree attainment abroad and political shocks – and changes in research support for universities affect the flow of foreign students to U.S. PhD programs.
Our interest in understanding the production of graduate education at universities is ultimately an input to the study of the link between the graduate education process and the employment of scientists and engineers in the U.S. and abroad. In turn, decisions to pursue graduate study reflect variation over time and countries of origin in labor market opportunities for the high-skill workers. A significant innovation of our work is the identification of trends in doctorate awards by country of origin. First, even countries that are relatively similar to the U.S. in socioeconomic circumstances and institutions (such as Canada and countries in Europe) send a considerable number of students to U.S. doctorate programs. Second, as baccalaureate degree receipt grows within countries so too does PhD attainment at U.S. universities, with these changes particularly marked among countries experiencing substantial changes in educational attainment. Finally, political transformations involving the opening or closing of trade with the U.S. also lead to substantial changes in the receipt of PhDs in the sciences among students from foreign countries.
SECTION 1. BASIC TRENDS AND POLICY CONTEXT
The U.S. education market has never been closed to foreign students, though the absolute number of foreign students enrolling in U.S. colleges and universities was relatively modest until
Internationalization of U.S. Doctorate Education 5
the 1970s. The post-World War II strengthening of U.S. universities – particularly in the sciences and engineering – made advanced study in the U.S. more attractive to foreign students. In the two decades between 1936 and 1956, foreign students accounted for 19% of PhDs awarded by U.S. institutions in engineering, 10% of PhDs awarded in the physical sciences, 12% of PhDs in the life sciences and 12% of PhDs in economics (National Academy of Sciences, 1958).3
The post World War II strengthening of U.S. universities -- particularly in the sciences and engineering -- made advanced study in the U.S. newly attractive to foreign students. Advances in air travel, global communication, and visa arrangements no doubt also reduced the fixed barriers that might otherwise have limited the access of foreign students to U.S. universities. Immigration reform through the Immigration and Nationality Act of 1952 and subsequent amendments formalized the status of students attending U.S. institutions from abroad by creating categories of “non-immigrant visas” permitting temporary study in the U.S. The most common designation is the F-1 visa, which is issued to students admitted to an approved institution of learning with the demonstration of sufficient financial support.4
Dramatic growth in doctorate education, as well as higher education more generally, characterized the immediate post-World War II decades in the United States. Doctorate degrees awarded increased from less than 10,000 in 1958 to nearly 35,000 in 1973 (Figure 1). Then, after a period of stagnation, the overall number of doctorate degrees expanded again in many fields during the 1980s and the number of doctorates awarded by U.S. institutions climbed to an historic peak of 42,652 in 1998. The rise in the share of degrees awarded to students born outside the U.S. is a distinguishing feature of the last quarter century (see Figure 1), particularly in scientific fields.
3 There is a small representation of foreigners in U.S. undergraduate programs as well, with
temporary residents representing about 3% of BA recipients from U.S. institutions. The distribution of foreign undergraduate and professional students studying in the U.S. is quite different than the distribution of students pursuing doctorate degrees in large part because undergraduate students and students in professional programs are generally expected to pay their own way. As the size of the U.S. college-age population fell in the late 1970s many colleges and universities actively recruited students from foreign countries to increase revenues. A 1979 report from the American Council on Education identified foreign students as a potentially important market for undergraduate colleges facing declining enrollment demand with smaller high school cohorts (Maeroff, 1979).
4 To obtain a student visa, an individual submits a letter of admission from a university and a certificate of eligibility issued by the school (known as form I-20) to the American embassy or consulate in the home country. The scope of education that F visas have historically included is not limited to degree-granting colleges and universities but also includes profit-making technical training schools and proprietary language institutes.
Internationalization of U.S. Doctorate Education 6
Changes in federal funding for science, as well as direct public support for graduate education,5 are an important determinant of both opportunities for graduate education and the labor market demand for PhDs. Figure 2 shows the overall trend in federal research funding to universities; the dramatic rise from the late-1950s to the late 1960s is followed by a period of stagnation in the 1970s, before increases in federal funding for the sciences resume in the 1980s.
The Survey of Earned Doctorates provides a comprehensive picture of PhDs produced by U.S. universities by country of origin from the late 1950s to the present. The Survey of Earned Doctorates is an individual-level census of recipients of doctorates at U.S. institutions. Because survey participation is often coupled with the formal process of degree receipt, response rates have been quite high. When we organize these data by country of origin, we focus on the country where an individual completed high school as this measure does not include those immigrating to the U.S. at young ages. This method also serves to “count” individuals in the country where they resided at young ages.6 Access to the restricted microdata files is particularly important for the analysis that follows.
Foreign students are more heavily concentrated in the sciences than in the humanities. Moreover, the broad area of the social sciences masks considerable diversity in representation of foreign students, as 51% of economics doctorates hold temporary visas though only 5% of psychology PhDs are neither citizens nor permanent residents. The variation in choice of specialization at the undergraduate level importantly affects demand for U.S. PhD programs by field. In Asian countries, the majority of undergraduate degrees are awarded in science and
5 Federal support for doctoral study came in the form of fellowships to individuals as well as project
support to researchers and universities. In 1952, the National Science Foundation established the Graduate Research Fellowship program which provided generous multi-year support for those pursuing doctorate study in the sciences and engineering. The annual number of awards grew from about 500 in the 1950s to a peak of 1373 in 1966, with the number of awards offered then contracting back to about 500 in the 1970s and 1980s before rising to nearly 1000 awards in the 1990s (Freeman, Chang, and Chiang, 2005). In addition, the NDEA Fellowships for graduate study were passed by Congress in 1958 as part of broader package of legislation intended to improve funding of education in the sciences and other areas of national need (including foreign languages), partly in response to the launching of Sputnik.
6 Country of origin was defined by the country in which the respondent attended high school (“hsplace” in the the Survey of Earned Degrees). Out of the 1.35 million observations, 88,709 (6.6%) listed no hsplace. Among respondents in fields classified as “science and engineering”, 6.0% listed no hsplace. Since “foreign” is defined as simply “not US”, it is possible that people who went to high school in the U.S. but listed no high school country are classified as “foreign”. However, of all those listing no hsplace, 15% list “United States” as their country of birth (compared with 69% of the overall), while 75% list no birthplace. Since at most 6% (and probably much less) of the relevant sample can be mis-classified this way, the foreign/U.S. treatment of these individuals should not materially affect this paper’s results.
Internationalization of U.S. Doctorate Education 7
engineering fields with a reported share of 65% for Japan and 60% for China,7 while in the U.S. (32%) and European countries including the U.K. (35%) the share of BA degrees awarded in science and engineering fields is appreciably smaller (Science and Engineering Indicators, 2004, Table A2-34).
Within science fields, the growth since the mid-1970s in doctorates awarded among those from outside the United States is particularly striking. Figure 3 shows the trend in doctorates awarded to U.S. residents and individuals from foreign countries in engineering, the life sciences, the physical sciences and economics. In all but the life sciences, the foreign share now equals or exceeds the share of PhD recipients from the U.S. With some modest differences in timing across fields, the expansion in degrees awarded to foreign students commenced in the mid-1970s and slowed in the mid-1990s. Summarizing the broad developments from 1980 to 1996 (the peak year in recent PhD awards to foreign students), the total number of PhDs in science and engineering increased from 12,126 to 21,253. If we engage in the accounting exercise of holding constant the foreign share at the 1980 level, the total expansion in doctorates awarded would have been expected to be a more modest 2,619 degrees relative to the observed change of 9,127 doctorate degrees awarded by U.S. institutions. Institutional context of U.S. universities
Universities in the United States award more PhD degrees than those in any other country. In 2001, the U.S. awarded 40,744 PhDs relative to 24,769 awarded by Germany, 14,210 awarded by Great Britain and 16,078 awarded by Japan. In the science and engineering fields, the U.S. continues to dominate but by a more modest margin – with the U.S. awarding 25,509 PhDs relative to 11,803 awarded by Germany, 8,520 awarded by Great Britain, 7,401 awarded by Japan and 8,153 awarded by China (Science and Engineering Indicators, 2004, Table A2-36). Not only do U.S. institutions award more PhD degrees than those in any other country, but U.S. universities also dominate at the highest levels of scientific accomplishment. At the same time, the rate of growth of doctorate education in the U.S. has lagged other counties (particularly those in Asia) over the last decade. The average annual rate of growth in doctorates awarded in science and engineering fields was 3.2% in the decade of the 1980s and 1.6% in the decade of the 1990s relative to annual rates of growth in doctorate production exceeding 20% in South Korea and Taiwan in the 1980s and China during the 1990s.8
7 While there is no question that the scale of undergraduate education has grown very dramatically in China in the last decade, there is evidence that some of the widely reported data on the number and share of degrees awarded in science and engineering are overstated, counting sub-baccalaureate training in trades as engineering or science degrees. See Gereffi, G.; V. Wadhwa, B. Rissing, R. Ong (2008) for further discussion.
8 See Science and Engineering Indicators (2004, Appendix Tables 2-38 and 2-39).
Internationalization of U.S. Doctorate Education 8
The U.S market for doctorate education is also highly stratified. In 2002, 413 universities in the United States awarded doctorates, with the mean number of degrees per institution 97, and the median number 38 degrees. Overall, production is relatively concentrated with 20 institutions awarding 27% of the 2002 total of 39,955 degrees.9 Substantial subsidies from state, federal and institutional sources to research universities affect the quantity and qualigraduate education, while the concentration of federal support at a relatively small set of universities adds to the stratification in graduate education. The National Academy of Sciences’ rankings show the wide difference in faculty publications and research funding between the top and bottom quartile of graduate programs.
ty of
10 Stratification is apparent in outcomes as well as funding, as high achieving scientists come from a relatively small number of graduate institutions. Top U.S. universities are often considered leaders at an international level, resulting in a comparative advantage in the production of doctorate education.11 That research and doctorate education are often complementary in production further strengthens the advantage of elite U.S. universities, contributing to potential agglomeration effects in the location of science.
SECTION 2. CROSS-SECTIONAL DISTRIBUTION BY COUNTRY
Motivation
There is considerable cross-country variation in doctorate attainment from U.S. institutions. Asian countries – particularly India (736), Taiwan (423), South Korea (842) and China (2452) – accounted for more than one-half the doctorates in science awarded to those from
9 While this concentration is considerable, it is appreciably less than at the start of the century. Up until
the mid-1920s, five institutions (Columbia, Harvard, Johns Hopkins, Yale and Chicago, notably all private) awarded about one half of the annual flow of doctorates; by the 1930s, there had been some dispersion as these five institutions awarded about one third of new doctorates (Berelson, 1960, p. 93). By 1950, there were at least 30 institutions, including many large public universities, awarding a significant number of PhD degrees annually. Focusing on the interval between 1958 and 1972, Bowen and Rudenstine (1992) document the extraordinary growth in the number of institutions and departments operating PhD programs. In economics, the number of PhD-granting institutions increased nearly 90% from 57 to 108 while in mathematics the number of programs increased more than 130% from 60 to 139.
10 To give but one example, graduate faculties in the top quartile of doctorate-granting programs in economics averaged 36 faculty members and nearly 13 citations per faculty member relative to 17.3 faculty members and 1.36 citations in the bottom quartile. See Research-Doctorate Programs in the United States: Continuity and Change (1995).
11 At least one effort has been made to compare universities through the creation of an index including measures such as Nobel laureates, articles in major scientific publications and citations. The result of this effort is that 15 of the top 20, as well as 35 of the top 50, universities are in the U.S. (Shanghai Jiao Tong University, 2003). While the strength of U.S. universities at the top of the international rankings is widely recognized, it should also be noted that there is considerable variance as well in the quality of U.S. doctorate programs. One British observer comparing the U.S. and the U.K. notes: “The U.S., with 4,000 institutions of higher education, probably has 50 of the best universities in the world and undoubtedly has 500 of the worst.” (Stevens, 2004, as cited in Bowen, Kurzweil and Tobin, 2005).
Internationalization of U.S. Doctorate Education 9
outside the U.S in 2003. Students from France (77), Germany (168) and Great Britain (76) were less than 3% of the foreign degree recipients. Why students from some countries are particularly likely to pursue doctorate education in the U.S. surely depends on opportunity costs. In general, demand for doctorate education will be lower for those students with more abundant home country opportunities and, in turn, students from countries with relatively substantial university systems will be unlikely to study in the U.S. unless they can attend top-tier doctorate programs.
What matters for students potentially pursuing study in the United States is the expected return to a U.S. PhD program relative to the best alternative in the home country. In the cross-section, individual students in each country face a choice based on the expected benefit to doctorate study in the U.S. and an expected return to persistence in the home country, which may include attending graduate school in the home country or pursuing some other vocation. It follows that the opportunity cost of pursuing a doctorate degree at a U.S. university varies among countries of origin. Alternative options for post-baccalaureate study as well as fixed costs of foreign study will vary by country.
Two presumptions about graduate study in the U.S. and abroad have implications for who comes to the U.S. for graduate study. First, expected success in home country and anticipated benefits from graduate education in the U.S. are correlated, implying that people likely to have high returns from graduate study in the United States are also likely to have an absolute advantage in home country graduate education or alternative activity. Second, U.S. programs tend to be dominant in the top tail of the international distribution of program quality.
For countries in which forgone opportunities are close to those in the U.S. – e.g., countries with large and well-established university sectors -- only a select few individuals will pursue graduate studies in the U.S. These individuals will be among those with relatively high ability and receive admission offers from some of the best programs in the U.S. In contrast, individuals from countries with much more limited higher education systems will have fewer opportunities for graduate study in their home countries and will be much more likely to choose to pursue graduate study at a U.S. university. In turn, these individuals may choose to come to the U.S. to pursue studies at programs outside the most highly ranked departments.
Moreover, part of the return to doctorate study in the U.S. may be future access to the U.S. labor market.12 Foreign doctorate recipients from U.S. universities may be particularly well-positioned to find employment in the U.S. and to receive H-1B work visas for employment
12 Finn (2003) estimates that about 71 percent of foreign citizens who received science/engineering doctorates from U.S. universities in 1999 were in the United States in 2001. For those receiving degrees in 1991, about 58 percent were still in the U.S. in 2001. The attractiveness of the transition from graduate study to employment with an H-status visa increased with the Immigration Act of 1990 allowing H-1B visas holders to also apply for permanent resident status, where formerly H-1B visa holders were required to declare an intention to return to their countries of residence.
Internationalization of U.S. Doctorate Education 10
in specialty occupations.13 By one estimate (Lowell, 2000), nearly one-quarter of H-1B visa recipients have changed from foreign student status. Completion of a PhD may be particularly important to an individual’s prospects for receiving an H visa as educational requirements are one way for firms to document that an individual has skills that are scarce and specialized in the application process.
The above considerations lead to two clear predictions. First, countries with relatively modest home country options for doctorate study will be represented in greater relative numbers in U.S. PhD programs than countries with significant home country university options. Secondly, the average quality of students (and the graduate programs selected) receiving PhDs in the U.S. is inversely related to the share of a country’s potential doctorate students completing advanced study in the U.S.
Cross-country differences in doctorate degree attainment
In the cross-section, both the level of undergraduate degree attainment in foreign countries and the extent to which there are established doctorate-level programs in these countries has a substantial effect on the flow of PhD students to U.S. institutions. The data in Table 1 provide a cross-sectional picture, combining undergraduate degree production in the early 1990s with doctorate production at the end of the decade across countries. The number of college-age individuals in each country receiving a science and engineering BA would seem to represent a reasonable measure of the potential demand for doctorate level graduate study in science and engineering. In column (1) of Table 1, we report data on this number for 1990 or the most recent available year.14 In the third column we report the undergraduate degrees in science and engineering relative to the 24 year old population in each country (column (2) reports all BA degrees relative to population). While there are some cross country differences, roughly 3 to 5% of the populations of North American and Western European countries received an undergraduate degree in science or engineering. In the early 1990s a comparable or even somewhat larger fraction of the population in Asian countries such as Japan, Taiwan and South
13 The government defines as specialty occupation as: “A specialty occupation requires theoretical
and practical application of a body of specialized knowledge along with at least a bachelor’s degree or its equivalent. For example, architecture, engineering, mathematics, physical sciences, social sciences, medicine and health, education, business specialties, accounting, law, theology, and the arts are specialty occupations.” http://uscis.gov/graphics/howdoi/h1b.htm
14 Note that these numbers would not be qualitatively different if we were to include BA degrees received at U.S. institutions by foreign students. Particularly for countries sending large numbers of students to the U.S. for graduate study, the proportion of PhD recipients who also received BA degrees from a U.S. institution was 4% for those from India and less than 2% for those from China measured over the last 15 years.
Internationalization of U.S. Doctorate Education 11
Korea did so. In contrast, just over 1 % of those form India and 0.6% of those from China received a science and engineering BA, reflecting relatively low overall levels of undergraduate degree attainment in these countries. Much of this observed difference across countries in the representation of science and engineering BA degree recipients is representative of the scale of higher education; in countries where only a small fraction of the population receives a BA degree (Column (2)), it follows that the overall number of science and engineering BA recipients will be limited.15 A second measure of the development of the higher education sector within a country is the size of the doctorate granting sector of higher education – both in an absolute sense and relative to the BA sector. Column (4) of Table 1 shows the number of PhDs awarded in each of the listed countries.16 Column (5) presents the number of individuals from the country in question receiving a Science or Engineering PhD from a U.S. institution. In the case of most of the countries listed in the table somewhere between 5 to 10 % of college graduates in the sciences and engineering go on to get a PhD, though the fraction of those awarded a PhD from a U.S. institution varies dramatically.17
A clear hypothesis is that countries with low domestic PhD production relative to undergraduate degrees awarded and relatively less developed higher education systems will be among those most likely to send PhD students to the United States. Columns (6) and (7) in Table 1 underscore this point clearly, as European countries with long traditions in higher education send relatively few students to the U.S. while Asian countries are much more likely to send students to the U.S. to pursue PhD studies.18 In short, the international representation of
15 Nevertheless, there are large differences across countries in the relative share of degrees awarded
in the sciences. For example, less than one fifth of U.S. undergraduate degrees are awarded in science and engineering fields while about one half of degrees in China are awarded in science and engineering fields. The United States – as well as other countries with substantial service sectors – educates many people at the baccalaureate level in professional fields such as accounting and business which are unlikely to provide the preparation for the pursuit of a PhD degree in science.
16 In the cases where this is possible --the US, the UK, Germany, France and Japan -- we have netted out foreigners obtaining a PhD in the country in question. In all other cases, the data refer to the total number of PhDs granted, irrespective of whether the individual is or is not a foreigner
17 The, largely Asian, countries in Table 1 that send significant numbers of students to the U.S. to receive their Ph.D.’s also send students to Canada, Australia and several European countries. For these countries, the numbers in Table 1, to some extent, underestimates the total number of individuals from these countries receiving PhD’s in the sciences.
18 Empirical verification of this point is provided by consideration of the correlation between measures of U.S. PhD production and home-country BA degrees awarded. Using available data, there is a negative (-.2) correlation between the ratio of PhDs awarded in the US and the ratio of BA degrees to population, indicating that countries with relatively well–developed university systems rely less on U.S. institutions for PhD production.
Internationalization of U.S. Doctorate Education 12
students in U.S. doctorate education depends appreciably on home country undergraduate and graduate options.
When we focus on top-ranked programs in the United States, the distribution of PhD recipients by country of origin is much different than when the focus on PhD recipients in aggregate.19 Students from European countries are represented in far greater proportions among top institutions than in the overall pool of doctorate recipients. Moreover, within each country of origin, countries that send a relatively high fraction of potential doctorates to the U.S. for training have relatively lower concentrations of PhD recipients among the top-ranked U.S. programs.
Table 2 presents these data on the proportion of a country’s PhD recipients receiving degrees from top-5 programs and shows the distribution of degrees by country awarded by the most highly ranked programs. What is clear is that for a number of Asian countries – notably Taiwan, South Korea, and China – PhD recipients in science are underrepresented in the top-5 departments and are much less likely to receive their degrees from these programs than PhD recipients from the U.S. in these fields. For example, while students from China are about 15.5% of all chemistry PhDs, they are only 5.3% of degree recipients from top-5 programs. At the other extreme, students from Canada and European countries tend to be represented in the top programs in shares in excess of their overall representation among PhD recipients from U.S. universities.
Countries that send a relatively high fraction of students to unranked or low ranked PhD programs are those where home countries opportunities for graduate study in the sciences are quite limited. Put somewhat differently, these data are indicative of the quality of “home country” PhD programs; for countries like Canada where PhD recipients from U.S. institutions are concentrated in relatively high quality institutions, the quality of home country PhD options is relatively high. A related explanation is that the countries with the highest relative representation among top programs in the U.S. are those countries where there is considerable existing research exchange among scholars in the U.S. and abroad, providing a natural network linking students from foreign universities to graduate study in the U.S.
19 We use the rankings at the discipline level assembled by the National Academy of Sciences at a
point in time in the early 1990s. While there have been some changes over time in rankings, there have been few large movements (mobility from unranked to top 5) over the last three decades. See: Research-Doctorate Programs in the United States: Continuity and Change, National Research Council, National Academy of Sciences, Washington, D.C. 1995. It is, of course, true that there are changes in the relative rank of PhD programs over time; yet, these changes tend to be modest relative to the overall correlation between rankings done in various years.
Internationalization of U.S. Doctorate Education 13
SECTION 3. GROWTH IN FOREIGN SHARE OVER TIME
The growth in the representation of foreign students among doctorate recipients from U.S. universities captures changes on both sides of the market for graduate education. In particular, the growth reflects some combination of the following circumstances: 1) shifts in demand for graduate study among foreign born arising from changes in the sending country, 2) shifts in demand arising from changes in institutions that affect the “costs” of matching students with U.S. graduate programs, including the development of international networks, and 3) adjustments in the supply-side or offerings of U.S. universities that differentially affect foreign students.
The forces affecting the representation of foreign students in U.S. doctorate education are presented through a basic supply-demand framework. “Demand shocks” generated by increases in the number of undergraduates (potentially) prepared for graduate study from abroad are one dimension of change. Those countries with relatively high BA growth might be expected to expand in the share of PhDs received from U.S. institutions. Growth in the size of cohorts prepared for graduate study (for simplicity, those with the BA) is the most obvious type of demand shift varying across countries. Such shifts may include growth in the fraction of college graduates or shifts in cohort size, varying in magnitude and timing across countries. Over the course of the last half century, a number of political transformations such as the fall of communism in the Soviet bloc or the normalization of relations with China have dramatically altered the demand for graduate study in the U.S. among foreign students.
Beyond changes in the number of students prepared for graduate work in a country, a related change in demand comes from the development of networks that reduce the costs of foreign study. Following dynamic models similar to the Carrington et al. (1996) of the South-North migration of blacks in the first half of the 20th century, successful experiences of initial migrants lead to dramatic reductions in information costs among those in later cohorts. Students from specific regions or foreign universities may establish links with U.S. programs; in turn, U.S. universities may use past experience in recruiting and selecting students. Such network effects have the long term result of increasing the relative benefits of pursuing doctorate study and the share of students from abroad pursuing graduate study in the U.S. By lowering the costs and increasing the value of graduate education in the U.S., such networks serve to shift the demand for graduate education in the U.S.
The supply-side of the U.S. market for graduate education is by no means fixed over time. Because doctorate-level students do not pay full tuition for their studies, the availability of opportunities is likely to be determined by research funding and other institutional sources of support, including state funding and demand for teaching assistants. These sources of support have varied over time, with federal funding for science stagnant from the 1970s through the mid-
Internationalization of U.S. Doctorate Education 14
1980s. Then, beginning in the mid 1980s, there were quite substantial increases in federal research funding to colleges and universities in both the physical sciences and the health sciences. As a result, we expect supply shocks affect the doctorate education market. Increases in research funding or direct public support for graduate programs in the U.S. have the effect of increasing the number of opportunities for study in U.S. graduate programs. If the elasticity of demand for graduate study among those from abroad is greater than for the U.S. (perhaps because the opportunity cost is study in another country rather than a different career), funding shifts will yield relatively larger responses in degree attainment among foreign students, resulting in increasing share with positive shocks and decreasing share with adverse shocks.
When the fraction of a country’s potential doctorate students choosing to study in the U.S. is initially small (or when there is excess demand among foreign students for U.S. programs), expansions in U.S. opportunities could plausibly have proportionately larger effects on the number of individuals pursuing a degree in the U.S. than when the share pursuing degrees is already quite large. A second explanation is that when foreigners considering studying in the U.S. have alternatives that are close substitutes (e.g., studying in Australia) elasticity of demand will be much higher. For those from the U.S., the alternative to pursuing a PhD at a U.S. university is unlikely to be a close substitute, demand will likely be more inelastic, and the change in graduate study in response to a supply shock somewhat more limited. Evidence on changes in the share of foreign PhDs
A starting point for understanding the dynamic in the variation in the representation of foreign students among U.S. doctorate recipients is to examine how country and field specific patterns differ from overall trends, which are presumably a function of secular changes. Table 3 illustrates country and field of PhD degree receipt relative to total degrees awarded by U.S. universities at the start of each decade and during the peak 1994-96 interval. In terms of growth rates, PhD receipt for U.S. residents has lagged overall university doctorate production, particularly since about 1980 (refer back to Figures 1 and 3). For foreign countries, several “regimes” are apparent. Canada, as well as the U.K., represent one case where degrees awarded by U.S. institutions largely echo the overall trend. South Korea, India (except in engineering), China and Germany are cases where PhDs awarded by U.S. universities to students from these countries far outstrip the secular trend through much of the 1980s. Doctorate program quality
Expansion in doctorate attainment at U.S. institutions among foreign students is not uniform among differently ranked graduate programs and, indeed, much of the growth recorded
Internationalization of U.S. Doctorate Education 15
from the mid-1980s to the mid-1990s occurred at PhD programs outside the most highly-ranked. Figure 4 shows doctorates awarded to foreign students by rank of program. In physics, biochemistry, and chemistry much of the expansion in doctorate receipt to foreign students occurs at unranked programs or those ranked outside the top-50; while the growth in foreign students in engineering is distributed more evenly among programs. Among students from China, Taiwan and South Korea growth has been particularly concentrated outside the most highly ranked institutions. Demand changes at the country level
A basic proposition is that growth in undergraduate degree attainment is likely to translate to increases in the overall demand for doctorate-level training and, specifically, growth in the number of students pursuing PhDs at U.S. institutions. Figure 5 illustrates the time-trend in BA degree attainment in the sciences by country relative to the U.S. The top two panels of Figure 5 show the growth of undergraduate degrees relative to the base year of 1975 for European (and Canada) countries and Asian countries, respectively, and the final panel shows the number of degrees awarded by year in China. The top panel, which illustrates relative BA attainment for North American and European countries, shows near parity among countries from the 1976 BA year through 1985. Then, there is retrenchment in the number of BA degrees awarded in the US (and to a lesser extent the UK) as birth cohorts shrank markedly in subsequent years. In the other countries in this panel, degree attainment continues to rise into the 1990s, reflecting somewhat different demographic trends and net increases in collegiate attainment within cohorts.
The trends in North American and European countries are quite modest when seen in comparison to changes BA degree receipt among Asian countries (second panel). Most dramatically, BA degrees awarded in Korea grew by about 150% over the period shown in the graph. Both India and Taiwan witness considerable growth in BA degree attainment during the years in which BA degrees awarded in the U.S were stagnant. The most dramatic story, however, is the case of China, with the number of science and engineering degrees shown in the bottom panel. Although consistent data on the number of science and engineering degrees are difficult to piece together for China until the mid-1980s, undergraduate degree attainment has risen meteorically over the past quarter century in China, rising from near zero in the mid-1970s to more than 330,000 BA degrees in science and engineering fields at the start of the 21st century.
What the trends in undergraduate degrees by country suggest is that those countries with growth relative to the U.S. at the undergraduate level may translate to increased demand for doctorate education from U.S. institutions. Figure 6 illustrates this point in a general sense, with
Internationalization of U.S. Doctorate Education 16
the annual rate of growth in BA degrees on the x axis and the annual rate of growth in PhDs awarded by U.S. universities (7 years later) on the y-axis. While the link is by no means exact – with some countries well above and below unity – the relationship is clearly positive. What is more, the figure makes clear the variation in the expansion of undergraduate degree attainment across countries. At one extreme, the U.S., U.K., and Japan hover at growth below 2 percent while South Korea evidences growth in BA attainment over 10%. China – as we discuss shortly – is a case that is literally “off the chart” in terms of the growth in PhDs awarded between 1982 and 1992.
That there are a number of countries such as Germany, Italy and India where the growth in PhDs awarded by U.S. institutions outstrips the home country growth in BA degree receipt suggests that growth in undergraduate degree production is but one factor determining the rise in the representation of foreign students among doctorate recipients from U.S. universities. We note that the growth in the presence of students from Germany and Italy in U.S. PhD programs reflects ‘catching up’ to other European countries in U.S. doctorate receipt. We also suspect that dramatic growth in PhD programs in Korea and Taiwan over the last decade (see Table 1) may have recently begun to have an effect on the relative attractiveness of U.S. PhD programs for students from these countries.
While it would be hard, if not impossible, to quantify the importance of the growth of networks for explaining the growing representation for foreigners in U.S. PhD programs, anecdotal evidence points to their importance. Repeatedly we have been told of cases where someone from, for example, Italy was encouraged to seek graduate education outside of Italy by a professor who, himself, had been trained in the U.S. We also find the students from particular countries tend to be over represented in particular PhD programs. Thus, for example, in economics, Italians are over represented at MIT, Columbia and NYU, while students from India are underrepresented at Harvard and over represented at Rochester, Columbia, Boston University and Cornell. In contrast, in physics, Italians are again overrepresented at MIT, while students from India are overrepresented at Ohio, Stony Brook, Maryland, Rochester and Texas. Such patterns are consistent with the importance of department and institution specific networks.
Country-specific shocks
Beyond gradual changes in the demand for U.S. doctorate training generated by expansion in home-country BA production among countries with long-standing diplomatic and trade ties with the United States, political shifts produce sharp changes foreign students’ access to the U.S. education market. Two of the most dramatic examples include the entry to the U.S. of PhD students from China in the early 1980s and the dramatic decline in the flow of PhD students from Iran in the late 1970s. Figure 7 illustrates these transformations for China and
Internationalization of U.S. Doctorate Education 17
Iran. Representing the data by year of birth (in the right panels of figure 7) shows clearly the cohort specific effects which tend to be somewhat attenuated when the data are arranged by year of PhD given the natural variation in time to degree.
China. China represents the most extreme case. In the first part of the twentieth century there was relatively extensive exchange between the U.S. and Chinese universities, with many of China’s leading scientists trained in the U.S. Exchange with western universities changed dramatically at mid-century. During Mao’s “Cultural Revolution” from 1966 to 1976 university activity was largely disrupted. The establishment of diplomatic relations with the United States in 1979 dramatically changed the level of educational exchange with China. China sought to jump start its development process through access to science and engineering technology through U.S. university education and, at least initially, most students and scholars visiting the U.S. from China came on J or exchange visas. A disproportionate share of the first wave of exchange students coming to the U.S. were related to high-level Chinese officials, including the son of Deng Xiaoping and the son of the Foreign Minister (Wong, 1981), though there was also considerable competition among U.S. universities to identify the most talented among the Chinese students.
The establishment of networks early on was particularly important in opening doctorate education. One important example was the China-United States Physics Examination and Application (CUSPEA) program initiated in the fall of 1979 by the Chinese-American Nobel Laureate physicist T.D. Lee of Columbia University. The intent of the initiative was to identify gifted graduate students through examination in China and to place these students at U.S. universities. During the course of the program from CUSPEA placed more than 900 students in physics programs at U.S. universities.20
When we look at the data for China organized by year of birth or year of college entry, the cohorts born in 1962-63 and entering college in 1978 are extraordinary in representation among U.S. PhD recipients in the sciences. These cohorts captured considerable pent up demand for undergraduate education and represented the first full class of students admitted to Chinese universities by competitive examination in the aftermath of the Cultural Revolution. Add to this strong encouragement from the government to study abroad combined with relatively few domestic opportunities, many students from this cohort received PhDs from U.S. universities. To illustrate the unusual impact of this single cohort, we note that of the PhD degrees awarded to students from China in the decade between 1985 and 1994, 46.6% of the 11,197 PhDs awarded
20 To put these numbers in perspective, the total number of PhD degree recipients from China receiving degrees in physics between 1980 and 1992 was 1062. Of course, there were other channels through which Chinese students could study physics in the U.S., but the CUSPEA program clearly had a substantial impact in generating a network or link between leading U.S. and Chinese universities.
Internationalization of U.S. Doctorate Education 18
to students from China had started college in 1978. What is more, if one eliminates this cohort the “downturn” in degrees awarded to students from China after 1995 virtually disappears.
Iran. While the case of students from China over the course of the last two decades is one of increased involvement with U.S. universities, Iran represents a counterexample. In the late 1960s and early 1970s, Iranian doctorate attainment – particularly in engineering – rose rapidly, reflecting movements of the country to modernize and improve technological infrastructure, particularly in relation to the petroleum industry.21 The political upheaval associated with the fall of the Shah in January 1979 and the hostage crisis at the American embassy in Tehran in 1979 brought an abrupt halt to the substantial participation of Iranian students in U.S. graduate education. While entry of graduate students stopped largely after 1979, it is plain that many students of Iranian origin chose to stay in the U.S. to finish their graduate studies. What is apparent in Figure 7 is the sharp drop-off in degree attainment by birth cohort and the more gradual decline by year of degree receipt.
Eastern Europe and Former Soviet Union. In the years before 1989, barely a trickle of students from the Soviet Union completed doctorate degrees in the United States, with most of those students likely related to political émigrés. Then, perestroika in the Gorbachev years initiated modest exchange of graduate students and scholars (Chronicle of Higher Education, October 11, 1989). But the collapse of the former Soviet Union also led to significant declines among the traditional Soviet universities, which had long standing strengths in the physical sciences and had been generously supported by the government during the Cold War. By one estimate, funding for science in Russia declined 44.2% between 1989 and1991 (Shkolnikov, 1995). The result was an exodus of scholars and graduate students to the United States and universities in Europe and Israel. In the Eastern European countries of Bulgaria, Czechoslovakia, Romania, Hungary and Poland, there are similar shifts in the flow of doctorates students to the U.S. corresponding to political transitions of the late 1980s and early 1990s.
21 In Iran, the oil boom of the early seventies brought a half a dozen new universities and an
increased premium on western-trained academics (Pace, New York Times, 1976). In addition, many relatively affluent Iranian families paid to send their children to U.S. universities and, by one estimate, as many as 50,000 Iranian students were attending educational institutions in the U.S. before the fall of the Shah, accounting for one-fifth of the foreign student population in 1979. With the crisis following the Iranian revolution in the U.S., Iranian students were severely limited in their capacity to finance studies in the U.S. and student visas were unattainable as diplomatic relations ceased. At the extreme, institutions like the University of Southern California had as many as 1,000 students from Iran. While many universities were able to make accommodations fro Iranian students, it was the small colleges that suffered financial setbacks with the political shock. For example, the small Windham College in Vermont depended on Iranians for 30% of its enrollment and went out of business when these students were unable to make tuition payments (Hechinger, 1979).
Internationalization of U.S. Doctorate Education 19
In summarizing the country-specific trends in doctorate attainment at U.S. universities, it is clear that both secular growth in home country undergraduate education and the sharp changes produced by political transformations in countries like China affect the representation of foreign students at U.S. universities. It is also the case – if somewhat more difficult to measure directly – that the establishment of networks providing information about U.S. universities and opportunities builds the floor of foreign students to U.S. universities. Yet, the flow of students to U.S. doctorate programs need not reflect a permanent exodus of the highly skilled from the sending country to the U.S. (what is sometimes described as “brain drain”); there is clear evidence that the initial flows following political transitions capture considerable “pent up demand” which subsides, particularly with investment in home-country universities (Blanchard, Bound, and Turner, 2008).22 SECTION 4. STAGNATION IN DEGREE RECEIPT AMONG U.S. STUDENTS
While funding for science at U.S. universities has increased in the last two decades, the number of PhDs in the sciences awarded to students from the U.S. has been largely stagnant over the last two decades, falling somewhat in economics and rising only modestly in the life sciences. The number of PhDs awarded to those from the U.S. in 2003 in the physical sciences, engineering, and economics remains below corresponding numbers from 1970. How do we explain the relatively anemic participation of students from the U.S. in doctorate level science? Undergraduate degree attainment in the U.S.
As we indicated before (Figure 5), the growth in the number of individuals receiving undergraduate degrees in the sciences has been quite muted in the US. Change in cohort size plays a central role in these trends. In the U.S., the size of the college-age population (and, by extension the broad pool of potential PhD recipients) grew rapidly with the college entry of the baby-boom cohorts, peaked in the mid-1970s, and then declined through the early 1990s. Thus, despite the fact that the fraction of cohorts obtaining undergraduate degrees in science and engineering during the 1980s and early 1990s rose at an average rate of 2 % per year, the number of science and engineering BA’s hardly rose at all. As Figure 6 suggests, the growth in the number of science and engineering PhDs being granted to U.S. residents is in line with the growth in the number of BAs awarded in science and engineering fields in the U.S. Indeed, Figure 6 would suggest that the slow growth in the number of Science and Engineering BAs
22 See also Regets (2001) for a thoughtful discussion of determinants and timing of migration
decisions of highly-skilled.
Internationalization of U.S. Doctorate Education 20
being awarded in the U.S, relative the growth in other countries can go a long way towards explaining the drop in the U.S. share of science and engineering PhDs in the country. Beyond overall changes in undergraduate degree attainment, the progression from baccalaureate attainment to PhD completion has varied appreciably over the last four decades. The ratio of PhD receipt to BA receipt organized by year of BA rose during the early 1960s, fell through the 1970s and has subsequently maintained a plateau. This ratio peaked at 0.056 in 1964 and had fallen to about 0.025 percent by 1974. Figure 8 makes this presentation at the level of field of study, aligning PhDs by the year in which individuals received BA degrees in relation to the number of BA degrees awarded in a given year. While the number of PhDs awarded in these sciences and engineering fields rose over the 1980s and early 1990s (Figure 3), the ratio of PhDs to BAs did not change appreciably for those completing their undergraduate work (and potentially considering graduate study) in the 1980s.
The growth of foreign students among overall PhD recipients and PhD recipients from U.S. institutions affects the flow of potential U.S. doctorate students through two potential channels. First, U.S. students may face increased competition for “slots” or admission to the most highly ranked programs, which typically have considerable excess demand. Second, beyond potential “crowd out” effects in higher education, the overall growth in the number of foreign doctorates (both those who obtained their degrees in the US and those who migrated after receiving their degrees) is likely to have had a substantial effect on the labor market returns to PhD awards in science (Bound and Turner, 2006). Direct crowd out of U.S. students by foreign students
An important question is how changes in demand for U.S. doctorate education from foreign students affect the level and distribution of doctorate attainment among U.S. students. Changes in the rate at which U.S. students complete PhD programs may reflect both student demand and the availability of opportunities in graduate programs. It is surely possible that, with a limited supply of places in graduate programs, the presence of foreign students may change opportunities for U.S. born students, potentially initiating “crowd out” at the doctorate level.23 It
23 Some previous research attempts to estimate the extent to which foreign graduate students tend to crowd out U.S. students. In general, there is little conclusive evidence to support substantial crowd-out effects. Using data from the Survey of Graduate Students and Postdocs and variation within academic departments, Regets (2001) finds a largely positive association between enrollment of U.S. students and foreign students. Borjas (2007) uses within institution variation in graduate student enrollment measured in the IPEDS surveys and finds a negative effect of foreign enrollment on the level of enrollment of white men, though little effect on domestic enrollment in aggregate. This previous research is limited to the extent that increases in the representation of foreign students in U.S. graduate programs may well be endogenously related to other factors such as the availability of funding simultaneously affecting the demand for graduate students.
Internationalization of U.S. Doctorate Education 21
is hard to estimate the counter-factual of how large the growth of PhD programs would have been in the absence of this substantial inflow of foreign students. Some “crowd out” – with foreign students lowering degree attainment among U.S. residents is likely to follow as U.S. students become less likely to receive admission offers from the top programs and expansion in the total number of degrees awarded reduces expected wages. Yet, estimates of “crowd out” are inherently difficult to estimate because it is necessary to separate increases in demand among foreign students from other factors such as funding shocks which would lead to increases in scale of graduate programs.
The magnitude of crowd out effects ultimately depends on the elasticity of supply in U.S. doctorate programs. We suspect that at least in the short run, additional foreign students reduce the number of U.S. students 1:1 in the most highly ranked programs where nearly all students enter with full funding and class size is essentially fixed. Somewhat further down the distribution of program quality, programs appear to be much more elastic in scale. Indeed, for the programs that are unranked or ranked very modestly, the period of growth in the 1960s and early 1970s represented both expansion in scale and the entry of new programs; the entry of new programs in this category was extraordinary, with a threefold increase in the primary science fields. As the market contracted in the 1970s and then expanded in the 1980s, the adjustment came in terms of the scale of programs, with apparently few programs either exiting or entering the market.
The case of the sharp increase in demand among Chinese graduate students beginning in the early 1980s presents a clear opportunity to assess the adjustment of the U.S. market to a sharp demand shock. Figure 9 illustrates using the example of the field of physics with the data on doctorates awarded by year of graduate school entry, which makes the magnitude of the change among the Chinese students all the more striking. At top ranked programs, the number of additional students from China is small and there is little discernable change in the overall number of PhDs awarded. At the other extreme (bottom right panel), the number of Chinese students receiving PhDs from universities outside the top-50 increased from 7 to 202 between the 1980 year of graduate entry and the 1985 year of graduate school entry. Notably, this large “shock” produced no notable decline in PhDs awarded to U.S. students at these institutions, with this number actually rising slightly from 164 to 199, while the number of students from other countries receiving PhDs also rose over this interval of graduate school entry. Data for other fields show similar patterns. Remarkably, this large cohort of Chinese students had no discernable impact on the number of U.S., or for that matter, other foreign students receiving PhDs in the sciences.
We found this evidence that the large influx of Chinese students in the early 1980s seemed to have no noticeable crowd out effects surprising. We suspect a combination of factors
Internationalization of U.S. Doctorate Education 22
may have been at work. This was a period of time in which funding for the sciences in general and the physical sciences in particular, was expanding rapidly. One senior physicist described how the influx of Chinese students at his research university met a need and allowed the department to expand, as funding for physics remained glowing in the 1980s with the persistence of Cold War federal funding. At the same time the number of undergraduates from the U.S. obtaining degrees in the physical and life sciences was stagnate or declining and the size of college age population in the U.S. was declining.24 Thus, the capacity for U.S. graduate programs to expand rapidly had they relied on U.S. students might have been quite limited. Thus, it is unclear whether under different circumstances a similar demand shock would work in the same way (i.e. have no impact on other groups).25 With this in mind we did similar analyses using data from the former Soviet Union and Iran. Unfortunately, these shocks were not large enough for them to provide useful information with respect to crowd out. Our analysis suggests that substantial changes in the doctorate study of foreign students have not led to direct crowd out of the best and brightest U.S. students in top programs, as much of the expansion in study among students from abroad has come in less highly ranked programs. Opportunity cost of PhD attainment for U.S. students
Examination of the trends in the labor market rewards for PhD scientists in the U.S. relative to other high-skill workers over the last quarter century suggests that the relative returns to advanced study in the sciences have not increased.26 Earnings of those early-career advanced degrees in the sciences have actually decreased in relation to the earnings of other college-educated workers, with the latter having risen overall in the last two decades as is well-known.
24 Note that the decline in the number of science and engineering BA degree recipients is largely a
reflection of the decline in cohort size from its peek in the late 1970s. 25 It is worth also considering whether the absence of crowd that we see among doctorate recipients
would also be apparent if we were able to examine first-year enrollment by country of origin over a long horizon. One hypothesis is that the new foreign students – particularly in the case of the Chinese – replaced relatively weak domestic students, many of whom might have been expected to bow out of doctorate programs with MA degrees after experiencing difficulties at the stage or qualifying or preliminary exams. Because the entering Chinese students were often extremely well technically prepared, the examinations in early stages of graduate study were less likely to be substantial hurdles to completion.
26 Our data on the earnings of early career advanced degree recipients in the sciences come from two sources, which tell similar stories. First, the Survey of Doctorate Recipients is a stratified random sample of PhD recipients from U.S. universities across potential cohorts and provides earnings observations in odd years from 1973 to 2001, with data from the precursor National Register of Scientific and Technical Personnel providing evidence from 1958 to 1970. In addition, the Faculty Salary Survey series provides salaries by field and rank for public universities.
Internationalization of U.S. Doctorate Education 23
Before turning to the earnings evidence, an important structural shift in the expected career paths of advanced degree recipients in science and engineering fields is the increasing reliance and expectation for post-doc appointments. Freeman, Weinstein, Marincola, and Solomon (2001) note that the time between graduate school entry and completion of training in the life sciences has increased from less than 10 years in 1970s to over 11.8 years in the 1990s, largely reflecting the increased expectation of post-doctorate appointments and the extended duration of these appointments. Similarly, National Science Foundation data show a dramatic increase in the number of PhDs holding post-doctorate appointments in university departments of science and engineering between 1981 and 1998, rising from approximately 18,000 to 39,000. Relatively low wages associated with post-doc appointments combined with the increased uncertainty about permanent employment prospects detract from some of the attractive features of investment in doctorate level training and careers in the sciences. Further, it may be that beyond the decline in relative earnings associated with science and engineering, these careers may be particularly unattractive given the long hours and difficulties in accommodating two-career families in university labor markets.
The labor market provides considerable clues in understanding why there has not been a larger response among U.S. students to opportunities for doctorate study. Figure 10 shows the trends in salaries by field for those within ten years of doctorate receipt, from 1973 to the present. The dashed line represents the corresponding trend for BA recipients (ages 25-34) more generally, calculated from the CPS. To be sure, real earnings of doctorate level scientists have increased over the last decade. Yet, as indicated by the dashed line to the field-specific series, the increases in the earnings of scientists have risen less rapidly than BA recipients more generally, with the exception of the physical sciences where the changes are near equal.
Focusing just on faculty labor markets, the rate of growth for young academics in the sciences has lagged that realized by college educated workers. Examining faculty salaries at public institutions by rank and field in all of the broad science fields, the average annual rate of growth in academic salaries is less than 2% in both the 1980s and the 1990s, based on data from the Faculty Salary Survey (Oklahoma State University, various years). In comparison, the rate of grown in real earnings across all young workers with a BA degree was about 2.6% from 1994 to 2003.27 In effect, scientists employed in academics have done less well than college-educated workers more generally in the last decade.
Moreover, there is some evidence that there have been changes in the profile of academic salaries by rank over the course of the last three decades. The ratio of earnings of junior faculty to senior faculty has decreased over time, with the ratio of assistant to full salaries in the physical
27 This rate of growth in earnings is yet larger if the comparison group is advanced degree recipients in the CPS.
Internationalization of U.S. Doctorate Education 24
sciences falling from .62 in 1974-1975 to .57 in 2003-04 and the ratio of assistant to full salaries in the physical sciences falling from .69 in 1974-1975 to .59 in 2003-04 in the life sciences based on data from the Faculty Salary Survey. [Economics is an exception, presumably as the non-academic market remains strong in economics, with the ratio of junior to senior faculty salaries holding roughly constant over the interval.] Because reaching full professor is not guaranteed, this shift works to reduce incentives to enter science as rewards appear to have become more concentrated toward the senior level.
What is striking is that growth in the earnings of new advanced degree recipients in science and engineering fields in the last two decades is muted relative to the overall market for college-educated workers. In contrast, during the scientific boom years of the late 1950s and the early 1960s, the increases in the salaries of scientists with advanced degrees tended to outstrip overall changes in earnings of college graduates (see Table 4 as well as Freeman (1975)). It seems likely that other factors in addition to the rise in relative salaries were increasing the demand for graduate education during the 1950s and 60s. Academic jobs were relatively plentiful in this period owing to the expansion of undergraduate education through the early 1970s and the federal government continued to provide substantial resources for the funding of scientific research. Moreover, the availability of student deferments provided an incentive for men to enter graduate school and persist toward the PhD as a means to avoid military service in the late 1960s.28
Suggested by this comparison is a case that there has been a structural change in the labor market for those with advanced degrees in science and engineering. Where there were once only a modest number of potential students from foreign countries there are now, literally, thousands of potential students from countries like China. The resulting shift in the demand for U.S. doctorate programs over the last quarter century is surely central to the rising representation of foreign students among doctorate recipients from U.S. institutions. In turn, funding shocks (refer back to Figure 2) in the sciences appear are accommodated by foreign students as well as U.S. students, leading to much smaller changes in the wages of scientists and engineers in recent years relative to the 1950s and 1960s.
28 For cohorts graduating from college in the early 1960s, the availability of 2-S deferments from
military service for graduate study encouraged many students to seek out doctorate programs as a refuge from the risk of the draft. Then, in 1967, the provision allowing exemption for graduate study was eliminated. Under the Selective Service Act of 1967, which became effective June 30, 1967 and Executive Order 11360, there would be a one-year grace period through the end of academic year 1967-1968 and then no more 2-S deferments would be granted to graduate students (except as specifically written into the law). Support for the proposition that the incentive to avoid military service inflated doctorate enrollment and attainment during this period is provided by the much larger relative decline in the progression of men relative to women into graduate education (Bowen, Turner, and Witte; 1992).
Internationalization of U.S. Doctorate Education 25
Analysis of the science and engineering labor market of the 1960s and 1970s found considerable empirical support for cob-web cycles in the labor market, with changes in labor market demand resulting in sharp fluctuations in wages. Boom periods led to substantial increases in the returns to science, where declines in funding brought about sharp downturns, resulting from the relative inelastic supply of scientific labor associated with the long time lag to doctorate production (see, for example, Blank and Stigler, 1957 and Freeman, 1975). Yet, funding changes for science in the 1980s and 1990s did not lead to sharp increases in wages for scientists.
One explanation is that the labor market drew in lots of foreign-trained scientists, in addition to retaining a number of foreign students educated in the U.S., resulting in few incentives for U.S. students to change investments in scientific training. Many foreign-born workers among the highly skilled enter the U.S. having completed graduate study abroad. Indeed, a substantial number of foreigners first enter the U.S. as post doctoral scholars (National Academy of Sciences, 2005).29 According to the 2000 Census, close to 20% of foreign born PhDs in the U.S. had immigrated within the last four years, too short a time to obtain a PhD.
Where the supply of those trained at the highest level in science and engineering disciplines in the United States might have accurately been described as inelastic in the short-run during the 1960s, this structural feature of the science and engineering labor market appears to have eroded.30 As such, our hypothesis is that the science and engineering labor market is much more internationally integrated now than three decades ago. The result is that changes in the labor demand for scientists are much more likely to be accommodated in the near term. The decision to stay in the U.S. by those from other countries receiving PhDs from U.S. institutions is one mechanism for adjustment. In addition, the U.S. remains a “net importer” of doctorate degree recipients from other countries, which can be seen in the comparison of the number of doctorates awarded by U.S. institutions by country and year of birth and the representation of doctorate recipients by country in the decennial Census files.
29 Data presented in a recent National Academy of Sciences report showed that of the 60 percent of
academic postdocs who hold temporary visas, about 80 percent have non-U.S. doctorates (p. 35), implying that about one-half of all U.S. postdocs in academic institutions have PhD degrees from abroad.
30 The detailed evidence on the earnings of those in faculty position in the sciences and PhD recipients employed in the U.S. makes clear that this group of workers did not capture the rents to increases in federal funding for sciences in the last two decades as suggested by Goolsbee (1998). Instead, we believe the measures employed in this analysis capture essentially the secular changes in wages to the college-educated in this period (which, in turn, are correlated with science funding) rather than the effect of federal funding on the earnings of advanced degree recipients in science and engineering fields relative to other college-educated workers.
Internationalization of U.S. Doctorate Education 26
SECTION 5. CONCLUSIONS AND DISCUSSION
An undisputed empirical point is that there has been a dramatic rise in the share of doctorate degrees awarded by U.S. institutions to students from other countries. How do we explain the determinants of this change and the resulting variation in the countries of origin of these doctorate recipients in science and engineering fields? There is no single explanation for this quite dramatic change. And, perhaps more significantly, there is considerable variation across countries in the magnitude of the change in U.S. doctorate receipt and the underlying causal forces.
A substantial part of the increased representation in foreign students can be explained in terms of growth in the demand for U.S. PhD programs generated by the expansion of undergraduate degree attainment in countries like South Korea with relatively modest university systems (particularly as they existed two decades ago). Changes in political circumstances – as with the cases of China and the former Soviet Union – also produce sharp changes in the flow of doctorate students to the U.S. university system. With substantial differences in home country opportunities, it is natural that students from countries where options are more limited will be distributed at a broader range of institutions (and less concentrated at the highest quality programs) than students from countries where opportunities are closer to those found in the U.S. Still, increases in demand for doctorate study among foreign students cannot account for the full expansion of foreign doctorate attainment or the relative stagnation in attainment among U.S. students, particularly in the 1990s. Substantial increases in public support for science and engineering research fueled supply-side expansion in many fields. It is quite plausible that elasticity of demand and associated response to such shocks among foreign students may be somewhat larger than for U.S. based students. Beyond direct supply-side shifts, the role of international networks and the process by which they have expanded over the last quarter century surely contributes to the internationalization of U.S. doctorate education. That growth in PhD receipt among U.S. students in the sciences has not kept pace with the outcomes for foreign students is also likely a response to the labor market for advanced degree recipients in these fields. Despite what is perceived as a relative “boom” period for scientific fields in the 1990s, the earnings gains for advanced degree recipients in the sciences actually trailed those of college educated workers more generally. To this end, it should the educational choices of U.S. students should be no surprise. A change that is remarkable, nevertheless, is the increased internationalization of the labor market for advanced degree recipients in science and engineering fields. One immediate effect of this transformation is the reduction of the large swings in the earnings of scientists associated with changes in federal support for research.
Internationalization of U.S. Doctorate Education 27
Much more work is yet to be done before one can present a full analysis of the welfare effects of the “internationalization” of both doctorate education and the science and engineering labor market. We suspect that the resources of U.S. research universities are a lure for the best and the brightest across the world. If there are benefits to concentrating talent (agglomeration effects), then international output is expanded. With some foreigners trained in the U.S. returning to their home countries, there are surely home country benefits if these scientists are able to spur development of science, while also engaging in the exchange of ideas internationally through networks developed in the U.S. Benefits also accrue in the U.S., as the influx of scientists –trained in both the U.S. and abroad – reduces labor costs and increases the flexibility in the supply of science and engineering workers. Yet, all these benefits come with some costs and it seems clear that some individuals would have pursued advanced degrees in science and engineering in the absence of the substantial foreign flow in to graduate education and the labor market.
Internationalization of U.S. Doctorate Education 28
REFERENCES
Berelson, B. 1960. Graduate Education in the United States, New York: McGraw- Hill. Blanchard, Emily; John Bound and Sarah Turner. 2008. “Opening (and Closing) Doors: Country-
Specific Shocks in U.S. Doctorate Education.” In Ron Ehrenberg (Ed) Doctoral Education and the Faculty of the Future. Cornell University Press. Ithaca, NY.
Blank, D. and G. Stigler. 1957. The Demand and Supply of Scientific Personnel. No. 62. General Series National Bureau of Economic Research. New York: National Bureau
Borjas, G. 2007. “Do Foreign Students Crowd Out Native Students from Graduate Programs?” in Science and the University, P. Stephan and R. Ehrenberg (eds). Madison: University of Wisconsin Press.
Bound, J. and S. Turner. 2006. “International Flows of College-Educated Workers: Estimates of the Effect on Skilled Workers in the United States” work in progress University of Michigan and University of Virginia.
Bowen, W. and N. Rudenstine. 1992. In Pursuit of the Phd. Princeton: Princeton University Press. Bowen, W.; M. Kurzweil and E. Tobin. 2005. Equity and Excellence in American Higher Education.
Charlottesville: University of Virginia Press. Bowen, W., S. Turner, and M. Witte. 1992. “The B.A.-Ph.D. Nexus.” Journal of Higher Education, Vol.
63, No. 1 (Jan. - Feb., 1992) , pp. 65-86 Carrington, W.; E. Detragiache and T Vishwanath. 1996. “Migration with Endogenous Moving Costs.”
The American Economic Review, Vol. 86, No. 4 (September), 909-930. Finn, M. 2003. Stay Rates of Foreign Doctorate Recipients from U.S. Universities. Oak Ridge, TN: Oak
Ridge Institute for Science and Engineering. http://www.orau.gov/orise/pubs/stayrate03.pdf Freeman, R., 1975. “Supply and Salary Adjustments to the Changing Science Manpower Market:
Physics, 1948-1973” American Economic Review, Vol. 65, No. 1 (March), 27-39 Freeman, R.; Chang, T. and H. Chiang. 2005. “Supporting ‘The Best and Brightest’ in Science and
Engineering: NSF Graduate Research Fellowships.” NBER Working Paper No. 11623. Freeman,R.; E. Weinstein, E. Marincola, J. Rosenbaum, F. Solomon. 2001. “Competition and Careers in
Biosciences” Science, Vol 294, 5550, 2293-2294 , 14 December. Freeman, R.; E. Jin and C. Shen. 2004. “Where do U.S. Trained Science and Engineering PhDs Come
From?” NBER Working Paper No. 10554. Gereffi, G.; V. Wadhwa, B. Rissing, R. Ong. 2008. “Getting the Numbers Right: International
Engineering Education in the United States, China, and India.” Journal of Engineering Education. 97 (1), pp. 13-25.
Goolsbee, A. 1998.”Tax and Human-Capital Policy Does Government R&D Policy Mainly Benefit Scientists and Engineers?” The American Economic Review, Vol. 88, No. 2, Papers and Proceedings of the Hundred and Tenth Annual Meeting of the American Economic Association. (May), 298-302.
Hechinger, F. 1979. “Iranian Plight Puts a Spotlight on U.S. Colleges.” New York Times (February 20), p. c 4.
Kwok, V. and H. Leland. 1982. “An Economic Model of the Brain Drain.” The American Economic Review, Vol. 72, No. 1. (March), 91-100.
Lowell, L. 2000. “H-1B Temporary Workers: Estimating the Population” http://www.ieeeusa.org/policy/issues/H1bvisa/h1breport.pdf
Maeroff, G. 1979. “Colleges Facing Decline, Advised to Lure Students.” New York Times (Januray 1), p. 6.
Internationalization of U.S. Doctorate Education 29
National Academy of Science-National Research Council. 1958. Doctorate Production in United States Universities 1936-1956 with Baccalaureate Origins of Doctorates in Sciences, Arts and Humanities. Publication 582.
National Academy of Sciences. 2005. Rising Above The Gathering Storm: Energizing and Employing America for a Brighter Economic Future. Committee on Science, Engineering, and Public Policy.
National Research Council. 1995. Research-Doctorate Programs in the United States: Continuity and Change. National Academy of Sciences, Washington, D.C. 1995.
National Science Board. 1996. Science and Engineering Indicators. National Science Foundation (http://nsf.gov/statistics/seind96/).
National Science Board. 2000. Science and Engineering Indicators. National Science Foundation (http://nsf.gov/statistics/seind00/).
National Science Board. 2004. Science and Engineering Indicators. National Science Foundation (http://nsf.gov/statistics/seind04/).
National Science Foundation. 1993. Human Resources for Science and Technology: The Asian Region, NSF 93-303 Washington, DC.
National Science Foundation. 1996. Human Resources for Science and Technology: The European Region, NSF 96-31. Washington, DC.
National Science Foundation. 1986. Foreign Citizens in U.S. Science and Engineering: History, Status and Outlook. (NSF 86-305) Washington DC.
Regents, M. 2001. “Research and Policy Issues in High-Skilled International Migration: A Perspective with Data from the United States.” IZA DP No. 366.
Roy, A.D. 1951. “Some Thoughts on the Distribution of Earnings,” Oxford Economic Papers Vol. 3, 135-146.
Shanghai Jiao Tong University, Institute of Higher Education. 2003. Academic Ranking of World Universities. http://ed.sjtu.edu.cn/ranking.htm
Shkolnikov, V. 1995. “Potential Energy: Emergent Emigration of Highly Qualified Manpower from the Former Soviet Union.” Rand Graduate School.
Stevens, Robert. 2004. University to Uni: The Politics of Higher Education in England since 1944.London, Politico’s p. xiii.
Sutton Trust. 2003. “Nobel Prizes: The Changing Pattern of Awards.” United Nations Educational, Scientific and Cultural Organization. 1963-1999. Statistical Yearbook. Paris:
UNESCO. Wong, J. 1981. “China’s Leap to American Campuses.” New York Times. (November 15).
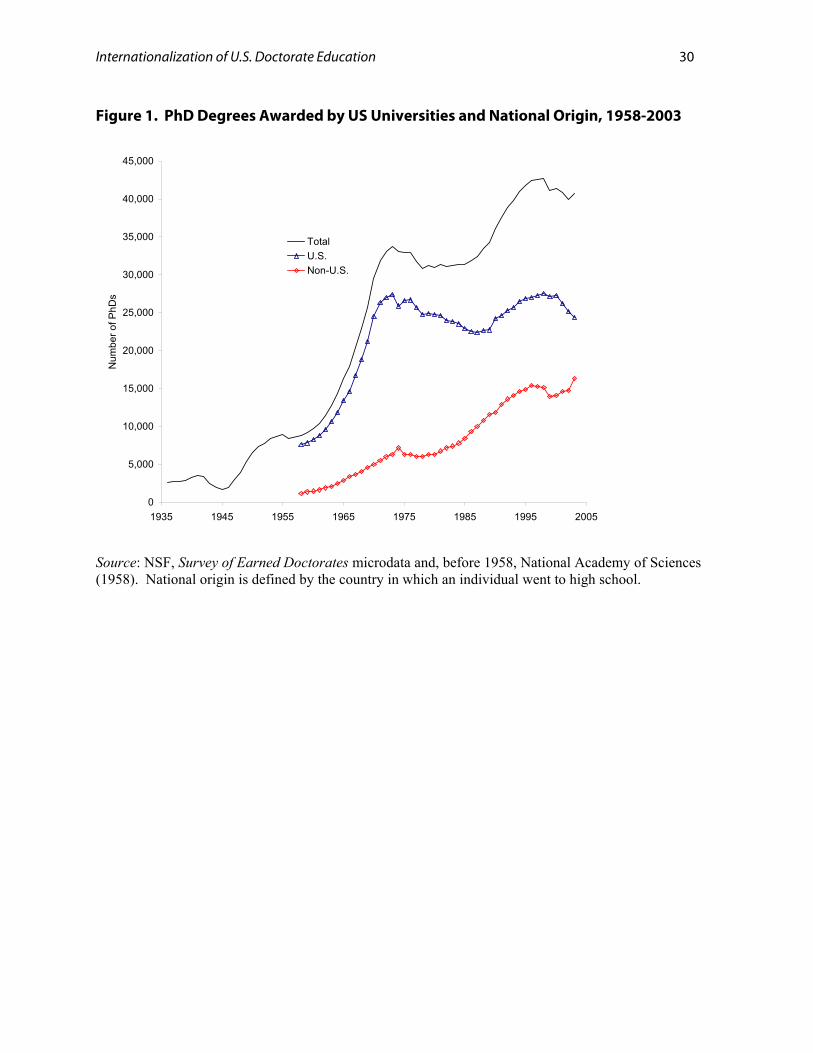
Internationalization of U.S. Doctorate Education 30
Figure 1. PhD Degrees Awarded by US Universities and National Origin, 1958-2003
0
5,000
10,000
15,000
20,000
25,000
30,000
35,000
40,000
45,000
1935 1945 1955 1965 1975 1985 1995 2005
Num
ber o
f PhD
s
TotalU.S.Non-U.S.
Source: NSF, Survey of Earned Doctorates microdata and, before 1958, National Academy of Sciences (1958). National origin is defined by the country in which an individual went to high school.
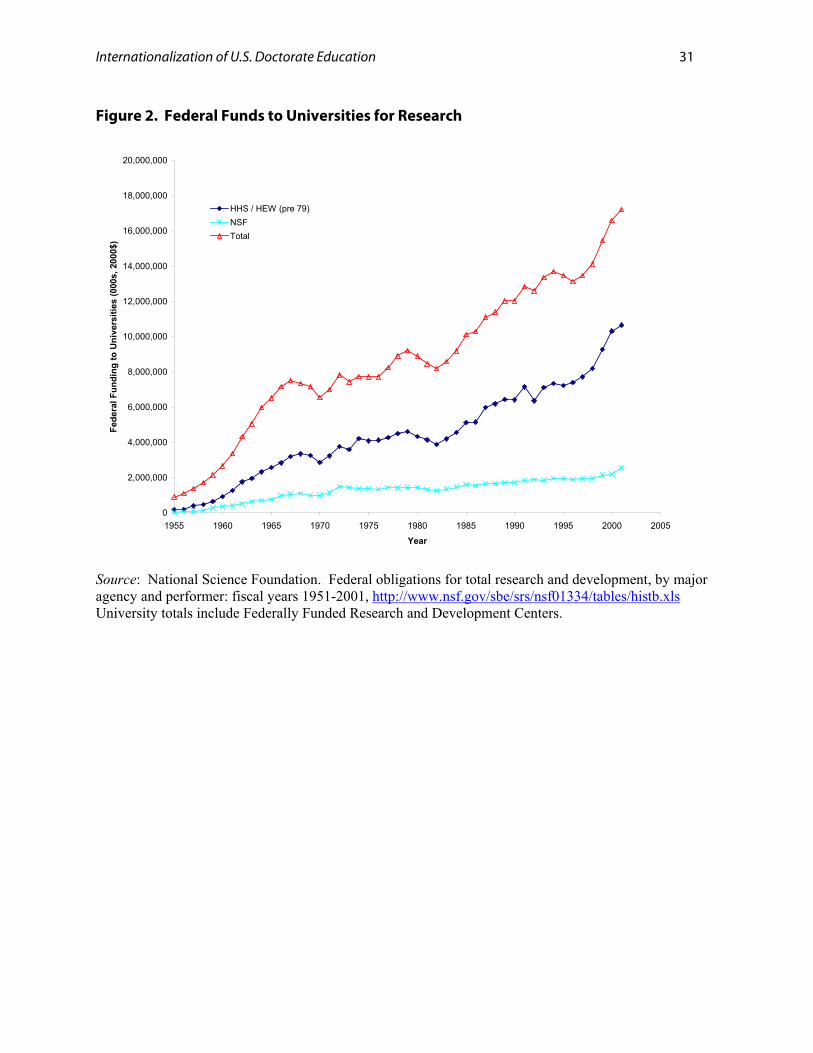
Internationalization of U.S. Doctorate Education 31
Figure 2. Federal Funds to Universities for Research
0
2,000,000
4,000,000
6,000,000
8,000,000
10,000,000
12,000,000
14,000,000
16,000,000
18,000,000
20,000,000
1955 1960 1965 1970 1975 1980 1985 1990 1995 2000 2005
Year
Fede
ral F
undi
ng to
Uni
vers
ities
(000
s, 2
000$
)
HHS / HEW (pre 79)NSFTotal
Source: National Science Foundation. Federal obligations for total research and development, by major agency and performer: fiscal years 1951-2001, http://www.nsf.gov/sbe/srs/nsf01334/tables/histb.xls University totals include Federally Funded Research and Development Centers.
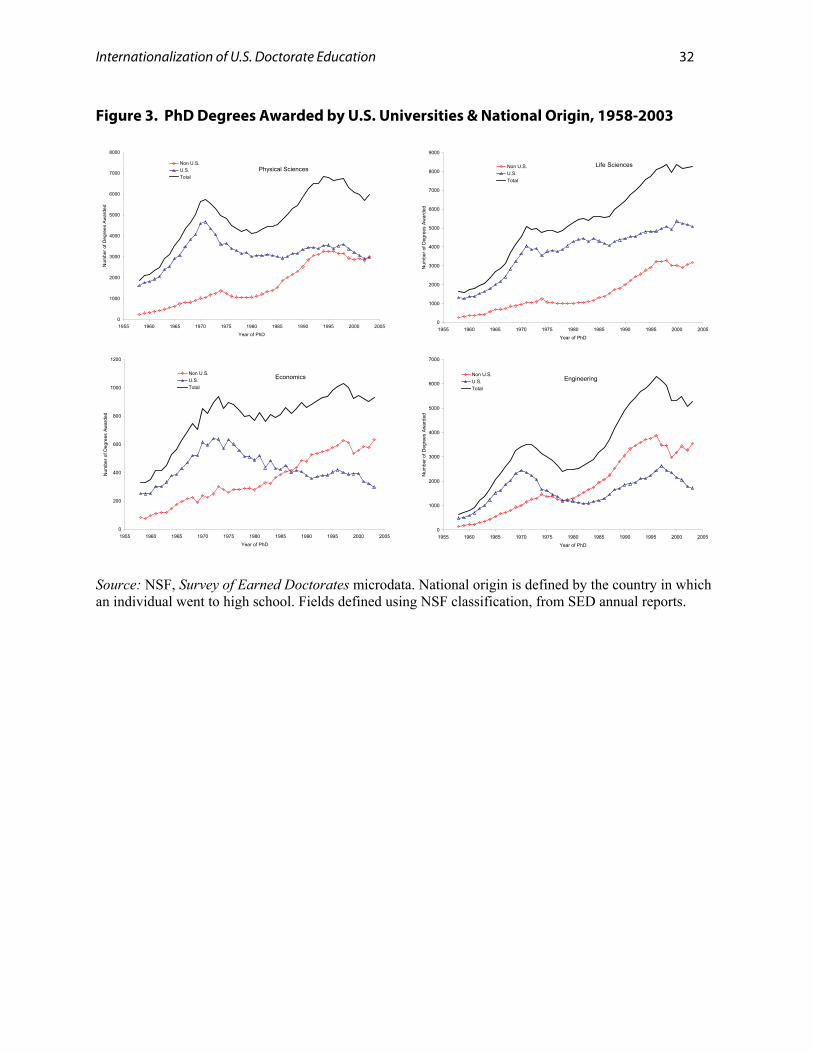
Internationalization of U.S. Doctorate Education 32
Figure 3. PhD Degrees Awarded by U.S. Universities & National Origin, 1958-2003
0
1000
2000
3000
4000
5000
6000
7000
8000
1955 1960 1965 1970 1975 1980 1985 1990 1995 2000 2005
Year of PhD
Num
ber o
f Deg
rees
Aw
arde
d
Non U.S.U.S.Total
Physical Sciences
0
1000
2000
3000
4000
5000
6000
7000
8000
9000
1955 1960 1965 1970 1975 1980 1985 1990 1995 2000 2005
Year of PhD
Num
ber o
f Deg
rees
Aw
arde
d
Non U.S.U.S.Total
Life Sciences
0
200
400
600
800
1000
1200
1955 1960 1965 1970 1975 1980 1985 1990 1995 2000 2005
Year of PhD
Num
ber o
f Deg
rees
Aw
arde
d
Non U.S.U.S.Total
Economics
0
1000
2000
3000
4000
5000
6000
7000
1955 1960 1965 1970 1975 1980 1985 1990 1995 2000 2005Year of PhD
Num
ber o
f Deg
rees
Aw
arde
d
Non U.S.U.S.Total
Engineering
Source: NSF, Survey of Earned Doctorates microdata. National origin is defined by the country in which an individual went to high school. Fields defined using NSF classification, from SED annual reports.
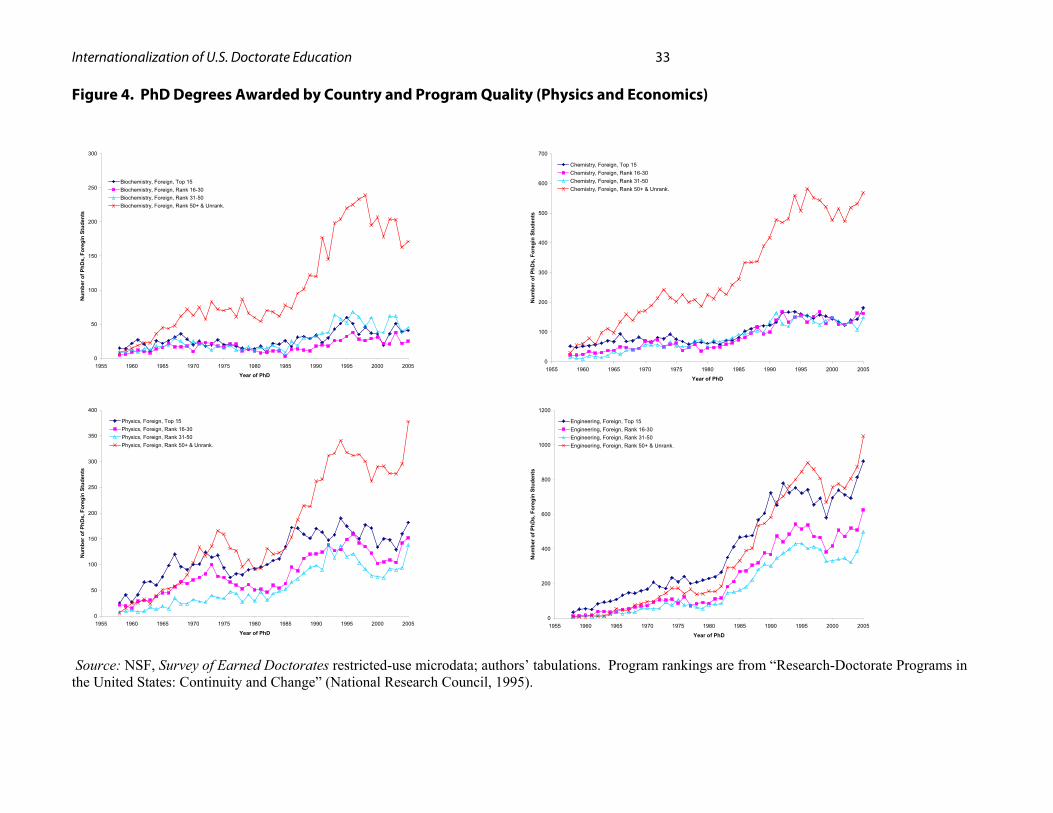
Internationalization of U.S. Doctorate Education 33 Figure 4. PhD Degrees Awarded by Country and Program Quality (Physics and Economics)
0
50
100
150
200
250
300
1955 1960 1965 1970 1975 1980 1985 1990 1995 2000 2005
Year of PhD
Num
ber o
f PhD
s, F
oreg
in S
tude
nts
Biochemistry, Foreign, Top 15Biochemistry, Foreign, Rank 16-30Biochemistry, Foreign, Rank 31-50Biochemistry, Foreign, Rank 50+ & Unrank.
0
100
200
300
400
500
600
700
1955 1960 1965 1970 1975 1980 1985 1990 1995 2000 2005
Year of PhD
Num
ber o
f PhD
s, F
oreg
in S
tude
nts
Chemistry, Foreign, Top 15Chemistry, Foreign, Rank 16-30Chemistry, Foreign, Rank 31-50Chemistry, Foreign, Rank 50+ & Unrank.
0
50
100
150
200
250
300
350
400
1955 1960 1965 1970 1975 1980 1985 1990 1995 2000 2005
Year of PhD
Num
ber o
f PhD
s, F
oreg
in S
tude
nts
Physics, Foreign, Top 15Physics, Foreign, Rank 16-30Physics, Foreign, Rank 31-50Physics, Foreign, Rank 50+ & Unrank.
0
200
400
600
800
1000
1200
1955 1960 1965 1970 1975 1980 1985 1990 1995 2000 2005
Year of PhD
Num
ber o
f PhD
s, F
oreg
in S
tude
nts
Engineering, Foreign, Top 15Engineering, Foreign, Rank 16-30Engineering, Foreign, Rank 31-50Engineering, Foreign, Rank 50+ & Unrank.
Source: NSF, Survey of Earned Doctorates restricted-use microdata; authors’ tabulations. Program rankings are from “Research-Doctorate Programs in the United States: Continuity and Change” (National Research Council, 1995).
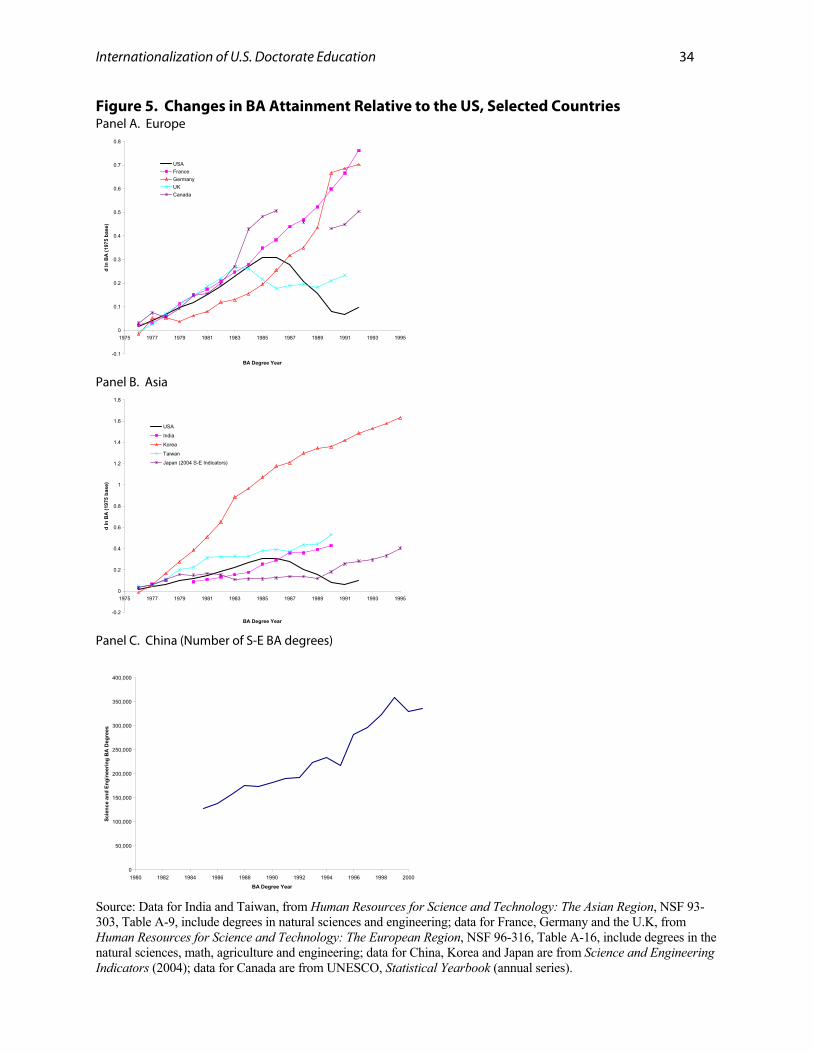
Internationalization of U.S. Doctorate Education 34
Figure 5. Changes in BA Attainment Relative to the US, Selected Countries Panel A. Europe
-0.1
0
0.1
0.2
0.3
0.4
0.5
0.6
0.7
0.8
1975 1977 1979 1981 1983 1985 1987 1989 1991 1993 1995
BA Degree Year
d ln
BA
(197
5 ba
se)
USAFranceGermanyUKCanada
Panel B. Asia
-0.2
0
0.2
0.4
0.6
0.8
1
1.2
1.4
1.6
1.8
1975 1977 1979 1981 1983 1985 1987 1989 1991 1993 1995
BA Degree Year
d ln
BA
(197
5 ba
se)
USA
India
Korea
Taiwan
Japan (2004 S-E Indicators)
Panel C. China (Number of S-E BA degrees)
0
50,000
100,000
150,000
200,000
250,000
300,000
350,000
400,000
1980 1982 1984 1986 1988 1990 1992 1994 1996 1998 2000
BA Degree Year
Scie
nce
and
Engi
neer
ing
BA
Deg
rees
Source: Data for India and Taiwan, from Human Resources for Science and Technology: The Asian Region, NSF 93-303, Table A-9, include degrees in natural sciences and engineering; data for France, Germany and the U.K, from Human Resources for Science and Technology: The European Region, NSF 96-316, Table A-16, include degrees in the natural sciences, math, agriculture and engineering; data for China, Korea and Japan are from Science and Engineering Indicators (2004); data for Canada are from UNESCO, Statistical Yearbook (annual series).
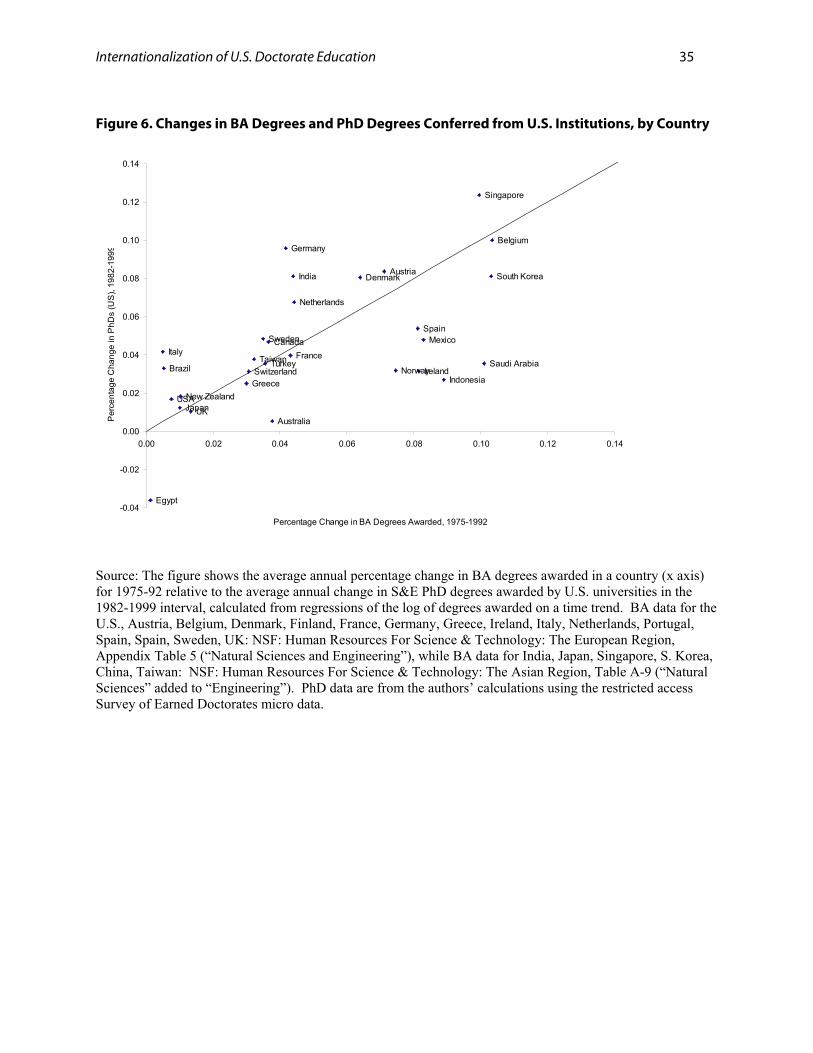
Internationalization of U.S. Doctorate Education 35
Figure 6. Changes in BA Degrees and PhD Degrees Conferred from U.S. Institutions, by Country
AustraliaJapanUK
USA
BrazilTaiwan
IrelandNorway
Egypt
Saudi ArabiaSwitzerlandGreece
Canada
Germany
India
Netherlands
Denmark
France
Singapore
ItalyMexico
New Zealand
Sweden
South Korea
Spain
Turkey
Belgium
Austria
Indonesia
-0.04
-0.02
0.00
0.02
0.04
0.06
0.08
0.10
0.12
0.14
0.00 0.02 0.04 0.06 0.08 0.10 0.12 0.14
Percentage Change in BA Degrees Awarded, 1975-1992
Per
cent
age
Cha
nge
in P
hDs
(US
), 19
82-1
999
Source: The figure shows the average annual percentage change in BA degrees awarded in a country (x axis) for 1975-92 relative to the average annual change in S&E PhD degrees awarded by U.S. universities in the 1982-1999 interval, calculated from regressions of the log of degrees awarded on a time trend. BA data for the U.S., Austria, Belgium, Denmark, Finland, France, Germany, Greece, Ireland, Italy, Netherlands, Portugal, Spain, Spain, Sweden, UK: NSF: Human Resources For Science & Technology: The European Region, Appendix Table 5 (“Natural Sciences and Engineering”), while BA data for India, Japan, Singapore, S. Korea, China, Taiwan: NSF: Human Resources For Science & Technology: The Asian Region, Table A-9 (“Natural Sciences” added to “Engineering”). PhD data are from the authors’ calculations using the restricted access Survey of Earned Doctorates micro data.
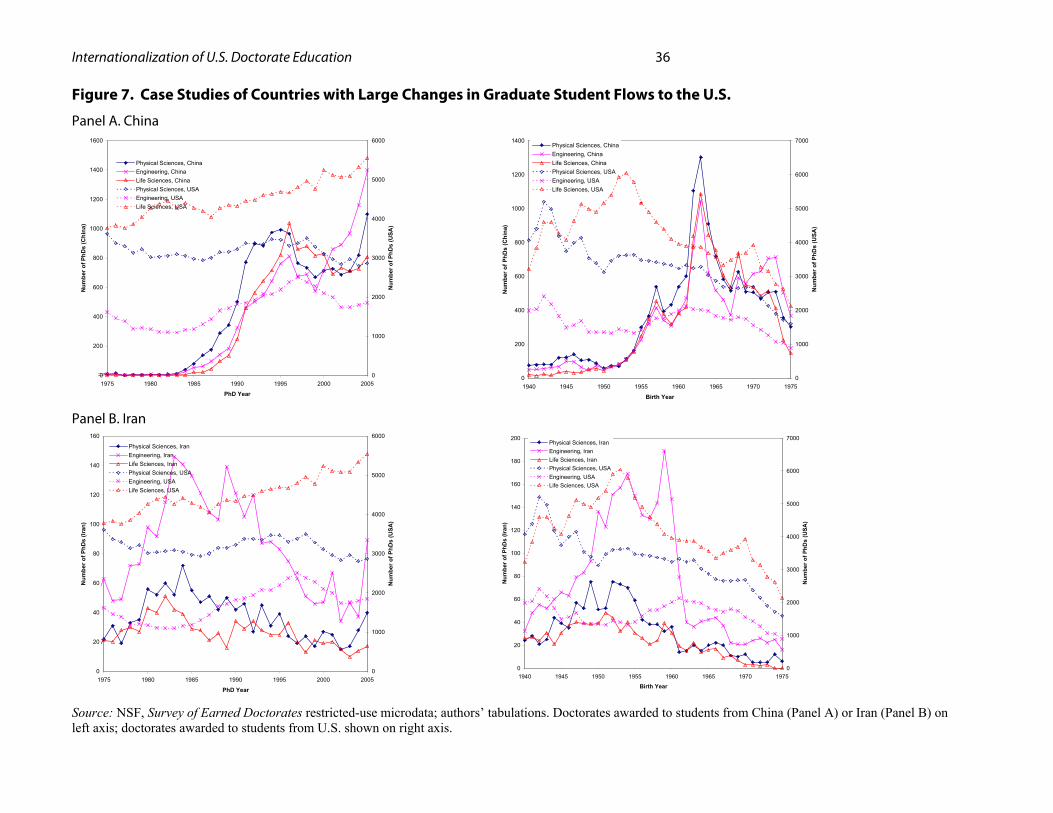
Internationalization of U.S. Doctorate Education 36 Figure 7. Case Studies of Countries with Large Changes in Graduate Student Flows to the U.S.
Panel A. China
0
200
400
600
800
1000
1200
1400
1600
1975 1980 1985 1990 1995 2000 2005
PhD Year
Num
ber o
f PhD
s (C
hina
)
0
1000
2000
3000
4000
5000
6000
Num
ber o
f PhD
s (U
SA)
Physical Sciences, ChinaEngineering, ChinaLife Sciences, ChinaPhysical Sciences, USAEngineering, USALife Sciences, USA
0
200
400
600
800
1000
1200
1400
1940 1945 1950 1955 1960 1965 1970 1975
Birth Year
Num
ber o
f PhD
s (C
hina
)
0
1000
2000
3000
4000
5000
6000
7000
Num
ber o
f PhD
s (U
SA)
Physical Sciences, ChinaEngineering, ChinaLife Sciences, ChinaPhysical Sciences, USAEngineering, USALife Sciences, USA
Panel B. Iran
0
20
40
60
80
100
120
140
160
1975 1980 1985 1990 1995 2000 2005
PhD Year
Num
ber o
f PhD
s (Ir
an)
0
1000
2000
3000
4000
5000
6000
Num
ber o
f PhD
s (U
SA)
Physical Sciences, IranEngineering, IranLife Sciences, IranPhysical Sciences, USAEngineering, USALife Sciences, USA
0
20
40
60
80
100
120
140
160
180
200
1940 1945 1950 1955 1960 1965 1970 1975
Birth Year
Num
ber o
f PhD
s (Ir
an)
0
1000
2000
3000
4000
5000
6000
7000
Num
ber o
f PhD
s (U
SA)
Physical Sciences, IranEngineering, IranLife Sciences, IranPhysical Sciences, USAEngineering, USALife Sciences, USA
Source: NSF, Survey of Earned Doctorates restricted-use microdata; authors’ tabulations. Doctorates awarded to students from China (Panel A) or Iran (Panel B) on left axis; doctorates awarded to students from U.S. shown on right axis.
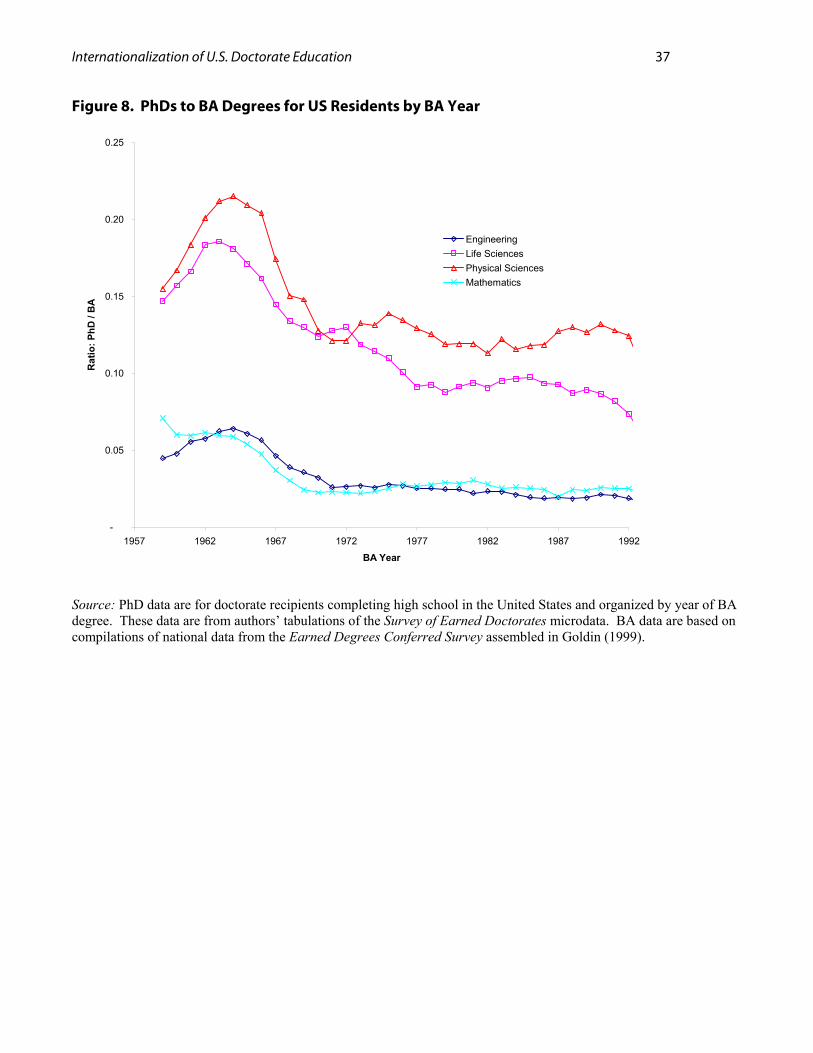
Internationalization of U.S. Doctorate Education 37
Figure 8. PhDs to BA Degrees for US Residents by BA Year
-
0.05
0.10
0.15
0.20
0.25
1957 1962 1967 1972 1977 1982 1987 1992
BA Year
Rat
io: P
hD /
BA
EngineeringLife SciencesPhysical SciencesMathematics
Source: PhD data are for doctorate recipients completing high school in the United States and organized by year of BA degree. These data are from authors’ tabulations of the Survey of Earned Doctorates microdata. BA data are based on compilations of national data from the Earned Degrees Conferred Survey assembled in Goldin (1999).
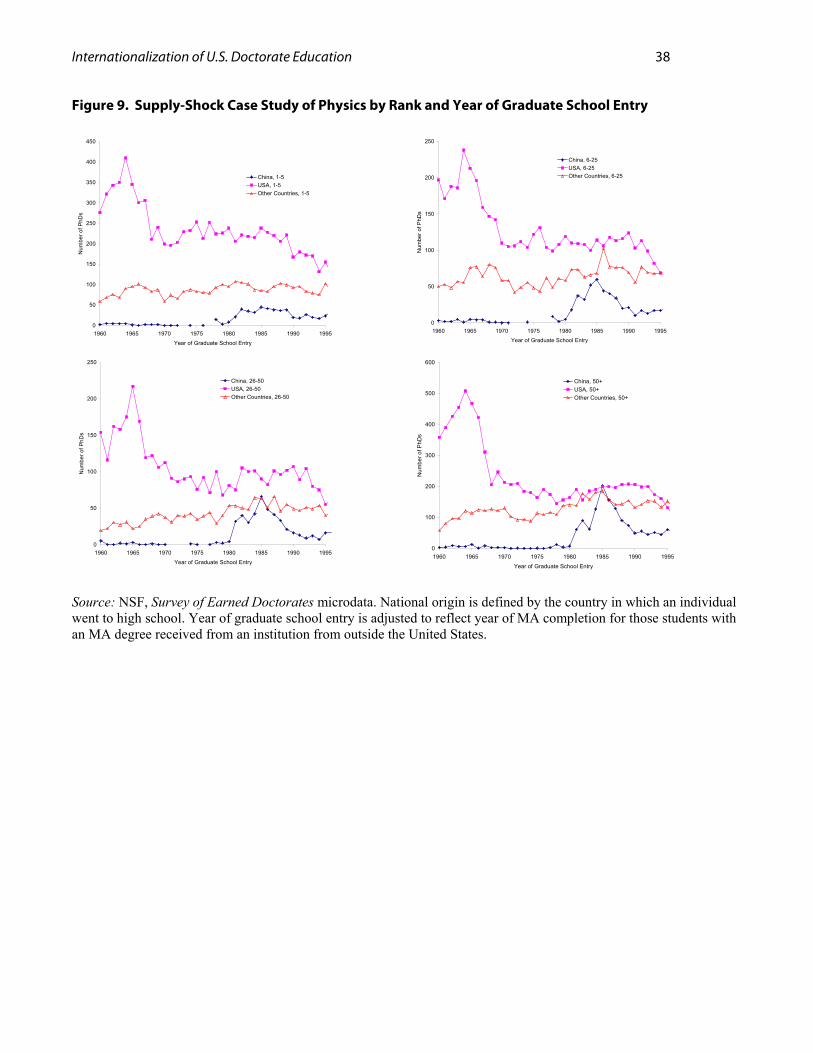
Internationalization of U.S. Doctorate Education 38
Figure 9. Supply-Shock Case Study of Physics by Rank and Year of Graduate School Entry
0
50
100
150
200
250
300
350
400
450
1960 1965 1970 1975 1980 1985 1990 1995Year of Graduate School Entry
Num
ber o
f PhD
s
China, 1-5USA, 1-5Other Countries, 1-5
0
50
100
150
200
250
1960 1965 1970 1975 1980 1985 1990 1995Year of Graduate School Entry
Num
ber o
f PhD
s
China, 6-25USA, 6-25Other Countries, 6-25
0
50
100
150
200
250
1960 1965 1970 1975 1980 1985 1990 1995
Year of Graduate School Entry
Num
ber o
f PhD
s
China, 26-50USA, 26-50Other Countries, 26-50
0
100
200
300
400
500
600
1960 1965 1970 1975 1980 1985 1990 1995Year of Graduate School Entry
Num
ber o
f PhD
s
China, 50+USA, 50+Other Countries, 50+
Source: NSF, Survey of Earned Doctorates microdata. National origin is defined by the country in which an individual went to high school. Year of graduate school entry is adjusted to reflect year of MA completion for those students with an MA degree received from an institution from outside the United States.
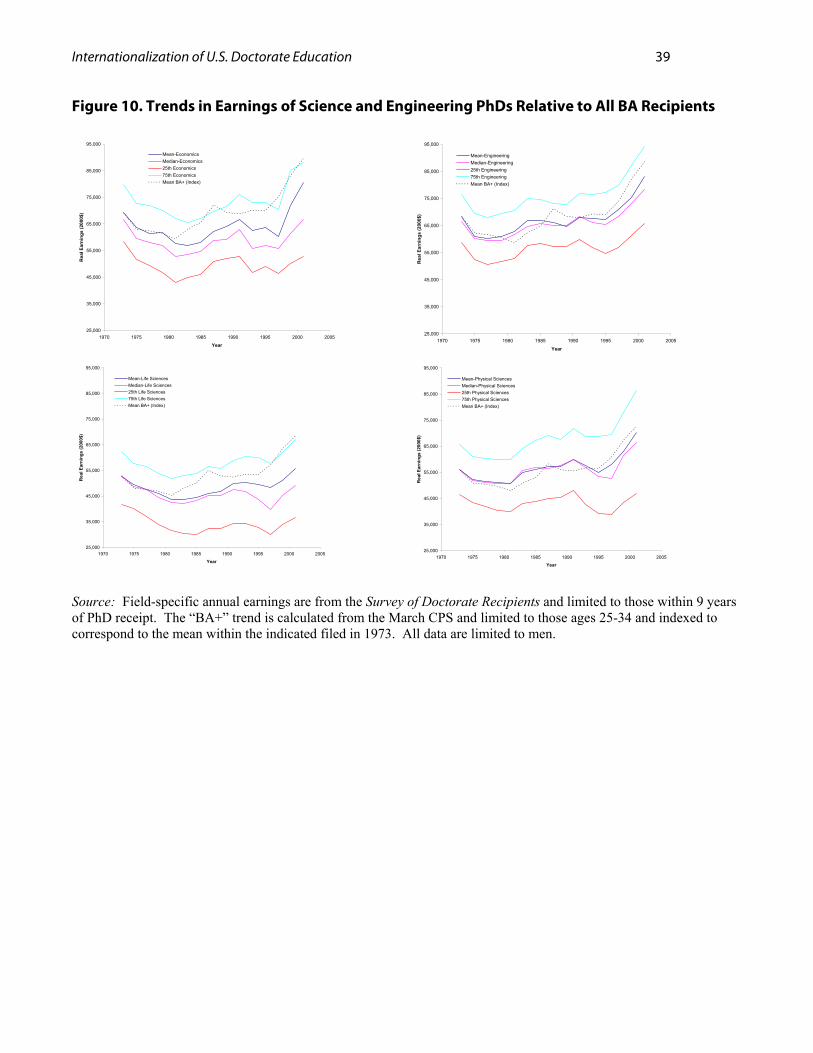
Internationalization of U.S. Doctorate Education 39
Figure 10. Trends in Earnings of Science and Engineering PhDs Relative to All BA Recipients
25,000
35,000
45,000
55,000
65,000
75,000
85,000
95,000
1970 1975 1980 1985 1990 1995 2000 2005
Year
Rea
l Ear
ning
s (2
000$
)
Mean-EconomicsMedian-Economics25th Economics75th EconomicsMean BA+ (Index)
25,000
35,000
45,000
55,000
65,000
75,000
85,000
95,000
1970 1975 1980 1985 1990 1995 2000 2005
Year
Rea
l Ear
ning
s (2
000$
)
Mean-EngineeringMedian-Engineering25th Engineering75th EngineeringMean BA+ (Index)
25,000
35,000
45,000
55,000
65,000
75,000
85,000
95,000
1970 1975 1980 1985 1990 1995 2000 2005
Year
Rea
l Ear
ning
s (2
000$
)
Mean-Life SciencesMedian-Life Sciences25th Life Sciences75th Life SciencesMean BA+ (Index)
25,000
35,000
45,000
55,000
65,000
75,000
85,000
95,000
1970 1975 1980 1985 1990 1995 2000 2005
Year
Rea
l Ear
ning
s (2
000$
)
Mean-Physical SciencesMedian-Physical Sciences25th Physical Sciences75th Physical SciencesMean BA+ (Index)
Source: Field-specific annual earnings are from the Survey of Doctorate Recipients and limited to those within 9 years of PhD receipt. The “BA+” trend is calculated from the March CPS and limited to those ages 25-34 and indexed to correspond to the mean within the indicated filed in 1973. All data are limited to men.
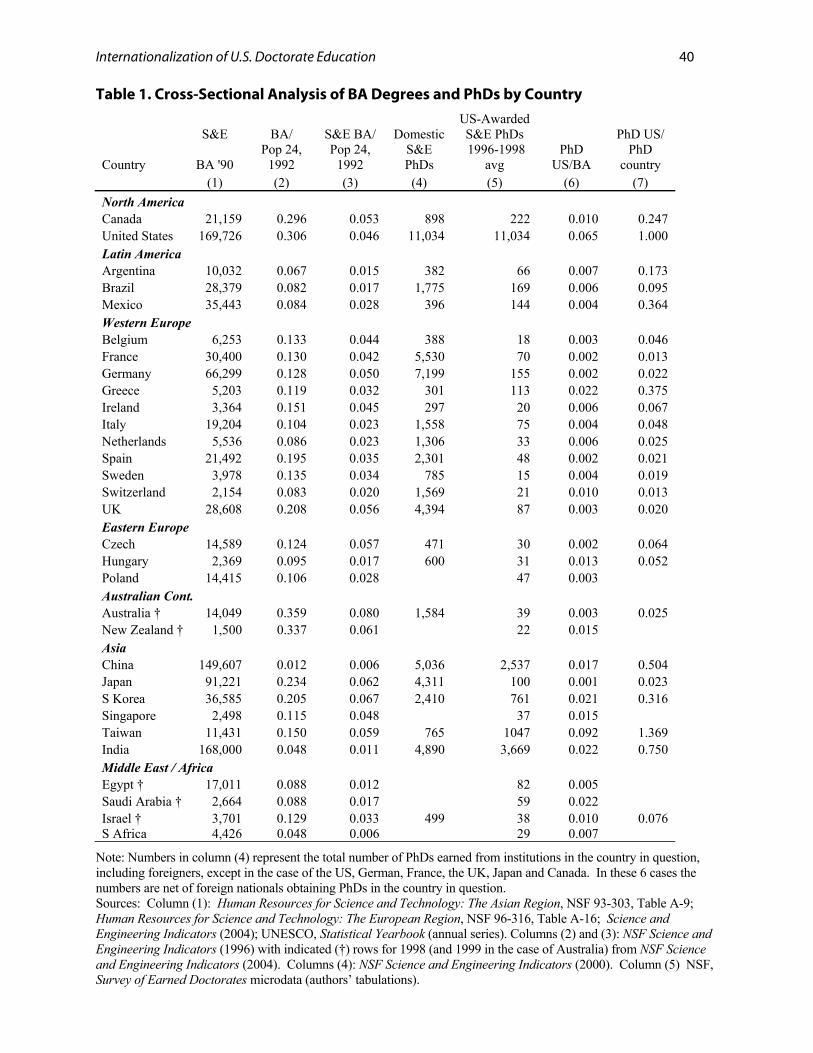
Internationalization of U.S. Doctorate Education 40
Table 1. Cross-Sectional Analysis of BA Degrees and PhDs by Country
S&E BA/ S&E BA/ Domestic US-Awarded S&E PhDs PhD US/
Country BA '90 Pop 24,
1992 Pop 24,
1992 S&E PhDs
1996-1998 avg
PhD US/BA
PhD country
(1) (2) (3) (4) (5) (6) (7) North America Canada 21,159 0.296 0.053 898 222 0.010 0.247 United States 169,726 0.306 0.046 11,034 11,034 0.065 1.000 Latin America Argentina 10,032 0.067 0.015 382 66 0.007 0.173 Brazil 28,379 0.082 0.017 1,775 169 0.006 0.095 Mexico 35,443 0.084 0.028 396 144 0.004 0.364 Western Europe Belgium 6,253 0.133 0.044 388 18 0.003 0.046 France 30,400 0.130 0.042 5,530 70 0.002 0.013 Germany 66,299 0.128 0.050 7,199 155 0.002 0.022 Greece 5,203 0.119 0.032 301 113 0.022 0.375 Ireland 3,364 0.151 0.045 297 20 0.006 0.067 Italy 19,204 0.104 0.023 1,558 75 0.004 0.048 Netherlands 5,536 0.086 0.023 1,306 33 0.006 0.025 Spain 21,492 0.195 0.035 2,301 48 0.002 0.021 Sweden 3,978 0.135 0.034 785 15 0.004 0.019 Switzerland 2,154 0.083 0.020 1,569 21 0.010 0.013 UK 28,608 0.208 0.056 4,394 87 0.003 0.020 Eastern Europe Czech 14,589 0.124 0.057 471 30 0.002 0.064 Hungary 2,369 0.095 0.017 600 31 0.013 0.052 Poland 14,415 0.106 0.028 47 0.003 Australian Cont. Australia † 14,049 0.359 0.080 1,584 39 0.003 0.025 New Zealand † 1,500 0.337 0.061 22 0.015 Asia China 149,607 0.012 0.006 5,036 2,537 0.017 0.504 Japan 91,221 0.234 0.062 4,311 100 0.001 0.023 S Korea 36,585 0.205 0.067 2,410 761 0.021 0.316 Singapore 2,498 0.115 0.048 37 0.015 Taiwan 11,431 0.150 0.059 765 1047 0.092 1.369 India 168,000 0.048 0.011 4,890 3,669 0.022 0.750 Middle East / Africa Egypt † 17,011 0.088 0.012 82 0.005 Saudi Arabia † 2,664 0.088 0.017 59 0.022 Israel † 3,701 0.129 0.033 499 38 0.010 0.076 S Africa 4,426 0.048 0.006 29 0.007
Note: Numbers in column (4) represent the total number of PhDs earned from institutions in the country in question, including foreigners, except in the case of the US, German, France, the UK, Japan and Canada. In these 6 cases the numbers are net of foreign nationals obtaining PhDs in the country in question. Sources: Column (1): Human Resources for Science and Technology: The Asian Region, NSF 93-303, Table A-9; Human Resources for Science and Technology: The European Region, NSF 96-316, Table A-16; Science and Engineering Indicators (2004); UNESCO, Statistical Yearbook (annual series). Columns (2) and (3): NSF Science and Engineering Indicators (1996) with indicated (†) rows for 1998 (and 1999 in the case of Australia) from NSF Science and Engineering Indicators (2004). Columns (4): NSF Science and Engineering Indicators (2000). Column (5) NSF, Survey of Earned Doctorates microdata (authors’ tabulations).
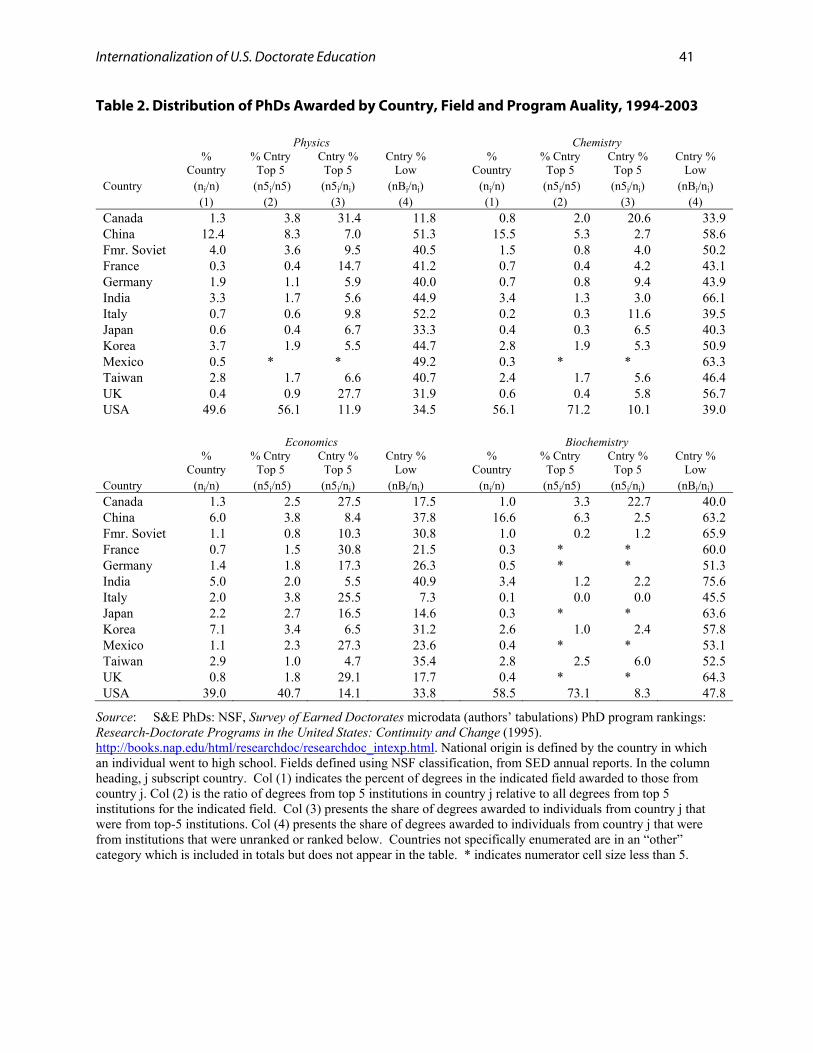
Internationalization of U.S. Doctorate Education 41
Table 2. Distribution of PhDs Awarded by Country, Field and Program Auality, 1994-2003
Physics Chemistry
%
Country % Cntry
Top 5 Cntry % Top 5
Cntry % Low
% Country
% Cntry Top 5
Cntry % Top 5
Cntry % Low
Country (nj/n) (n5j/n5) (n5j/nj) (nBj/nj) (nj/n) (n5j/n5) (n5j/nj) (nBj/nj) (1) (2) (3) (4) (1) (2) (3) (4) Canada 1.3 3.8 31.4 11.8 0.8 2.0 20.6 33.9 China 12.4 8.3 7.0 51.3 15.5 5.3 2.7 58.6 Fmr. Soviet 4.0 3.6 9.5 40.5 1.5 0.8 4.0 50.2 France 0.3 0.4 14.7 41.2 0.7 0.4 4.2 43.1 Germany 1.9 1.1 5.9 40.0 0.7 0.8 9.4 43.9 India 3.3 1.7 5.6 44.9 3.4 1.3 3.0 66.1 Italy 0.7 0.6 9.8 52.2 0.2 0.3 11.6 39.5 Japan 0.6 0.4 6.7 33.3 0.4 0.3 6.5 40.3 Korea 3.7 1.9 5.5 44.7 2.8 1.9 5.3 50.9 Mexico 0.5 * * 49.2 0.3 * * 63.3 Taiwan 2.8 1.7 6.6 40.7 2.4 1.7 5.6 46.4 UK 0.4 0.9 27.7 31.9 0.6 0.4 5.8 56.7 USA 49.6 56.1 11.9 34.5 56.1 71.2 10.1 39.0 Economics Biochemistry
%
Country % Cntry
Top 5 Cntry % Top 5
Cntry % Low
% Country
% Cntry Top 5
Cntry % Top 5
Cntry % Low
Country (nj/n) (n5j/n5) (n5j/nj) (nBj/nj) (nj/n) (n5j/n5) (n5j/nj) (nBj/nj) Canada 1.3 2.5 27.5 17.5 1.0 3.3 22.7 40.0 China 6.0 3.8 8.4 37.8 16.6 6.3 2.5 63.2 Fmr. Soviet 1.1 0.8 10.3 30.8 1.0 0.2 1.2 65.9 France 0.7 1.5 30.8 21.5 0.3 * * 60.0 Germany 1.4 1.8 17.3 26.3 0.5 * * 51.3 India 5.0 2.0 5.5 40.9 3.4 1.2 2.2 75.6 Italy 2.0 3.8 25.5 7.3 0.1 0.0 0.0 45.5 Japan 2.2 2.7 16.5 14.6 0.3 * * 63.6 Korea 7.1 3.4 6.5 31.2 2.6 1.0 2.4 57.8 Mexico 1.1 2.3 27.3 23.6 0.4 * * 53.1 Taiwan 2.9 1.0 4.7 35.4 2.8 2.5 6.0 52.5 UK 0.8 1.8 29.1 17.7 0.4 * * 64.3 USA 39.0 40.7 14.1 33.8 58.5 73.1 8.3 47.8
Source: S&E PhDs: NSF, Survey of Earned Doctorates microdata (authors’ tabulations) PhD program rankings: Research-Doctorate Programs in the United States: Continuity and Change (1995). http://books.nap.edu/html/researchdoc/researchdoc_intexp.html. National origin is defined by the country in which an individual went to high school. Fields defined using NSF classification, from SED annual reports. In the column heading, j subscript country. Col (1) indicates the percent of degrees in the indicated field awarded to those from country j. Col (2) is the ratio of degrees from top 5 institutions in country j relative to all degrees from top 5 institutions for the indicated field. Col (3) presents the share of degrees awarded to individuals from country j that were from top-5 institutions. Col (4) presents the share of degrees awarded to individuals from country j that were from institutions that were unranked or ranked below. Countries not specifically enumerated are in an “other” category which is included in totals but does not appear in the table. * indicates numerator cell size less than 5.
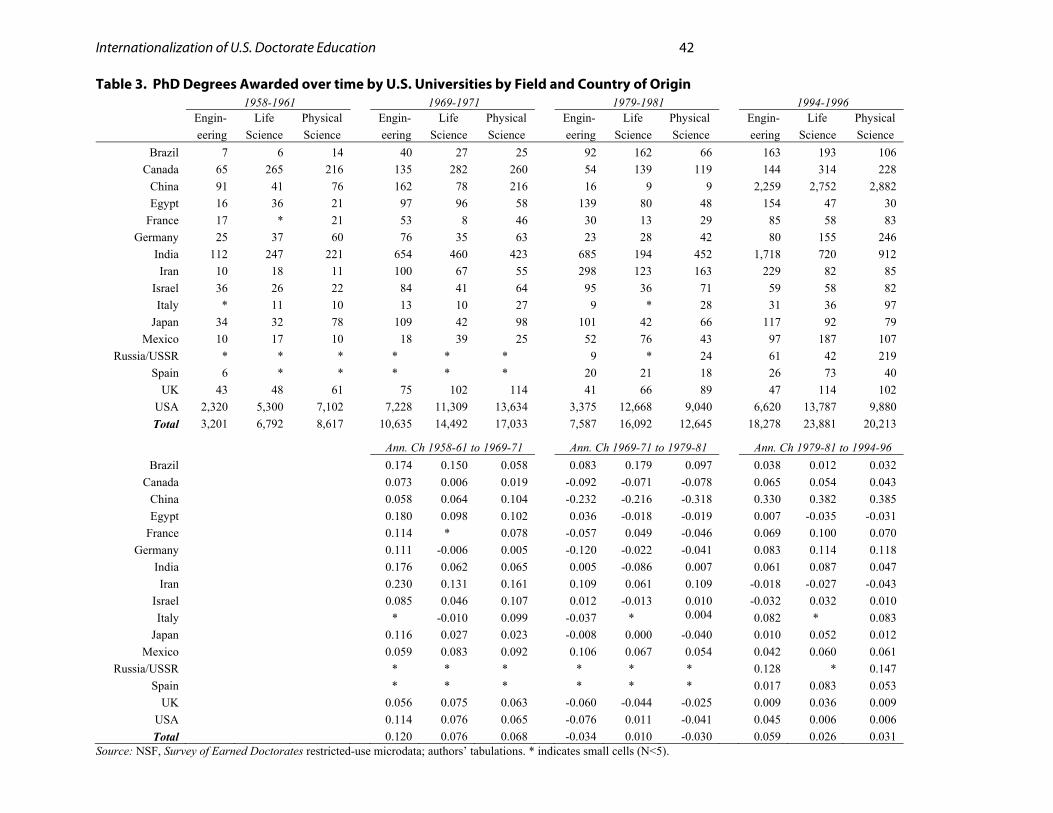
Internationalization of U.S. Doctorate Education 42
Table 3. PhD Degrees Awarded over time by U.S. Universities by Field and Country of Origin 1958-1961 1969-1971 1979-1981 1994-1996 Engin- Life Physical Engin- Life Physical Engin- Life Physical Engin- Life Physical eering Science Science eering Science Science eering Science Science eering Science Science
Brazil 7 6 14 40 27 25 92 162 66 163 193 106 Canada 65 265 216 135 282 260 54 139 119 144 314 228
China 91 41 76 162 78 216 16 9 9 2,259 2,752 2,882 Egypt 16 36 21 97 96 58 139 80 48 154 47 30
France 17 * 21 53 8 46 30 13 29 85 58 83 Germany 25 37 60 76 35 63 23 28 42 80 155 246
India 112 247 221 654 460 423 685 194 452 1,718 720 912 Iran 10 18 11 100 67 55 298 123 163 229 82 85
Israel 36 26 22 84 41 64 95 36 71 59 58 82 Italy * 11 10 13 10 27 9 * 28 31 36 97
Japan 34 32 78 109 42 98 101 42 66 117 92 79 Mexico 10 17 10 18 39 25 52 76 43 97 187 107
Russia/USSR * * * * * * 9 * 24 61 42 219 Spain 6 * * * * * 20 21 18 26 73 40
UK 43 48 61 75 102 114 41 66 89 47 114 102 USA 2,320 5,300 7,102 7,228 11,309 13,634 3,375 12,668 9,040 6,620 13,787 9,880 Total 3,201 6,792 8,617 10,635 14,492 17,033 7,587 16,092 12,645 18,278 23,881 20,213
Ann. Ch 1958-61 to 1969-71 Ann. Ch 1969-71 to 1979-81 Ann. Ch 1979-81 to 1994-96
Brazil 0.174 0.150 0.058 0.083 0.179 0.097 0.038 0.012 0.032 Canada 0.073 0.006 0.019 -0.092 -0.071 -0.078 0.065 0.054 0.043
China 0.058 0.064 0.104 -0.232 -0.216 -0.318 0.330 0.382 0.385 Egypt 0.180 0.098 0.102 0.036 -0.018 -0.019 0.007 -0.035 -0.031
France 0.114 * 0.078 -0.057 0.049 -0.046 0.069 0.100 0.070 Germany 0.111 -0.006 0.005 -0.120 -0.022 -0.041 0.083 0.114 0.118
India 0.176 0.062 0.065 0.005 -0.086 0.007 0.061 0.087 0.047 Iran 0.230 0.131 0.161 0.109 0.061 0.109 -0.018 -0.027 -0.043
Israel 0.085 0.046 0.107 0.012 -0.013 0.010 -0.032 0.032 0.010 Italy * -0.010 0.099 -0.037 * 0.004 0.082 * 0.083
Japan 0.116 0.027 0.023 -0.008 0.000 -0.040 0.010 0.052 0.012 Mexico 0.059 0.083 0.092 0.106 0.067 0.054 0.042 0.060 0.061
Russia/USSR * * * * * * 0.128 * 0.147 Spain * * * * * * 0.017 0.083 0.053
UK 0.056 0.075 0.063 -0.060 -0.044 -0.025 0.009 0.036 0.009 USA 0.114 0.076 0.065 -0.076 0.011 -0.041 0.045 0.006 0.006 Total 0.120 0.076 0.068 -0.034 0.010 -0.030 0.059 0.026 0.031
Source: NSF, Survey of Earned Doctorates restricted-use microdata; authors’ tabulations. * indicates small cells (N<5).
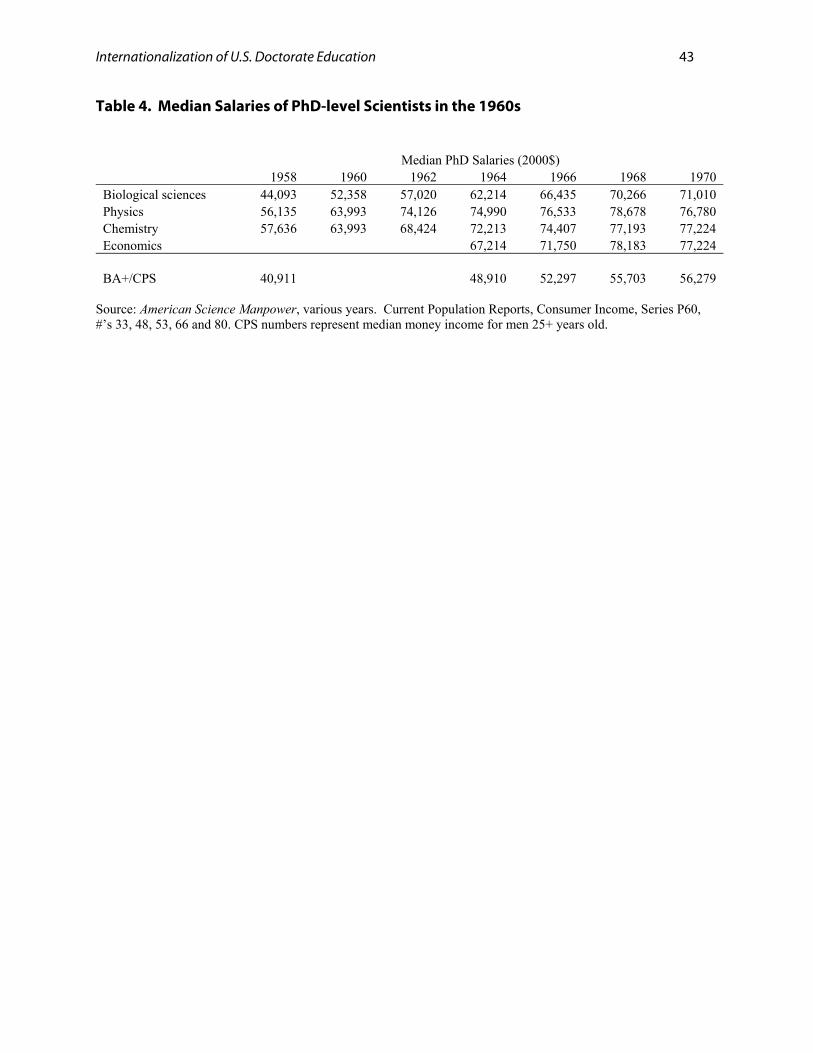
Internationalization of U.S. Doctorate Education 43
Table 4. Median Salaries of PhD-level Scientists in the 1960s
Median PhD Salaries (2000$) 1958 1960 1962 1964 1966 1968 1970 Biological sciences 44,093 52,358 57,020 62,214 66,435 70,266 71,010 Physics 56,135 63,993 74,126 74,990 76,533 78,678 76,780 Chemistry 57,636 63,993 68,424 72,213 74,407 77,193 77,224 Economics 67,214 71,750 78,183 77,224 BA+/CPS 40,911 48,910
52,297
55,703
56,279
Source: American Science Manpower, various years. Current Population Reports, Consumer Income, Series P60, #’s 33, 48, 53, 66 and 80. CPS numbers represent median money income for men 25+ years old.