Embed Size (px)
Citation preview
Interrater reliability and the assessment of pressure-sore risk using an adapted Waterlow Scale
M. Cook, C. Hale and B.Watson
Objective: the purpose of this paper is to highlight the issue and the complexi ty of the assessment of in terrater reliabil ity in the assessment of pressure sore risk.
Design: an empirical study undertaken to assess the in ter rater reliabil ity of an adapted Water low Scale is described.The scores obtained f rom 15 patients on two wards are presented. Each patient was assessed daily by two different nurses over a period of 7 days.A total of 210 assessments were obtained. In ter rater reliabil ity was assessed using two statistical techniques: percentage of agreement and correlation.
Setting: the elderly care unit of a distr ict general hospital in the Nor th of England.
Participants: twenty-eight ward staff and the research coordinator.
Results: the statistical tests showed a weak~moderate degree of in terrater reliability. A comparison of the reliabil i ty coefficients obtained f rom these tests with a visual examination of the actual scores obtained by the raters is made and discussed in relation to the clinical acceptabil ity of reliabil i ty coefficients.
Conclusions:
Margaret Cook RN, Msc, BSc, Staff Nurse, Neurological Rehabiritation Unit, Sunderland City Hospitals NHSTrust, Sunderland
Claire Hale RN RNT, PhD, BA Dame Kathleen Raven Professor of Clinical Nursing, School of Healthcare Studies, University of Leeds, General Infirmary at Leeds, Great George St, Leeds LS I 3EX, UK
Bill Watson RN, MSC, Senior Lecturer, Nursing Research and Development Unit, Faculty of Health, Social Work and Education University of Northumbria, Coach Lane Campus, Newcastle upon Tyne NES, UK
Correspondence to: Claire Hale
I. The relationship between statistical acceptabil ity and clinical acceptabil ity needs to be fur ther explored part icularly in relation to the assessment of pressure sore risk.
2. Fur ther investigation into the reliabil i ty of risk assessment tools is needed to identify if and under what circumstances they are effective and what training in the use of the tool is needed to improve and maintain reliabil ity and thereby be of any real practical use.
�9 Harcour t Publishers Ltd
Keywords: decubitous ulcer, pressure sore,Water low Scale, risk assessment, nursing practice
I N T R O D U C T I O N A N D B A C K G R O U N D
For many years pressure sores have been seen as a major problem in the National Health Service (NHS), not only because of the costs (estimated at
s million per year [ Smith et al. 1995]), but also because of the suffering they cause. The presence of pressure sores has been in the past, and to some
extent still is, seen as an indicator of poor nursing care and pressure sore prevalence is often used as a
quality indicator. As a result, considerable effort has
been put into preventing the occurrence of pressure sores by identifying those who are most at risk and concentrating preventative measures on this group of patients. The basis of prevention requires a reli-
able and valid assessment tool which accurately dis- criminates between patients at no risk, low risk, high risk and very high risk, in order to allocate expensive prevention resources efficiently.
Since the development 9 f the Norton Scale in the early 1960s (Norton et al. 1962) a number of scales
Clinical Effectiveness in Nursing (I 999) 3, 66-74 �9 1999 Harcourt Publishers Ltd
Interrater reliability and the assessment of pressure-sore risk using an adapted Wate r low Scale 67
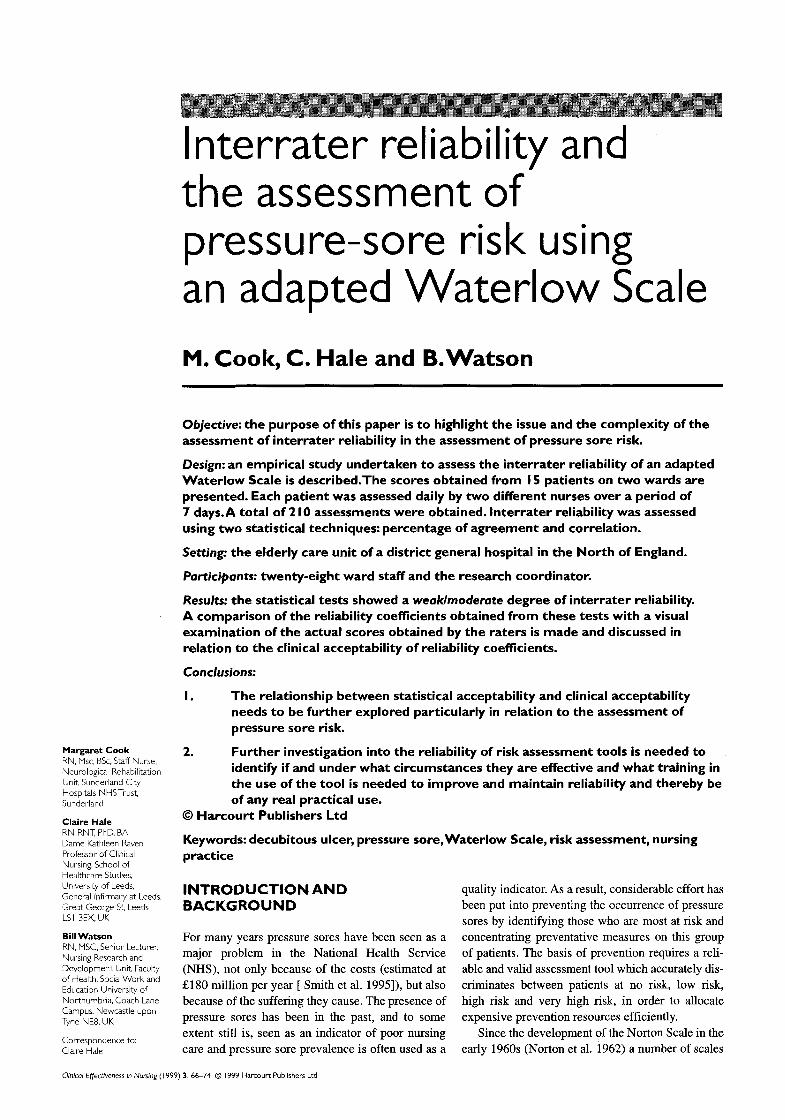
Ring scores in the table and calculate the total (several scores per category can be used)
Score I 0+ 15+ 20+ At Risk High Risk Very High Risk
Build/VVeight for height Appetite
Average 0 Above average I Obese 2 Below 3
Continence Completely catheterized 0 Occasionally incontinent I Catheterized/incontinent of faeces 2 Doubly incontinent 3
Skin type: visual risk area Healthy 0 Tissue paper I Dry I Oedematous I Clammy (Temp I") I Discolou red 2 Broken/spot 3
Mobility Fully 0 Restless/fidgety I Apathetic 2 Restricted 3 Inert/traction 4 Chairbound 5
Sex/Age Male I Female 2 1449 I 50 64 2 65 74 3 75-80 4 81+ 5
Average Poor NG tube/fluids only NBM/anorexic
Tissue malnutrition Terminal cachexia Cardiac failure Peripheral vascular disease Anaemia Smoking
Neurological deficit Diabetes, MS, CVA, motor/sensory. paraplegia
Major surgery/trauma Orthopaedic - below waist, spinal On table over 2 hours
Medication Cytotoxics. high doses of steroids, anti inflammatory
0 I 2 3
8 5 5 2 I
4-6
have been developed to assess the vulnerability of patients to pressure damage. Clark (1993) claimed there were 18 risk-assessment tools in existence, most of which attemped to overcome the apparent failures of the Norton Scale. However, the majority of these risk assessment scales have not been subjected to rigorous scrutiny in terms of their reliability and validity.
The reliability of a measuring instrument is a major standard for assessing its quality and adequacy. It refers to the consistency of the scale no matter who uses it. Gibbon (1995) states that relia- bility is an absolute prerequisite to validity. The validity of a tool is determined by its ability to measure what it claims to measure. Polit and Hungler (1991) claim that a measuring tool that is not reliable cannot validly be measuring the charac- teristic of concern. The greater number of ways a scale is shown to be reliable and valid, the more confidence one can have in its utilization.
In the UK one of the most widely used pressure- risk assessment scales is the Waterlow Scale (1985). It was developed after a survey revealed that 6.6% of all hospital inpatients developed pressure damage whilst in hospital. A concern arising from the survey was that a number of patients identified by the
Norton Scale as 'not at risk' developed pressure
damage. Waterlow reviewed the risk factors associ- ated with pressure damage and concluded that many were overlooked by the Norton Scale. The
Waterlow Scale consists of ten categories, each containing a number of subscales. Each subscale is allocated a 'risk score' ranging from 0 (most favourable) to 6/8 (least favourable). To achieve the total risk score, first the category scores are obtained and then these are totalled. A patient is deemed 'at risk' if the total score is between 10 and 14, at 'high risk' if the total score is between 15 and 19 and at 'very high risk' if the total score is over 20. Waterlow is nationally recognized in the UK,
however, despite its popularity, there has been little assessment of its reliability and validity (Bridel
1993, Smith et al. 1995). Table 1 shows the original Waterlow Scale.
In early 1993, the Elderly Services Directorate of a district general hospital in the North East of
England began to review its pressure sore preven- tion policy. The Norton Score, which was then used in the directorate, was failing to identify those who
subsequently developed pressure sores. A pressure care interest group was instigated and all the current pressure-sore risk-assessment tools were reviewed.
68 Clinical Effectiveness in Nursing
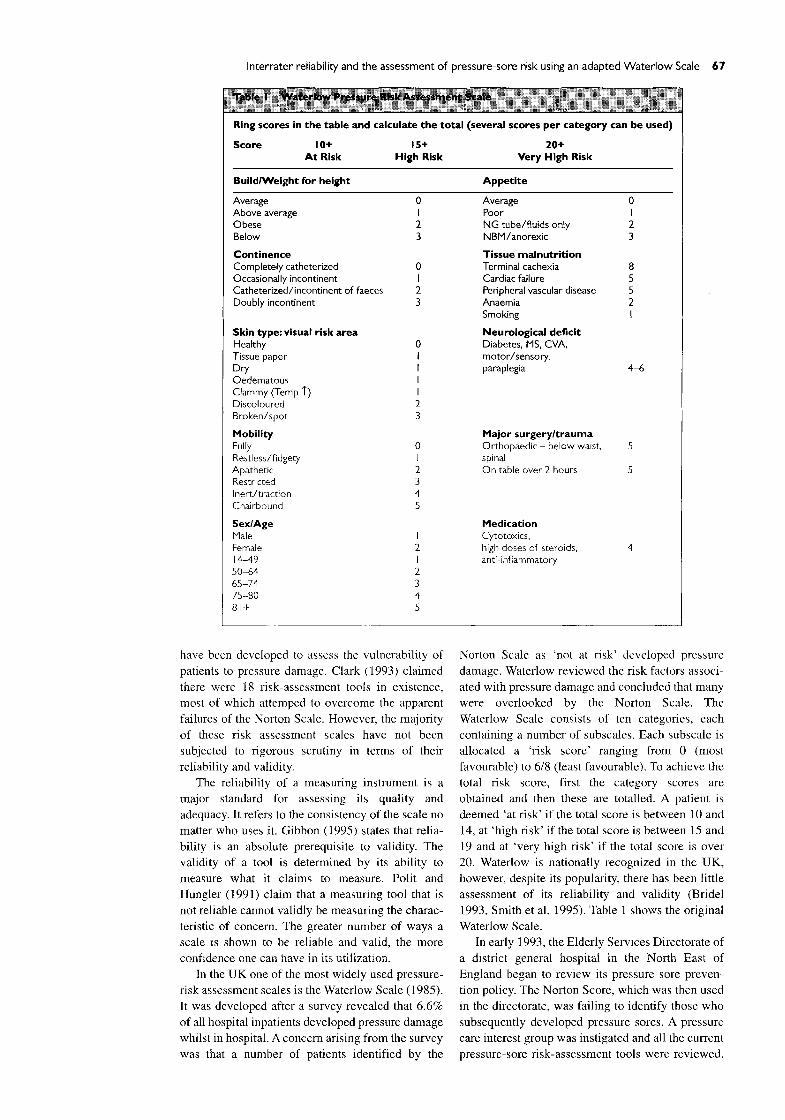
Ring scoresin the table and calculate the total(severalscores per category can be used) Score 10+ 15+ 20+
At Risk High Risk Very High Risk
Build/weight for height (I) Appetite (6)
Average 0 Above Average I Obese 2 Below 3 Continence (2)
Completely catheterized 0 Occasional incontinence I Catheterized/incontinent of faeces 2 Incontinence of urine 2
Skin type: visual risk Area (3)
Healthy 0 Tissue paper I Dry I Oedematous I Clammy I Discoloured 2 Broken/spot 3 Mobility (4) Fully 0 Restless/fidgety I Apathetic 2 Restricted/inert 3 Traction 4 Chairbound 5 Sex/age (S) Male I Female 2 14-49 I 50-64 2 65-74 3 75-80 4 81+ 5
Average Poor NG tube/fluids only NBM/anorexic Special risks: tissue malnutrition (7) Terminal cachexia Cardiac failure Peripheral vascular disease Anaemia Smoking Neurological deficit/general medical condition (8) Diabetes, MS, CVA, motor/sensory. paraplegia severe rheumatoid arthritis
Major surgery/trauma (9) Orthopaedic - below waist, spinal On table over 2 hours
Medication ( I 0) Steroids, cytotoxics, high doses of anti- inflammatory, sedation
The Waterlow Scale was already being used in other areas within the hospital and it was decided to trial this tool on the elderly care ward. The trial sug- gested that there were limitations to using the Waterlow Scale in the elderly care area, particularly with patients who were continuously incontinent of urine but who were continent of faeces. As a result, the pressure care interest group decided to make some minor changes to the original Waterlow Scale. The tool subsequently produced was known within the hospital as the adapted Waterlow Scale. Details of the process by which this tool was developed can be found in (Cook 1994). Table 2 shows the adapted version of the Waterlow Scale which is the subject of this paper.
The format of the adapted version of the Waterlow scale was similar to the original, but contained the following changes:
�9 In the Waterlow Scale in the 'continence' subscale, there is no means of scoring a patient who is incontinent of urine but continent of faeces. Waterlow appears to be assuming that if a patient is incontinent of urine they will be catherized. However, it was not the policy of the hospital involved in this study to catheterize all incontinent patients, therefore, 'doubly
incontinent' was replaced by 'incontinent of
urine' and rated a score of 2. In the Waterlow Scale the 'neurological deficit' subscale rates a score of between 4 and 6, allowing for individual interpretation by each assessor. In the adapted scale, the 'neurological
deficit' subscale has been changed to 'neurological deficit/general medical condition'
and rated a standard score of 6. Rheumatiod arthritis was added to the list of conditions which would fall into this category.
The 'medication' subscale in the adapted scale has been extended to include high doses of sedation over a 24 hour period. This alteration was made following an in-depth discussion with the head of the pharmacy department who
maintained that such doses could not only affect the patient's mobility and state of mind, but also that the 'cocktail' of drugs often prescribed to the elderly could result in a slowing down of the healing process.
In April 1994, the tool was introduced into the elderly care area of the hospital for a trial period and an evaluation was carried out once the staff had
gained some practice using the new tool. A full
Interrater reliability and the assessment of pressure-sore risk using an adapted Waterlow Scale 69
report of the study is available elsewhere (Cook 1996). This paper discusses an assessment of its interrater reliability.
INTERRATER RELIABIL ITY
Interrater reliability is an estimate of the degree to which two or more independent raters, observers, scorers judges or interviewers are consistent in their judgments (Goodwin & Prescott 1981). The assess- ment of interrater reliability is particularly important in the development of standard measuring instru- ments which will be used by a variety of raters in a variety of situations. In these circumstances inter- rater reliability is assessed statistically and a reliabil- ity coefficient is obtained. Goodwin and Prescott (1981) explain that most of the statistical approaches to reliability assessment are based on classical test theory, which assumes that a person's score on a measure is the sum of two parts: a true score and an error component. Error may be caused by many fac- tors, e.g. the subjects themselves, poor technique by the raters, insufficient time to carry out the assess- ment, and poor wording of items on the instrument. The aim when developing measuring instruments of any kind is to minimize the error component so that
the scores subsequently obtained are as near as pos- sible to the true score. However, in all statistical assessments of interrater reliability it is assumed that obtained scores are never totally free of error. The
reliability coefficient obtained from the application of a statistical technique to a data set expresses the amount of variance in observed scores that can be considered true-score variance, as opposed to error variance, and will range from the theoretical values of 0 to I. An unreliable instrument will have a relia-
bility coefficient approaching 0 (e.g. 0.02) which indicates that the measure is producing unstable or inconsistent scores. A reliable instrument will have a
reliability coefficient approaching the maximum the- oretical value of 1 (e.g. 0.95). When assessing the reliability (interrater or other) of a particular instru- ment, it is important to remember that reliability is not a property of an instrument in isolation
(Goodwin & Prescott 1981). The reliability coeffi- cient obtained in a particular study is specific to that group of subjects in those particular circumstances. The reliability coefficient obtained in one study can- not automatically be assumed to apply to other sub- jects in other circumstances.
To add to the complexity of assessing interrater
reliability, there are also several different approaches to assessment. One of the most fre- quently used is Cohen's K (Burns & Grove 1993).
Two other popular approaches are 'percentage of agreement' and 'correlation technique' (Goodwin &
Prescott 1981). Goodwin and Prescott (1981), using the same data set, also demonstrated how four different approaches to estimating interrater relia- bility yielded substantially different results and
interpretations. They concluded that increased attention needs to be paid to reliability estimation in nursing research when measuring instruments are being developed. In particular, there is a need to consider the ways in which reliability estimates are calculated and the appropriateness of the corre- sponding interpretations. This requires that more information needs to be given in a study report about the type of reliability coefficient calculated and the subjects involved as well as other relevant features of the reliability estimation.
Unfortunately, it appears that nurse researchers have paid little attention to the advice of Goodwin and Prescott. A recent citation search of the article provided only 20 citations, only one of which was from an article about the assessment of pressure sore risk (Bergstrom et al. 1987). This paper attempts to redress that balance.
RESEARCH D E S I G N
Setting
The study was carried out in two wards within the Elderly Services Directorate of a district general hospital in the North East of England. Two wards
were used:
�9 Ward 1-A stroke rehabilitation unit. Admission to this ward depended upon the patient's potential for rehabilitation.
�9 Ward 2-An acute medical/rehabilitation ward. Patients were admitted directly from home or via the Acute Medical Emergency Unit.
Approval tbr the study to take place was given by
the Local Research Ethics Committee.
RESEARCH PARTICI PANTS
Patients
The ward manager of each ward was requested to compile a list of the patients suitable for inclusion in the research. The rationale for this was to avoid any patient being included whose medical condition was regarded as unstable. The stability of the patient's condition was deemed necessary as an inclusion criteria in order to exclude (as far as possible) changes in a patient's condition as a reason for
variation in the nurse assessment scores. It was also believed that the ward manager was
in the best position to safeguard the inclusion of any patient who was 'confused' or 'mentally impaired' from unwittingly giving their permission to be involved. Written and witnessed consent was obtained from all patients who participated in the study. In total, 15 patients participated in the study: nine from ward 1 and six from ward 2.
70 Clinical Effectiveness in Nursing
30
25
20
15
10
5
0
x
• x
4~
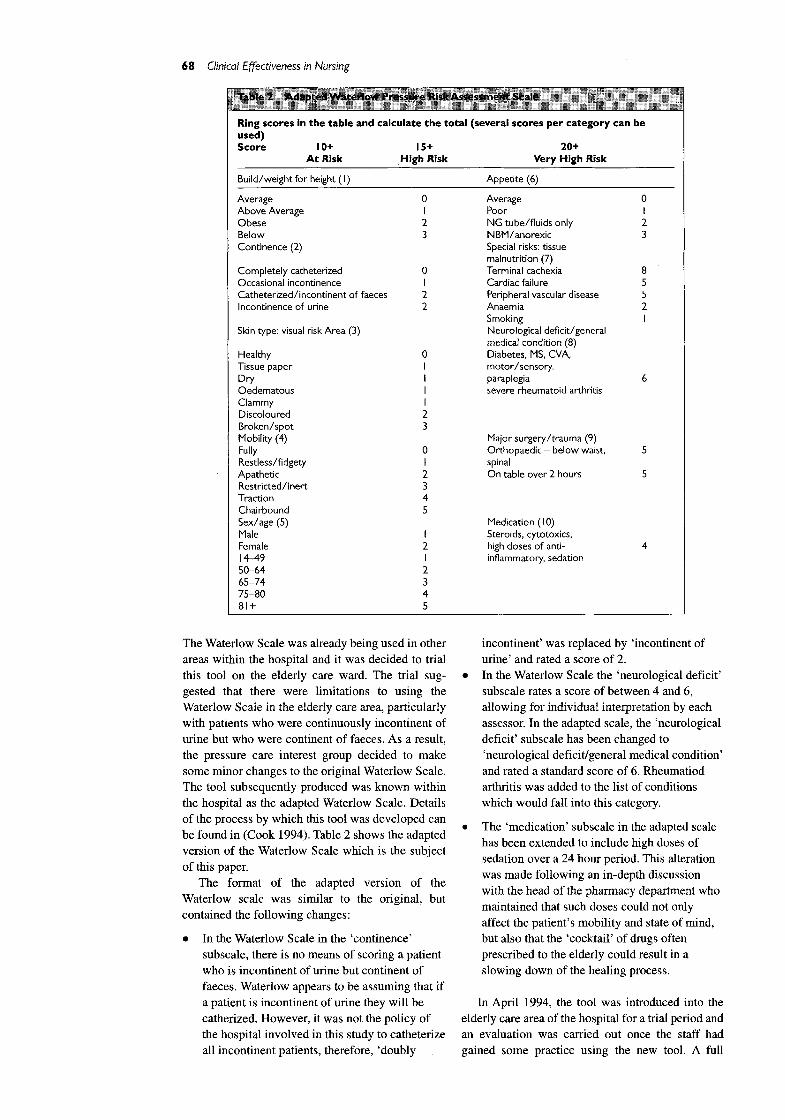
1 2 3 4 5 6 7 8 9 10
Patient identification number
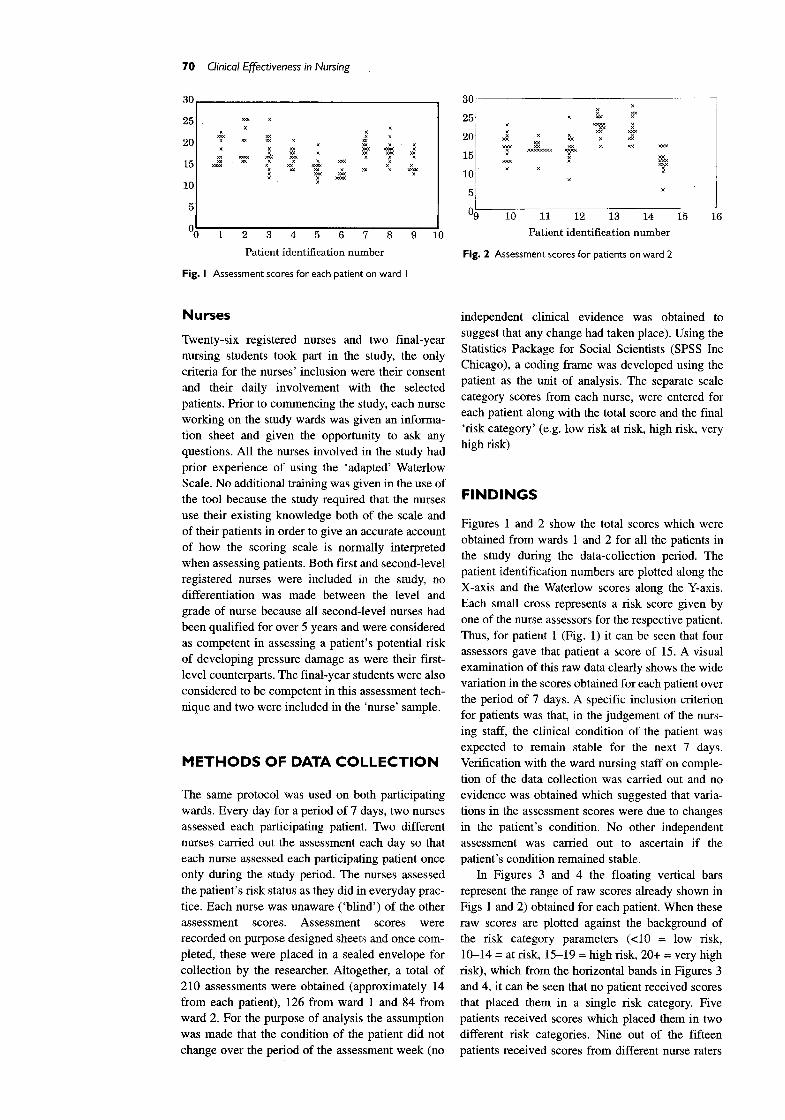
Fig. I Assessment scores for each patient on ward I
3(3
25
2(3
15
1C
5
x
x ~e<
• x ~ x
x x
x
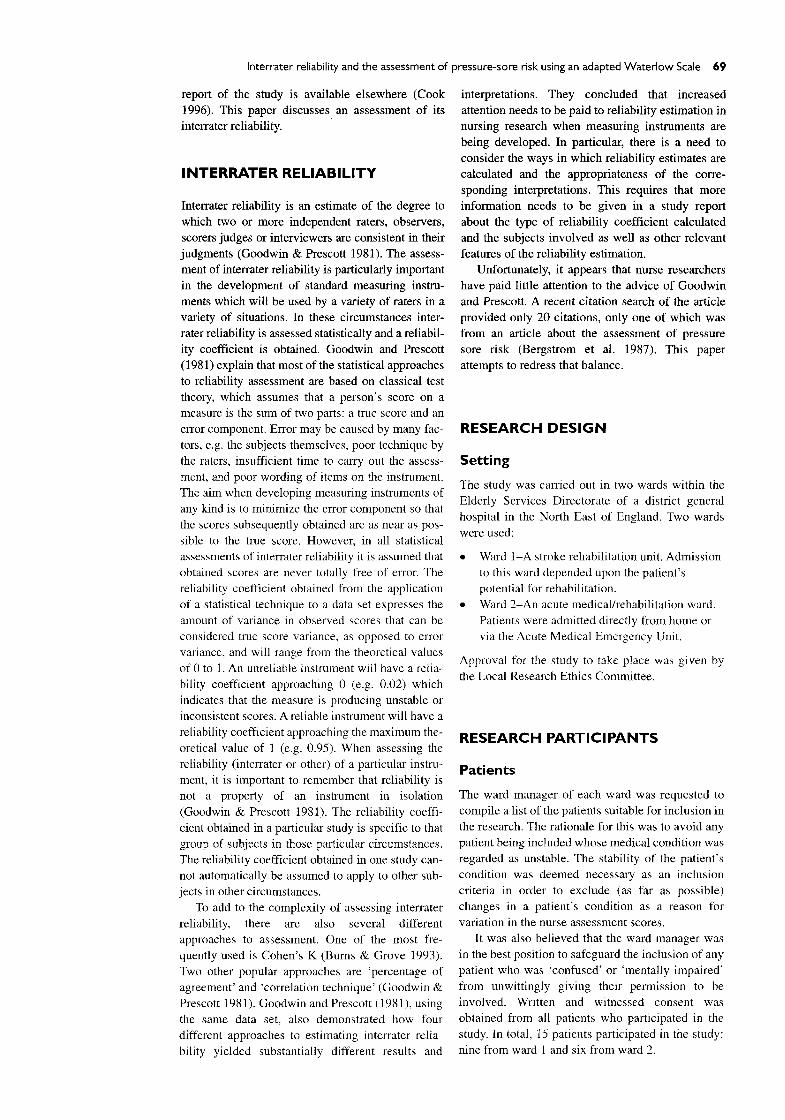
09 10 11 12 13 14
Patient identification number
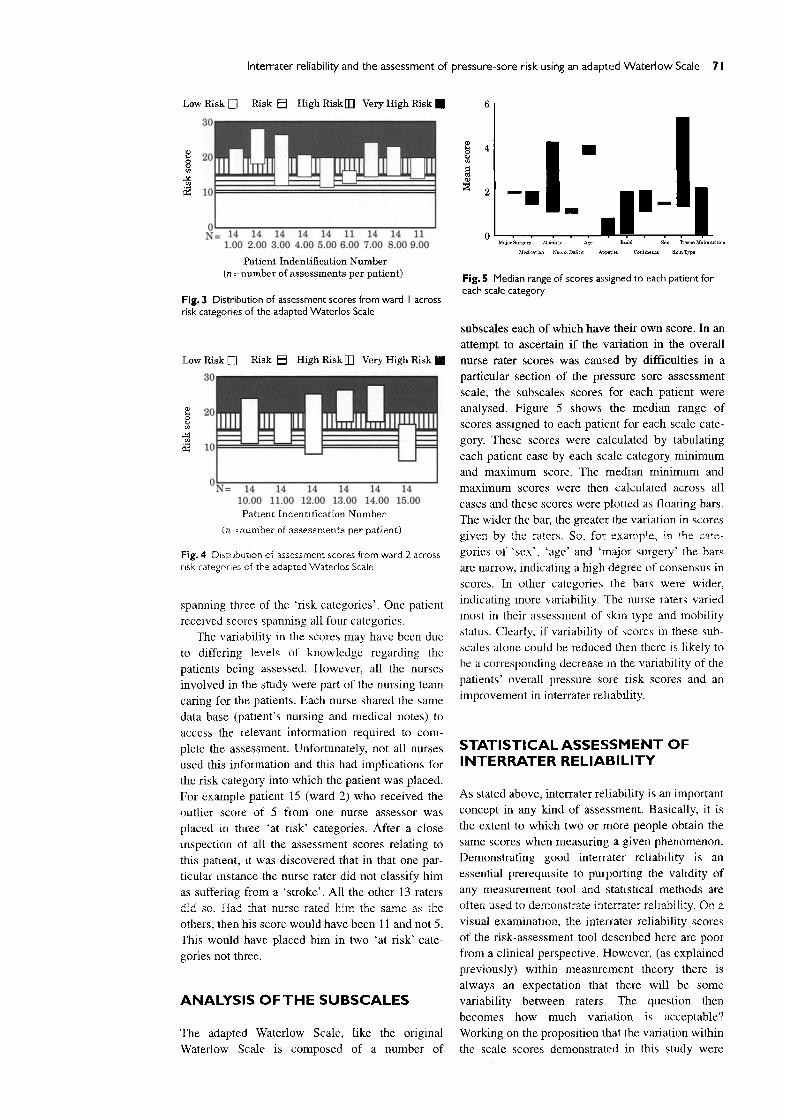
Fig. 2 Assessment scores for patients on ward 2
15 16
Nurses
Twenty-six registered nurses and two final-year nursing students took part in the study, the only
criteria for the nurses' inclusion were their consent a n d their daily involvement with the selected patients. Prior to commencing the study, each nurse working on the study wards was given an informa- tion sheet and given the opportunity to ask any
questions. All the nurses involved in the study had prior experience of using the 'adapted' Waterlow Scale. No additional training was given in the use of the tool because the study required that the nurses use their existing knowledge both of the scale and of their patients in order to give an accurate account of how the scoring scale is normally interpreted when assessing patients. Both first and second-level registered nurses were included in the study, no differentiation was made between the level and grade of nurse because all second-level nurses had been qualified for over 5 years and were considered as competent in assessing a patient's potential risk of developing pressure damage as were their first- level counterparts. The final-year students were also considered to be competent in this assessment tech- nique and two were included in the 'nurse' sample.
M E T H O D S O F D A T A C O L L E C T I O N
The same protocol was used on both participating wards. Every day for a period of 7 days, two nurses assessed each participating patient. Two different nurses carried out the assessment each day so that each nurse assessed each participating patient once only during the study period. The nurses assessed
the patient's risk status as they did in everyday prac- tice. Each nurse was unaware ( 'blind') of the other
assessment scores. Assessment scores were recorded on purpose designed sheets and once com- pleted, these were placed in a sealed envelope for collection by the researcher. Altogether, a total of
210 assessments were obtained (approximately 14 from each patient), 126 from ward 1 and 84 from ward 2. For the purpose of analysis the assumption was made that the condition of the patient did not change over the period of the assessment week (no
independent clinical evidence was obtained to
suggest that any change had taken place). Using the Statistics Package for Social Scientists (SPSS Inc Chicago), a coding frame was developed using the patient as the unit of analysis. The separate scale
category scores from each nurse, were entered for each patient along with the total score and the final
'risk category' (e.g. low risk at risk, high risk, very high risk)
F I N D I N G S
Figures 1 and 2 show the total scores which were
obtained from wards 1 and 2 for all the patients in the study during the data-collection period. The patient identification numbers are plotted along the
X-axis and the Waterlow scores along the Y-axis. Each small cross represents a risk score given by one of the nurse assessors for the respective patient. Thus, for patient 1 (Fig. 1) it can be seen that four assessors gave that patient a score of 15. A visual examination of this raw data clearly shows the wide variation in the scores obtained for each patient over the period of 7 days. A specific inclusion criterion for patients was that, in the judgement of the nurs- ing staff, the clinical condition of the patient was expected to remain stable for the next 7 days. Verification with the ward nursing staff on comple- tion of the data collection was carried out and no evidence was obtained which suggested that varia- tions in the assessment scores were due to changes in the patient's condition. No other independent assessment was carried out to ascertain if the patient's condition remained stable.
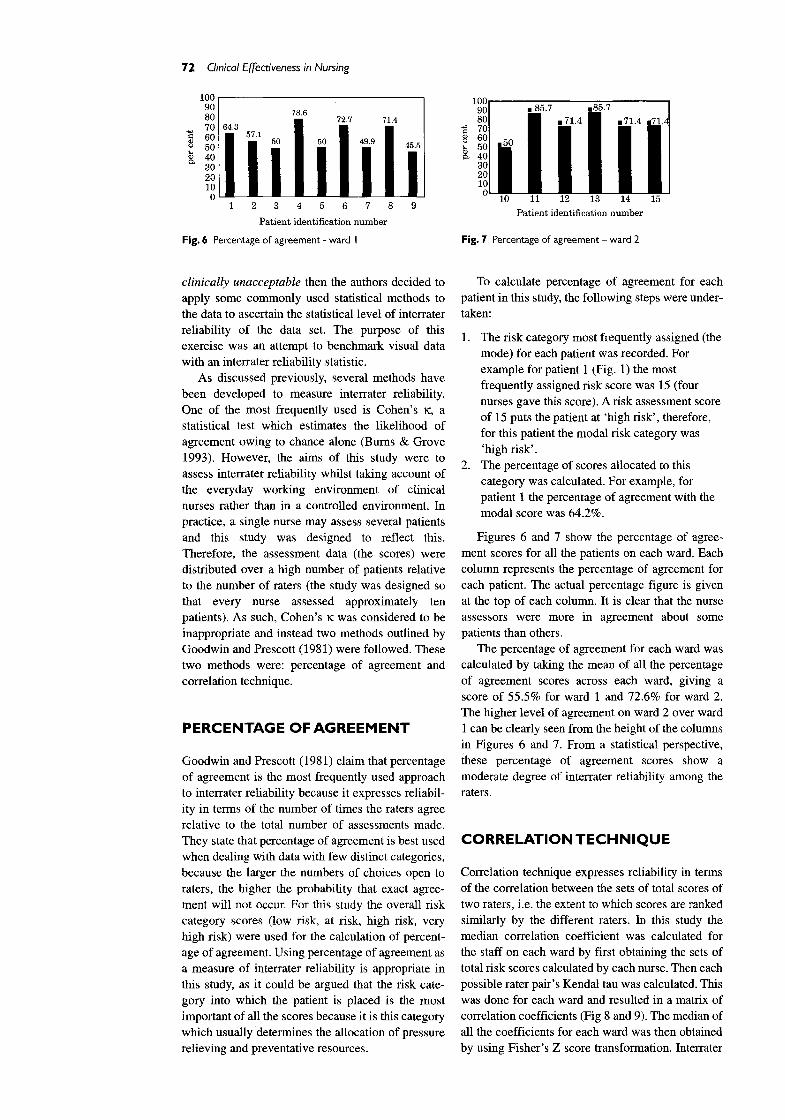
In Figures 3 and 4 the floating vertical bars represent the range of raw scores already shown in
Figs 1 and 2) obtained for each patient. When these raw scores are plotted against the background of the risk category parameters (<i0 = low risk, 10-14 = at risk, 15-19 = high risk, 20+ = very high
risk), which from the horizontal bands in Figures 3 and 4, it can be seen that no patient received scores that placed them in a single risk category. Five patients received scores which placed them in two different risk categories. Nine out of the fifteen patients received scores from different nurse raters
Interrater reliability and the assessment of pressure-sore risk using an adapted Waterlow Scale 71
Low Risk E]
30
20 8
10
Risk [] High Risk [] Very High Risk [] 6
I<1= 14 14 14 14 14 11 14 14 11 1.00 2.00 3.00 4.00 5.00 6.00 7.00 8.00 9.00
Patient Indentification Number (n = number of assessments per patient)
Fig. 3 Distr ibut ion of assessment scores from ward I across risk categories of the adapted Watedos Scale
Low Risk []
30
20 8 m
~2 lO
Risk [ ] High Risk [] Very High Risk []
ON= 14 14 14 14 14 14 I000 11.00 12.00 13.00 14.00 15.00
Patient [ndentification Number
(n = number of assessments per patient)
Fig. 4 Distribution of assessment scores from ward 2 across risk categories of the adapted Waterlos Scale
spanning three of the 'risk categories ' . One patient
received scores spanning all four categories.
The variability in the scores may have been due
to differing levels of knowledge regarding the
patients being assessed. However, all the nurses
involved in the study were part of the nursing team
caring for the patients. Each nurse shared the same
data base (patient's nursing and medical notes) to
access the relevant intormation required to com-
plete the assessment. Unfortunately, not all nurses
used this information and this had implications for
the risk category into which the patient was placed.
For example patient 15 (ward 2) who received the
outlier score of 5 from one nurse assessor was
placed in three 'at risk' categories. After a close
inspection of all the assessment scores relating to
this patient, it was discovered that in that one par-
ticular instance the nurse rater did not classify him
as suffering from a 's troke' . All the other 13 raters
did so. Had that nurse rated him the same as the
others, then his score would have been 11 and not 5.
This would have placed him in two 'at risk' cate-
gories not three.
ANALYSIS OF THE SUBSCALES
The adapted Waterlow Scale, like the original
Waterlow Scale is composed of a number of
4 �9
a
o M~ior Surgery Mobility Age ~u~ld Sou Tiasue Malnutrition
Medication Igeum Deficit Appetite C o n t i ~ Skin Type
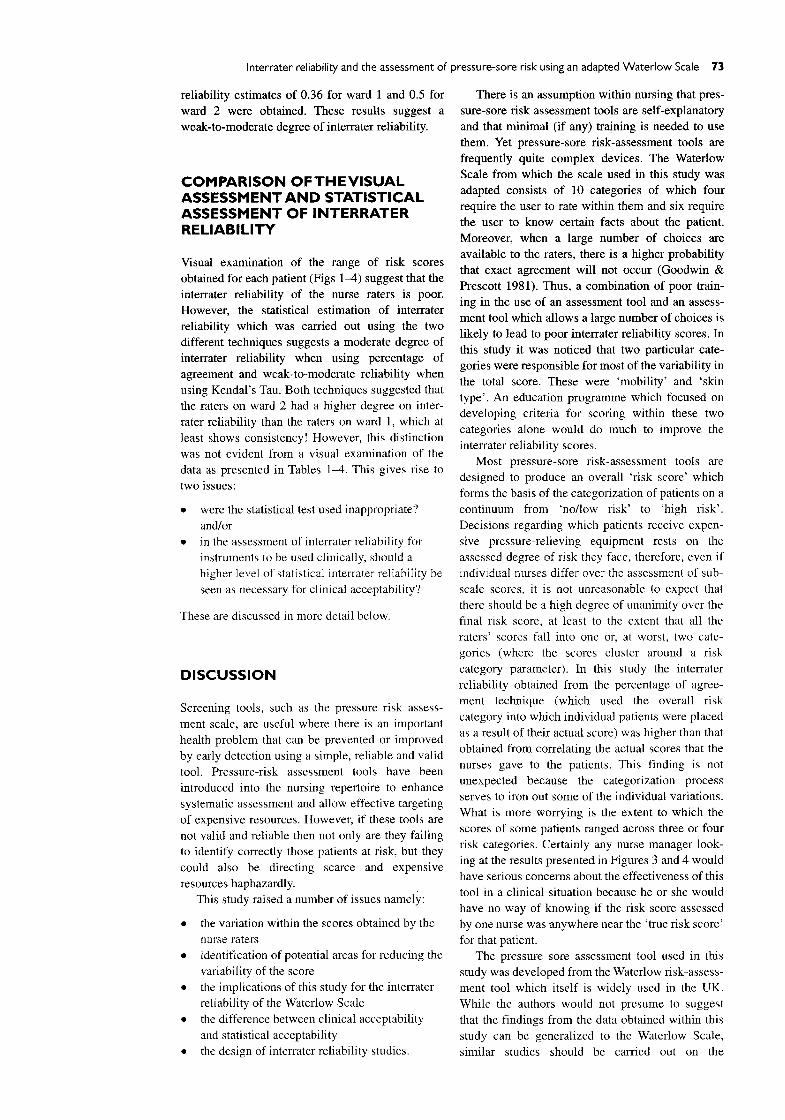
Fig. S Median range of scores assigned to each patient for each scale category
subscales each of which have their own score. In an
attempt to ascertain if the variation in the overall
nurse rater scores was caused by difficulties in a
particular section of the pressure sore assessment
scale, the subscales scores for each patient were
analysed. Figure 5 shows the median range of
scores assigned to each patient for each scale cate-
gory. These scores were calculated by tabulating
each patient case by each scale category minimum
and maximum score. The median min imum and
maximum scores were then calculated across all
cases and these scores were plotted as floating bars.
The wider the bar, the greater the variation in scores
given by the raters. So, for example, in the cate-
gories of ' sex ' , ' age ' and 'major surgery' the bars
are narrow, indicating a high degree of consensus in
scores. In other categories the bars were wider,
indicating more variability. The nurse raters varied
most in their assessment of skin type and mobility
status. Clearly, i f variability of scores in these sub-
scales alone could be reduced then there is likely to
be a corresponding decrease in the w~riability of the
patients' overall pressure sore risk scores and an
improvement in interrater reliability.
STATISTICAL ASSESSMENT OF INTERRATER RELIABIL ITY
As stated above, interrater rehability is an important
concept in any kind of assessment, Basically, it is
the extent to which two or more people obtain the
same scores when measuring a given phenomenon.
Demonstrating good interrater reliability is an
essential prerequisite to purporting the validity of
any measurement tool and statistical methods are
often used to demonstrate interrater reliability. On a
visual examination, the interrater reliability scores
of the risk-assessment tool described here are poor
from a clinical perspective. However, (as explained
previously) within measurement theory there is
always an expectation that there will be some
variability between raters. The question then
becomes how much variation is acceptable?
Working on the proposition that the variation within
the scale scores demonstrated in this study were
72 Clinical Effectiveness in Nursing
100 I 100
80 . 72.7 7 1 . 4 . 1iii41 i 70 043 57, = - 51 .714 . 7 1 , . 7 1 = _ 00 l 50 I I 560 ~ 50
O ~ 0 10 11 12 13 14 15
1 2 3 4 5 6 7 8 9 Patient identification number
Pat ient identification number
Fig. 6 Percentage of agreement - ward I Fig. 7 Percentage of agreement ward 2
clinically unacceptable then the authors decided to apply some commonly used statistical methods to the data to ascertain the statistical level of interrater reliability of the data set. The purpose of this exercise was an attempt to benchmark visual data with an interrater reliability statistic.
As discussed previously, several methods have been developed to measure interrater reliability. One of the most frequently used is Cohen's •, a statistical test which estimates the likelihood of agreement owing to chance alone (Bums & Grove 1993). However, the aims of this study were to assess interrater reliability whilst taking account of the everyday working environment of clinical nurses rather than in a controlled environment. In practice, a single nurse may assess several patients and this study was designed to reflect this. Therefore, the assessment data (the scores) were distributed over a high number of patients relative to the number of raters (the study was designed so that every nurse assessed approximately ten patients). As such, Cohen's ~: was considered to be inappropriate and instead two methods outlined by Goodwin and Prescott (1981) were followed. These two methods were: percentage of agreement and correlation technique.
PERCENTAGE OF AGREEMENT
Goodwin and Prescott (1981) claim that percentage of agreement is the most frequently used approach to interrater reliability because it expresses reliabil- ity in terms of the number of times the raters agree relative to the total number of assessments made. They state that percentage of agreement is best used when dealing with data with few distinct categories, because the larger the numbers of choices open to raters, the higher the probability that exact agree- ment will not occur. For this study the overall risk category scores (low risk, at risk, high risk, very high risk) were used for the calculation of percent- age of agreement. Using percentage of agreement as a measure of interrater reliability is appropriate in this study, as it could be argued that the risk cate- gory into which the patient is placed is the most important of all the scores because it is this category which usually determines the allocation of pressure relieving and preventative resources.
To calculate percentage of agreement for each patient in this study, the following steps were under- taken:
1. The risk category most frequently assigned (the mode) for each patient was recorded. For example for patient 1 (Fig. 1) the most frequently assigned risk score was 15 (four nurses gave this score). A risk assessment score of 15 puts the patient at 'high risk', therefore, for this patient the modal risk category was 'high risk'.
2. The percentage of scores allocated to this category was calculated. For example, for patient 1 the percentage of agreement with the modal score was 64.2%.
Figures 6 and 7 show the percentage of agree- ment scores for all the patients on each ward. Each column represents the percentage of agreement for each patient. The actual percentage figure is given at the top of each column. It is clear that the nurse assessors were more in agreement about some patients than others.
The percentage of agreement for each ward was calculated by taking the mean of all the percentage of agreement scores across each ward, giving a score of 55.5% for ward 1 and 72.6% for ward 2. The higher level of agreement on ward 2 over ward 1 can be clearly seen from the height of the columns in Figures 6 and 7. From a statistical perspective, these percentage of agreement scores show a moderate degree of interrater reliability among the raters.
CORRELATION T E C H N I Q U E
Correlation technique expresses reliability in terms of the correlation between the sets of total scores of two raters, i.e. the extent to which scores are ranked similarly by the different raters. In this study the median correlation coefficient was calculated for the staff on each ward by first obtaining the sets of total risk scores calculated by each nurse. Then each possible rater pair 's Kendat tan was calculated. This was done for each ward and resulted in a matrix of correlation coefficients (Fig 8 and 9). The median of all the coefficients for each ward was then obtained by using Fisher's Z score transformation. Interrater
Interrater reliability and the assessment of pressure-sore risk using an adapted Waterlow Scale 73
reliability estimates of 0.36 for ward 1 and 0.5 for ward 2 were obtained. These results suggest a weak-to-moderate degree of interrater reliability.
C O M P A R I S O N OF T H E V I S U A L ASSESSMENT A N D STATISTICAL ASSESSMENT OF INTERRATER RELIABILITY
Visual examination of the range of risk scores obtained for each patient (Figs 1-4) suggest that the interrater reliability of the nurse raters is poor. However, the statistical estimation of interrater reliability which was carried out using the two different techniques suggests a moderate degree of interrater reliability when using percentage of agreement and weak-to-moderate reliability when using Kendal's Tau. Both techniques suggested that the raters on ward 2 had a higher degree on inter- rater reliability than the raters on ward 1, which at least shows consistency! However, this distinction was not evident from a visual examination of the data as presented in Tables 1-4. This gives rise to
two issues:
�9 were the statistical test used inappropriate?
and/or �9 in the assessment ofinterrater reliability for
instruments to be used clinically, should a higher level of statistical intenater reliability be seen as necessary for clinical acceptability?
These are discussed in more detail below.
DISCUSSION
Screening tools, such as the pressure risk assess- ment scale, are useful where there is an important health problem that can be prevented or improved by early detection using a simple, reliable and valid
tool. Pressure-risk assessment tools have been introduced into the nursing repertoire to enhance systematic assessment and allow effective targeting
of expensive resources. However, if these tools are not valid and reliable then not only are they failing to identify correctly those patients at risk, but they could also be directing scarce and expensive
resources haphazardly. This study raised a number of issues namely:
�9 the variation within the scores obtained by the
nurse raters �9 identification of potential areas for reducing the
variability of the score �9 the implications of this study for the interrater
reliability of the Waterlow Scale �9 the difference between clinical acceptability
and statistical acceptability �9 the design of interrater reliability studies.
There is an assumption within nursing that pres- sure-sore risk assessment tools are self-explanatory and that minimal (if any) tr~ning is needed to use them. Yet pressure-sore risk-assessment tools are frequently quite complex devices. The Waterlow Scale from which the scale used in this study was adapted consists of 10 categories of which four require the user to rate within them and six require the user to know certain facts about the patient. Moreover, when a large number of choices are available to the raters, there is a higher probability that exact agreement will not occur (Goodwin & Prescott 1981). Thus, a combination of poor train- ing in the use of an assessment tool and an assess- ment tool which allows a large number of choices is likely to lead to poor interrater reliability scores. In
this study it was noticed that two particular cate- gories were responsible for most of the variability in the total score. These were 'mobility' and 'skin type'. An education programme which focused on developing criteria for scoring within these two categories alone would do much to improve the interrater reliability scores.
Most pressure-sore risk-assessment tools are designed to produce an overall 'risk score' which forms the basis of the categorization of patients on a continuum from 'no/low risk' to 'high risk'. Decisions regarding which patients receive expen- sive pressure-relieving equipment rests on the assessed degree of risk they face, therefore, even if individual nurses differ over the assessment of sub- scale scores, it is not unreasonable to expect that there should be a high degree of unanimity over the final risk score, at least to the extent that all the raters' scores fall into one or, at worst, two cate- gories (where the scores cluster around a risk category parameter). In this study the interrater reliability obtained from the percentage of agree- ment technique (which used the overall risk category into which individual patients were placed as a result of their actual score) was higher than that obtained from correlating the actual scores that the nurses gave to the patients. This finding is not unexpected because the categorization process serves to iron out some of the individual variations. What is more worrying is the extent to which the scores of some patients ranged across three or four risk categories. Certainly any nurse manager look- ing at the results presented in Figures 3 and 4 would have serious concerns about the effectiveness of this tool in a clinical situation because he or she would have no way of knowing if the risk score assessed by one nurse was anywhere near the 'true risk score' for that patient.
The pressure sore assessment tool used in this study was developed from the Waterlow risk-assess- ment tool which itself is widely used in the UK. While the authors would not presume to suggest that the findings from the data obtained within this study can be generalized to the Waterlow Scale, similar studies should be carried out on the
74 Clinical Effectiveness in Nursing
Waterlow Scale itself because the principles of
assessment and scoring are the same across both
tools and there has, in fact, been very little assess-
ment of the reliability and validity of the Waterlow
Scale (Bridel 1993, Smith et al. 1995).
In medical research the concept of clinical
significance is as important as statistical signifi-
cance. This concept can be applied in field studies
of the type described here. It would be difficult to
sustain an argument that the raw risk assessment
scores obtained in this study are acceptable for
'clinical ' purposes, however, the statistical tests car-
ried out suggested a higher degree of interrater reli-
ability. In this study, because the data set was
comparatively small, we examined the data visually
to see what moderately reliability and weak-to-
moderate reliability really meant. Further work
should be undertaken with larger data sets to
correlate 'clinical ' acceptability and statistical
acceptability.
The design of interrater reliability studies also
needs some attention. In the past, much work has
been concentrated on the predictive validity of
pressure-sore scales to assess the relationship
between the score and future pressure-sore develop-
ment (Edwards 1994) and this work continues. To
avoid the problems of interrater reliability usually
only one or two raters are involved in this type of
study. However, to be a useful tool clinically, the
reliability of the scores obtained by many different
raters has to be assured. If it is not, then the predic-
tive validity of the tool (in practice) and the effec-
tiveness of the allocation of resources according to
the scores obtained, is questionable. This particular
study was designed to have as large a number of
raters as possible and practical, assessing a group
of patients. The above, combined with the structure
of the assessment tool made the assessment of inter-
rater reliability complex and we would like to
highlight that future studies of this kind are carried
out in collaboration with statisticians. Goodwin and
Prescot (1981) themselves recognized the limita-
tions of the techniques used in this study and
suggested that a useful way forward would be to use
generalizability theory techniques (Cronbach et al.
1972) and this could be the focus of further work in
this area.
C O N C L U S I O N
If pressure-sore prevention resources are allocated
on the basis of risk score, then the variability in
scores demonstrated above clearly has financial
implications for resource use as well as the assess-
ment of the effectiveness of the interventions
themselves.
Further investigation into the reliability of risk
assessment tools is needed to identify if and under
what circumstances they are effective and what
training in the use of the tool is needed to improve
and maintain reliability, and thereby be of any real
practical use. Some of these investigative studies
should explore the use of generalizability theory
techniques.
REFERENCES
Bridel J 1993 Assessing the risk of pressure sores. Nursing Standard 7 (25): 32-35
Clark M 1993 Understanding pressure sores; an awareness of research methodology. Wound Management 4 (2): 41-45
Cook MJ 1994 The process of change: the implementation of an 'adapted' Waterlow pressure damage prevention policy, throughout the 'Elderly Services Directorate' of South Tyneside Health Care Trust. Unpublished dissertation University of Northumbria at Newcastle
Cook M 1996 Estimating the inter-rater reliability of the adapted Waterlow Pressure Sore Risk Assessment Scale. Unpublished MSc thesis. University of Northumbria at Newcastle
Edwards M 1994 The rationale for the use of risk calculators in pressure sore prevention and the evidence of the reliability and validity of published scales. Journal of Advanced Nursing 20:288-296
Gibbon B 1995 Validity and reliability of assessment tools. Nurse Researcher 2 (4): 48-55
Goodwin LD, Prescott PA 1981 Issues and approaches to estimating inter-rater reliability in nursing research. Research in Nursing and Health 4:323-337
Norton D, McLaren R, Exton-Smith A 1962 An investigation of geriatric nursing problems in hospital. National Corporation for the Care of Old People, London
Polit DF, Hungler BP 1991 Nursing research: principles and methods, 4th edn. Lippincott, Philadelphia
Smith LN, Booth Net al. 1995 A critique of 'at risk' pressure sore assessment tools. Journal of Clinical Nursing 4: 153-159
Waterlow J 1985 A risk assessment card. Nursing Times 81(48): 4%55


