Embed Size (px)
Citation preview

1
2
3456
7
89101112
13141516171819
4142
43
44
45
46
47
48
49
50
51
52
53
54
55
56
57
58
59
NeuroImage: Clinical xxx (2014) xxx–xxx
YNICL-00309; No. of pages: 13; 4C:
Contents lists available at ScienceDirect
NeuroImage: Clinical
j ourna l homepage: www.e lsev ie r .com/ locate /yn ic l
Intersession reliability of fMRI activation for heat pain and motor tasks
OF
Raimi L. Quitona,b,c,*, Michael L. Keaserc, Jiachen Zhuod, Rao P. Gullapallid, Joel D. Greenspanc
aDepartment of Psychology, University of Maryland, Baltimore, MD, USAbDepartment of Anatomy and Neurobiology, School of Medicine, University of Maryland, Baltimore, MD, USAcDepartment of Pain and Neural Sciences, School of Dentistry, and UM Center to Advance Chronic Pain Research, University of Maryland, Baltimore, MD, USAdDepartment of Diagnostic Radiology & Nuclear Medicine & Magnetic Resonance Research Center, School of Medicine, University of Maryland, Baltimore, MD, USA
* Corresponding author..E-mail address: [email protected] (R.L. Quiton).
http://dx.doi.org/10.1016/j.nicl.2014.07.0052213-1582/© 2014 Published by Elsevier Inc. This is an op
Please cite this article as: Quiton, R.L., et al., Ihttp://dx.doi.org/10.1016/j.nicl.2014.07.005
Oa b s t r a c t
a r t i c l e i n f o20
21
22
23
24
25
26
27
28
29
30
31
Article history:Received 22 April 2014Received in revised form 22 June 2014Accepted 17 July 2014Available online xxxx
Keywords:Intraclass correlation coefficientReliability coefficientReproducibilityRepeatabilityAnterior insulaCingulate cortex
32
33
34
35
36
37
38
39
40
RECTED PRAs the practice of conducting longitudinal fMRI studies to assess mechanisms of pain-reducing interventions be-comes more common, there is a great need to assess the test–retest reliability of the pain-related BOLD fMRI sig-nal across repeated sessions. This study quantitatively evaluated the reliability of heat pain-related BOLD fMRIbrain responses in healthy volunteers across 3 sessions conducted on separate days using two measures:(1) intraclass correlation coefficients (ICC) calculated based on signal amplitude and (2) spatial overlap. TheICC analysis of pain-related BOLD fMRI responses showed fair-to-moderate intersession reliability in brainareas regarded as part of the cortical pain network. Areas with the highest intersession reliability based on theICC analysis included the anterior midcingulate cortex, anterior insula, and second somatosensory cortex.Areas with the lowest intersession reliability based on the ICC analysis also showed low spatial reliability;these regions included pregenual anterior cingulate cortex, primary somatosensory cortex, and posterior insula.Thus, this study found regional differences in pain-related BOLD fMRI response reliability, which may provideuseful information to guide longitudinal pain studies. A simple motor task (finger-thumb opposition) was per-formed by the same subjects in the same sessions as the painful heat stimuliwere delivered. Intersession reliabil-ity of fMRI activation in cortical motor areas was comparable to previously published findings for both spatialoverlap and ICCmeasures, providing support for the validity of the analytical approach used to assess intersessionreliability of pain-related fMRI activation. A secondary finding of this study is that the use of standard ICC alone asameasure of reliabilitymay not be sufficient, as the underlying variance structure of an fMRI dataset can result ininappropriately high ICC values; a method to eliminate these false positive results was used in this study and isrecommended for future studies of test–retest reliability.
© 2014 Published by Elsevier Inc. This is an open access article under the CC BY-NC-ND license(http://creativecommons.org/licenses/by-nc-nd/3.0/).
60
61
62
63
64
65
66
67
68
69
70
71
72
73
74
75
UNCO
R
1. Introduction
Functional magnetic resonance imaging (fMRI) studies in chronicpain patients have the potential to provide valuable information aboutthe neural mechanisms and efficacy of analgesic therapies, includingdrug treatments, acupuncture, brain stimulation, distraction tasks,mindfulness meditation, and cognitive-behavioral interventions. Fur-thermore, fMRI studies in healthy individuals have provided insightsinto neural mechanisms of pain modulation, such as the placebo effectand conditioned pain modulation. Such studies rely on the assumptionthat brain responses to pain are consistent in sessions conducted onseparate days before, during, and after therapeutic interventions. De-spite this common practice, only one study specifically addressing theintersession reliability of pain-related fMRI activation has been pub-lished. Taylor and Davis (2009) examined the spatial reliability of fMRIactivation associated with painful mechanical stimulation of the hand
76
77
78
en access article under the CC BY-NC
ntersession reliability of fMRI
in 6 subjects across four biweekly sessions, finding high across-sessionspatial repeatability in second somatosensory cortex (S2), but lowerandmore variable spatial repeatability in primary somatosensory cortex(S1) and thalamus (Taylor and Davis, 2009); other areas that are part ofthe cortical network classically activated by pain (as reviewed inDuerden and Albanese, 2013) were not examined in the study. Further-more, studies examining across-session reliability of the amplitude(percent signal change) of pain-related fMRI responses have not yetbeen published. Gaining a better understanding of the stability of re-peated, intersession measures of responses to pain (both spatial extentand BOLD signal amplitude) in the entire cortical pain network will en-hance the ability to interpret data collected in studies of pain-reducingmanipulations. Thus, characterization of test–retest reliability of pain-related fMRI activation is a critically important issue to address.
High test-retest reliability of fMRI responses across two ormore ses-sions has been reported for a wide variety of tasks, including motor,auditory detection, language, learning, and memory (Atri et al.,2011; Bennett and Miller, 2010; Cacares et al., 2009; Chen et al.,2007; Fliessbach et al., 2010; Freyer et al., 2009; Gorgolewski et al.,
-ND license (http://creativecommons.org/licenses/by-nc-nd/3.0/).
activation for heat pain and motor tasks, NeuroImage: Clinical (2014),

T
79
80
81
82
83
84
85
86
87
88
89
90
91
92
93
94
95
96
97
98
99
100
101
102
103
104
105
106
107
108
109
110
111
112
113
114
115
116
117
118
119
120
121
122
123
124
125
126
127
128
129
130
131
132
133
134
135
136
137
138
139
140
141
142
143
144
145
146
147
148
149
150
151
152
153
154
155
156
157
158
159
160
161
162
163
164
165
166
167
168
169
170
171
172
173
174
175
176
177
178
179
180
181
182
183
184
185
186
187
188
189
190
191
192
193
194
195
196
197
198
199
200
201
2 R.L. Quiton et al. / NeuroImage: Clinical xxx (2014) xxx–xxx
UNCO
RREC
2013; Gountouna et al., 2010; Havel et al., 2006; Kiehl and Liddle, 2003;Maitra et al., 2002; McGregor et al., 2012; Yoo et al., 2005). However,poor test–retest reliability of fMRI responses has been found for othertasks such as mouth movements (Havel et al., 2006), reward (Fliessbachet al., 2010), and spatial attention (Gorgolewski et al., 2013). Whilethese results may reflect differences in reliability across tasks, they mayalso reflect differences in statistical approaches used to assess reliability.Approaches have included measuring spatial extent or spatial overlapof significant task-related activation at the individual or group level,performing voxelwise group-level contrasts of the blood oxygenationlevel-dependent (BOLD) response, and calculating voxel-wise intraclasscorrelation coefficients (ICC) based on the amplitude of the BOLDresponse.
The first objective of this study was to characterize the intersessionreliability of pain-related fMRI activation elicited by painful contactheat stimuli in healthy volunteers, considering both spatial extent andamplitude measures. To address the possibility that reliability of pain-related fMRI responses may vary across brain regions, the study sepa-rately evaluated reliability of responses in cortical areas that are partof the network classically activated by pain (as reviewed in Duerdenand Albanese, 2013), including: S1, S2, pregenual anterior cingulatecortex (pACC), anterior midcingulate cortex (aMCC), insular cortex(INS, distinguishing anterior and posterior), supplementary motorarea (SMA), and several frontal lobe regions; the thalamus was alsoexamined.
Stimulus paradigms using painful heat vary across studies, withsome protocols using fixed temperatures for all subjects (resulting inhighly variable perceived pain intensity reports across the group) andothers using subject-specific temperatures that produce consistent per-ceived pain intensities across the group. A recent study reported no dif-ference in pain-related fMRI activation produced by fixed temperaturestimuli and individually-determined contact heat pain stimuli (vanden Bosch et al., 2013); however, the question of whether these differ-ent stimulus paradigms produce equally reliable results across sessionsremains unanswered. A second objective of this study was to comparethe reliability of pain-related fMRI responses for fixed temperaturestimuli with that of subject-specific temperatures to address whetherone or the other approach provides for more reproducible results.
The subjects in this study also performed a simple motor task(finger-thumb opposition) in the same sessions as they experiencedpainful heat. To evaluate the appropriateness and validity of theanalytical approach used to assess intersession reliability of pain-related fMRI responses, this study used the same approach to assessthe across-session reliability of motor-related fMRI activation andcompared the results with those previously published.
2. Methods
2.1. Subjects
Fourteen subjects (mean age 44.3 years, SD 19, range 22–75; 7male)participated in the study. All subjects were healthy, with nomajormed-ical, neurological, or chronic pain disorders. Young female subjects weretested during the follicular phase of their menstrual cycle (days 3 to 10)to reduce variance potentially related to effects of gonadal hormonefluctuations on pain perception. All postmenopausal women (n = 4)were not using hormone replacement therapy. Informed consent wasobtained from all subjects prior to experimentation. The protocol forthis studywas approved by the University of Maryland Institutional Re-view Board for the Protection of Human Subjects.
2.2. Stimulation
Painful heat stimuli were delivered to the left dorsal forearm of eachsubject using an MR-compatible Peltier thermal probe with a 2.6 cm2
contact surface (TSA-II, Medoc Ltd., Israel). The probe was held in
Please cite this article as: Quiton, R.L., et al., Intersession reliability of fMRIhttp://dx.doi.org/10.1016/j.nicl.2014.07.005
ED P
RO
OF
place during testing with a Velcro strap. Two temperatures of painfulheat were delivered to each subject: (1) 48 °C and (2) a subject-specific temperature perceived as moderately painful, which was de-fined as the temperature the subject rated as 50 on a 100-point comput-erized visual analog scale (VAS) for pain intensity. These stimuli will bereferred to as 48 °C and 50VAS throughout this manuscript. Tempera-tures that evoked the perception of moderate pain (50VAS) rangedfrom 47.5 to 50.0 °C (mean 49.0 °C, SD 1.0).
2.3. Experimental Protocol
2.3.1. Training sessionSubjects participated in a training session in a laboratory room ded-
icated to psychophysical assessments at least one day prior to scanning.During the training session, subjects were first presented with an as-cending series of thermal stimuli ranging from42 to 50 °C. Each temper-aturewas presented for 15 s (including rampup anddown time at a rateof 2.7 °C/s), followed by a 30-s interstimulus period of nonpainfulwarmth (37 °C). Subjects were then presented with a series of heatstimuli expected to be in the painful range (46–50 °C), with temperaturespresented twice each in a randomized order. After each stimulus, subjectsused an MR-compatible trackball (Fellowes, http://www.fellowes.com) torate peak pain intensity on a computerized VAS, which consisted of a ver-tical scale labeled “no pain” at the bottom and “most intense pain imagin-able” at the top (DAPSYS, Brian Turnquist, Johns Hopkins University,http://www.dapsys.net). VAS ratings were converted to numerical valuesranging from 0 to 100. Individual subject ratings for the range of temper-atures were used to interpolate the subject-specific temperature thatevoked a perception of moderate pain (50VAS) and to confirm that the48 °C stimulus was perceived as painful.
2.3.2. Scanning sessionsEach subject participated in three scanning sessions conducted on
separate days, with the mean interval between sessions 15 days (SD18). The high variance in the between-session interval was mainly at-tributable to two women who were scanned across multiple monthsto ensure testing was conducted during the follicular phase of themen-strual cycle. Most scans occurred between 4 and 9 pm and lasted about90 minutes; each of the 3 sessions for an individual subject began atabout the same time each day to reduce circadian variability in percep-tion and hormone levels. During each scanning session, informationabout functional brain responses was collected using BOLD fMRI and in-formation about brain anatomywas collected usingMR imaging (detailsbelow). The fMRI portion of the session consisted of two scans in whichpainful heat stimuli were delivered, separated by a 30-minute interval.The painful heat stimulus protocol for each fMRI scan consisted of deliv-ering the two temperatures (48 °C and the subject-specific temperatureperceived as moderately painful) six times each in a randomized order.Each temperature was presented for 15 s (including ramp up and downtime at a rate of 2.7 °C/s), followed by a 30-s interstimulus period ofnonpainful warmth (37 °C). After each stimulus, the computerizedVASwas presented to the subject throughMRVision 2000 goggles (Res-onance Technologies, Van Nuys, CA) and the subject rated peak painintensity using the MR-compatible trackball. The duration of each stim-ulus cyclewas 45 s: painful heat application (15 s), VAS rating task (15 s,or less if the subject responded more rapidly), and rest period (15 s, ormore if the subject completed the rating task in less than 15 s).
In the 30-minute interval between pain fMRI scans, subjects restedquietly for approximately 10 minutes, performed a simple motor task(right hand finger-thumb opposition at approximately 1 Hz) in ablock design (24 s opposition alternating with 24 s rest) for 6 minutesand 54 s while fMRI data were acquired, then rested quietly for the re-mainder of the interval.
2.3.2.1. Image acquisition. Imageswere collected using a 1.5 Tesla PhillipsEclipse scanner (Phillips Healthcare, Cleveland, OH). Functional MR
activation for heat pain and motor tasks, NeuroImage: Clinical (2014),

T
202
203
204
205
206
207
208
209
210
211
212
213
214
215
216
217
218
219
220
221
222
223
224
225
226
227
228
229
230
231
232
233
234
235
236
237
238
239
240
241
242
243
244
245
246
247
248
249
250
251
252
253
254
255
256
257
258
259
260
261
262
263
264
265
266
267
268
269
270
271
272
273
274
275
276
277
278
279
280
281
282
283
284
285
286
287
288
289
290
291
292
293
294
295
296
297
298
299
300
301
302
303
304
305
306
307
308
309
310
311
312
313
314
315
316
317
318
319
320
321
322
323
324
325
326
327
328
329
330
331
332
3R.L. Quiton et al. / NeuroImage: Clinical xxx (2014) xxx–xxx
UNCO
RREC
images were acquired using a single-shot echo planar imagingT2*-weighted sequence with an echo time (TE) of 35 ms and flip angleof 90°. Acquired image resolution was 3.2 × 3.2 mm over a 24-cm field-of-view (FOV). The images were zero padded to 128 × 128 pixels to pro-vide a resolution of 1.875×1.875mm. The repetition time (TR) of 3 s pro-vided full brain coverage using 24 axial slices (6 mm thick with no gapsbetween slices) prescribed parallel to the anterior-posterior commisuralplane. High-resolution T1-weighted volumetric scans (4.5 ms TE, 29 msTR, 110 slices, slice thickness 1.5 mm, 0.938 × 0.938mm in-plane resolu-tion, 24-cm FOV) were acquired in the same plane as the functional im-ages for anatomical detail.
2.3.2.2. Image processing and analysis2.3.2.2.1. Preprocessing. Image processing was performed using the
software package Analysis of Functional Neuroimages (AFNI; Cox,1996). The first four volumes of each functional scan were discardedto exclude images acquired prior to stabilization of the magnetic reso-nance signal. The remaining volumes were corrected for slice timingdifferences. Data from the 2 functional pain scans conducted withineach session were concatenated for analysis. Functional images weremotion-corrected by spatially registering the volumes from all function-al scans to the first remaining volume (AFNI routine 3dVolreg). Tominimize effects from possible spike-related artifacts, signals greaterthan 2.5 SDs of the overall BOLD signal were reduced (AFNI routine3dDespike). Time series were temporally smoothed to reduce highfrequency noise using a moving 3-point weighted (0.15-0.70-0.15) av-erage. Images were spatially smoothed to increase the signal-to-noiseratio using a 5-mm full width half-maximum Gaussian kernel. Trendsin the time series (linear, second-order, and third-order) were re-moved on a voxelwise basis to reduce low frequency noise compo-nents. Functional and anatomical images were transformed tocommon space (Tailairach and Tournoux, 1988), and the voxelsresampled to 2 × 2 × 2 mm. Voxelwise normalization was per-formed by dividing the signal intensity at each time point by thevoxel’s mean intensity.
2.3.2.2.2. Statistical analysis. For each individual subject, a general lin-ear modeling (GLM) approach was used to identify brain regions inwhich the time course of the BOLD signal was significantly related tothe task, either the painful stimulus or the motor task (AFNI script3dDeconvolve). The GLM for the pain scans consisted of three temporal-ly independent regressors (one for each temperature of painful heat andfor the VAS rating task) each represented by a delayed boxcar functionconvolved using the AFNI BLOCK function to account for hemodynamicdelay. The GLM also included 6motion correction parameters as regres-sors. Though the GLM included a regressor for the VAS rating task, re-sults for this regressor are not presented because brain activity duringthe VAS rating task is not a variable of interest in this study. The GLMfor the motor scans consisted of a regressor for the motor task as wellasmotion correction parameters. Voxelwise regression of the BOLD sig-nal time course with the appropriate model resulted in statistical para-metricmaps for pain-related activation andmotor-related activation foreach individual subject.
Group maps of significant pain-related activation were calculatedseparately for each stimulus type (48 °C and 50VAS) using regressioncoefficients from the GLM, collapsed across sessions, in a one-samplet-test (AFNI routine 3dttest). The resulting group statistical parametricmaps (one for the 48 °C stimulus and one for the 50VAS stimulus)were thresholded to identify significant activation associated witheach type of painful heat using a cluster threshold approach to correctfor multiple comparisons across the brain. The cluster threshold criteri-on was determined using Monte Carlo simulations to estimate the like-lihood of detecting false positives over multiple comparisons (AFNIroutine 3dClustSim). Based on the simulations, which were derivedfrom whole-brain analyses, a significant cluster (overall correctedp b 0.05) was defined as a minimum cluster size of 190 mm3 of contig-uous voxels, each with a voxelwise p b 0.05. The cluster threshold
Please cite this article as: Quiton, R.L., et al., Intersession reliability of fMRIhttp://dx.doi.org/10.1016/j.nicl.2014.07.005
ED P
RO
OF
criterion was applied to maps for the t-statistic for each stimulus type(48 °C and 50VAS) to identify the voxels that responded significantlyto each type of painful heat, resulting in two thresholded maps foreach subject: (1) voxels responding significantly to 48 °C stimuli and(2) voxels responding significantly to the 50VAS stimulus. Statisticalparametric maps for the motor task were thresholded using the sameapproach to identify voxels responding significantly during the motortask. The pain-related and motor-related maps that resulted from thisstage of analysis differed in spatial extent. Accordingly, cluster sizethresholding for subsequent analyses (described below) involved dif-ferent spatial threshold criteria for the pain- and motor-related activa-tion maps.
To evaluate reliability of pain- and motor-related fMRI activationacross the three sessions conducted in this study, two measures werecalculated for voxels that showed significant pain-related activation,separately for each stimulus type (48 °C and 50VAS), or significantmotor-related activation: (1) spatial reliability coefficients based onspatial localization and extent of activation and (2) intraclass correla-tion coefficients (ICC) based on the GLM regression coefficients, whichreflect fMRI response amplitude. Spatial reliability coefficients arebased on the number of voxels commonly activated in all sessions(Rombouts et al., 1998); voxels significantly activated by painful stimulior the motor task were identified in each session using regression coef-ficients from the GLM in a one-sample t-test. Spatial reliability coeffi-cients were calculated separately for the 48 °C stimulus, the 50VASstimulus, and the motor task, using the formula R = (3 × number ofvoxels commonly activated in all 3 sessions)/(sum of activated voxelsin all 3 sessions) (Havel et al., 2006). Spatial reliability coefficients forthe painful stimuli were also calculated across the two stimulus types(48 °C and 50VAS) using the formula R = (2 × number of voxels com-monly activated by both stimulus types)/(sum of activated voxels byboth stimulus types). Spatial reliability coefficients can range in valuefrom 0 to 1, with 0 indicating poor spatial reliability and 1 indicatingperfect spatial overlap across sessions or conditions.
ICCs were calculated using the regression coefficients from the GLM(which reflect BOLD response amplitude) separately for the 48 °C stim-ulus, the 50VAS stimulus, and themotor task, resulting in three reliabil-ity maps (one for the 48 °C stimulus, one for the 50VAS stimulus, andone for themotor task). ICCs were calculated separately for each painfulstimulus type and the motor task (AFNI routines 3dCalc and 3dMean)using the formula described in McGraw and Wong (1996) for the de-gree of absolute agreement among repeated measurements:
ICCðA;1Þ ðBMS−EMSÞBMS þ ðk−1ÞEMSþ k
nðWMS−EMSÞ
The ICC thereforemeasures the correlation of themagnitude of pain-or motor-related fMRI responses between sessions using a two-waymixed ANOVA framework, where the variance is divided into betweensubject variance (BMS), within subject variance (WMS), and residualsources of variance (EMS), k is the number of repeated sessions, and nis the number of subjects within a session. An F-statistic and p-value as-sociated with each voxel’s ICC were calculated based on the approachdescribed in (McGraw and Wong, 1996). The F-statistic maps werethen thresholded using a cluster threshold approach to correct formulti-ple comparisons across the voxels that survived the initial thresholdingstep (described above) (AFNI routine 3dClustSim). As previously noted,the pain- andmotor-related maps differed in spatial extent after the ini-tial thresholding step; as a result, different cluster size threshold criteriawere calculated for these maps in these subsequent analyses. For pain-related maps, a significant cluster (overall corrected p b 0.05) was de-fined as a minimum cluster size of 127 mm3 of contiguous voxels, eachwith a voxelwise p b 0.05. For motor-related maps, a significant cluster(overall corrected p b 0.05) was defined as a minimum cluster size of148 mm3 of contiguous voxels, each with a voxelwise p b 0.05. Thethresholding step was conducted separately for each stimulus type andfor the motor task, resulting in three statistical parametric maps (one
activation for heat pain and motor tasks, NeuroImage: Clinical (2014),
TE
R
333
334
335
336
337
338
339
340
341
342
343
344
345
346
347
348
349
350
351
352
353
354
355
356
357
358
359
360
361
362
363
364
365
366
367
368
369
370
371
372
373
374
375
376
377
378
379
380
381
382
383
384
385
386
387
388
389
390
391
392
393
394
395
396
397
398
399
400
401
402
403
404
405
406
407
408
409
410
411
412
413
414
415
416
417
418
419
420
421
422
423
424
425
426
427
428
429
430
431
432
433
434
435
48° Celsius50 VAS
Fig. 1. Box plots of pain intensity ratings for 48 °C stimulus and perceptually-equalizedstimuli (50VAS)where the temperature that produced a rating of 50 on a 0–100 visual an-alog scalewas selected individually for each subject (n=14). Ratingswereobtained in thescanner on separate days (sessions 1–3). Median values are represented by solid lines.Solid circles represent individual outliers. No significant session effects were found for ei-ther measure (Friedman test, p N 0.05 for each stimulus type).
4 R.L. Quiton et al. / NeuroImage: Clinical xxx (2014) xxx–xxx
UNCO
RREC
for the 48 °C stimulus, one for the 50VAS stimulus, and one for themotortask) of brain areas with significantly reliable pain- or motor-related ac-tivation. Thesemapswere thenmasked to exclude voxels wherewithin-subject variance contributed tomore than 1% of the total variance (calcu-lated using AFNI’s 3dICC_REML routine). The purpose of this step was toeliminate voxelswith artifactually high ICCs (such aswould be the case ifBMS was high, WMSwas high, and EMS was low), thereby reducing thepossibility of false positives (Chen et al., 2007). EMS represents randomvariance with unknown sources that might include MRI-related noise,physiological noise, or cognitive processes unrelated to the task thatchange over time (Bennett and Miller, 2010).
Significantly reliable pain-related activation (as determined by clus-ters with significant ICCs) associated with each stimulus type was ex-amined in anatomically-defined regions of interest (ROI) known to beinvolved in processing painful stimuli: the arm representation area ofS1, S2, pACC, aMCC (corresponding to the area referred to as the mid-ACC in many previous pain studies), anterior INS (aINS), posterior INS(pINS), SMA, inferior frontal gyrus (IFG), medial prefrontal cortex(mPFC) and dorsolateral prefrontal cortex (dlPFC). The arm area of S1was defined as the region of the postcentral gyrus starting from themost medial portion of the hand representation (delineated by the“knob” created by the postcentral gyrus) and extending approximately2 cmmedially along the surface from that point, excluding digit represen-tations (Servos et al., 1998; van Westen et al., 2004); these boundariesshould encompass the complete arm representation. The boundaries ofthe pACC and aMCC were delineated based on Vogt (2005). The bound-aries of the other ROIs were described previously (Moulton et al., 2005).Significantly reliable motor-related activation (as determined by clusterswith significant ICCs) was examined in two anatomically-defined motorROIs: the hand representation area in the primary motor cortex (M1)and SMA.
For the painful stimuli, separate evaluationswere conducted for por-tions of each ROI contralateral (right hemisphere) and ipsilateral (lefthemisphere) to the stimuli. For each stimulus type, the largest clusterof significantly reliable (as defined by significant ICC values) pain-related activationwas identified in each ROI. The reliability of each clus-ter was then classified using the peak ICC value based on the conserva-tive criteria described by Shrout (1998): virtually no reliability (0–0.1),slight reliability (0.11–0.4), fair reliability (0.41–0.6), moderate reliabil-ity (0.61–0.8), and substantial reliability (0.81–1). Themotor data wereanalyzed using the same approach, with the largest cluster of signifi-cantly reliablemotor-related activation identified in each ROI contralat-eral to the hand performing the task (left hemisphere) and ipsilateral(right hemisphere).
To address the question of whether a painful stimulus of constanttemperature or of constant perceived intensity produced more reliableBOLD fMRI responses, a group-level contrast between significantly reli-able pain-related activation for the 2 stimulus types was conducted inwhich the voxelwise ICC values for each stimulus type were contrasted(Donner and Zou, 2002).
2.3.2.2.3. Additional statistical analyses2.3.2.2.3.1. Perception-Dependent Responses. To address the question ofwhether the perceived pain intensity-dependent response is consistentacross sessions, a voxelwise analysis was conducted in which individualpain intensity ratings for each subject and each stimulus were used inthe GLM. The analysis was conducted on the 48 °C pain condition,whichwas the protocol inwhich ratings varied themost across subjects.For each individual subject and each session, pain intensity ratings ofeach 48 °C stimulus were used in the regression model for each voxel,resulting in parameter estimates for each subject at each voxel that rep-resented the degree towhich perceived pain intensity covariedwith theBOLD response. The parameter estimates were then used in a groupanalysis to identify voxels where the pain intensity ratings significantlypredicted themagnitude of the BOLD response to the stimulus. Interses-sion reliability in these voxels could then be evaluated by calculatingICCs.
Please cite this article as: Quiton, R.L., et al., Intersession reliability of fMRIhttp://dx.doi.org/10.1016/j.nicl.2014.07.005
OO
F
2.3.2.2.3.2. Intersession Reliability: The effect of duration between sessions.To address the question of whether the duration between sessions hadan effect on intersession reliability, we reanalyzed our pain and motortask data sets to calculate ICCs on task-related activation detectedwhen duration between session was used as a covariate in the analysis.The analysis involved two stages.
The first analysis stage involved conducting a voxelwise GLMrepeated measures ANCOVA for each of our pain and motor tasks sepa-rately, using each subject’s average days between sessions as a time-invariant covariate using the methodology of Winer (1971). The analy-sis excluded voxels that violated the assumption of homogeneity ofregression slopes because ANCOVA is not an appropriate statisticaltest when this assumption is violated (Tabachnick and Fidell, 2007).Our homogeneity test revealed that 98% of voxels across the brain didNOT violate this assumption andwere therefore included in the ANCOVA.
In the second stage of the analysis, ICCswere calculated based on theANOVA framework described by McGraw andWong (1996), but with aslight modification: A two-way mixed design of absolute agreementwas used to calculate ICCs on a voxelwise basis using adjusted variabil-ity estimates and degrees of freedomderived from theANCOVA analysis(AFNI routines 3dcalc and 3dMean). Subsequent analysis steps involvedthe same thresholding, masking, and statistical steps as the original ICCanalysis.
D P2.3.3. Statistical Analysis: Psychophysical data
Pain intensity ratings obtained in the scanner were evaluated sepa-rately for each stimulus type using the nonparametric Friedman testfor intersession effects. Mauchly’s test of sphericity was used to com-pare the error variance associated with each stimulus type. The signifi-cance level for all tests was set at 0.05.
3. Results
3.1. Psychophysics
Pain intensity ratings did not differ significantly across sessions foreither stimulus type (p N 0.05, Friedman test, Fig. 1), indicating thatwithin the parameters of this study, repeated testing did not change per-ceived intensity of the painful heat stimuli. Variance of pain intensity rat-ings was greater for the 48 °C stimulus than the perceptually-equalized50VAS stimulus (p b 0.05).
activation for heat pain and motor tasks, NeuroImage: Clinical (2014),

TD P
RO
OF
436
437
438
439
440
441
442
443
444
445
446
447
448
449
450
A B48°C Stimulus 50VAS Stimulus
-13 ±2.0 13
T value
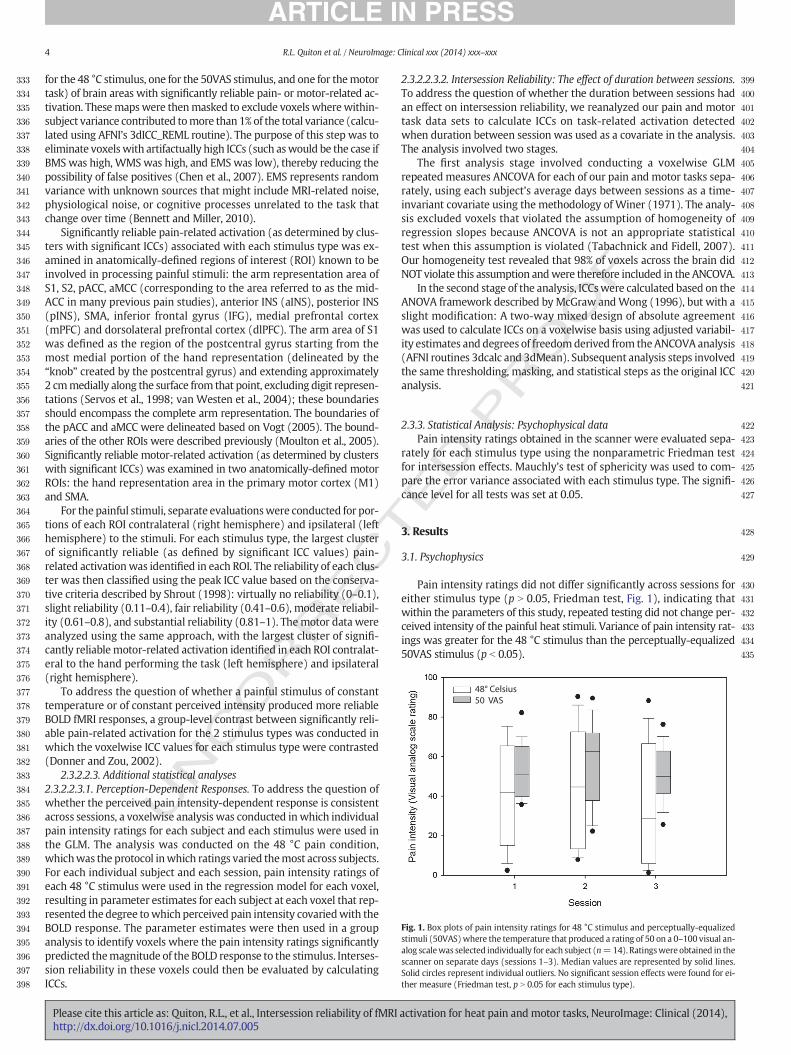
Fig. 2. Groupmaps of brain regions significantly activated by painful heat stimuli: (A) 48 °C and (B) subject-specific temperatures that were rated as 50 on a 0–100 visual analog scale forpain intensity (50VAS). Functional activation is overlaid on the T1-weighted group average of each subject’s brain normalized to Talairach space. Significant activation was defined as aminimum cluster size of 9 contiguous voxels (190 mm3), each with a voxelwise p b 0.05, resulting in an overall corrected p b 0.05. Orange and yellow areas represent voxels with a sig-nificantly positive pain-related BOLD response, while blue areas represent voxels with a significantly negative pain-related BOLD response.
5R.L. Quiton et al. / NeuroImage: Clinical xxx (2014) xxx–xxx
EC
3.2. Pain-related Activation
Significant pain-related activation was found in expected brain re-gions of interest (ROI) for both types of painful heat stimuli (Fig. 2).Most prescribed ROIs showed significant increases in the BOLD signalassociated with painful heat, including pACC, aMCC, aINS, and S2. Afew ROIs, including the arm region of S1 and frontal lobe regions,showed significant decreases in the BOLD signal in response to painful
UNCO
RR
A 48°C Session Overlap B
1+2 1+3
Session # Co
Fig. 3.Groupmaps showing voxels significantly activated in 1, 2, or all 3 sessions in response toon a 0–100 visual analog scale for pain intensity (50VAS).
Please cite this article as: Quiton, R.L., et al., Intersession reliability of fMRIhttp://dx.doi.org/10.1016/j.nicl.2014.07.005
Estimuli (Fig. 2). The map of pain-related activation from this studywas compared with the reverse inference meta-analysis image fromthe Neurosynth database (Yarkoni et al., 2011) and was found to havenotable overlap, particularly with respect to the insula, anterior cingu-late cortex, and somedorsolateral frontal regions. As reported above, ro-bust activation was found in several other brain regions that were notidentified in the image from the Neurosynth database, but have beendescribed in the literature (Duerden and Albanese, 2013).
50VAS Session Overlap
2+3 all
lor Scale
painful heat stimuli: (A) 48 °C and (B) subject-specific temperatures that were rated as 50
activation for heat pain and motor tasks, NeuroImage: Clinical (2014),

T
RO
OF
451
452
453
454
455
456
457
458
459
460
461
462
463
464
465
466
467
468
469
470
471
472
473
t1:1 Table 1t1:2 Spatial reliability coefficients for pain-activated regions associated with 48 °C stimulus.
t1:3 Region of interesta Number of significant voxels (each session) Across-session overlap(# voxels)
Reliability coefficientb
1 2 3
t1:4 Anterior midcingulate cortex (left) 1352 1592 1976 472 0.29t1:5 Anterior midcingulate cortex (right) 1888 1856 2768 496 0.23t1:6 Pregenual anterior cingulate cortex (left) 128 168 432 0 0.00t1:7 Pregenual anterior cingulate cortex (right) 120 264 128 0 0.00t1:8 Inferior frontal gyrus (left) 3504 2600 3672 496 0.15t1:9 Inferior frontal gyrus (right) 5472 8256 8848 3408 0.45t1:10 Primary somatosensory cortex (left) 592 104 624 8 0.02t1:11 Primary somatosensory cortex (right) 160 664 408 16 0.04t1:12 Supplementary motor area (left) 1360 1632 2264 160 0.09t1:13 Supplementary motor area (right) 2056 1936 2088 400 0.20t1:14 Anterior insular cortex (left) 1992 3648 2544 1112 0.41t1:15 Posterior insular cortex (left) 360 768 224 0 0.00t1:16 Anterior insular cortex (right) 3280 3736 2936 1744 0.53t1:17 Posterior insular cortex (right) 384 136 312 0 0.00t1:18 Medial prefrontal cortex (left) 3816 5320 5688 1904 0.39t1:19 Medial prefrontal cortex (right) 2640 2944 2400 624 0.23t1:20 Dorsolateral prefrontal cortex (left) 6928 8136 5496 976 0.14t1:21 Dorsolateral prefrontal cortex (right) 10,352 12,464 13,824 4672 0.38t1:22 Second somatosensory cortex (left) 1088 1264 1376 112 0.09t1:23 Second somatosensory cortex (right) 880 1872 1368 384 0.28t1:24 Thalamus (left) 560 360 576 24 0.05t1:25 Thalamus (right) 256 1656 392 72 0.09
t1:26 a Left regions are ipsilateral to the stimulust1:27 b Reliability coefficient = (3 × number of common voxels)/(sum of activated voxels in each session)
t2:1
t2:2
t2:3
t2:4
t2:5
t2:6
t2:7
t2:8
t2:9
t2:10
t2:11
t2:12
t2:13
t2:14
t2:15
t2:16
t2:17
t2:18
t2:19
t2:20
t2:21
t2:22
t2:23
t2:24
t2:25
t2:26
t2:27
t2:28
t2:29
6 R.L. Quiton et al. / NeuroImage: Clinical xxx (2014) xxx–xxx
C
3.2.1. Reliability of pain-related activation: Spatial reliability coefficientsIntersession reliability of the spatial extent of significant pain-
related activation is shown in Fig. 3. Spatial reliability coefficientswere low (b 0.2) in most pain-related ROIs, for both the 48 °C stimulus(Table 1) and 50VAS stimulus (Table 2). Spatial reliability differed byROI, with the highest spatial overlap shown for both stimulus types inthe aINS and no voxels displaying complete overlap (e.g., significant ac-tivation in all 3 sessions) for either stimulus type in the pACC.
Spatial overlap between the two stimulus types (48 °C and 50VAS)is shown in Fig. 4. Spatial reliability coefficients were relatively high(most N 0.5, Table 3), indicating moderately consistent spatial extentof activation regardless of whether the stimulus was of constant
UNCO
RRE
Table 2Spatial reliability coefficients for pain-activated regions associated with 50VASastimulus.
Number of significant voxels (ea
Region of interestb 1 2
Anterior midcingulate cortex (left) 1504 1408Anterior midcingulate cortex (right) 1392 2152Pregenual anterior cingulate cortex (left) 344 392Pregenual anterior cingulate cortex (right) 176 96Inferior frontal gyrus (left) 3800 3928Inferior frontal gyrus (right) 6760 7192Primary somatosensory cortex (left) 248 240Primary somatosensory cortex (right) 32 72Supplementary motor area (left) 1688 1088Supplementary motor area (right) 1744 1512Anterior insular cortex (left) 2384 3032Posterior insular cortex (left) 136 176Anterior insular cortex (right) 4344 2784Posterior insular cortex (right) 104 296Medial prefrontal cortex (left) 4648 3888Medial prefrontal cortex (right) 2416 1808Dorsolateral prefrontal cortex (left) 5960 6544Dorsolateral prefrontal cortex (right) 7144 4088Second somatosensory cortex (left) 336 1160Second somatosensory cortex (right) 728 1800Thalamus (left) 168 904Thalamus (right) 1664 1656
a 50VAS is the subject-specific temperature that produced a perceived intensity of 50 on a 0b Left regions are ipsilateral to the stimulusc Reliability coefficient = (3 × number of common voxels)/(sum of activated voxels in each
Please cite this article as: Quiton, R.L., et al., Intersession reliability of fMRIhttp://dx.doi.org/10.1016/j.nicl.2014.07.005
ED Ptemperature or of constant perceived pain intensity. Spatial overlap be-
tween the stimulus types showed regional differences, with the highestreliability coefficients in the aINS and low reliability coefficients in thepACC.
3.2.2. Reliability of pain-related activation: Intraclass correlation coefficientsReliability of pain-related activation amplitude was assessed in a
two-step process (see Methods), by calculating voxelwise ICCs andthen applying a statistical filter to eliminate voxels with artifactuallyhigh ICC values due to a combination of high WMS and low EMS.Fig. 5 shows an example of the importance of the statistical filteringstep. Fig. 5A shows the average BOLD response amplitude for each
ch session) Across-session overlap(# voxels)
Reliability coefficientc
3
928 168 0.131904 424 0.230 0 0.0064 0 0.003880 440 0.116512 3288 0.48184 8 0.04400 0 0.001528 168 0.121576 344 0.213592 984 0.33888 8 0.024608 2200 0.56224 0 0.002608 776 0.212104 480 0.233944 632 0.128800 1136 0.17736 24 0.03552 208 0.20352 0 0.001368 200 0.13
–100 visual analog scale
session)
activation for heat pain and motor tasks, NeuroImage: Clinical (2014),

T
RO
OF
474
475
476
477
478
479
480
481
482
483
484
485
486
487
488
489
490
491
492
493
494
495
496
497
498
499
A BPositive response overlap Negative response overlap
Fig. 4. Overlap of significant pain related activation (A) or deactivation (B) produced by 48 °C stimuli (green areas) and subject-specific temperatures that were rated as 50 on a 0–100visual analog scale for pain intensity (50VAS, red areas). Yellow represents areas that showed significant response for both stimulus conditions.
t3:1
t3:2
t3:3
t3:4
t3:5
t3:6
t3:7
t3:8
t3:9
t3:10
t3:11
t3:12
t3:13
t3:14
t3:15
t3:16
t3:17
t3:18
t3:19
t3:20
t3:21
t3:22
t3:23
t3:24
t3:25
t3:26
t3:27
t3:28
7R.L. Quiton et al. / NeuroImage: Clinical xxx (2014) xxx–xxx
C
session in the voxel in the left IFG with the highest ICC prior to the sta-tistical filtering step. The graph shows a highly variable pain-relatedBOLD response in this voxel across sessions; however, the ICC value(0.75) calculated for this voxelwas the highest in the ROI and statistical-ly significant. The high ICC value obtained for this voxel is attributable toa combination of high BMS, highWMS and low EMS. This example illus-trates that it is possible to obtain a high ICC value for a voxel despitehigh variability (low reliability) of the response from session to session.Thus, relying entirely on ICC values without examining the variancesthat contribute to the ICC can result in a voxel being identified as havinga reliable intersession responsewhen in fact it does not (in other words,a false positive). The statistical filtering step employed here, which elim-inates voxels with high WMS (such as the voxel shown in Fig. 5A), is a
UNCO
RRE
Table 3Spatial reliability coefficients for pain-activated regions across stimulus conditions.
Region of interesta 48 °C stimulus (# voxels)
Anterior midcingulate cortex (left) 3520Anterior midcingulate cortex (right) 4016Pregenual anterior cingulate cortex (left) 512Pregenual anterior cingulate cortex (right) 600Inferior frontal gyrus (left) 8400Inferior frontal gyrus (right) 13,448Primary somatosensory cortex (left) 920Primary somatosensory cortex (right) 1144Supplementary motor area (left) 3976Supplementary motor area (right) 4264Anterior insular cortex (left) 5104Posterior insular cortex (left) 1224Anterior insular cortex (right) 5600Posterior insular cortex (right) 456Medial prefrontal cortex (left) 9544Medial prefrontal cortex (right) 5672Dorsolateral prefrontal cortex (left) 15,560Dorsolateral prefrontal cortex (right) 23,024Second somatosensory cortex (left) 2936Second somatosensory cortex (right) 3056Thalamus (left) 1192Thalamus (right) 2040
a Left regions are ipsilateral to the stimulusb 50VAS is the subject-specific temperature that produced a perceived intensity of 50 on a 0c Reliability coefficient = (3 × number of common voxels)/(sum of activated voxels in each
Please cite this article as: Quiton, R.L., et al., Intersession reliability of fMRIhttp://dx.doi.org/10.1016/j.nicl.2014.07.005
ED Pconservative approach to address this issue. Fig. 5B shows the average
BOLD response for each session in the voxel in the left IFG with thehighest ICC after the statistical filtering step. This voxel, which is anatom-ically close to the peak voxel found prior to statistical filtering, showsmuchmore consistent and reliable pain-related responses across session,and an ICC value (0.73) that more accurately reflects the low intersessionvariance.
Intersession reliability of pain-related activation associated with the48 °C stimulus is summarized in Table 4 and Fig. 6A. Table 4 identifiesthe largest cluster of significantly reliable pain-related activation foundin each ROI and the ICC value associated with the peak voxel in thecluster; additional clusters were also found in most ROIs. Fair-to-moderate reliability (based on Shrout, 1998) was found in every
50 VASb stimulus (# voxels) Overlap(# voxels)
Reliability coefficientc
3960 2512 0.6724296 3080 0.741560 192 0.358392 192 0.3879304 5800 0.65511,120 10,240 0.834592 448 0.593400 312 0.4043784 2632 0.6783416 2680 0.6985776 4856 0.893848 360 0.3476544 5336 0.879408 72 0.1677560 6968 0.8155496 4000 0.71613,552 9824 0.67516,088 14,712 0.7522576 2008 0.7292584 2352 0.834952 392 0.3662776 1584 0.658
–100 visual analog scalesession)
activation for heat pain and motor tasks, NeuroImage: Clinical (2014),

T
RO
OF
500
501
502
503
504
505
506
507
508
509
510
511
512
513
514
515
516
517
518
519
520
521
522
523
524
525
526
527
528
529
530
531
532
533
BOLD
% s
igna
l cha
nge
0
0.2
0.4
1 2 3 1 2 3
0
0.4
Session
ICC = 0.75BMS = .65WMS = .20EMS = .07
ICC = 0.73BMS = .39WMS = .03EMS = .04
A BLeft Inferior Frontal Gyrus (x=-45 mm, y=19 mm, z=-6 mm)
Left Inferior Frontal Gyrus (x=-47 mm, y=19 mm, z=-6 mm)
Session
Fig. 5. BOLD fMRI response amplitude in the left inferior frontal gyrus to painful heat stimuli rated 50 on a 0–100 visual analog scale for pain intensity (50VAS). (A) Responses in the voxelwith the peak intraclass correlation coefficient (ICC) value before statistical filtering. (B) Responses in the voxel with the peak ICC after filtering. Values for ICC, between-subject variance(BMS),within-subject variance (WMS), and residual error variance (EMS) are shown for each voxel. Statisticalfiltering consisted of removing voxelswhereWMS contributed tomore than1%of the total variance. The value of statisticalfiltering is demonstrated in (A)where the voxelwith thepeak ICC value has highWMS, indicating low reliability, but an artifactually high ICCdue to high BMS and low EMS. Statistical filtering eliminated this voxel, instead identifying a nearby voxel (B) with a peak ICC value and low WMS in the same brain region of interest.
t4:1
t4:2
t4:3
t4:4
t4:5
t4:6
t4:7
t4:8
t4:9
t4:10
t4:11
t4:12
t4:13
t4:14
t4:15
t4:16
t4:17
t4:18
t4:19
t4:20
t4:21
8 R.L. Quiton et al. / NeuroImage: Clinical xxx (2014) xxx–xxx
RREC
ROI except (1) contralateral pACC, which showed slight reliability,and (2) S1, pINS, and ipsilateral thalamus, which contained no clustersthat were significantly reliable across the three sessions. ROIs with thehighest ICCs (the upper portion of the moderate range) included aMCC,aINS, and several frontal lobe areas. Clusters of significantly reliablepain-related activation from selected ROIs are shown in Fig. 6A.
Intersession reliability of pain-related activation associated with the50VAS stimulus is summarized in Table 5 and Fig. 6B. Table 5 identifiesthe largest cluster of significantly reliable pain-related activation foundin each ROI and the ICC value associatedwith the peak voxel in the clus-ter; additional clusters were also found in most ROIs. Fair-to-moderatereliability (based on Shrout, 1998)was found in every ROI except (1) ip-silateral pACC and ipsilateral thalamus, which showed slight reliability,and (2) contralateral pACC, S1, and contralateral pINS, which containedno clusters that were significantly reliable across the three sessions.ROIs with the highest ICCs (the upper portion of the moderate range)included aMCC and S2. Clusters of significantly reliable pain-related ac-tivation from selected ROIs are shown in Fig. 6B.
UNCOTable 4
Brain regions with significantly reliable pain-related signal amplitude associated with 48 °C sti
Region of interesta Largest cluster (mm3) Pe
x
Anterior midcingulate cortex (left) 1144 –1Anterior midcingulate cortex (right) 704 1Pregenual anterior cingulate cortex (left) 56 –3Pregenual anterior cingulate cortex (right) 80 1Inferior frontal gyrus (left) 392 –4Inferior frontal gyrus (right) 3096 57Supplementary motor area (left) 288 –1Supplementary motor area (right) 704 13Anterior insular cortex (left) 528 –3Anterior insular cortex (right) 2232 37Medial prefrontal cortex (left) 1896 –5Medial prefrontal cortex (right) 1376 9Dorsolateral prefrontal cortex (left) 816 –3Dorsolateral prefrontal cortex (right) 640 45Second somatosensory cortex (left) 184 –5Second somatosensory cortex (right) 1152 55Thalamus (right) 32 7
a Left regions are ipsilateral to the stimulus
Please cite this article as: Quiton, R.L., et al., Intersession reliability of fMRIhttp://dx.doi.org/10.1016/j.nicl.2014.07.005
ED PThe results of the group-level contrast between significantly reliable
pain-related activation for the 2 stimulus types are summarized inTable 6. Voxelwise ICC values for each stimulus type were contrastedto obtain these results. The constant temperature stimulus (48 °C) pro-ducedmore reliable activation than the constant perceived pain intensi-ty stimuli in aINS (bilaterally), ipsilateral mPFC, and ipsilateral dlPFC;the converse was found in contralateral IFG, contralateral dlPFC, and ip-silateral S2. No significant differences in reliability were found for theother ROIs examined in this study. Thus, though therewere some differ-ences, no consistent pattern emerged in terms of whether a painfulstimulus of constant temperature or of constant perceived intensityproduced more reliable BOLD fMRI responses.
3.2.3. Perception-dependent responsesClusters for which pain intensity ratings of the 48 °C stimulus signif-
icantly predicted the magnitude of the BOLD response to the stimuluswere found to be very limited, scattered, and with little overlap across
mulus.
ak voxel in largest cluster
y z ICC F p-value
23 32 0.76 9.908 b 0.00123 28 0.746 9.314 b 0.00143 10 0.497 3.992 0.00137 10 0.39 2.808 0.012
7 17 –4 0.634 6.081 b 0.0019 22 0.757 10.359 b 0.001–13 54 0.683 7.048 b 0.001–11 62 0.593 5.372 b 0.001
3 15 6 0.668 6.95 b 0.0015 –6 0.721 8.749 b 0.00149 10 0.688 7.653 b 0.00159 8 0.771 10.632 b 0.001
3 21 40 0.63 5.899 b 0.0011 38 0.734 8.967 b 0.001
5 –25 16 0.451 3.506 0.003–25 18 0.657 6.722 b 0.001–11 14 0.436 3.169 0.006
activation for heat pain and motor tasks, NeuroImage: Clinical (2014),

PRO
OF
534
535
536
537
538
539
540
541
542
543
544
545
z=10 z=20 x=1Contralateral S2 mPFC and aINS Contralateral aMCC
2.12 6 11
F-scale
Contralateral SMA z=62
A
Bz=12 z=24
S2 Contralateral aINS z=2
mPFC Contralateral aMCCx=1
Fig. 6. Representative brain regions with significantly reliable responses to (A) painful 48 °C heat stimuli and (B) painful heat stimuli rated 50 on a 0–100 visual analog scale for pain in-tensity across 3 sessions conducted on separate days. Color-coded areas represent the largest clusters in a brain region of interest with statistically significant intraclass correlation coef-ficients (threshold criterion of 6 contiguous voxels equivalent to 127 mm3, each with a voxelwise p b 0.05, resulting in overall corrected p b 0.05). Regions of interest with significantlyreliable pain-related activation included the medial prefrontal cortex (mPFC), anterior insular cortex (aINS), second somatosensory cortex (S2), anterior mid-cingulate cortex (aMCC),and supplementary motor area (SMA).
t5:1
t5:2
t5:3
t5:4
t5:5
t5:6
t5:7
t5:8
t5:9
t5:10
t5:11
t5:12
t5:13
t5:14
t5:15
t5:16
t5:17
t5:18
t5:19
t5:20
t5:21
t5:22
t5:23
9R.L. Quiton et al. / NeuroImage: Clinical xxx (2014) xxx–xxx
sessions (Supplemental Fig. 1). As a result, a quantitative analysis of ICCswas deemed unnecessary.
T 546
547
548
549
550
551
552
553
554
555
556
REC
3.2.4. Effect of duration between sessions on intersession reliabilityAs shown in Supplemental Tables 1, 2, and 3, the effect of duration
between sessions on the reliability of pain- and motor-related fMRI ac-tivation was minor. The ICCs calculated in our original analysis and theanalysis that took between-session duration into account are compara-ble and did not differ in a large or consistent way in any pain- or motor-related region of interest. Thus, the results suggest that with this dataset, the duration between sessions did not contribute significantly to in-tersession variability.
UNCO
R
Table 5Brain regions with significantly reliable pain-related signal amplitude associated with 50VASa
Region of interestb Largest cluster (mm3) Pea
x
Anterior midcingulate cortex (left) 1296 –3Anterior midcingulate cortex (right) 888 3Pregenual anterior cingulate cortex (left) 48 –11Inferior frontal gyrus (left) 384 –49Inferior frontal gyrus (right) 2816 45Supplementary motor area (left) 280 –1Supplementary motor area (right) 280 1Anterior insular cortex (left) 336 –47Posterior insular cortex (left) 40 –37Anterior insular cortex (right) 832 39Medial prefrontal cortex (left) 584 –3Medial prefrontal cortex (right) 328 5Dorsolateral prefrontal cortex (left) 304 –25Dorsolateral prefrontal cortex (right) 2200 43Second somatosensory cortex (left) 1688 –57Second somatosensory cortex (right) 768 55Thalamus (left) 16 –5Thalamus (right) 216 7
a 50VAS is the subject-specific temperature that produced a perceived intensity of 50 on a 0b Left regions are ipsilateral to the stimulus
Please cite this article as: Quiton, R.L., et al., Intersession reliability of fMRIhttp://dx.doi.org/10.1016/j.nicl.2014.07.005
ED
3.3. Motor activation
Significant motor-related activation was found in expected brainROIs (M1 and SMA) bilaterally. Intersession reliability of the spatial ex-tent of significantmotor-related activation is shown in Table 7. The spa-tial reliability coefficient was high in M1 contralateral to the handperforming the motor task (0.78) but was much lower in contralateralSMA (0.2). The spatial reliability coefficients in M1 and SMA ipsilat-eral to the hand performing the motor task were notably lowerthan the contralateral regions. Intersession reliability of the ampli-tude of motor-related activation is shown in Table 7, which identifiesthe largest cluster of significantly reliable motor-related activation ineach ROI and the ICC value associatedwith the peak voxel in the cluster;
stimulus.
k voxel in largest cluster
y z ICC F p-value
21 32 0.694 7.823 b 0.001–1 40 0.781 10.967 b 0.00133 22 0.392 2.898 0.01011 28 0.596 5.497 b 0.00121 10 0.708 8.007 b 0.001–11 58 0.675 6.874 b 0.001–9 58 0.613 5.507 b 0.0015 –2 0.531 4.271 b 0.001–29 20 0.457 3.449 0.00317 12 0.636 6.035 b 0.00153 2 0.706 7.879 b 0.00155 0 0.69 7.33 b 0.00111 56 0.619 5.593 b 0.00141 22 0.696 7.537 b 0.001–31 20 0.774 10.818 b 0.001–25 24 0.731 9.296 b 0.001–3 8 0.289 2.187 0.043–3 8 0.564 4.649 b 0.001
–100 visual analog scale
activation for heat pain and motor tasks, NeuroImage: Clinical (2014),

T
F
557
558
559
560
561
562
563
564
565
566
567
568
569
570
571
572
573
574
575
576
577
578
579
580
581
582
583
584
585
586
587
588
589
590
591
592
593
594
595
596
597
598
599
600
601
602
t6:1 Table 6t6:2 Brain regions with significant differences in reliabilitya of pain-related signal amplitude across stimulus conditions.
t6:3 Region of interestb Stimulus typec Largest cluster (mm3) Z stat x Y z ICC F p-value Reliability result
t6:4 Inferior frontal gyrus (right) 48 °C 128 –3.87 43 19 –8 –0.308 0.327 0.98065 50VAS N 48 °Ct6:5 50VAS 128 –3.87 43 19 –8 0.312 2.313 0.03334t6:6 Anterior insular cortex (left) 48 °C 296 3.31 –37 15 10 0.61 5.414 0.00013 48 °C N 50VASt6:7 50VAS 296 3.31 –37 15 10 –0.112 0.681 0.76309t6:8 Anterior insular cortex (right) 48 °C 208 4.21 35 9 –4 0.451 3.782 0.00189 48 °C N 50VASt6:9 50VAS 208 4.21 35 9 –4 –0.346 0.283 0.98975t6:10 Medial prefrontal cortex (left) 48 °C 1000 5.00 –13 57 8 0.689 7.653 0.00001 48 °C N 50VASt6:11 50VAS 1000 5.00 –13 57 8 –0.259 0.406 0.95425t6:12 Dorsolateral prefrontal cortex (left) 48 °C 288 3.64 –29 23 44 0.306 2.295 0.03459 48 °C N 50VASt6:13 50VAS 288 3.64 –29 23 44 –0.315 0.313 0.98401t6:14 Dorsolateral prefrontal cortex (right) 48 °C 152 –2.83 27 23 46 0.044 1.13 0.37983 50VAS N 48 °Ct6:15 50VAS 152 –2.83 27 23 46 0.637 6.462 0.00003t6:16 Second somatosensory cortex (left) 48 °C 528 –4.03 –49 –25 22 –0.146 0.622 0.81371 50VAS N 48 °Ct6:17 50VAS 528 –4.03 –49 –25 22 0.684 7.065 0.00001
t6:18 a Based on voxelwise contrast of significant intraclass correlation coefficients (48 °C stimulus versus 50VAS stimulus)t6:19 b Left regions are ipsilateral to the stimulust6:20 c 50VAS is the subject-specific temperature that produced a perceived intensity of 50 on a 0–100 visual analog scale
t7:1
t7:2
t7:3
t7:4
t7:5
t7:6
t7:7
t7:8
t7:9
t7:10
t7:11
t7:12
t7:13
t7:14
t7:15
t7:16
t7:17
t7:18
10 R.L. Quiton et al. / NeuroImage: Clinical xxx (2014) xxx–xxx
RREC
additional clusters were also found in these ROIs. Substantial reliability(based on Shrout, 1998) was found in contralateral M1 (ICC = 0.815)and moderate reliability in contralateral SMA (ICC = 0.657). Fair reli-ability was found in M1 and SMA ipsilateral to the hand performingthe motor task. Overall, motor-related activation showed greater reli-ability than pain-related activation for both the spatial extent and ICCmeasures.
4. Discussion
This study quantitatively evaluated across-session reliability of pain-related BOLD fMRI responses in brain areas that are typically regardedas part of the cortical pain network. While these brain areas show con-sistent and often robust activation in fMRI studies across diverse painmodalities (as reviewed in Duerden and Albanese, 2013), the questionof how reliable this activation is from session to session has not beencomprehensively addressed in the literature. We used two reliabilitymeasures (voxelwise spatial overlap and ICCs based on BOLD responseamplitude) that are commonly used in the literature (Bennett andMiller, 2010) to assess test–retest reliability of fMRI responses to awide variety of conditions (e.g., motor tasks, visual stimulation, memo-ry) but have not been previously applied to pain. The results revealedthat the two measures of intersession pain-related fMRI activation reli-ability used in this study produced disparate results, with (1) reliabilitybased on spatial measures generally low and highly variable across
UNCOTable 7
Reliability measures for motor task activation.
Spatial reliability coefficients for motor task-activated regions
Number of significant voxels (each sess
Region of interestb 1 2
Primary motor cortex (left) 2656 3608Primary motor cortex (right) 80 256Supplementary motor area (left) 1840 1160Supplementary motor area (right) 1368 1816
Brain regions with significantly reliable motor task-related signal amplitude
Region of interestb Largest cluster (mm3) Peak vox
x
Primary motor cortex (left) 1984 –33Primary motor cortex (right) 152 29Supplementary motor area (left) 760 –1Supplementary motor area (right) 104 17
Brain regions with significantly reliable motor task-related signal amplitudea Reliability coefficient = (3 × number of common voxels)/(sum of activated voxels in eachb Left regions are contralateral to the hand performing the task
Please cite this article as: Quiton, R.L., et al., Intersession reliability of fMRIhttp://dx.doi.org/10.1016/j.nicl.2014.07.005
ED P
RO
O
brain regions and (2) reliability based on signal amplitude (ICCs) inthe fair-to-moderate range for most brain regions.
4.1. Spatial measures of intersession reliability
Spatial reliability coefficients were low for most regions examined,indicating a low probability that the same voxels are activated acrossthree separate sessions. The highest spatial reliability coefficients werefound in the aINS for both stimulus types but no spatial overlap acrossthe three sessions was found for pINS. For both stimulus types, spatialreliability coefficients were higher in S2 than in S1 or thalamus, whichis consistent with the findings of Taylor and Davis (2009), who used adifferent measure of spatial reliability in a study involving mechanicalpain applied across 4 sessions in 6 subjects; their analysis was limitedto S1, S2, and thalamus. While low S1 spatial reliability is in agreementwith the inconsistency of S1 activation across fMRI studies of pain(Bushnell et al., 1999), the reasons for a total lack of spatial overlap inpACC are unclear. These results suggest that the precise location ofpain-related activation is not highly reproducible across multiplesessions, perhaps due in part to variability introduced bymotion correc-tion, spatial normalization, and spatial smoothing procedures. As notedby Taylor and Davis (2009), conservative thresholding procedures suchas those used in this study to avoid false positives may add to spatialvariability across sessions by increasing false negatives; for example, avoxel may be activated by pain in all sessions but be eliminated from
ion) Across-session overlap(# voxels)
Reliability coefficienta
3
3640 2576 0.78792 16 0.042160 352 0.201784 16 0.01
el in largest cluster
y z ICC F p-value
–21 48 0.815 15.58 b 0.001–25 50 0.443 3.366 .004–9 54 0.657 7.116 b 0.001–3 62 0.559 5.794 b 0.001
session)
activation for heat pain and motor tasks, NeuroImage: Clinical (2014),

603
604
605
606
607
608
609
610
611
612
613
614
615
616
617
618
619
620
621
622
623
624
625
626
627
628
629
630
631
632
633
634
635
636
637
638
639
640
641
642
643
644
645
646
647
648
649
650
651
652
653
654
655
656
657
658
659
660
661
662
663
664
665
666
667
668
11R.L. Quiton et al. / NeuroImage: Clinical xxx (2014) xxx–xxx
one or more sessions if the activation falls slightly below threshold. As aresult, spatial measures do not appear to be ideal for assessing interses-sion reliability because the threshold criterion has a major influenceupon cluster sizes. However, suprathreshold clusters of voxels in abrain region may show reliable pain-related BOLD signal amplitudechanges across sessions. To test this possibility, ICCs were calculatedbased on pain-related BOLD signal amplitude changes.
669
670
671
672
673
674
675
676
677
678
679
680
681
682
683
684
685
686
687
688
689
690
691
692
693
4.2. BOLD signal amplitude measures of intersession reliability
ICC calculation is a widely-accepted and commonly used method toevaluate test–retest reliability (Cacares et al., 2009;McGraw andWong,1996; Shrout and Fleiss, 1979). This study used a conservative two-stepapproach that involved calculating ICCs based on BOLD signal amplitudechanges in suprathreshold voxels and then applying a filtering step toeliminate voxels with artifactually high ICCs based on the variancestructure of the data. This approach revealed fair-to-moderate interses-sion reliability of pain-related activation in most regions of the corticalpain network, based on the conservative classification criteria describedby Shrout (1998). Regional differences in intersession reliability werefound, with the aMCC (bilaterally) containing clusters with the highestICCs (≥ 0.7,withmoderate reliability defined as 0.61–0.8) for both stim-ulus types. Other areas with ICCs in the moderate range included theaINS and most frontal lobe areas for both stimulus types, as well as S2for the 50VAS stimulus. Areas with the lowest intersession reliabilitybased on the ICC analysis also showed no to very low spatial reliability;these regions included pACC, S1, and pINS for both stimulus types. Thefinding of higher ICCs in S2 than S1 is consistent with Taylor and Davis(2009), though their calculated ICCs were higher than those in thisstudy, likely because they included responses from subthreshold voxelsin their analysis.
T 694
695
696
697
698
699
700
701
702
703
704
705
706
707
708
709
710
711
712
713
714
715
716
717
718
719
720
721
722
723
724
725
UNCO
RREC4.3. Regional differences in pain-related intersession reliability
The brain regions that displayed the highest intersession reliabilityin this studywere aINS (based on both spatial extent and ICCmeasures)and aMCC (based on ICCs). Both of these areas have been implicated inprocessing affective aspects of pain, and are anatomically and function-ally connected (Berthier et al., 1988; Friedman et al., 1986; Heimer andVanHoesen, 2006; Vogt, 2005). Craig (2002, 2003, 2009, 2011) has pos-tulated that the aINS has a role in generating subjective emotional feel-ings about the internal state of the body and interacts with the ACC,which initiates adaptive behavioral responses. Evidence for the involve-ment of aMCC in emotion-based response selection, including fearavoidance behavior (Vogt, 2005), provides support for Craig’s model.Thus, the consistently reliable activation of aINS and aMCC in thisstudy may highlight the importance of and priority given to processingemotional-motivational aspects of pain. However, Craig’s model iden-tifies pINS as the region that generates the initial cortical representationof the body’s homeostatic condition, providing aINS with informationupon which to generate emotions associated with that representation.The fact that the pINS had very low intersession reliability in thisstudy does not fit well with a model of a serial-processing insular sys-tem in which the anterior region response is highly dependent uponthe posterior region response.
The relatively high ICCs and spatial overlap for contralateral S2 con-trasts sharply with that of the pINS. Both regions have historically beenconsidered important in nociceptive processing, and most functionalneuroimaging studies do not describe differences in their nociceptiveprocessing capacities. The current study reveals the muchmore reliableresponsiveness of the S2 cortex to acute heat stimuli, compared to thepINS. This difference suggests that S2 has a more essential role in noci-ceptive processing, at least within the context of responding to repeti-tively administered acute noxious heat stimuli.
Please cite this article as: Quiton, R.L., et al., Intersession reliability of fMRIhttp://dx.doi.org/10.1016/j.nicl.2014.07.005
ED P
RO
OF
4.4. Comparison of intersession reliability between stimulus types
The second objective of this study was to evaluate whether BOLDfMRI activation produced by painful heat stimuli of constant tempera-ture or of constant perceived pain intensity was more reliable. As ex-pected, spatial overlap of significant pain-related activation betweenthese two conditions was relatively high, indicating that the experienceof heat pain, regardless of these differences in intensities, activates com-mon brain areas. This is consistentwith a recent report that pain-relatedfMRI activation did not differ for fixed temperature stimuli and percep-tually equalized stimuli in any brain region, including the pACC, aMCC,and INS (van den Bosch et al., 2013). The ICC contrast between thetwo stimulus conditions showed only a few brain regions where reli-ability differed (aINS, S2, and some frontal lobe regions). Among thesebrain regions, no clear pattern emerged: in some areas the constanttemperature stimuluswasmore reliable across sessionswhile the oppo-site was found for other areas. Thus, in this paradigm, no definitive con-clusion can be made regarding intersession reliability differences infMRI activation resulting from stimuli of constant temperature versusstimuli that produce a constant perception. One possible explanationis that variation in perceived pain intensity is not an important contrib-utor to the variability of the BOLD response, a notion that is supportedby our finding of only scattered clusters for which pain intensity ratingssignificantly covaried with the BOLD signal amplitude response to pain-ful stimuli. Another possible explanation for failing to find a consistentdifference is that the methodology of the current study (such as vari-ability in the subject pool or choice of stimuli) did not provide therange of data adequate to draw out differences. Thus, the possibility re-mains that in some populations or contexts, pain-related fMRI activa-tion may be more reliable for stimuli of fixed temperature or fixedperception; studies that further explore this issue may provide valuableinformation to aid in the design of pain imaging experiments.
4.5. Strengths and limitations
Amajor strength of this study is that the analytical approach used toassess reliability of pain-related activationwas also applied to fMRI datacollected from the same subjects during the same sessions as theyperformed a simple motor task (finger-thumb opposition). Using thisapproach, intersession reliability of motor-related activation in thisstudy was found to be comparable to previously published results forboth spatial overlap and ICC measures (Bennett and Miller, 2010;Gountouna et al., 2010; Havel et al., 2006; Kong et al., 2007; McGregoret al., 2012; Yoo et al., 2005). This supports the validity and appropriate-ness of the analytical approach used in this study to assess intersessionreliability of pain-related fMRI activation.
This study is the first to quantitatively examine intersession reliabil-ity of pain-related fMRI activation in the entire cortical pain network,expanding upon the work of Taylor and Davis (2009), who limitedtheir analysis to somatosensory processing regions. Furthermore, thisstudy is the first to examine reliability of activation evoked by a ramp-and-hold contact heat stimulus paradigm, which is used in many painimaging paradigms, including those assessing changes associated withpain-reducing manipulations. While the sample size of 14 subjects inthis study is modest, it is the largest used to evaluate intersession reli-ability of pain-related fMRI activation and is greater than the averagenumber of 11 subjects across all test–retest fMRI activation studies(Bennett and Miller, 2010). Furthermore, the diversity of our subjectsin terms of age and gender, which likely added to inter-individual vari-ability of brain responses, can be viewed as a strength, as the resultsshould be more generalizable than those obtained from a more homo-geneous subject population such as undergraduate students, as utilizedin many test–retest fMRI studies (Bennett and Miller, 2010).
Habituation is a possible explanation for finding poor intersessionpain-related fMRI reliability in some brain areas. However, consistentwith published literature for the type of ramp-and-hold contact heat
activation for heat pain and motor tasks, NeuroImage: Clinical (2014),

T
726
727
728
729
730
731
732
733
734
735
736
737
738
739
740
741
742
743
744
745
746
747
748
749
750
751
752
753
754
755
756
757
758
759
760
761
762
763
764
765
766
767
768
769
770
771
772
773
774
775
776777778779780781782783784785
786787788789790791792793794795796797798799800801Q1802803804805806807808809810811812813814815816817818819820821822823824825826827828829830831832833834835836837838839840841842843844845846847848849850851852853854855856857858859860861862863864865866867868869870871
12 R.L. Quiton et al. / NeuroImage: Clinical xxx (2014) xxx–xxx
UNCO
RREC
stimulus paradigm used in this study (Quiton and Greenspan, 2008),pain intensity ratings did not change across the three sessions and thetemperatures required to produce subject-specific ratings of 50 on a0–100 scale did not change over the course of the experiments. Further-more, the data show no systematic decreases in either number of signif-icant voxels or signal amplitude changes across the three sessions.Bingel et al. (2008) required daily application of 60 painful heat stimulito the forearm for 8 days before observing perceptual habituation anddecreases in pain-related fMRI responses in the brain. Thus, it is unlikelythat habituation is a major contributor to the poor intersession reliabil-ity observed for some brain areas in this study.
Intersession reliability may vary based on the number of trials ofpainful stimuli. Conclusions from this study, in which 12 trials of eachtemperature were applied in each session, may not be generalizable tostudies where the number of trials is significantly different. Increasingthe number of stimuli has the potential to increase statistical powerand intersession reliability; however, it also might introduce dynamicchanges in the BOLD response that would add variability and therebydecrease intersession reliability. A separate study is needed to deter-mine how reliability varies as a function of stimulus number.
4.6. Conclusions
Overall, in this paradigm, pain-related BOLD fMRI responses showedfair to moderate test–retest reliability in brain regions that are part ofthe classical pain network. A review of over 63 studies of fMRI test–retestreliability for various tasks, designs, and test–retest intervals reported theaverage ICC value was 0.5 (Bennett andMiller, 2010). The ICCs calculatedin this study formost brain regions were greater than 0.5, suggesting thatpain-related fMRI activation has better than average intersession reliabil-ity. The finding that some brain regions showed stronger test–retest reli-ability than others may provide useful information to guide longitudinalpain studies. In addition, the study findings led to the following recom-mendations for test–retest reliability analyses: (1) Spatial extent and lo-calization of activation do not appear to be useful measures of fMRIresponse reliability at the group level. (2) The use of ICC values alone asa measure of reliability may not be sufficient, as the underlying variancestructure of a dataset may result in erroneously high ICC values. Methodsto eliminate erroneously high ICC values (such as the filtering step used inthis study) should be incorporated into any analysis of this type.
Supplementary data to this article can be found online at http://dx.doi.org/10.1016/j.nicl.2014.07.005.
Uncited references
No citations were found for the following references: Chen et al.(2013); Melzack, and Casey (1968); Rosier, Iadarola, and Coghill(2002); Treede et al. (1999).
Acknowledgements
The authors gratefully acknowledge NIH for funding (R03-AG022223/R01-NS39337). The authors of this manuscript do nothave any financial or other relationships that might lead to a con-flict of interest.
References
Atri, A.,O’Brien, J.L., Sreenivasan, A.,Rastegar, S., Salisbury, S.,DeLuca, A.N.,O’Keefe, K.M.,LaViolette, P.S., Rentz, D.M.,Locascio, J.J., Sperling, R.A., 2011. Test–retest reliability ofmemory task fMRI in Alzheimer’s disease clinical trials. Archives of Neurology 68,599–606. http://dx.doi.org/10.1001/archneurol.2011.9421555634.
Bennett, C.M.,Miller, M.B., 2010. How reliable are the results from functional magneticresonance imaging? Annals of the New York Academy of Sciences 1191, 133–155.http://dx.doi.org/10.1111/j.1749-6632.2010.05446.x20392279.
Berthier, M., Starkstein, S., Leiguarda, R., 1988. Asymbolia for pain: A sensory-limbic dis-connection syndrome. Annals of Neurology 24, 41–49. http://dx.doi.org/10.1002/ana.4102401093415199.
Please cite this article as: Quiton, R.L., et al., Intersession reliability of fMRIhttp://dx.doi.org/10.1016/j.nicl.2014.07.005
ED P
RO
OF
Bingel, U., Herken, W., Teutsch, S.,May, A., 2008. Letter to the editor: Habituation topainful stimulation involves the antinociceptive system − A 1-year follow-upof 10 participants. Pain 140, 393–394. http://dx.doi.org/10.1016/j.pain.2008.09.03018952372.
Bushnell, M.C.,Duncan, G.H.,Hofbauer, R.K.,Ha, B.,Chen, J.-I.,Carrier, B., 1999. Pain perception:Is there a role for primary somatosensory cortex? Proceedings of the National Academyof Sciences of the United States of America 96, 7705–770910393884.
Caceres, A.,Hall, D.L.,Zelaya, F.O.,Williams, S.C.R.,Mehta, M.A., 2009. Measuring fMRI reli-ability with the intra-class correlation coefficient. NeuroImage 45, 758–768. http://dx.doi.org/10.1016/j.neuroimage.2008.12.03519166942.
Chen, E.E., Small, S.L., 2007. Test–retest reliability in fMRI of language: Group and taskeffects. Brain and Language 102, 176–185. http://dx.doi.org/10.1016/j.bandl.2006.04.01516753206.
Chen, G., Saad, Z.S.,Britton, J.C., Pine, D.S., Cox, R.W., 2013. Linear mixed-effects modelingapproach to FMRI group analysis. NeuroImage 73, 176–190. http://dx.doi.org/10.1016/j.neuroimage.2013.01.04723376789.
Cox, R.W., 1996. AFNI: Software for analysis and visualization of functional magnetic res-onance Neuroimages. Computers and Biomedical Research, an International Journal29, 162–1738812068.
Craig, A.D., 2002. How do you feel? Interoception: The sense of the physiological condi-tion of the body. Nature Reviews. Neuroscience 3, 655–666. http://dx.doi.org/10.1038/nrn89412154366.
Craig, A.D., 2003. Interoception: The sense of the physiological condition of the body. Cur-rent Opinion in Neurobiology 13, 500–50512965300.
Craig, A.D., 2009. How do you feel − Now? The anterior insula and human aware-ness. Nature Reviews. Neuroscience 10, 59–70. http://dx.doi.org/10.1038/nrn255519096369.
Craig, A.D., 2011. Significance of the insula for the evolution of human awareness of feel-ings from the body. Annals of the New York Academy of Sciences 1225, 72–82. http://dx.doi.org/10.1111/j.1749-6632.2011.05990.x21534994.
Donner, A.,Zou, G., 2002. Testing equality of dependent intraclass correlation coefficients.Journal of the Royal Statistical Society, Series D (The Statistician) 51, 367–379.
Duerden, E.G.,Albanese, M.-C., 2013. Localization of pain-related brain activation: A meta-analysis of neuroimaging data. Human Brain Mapping 34, 109–149. http://dx.doi.org/10.1002/hbm.2141622131304.
Fliessbach, K.,Rohe, T.,Linder, N.S.,Trautner, P.,Elger, C.E.,Weber, B., 2010. Retest reliabilityof reward-related BOLD signals. NeuroImage 50, 1168–1176. http://dx.doi.org/10.1016/j.neuroimage.2010.01.03620083206.
Freyer, T.,Valerius, G., Kuelz, A.-K., Speck, O.,Glauche, V.,Hull, M.,Voderholzer, U., 2009.Test–retest reliability of event-related functional MRI in a probabilistic reversal learn-ing task. Psychiatry Research 174, 40–46. http://dx.doi.org/10.1016/j.pscychresns.2009.03.00319783412.
Friedman, D.P.,Murray, E.A.,O’Neill, J.B.,Mishkin, M., 1986. Cortical connections of the so-matosensory fields of the lateral sulcus of macaques: Evidence for a corticolimbicpathway for touch. Journal of Comparative Neurology 252, 323–347. http://dx.doi.org/10.1002/cne.9025203043793980.
Gorgolewski, K.J., Storkey, A.,Bastin, M.E.,Whittle, I.R.,Wardlaw, J.M.,Pernet, C.R., 2013. Atest–retest fMRI dataset for motor, language, and spatial attention functions.GigaScience 2, 6. http://dx.doi.org/10.1186/2047-217X-2-623628139.
Gountouna, V.-E., Job, D.E.,McIntosh, A.M.,Moorhead, T.W.J., Lymer, G.K.L.,Whalley, H.C.,Hall, J.,Waiter, G.D., Brennan, D.,McGonigle, D.J.,Ahearn, T.S.,Cavanagh, J.,Condon, B.,Hadley, D.M.,Marshall, I.,Murray, A.D., Steele, J.D.,Wardlaw, J.M., Lawrie, S.M., 2010.Functional magnetic resonance imaging (fMRI) reproducibility and variance compo-nents across visits and scanning sites with a finger tapping task. NeuroImage 49,552–560. http://dx.doi.org/10.1016/j.neuroimage.2009.07.02619631757.
Havel, P.,Braun, B.,Rau, S.,Tonn, J.-C.,Fesl, G.,Brückmann, H.,Ilmberger, J., 2006. Reproduc-ibility of activation in fourmotor paradigms. An fMRI study. Journal of Neurology 253,471–476. http://dx.doi.org/10.1007/s00415-005-0028-416283098.
Heimer, L.,Van Hoesen, G.W., 2006. The limbic lobe and its output channels: Implicationsfor emotional functions and adaptive behavior. Neuroscience and Biobehavioral Re-views 30, 126–147. http://dx.doi.org/10.1016/j.neubiorev.2005.06.00616183121.
Kiehl, K.A., Liddle, P.F., 2003. Reproducibility of the hemodynamic response to auditoryoddball stimuli: A six-week test–retest study. Human Brain Mapping 18, 42–52.http://dx.doi.org/10.1002/hbm.1007412454911.
Kong, J.,Gollub, R.L.,Webb, J.M.,Kong, J.-T.,Vangel, M.G.,Kwong, K., 2007. Test–retest studyof fMRI signal change evoked by electroacupuncture stimulation. NeuroImage 34,1171–1181. http://dx.doi.org/10.1016/j.neuroimage.2006.10.01917157035.
Maitra, R.,Roys, S.R.,Gullapalli, R.P., 2002. Test–retest reliability estimation of functionalMRI data. Magnetic Resonance inMedicine: Official Journal of the Society ofMagneticResonance in Medicine / Society of Magnetic Resonance in Medicine 48, 62–70.http://dx.doi.org/10.1002/mrm.1019112111932.
McGraw, K.O.,Wong, S.P., 1996. Forming inferences about some intraclass correlation co-efficients. Psychological Methods 1, 30–46.
McGregor, K.M.,Carpenter, H.,Kleim, E., Sudhyadhom, A.,White, K.D., Butler, A.J., Kleim, J.,Crosson, B., 2012. Motor map reliability and aging: A TMS/fMRI study. ExperimentalBrain Research 219, 97–106. http://dx.doi.org/10.1007/s00221-012-3070-322466408.
Melzack, R., Casey, K.L., 1968. Sensory, motivational and central control determinants ofchronic pain: A new conceptual model. In: Kenshalo, D.R. (Ed.), The Skin Senses.Thomas, Springfield, IL, p. 432.
Moulton, E.A.,Keaser, M.L.,Gullapalli, R.P.,Greenspan, J.D., 2005. Regional intensive andtemporal patterns of functional MRI activation distinguishing noxious and innocuouscontact heat. Journal of Neurophysiology 93, 2183–2193. http://dx.doi.org/10.1152/jn.01025.200415601733.
Quiton, R.L., Greenspan, J.D., 2008. Across- and within-session variability of ratings ofpainful contact heat stimuli. Pain 137, 245–256. http://dx.doi.org/10.1016/j.pain.2007.08.03417942227.
activation for heat pain and motor tasks, NeuroImage: Clinical (2014),

872873874875876877Q2878879880881882883884885886887888889890
891892Q3893894895896897898899900901902903904905906907908909
910
13R.L. Quiton et al. / NeuroImage: Clinical xxx (2014) xxx–xxx
Rombouts, S.A., Barkhof, F., Hoogenraad, F.G., Sprenger, M., Scheltens, P., 1998. Within-subject reproducibility of visual activation patterns with functional magnetic reso-nance imaging using multislice echo planar imaging. Magnetic Resonance Imaging16, 105–1139508267.
Rosier, E.M., Iadarola, M.J., Coghill, R.C., 2002. Reproducibility of pain measurement andpain perception. Pain 98, 205–21612098633.
Servos, P., Zacks, J., Rumelhart, D.E., Glover, G.H., 1998. Somatotopy of the human armusing fMRI. Neuroreport 9, 605–6099559924.
Shrout, P.E., 1998. Measurement reliability and agreement in psychiatry. StatisticalMethods in Medical Research 7, 301–3179803527.
Shrout, P.E.,Fleiss, J.L., 1979. Intraclass correlations: Uses in assessing rater reliability. Psy-chological Bulletin 86, 420–42818839484.
Tabachnick, B.G.,Fidell, L.S.., 2007. Using Multivariate Statisticsfifth edition. Pearson/Allyn& Bacon, Boston, MA.
Tailairach, J.,Tournoux, P., 1988. Co-Planar Stereotaxic Atlas of the Human BrainThiemeMedical Publishers, New York.
Taylor, K.S.,Davis, K.D., 2009. Stability of tactile- and pain-related fMRI brain activations: Anexamination of threshold-dependent and threshold-independent methods. HumanBrain Mapping 30, 1947–1962. http://dx.doi.org/10.1002/hbm.2064118711711.
UNCO
RRECT
Please cite this article as: Quiton, R.L., et al., Intersession reliability of fMRIhttp://dx.doi.org/10.1016/j.nicl.2014.07.005
Treede, R.-D.,Kenshalo, D.R.,Gracely, R.H.,Jones, A.K.P., 1999. The cortical representation ofpain. Pain 79, 105–11110068155.
Van den Bosch, G.E.,van Hemmen, J.,White, T.,Tibboel, D.,Peters, J.W.B.,van der Geest, J.N.,2013. Standard and individually determined thermal pain stimuli induce similarbrain activations. European Journal of Pain (London, England) 17, 1307–1315.http://dx.doi.org/10.1002/j.1532-2149.2013.00311.x23529976.
Van Westen, D., Fransson, P., Olsrud, J., Rosén, B., Lundborg, G., Larsson, E.-M., 2004.Fingersomatotopy in area 3b: An fMRI-study. BMC Neuroscience 5, 28. http://dx.doi.org/10.1186/1471-2202-5-2815320953.
Vogt, B.A., 2005. Pain and emotion interactions in subregions of the cingulate gyrus. NatureReviews. Neuroscience 6, 533–544. http://dx.doi.org/10.1038/nrn170415995724.
Winer, B.J., 1971. Statistical Principles in Experimental Designsecond edition. McGraw-Hill, New York.
Yarkoni, T.,Poldrack, R.A.,Nichols, T.E.,Van Essen, D.C.,Wager, T.D., 2011. Large-scale auto-mated synthesis of human functional neuroimaging data. Nature Methods 8,665–670. http://dx.doi.org/10.1038/nmeth.163521706013.
Yoo, S.-S.,Wei, X.,Dickey, C.C.,Guttmann, C.R.G.,Panych, L.P., 2005. Long-term reproduc-ibility analysis of fMRI using hand motor task. International Journal of Neuroscience115, 55–7715768852.
FED P
RO
O
activation for heat pain and motor tasks, NeuroImage: Clinical (2014),