Embed Size (px)
Citation preview

Intrinsic Raman spectroscopy for quantitative biologicalspectroscopy Part II:Experimental applications
Kate L. Bechtel1, Wei-Chuan Shih2, and Michael S. Feld*G. R. Harrison Spectroscopy Laboratory, Massachusetts Institute of Technology, 77 MassachusettsAvenue, Cambridge, MA 02139
AbstractWe demonstrate the effectiveness of intrinsic Raman spectroscopy (IRS) at reducing errors causedby absorption and scattering. Physical tissue models, solutions of varying absorption and scatteringcoefficients with known concentrations of Raman scatterers, are studied. We show significantimprovement in prediction error by implementing IRS to predict concentrations of Raman scatterersusing both ordinary least squares regression (OLS) and partial least squares regression (PLS). Inparticular, we show that IRS provides a robust calibration model that does not increase in error whenapplied to samples with optical properties outside the range of calibration.
1. IntroductionIn many applications of Raman spectroscopy the analytes of interest are embedded in a turbidmedium, in which the absorption and elastic scattering coefficients, μa and μs, respectively,may significantly distort the measured Raman spectrum, in contrast to the intrinsic Ramanspectrum obtained from a transparent medium. A prime example, of interest to us, is biologicaltissue analysis. The apparent contributions of the Raman spectral features, and therefore theshape of the spectrum, may be altered as a result of the wavelength dependence of μa and μs.Additionally, the overall Raman intensity may be altered as a result of turbidity-inducedchanges in sampling volume, defined as the overlap between the three-dimensional deliveryand collection volumes, which affects the propagation of both the excitation and scatteredRaman light. Time- or sample-dependent turbidity variations can further complicate theextraction of quantitative information.
In order to account for such non-analyte-specific variability in building a multivariatecalibration model, samples with significant extremes of variability are incorporated into thecalibration data set. However, this approach sacrifices accuracy because of increased modelcomplexity, not to mention the added costs associated with inclusion of large sample numbersfor in vivo studies. The better solution is to directly reduce the turbidity variability throughprior or additional information such that a more accurate model is obtained and prediction erroris reduced.
©2008 Optical Society of America1Current Address: Triple Ring Technologies, 39655 Eureka Drive, Newark, CA 945602Current address: Schlumberger-Doll Research, 1 Hampshire St., Cambridge, MA 02139*Corresponding author: [email protected] codes: (170.1470) Blood or tissue constituent monitoring; (170.3660) Light propagation in tissue; (170.5280) Photon migration;(170.5660) Raman spectroscopy; (170.7050) Turbid media.
NIH Public AccessAuthor ManuscriptOpt Express. Author manuscript; available in PMC 2010 March 25.
Published in final edited form as:Opt Express. 2008 August 18; 16(17): 12737–12745.
NIH
-PA Author Manuscript
NIH
-PA Author Manuscript
NIH
-PA Author Manuscript

Corrections for turbidity variations in the form of spectral shape distortions have beenextensively pursued in fluorescence spectroscopy [1-5]. However, in many cases the recordedspectra are normalized and information about sampling volume variations are lost, renderingthe analysis semi-quantitative. For quantitative studies, variations in the sampling volume arecritical because of the relationship to the absolute number of analyte molecules sampled.
For quantitative Raman spectroscopy, corrections for both shape and intensity distortions havebeen developed [6-9], but the existing methods are designed for media with isotropic elasticscattering, and in which only one optical property changes at a time. Thus, they are not suitablefor our application to biological media, in which elastic scattering is anisotropic [10,11] andboth μa and μs can vary simultaneously and independently.
The underlying principle of all of these correction methods is that Raman scattering orfluorescence at a given wavelength is proportional to elastically scattered light (diffusereflectance) at the same wavelength. Therefore, with the aid of a broadband light source tomeasure diffuse reflectance, distortions in Raman and fluorescence spectra can be removed.
In the companion paper (Part I), we present the theory for a method for correcting thesedistortions called intrinsic Raman spectroscopy (IRS), and conduct numerical simulations tovalidate the theory. As discussed in detail in Part I, diffuse reflectance spectroscopy is used tocorrect the observed Raman spectra. The present paper presents an experimental study of IRS,using in vitro physical tissue models of various turbidities. We demonstrate that IRS providesa marked reduction in prediction error compared with the uncorrected measurements via bothexplicit and implicit multivariate calibration techniques.
2. ImplementationIn the companion paper (Part I: Theory and simulations), the following equation forimplementing the IRS correction was derived:
(1)
where RamINT is the intrinsic Raman signal observed in the absence of absorption andscattering, μt is the reduced total attenuation coefficient (μt = μa + μs), RamOBS is the measured(observed) Raman signal, and f(Rd) is a parameter, the calibration function, that depends onlyon diffuse reflectance, Rd, sample geometry, and anisotropy, g. The functional form of f(Rd)is complex, but may be fit by a simple analytical function such as a power law or an exponentialfunction. f(Rd) can be obtained experimentally by fixing the concentration of a known Ramanscatterer and varying the optical properties of the medium, as described below. Thus, byknowing f(Rd), measuring Rd, and extracting μt, RamINT can be obtained from RamOBS.
The most general method of implementing the IRS correction is the “wavelengthdependent”approach. It is appropriate when the diffuse reflectance spectra exhibit significant spectralstructure. In this case one employs Eq. (1), wavelength-by-wavelength, to obtain the intrinsicRaman spectra. However, owing to the division operation in Eq. (1), noise and minor errorsapplied at each wavelength may be amplified when applied over the entire spectral range, andthus introduce artifacts that lead to higher prediction errors in the subsequent multivariatecalibration. Therefore, use of the λ-dependent method should be restricted to cases in whichnarrow absorption features that significantly alter the shape of RamOBS (compared toRamINT) are present.
Bechtel et al. Page 2
Opt Express. Author manuscript; available in PMC 2010 March 25.
NIH
-PA Author Manuscript
NIH
-PA Author Manuscript
NIH
-PA Author Manuscript

In other cases, however, the diffuse reflectance spectra do not exhibit sharp features and asimpler, λ-independent correction method may be used. This will occur when μa and μs, henceRd, do not vary appreciably with wavelength. An example of interest is our Raman studies tomeasure blood analyte concentrations, which are conducted in the near infrared at 830-1000nm [12]. In this case, the amplitude of RamOBS varies with sample-to-sample variations inturbidity but its spectral shape is not distorted. As a result, the λ-independent correction methodcan be employed in which the measured spectra are not corrected, but instead the referenceconcentrations are converted into the number of molecules measured in the same samplingvolume as the measured Raman spectra. In the remainder of this paper we will implement IRSusing the λ-independent method, and illustrate it with physical tissue models that are relevantto our blood analyte studies.
Raman scattering is proportional to the number of Raman scatterers sampled, N, which varieswith optical sampling volume. However, most reference techniques measure localconcentrations of analytes. We can thus consider a constant optical sampling volume such thatthe concentration, CREF, is equivalent to number of molecules, NREF. As a result of turbidity-induced variations in sampling volume, however, RamOBS measures a quantity NOBS ratherthan NREF. In order to correct for this, NOBS can be related to NREF in the same manner asRamOBS is related to RamINT:
(2)
For multivariate calibration, NOBS may then be used in conjunction with RamOBS to constructa calibration model that is used for prediction. The resulting predicted concentration valueNPRED’, which gives the actual number of analyte molecules measured, may then be convertedto NPRED, which is equivalent to the analyte concentration measured by a separate referencetechnique, using Eq. (2) as before.
A key advantage of this approach, as opposed to correcting the spectra themselves, is thatreference concentration measurements are in principle more accurate than spectral data andtherefore less likely to suffer from the amplification of minor noise or errors associated withthe application of Eq. (1).
In summary, Raman spectra may be relied upon to accurately measure a given number ofmolecules, NOBS. Diffuse reflectance (Rd) and the extracted μt provide the necessaryrelationship between the sampling volume-dependent NOBS and the sampling volume-independent NREF. The λ-independent method corrects for intensity variations only, whereasthe λ-dependent method corrects for both spectral and intensity variations.
3. Experimental3.1 Apparatus
The experimental setup (Fig. 1) employs an 830 nm diode laser (Process Instruments) as theRaman excitation source and a tungsten-halogen lamp (Avantes AvaLight-HAL-S) as thediffuse reflectance excitation source. A laser line filter (Semrock MaxLine 830) is placed atthe laser output to remove unwanted spontaneous emission that broadens the laser linewidth.An RG850 absorption filter is placed at the lamp output to reduce shorter wavelengths thatmay cause scatter within the spectrometer. The two beams are independently shuttered andcombined using a MgF2 plate at 45°, with the laser being transmitted and the white light sourcebeing reflected and adjusted to be collinear. A photodiode placed at this intersection monitorsthe power of both sources. The light sources are focused through a small hole (4 mm dia.) in
Bechtel et al. Page 3
Opt Express. Author manuscript; available in PMC 2010 March 25.
NIH
-PA Author Manuscript
NIH
-PA Author Manuscript
NIH
-PA Author Manuscript

an off-axis, gold-coated, half-paraboloidal mirror (Perkin-Elmer, Inc.) and into a fused silicacuvette (1 cm pathlength) filled with the sample of interest. Achromatic doublet lenses are usedto shape the beams. The beam diameters at the sample are approximately 1 mm, and the powersare 250 mW and 100 μW for the laser and white light source, respectively. The power level ofthe white light source is carefully controlled to prevent saturation of the CCD detector.
Back-scattered Raman and diffusely reflected light are collected with the paraboloidal mirrorand sent through a holographic notch filter (Kaiser Optical Systems, Inc.) to reduce themagnitude of the excitation peak. Specular reflection from the cuvette surface passes throughthe hole in the paraboloidal mirror and is significantly diminished. The collected light is thenfocused into a fiber bundle (RoMack, Inc.) that transforms the circular shape of the collectedlight (input end) into a vertical line (exit end, ∼400 μm×26 mm). The exit end of the fiberbundle serves as the entrance slit of a modified f/1.4 spectrometer (Kaiser Optical Systems,Inc.). The light is dispersed with a holographic grating onto a 1300×1340 pixel liquid nitrogen-cooled CCD detector (Princeton Instruments).
Raman spectra and diffuse reflectance (DRS) spectra were alternately acquired, with a total of10 Raman spectra and 10 DRS spectra collected for each sample. The Raman spectra wereaccumulated with a 2s integration time and the DRS spectra were accumulated with a 0.5sintegration time. Identical excitation-collection geometry was maintained throughout theexperiment by fixing the cuvette position. Samples were replaced via pipette following a waterrinse and two rinses of the sample of interest. Data were processed off-line for image curvaturecorrection, summation, and removal of cosmic rays [13]. Spectra from 280-1700 cm-1 (850-966nm) were used in all data analysis.
3.2 Materials and methodsPhysical tissue models in which scattering, absorption and Raman scattering could be preciselyvaried throughout their respective relevant physiological ranges were used to test theapplicability of intrinsic Raman spectroscopy. Two experiments were performed. In the first,elastic scattering and absorption were varied independently while Raman scatterer density washeld constant. In the second, the Raman scatterer density was also simultaneously varied.
The physical tissue models were prepared in water solutions. The elastic scattering andabsorption properties were varied over ranges similar to that found in human biological tissue[10]. The scattering coefficient, μs, was varied by altering the concentration of Intralipid(Baxter Healthcare), an anisotropic elastic scatterer commonly used to simulate tissuescattering. The value, g, for intralipid is between 0.8 and 0.9 [14], as is tissue. The absorptioncoefficient, μa, was varied by altering the concentration of India ink (Super Black India Ink,Speedball Art Products company), which possesses a nearly flat absorption profile in the nearinfrared region. For each specific mixture (sample), 10 Raman spectra were collected andaveraged. Scattering and absorption coefficients at the excitation wavelength (830 nm) ofrepresentative physical tissue models were determined by integrating sphere measurementsutilizing a look-up table based on Monte Carlo simulations performed by Enejder [15]. Thevalue of g for each of the samples was taken to be fixed at 0.8.
In the first experiment, 49 samples were prepared following a 7×7 matrix in which μs wasvaried from 24 to 130 cm-1 (median 81.6 cm-1) at 830 nm, and μa was varied from 0.08 to 1.3cm-1 (median 0.31 cm-1) at 830 nm. A constant 50 mM concentration of creatinine was includedin each sample to serve as an indicator of an intrinsically constant Raman signal, theconcentration of which may be measured incorrectly as a result of turbidity. The relatively highconcentration of creatinine enabled higher absorption values to be studied while retaining asatisfactory signal-to-noise ratio.
Bechtel et al. Page 4
Opt Express. Author manuscript; available in PMC 2010 March 25.
NIH
-PA Author Manuscript
NIH
-PA Author Manuscript
NIH
-PA Author Manuscript

In the second experiment, 50 samples were prepared with randomized concentration profilesand turbidities. In these samples, μs was randomly varied from 48.4 to 95.1 cm-1 (mean 73.4cm-1) at 830, and μa was randomly varied from 0.09 to 0.18 cm-1 (mean 0.136 cm-1) at 830nm. Two Raman scatterers, glucose and creatinine, were also present, with concentrationsvarying randomly from 5 to 30 mM (mean 16 mM).
3.3 Data analysisData were initially analyzed via ordinary least squares (OLS) [16] using a seven- or eight-component model. The model components include the Raman spectra of fused silica (cuvette),water, Intralipid, India ink, creatinine (as measured in water, with the background subtracted,glucose (second experiment only), fluorescence (from impurities in the cuvette - obtained bysubtracting the tenth spectrum from the first spectrum for a representative sample), and a DCoffset to account for the increased or decreased signal level due to scattering or absorption,respectively.
The OLS model components for the first experiment are shown in Fig. 2. Each spectrum wasfit individually to account for varying levels of fluorescence and offset, and the creatinine fitcoefficients for the 10 spectra in each set were averaged for each sample.
Data from the second experiment were analyzed via OLS to obtain fit coefficients, as in thefirst experiment. Additionally, data from the second experiment were analyzed via partial leastsquares (PLS) [17], as described in detail below, to demonstrate the utility of the IRS correctionmethod with an implicit multivariate calibration technique.
4. Results and discussionWe begin with the first experiment (fixed concentration Raman scatterers in all 49 samples.)The observed Raman spectra of the 49 samples are shown in Fig. 3(a). The associated DRSspectra are shown in Fig. 3(b). To better illustrate the relative change in the DRS spectra dueto changing optical properties, the DRS spectra in Fig. 3(b) are normalized to 4% intralipidwith no absorber added (μs = 73.6 cm-1). Note that any of the samples could in theory be chosenas the basis for normalization. The DRS spectra were not normalized to a white reflectancestandard such as Spectralon (>99%, Labsphere) because the reference glucose and creatinineconcentrations were measured in an aqueous solution. Thus, the “intrinsic” Raman spectrumincludes the effects of water absorption and it was not necessary to correct the turbid samplesfor this effect. Because the DRS spectra were internally normalized, Rd is here the relativediffuse reflectance rather than the absolute diffuse reflectance. This difference has no effecton the functionality of the IRS correction method. As can be seen in Fig. 3(b), even though theintensity variations in this wavelength region (830-960 nm) are substantial, the spectralvariations from sample to sample, owing to changes in Intralipid and water absorption, areminimal. Thus, we can use the -independent correction method.
For the λ-independent method, we compare the observed number of molecules measured(NOBS) for each sample to the actual reference concentration (NREF). For convenience, NOBSwas obtained through OLS analysis, in which the measured Raman spectrum is fit by a linearcombination of the spectra of each component in the physical tissue model (e.g., water,Intralipid, India ink, creatinine, fused silica cuvette, etc.). The fit coefficient for the (constant)concentration of the Raman scatterer, in this case creatinine, is NOBS. (It does not matter whichRaman scatterer is used as the probe to calibrate f(Rd), as the shape of this parameter is notanalyte-dependent.) In the absence of turbidity, the ratio NOBS/NREF should be 1. However,owing to the effects of absorption and scattering, this value varied significantly, from 0.34 to1.14. NOBS/NREF for each of the 49 samples is displayed in Fig. 4 as a function of μa and μs.
Bechtel et al. Page 5
Opt Express. Author manuscript; available in PMC 2010 March 25.
NIH
-PA Author Manuscript
NIH
-PA Author Manuscript
NIH
-PA Author Manuscript

Following Eq. (2), values of (NOBS/NREF)·μt versus Rd are plotted in Fig. 5. Data collectedfrom the two experiments are combined. The fit to the data is f(Rd), which for these experimentsis best represented by an exponential function. Although the data collection periods were twoweeks apart and the sample was replaced several times, it can be seen that f(Rd) remainsconstant, as would be expected for similar geometry and anisotropy, g.
The noise in Fig. 5, i.e., data points that do not lie on the curve, is a result of experimentalsignal-to-noise. The creatinine signal is much smaller than the signals from most of the otherconstituents; therefore slight modeling errors and noise in the spectral data contribute to errorin extracting the OLS fit coefficient for creatinine. As noted above, any Raman scatterer canbe used to determine the IRS calibration curve, f(Rd). For example, intralipid itself may be usedprovided that its apparent concentration change due to varying optical properties isdeconvolved from its real concentration change. Processed accordingly, use of intralipid datawith its higher signal-to-noise ratio results in a tight f(Rd) curve equivalent to the curvature ofFig. 5, but with no appreciable spread. However, to prevent potential confusion on the part ofthe reader, we opted to present the analysis using the fixed-concentration Raman scatterer,creatinine.
Once f(Rd) was obtained, NOBS for each sample was multiplied by the corresponding μt of thatsample and divided by f(Rd) to obtain NPRED, which may be compared to NREF for assessingprediction accuracy. The root-mean-square error of prediction (RMSEP) for the uncorrecteddata (NOBS) was 36%, versus an RMSEP for the IRS-corrected data (NPRED) of 6%. Thus, IRSsignificantly improved the prediction accuracy.
The second data set was designed to illustrate the effectiveness of the IRS correction methodunder an implicit calibration framework [18]. The data were analyzed twice, first using OLS(explicit calibration) and then via PLS (implicit calibration). Prior to implicit analysis, the 10sequential Raman spectra for each sample were averaged and smoothed via a Savitsky-Golayfunction.
The Raman spectra were then split into calibration and validation sets following two differentprocedures. In the first procedure, the 50 sample spectra were randomly split into 36 calibrationand 14 prediction sample spectra for 500 independent iterations. For comparison between theuncorrected analysis, in which sampling volume changes are ignored, and IRS, the referencevalues used in conjunction with the calibration data set to generate the regression vector [18]were either the actual reference values, NREF, or, for IRS application, NOBS, as calculated fromEq. (2). The number of PLS factors employed in either case was 6, which is in accordance withthe number of known variables and the size of the calibration set. The resulting calibrationalgorithms were applied to the same validation set to compare predictive capabilities. In thecase of IRS application, a final step was needed to convert the predicted values NPRED’ toNPRED, again via Eq. (2). The boxplot for the 500 RMSEP values for glucose generated withuncorrected and IRS-corrected data is shown in Fig. 6. The mean and standard deviation are0.56 and 0.11 for the uncorrected data, and 0.43 and 0.08 for the corrected data, resulting inmore than a 20% reduction in mean and standard deviation of prediction error by implementingIRS.
In the second procedure the samples were split into calibration and validation sets accordingto the μs/μa value, where μs=μs(1-g) with g=0.8. Samples having μs/μa values less than 65comprised the calibration set and samples having μs/μa values higher than 65 comprised thevalidation set (Fig. 7(a)). Such a splitting replicates the scenario of not incorporating the fullrange of optical property variability into the calibration set. Typically, this scenario results ina calibration algorithm that is not robust. In other words, applying the generated calibration
Bechtel et al. Page 6
Opt Express. Author manuscript; available in PMC 2010 March 25.
NIH
-PA Author Manuscript
NIH
-PA Author Manuscript
NIH
-PA Author Manuscript
algorithm to samples lying outside the range of the calibration set gives much larger predictionerror.
Indeed, for uncorrected analysis of the data (using NREF for the reference values as describedabove), the standard error of cross-validated (SECV) for the calibration set is 0.47 mM whereasthe standard error of prediction (SEP) for the validation set is nearly twice as large, 0.86 mM.For the IRS analysis, the SECV is 0.41 mM and, in contrast to the uncorrected analysis, theSEP remains nearly level at 0.42 mM (Fig. 7(b)). This is an improvement of over 50% comparedto the uncorrected RMSEP. This scenario illustrates the advantages of the IRS correctionmethod. By replacing the reference values with the actual number of analyte molecules in thesampling-volume region NOBS, the multivariate calibration technique is better able to lock ontothe signal from the analyte of interest, generating a more robust model and greatly reducingthe prediction error.
5. ConclusionsWe have demonstrated the principles of the intrinsic Raman correction method to obtain moreaccurate, quantitative results in turbid media. IRS provides a way to overcome inaccuraciescaused by sampling volume variations as a result of absorption and scattering. This reductionin variability by use of IRS means fewer number of samples over a smaller optical propertyrange may be used to form the calibration model. The resulting calibration algorithm is robustand provides improved accuracy in prospective studies.
We note that implementation of the IRS correction method requires knowledge of μt and thecalibration function, f(Rd). In the reported tissue phantom studies, the optical property μt foreach sample was determined with the aid of an integrating sphere. For experimentalapplications in which this is not possible, e.g., in vivo studies, the optical property informationmay be extracted from diffuse reflectance measurements. This is a well-developed researcharea and the reader is referred to a number of excellent references on this topic [19-23]. Thecalibration function, f(Rd), may be determined either experimentally or through Monte Carlosimulations. However, practical concerns in slight sampling size and excitation-collectiongeometry variations may justify the experimental approach over a Monte Carlo-basedapproach.
A related method of analysis to IRS in which variations in μa are considered to be insubstantial,and therefore knowledge of the optical properties is not required, will be the subject of aforthcoming publication.
AcknowledgmentsThis work was performed at the MIT Laser Biomedical Research Center and supported by the NIH National Centerfor Research Resources, grant P41-RR02594, and a grant from Bayer Health Care, LLC.
References and links1. Zhadin NN, Alfano RR. Correction of the internal absorption effect in fluorescence emission and
excitation spectra from absorbing and highly scattering media: Theory and experiment. J. Biomed.Opt 1998;3:171–186.
2. Biswal NC, Gupta S, Ghosh N, Pradhan A. Recovery of turbidity free fluorescence from measuredfluorescence: an experimental approach. Opt. Express 2003;11:3320–3331. [PubMed: 19471461]
3. Finlay JC, Foster TH. Recovery of hemoglobin oxygen saturation and intrinsic fluorescence with aforward-adjoint model. Appl. Opt 2005;44:1917–1933. [PubMed: 15813528]
4. Wu J, Feld MS, Rava RP. Analytical model for extracting intrinsic fluorescence in turbid media. Appl.Opt 1993;32:3585–3595.
Bechtel et al. Page 7
Opt Express. Author manuscript; available in PMC 2010 March 25.
NIH
-PA Author Manuscript
NIH
-PA Author Manuscript
NIH
-PA Author Manuscript

5. Muller MG, Georgakoudi I, Zhang QG, Wu J, Feld MS. Intrinsic fluorescence spectroscopy in turbidmedia: disentangling effects of scattering and absorption. Appl. Opt 2001;40:4633–4646. [PubMed:18360504]
6. Kuba S, Knozinger H. Time-resolved in situ Raman spectroscopy of working catalysts: sulfated andtungstated zirconia. J. Raman Spectrosc 2002;33:325–332.
7. Nijhuis TA, Tinnemans SJ, Visser T, Weckhuysen BM. Operando spectroscopic investigation ofsupported metal oxide catalysts by combined time-resolved UV-VIS/Raman/on-line massspectrometry. Phys. Chem. Chem. Phys 2003;5:4361–4365.
8. Aarnoutse PJ, Westerhuis JA. Quantitative Raman reaction monitoring using the solvent as internalstandard. Anal. Chem 2005;77:1228–1236. [PubMed: 15732901]
9. Tinnemans SJ, Kox MHF, Nijhuis TA, Visser T, Weckhuysen BM. Real time quantitative Ramanspectroscopy of supported metal oxide catalysts without the need of an internal standard. Phys. Chem.Chem. Phys 2005;7:211–216. [PubMed: 19785192]
10. Tuchin, VV. Tissue optics: light scattering methods and instruments for medical diagnosis. SPIEPress; Bellingham, Wash.: 2000.
11. Tsuboi M. Raman scattering anisotropy of biological systems. J. Biomed. Opt 2002;7:435–441.[PubMed: 12175294]
12. Enejder AMK, Scecina TG, Oh J, Hunter M, Shih WC, Sasic S, Horowitz GL, Feld MS. Ramanspectroscopy for noninvasive glucose measurements. J. Biomed. Opt 2005;10:031114. [PubMed:16229639]
13. Shih, W-C.; Bechtel, KL.; Feld, MS. Quantitative biological Raman spectroscopy. In: Tuchin, VV.;Taylor; Francis, editors. Handbook of Optical Sensing of Glucose in biological fluids and tissues.2008. Chap. 12
14. Flock ST, Jacques SL, Wilson BC, Star WM, Vangemert MJC. Optical-Properties of Intralipid - aPhantom Medium for Light-Propagation Studies. Lasers Surg. Med 1992;12:510–519. [PubMed:1406004]
15. Enejder, AMK. Doctoral Thesis. Department of Physics, Lund Institute of Technology; 1997.16. Frank IE, Friedman JH. A Statistical View of Some Chemometrics Regression Tools. Technometrics
1993;35:109–135.17. Wold, S.; Martin, H.; Wold, H. Lecture Notes in Mathematics. Springer-Verlag; Heidelberg: 1983.18. Shih W-C, Bechtel KL, Feld MS. Constrained regularization: Hybrid method for multivariate
calibration. Anal. Chem 2007;79:234–239. [PubMed: 17194145]19. Zonios G, Perelman LT, Backman VM, Manoharan R, Fitzmaurice M, Van Dam J, Feld MS. Diffuse
reflectance spectroscopy of human adenomatous colon polyps in vivo. Appl. Opt 1999;38:6628–6637. [PubMed: 18324198]
20. Farrell TJ, Patterson MS, Wilson B. A Diffusion-Theory Model of Spatially Resolved, Steady-StateDiffuse Reflectance for the Noninvasive Determination of Tissue Optical-Properties Invivo. Med.Phys 1992;19:879–888. [PubMed: 1518476]
21. Dam JS, Pedersen CB, Dalgaard T, Fabricius PE, Aruna P, Andersson-Engels S. Fiber-optic probefor noninvasive real-time determination of tissue optical properties at multiple wavelengths. Appl.Opt 2001;40:1155–1164. [PubMed: 18357101]
22. Doornbos RMP, Lang R, Aalders MC, Cross FW, Sterenborg HJCM. The determination of in vivohuman tissue optical properties and absolute chromophore concentrations using spatially resolvedsteady-state diffuse reflectance spectroscopy. Phys. Med. Biol 1999;44:967–981. [PubMed:10232809]
23. Nichols MG, Hull EL, Foster TH. Design and testing of a white-light, steady-state diffuse reflectancespectrometer for determination of optical properties of highly scattering systems. Appl. Opt1997;36:93–104. [PubMed: 18250650]
Bechtel et al. Page 8
Opt Express. Author manuscript; available in PMC 2010 March 25.
NIH
-PA Author Manuscript
NIH
-PA Author Manuscript
NIH
-PA Author Manuscript

Fig. 1.Schematic of experimental setup. F1: laser line filter (MaxLine, Semrock); S1-S2: shutters;BS: MgF2 plate used as beamsplitter; M1-M2: gold plated mirrors; L1-L2: beam shapinglenses; M3: paraboloidal mirror; F2: notch filter; L3: coupling lens; FB: fiber bundle.
Bechtel et al. Page 9
Opt Express. Author manuscript; available in PMC 2010 March 25.
NIH
-PA Author Manuscript
NIH
-PA Author Manuscript
NIH
-PA Author Manuscript

Fig. 2.OLS model components for experiment 1.
Bechtel et al. Page 10
Opt Express. Author manuscript; available in PMC 2010 March 25.
NIH
-PA Author Manuscript
NIH
-PA Author Manuscript
NIH
-PA Author Manuscript

Fig. 3.(a). Raman spectra (b). Relative DRS spectra normalized to 4% intralipid with no absorberpresent.
Bechtel et al. Page 11
Opt Express. Author manuscript; available in PMC 2010 March 25.
NIH
-PA Author Manuscript
NIH
-PA Author Manuscript
NIH
-PA Author Manuscript

Fig. 4.The ratio of observed to actual values of an analyte at constant concentration showingsignificant deviation from 1 resulting from turbidity distortions, plotted as a function of μa andμs.
Bechtel et al. Page 12
Opt Express. Author manuscript; available in PMC 2010 March 25.
NIH
-PA Author Manuscript
NIH
-PA Author Manuscript
NIH
-PA Author Manuscript

Fig. 5.(NOBS/NREF)·μt versus Rd for experiments 1 and 2, showing reproducible curvature.
Bechtel et al. Page 13
Opt Express. Author manuscript; available in PMC 2010 March 25.
NIH
-PA Author Manuscript
NIH
-PA Author Manuscript
NIH
-PA Author Manuscript

Fig. 6.Boxplot showing reduction in mean and standard deviation of prediction error by applicationof IRS. Values were derived from 500 unique splittings of 50 samples into 36 calibration and14 prediction sample sets.
Bechtel et al. Page 14
Opt Express. Author manuscript; available in PMC 2010 March 25.
NIH
-PA Author Manuscript
NIH
-PA Author Manuscript
NIH
-PA Author Manuscript
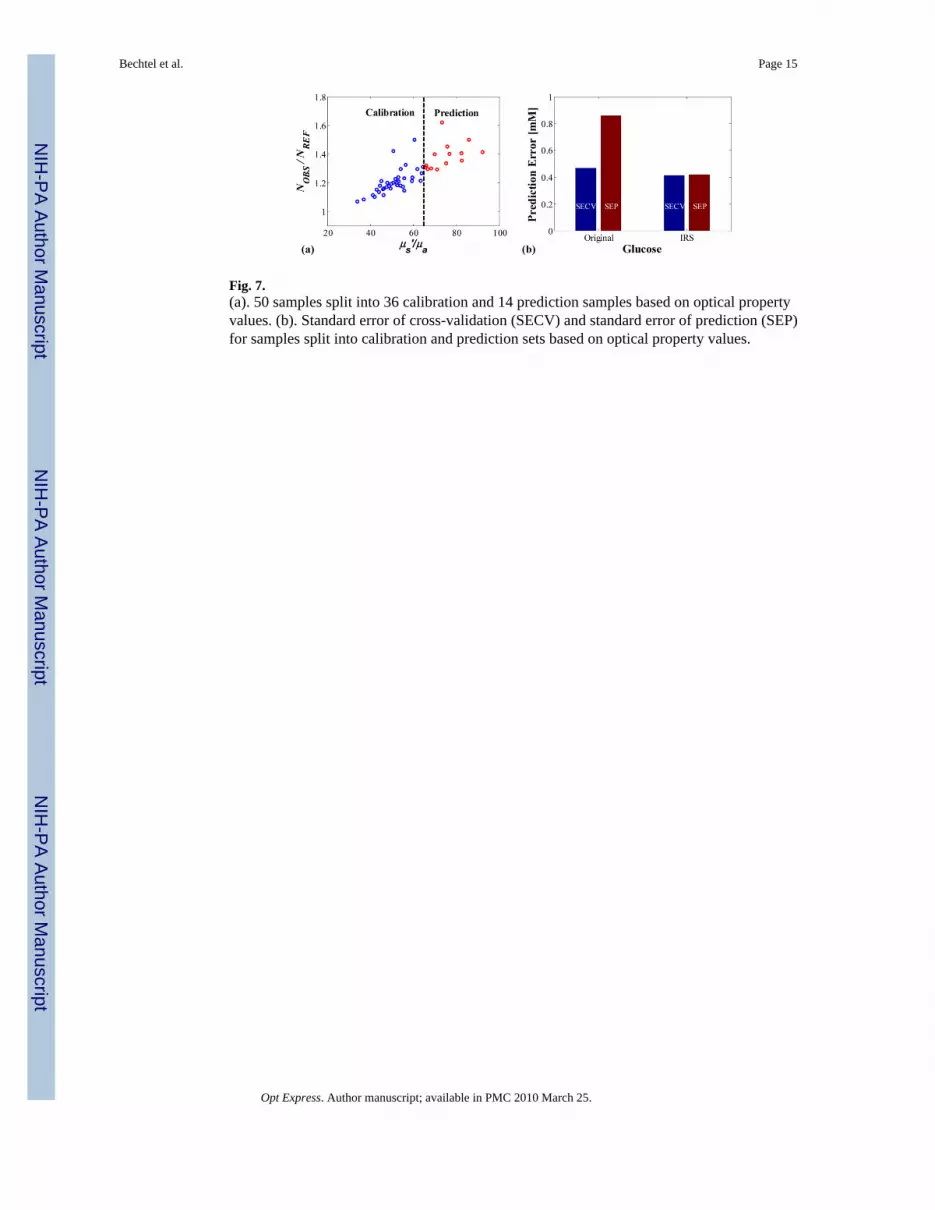
Fig. 7.(a). 50 samples split into 36 calibration and 14 prediction samples based on optical propertyvalues. (b). Standard error of cross-validation (SECV) and standard error of prediction (SEP)for samples split into calibration and prediction sets based on optical property values.
Bechtel et al. Page 15
Opt Express. Author manuscript; available in PMC 2010 March 25.
NIH
-PA Author Manuscript
NIH
-PA Author Manuscript
NIH
-PA Author Manuscript


