Embed Size (px)
Citation preview

Io
Fa
b
c
C
a
ARRA
KRSFBFS
1
m(aeadpwDd2ce
1h
Ecological Indicators 24 (2013) 451–461
Contents lists available at SciVerse ScienceDirect
Ecological Indicators
jo ur nal homep age: www.elsev ier .com/ locate /eco l ind
ntroducing two indicators for fire risk consideration in the managementf boreal forests
rédéric Rauliera,∗, Héloïse Le Goffa,b, Sylvie Gauthierb, Rija Rapanoelaa, Yves Bergeronc
Centre d’étude de la forêt, Faculté de foresterie, de géomatique et de géographie, Université Laval, 2405 rue de la Terrasse, Québec, QC, G1V 0A6 CanadaNatural Resources Canada, Canadian Forest Service, Laurentian Forestry Center, 1055, rue du PEPS, C.P. 10380, stn. Sainte-Foy, Québec, QC, G1V 4C7 CanadaNSERC/UQAT/UQAM Industrial Chair in Sustainable Forest Management, Université du Québec en Abitibi-Témiscamingue, 445 boul. de l’Université, Rouyn-Noranda, QC, J9X 5E4anada
r t i c l e i n f o
rticle history:eceived 5 March 2012eceived in revised form 23 July 2012ccepted 26 July 2012
eywords:isk assessmentustainable forest managementorest productivityoreal forestorest fireurvival likelihood probability
a b s t r a c t
When forest fires are taken into account during timber supply analyses, planned harvest rates are nec-essarily reduced to prevent potential timber shortages due to future forest fires. Because fire events arehighly unpredictable, forest managers are reluctant to proactively reduce harvest targets, as it results inan immediate revenue loss. We explored a simple but proactive way of including the risks and uncer-tainties of fire in forest management planning through the identification of low productivity forest areasmost vulnerable to fire in two different boreal forest zones. Site index and relative density index wereused to estimate the time required to reach different harvesting thresholds based on stem size and treedensity. We varied the production objective by using three different thresholds of minimum stem size(dm3/tree) and stand yield (m3/ha) (50 dm3/tree – 50 m3/ha, 70 dm3/tree – 70 m3/ha, 90 dm3/tree –90 m3/ha). We estimated the time required to reach these thresholds and the proportion of forest zonethat could exceed them. Fire cycle length was then used to assess the survival likelihood (probability ofreaching the threshold at the stand scale when considering fire risk). An alternative rate of return was
also used as an indicator of profit exposure to fire risk. When survival likelihood and alternative rate ofreturn are considered jointly with time-declining interest rates, minimum survival likelihoods need to behigher for longer fire cycles. The proportion of stands vulnerable to fire served to decide whether or notto include fire risk into strategic planning. The identification of major break points in the vulnerabilityassessment also helped to decide which minimum harvesting threshold is appropriate as a function ofristic
the productivity characte. Introduction
Sustainability is now the overarching goal of forest manage-ent for many countries of the world. Since the Montreal Process
1995), forest management typically implies planning harvestingctivities over a long time horizon while considering economic,nvironmental and social dimensions. In many forest biomes, fire isn important disturbance that interferes with timber availability,espite the fact that most jurisdictions have very good fire sup-ression systems (Pan et al., 2011). Fire activity is controlled byeather and climate, vegetation, human activities, and topography.ry forest fuels and winds are major contributors to large stand-estroying fires (Flannigan and Wotton, 2001; Westerling et al.,
006). The strong linkage between historical forest fire activity andlimate suggests that fire activity will still occur in the boreal for-st and might be increasing in the face of climate change (Flannigan∗ Corresponding author. Tel.: +1 418 656 2131x6742; fax: +1 418 656 5262.E-mail address: [email protected] (F. Raulier).
470-160X/$ – see front matter © 2012 Elsevier Ltd. All rights reserved.ttp://dx.doi.org/10.1016/j.ecolind.2012.07.023
s and fire cycle of the forest under management.© 2012 Elsevier Ltd. All rights reserved.
et al., 2009; Bergeron et al., 2006, 2010). Moreover, as climate vari-ability is affecting the annual area burned (Girardin et al., 2009; LeGoff et al., 2008), forest fires represent highly variable and uncer-tain losses of timber supply. These uncertainties have hampered theinclusion of fire risk into the planning process. In fact, in Canada forinstance, fire risk is traditionally managed after forest fires occurin areas under management. Fires generally trigger unpredictedchanges in management and harvesting plans (salvage logging),specific equipment use (roads and machinery) and new timber sup-ply analyses when timber losses are deemed consequential (Savageet al., 2010, for a recent review). When forest fires are taken intoaccount during timber supply analyses, planned harvest targets arenecessarily lower to prevent future deficits in harvestable volume(Armstrong, 2004; Didion et al., 2007; Savage et al., 2010). Since fireevents are highly unpredictable, forest managers remain reluctantto reduce harvest targets beforehand, as it represents an imme-
diate revenue loss. This a posteriori approach to accounting forfire can interfere with efforts to achieve sustainable forest man-agement objectives and recently many authors have argued thatfire risk should be integrated into forest management planning in a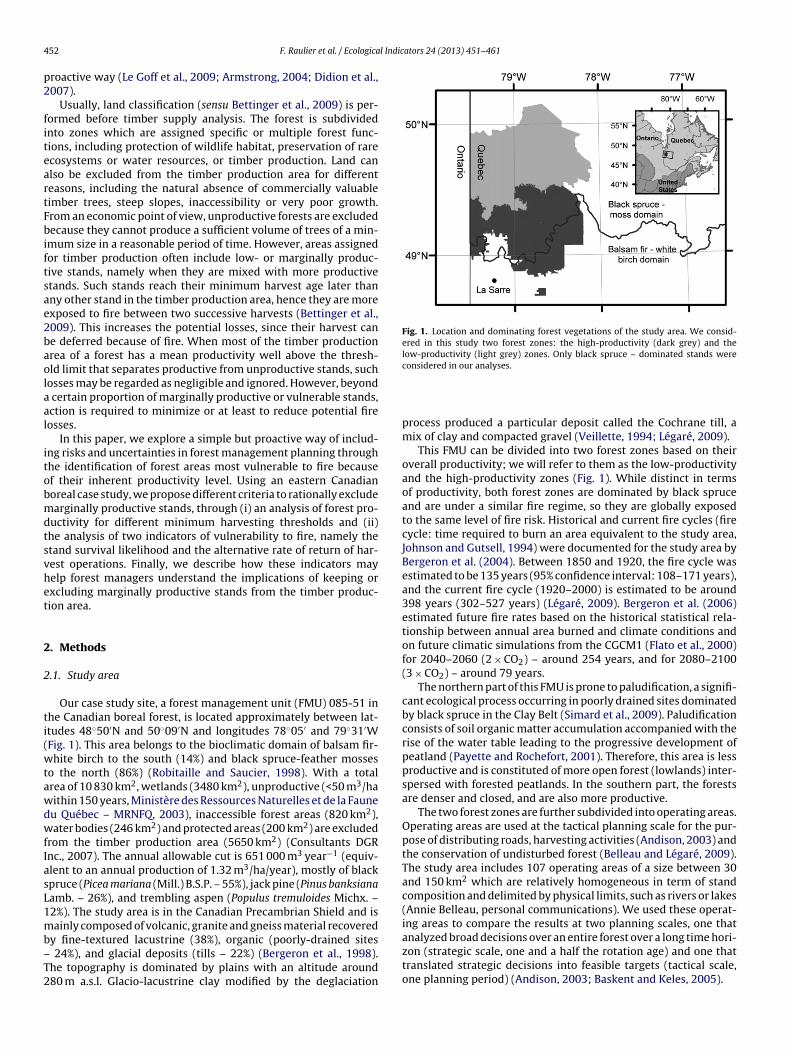
4 l Indicators 24 (2013) 451–461
p2
fiteartFbiftsae2baolaal
itobmdtsvhet
2
2
ti(wtawdwfIasL1mb–T2
Fig. 1. Location and dominating forest vegetations of the study area. We consid-ered in this study two forest zones: the high-productivity (dark grey) and thelow-productivity (light grey) zones. Only black spruce – dominated stands were
52 F. Raulier et al. / Ecologica
roactive way (Le Goff et al., 2009; Armstrong, 2004; Didion et al.,007).
Usually, land classification (sensu Bettinger et al., 2009) is per-ormed before timber supply analysis. The forest is subdividednto zones which are assigned specific or multiple forest func-ions, including protection of wildlife habitat, preservation of rarecosystems or water resources, or timber production. Land canlso be excluded from the timber production area for differenteasons, including the natural absence of commercially valuableimber trees, steep slopes, inaccessibility or very poor growth.rom an economic point of view, unproductive forests are excludedecause they cannot produce a sufficient volume of trees of a min-
mum size in a reasonable period of time. However, areas assignedor timber production often include low- or marginally produc-ive stands, namely when they are mixed with more productivetands. Such stands reach their minimum harvest age later thanny other stand in the timber production area, hence they are morexposed to fire between two successive harvests (Bettinger et al.,009). This increases the potential losses, since their harvest cane deferred because of fire. When most of the timber productionrea of a forest has a mean productivity well above the thresh-ld limit that separates productive from unproductive stands, suchosses may be regarded as negligible and ignored. However, beyond
certain proportion of marginally productive or vulnerable stands,ction is required to minimize or at least to reduce potential fireosses.
In this paper, we explore a simple but proactive way of includ-ng risks and uncertainties in forest management planning throughhe identification of forest areas most vulnerable to fire becausef their inherent productivity level. Using an eastern Canadianoreal case study, we propose different criteria to rationally excludearginally productive stands, through (i) an analysis of forest pro-
uctivity for different minimum harvesting thresholds and (ii)he analysis of two indicators of vulnerability to fire, namely thetand survival likelihood and the alternative rate of return of har-est operations. Finally, we describe how these indicators mayelp forest managers understand the implications of keeping orxcluding marginally productive stands from the timber produc-ion area.
. Methods
.1. Study area
Our case study site, a forest management unit (FMU) 085-51 inhe Canadian boreal forest, is located approximately between lat-tudes 48◦50′N and 50◦09′N and longitudes 78◦05′ and 79◦31′WFig. 1). This area belongs to the bioclimatic domain of balsam fir-hite birch to the south (14%) and black spruce-feather mosses
o the north (86%) (Robitaille and Saucier, 1998). With a totalrea of 10 830 km2, wetlands (3480 km2), unproductive (<50 m3/haithin 150 years, Ministère des Ressources Naturelles et de la Fauneu Québec – MRNFQ, 2003), inaccessible forest areas (820 km2),ater bodies (246 km2) and protected areas (200 km2) are excluded
rom the timber production area (5650 km2) (Consultants DGRnc., 2007). The annual allowable cut is 651 000 m3 year−1 (equiv-lent to an annual production of 1.32 m3/ha/year), mostly of blackpruce (Picea mariana (Mill.) B.S.P. – 55%), jack pine (Pinus banksianaamb. – 26%), and trembling aspen (Populus tremuloides Michx. –2%). The study area is in the Canadian Precambrian Shield and isainly composed of volcanic, granite and gneiss material recovered
y fine-textured lacustrine (38%), organic (poorly-drained sites 24%), and glacial deposits (tills – 22%) (Bergeron et al., 1998).he topography is dominated by plains with an altitude around80 m a.s.l. Glacio-lacustrine clay modified by the deglaciation
considered in our analyses.
process produced a particular deposit called the Cochrane till, amix of clay and compacted gravel (Veillette, 1994; Légaré, 2009).
This FMU can be divided into two forest zones based on theiroverall productivity; we will refer to them as the low-productivityand the high-productivity zones (Fig. 1). While distinct in termsof productivity, both forest zones are dominated by black spruceand are under a similar fire regime, so they are globally exposedto the same level of fire risk. Historical and current fire cycles (firecycle: time required to burn an area equivalent to the study area,Johnson and Gutsell, 1994) were documented for the study area byBergeron et al. (2004). Between 1850 and 1920, the fire cycle wasestimated to be 135 years (95% confidence interval: 108–171 years),and the current fire cycle (1920–2000) is estimated to be around398 years (302–527 years) (Légaré, 2009). Bergeron et al. (2006)estimated future fire rates based on the historical statistical rela-tionship between annual area burned and climate conditions andon future climatic simulations from the CGCM1 (Flato et al., 2000)for 2040–2060 (2 × CO2) – around 254 years, and for 2080–2100(3 × CO2) – around 79 years.
The northern part of this FMU is prone to paludification, a signifi-cant ecological process occurring in poorly drained sites dominatedby black spruce in the Clay Belt (Simard et al., 2009). Paludificationconsists of soil organic matter accumulation accompanied with therise of the water table leading to the progressive development ofpeatland (Payette and Rochefort, 2001). Therefore, this area is lessproductive and is constituted of more open forest (lowlands) inter-spersed with forested peatlands. In the southern part, the forestsare denser and closed, and are also more productive.
The two forest zones are further subdivided into operating areas.Operating areas are used at the tactical planning scale for the pur-pose of distributing roads, harvesting activities (Andison, 2003) andthe conservation of undisturbed forest (Belleau and Légaré, 2009).The study area includes 107 operating areas of a size between 30and 150 km2 which are relatively homogeneous in term of standcomposition and delimited by physical limits, such as rivers or lakes(Annie Belleau, personal communications). We used these operat-ing areas to compare the results at two planning scales, one thatanalyzed broad decisions over an entire forest over a long time hori-zon (strategic scale, one and a half the rotation age) and one that
translated strategic decisions into feasible targets (tactical scale,one planning period) (Andison, 2003; Baskent and Keles, 2005).
l Indic
2a
smmvtumar
a7b55loegti
po2uasIosttepretac1
rbPetiaapwawtpdatHtt
F. Raulier et al. / Ecologica
.2. Estimating the proportion of management zones that satisfy minimum harvesting threshold, without considering fire
A minimum harvesting threshold is defined as a sufficient den-ity of trees of a minimum size. In other words, it requires ainimum mean merchantable stem volume (dm3/stem) and ainimum merchantable stand volume (m3/ha). The merchantable
olume of a stem corresponds to the volume with bark of the treerunk up to a 9 cm diameter top (Perron, 1986). The stand vol-me is the product of the mean stem volume and the density oferchantable trees in a site. The minimum harvesting threshold is
ssumed at least to cover the cost of access, harvest, transportation,egeneration and management.
To cover the observed range of stand productivity in the entirerea, we chose to contrast three harvesting thresholds: 50-50, 70-0, and 90-90 (dm3/stem – m3/ha). This range of thresholds isroad, as lumber value per stem doubles for black spruce stems of0–90 dm3 (Liu et al., 2007). The lowest harvesting threshold (50-0) is considered loosely constraining (MRNFQ, 2003), because a
arge proportion of forest stands will satisfy this harvesting thresh-ld. The harvest of these stands however provides very narrowconomic benefits. The highest harvesting threshold (90-90) bringsreater economic benefits per unit area, but is very restrictive forhis particular management unit, as it would exclude a very signif-cant proportion of the actual timber production area.
A stand is excluded from the timber production area based on itsotential to reach in one rotation the minimum harvesting thresh-ld both at the stem and stand levels (MRNFQ, 2003; Bettinger et al.,009). Yield tables developed by Pothier and Savard (1998) weresed to identify productive stands (MRNFQ, 2003). These tablesre based on site and relative density indices. Site index (SI) corre-ponds to the stand dominant height at a reference age of 50 years.t is a quantitative measure used to express tree growth potentialf a forest stand (Alemdag, 1991) and remains independent of den-ity for a wide range of tree densities. The relative density index ishe ratio of observed stem density (total number of stems per ha)o a maximum stem density estimated for a given mean tree diam-ter with the self-thinning rule (Drew and Flewelling, 1979). Withermanent sample plots, Pothier and Savard (1998) observed thatelative density is sensitive to stand age, so they removed this ageffect by referring to a relative density index at 100 years (RDI100,heir Eq. (11)). Although both indices are primarily intended to bepplied to fully stocked and even-aged monospecific stands, theyan also be used in irregular and more open stands (Monserud,984; Shaw and Long, 2007).
The minimum harvesting age, defined as the time required toeach the minimum harvesting threshold, was estimated for alllack spruce stands of the study area with the yield tables ofothier and Savard (1998). Site and relative density indices werestimated by the MRNFQ for the last timber supply analysis ofhe study area (2008–2013 planning period). Their methodologys briefly explained here. Stand polygons were delineated from
mosaic of aerial photos and grouped into management strataccording to photo-interpreted information such as stand com-osition, age and density. Biometric characterization of the strataas based on approximately 8 inventory sample plots per stratum
nd located in stands with similar photointerpreted properties andithin the constraint of the hierarchical ecological forest classifica-
ion of Robitaille and Saucier (1998). Within each 400 m2 inventorylot, species and diameter at breast height (dbh) of every tree with aiameter larger than 9 cm were recorded by 2 cm-dbh classes. Over-ll, 6148 sample plots were used. Saplings (diameter < 9 cm) taller
han 1.3 m were counted by 2 cm-dbh classes in a 40-m2 subplot.eight and age (ring count at 1 m) were measured on 2–5 samplerees per plot. In total, there were 755 management strata in theimber production area, out of which 747 included black spruce.
ators 24 (2013) 451–461 453
Median, skewness (a measure of the lack of symmetry in thedata distribution) and kurtosis (a measure of peakedness of the datadistribution when compared to a normal distribution) of the min-imum harvesting age probability density function can be used asindicators of overall site productivity. A productive timber produc-tion area should have a low median minimum harvesting age, withits density function being strongly right-skewed and leptokurtic.We have examined these parameters both at the forest zone andoperating area scales.
2.3. Probability to reach a minimum harvesting volume,considering fire activity
To estimate the probability that a stand escapes from fire andreaches the harvesting threshold, we used fire cycle lengths rep-resentative of the historical and future fire cycles reported for thestudy area (400, 200 and 100 years). We estimated the expectedproportion of forest stands that will likely reach their minimumharvesting age without being affected by a forest fire. These resultswere compared with those obtained with a very low fire cycle(10 000 years), representing a situation where all fires would besuppressed or where almost no fire occurs.
To ease the interpretation of the assessment and to choose indi-cator thresholds below which a stand would be considered toovulnerable to fire risk, two vulnerability indicators were used atthe stand level, one based on survival likelihood and another basedon the alternative rate of return of harvesting activities. Assumingthat in boreal forests fire activity is mostly controlled by weather(Parisien et al., 2011), the time-since-fire distribution (stand agedistribution across the FMU) is negatively exponential (Johnson andGutsell, 1994). The expected proportion of stands reaching a givenminimum harvesting age is then given by:
p(Aht) = exp
(−Aht
Tf
)(1)
where Aht is the age required for a stand to reach a minimumharvesting threshold and Tf is a fire cycle (years). Eq. (1) equalsthe survival likelihood of a specific stand for Aht years in an areasubmitted to a particular fire cycle and may serve to assess standvulnerability under a certain fire cycle. When the likelihood prob-ability was below 66%, the stand was considered too vulnerable tofire to be included into the timber production area.
An indicator based on probability language, such as survivallikelihood, may not be sufficiently informative to a forest man-ager. The action of classifying a stand as unproductive representsa potential profit loss, equivalent to abandoning the latent sellingprice that results from harvesting activities. The choice of includ-ing or excluding a stand into the timber production area can thusbe equated to an investment decision in which two alternativesare assessed: keep or “sell” the stand to another use. We used theland expectation value (LEV) to represent the economical value ofland with all harvesting benefits anticipated. LEV helps comparedifferent projects or options. Usually, LEV is estimated at rotationstart (Davis et al., 2001), but we compounded LEV to harvestingage in order to evaluate the first harvest decision and assumed thatthe stand would be “abandoned” to another use if the net profitof harvesting is less than the stand economical value. For standsat the harvesting threshold, the wood harvested will always havethe same size and quantity as defined by the harvesting threshold,
thus, costs and revenues can be expressed in units of merchantablevolume. Also, one may further assume for simplification purposesthat these operations take place simultaneously. Although untrueat the stand level (e.g. Klemperer, 1996), this is approximately valid
4 l Indicators 24 (2013) 451–461
at
L
whttmw2
bsdblvssmabh
V
wVr
i
ibfib2
saiooe5ttctctltfo
2o
zl
Table 1Distribution (%) of the relative proportion of the timber production area by site (SI)classes and relative density indices (RDI100) classes across the study area for the high-productivity and low-productivity forest zones. SI and RDI100 values correspond tocentral values of each class.
RDI100 SI
9 12 15 18 21
High-productivity zone0.1 0.10.3 4.50.5 5.1 7.80.7 0.2 18.6 55.6 7.7 0.4
Low-productivity zone0.10.3 11.0
54 F. Raulier et al. / Ecologica
t the forest scale. Under these assumptions, including a stand intohe timber production area requires that:
EV = Vh(1 + i)Ah
(1 + i)Ah − 1≥ Vht (2)
here Vh is the volume (m3/ha) expected to be harvested at thearvesting age (Ah), Vht is the volume set by a minimum harvestinghreshold and i is an interest rate. When LEV = Vht, i correspondso the minimum interest rate of return below which a decision
aker would renounce harvesting activities in a given stand. Weill further refer to it as the alternative rate of return (Davis et al.,
001).The link between minimum profit and exposure is provided
y the expected volume at harvest age, considering fire risk. Aspecified before, actual timber supply analyses are realized in aeterministic fashion and ignore the impact of fire hazard on tim-er harvest. As a consequence, stands whose productivity is at the
imit of the harvesting threshold will be regularly scheduled for har-est, as any other productive stand will be. Should some of thesetands burn before harvesting age, they will not be harvested at thecheduled time since their volume will always be below the mini-um harvesting threshold. Consequently, the expected volume of
group of stands at the limit of the harvesting threshold Vh cane derived from the product of survival likelihood and volume atarvesting threshold:
h = Vht exp
(−Aht
Tf
)(3)
here Aht is the minimum harvesting age. Eq. 3 may serve to replaceh in Eq. (2) and Eq. (2) may be rearranged to isolate the alternativeate of return:
ht =(
1 − exp
(−Aht
Tf
))−1/Aht
− 1 (4)
The alternative rate of return is a tool that serves to rate the prof-tability, in the present case, of harvesting activities. As expressedy Eq. (4), it can also be used as an indicator of profit exposure tore risk. When looking at this indicator alone, we defined a stand aseing vulnerable to fire when the alternative rate of return is below%.
An analysis of stand vulnerability combining both indicatorshould likely involve different values of alternative rate of returnnd survival likelihood. As the uncertainty of forecasted incomesncreases with the length of the forecast, Moore et al. (2004) rec-mmended using time-declining rates for cost-benefit analysesf public investment projects. They proposed 3.5% for intragen-rational projects (less than 50 years), 2.5% for projects spanning0–100 years and 1.5% for projects of 100–200 years. Using thoseime-declining rates, the alternative rate of interest will vary withhe minimum harvesting age and correspondingly with the fireycle (by Eq. (4)). Since the harvest age cannot be set analyticallyo the left of Eq. (4), the minimum harvest age for a particular fireycle was estimated with a binary search algorithm using alterna-ively the three interest rates and assessing whether it fit within theength of the corresponding spanning time (Moore et al., 2004) forhat interest rate. Once the interest rates and harvesting age wereound (we used the lowest interest rates when there was more thanne solution), survival likelihoods were then estimated with Eq. (1).
.4. Vulnerability assessment at the management zone andperating area levels
In a first step, an analysis at the scale of forest managementones served to rate and to compare both indicators (survival like-ihood and alternative rate of return). This analysis was not spatially
0.5 7.2 36.6 9.60.7 13.1 20.0 2.3
explicit. Probability density functions of both indicators were usedto assess the vulnerability of stands to fire. To help rate the overallvulnerability, survival likelihood probabilities were rated accord-ing to a scale presented by Patt and Schrag (2003). As an example,results will be presented using probabilities greater than 66% (i.e.stands will likely reach minimum harvesting age).
Common ranges of interest rates for different project types werealso used to evaluate values of alternative rates of return. A rangebetween 2 and 4% is used for social discount rates for public invest-ment (Moore et al., 2004), and interest rates higher than 4% maypotentially attract private investors (e.g. Borders et al., 2008). Arange between 4 and 8% is common for discount rates in temperateprivate forests (Borders et al., 2008; Klemperer, 1996) and discountrates higher than 8% are only used for highly productive plantations(Manley, 2007).
In a second step, the relative abundance of vulnerable standsby operating area was estimated. At this scale, vulnerability wasrated by the frequency of vulnerable stands by fire cycle and mini-mum harvesting threshold because many management targets aredefined in this way (e.g. biological refuges, residual forest, adaptedsilvicultural practices, etc.) (Belleau and Légaré, 2009). The abun-dance of vulnerable stands was described with an ACFOR scale:“Abundant” (more than 75% of the timber production area in a par-ticular operating area), “Common” (50–75%), “Frequent” (25–50%)and “Occasional or Rare” (less than 25%).
In a third and last step, as vulnerable stands could be excludedfrom the timber production area, operating areas could themselvesbe excluded because of an insufficient proportion of timber produc-tion area relative to their total terrestrial area. The northern part ofthe FMU (the low-productivity zone) borders to the northern limitof commercial forest in Quebec and we used the minimum pro-portion of productive stands observed in the operating areas of thelow-productivity zone (25%) as the threshold for excluding entireoperating areas.
3. Results
3.1. Minimum harvesting thresholds and stand productivity
The differences in productivity at the zone level are reflected bythe distribution reported in Table 1. More than 70% of the area isoccupied by sites with SI above 15 and RDI100 above 0.5 in the high-productivity zone as compared to only 32% in the low-productivityzone.
The three minimum harvesting thresholds appear as segmentedcurvilinear curves or “hockey sticks” in a graph representing rela-tive density index as a function of site index (Fig. 2). This curveform is caused by the double threshold definition, with a minimum

F. Raulier et al. / Ecological Indicators 24 (2013) 451–461 455
0
0.2
0.4
0.6
0.8
2015105
RD
I 10
0
Site index
Low-productivityzone
High-productivity zone
Fig. 2. Mean site index (SI) and mean relative density index (RDI100) and asso-ciated 95% confidence intervals for the high-productivity (closed circle) andlow-productivity (open circle) zones. “Hockey-stick” lines indicate the limit defin-ing unproductive (left side) and productive (right side) stands for three minimumharvesting thresholds: 50 dm3/tree and 50 m3/ha (continuous line), 70 dm3/tree and7 3 3 3
awss(smat99h9
apldtzkfyebaFohplt(
ubwiho6smi
Are
a d
istr
ibu
tio
n
0
0.2
0.4
0.6
0.8
High-produ ctivity zon e
Low-produ ctivity zon e
0
0.2
0.4
0.6
0.8
0
0.2
0.4
0.6
0.8
a) 50-50 minimum ha rvestin g t hreshold
b) 70 -70 mini mum harvesting threshold
c) 90-90 mini mum ha rvestin g threshol d
Age at which the mini mum ha rvesting threshold is rea ched (years)
Fig. 3. Relative area distribution of the minimum stand age at which are reacheddifferent minimum harvesting thresholds (50-50: 50 dm3/tree and 50 m3/ha (a),70-70: 70 dm3/tree and 70 m3/ha (b), and 90-90: 90 dm3/tree and 90 m3/ha (c))for the high-productivity (closed bars) and the low-productivity (open bars) zones.“Unprod” indicates the proportion of the zones with SI and RDI100 too low to satisfy
0 m /ha (long dashed line), and 90 dm /tree and 90 m /ha (short dashed line).
chievable stem size that is insensitive to relative density indexith the Pothier and Savard (1998) yield model (the hockey stick’s
haft) and a minimum standing volume (the blade). Minimum stemizes of 50, 70 and 90 dm3 respectively correspond to site indicesSI) of 10, 11 and 13 m at 50 years. Stands to the right of the hockeytick are considered productive at the specified threshold level. Thiseans that, without considering fire activity, close to 100% of the
rea in the high-productivity zone is considered productive underhe 50-50 and 70-70 thresholds while it drops to 71% under the0-90 threshold (Fig. 3). In contrast, in the low-productivity zone,2% of the area is considered productive for the 50-50 and 70-70arvesting thresholds and only 32% is considered as such for the0-90 threshold.
At a 50-50 harvesting threshold, both zones have a lowmount of unproductive sites. Under these conditions, the high-roductivity forest zone is identified by a right-skewed and
eptokurtic (i.e. with more acute peak than a normal distribution)ensity function (Fig. 3a), where the great majority of stands reachhe threshold before 60 years. Conversely, the low-productivityone presents a symmetric and almost mesokurtic (i.e. with aurstosis comparable to that of a normal distribution) densityunction (Fig. 3a), where a majority of stands take less than 80ears to reach the threshold. When a higher threshold is consid-red (70-70), there is still a low amount of unproductive sites inoth zones. The kurtosis becomes negative for both forest zonesnd skewness diminishes for the high-productivity zone (Fig. 3b).inally at 90-90, there is an important increase in the amountf area that is considered unproductive at 27% and 67% for theigh- and low-productivity zones respectively. For the productiveortion, the density functions are truncated to the right, strongly
eft-skewed and leptokurtic while the majority of stands reachhe minimum harvesting age in less than 80 years in both zonesFig. 3c).
A finer analysis at the scale of operating areas shows a contin-um of productivity situations but with a relatively clear distinctionetween the high- and low-productivity zones (Fig. 4). On average,hen the minimum harvesting threshold is set to 50-50, operat-
ng areas of the high-productivity zone have a mean minimumarvesting age lower than 60 years and a skewness higher thanne, while in the low-productivity zone these values are more than
0 years and less than zero (Fig. 4a and d). Similarly, the kurto-is values of the operating areas in the high-productivity zone areostly greater than one, whereas they are mainly less than zeron the low-productivity zone (Fig. 4g). As was the case with the
the corresponding minimum harvesting thresholds (see Fig. 2).
forest management zones (Fig. 3b and c), kurtosis of minimum har-vesting age density functions by operating area becomes negative(Fig. 4h) and skewness diminishes (Fig. 4e) with a higher harvestingthreshold (70-70). At the still higher harvesting threshold of 90-90, none of the operating areas of the low-productivity zone areexcluded entirely, but have a median minimum harvesting agebetween 60 and 80 years. Kurtosis and skewness cannot be esti-mated anymore for some operating areas (Fig. 4f and i).
3.2. Vulnerability of forest productivity to fire risk: comparingboth indicators
Stand level values of survival likelihood and alternative rate ofreturn were computed with Eqs. (1) and (4) for different values ofminimum harvesting age and fire cycles (Fig. 5). For the sake ofpresentation, first assume that if the survival likelihood probability
is greater than 66%, stands will be considered as being productiveenough to face the risk of fire. Stands would then need to reach the50-50 threshold before 166 years under the current fire cycle (400years) while harvest ages would have to be reached before 83 and
456 F. Raulier et al. / Ecological Indicators 24 (2013) 451–461
Fig. 4. Median (a–c), skewness (d–f) and kurtosis (g–i) of the density function of minimum harvesting age by operating area as a function of a minimum harvesting threshold(50-50: 50 dm3/tree and 50 m3/ha (a, d and g), 70-70: 70 dm3/tree and 70 m3/ha (b, e and h), 90-90: 90 dm3/tree and 90 m3/ha (c, f, i)).
4osa(atafir
5izg
1 years for 200- and 100-years fire cycles, respectively (Fig. 5a). Inther words, to face an increasing fire risk (decreasing fire cycle),tands have to reach the harvesting threshold at a notably youngerge, in a percentage equivalent to that of the fire cycle change (Eq.1)). When the minimum alternative rate of return is set to 2%, for
fire cycle of 400 years, stands have to reach the 50-50 harvestinghreshold before 84 years, a much lower value than the one set with
survival likelihood of 66% (166 years) (Fig. 5b). Under a 100-yearsre cycle, the minimum harvest age required to achieve the rate ofeturn target is approximately 49 years.
When comparisons are done at the scale of forest zones, with a
0-50 threshold, an increasing fire risk results in a faster decreasen the proportion of productive stands in the low-productivityone (still assuming a minimum survival likelihood probabilityreater than 66% to face the risk of fire): from 88% (10 000 and
400 years fire cycle), 82% (200-years fire cycle) and 22% (100-years fire cycle) (Fig. 6d) as compared to 100%, 95% and 64%for the high-productivity zone (Fig. 6a). When our indicator isa minimum alternative rate of return of 2%, under a 400-yearsfire cycle, most of the stands of both forest zones are consideredproductive (Fig. 7a and d), but with an increased fire risk, how-ever (200- and 100-years fire cycles), the proportion of timberproduction area decreases more rapidly in the low-productivityzone: from 45% (200-years fire cycle) to 22% (100-years fire cycle)(Fig. 7d) as compared to 90–64% for the high-productivity zone(Fig. 7a).
Proportions of area excluded from the timber production areaare higher with more restrictive harvesting thresholds of 70-70 and90-90 (Figs. 6b, c, e, f and 7b, c, e, f) but comparisons with bothindicators set to 66% and 2% remain similar: a minimum survival

F. Raulier et al. / Ecological Indicators 24 (2013) 451–461 457
Table 2Minimum survival probabilities resulting from considering fire cycle length, time-declining rates (from Moore et al., 2004) and minimum harvesting ages. Minimum harvestingages are derived from Eq. (4) and minimum survival likelihoods from Eq. (1).
Fire cycle(years)
Minimumalternativerate ofreturn (%)
Minimumharvestingage (years)
Minimumsurvivallikelihood (%)
400 1.5 101 78200 2.5 57 75
5
lo
ewmetacy1aHifi
3
tVnttt
Fra
100 3.5 3
ikelihood of 66% is approximately equivalent to an alternative ratef return of 2% for a fire cycle of 100 years.
To combine both indicators, combined harvesting ages, inter-st rates and survival likelihood for the three different fire cyclesere defined. For a fire cycle of 400 years, we obtained ainimum harvesting age of 101 years and thus fixed the inter-
st rate at 1.5%, in correspondence with projects spanning morehan 100 years. The associated survival likelihood is 78%. Under
200-years fire cycle, the minimum harvesting age (57 years)orresponded to a fixed rate of 2.5% (projects spanning 50–100ears), with a corresponding survival likelihood of 75%. Under a00-years fire cycle, a rate of 3.5% (35-years minimum harvestingge) was assigned, with a corresponding survival likelihood of 70%.ence, the use of time-declining interest rates of Moore et al. (2004)
mplies raising the minimum value of survival likelihood for longerre cycles (Table 2).
.3. Forest vulnerability to fire risk: operating area scale
The vulnerability of operating areas was assessed with theime-declining rates and minimum survival likelihoods of Table 2.ulnerable stands are marginally productive stands rated too vul-erable to fire risk that should potentially be excluded from the
imber production area. Consequently, some operating areas couldhemselves be excluded because of an insufficient proportion ofimber production area. Without considering fire risk and with a200150100500
10000
400
200
100
Fire
cycle
(ye
ars
)
p ≥ 0.9 9
p ≥ 0.9 0
p ≥ 0.6 6
p ≤ 0.6 6
a
200150100500
10000
400
200
100
Stand age (years)
i ≥ 8%
i ≥ 4%
i ≥ 2%
i ≤ 2%
b
ig. 5. Distribution of survival likelihood probabilities (a) and of alternative rates ofeturn (b) as a function of the stand harvesting age for different fire cycles (Eqs. (1)nd (4)).
70
minimum harvesting threshold of 50-50 or 70-70, a vast propor-tion of operating areas of both forest zones have more than 25%of their total terrestrial area included in the timber productionarea (Fig. 8a and b). With a 50-50 threshold under a 400-yearsfire cycle, although the proportion of productive stands in oper-ating areas is slightly decreased (when compared to Fig. 8a andb), most of them still have more than 25% of timber productionarea (Fig. 8d). If the threshold for including or excluding oper-ating areas is set at more than 25% of timber production areaper operating area, then a major change is observed between the70-70 and 90-90 minimum harvesting thresholds for the low-productivity zone (Fig. 8c). Major changes are also observed forthe same zone with a 400-years fire cycle and a 70-70 thresh-old (Fig. 8e) or with a 200-years fire cycle and a 50-50 threshold(Fig. 8g). For the high-productivity zone, the exclusion of operatingareas would only start to occur when considering a 200-years firecycle (Fig. 8g–i), while a major shift is observed at 90-90 harvestingthreshold (Fig. 8i).
Under the current fire cycle (400 years) and a 50-50 harvestingthreshold, vulnerable stands are rare (1–25%) in most operatingareas of the high-productivity zone, but somewhat more frequent(25–50%) in the low-productivity zone (Fig. 9a). With a 70-70 mini-mum threshold and a 400-years fire cycle, the majority of operatingareas of the high-productivity zone have more than 25% of theirarea in vulnerable stands (Fig. 9b). In the low-productivity zone,almost all operating areas have more than 50% of their area in vul-nerable stands for the same minimum threshold and fire cycle. Forthe 90-90 harvesting threshold, the vulnerability assessment rad-ically changes between a 400- and a 200-years fire cycle for bothforest zones (Fig. 9c and f).
4. Discussion
Fig. 8 illustrates the non-linearity of the relationship betweenthe proportion of productive stands per operating area, the firecycle, and the minimum harvesting threshold. In our case study,three different situations can be observed between which majorchanges occur in the proportion of the timber production areain operating areas: (1) Fig. 8a, b and d, (2) Fig. 8c, e, f, g and hand (3) Fig. 8i. In each of these three situations, the proportionof productive stands by operating area decreases gradually whenconsidering fire risk or when the minimum harvesting thresh-old is increased. These results suggest that for a particular forestarea under management, the identification of major break pointsmay help forest managers to decide which minimum harvestingthreshold is appropriate as a function of the productivity charac-teristics and fire cycle of the forests under management, as wellas of the harvesting expectations placed on the forest being man-aged. Moreover, as fire disturbances are predicted to increase with
the climatic change in many regions of the boreal forest (Flanniganet al., 2009; Bergeron et al., 2010), this approach also allows forassessment of vulnerablities that could be generated by such anincrease.
458 F. Raulier et al. / Ecological Indicators 24 (2013) 451–461
0%
20%
40%
60%
80%
100%
1000 0 40 0 20 0 10010000 40 0 200 10 0
0%
20%
40%
60%
80%
100%
10000 40 0 200 10 0
Hig
h-p
rod
uctivity z
on
eA
rea
dis
trib
utio
n
a) b)50-50 09-0907-07 c)
0%
20%
40%
60%
80%
100%
10000 40 0 200 10 0
Lo
w-p
rod
uctivity z
on
eA
rea
dis
trib
utio
n
d)
10000 400 200 100
e)
0%
20%
40%
60%
80%
100%
10000 40 0 20 0 10 0
f)
Fire cy cle
66-90 % 90 -99 % >99 %
Fig. 6. Area distribution of the survival likelihood for four different fire cycles (10 000, 400, 200 and 100 years) and three different harvesting thresholds (50-50, 70-70 and9
tpSbchav
Fa
0-90) in the high-productivity (a–c) and low-productivity forest zones (d–f).
An alternative to excluding low-productivity stands vulnerableo fire would be to include the fire risk into the strategic planninghase. For a jack pine forest with a harvesting age of 65 years,avage et al. (2010) recommended accounting for fire in a tim-er supply analysis when the burn rate is above 0.45% year−1 (fireycle below 222 years). This recommendation would hold for the
igh-productivity zone (Fig. 9a), as most of its timber productionrea has a minimum harvesting age below 70 years with a har-esting threshold of 50-50 (Fig. 3a) and, with a fire cycle of 2000%
20%
40%
60%
80%
100%
10000 40 0 200 10 0
Lo
w-p
rod
uctivity z
on
eA
rea
dis
trib
utio
n
1000 0 40 0
1000 0 400 0%
20%
40%
60%
80%
100%
1000 0 40 0 20 0 100
Hig
h-p
rod
uctivity z
on
eA
rea
dis
trib
utio
n
a) b)50-50 -07
d) e)
Fire c
2-4% 4
ig. 7. Area distribution of the alternative rate of return for four different fire cycles (10 0nd 90-90) in the high-productivity (a–c) and low-productivity forest zones (d–f).
years, vulnerable stands become frequent or common for most ofits timber production area (Fig. 9d). For the low-productivity zone,however, approximately 47% of its timber production area has aminimum harvesting age higher than 70 years (Fig. 3a, 50-50) and27% of its operating areas have frequent vulnerable stands when afire cycle of 400 years is considered (Fig. 9a). Hence, the suggestion
of Savage et al. (2010) should be gradated by forest productivityand production objectives. For instance, with a 70-70 minimumthreshold and a 400-years fire cycle, 65% of the operating areas0%
20%
40%
60%
80%
100 %
10000 40 0 20 0 10 0200 10 0
0%
20%
40%
60%
80%
100%
10000 400 20 0 10 0200 10 0
09-0907 c)
f)
ycle
-8% >8%
00, 400, 200 and 100 years) and three different harvesting thresholds (50-50, 70-70

F. Raulier et al. / Ecological Indicators 24 (2013) 451–461 459
Fig. 8. Proportion of operating area considered productive under three different fire cycles. Productive stands are stands that reach the harvesting threshold under therequired conditions defined by Table 2. Harvesting thresholds considered: 50-50 (left), 70-70 (center) and 90-90 (right).
obaaeO9ra
no
f the high-productivity zone have frequent or common vulnera-le stands (Fig. 9b), and, consequent to the present vulnerabilityssessment, fire risk should be accounted for in a timber supplynalysis. Also, one could ask if a 70-70 minimum threshold shouldven be considered for the low-productivity zone (Fig. 9b and e).nly the most productive stands of both zones can sustain a 90-0 minimum threshold (Fig. 3c) and the vulnerability assessmentadically changes between a 400- and a 200-years fire cycle (Fig. 9c
nd f).The present approach of excluding low-productivity stands vul-erable to fire could also be seen as complementary to the inclusionf fire risk during the strategic planning phase. Indeed, most of
the studies that accounted for fire risk in timber supply planning(except Peter and Nelson, 2005) made the simplifying assumptionthat their studied forest had only one single age-volume relation-ship (e.g. Van Wagner, 1983; Reed and Errico, 1986; Armstrong,2004; Savage et al., 2010) or a single harvesting age (Didion et al.,2007). Accounting for stand vulnerability to fire resulting from thetime necessary to reach harvest eligibility can be seen as a strategyto reduce the risk of future harvest deficits, while also permitting
a lower reduction of current harvestable volume. One should becareful, however, not to cause biodiversity problems by concen-trating harvesting activities in the most productive sites (Paquetteand Messier, 2011).
460 F. Raulier et al. / Ecological Indicators 24 (2013) 451–461
Fig. 9. Proportion of vulnerable stands by operating areas for 400-yr (a–c) and 200-yr (d–f) fire cycles. Vulnerable stands are stands that do not reach the harvesting thresholdu left), 7
5
rpiahids
itacaiTnmp
dSl
nder the conditions defined in Table 2. Harvesting thresholds considered: 50-50 (
. Conclusions
The survival likelihood probability and the alternative rate ofeturn may be used to estimate the vulnerability of marginallyroductive stands to forest fire risk. We developed, presented and
llustrated how these indicators allow forest managers to decide theppropriate minimum harvesting threshold when implementing aarvest strategy on a particular area as a function of productiv-
ty characteristics, fire activity (current or future) and certainty ofesired outcomes. The assessment of timber vulnerability to fire isensitive to the considered fire cycle and production objectives.
The approach developed and demonstrated with our case studys applicable to other regions where fire is a dominant type of dis-urbance, provided that the time to reach an harvesting thresholdnd a fire risk can both be assessed. It has the advantage of being lessomplex to undertake than a complete timber supply analysis whilellowing to make an analysis over an entire forest management unitn order to decide on production targets while considering fire risk.he analysis of forest vulnerability to fire proposed in this studyeeds to remain framed within the concepts of sustainable forestanagement to avoid potential biodiversity problems in the most
roductive sites.
Finally, the proportion of stands vulnerable to fire may serve toecide whether or not including fire risk into strategic planning.uch a decision, that necessarily implies a lower planned harvestevel, could be weighted against the potential economic loss of
0-70 (center) and 90-90 (right).
excluding vulnerable stands from the timber harvest area. The iden-tification of major break points in the vulnerability assessment mayhelp to decide which minimum harvesting threshold is appropriateas a function of the productivity characteristics and fire cycle of theforest under management.
Acknowledgements
We thank David Baril (Bureau du Forestier en Chef) and LouisDumas (Tembec) for giving us access to the last timber supplyanalysis of FMU 085-51 and helping us understand the plannedmanagement strategies and underlying hypotheses. We also thankAnnie Belleau (UQAT) for providing the map of operating areas andStephanie Ewen for editing the manuscript. We finally thank thetwo reviewers for their comments that improved the manuscript.This project was founded by the Natural Sciences and EngineeringCouncil of Canada and the Fonds québécois de la recherche sur lanature et les technologies.
References
Andison, D.W., 2003. Tactical forest planning and landscape design. In: Burton, P.J.,Messier, C., Smith, D.W., Adamowicz, W.L. (Eds.), Towards Sustainable Manage-ment of the Boreal Forest. NRC Research Press, Ottawa, pp. 433–480.
Alemdag, I.S., 1991. National site-index and height-growth curves for white sprucegrowing in natural stands in Canada. Can. J. For. Res. 21, 1466–1474.

l Indic
A
B
B
B
B
B
B
B
B
D
D
D
F
F
F
G
J
K
L
L
Veillette, J.J., 1994. Evolution and paleohydrology of glacial lakes Barlow and Ojib-
F. Raulier et al. / Ecologica
rmstrong, G.W., 2004. Sustainability of timber supply considering the risk of wild-fire. For. Sci. 50, 626–639.
askent, E.Z., Keles, S., 2005. Spatial forest planning: a review. Ecol. Model. 188,145–173.
elleau, A., Légaré, S., 2009. Project Tembec: towards the implementation of a forestmanagement strategy based on the natural disturbance dynamics of the north-ern Abitibi region. In: Gauthier, S., Vaillancourt, M.-A., Leduc, A., De Grandpré,L., Kneeshaw, D., Morin, H., Drapeau, P., Bergeron, Y. (Eds.), Ecosystem Manage-ment in the Boreal Forest. Presses de l’Université du Québec, Québec, QC, pp.479–499.
ergeron, J.F., Grondin, P., Blouin, J., 1998. Rapport de classification écologiquedu sous-domaine bioclimatique de la pessière à mousses de l’ouest. Publica-tion RN98-3080, Direction des inventaires forestiers, Ministère des Ressourcesnaturelles du Québec, Québec.
ergeron, Y., Gauthier, S., Flannigan, M.D., Kafka, V., 2004. Fire regimes at the transi-tion between mixedwood and coniferous boreal forest in Northwestern Quebec.Ecology 85, 1916–1932.
ergeron, Y., Cyr, D., Drever, C.R., Flannigan, M., Gauthier, S., Kneeshaw, D., Lauzon,E., Leduc, A., Le Goff, H., Lesieur, D., Logan, K., 2006. Past, current, and future firefrequencies in Quebec’s commercial forests: implications for the cumulativeeffects of harvesting and fire on age-class structure and natural disturbance-based management. Can. J. For. Res. 36, 2737–2744.
ergeron, Y., Cyr, D., Girardin, M.P., Carcaillet, C., 2010. Will climate change drive 21stcentury burn rates in Canadian boreal forest outside of its natural variability:collating global climate model experiments with sedimentary charcoal data.Int. J. Wildland Fire 19, 1127–1139.
ettinger, P., Boston, K., Siry, J.P., Grebner, D.L., 2009. Forest Management and Plan-ning. Academic Press, Burlington, MA.
orders, B.E., Harrison, W.M., Clutter, M.L., Shiver, B.D., Souter, R.A., 2008. The valueof timber inventory information for management planning. Can. J. For. Res. 38,2287–2294.
avis, L.S., Johnson, K.N., Bettinger, P.S., Howard, T.E., 2001. Forest Management: ToSustain Ecological, Economic, and Social Values, 4th ed. McGraw-Hill, New York.
idion, M., Fortin, M.-J., Fall, A., 2007. Forest age structure as indicator of boreal forestsustainability under alternative management and fire regimes: a landscape levelsensitivity analysis. Ecol. Model. 200, 45–58.
rew, T.J., Flewelling, J.W., 1979. Stand density management: an alterna-tive approach and its implication to Douglas-fir plantation. For. Sci. 25,518–532.
lannigan, M.D., Wotton, B.M., 2001. Climate, weather, and area burned. In: John-son, E.A., Miyanishi, K. (Eds.), Forest Fires. Academic Press Inc., New York, pp.351–373.
lannigan, M.D., Krawchuk, M.A., de Groot, W.J., Wotton, M., Gowman, L.M., 2009.Implications of changing climate for global wildland fire. Int. J. Wildland Fire 18,483–507.
lato, G.M., Boer, G.J., Lee, W.G., McFarlane, N.A., Ramden, D., Reader, M.C., Weaver,A.J., 2000. The Canadian Centre for Climate Modelling and Analysis global cou-pled model and its climate. Clim. Dyn. 16, 451–467.
irardin, M.P., Ali, A., Carcaillet, C., Mudelsee, M., Drobyshev, I., Hély, C., Bergeron, Y.,2009. Heterogeneous response of circumboreal wildfire risk to climate changesince the early 1900s. Global Change Biol. 15, 2751–2769.
ohnson, E.A., Gutsell, S.L., 1994. Fire frequency models, methods and interpreta-tions. Adv. Ecol. Res. 25, 239–283.
lemperer, W.D., 1996. Forest Resource Economics and Finance. McGraw Hill, NewYork.
e Goff, H., Girardin, M.-P., Flannigan, M.D., Bergeron, Y., 2008. Dendroclimatic infer-
ence of wildfire activity in Quebec over the 20th century and implications fornatural disturbance-based forest management. Int. J. Wildland Fire 17, 348–362.e Goff, H., Flannigan, M.D., Bergeron, Y., 2009. Potential change in monthly fire riskin the eastern Canadian boreal forest under future climate change. Can. J. For.Res. 39, 2369–2380.
ators 24 (2013) 451–461 461
Légaré, S., 2009. Portrait de la forêt pré-industrielle. Tembec, Gestion des ressourcesforestières, Québec.
Liu, C., Ruel, J.-C., Zhang, S.Y., 2007. Immediate impacts of partial cutting strategieson stand characteristics and value. For. Ecol. Manage. 250, 148–155.
Manley, B., 2007. Discount rates used for forest valuation – results of 2007 survey.N. Z. J. For. 52, 21–27.
Ministère des Ressources Naturelles, de la Faune et des Parcs, 2003. Manueld’aménagement forestier, 4ème édition. Dir. Prog. For., Min. Ress. Nat. FauneParcs, Gouv. Québec, Québec.
Monserud, R.A., 1984. Height growth and site index curves for inland Douglas-firbased on stem analysis data and forest habitat type. For. Sci. 30, 943–965.
Montreal Process, 1995. Criteria and Indicators for the Conservation and SustainableManagement of Temperate and Boreal Forests. Canadian Forest Service, Hull,Quebec, 27 p.
Moore, M.A., Boardman, A.E., Vining, A.R., Weiner, D.L., Greenberg, D.H., 2004. “Justgive me a number!” Practical values for the social discount rate. J. Pol. Anal.Manage. 23, 789–812.
Pan, Y., Birdsey, R.A., Fang, J., Houghton, R., Kauppi, P.E., Kurz, W.A., Phillips, O.L., Shv-idenko, A., Lewis, S.L., Canadell, J.G., Ciais, P., Jackson, R.B., Pacala, S.W., McGuire,A.D., Piao, S., Rautiainen, A., Sitch, S., Hayes, D., 2011. A large and persistentcarbon sink in the World’s forests. Science 333, 988–993.
Paquette, A., Messier, C., 2011. The effect of biodiversity on tree productivity: fromtemperate to boreal forests. Global Ecol. Biogeogr. 20, 170–180.
Parisien, M.-A., Parks, S.A., Krawchuk, M.A., Flannigan, M.D., Bowman, L.M., Moritz,M.A., 2011. Scale-dependent controls on the area burned in the boreal forest ofCanada, 1980–2005. Ecol. Appl. 21, 789–805.
Patt, A.G., Schrag, D.P., 2003. Using specific language to describe risk and probability.Clim. Change 61, 17–30.
Payette, S., Rochefort, L., 2001. Écologie des tourbières du Québec-Labrador. Lespresses de l’Université Laval, Québec, QC, Canada.
Perron, N., 1986. Peut-on et doit-on s’inspirer de la variabilité naturelle des feux pourélaborer une stratégie écosystémique de repartition des coupes à l’échelle dupaysage? Le cas de la pessière noire à mousses de l’Ouest au Lac-Saint-Jean. PhDdissertation. Faculté de Foresterie et de Géomatique, Université Laval, Québec,QC, Canada.
Peter, B., Nelson, J., 2005. Estimating harvest schedules and profitability under therisk of fire disturbance. Can. J. For. Res. 35, 1378–1388.
Pothier, D., Savard, F., 1998. Actualisation des tables de production pour les prin-cipales espèces forestières du Québec. Ministère des Ressources naturelles,Gouvernement du Québec, Québec, QC, Canada.
Reed, W.J., Errico, D., 1986. Optimal harvest scheduling at the forest level in thepresence of the risk of fire. Can. J. For. Res. 16, 266–278.
Robitaille, A., Saucier, J.-P., 1998. Paysages Régionaux du Québec Méridional. LesPublications du Québec, Sainte-Foy, QC, Canada.
Savage, D.W., Martell, D.L., Wotton, M.B., 2010. Evaluation of two risk mitigationstrategies for dealing with fire-related uncertainty in timber supply modelling.Can. J. For. Res. 40, 1136–1154.
Shaw, J.D., Long, J.N., 2007. A density management diagram for longleaf pine standswith application to red-cockaded woodpecker habitat. South. J. Appl. For. 31,28–38.
Simard, M., Bernier, P.Y., Bergeron, Y., Paré, D., Guérine, L., 2009. Paludificationdynamics in the boreal forest of the James Bay Lowlands: effect of time sincefire and topography. Can. J. For. Res. 39, 546–552.
Van Wagner, C.E., 1983. Simulating the effect of forest fire on long-term annualtimber supply. Can. J. For. Res. 13, 451–457.
way. Quat. Sci. Rev. 13, 945–971.Westerling, A.L., Hidalgo, H.G., Cayan, D.R., Swetnam, T.W., 2006. Warming and ear-
lier spring increase western US forest wildfire activity. Science 313, 940–943,http://dx.doi.org/10.1126/SCIENCE.1128834.


