Embed Size (px)
Citation preview
INVENTORY MANAGEMENT
Outline
Elements of InventoryManagement
Inventory and Supply ChainManagement
Inventory Control Systems
Economic Order Quantity Models
Reorder Point
Classification of Inventories: ABC,VED
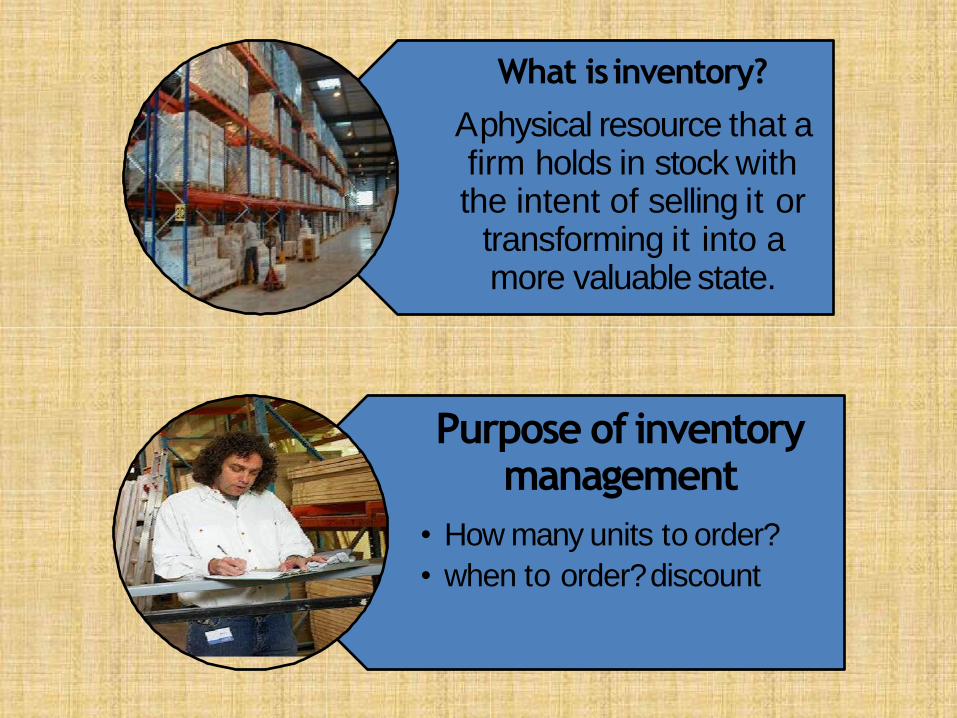
What is inventory?
A physical resource that a firm holds in stock with the intent of selling it or
transforming it into a more valuable state.
Purpose of inventory management
• How many units to order?
• when to order?discount
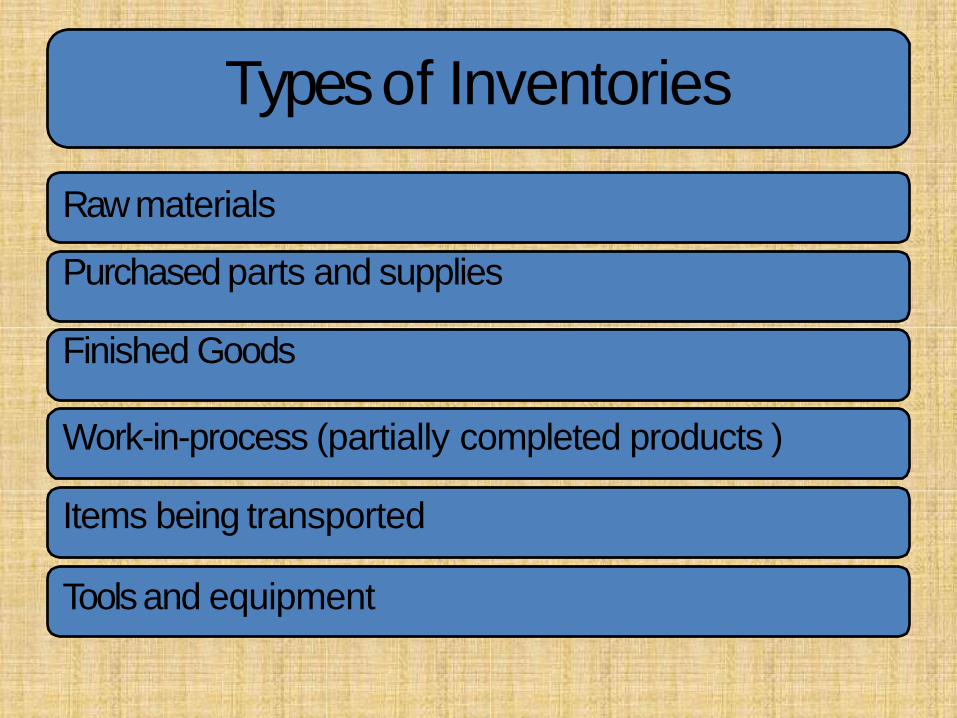
Types of Inventories
Rawmaterials
Purchased parts and supplies
Finished Goods
Work-in-process (partially completed products )
Items being transported
Tools and equipment
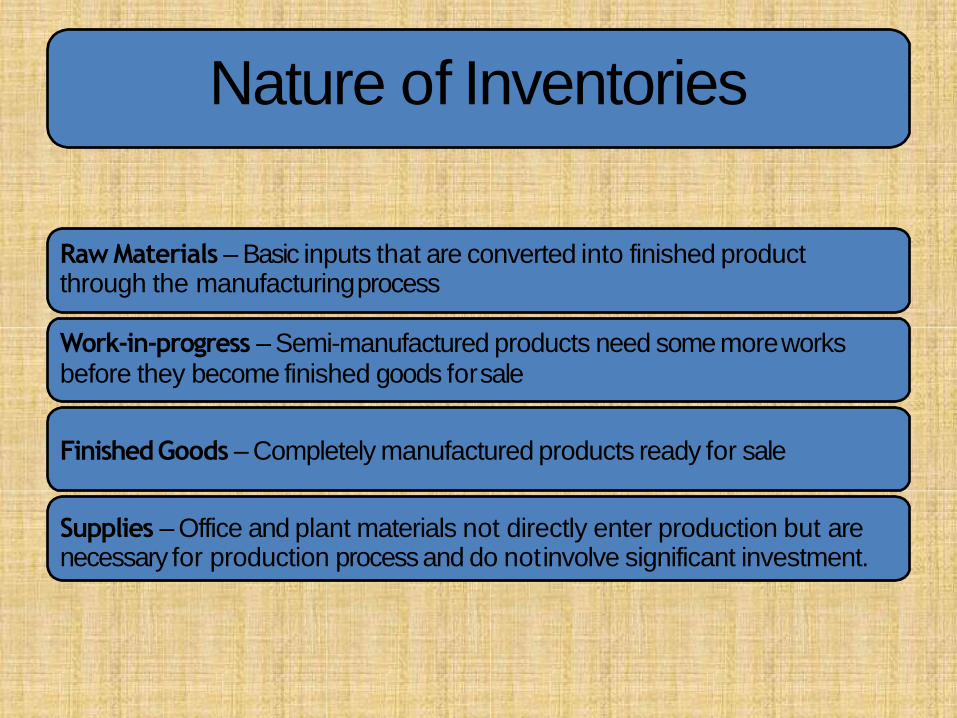
Nature of Inventories
Raw Materials –Basic inputs that are converted into finished product through the manufacturingprocess
Work-in-progress –Semi-manufactured products need some moreworksbefore they become finished goods forsale
FinishedGoods –Completely manufactured products ready for sale
Supplies –Office and plant materials not directly enter production but are necessary for production process and do notinvolve significant investment.
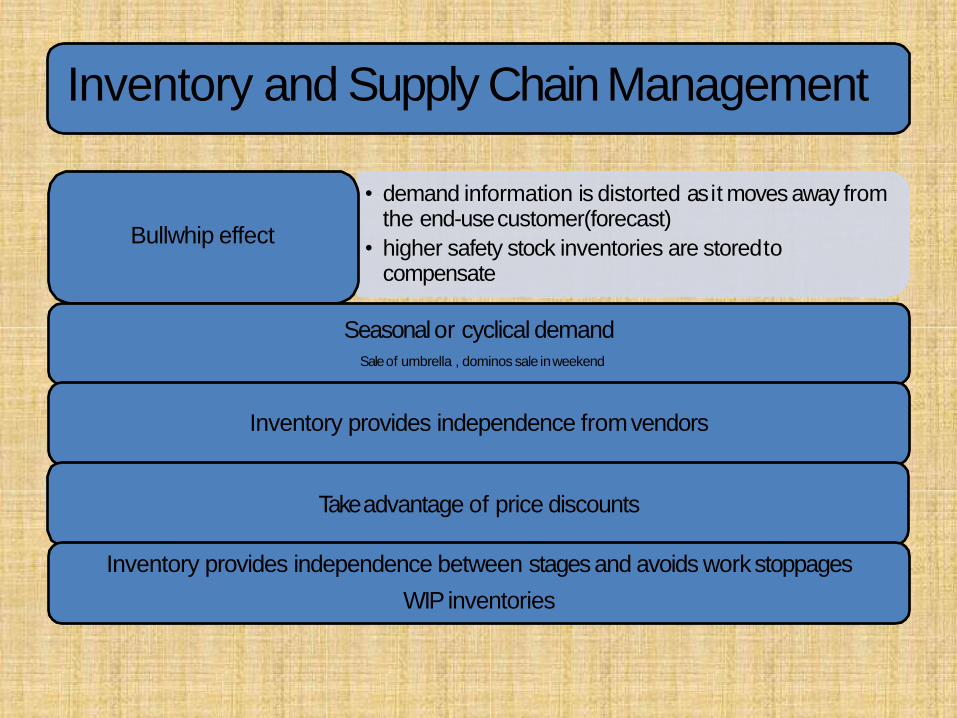
Inventory and Supply ChainManagement
• demand information is distorted as it moves away from the end-usecustomer(forecast)
• higher safety stock inventories are storedto compensate
Bullwhip effect
Seasonal or cyclical demand
Sale of umbrella , dominos sale inweekend
Inventory provides independence fromvendors
Take advantage of price discounts
Inventory provides independence between stages and avoids workstoppages
WIP inventories
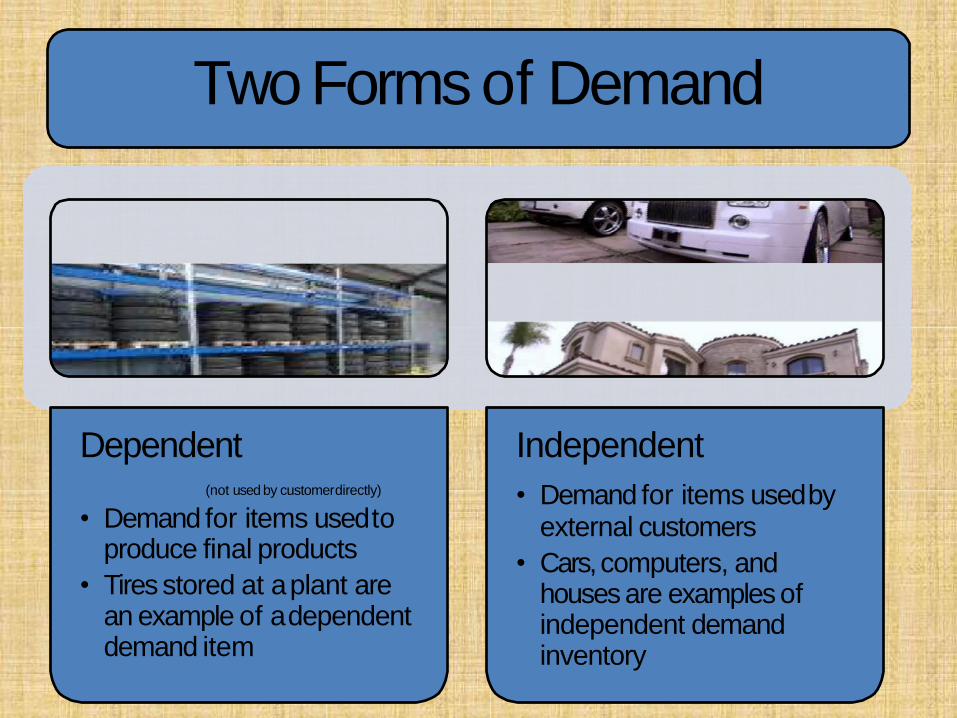
Two Forms of Demand
Dependent(not used by customerdirectly)
• Demand for items usedto produce final products
• Tires stored at a plant are an example of adependent demand item
Independent
• Demand for items usedbyexternal customers
• Cars, computers, and houses are examples of independent demand inventory
Inventory and Quality Management
Customers usually perceive quality serviceas availability of goods when they wantthem
Inventory must be sufficient to providehigh-quality customer service
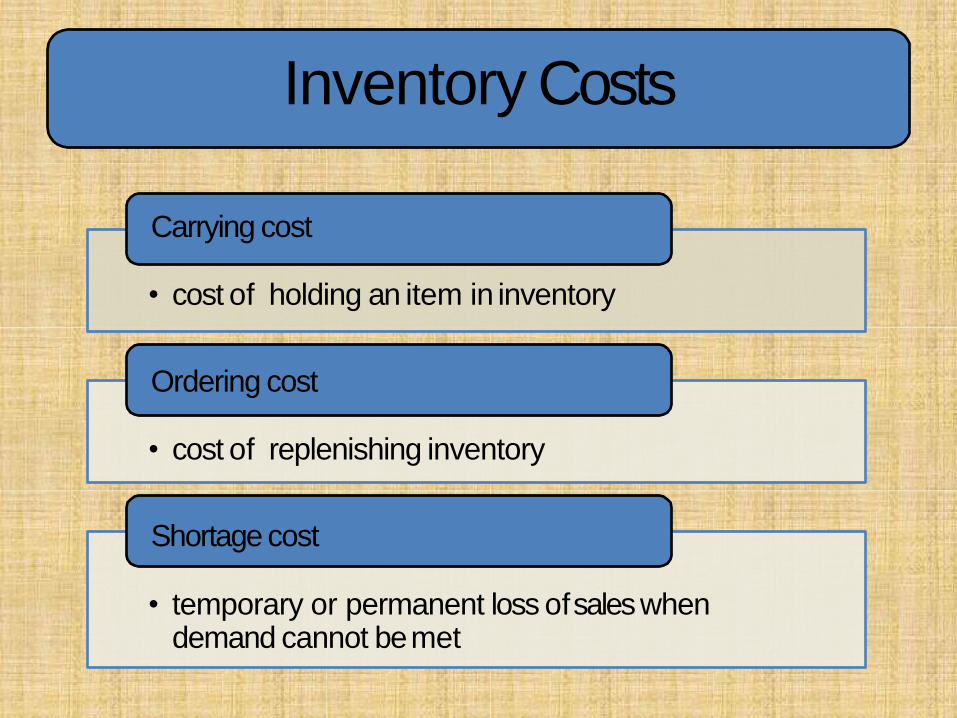
Inventory Costs
Carrying cost
• cost of holding an item in inventory
Ordering cost
• cost of replenishing inventory
Shortage cost
• temporary or permanent loss ofsales when demand cannot bemet
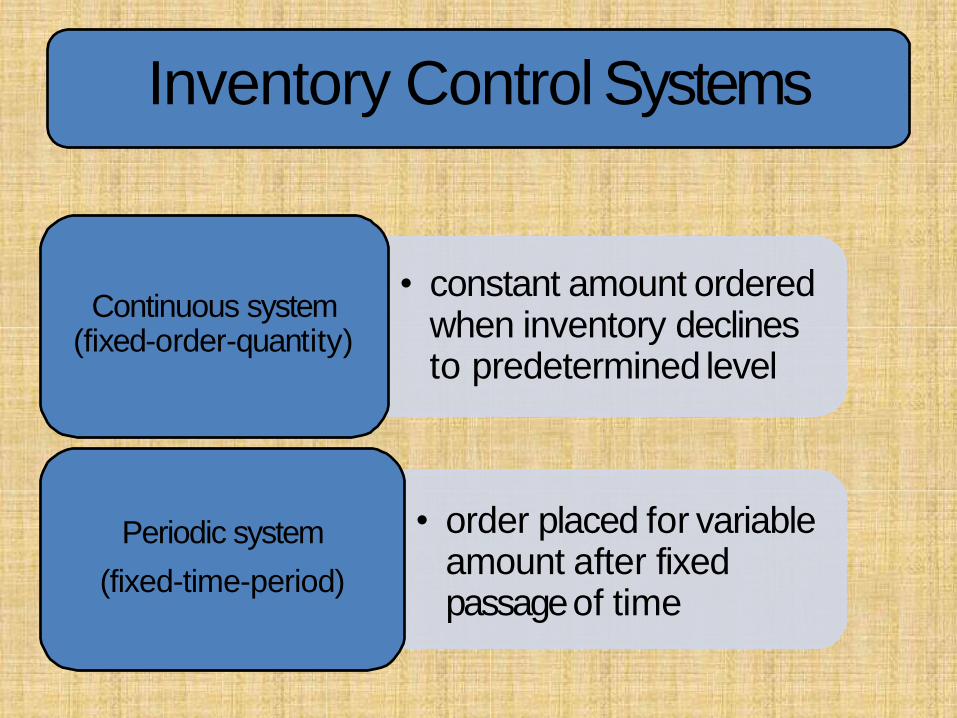
Inventory Control Systems
Continuous system (fixed-order-quantity)
• constant amount ordered when inventory declines to predetermined level
• order placed for variable amount after fixed passage of time
Periodic system
(fixed-time-period)
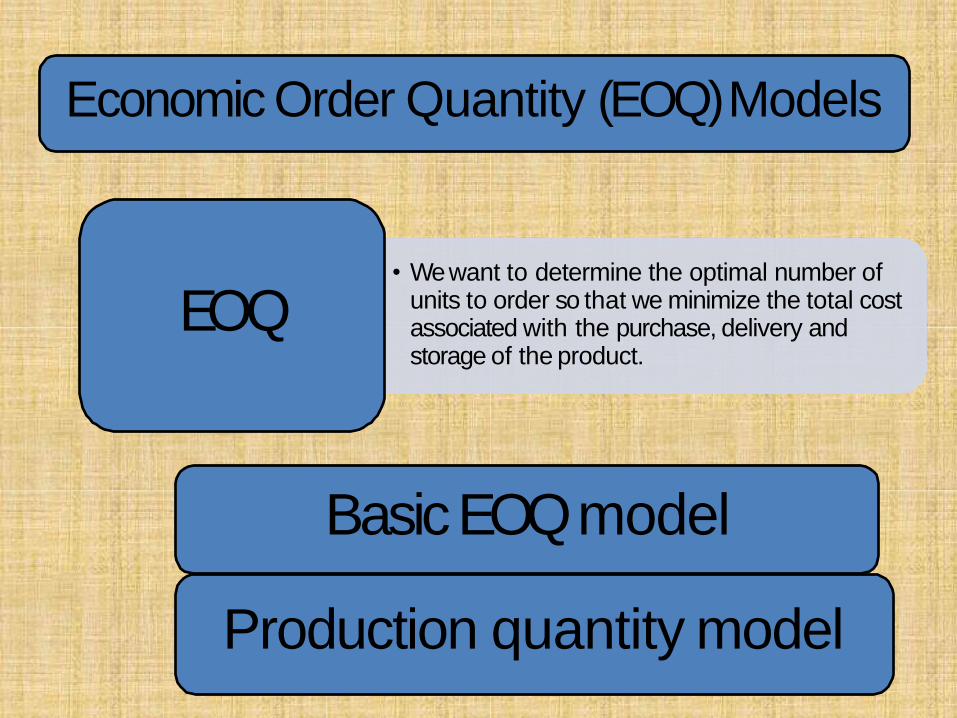
Economic Order Quantity (EOQ)Models
• We want to determine the optimal number of units to order so that we minimize the total cost associated with the purchase, delivery and storage of the product.
EOQ
Basic EOQmodel
Production quantity model
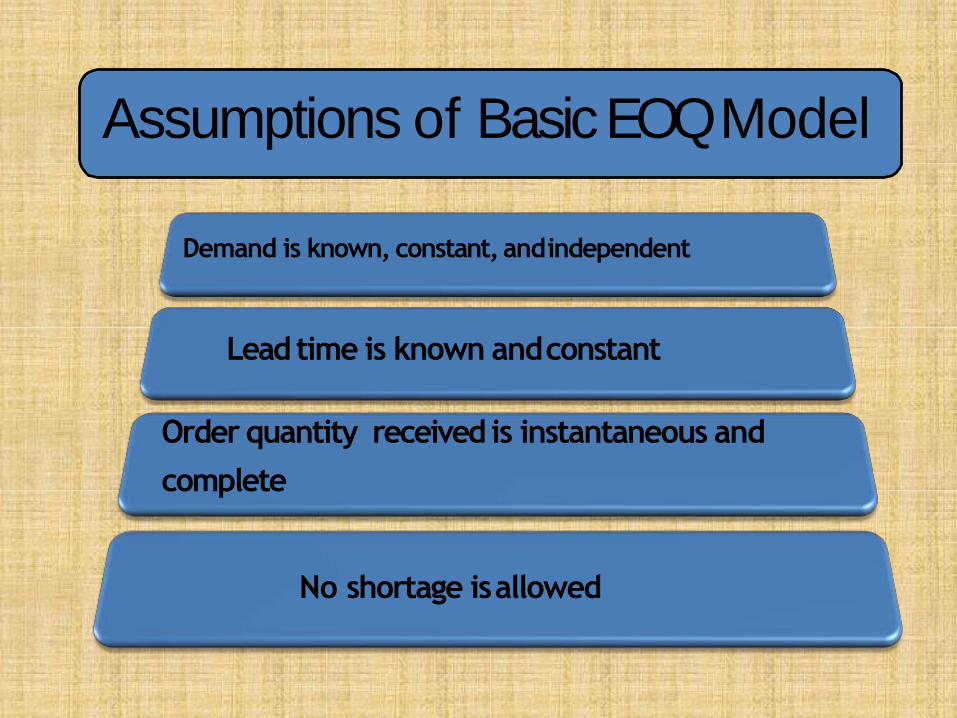
Assumptions of Basic EOQModel
Demand is known, constant, andindependent
Lead time is known andconstant
Order quantity received is instantaneous and
complete
No shortage isallowed
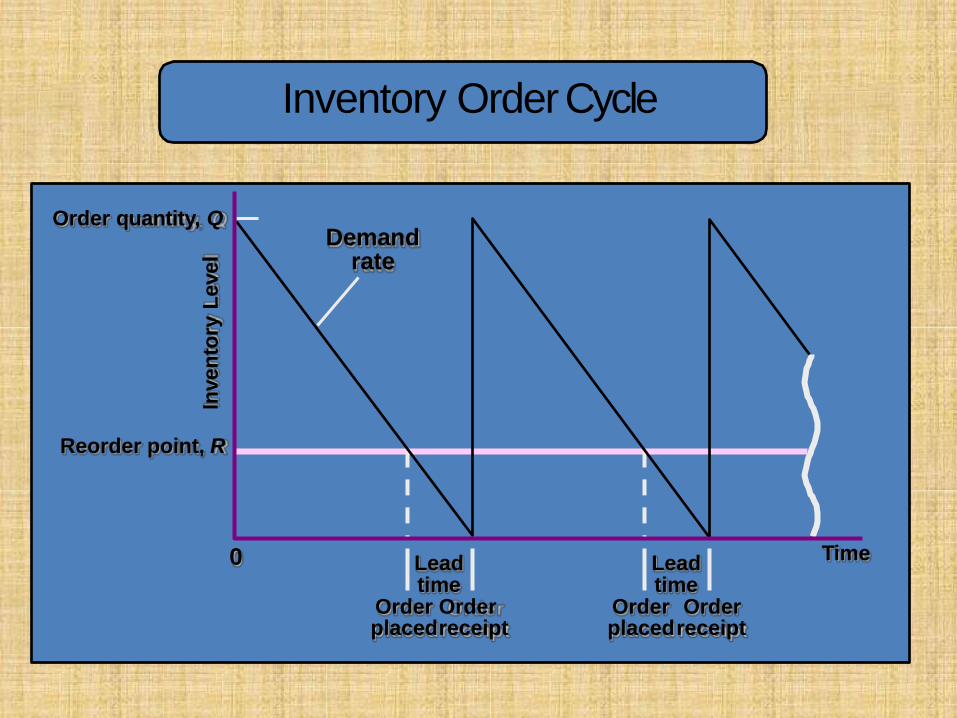
Inventory OrderCycle
Demand rate
TimeLeadtime
Leadtime
Order Order placedreceipt
Order Order placedreceipt
Inven
tory
Level
Reorder point, R
Order quantity, Q
0
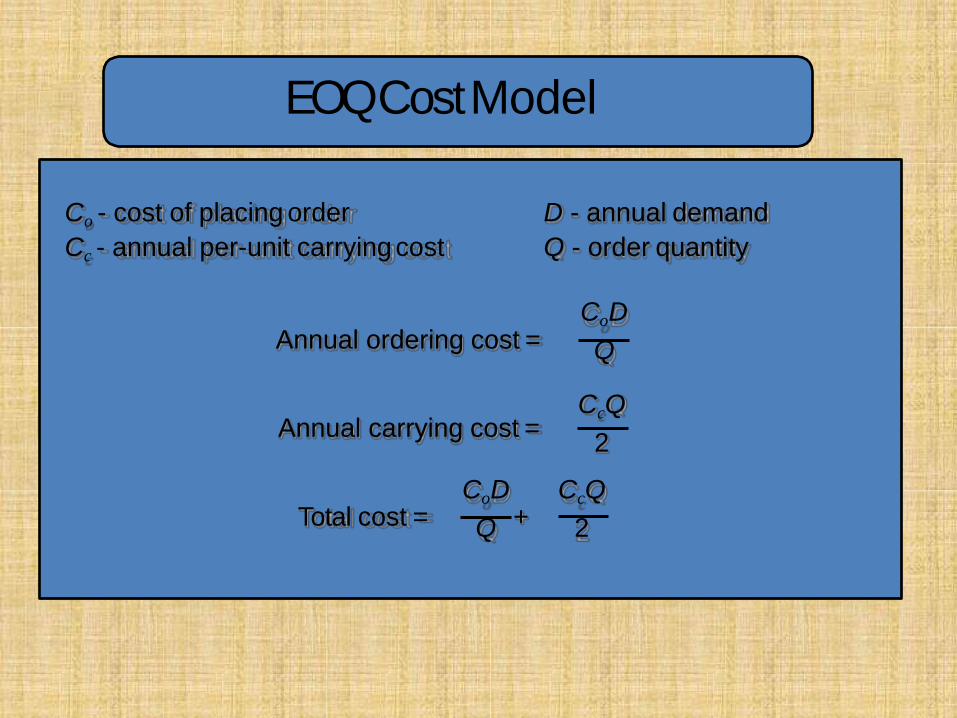
EOQ CostModel
Co - cost of placing order
Cc - annual per-unit carrying cost
D - annual demand
Q - order quantity
Annual ordering cost =
Annual carrying cost =
Total cost =
CoD
Q
CcQ
2
CoD CcQ
Q + 2
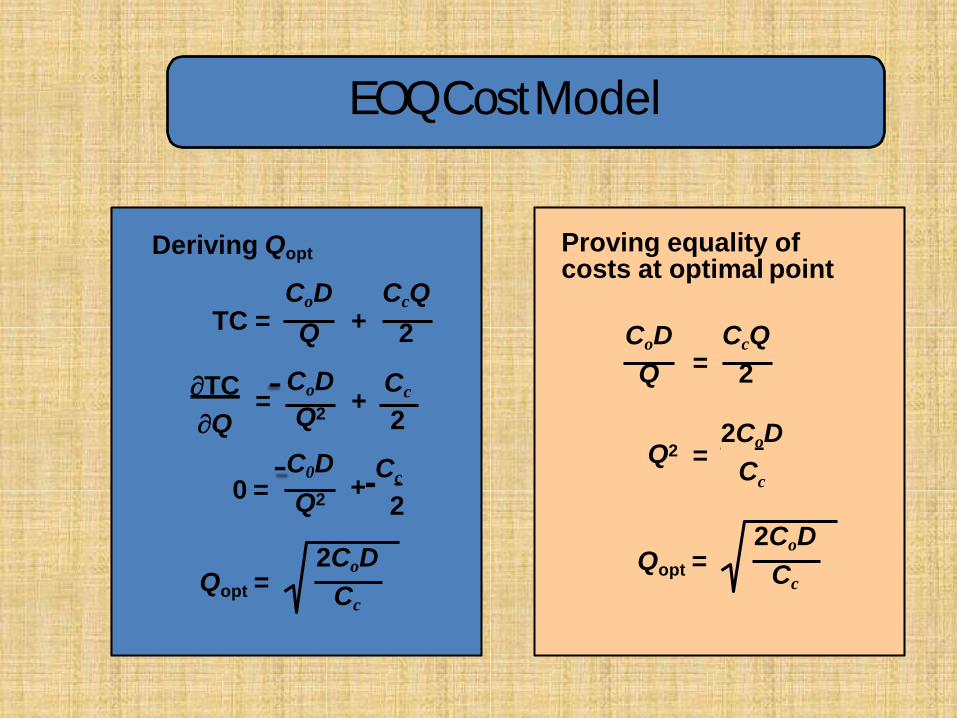
EOQ CostModel
Q2 2Q
0 = +Cc
2
Qopt =2CoD
Cc
Proving equality of costs at optimal point
=CoD CcQ
Q 2
Q2 =2CoD
Cc
Qopt =2CoD
Cc
Deriving Qopt
CoD CcQTC = Q + 2
TC=-CoD
+Cc
-C0D
Q2
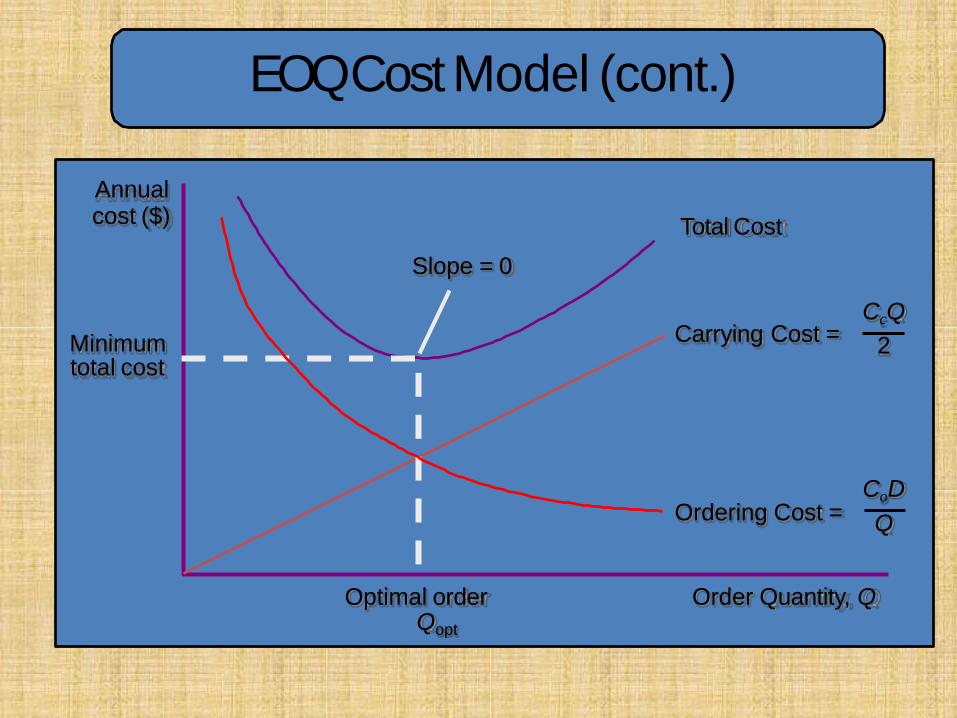
EOQ Cost Model (cont.)
Order Quantity, Q
Annualcost ($) Total Cost
Carrying Cost =CcQ
2
Slope = 0
Minimum total cost
Optimal orderQopt
Ordering Cost =CoD
Q
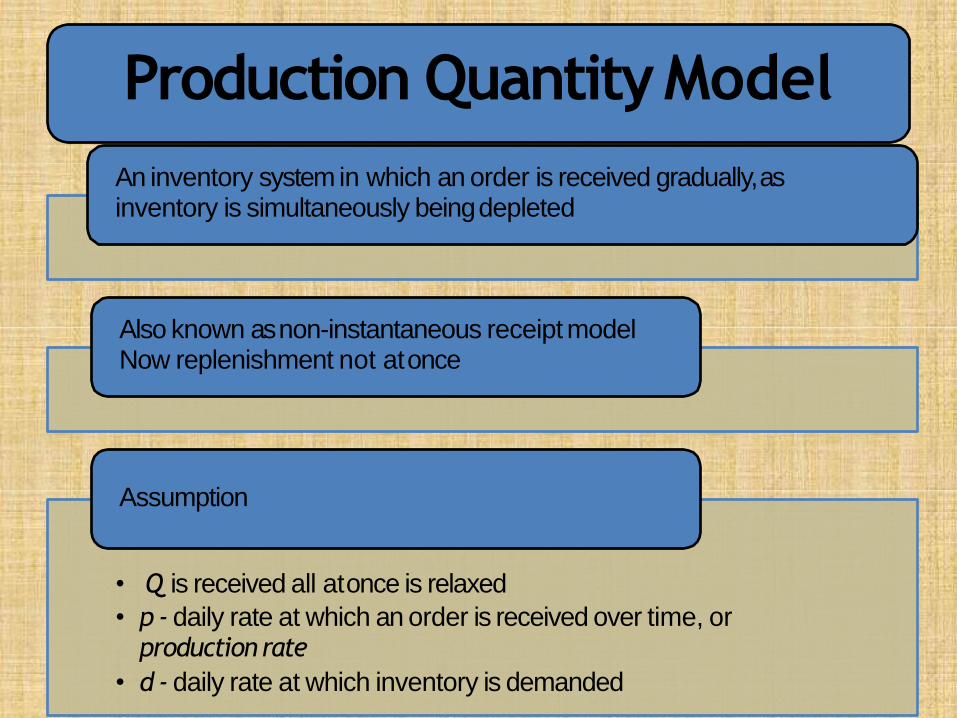
Production QuantityModel
An inventory system in which an order is received gradually,asinventory is simultaneously beingdepleted
Also known as non-instantaneous receipt modelNow replenishment not atonce
Assumption
• Q is received all atonce is relaxed
• p - daily rate at which an order is received over time, orproduction rate
• d - daily rate at which inventory is demanded
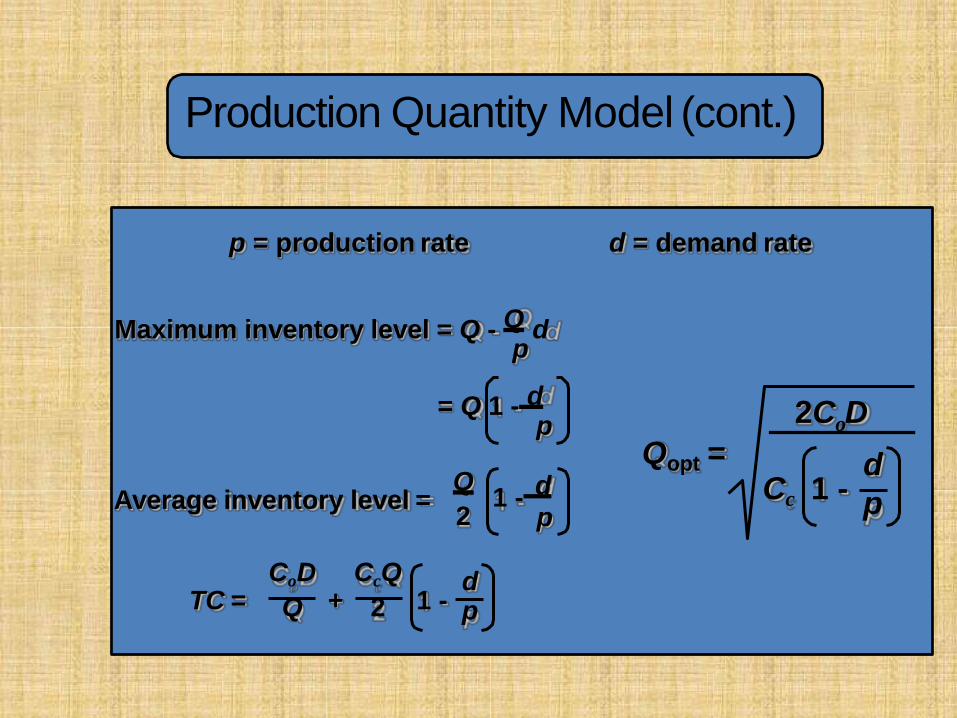
Production Quantity Model (cont.)
p = production rate d = demand rate
Maximum inventory level = Q - Q dp
= Q 1 - dp
Average inventory level =Q
21 - d
p
TC = +d
1 - p
CoD CcQ
Q 2
Qopt =o2C D
dCc 1 - p
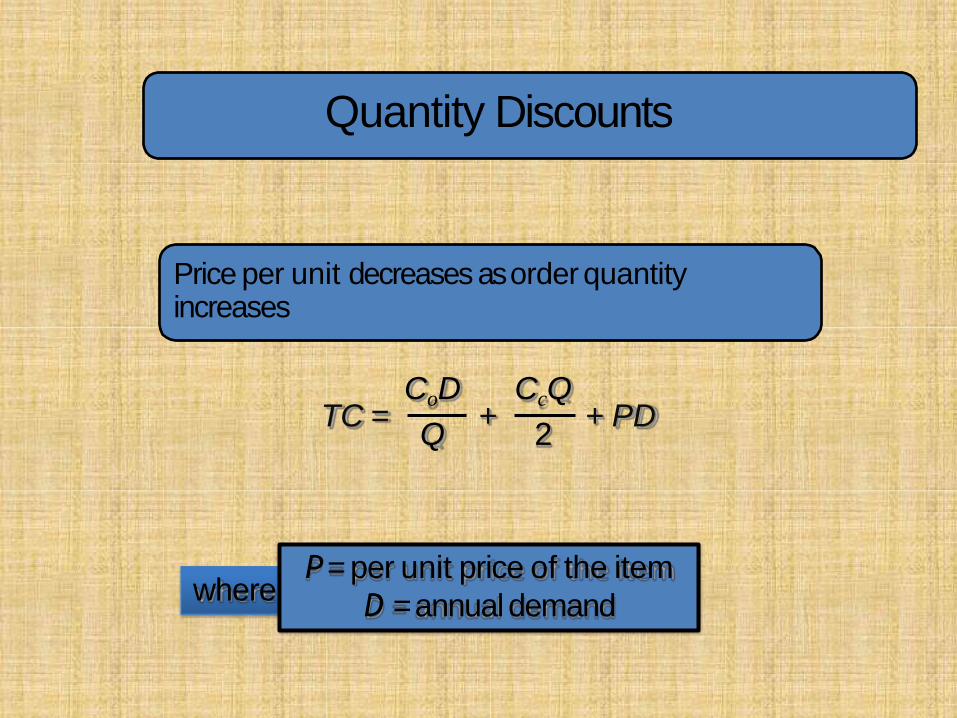
Quantity Discounts
TC = + + PD
Price per unit decreases as order quantity increases
CoD CcQ
Q 2
whereP =per unit price of the item
D = annualdemand
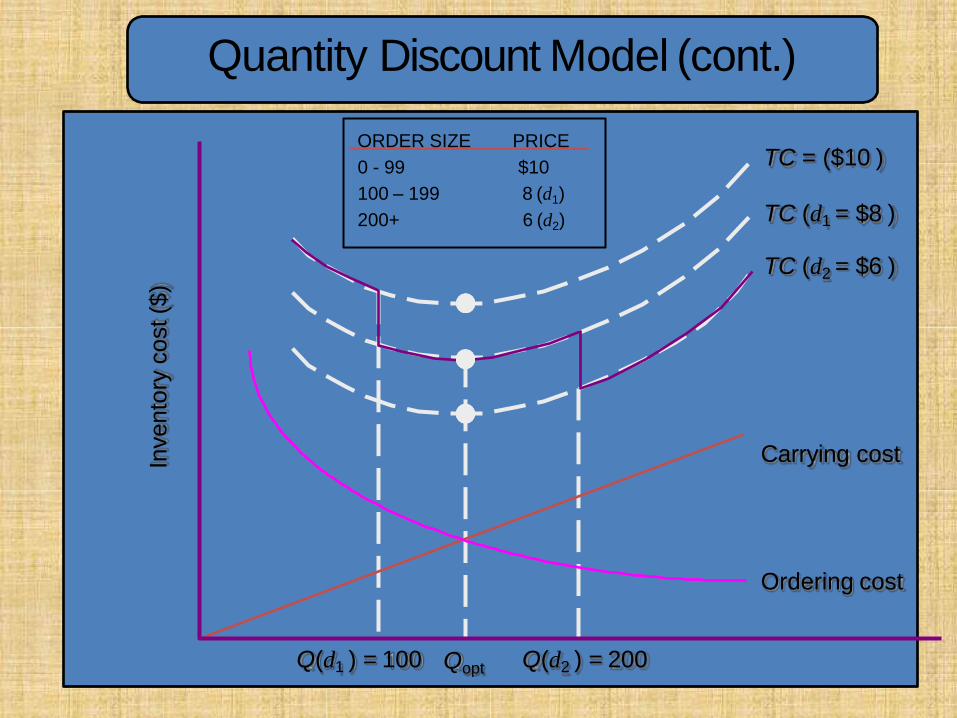
Quantity Discount Model (cont.)
Qopt
Carrying cost
Ordering cost
Invento
ry c
ost($
)
Q(d1 ) = 100 Q(d2 ) = 200
TC (d1 = $8 )
TC (d2 = $6 )
TC = ($10 )ORDER SIZE PRICE
0 - 99 $10
100 – 199 8 (d1)
200+ 6 (d2)
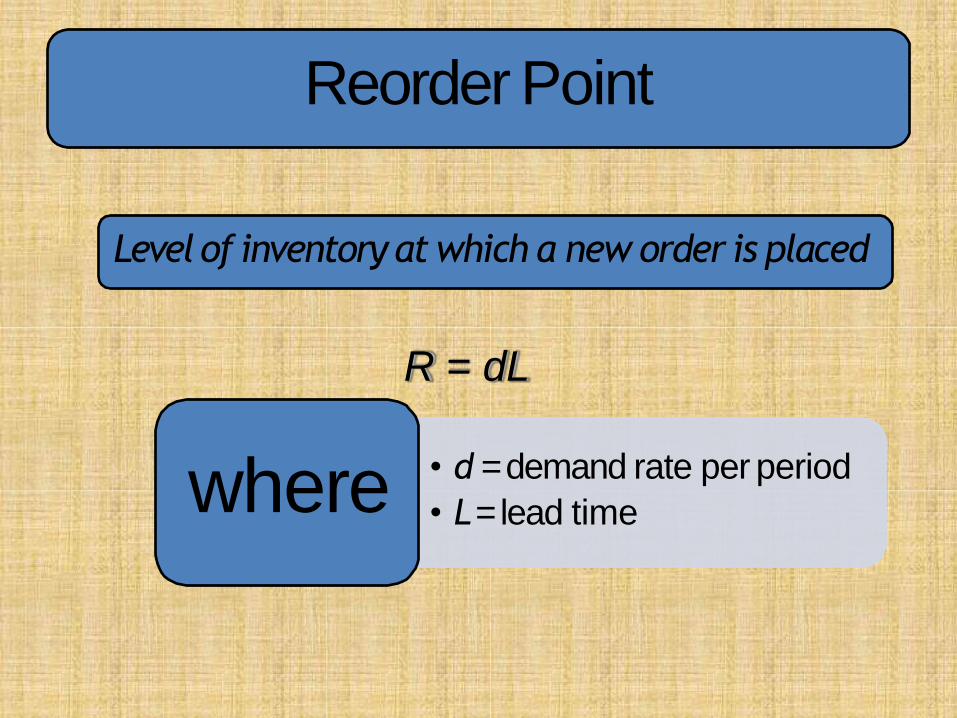
Reorder Point
Levelof inventory at which a new order is placed
R = dL
• d = demand rate per period
• L = lead timewhere
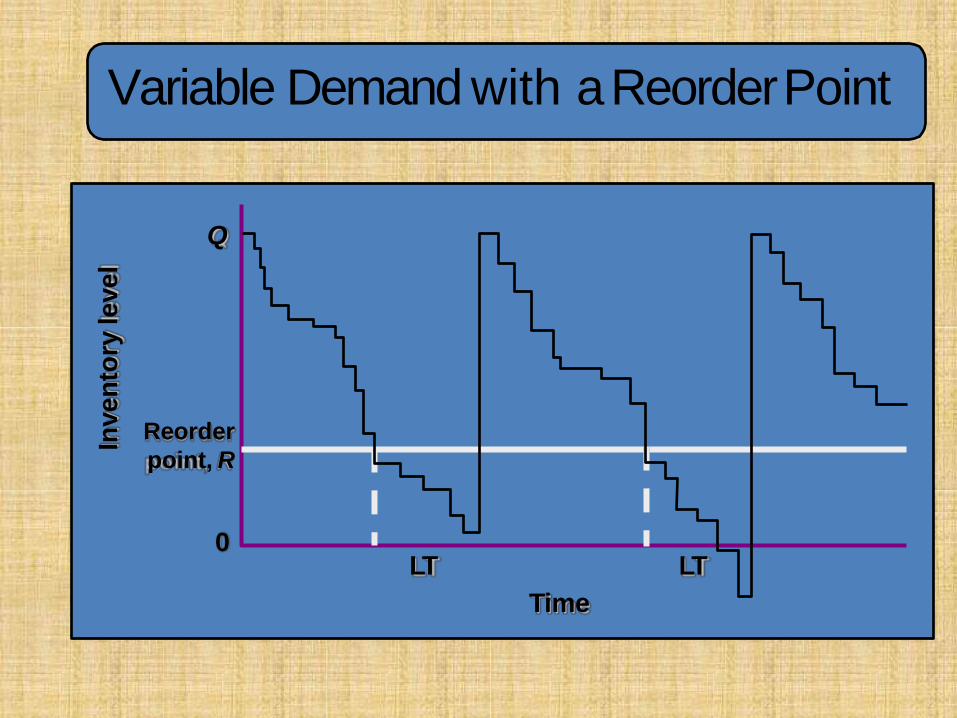
Variable Demand with a ReorderPoint
Q
LT
Time
LT
Inve
nto
ryle
ve
l
Reorder
point, R
0
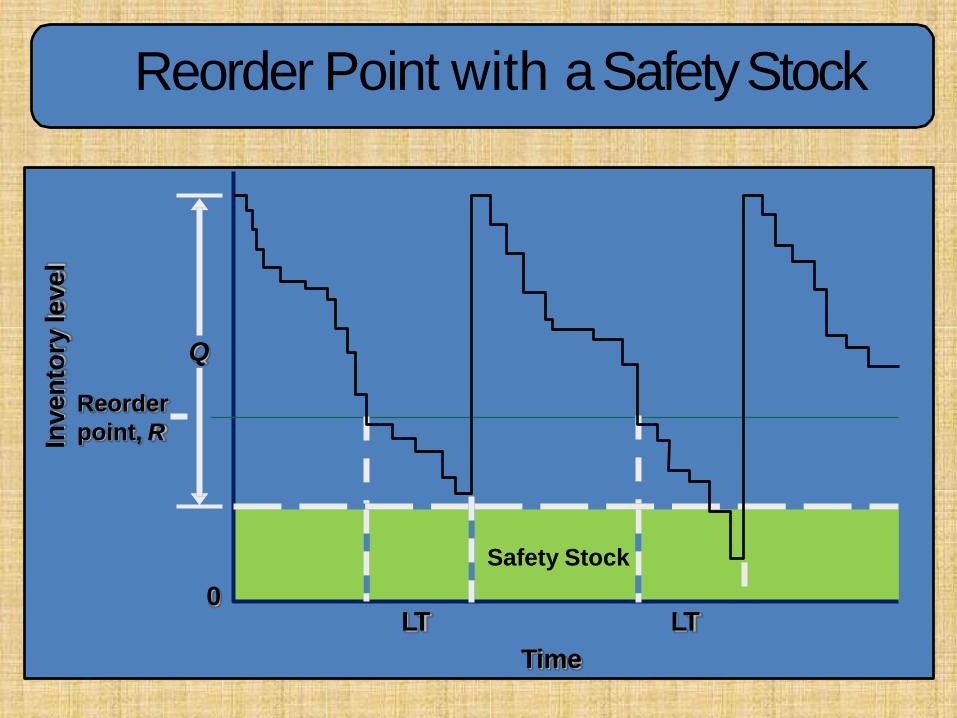
Reorder Point with a SafetyStock
Q
Reorder
point, R
LT
Time
LT
Inve
nto
ryle
ve
l
0
Safety Stock
Classifying Inventory Items
ABC Classification (ParetoPrinciple)
In any Retail organization there are large numbers of inventories to be maintained. It is not practical to have very stringent inventory control system for each &every item. So with the modus of having an effectivePurchase & stores control we implement ABCInventory
Classification model Known as Always Better Control (ABC) based upon Pareto rule ( 80/20 rule)
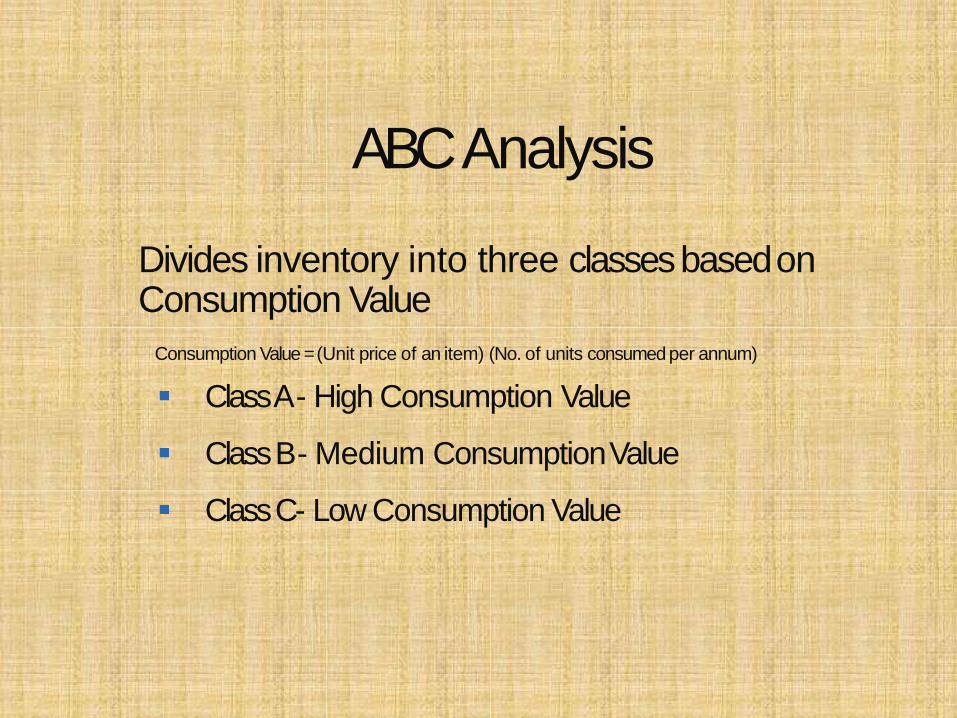
ABCAnalysis
Divides inventory into three classes basedon Consumption Value
Consumption Value = (Unit price of an item) (No. of units consumed per annum)
▪ Class A - High Consumption Value
▪ Class B - Medium ConsumptionValue
▪ Class C - Low Consumption Value
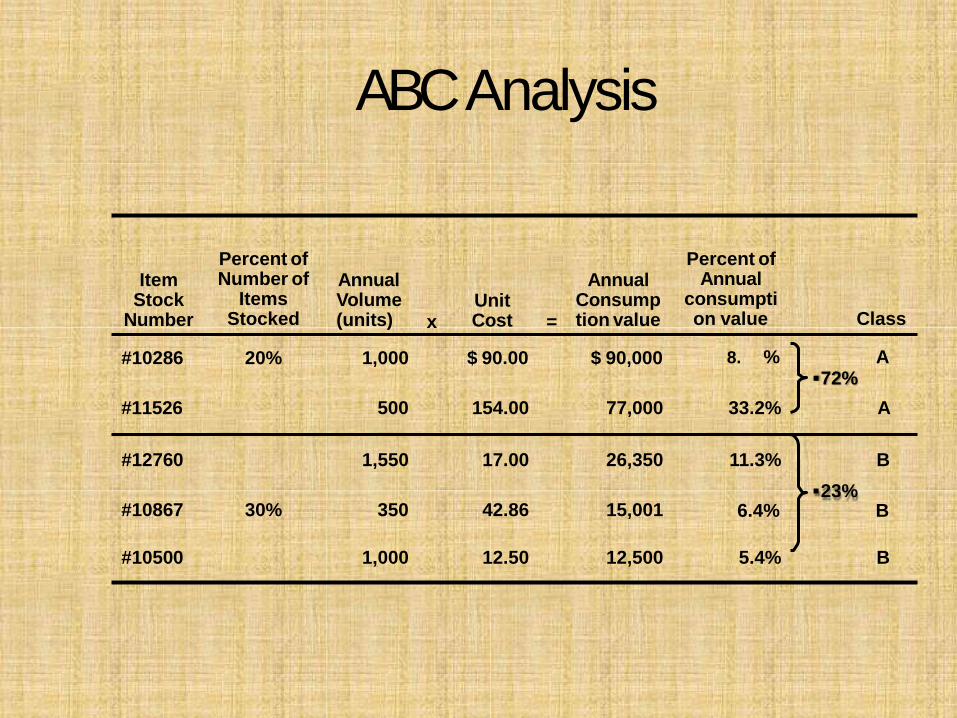
ABCAnalysis
Item Stock
Number
Percent of Number of
Items Stocked
AnnualVolume(units) x
Unit Cost =
Annual Consump tion value
Percent of Annual
consumption value Class
#10286 20% 1,000 $ 90.00 $ 90,000 8. % A▪72%
#11526 500 154.00 77,000 33.2% A
#12760 1,550 17.00 26,350 11.3% B
#10867 30% 350 42.86 15,001▪23%
6.4% B
#10500 1,000 12.50 12,500 5.4% B
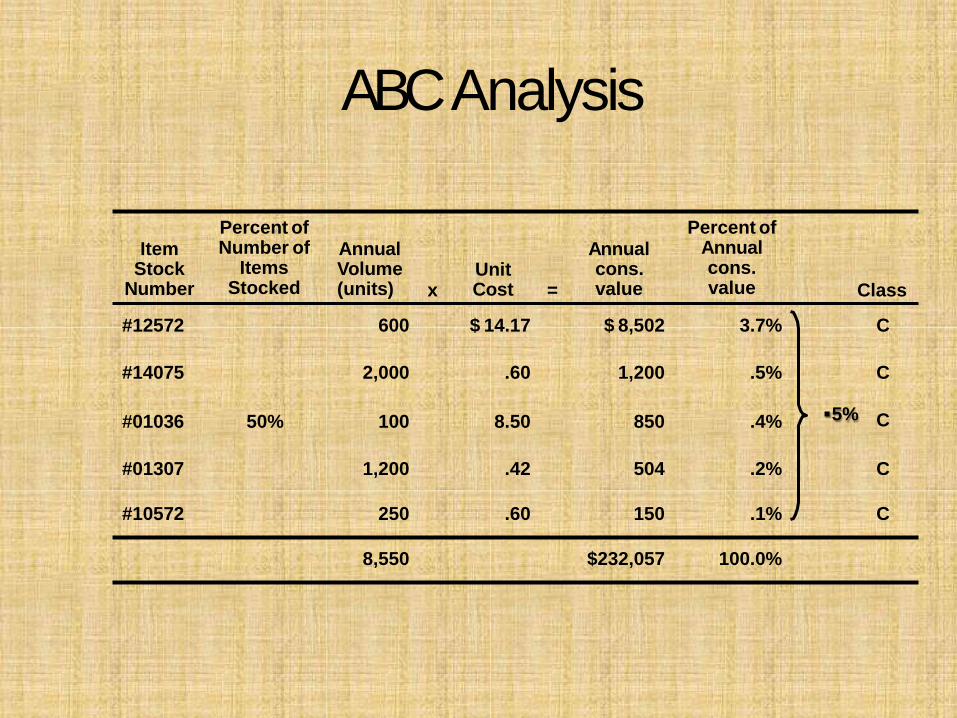
ABCAnalysis
Item Stock
Number
Percent of Number of
Items Stocked
AnnualVolume(units) x
Unit Cost =
Annual cons. value
Percent of Annual cons. value Class
#12572 600 $ 14.17 $ 8,502 3.7% C
#14075 2,000 .60 1,200 .5% C
#01036 50% 100 8.50 850 .4% ▪5% C
#01307 1,200 .42 504 .2% C
#10572 250 .60 150 .1% C
8,550 $232,057 100.0%
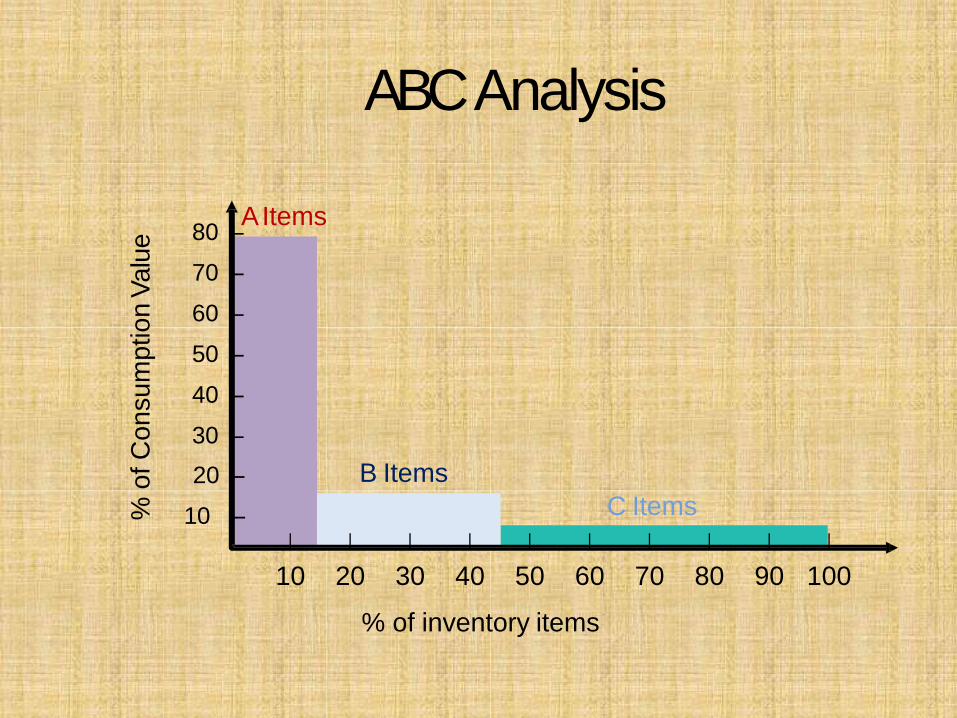
C Items
ABCAnalysis
AItems
B Items
% o
f C
on
su
mp
tio
nV
alu
e 80 –
70 –
60 –
50 –
40 –
30 –
20 –
10 –| | | | || | | | |
10 20 30 40 50 60 70 80 90 100
% of inventory items
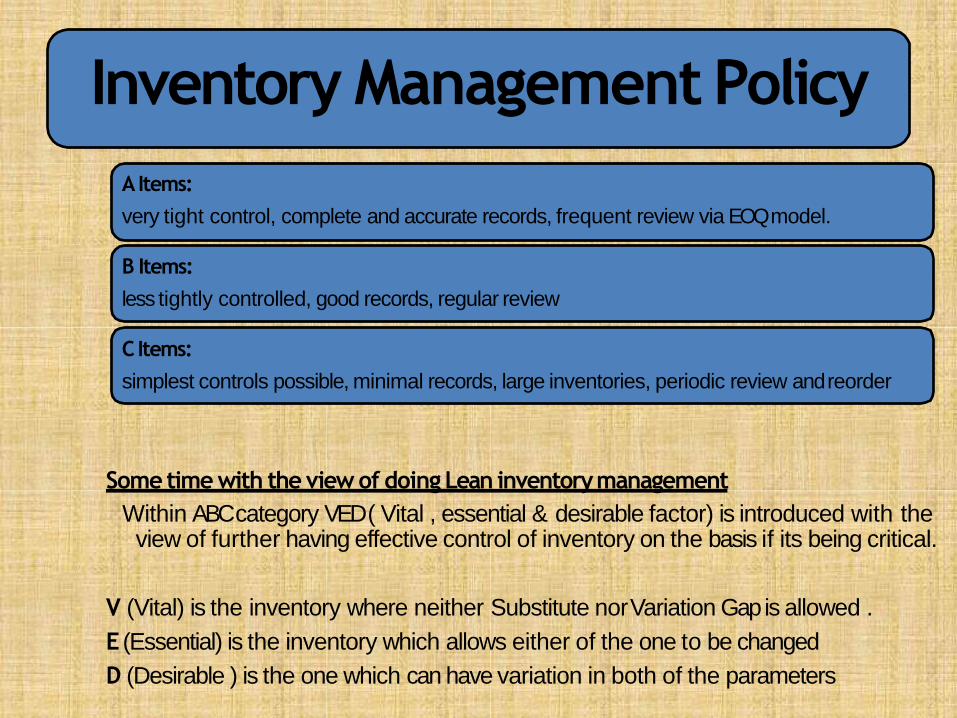
Inventory Management Policy
AItems:
very tight control, complete and accurate records, frequent review via EOQmodel.
B Items:
less tightly controlled, good records, regular review
C Items:
simplest controls possible, minimal records, large inventories, periodic review andreorder
Some time with the view of doing Lean inventorymanagement
Within ABC category VED ( Vital , essential & desirable factor) is introduced with the view of further having effective control of inventory on the basis if its being critical.
V (Vital) is the inventory where neither Substitute norVariation Gap is allowed .
E (Essential) is the inventory which allows either of the one to be changed
D (Desirable ) is the one which can have variation in both of the parameters
References:
• Cox, James F., III, and John H. Blackstone, Jr. APICS Dictionary.
9th ed. Falls Church VA: American Production and Inventory
Control Society,1998.
• Anupindi, Ravi, et al. Managing Business Process Flows:
Principles of Operations Management. 2nd ed. UpperSaddle
River, NJ: Pearson Prentice Hall, 2004.
• Meredith, Jack R., and Scott M. Shafer. Operations
Management for MBAs. 2nd ed. New York: John Wiley &Sons
Inc., 2002.
• Stevenson, William J. Production/Operations
Management. 8th ed. Boston: Irwin/McGraw-Hill,2005.

Thank You


