Embed Size (px)
Citation preview

1
Investigating the relationships between internal integration and external integration and their impact on combinative competitive capabilities
Suntichai Kotcharin, Steve Eldridge and James Freeman
Manchester Business School, University of Manchester,
Booth Street West, Manchester, M15 6PB, UK [email protected], [email protected], [email protected]
Abstract
This paper examines the interaction of internal integration and external integration and investigates the causal impact of their relationship on competitive capabilities in automotive suppliers in Thailand. In addition, a hybrid model for competitive capabilities is tested to confirm the configuration of competitive capabilities through external integration. An empirical study was carried out and structural equation modelling was employed to analyse the theoretical model. Internal integration was found to have a positive relationship with external integration. In particular, supplier integration requires a high level of internal integration in order to transform internal resources and build the firm’s capabilities. A high level of product quality achieved through internal and external integration leads to an enhanced delivery capability. Also, the findings suggest that low cost and flexibility capabilities are developed in parallel and do not follow a cumulative pattern. The study provides insight into the practices of supply chain integration in an emerging economy in which the outcomes may be different from other more developed countries. In addition, the study responds to the calls in the literature to investigate further the little studied interactions between the constructs of internal and external integration and provides further empirical evidence of the cumulative model of competitive capabilities. Keywords: Internal integration, external integration, cumulative competitive capabilities
1. Introduction Researchers have suggested that firms which collaborate with other firms or built inter firm relationship with others could be more competitive than those which do not (Johnston and Lawrence, 1988; Takeishi, 2001). This has led to a growing number of empirical studies devoted to the direct and indirect effects of supply chain integration on competitive capabilities and firm performance (Rosenzweig et al., 2003). Supply chain integration has previously been considered as a single dimension (Cousins and Menguc, 2006) and few researchers have paid attention to the interaction between the constructs that comprise supply chain integration, namely: internal integration, customer integration and supplier integration (Zhao et al., 2011). These latter two constructs are also known together as external integration (Zhao et al., 2011). Furthermore, studies which test the effect of supply chain integration on the competitive capabilities of product quality, delivery, process flexibility and cost report that supply chain integration can improve each individual competitive capability (Wong et al., 2011). However, testing of these effects in the context of a cumulative model of competitive capabilities (Nakane, 1986) remains a research opportunity. Building on these existing studies and these opportunities, the objectives of our study were to analyse the relationship between internal integration and external integration and then investigate how levels of internal and external integration affect combinations of competitive capabilities. Finally, our study would then test a cumulative model of competitive capability to identify an appropriate sequence of competitive capability development in Thailand’s automotive industry. We selected the automotive industry because this sector is well researched and the concepts such as supply chain integration and competitive capabilities are widely adopted in this industry (Lockstrom et al., 2010). Prior studies indicate that Thailand’s

2
automotive industry has well implemented supply chain integration strategies (Wong et al., 2011) and is an appropriate context for our study. The study is described below beginning with the theoretical background and the development of the research model and hypotheses. The research methodology is described next prior to the presentation of the findings and analyses. These are discussed and managerial implications identified. The paper concludes with a review of the limitations of the study and recommendations for further research are provided.
2. Theoretical background In this section, we outline the theoretical perspective adopted for the study and then describe the constructs that were used as a basis for the subsequent development of our conceptual model and hypotheses. 2.1 Internal integration. Internal integration is the degree to which a firm can structure its organizational practices, procedures and behaviors into collaborative, synchronised and manageable processes in order to fulfill customer requirements (Chen and Paulraj, 2004; Zhao et al., 2011). Information sharing and process coordination are two common supply chain integration themes (Yeung et al., 2009). Shared information can include interdepartmental meetings and real-time connections between internal functions and can feature both managerial and technology-based issues (Yeung et al., 2009). The process coordination theme includes the uses of cross-functional teams in internal processes, such as product design and process improvement. Moreover, the cross-functional teams are used to seek integrative solutions to improve product development performance (Koufteros et al., 2005). 2.2 Customer Integration. Customer integration is the degree to which a firm can partner with its key customers to structure their inter-organisational strategies, practices, procedures and behaviors into collaborative, synchronized and manageable processes in order to fulfill customer requirements (Chen and Paulraj, 2004; Flynn et al., 2010; Zhao et al., 2011). The sharing of technological, marketing, production and inventory information between manufacturers and customers can help to improve understanding of market trends, customer needs and idea of product (Mentzer, 2004; Lau et al., 2010b). Integrating business processes with supply chain partners includes product co-development with key customers, joint product design, process engineering and production operations (Lau et al., 2010a). 2.3 Supplier Integration. Supplier integration is defined as the degree to which a firm can partner with its key suppliers to structure their inter-organisational strategies, practices, procedures and behaviors into collaborative, synchronized and manageable processes in order to fulfill customer requirements (Yeung et al., 2009; Flynn et al., 2010). Supplier integration processes involve information sharing and product co-development (Lau et al., 2010a). Information sharing such as production plans, demand forecasts and inventory levels among manufacturers and suppliers is commonly found in measuring items inter-firm integration (Zhao et al., 2011). Process coordination covers activities such as product/component designs and supplier involvement in the firm’s internal processes. Several benefits such as time-to-market of new product, product quality, development cost, product cost, fast, agile and reliable delivery can be achieved from supplier integration (Wagner, 2003).

3
2.4 Cumulative competitive capabilities. Manufacturing capabilities are suggested to be developed in a cumulative process with each capability built upon the previous ones in the following sequence: quality, dependability, cost efficiency and flexibility (Nakane, 1986). Ferdows and DeMeyr (1990) have subsequently modified this model by exchanging the positions of flexibility and cost in the sequence. The relationship between quality and delivery is empirically supported but the relationship between cost and flexibility remains uncertain (Hallgren et al., 2011). These four competitive capabilities are describe below. 3. Research model and hypotheses 3.1 Conceptual model. The logic of resource and capability relationship was employed to frame the research model (Rosenzweig et al., 2003). Additionally, the resource based view of the firm (RBV) and the relational view of the firm (RV) were used to support the construct relationships. This approach is similar to other researchers (Koufteros et al., 2007; Kim, 2009; Hong et al., 2010) who have used the RBV and the RV to frame supply chain integration and competitive capabilities relationships. In addition, Swink et al. (2007) use a path analytic approach to assess the effect of strategic integration on manufacturing-based competitive capabilities and the approach of Hallgren et al. (2011) was adopted for testing cumulative competitive capabilities. Our research model is conceptualized in Figure 1.
Figure 1: Research conceptual model
3.2 Hypotheses development. It is believed that firm should achieve its internal integration process before entering into external integration (Gimenez and Ventura, 2005). Furthermore, internal integration has a positive relationship with external integration and external integration has a positive association with internal integration. Our study considered external integration to comprise supplier integration and customer integration and, therefore, we proposed the following hypotheses as: H1. Internal integration is associated with customer integration H2. Internal integration has a positive relationship with supplier integration H3. Customer integration has a positive relationship with supplier integration Customer integration and supplier integration are believed to impact on several dimensions of performance including as cost and reliability (Lee et al., 2007). Competitive capabilities are outcomes of integration (Rosenzweig et al., 2003) and prior studies suggest that benefits may be a result of inter-organizational communication through relationship-specific assets (Dyer and Singh, 1998) and open communication and sharing information are important for maintaining and enhancing these relationships (Christopher, 1992). Also, prior studies
Supply chain integration
• Internal
• Customer
• Supplier
Combinative competitive capability
• Product Quality,
• Delivery,
• Low Cost,
• Process Flexibility

4
(Miller, 1994; Swink et al., 2007; Paiva, 2010) use cost, quality, delivery and product flexibility to measure operational performance from integration with other functional areas. Therefore, we proposed the following hypothesis: H4. Supplier integration has a positive relationship with product quality capability as the first stage of a cumulative model of competitive capability. Some research suggests that capabilities should be traded-off against each other (roe example, cost versus quality) (Hayes and Pisano, 1996). An alternative model is proposed based upon a cumulative capabilities perspective (Ferdows and DeMeyer, 1990) and this indicates that there is a sequence of capabilities that is developed over time (Paiva, 2010). However, there is no consensus about the sequence of these capabilities. Each industry in each country may exhibit a different order based on strategic priority (Ferdows and DeMeyer, 1990; Noble, 1995; Paiva, 2010). According to order winning strategies, qualifiers in any type of market require suppliers to have quality and delivery capabilities (Hill, 2000; Hill and Hill, 2009). Theoretical propositions suggest that a high level of qualify capabilities support the development of delivery capabilities (Hallgren et al., 2011) and prior studies point that successful on time delivery performance requires high quality capability (Nakane, 1986; Ferdows and DeMeyer, 1990). Therefore, our hypothesis is; H5: Quality is required for successful delivery based on a cumulative capability model. Achievement of high quality and delivery capabilities should then lead to higher cost or flexibility capabilities. Hallgren at el (2011) suggest that cost and flexibility capabilities are developed in parallel with each other rather than sequentially. Alternatively, if price is the order winner (Hammel and Kopczak, 1993) then a low cost-based price can be achieved through an increase of flexibility (Quesada et al., 2008). The same authors suggest that flexibility has influence on manufacturing cost reduction. However, our study focused on the development of multiple capabilities which led to the following hypotheses: H6. Low cost is built upon delivery capability. H7. Flexibility is built upon delivery capability Figure 2 shows the relationships between studied constructs and their hypotheses. 4. Research design and methodology
Figure 2: Relationships between supply chain integration and competitive capabilities
H2
H3
H4 H5 H6
H7
H1
Internal integration
Customer integration
Supplier integration
Quality Delivery
Cost
Flexibility

5
4.1 Measures and questionnaire design. The use of dyadic relationship with a major customer and a major supplier is commonly practice in supply chain integration research (Zhao et al., 2011). Moreover, the use of a single informant is a common practice in survey research when key informants are likely to provide accurate information on supplier and customer integration since they are familiar with their major suppliers and customers (Paulraj et al., 2008; Zhao et al., 2011). The unit of analysis is at the firm level. Thus, strategic positions such as president, vice president of purchasing, managing director, supply chain director, procurement manager and knowledgeable persons who can provide perceptions and information on the research constructs are prospective respondents. The adapted items of supply chain integration and combinative competitive capabilities were taken from previous studies such as Flynn et al (2010). A 7-point Likert scale was used with “1” for “strongly disagree” and “7” for “strongly agree”. Our study employed the Q-sorting technique which comprised three separate stages: (1) item creation; (2) structured interview and Q-sort; and (3) large scale testing (Moore and Benbasat, 1991). Three Q-sort rounds were completed prior to distributing the final questionnaires to prospective respondents for a large-scale survey. Detailed Q-sort results are available from the authors. 4.2 Sample and data collection. Our sample frame was the list of members of Thailand Automotive Industry 2011, consisting of 1,858 companies. The research targeted both tier 1 and tier 2 automotive suppliers having least 100 employees. After screening for unrelated business operators, firms unwilling to participate in the survey and invalid addresses, 698 firms remained as potential participants to answer the questionnaires. Our study used only 130 samples collected from the first wave of the survey in which 350 questionnaires were sent out. The response rate was 37%. Table 1 provides a profile of the respondents to the survey.
Job Title Frequency Percentage President/CEO 16 12 Vice president/Director 20 15 General manager 17 13 Manager (plant manager, supply chain, logistics, purchasing/ procurement and operations)
28 21
Others (engineering, manufacturing/ production, project, sales and marketing)
51 39
Table 1: The sample profile
Table 2 provides a profile of the companies by number of employees, annual sales, type of firm ownership and position in supply chain. 5. Data analysis and results We used structural equation modelling (SEM) to analyse the data and its relationships (Hair et al., 1998) and then a two step approach was carried out to test the hypotheses: 1) test measurement model to check the validity and reliability of the item scales and 2) test structural model (Anderson and Gerbing, 1988).
Characteristics of firms Frequency Percentage Number of employees

6
Less than 200 200-499 500-999 More than 1,000
33 37 21 39
25.38 28.46 16.15 30.00
Annual sales( in millions Baht, 1 US$ = 30.84 baht) Below 200 (6.48 USD) 201-499 (6.52-16.18USD) 500-999 (16.21-32.39USD) 1,000-2,999 (32.42-97.24USD) Above 3,000 (97.28 USD)
27 21 12 37 33
20.80 16.15 9.23 28.46 25.38
Type of firm ownership 100% Thai owned Joint-venture Wholly foreign owned
47 42 41
36.2 32.3 31.5
Company position Supplier tier 1 Supplier tier 2
95 35
73.08 26.92
Table 2: Company profile
5.1 Measurement model, validity and reliability. The first-order measurement model was assessed. For the overall fit, is recommended to check the goodness of fit index (GFI), comparative fit index (CFI), incremental fit index(IFI), normed fit index (NFI), and root mean square error of approximation (RMSEA) (Hu and Bentler, 1999; Shah and Goldstein, 2006). The overall fit indicated that χ2 = 484.669, df = 307, GFI =.796, CFI= .919, IFI= .921, NFI=.810, RMSEA =.067. In addition, convergent validity from the significance of the loading for an item on its posited underlying construct (Anderson and Gerbing, 1988) and reliability of the measured items (Nunnally and Bernstein, 1994) were checked. Our study used a reliability test and exploratory factory analysis to purify the scale. The scale reliability of each construct was assessed by using Cronbach’s Alpha value (α). The Alpha value of every factor was greater than 0.70, indicating that it is a very good statistical result (Johnson and Wichern, 1998). The instruments for the constructs were validated by exploratory factory analysis using principal axis factoring with oblique factor rotation and their result confirmed the structure of the constructs. The convergent validity was checked for construct validation by using a confirmatory factor analysis and standardized factor loading which was greater than 0.5, indicating good convergent validity among the instruments of each construct (Byrne, 2001). In our study, all loadings were greater than 0.5. The maximum standardized loading was 0.912 and the minimum standardized loading was 0.577. In addition, variance extracted (VE) of each construct was assessed and VE should be at least 0.5 to be considered as adequately convergent and a construct reliability (CR) value between 0.6 and 0.7 is acceptable (Hair et al., 2006). The t-value represents the estimate of regression weight divided by its standard error. A t-value that is greater than 1.96 implies statistical significance at the 95% level. The minimum t-value of the loadings was 6.36 and the maximum t-value was 10.63. Our results are presented in Table 3. The discriminant validity was assessed by checking that the modification indices in the confirmatory factory analysis for omitted paths showed no significant cross loadings among the instrument (Kline, 1998). The non-response bias was assessed and we found that the data did not have an indicator for early versus late responses (Armstrong and Overton, 1977).

7
Items Factor loading
t-value α
Supplier Integration (CR = 0.85, AVE =.60) We share our inventory levels with our major supplier. We share our production plans with our major supplier Our major supplier shares their production capacity with us. Our major supplier shares available inventory with us.
.613 .710 .912 .831
a
6.61 7.53 8.85
.884
Internal Integration (CR = 0.75, AVE =0.48) We use cross functional teams in process design/improvement. We use cross functional teams in product development We can share and connect real-time information among all internal functions from raw material management through production, shipping and sales. We search and share knowledge in our company
.639 .620 .707
.820
a
9.11 6.36
6.75
.834
Customer Integration (CR =0.97, AVE =0.55) Our major customers are involved in our part/product development processes. We establish more frequent contact with our major customers Our major customers are linked with information/computer network Our major customers share market information with us Our major customer shares demand forecast with us
.656
.653 .666
.877
.826
a
6.43 6.42
6.93 7.45
.839
Product Quality (CR =0.83, AVE =0.56) Ability to offer product durability Ability to offer product reliability Ability to produce consistently low-defect rate Ability to offer high-performance products that meet customer needs
.667 .785 .867 .664
a
9.95 8.09 6.61
.857
Delivery (CR = 0.79, AVE =0.57) Ability to reduce production lead time Ability to fast delivery Ability to provide on time delivery
.834 .836 .577
a
10.63 6.64
.837
Process Flexibility (CR =0.78 xxx, AVE =0.57) Ability to rapidly modify methods for components Ability to rapidly modify methods for materials. Ability to manufacture broad product mix within same facilities Ability to changeover to a different product quickly
.798 .888 .698
659
a
10.38 8.14
7.60
. 860
Low Cost (CR = 0.91, AVE =0.71) Ability to offer lower-priced products Ability to manufacture similar products at a lower cost than our competitors. Ability to lower manufacturing overhead cost
.864 .911
.754
a
12.82
10.15
.879
Note: ‘‘a’’ means that the regression weight was fixed at 1.00, not estimated.
Table 3: Assessment of reliability and construct validity
8
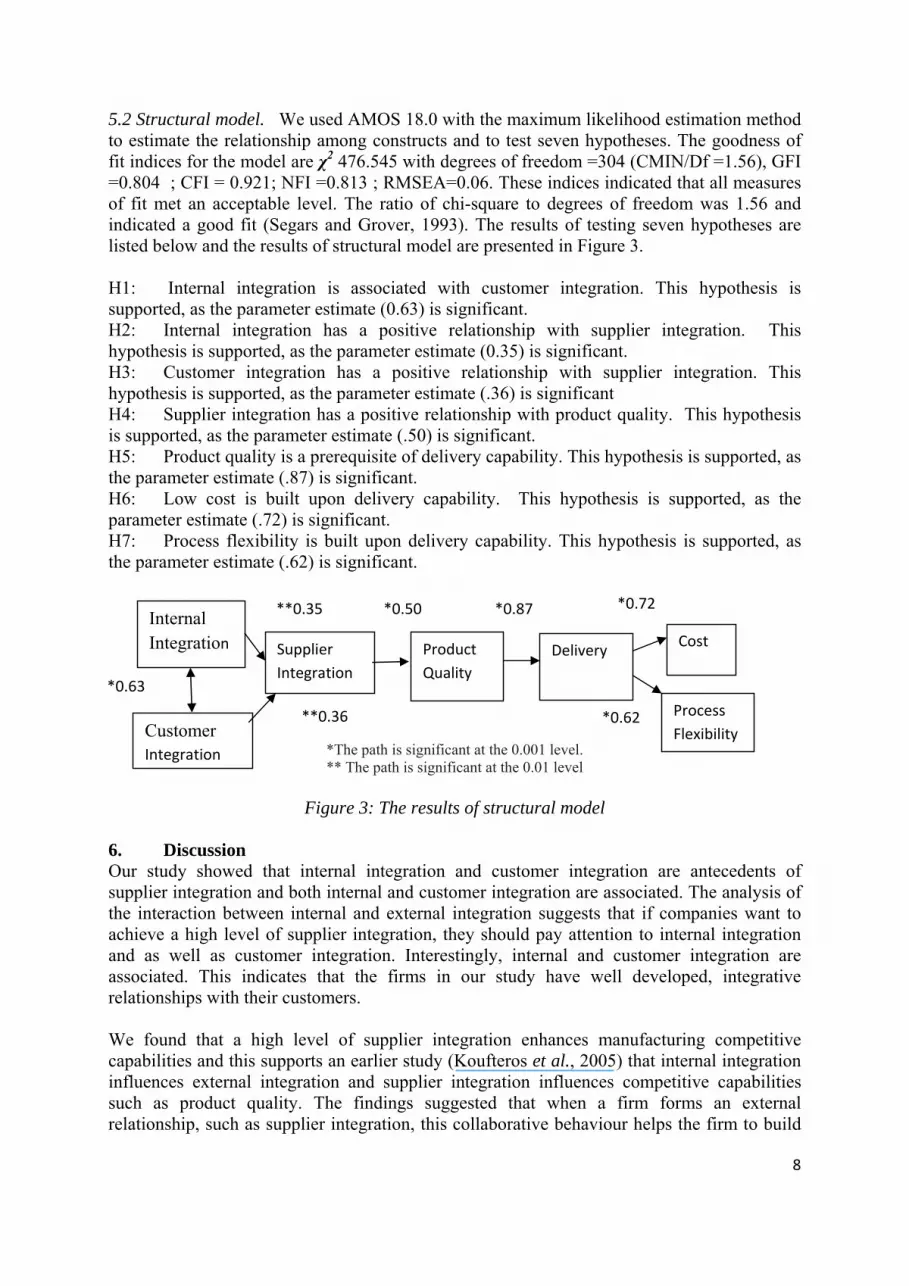
5.2 Structural model. We used AMOS 18.0 with the maximum likelihood estimation method to estimate the relationship among constructs and to test seven hypotheses. The goodness of fit indices for the model are χ2 476.545 with degrees of freedom =304 (CMIN/Df =1.56), GFI =0.804 ; CFI = 0.921; NFI =0.813 ; RMSEA=0.06. These indices indicated that all measures of fit met an acceptable level. The ratio of chi-square to degrees of freedom was 1.56 and indicated a good fit (Segars and Grover, 1993). The results of testing seven hypotheses are listed below and the results of structural model are presented in Figure 3. H1: Internal integration is associated with customer integration. This hypothesis is supported, as the parameter estimate (0.63) is significant. H2: Internal integration has a positive relationship with supplier integration. This hypothesis is supported, as the parameter estimate (0.35) is significant. H3: Customer integration has a positive relationship with supplier integration. This hypothesis is supported, as the parameter estimate (.36) is significant H4: Supplier integration has a positive relationship with product quality. This hypothesis is supported, as the parameter estimate (.50) is significant. H5: Product quality is a prerequisite of delivery capability. This hypothesis is supported, as the parameter estimate (.87) is significant. H6: Low cost is built upon delivery capability. This hypothesis is supported, as the parameter estimate (.72) is significant. H7: Process flexibility is built upon delivery capability. This hypothesis is supported, as the parameter estimate (.62) is significant.
*The path is significant at the 0.001 level. ** The path is significant at the 0.01 level
Figure 3: The results of structural model
6. Discussion Our study showed that internal integration and customer integration are antecedents of supplier integration and both internal and customer integration are associated. The analysis of the interaction between internal and external integration suggests that if companies want to achieve a high level of supplier integration, they should pay attention to internal integration and as well as customer integration. Interestingly, internal and customer integration are associated. This indicates that the firms in our study have well developed, integrative relationships with their customers. We found that a high level of supplier integration enhances manufacturing competitive capabilities and this supports an earlier study (Koufteros et al., 2005) that internal integration influences external integration and supplier integration influences competitive capabilities such as product quality. The findings suggested that when a firm forms an external relationship, such as supplier integration, this collaborative behaviour helps the firm to build
Internal Integration Supplier
Integration
Customer Integration
Product Quality
Delivery Cost
Process Flexibility
**0.35
*0.63
*0.50 *0.87 *0.72
*0.62 **0.36

9
their competitive capabilities, namely product quality, delivery, process flexibility and low cost. Many studies have point out the benefits when there is a high level of integration impacting on firm’s competitive capabilities. The relational view theory (Dyer and Singh, 1998) can help to explain that establishing strong and long-term relationships with its supply chain partners facilitates the firm’s access and ability to exploit capabilities that the firm does not possess (Prajogo and Olhager, 2012). Our study provided empirical evidence that customer integration has impact on supplier integration. This suggests that customer involvement and information such market information should be shared through to suppliers. Internal integration influences supplier integration but the impact is less strong when compared with that of external integration on internal integration. This suggests that the firms in our study were less developed in their integration practices with suppliers. If the firms pay more attention to supplier integration then our findings suggest that their product quality capability may be much improved with subsequent benefits for their other competitive capabilities. However, the firms did prioritise quality as indicated by the standardized path value from supplier integration to product quality. Product quality is very important as a base upon which delivery capability can be built. However, our findings suggest that it is not necessary to develop subsequent competitive capabilities sequentially. Firms can further develop multiple capabilities such as cost and process flexibility simultaneously and our path analysis was consistent with a previous study in which cost and process flexibility can be developed in parallel based upon a high level of delivery capability (Hallgren et al., 2011). Consequently our study has provided further confirmation a hybrid model of competitive capabilities. 7. Conclusion and further research Our study has provided the first empirical evidence to support the relationships between internal integration and the external integration constructs of supplier and customer integration. Our findings have confirmed that a hybrid model of competitive capabilities is appropriate in which product quality and then delivery capabilities are established prior to the parallel development of low cost and process flexibility. Our findings reinforce the view that integration enables a firm to enhance its competitive capabilities by allowing access to resources that would not be available otherwise. Particularly, supplier integration is positively affected by internal integration and customer integration and product quality capability is strongly positively affected by supplier integration. This suggests that supply chain integration is both a multiple construct and a source of competitive advantage. Our study has several limitations relating to its scope and method. Firstly, we did not include logistics integration, particular of physical flows, in our specification of supply chain integration even though supply chain integration relates to both physical flow and information flow (Prajogo and Olhager, 2012). In addition, the sample size was small and we focused on a single industry. The studied result may not be able to apply to other industries. Further studies should include larger sample sizes with representation from a broader number of industry sectors. Our study used a single informant for each firm and the use of multiple respondents could yield interesting findings. Finally, our knowledge of developing competitive capabilities in Thailand’s automotive suppliers needs to be supported by more understanding of the impact of these capabilities on firm performance.
10
References Anderson, J. C.andGerbing, D. W. 1988. Structural equation modeling in practice: a review
and recommended two-step approach. Psychological Bulletin, 103 (3), 453-460. Armstrong, J. S.andOverton, T. S. 1977. Estimating non-response bias in mail surveys.
Journal of Marketing Research, 14 (3), 396-402. Byrne, B. M. 2001. Structural Equation Modeling with AMOS: Basic concepts, applications,
and programming, New York: Routledge. Chen, I. J.andPaulraj, A. 2004. Understanding supply chain management: Critical research
and a theoretical framework. International Journal of Production Research, 42 (1), 131-163.
Christopher, M. 1992. Logistics and Supply Chain Management, London, UK: Pitman. Cousins, P. D.andMenguc, B. 2006. The implications of socialization and integration in
supply chain management. Journal of Operations Management, 24, 604-620. Dyer, J. H.andSingh, H. 1998. The relational view: Cooperative strategy and sources of
interorganizational competitive advantage. Academy of Management Review, 23 (4), 660-679.
Ferdows, K.andDeMeyer, A. 1990. Lasting improvements in manufacturing performance: in search of a new theory. Journal of Operations Management, 9 (2), 168-184.
Flynn, B. B., Huo, B.andZhao, X. 2010. The impact of supply chain integration on performance: A contingency and configuration approach. Journal of Operations Management, 28, 58-71.
Gimenez, C.andVentura, E. 2005. Logistics-production, logistics-marketing and external integration: their impact on performance. International Journal of Operation and Production Management, 25 (1), 20-38.
Hair, J., Anderson, R., Tatham, R.andBlack, W. 1998. Multivariate data analysis, Upper Saddle River, NJ: Prentice Hall.
Hair, J., Tatham, R.andAnderson, R. 2006. Multivariate Data Analysis, London: Prentice Hall.
Hallgren, M., Olhager, J.andSchroeder, R. G. 2011. A hybrid model of competitive capabilities. International Journal of Operations & Production Management, 31 (5), 511-526.
Hammel, T. R.andKopczak, L. R. 1993. Tightening the supply chain. Production & Inventory Management Journal, 43 (2), 63-70.
Hayes, R. H.andPisano, G. P. 1996. Manufacturingstrategy: attheintersectionoftwo paradigm shifts. Production and Operations Management, 5 (1), 25-41.
Hill, A.andHill, T. 2009. Manufacturing Operations Strategy, Houndsmills, Hampshire: Palgrave Macmillan.
Hill, T. 2000. Manufacturing Strategy: Text and Cases, Houndmills, Hampshire: Palgrave Macmillan.
Hong, P., Tran, O.andPark, K. 2010. Electronic comerce applications for supply chain integration and competitive capabilities. Benchmarking: An International Journal, 17 (4), 539-560.
Hu, L.andBentler, P. M. 1999. Cut off criteria for fit indexes in covariance structure analysis: conventional criteria versus new alternatives. Structural Equation Modeling, 6 (1), 1-55.
Johnson, R. A.andWichern, D. W. 1998. Applied Multivariate Statistical Analysis, USA: Prentice-Hall International, Inc.
Johnston, R.andLawrence, P. R. 1988. Beyond the vertical integration - the rise of the value-adding partnership. Harvard Business Review, 6 (4), 94-101.

11
Kim, S. W. 2009. An investigation on the direct and indirect effect of supply chain integration on firm performance International Journal of Production Economics, 119, 328-346.
Kline, R. B. 1998. Principles and Practice of Structural Equation Modeling New York: The Guilford Press
Koufteros, X. A., Cheng, T. C. E.andLai, K. H. 2007. "Black-box" and "gray-box" supplier integration in product development: antecedents, consequences and the moderating role of firm size. Journal of Operations Management, 25, 847-870.
Koufteros, X. A., Vonderembse, M. A.andJayaram, J. 2005. Internal and external integration for product development: The contingency effects of uncertainty, equivocality, and platform strategy. Decision Sciences, 36 (1), 97-133.
Lau, A. K. W., Tang, E.andYam, R. C. M. 2010a. Effects of supplier and customer integratin on product innovation and performance: Emprical evidence in Hong Kong manufacturers. Journal of Product Innovation and Management, 27, 761-777.
Lau, A. K. W., Yam, R. C. M.andTang, E. P. Y. 2010b. Supply chain integration and product modularity: an empirical sutdy of product performance for selected Hong Kong manufacturing industries. Internal Journal of Operations & Production Management, 30 (1), 20-56.
Lee, C. W., Kwon, I. D.andSeverance, D. 2007. Relationships between supply chain performance and degree of linkage among supplier, internal integration and customer. Supply Chain Management: An International Journal, 12 (6), 444-452.
Lockstrom, M., Schadel, J., Harrison, N., Moser, R.andMalhotra, M. K. 2010. Antecedents to supplier integration in the automotive industry: A multiple-case study of foreign subsidiaries in China. Journal of Operations Management, May (3), 240-256.
Mentzer, J. T. 2004. Fundamentals of Supply Chain Management, Tousand Oaks, CA: Sage. Miller, J. G. 1994. A taxonomy of manufacturing strategies. Management Science, 40 (3),
285-304. Moore, G. C.andBenbasat, I. 1991. Development of an instrument to measure the perceptions
of adopting an information technology innovation. Information Systems Research, 2 (2), 192-222.
Nakane, J. 1986. Manufacturing futures survey in Japan: a comparative survey 1983-1986, Tokyo: System Science Institute, Waseda University.
Noble, M. A. 1995. Manufacturing strategy: tesing the cumulative model in a multiple country context. Decision Sciences, 26 (5), 693-721.
Nunnally, J. C.andBernstein, I. H. 1994. Psychometric theory, New York: McGraw-Hill. Paiva, E. L. 2010. Manufacturing and marketing integration from a cumulative capabilities
perspective. International Journal of Production Economics, 126, 379-386. Paulraj, A., Lado, A. A.andChen, I. J. 2008. Inter-organizational communication as a
relational competency: antecedents and performance outcomes in collaborative buyer-supplier relationships. Journal of Operations Management, 26, 45-64.
Prajogo, D.andOlhager, J. 2012. Supply chain integration and performance: the effects of long-term relationships, information technology and sharing, and logistics integration. International Journal of Production Economics, 135, 514-522.
Quesada, G., Rachamadugu, R.andGonzalez, M. 2008. Linking order winning and external supply chain integration strategies. Supply Chain Management: An International Journal, 13 (4), 296-303.
Rosenzweig, E. D., Roth, A. V.andDean Jr., J. W. 2003. The influence of an integration strategy on competitive capabilities and business performance: An exploratory study of consumer product manufacturers. Journal of Operations Management, 21, 437-456.

12
Segars, A. H.andGrover, V. 1993. Re-examining perceived ease of use and usefulness: a confirmatory factor analysis. MIS Quarterly, 17, 517-525.
Shah, R.andGoldstein, S. M. 2006. Use of structural equation modeling in operations management research: Looking back and forward. Journal of Operations Management, 24, 148-169.
Swink, M., Narashmhan, R.andWang, C. 2007. Managing beyond the factory wall: Effects of four types of strategic integration on manufacturing plant performance. Journal of Operations Management, 25 (1), 148-164.
Takeishi, A. 2001. Bridging inter- and intra- firm boundaries: management of supplier involvement in automobile product development. Strategic Management Journal, 22 (5), 403-433.
Wagner, S. M. 2003. Intensity and managerial scope of supplier integration. Journal of Supply Chain Management, 39 (Fall), 4-15.
Wong, C. Y., Boon-itt, S.andWong, C. W. Y. 2011. The contingency effects of environmental uncertainty on the relationship between supply chain integration and operational performance. Journal of Operations Management, 29, 604-615.
Yeung, J. H. Y., Selen, W., Zhang, M.andHuo, B. 2009. The effects of trust and coercive power on supplier integration. International Journal of Production Economics, 120, 66-78.
Zhao, X., Huo, B., Selen, W.andYeung, J. H. Y. 2011. The impact of internal integration and relationship commitment on external integration. Journal of Operations Management, 29, 17-32.


![Case Study Slide Deck [FoodService App] - Elos Soluções Cloud](https://img.pdfslide.net/doc/110x75/63174fdb1e5d335f8d0a5354/case-study-slide-deck-foodservice-app-elos-solucoes-cloud.jpg)


