Embed Size (px)
Citation preview
Investigating the effect of pH on the surfacechemistry of an amino silane treated nano silica
Mehran Rostami and Mohsen Mohseni
Department of Polymer Engineering and Colour Technology, Amirkabir University of Technology, Tehran, Iran, and
Zahra RanjbarDepartment of Surface Coatings and corrosion, Institute for Colorants, Paint and Coatings (ICPC), Tehran, Iran
AbstractPurpose – The purpose of this paper is to investigate the effect of different PHS on the surface chemistry of fumed silica treated withaminopropyltrimethoxysilane (APTMS).Design/methodology/approach – The reaction conditions involved variation of pH ranging from acidic to alkaline. Different analytical techniquesincluding FT-IR spectroscopy, thermogravimetric analysis (TGA), CHN and Zeta potential analyses were employed to investigate the surface chemistry oftreated particles. In addition, the stability of silanised silica dispersions were studied using turbidimetric and rheometric measurements.Findings – It was revealed that in all conditions silica was more or less chemically grafted by the silane. When the pH of treating bath was adjusted to1-2 prior and during the reaction, 58 percent grafting was observed, as obtained by CHN and TGA analyses. At very alkaline conditions, however, thegrafting content declined to 29 percent. The variations in grafting were dependent on the silane hydrolysis and its further condensation with the silicasurface. Zeta potential measurements showed a drastic change from 27.1 mv to þ18.01 mv (at pH 7) for the untreated particle and the one with thehighest grafting, respectively. The dispersion stability of differently treated particles varied in solvents with different Hansen solubility parameters (HSP).Moreover, due to the variations of surface chemistry of particles, their rheological behaviours were significantly influenced.Originality/value – The results obtained in this work showed that the surface chemistry of fume silica could be tuned with treating method.The highest content of grafting led to a better dispersion in solvents having greater hydrogen bonding component and to an inferior dispersion insolvents with higher polar component.
Keywords Surface treatment, Surface chemistry, Rheology, Silica, Wettability
Paper type Research paper
Introduction
Fumed silicas, due to their very fine particle size and high
specific surface area, have shown to be one of the most
important reinforcing fillers for polymers and coatings (Robertsand Bergna, 2006; Sun et al., 2005). Apart from the geometry,
surface chemistry of silica also greatly affects the degree ofreinforcement. As silica contains a large number of silanol
groups on its surface in the formof vicinal, geminal and isolated,
it can be considered highly polar (Chen et al., 2005). Therefore,it is less compatible in non-polar media (Jesionowski and
Kkrysztafkiewicz, 2001). Moreover, the surface silanol groups
have a great affinity to form hydrogen bonding with each other,resulting in a strong filler-filler interaction (Chen et al., 2005;Jesionowski and Kkrysztafkiewicz, 2001; Jiang et al., 2007).This can be prevented by the aid of coupling agents, thereby
modifying the hydrophilic nature of silica surface. Such a
surface modification not only improves the wettability of silicain organic media, but also functionalises the particle to interact
chemically with coating media. The formation of chemicalbonds between the inorganic and organic is expected to
guarantee a durable interaction between the two incompatible
phases. For themodification of silica surfaces, organosilanes are
most commonly used (Chen et al., 2005; Sun et al., 2005).Recently, much attention has been given to the use of these
materials which are able, to some extent, to couple filler to an
organic media (Jesionowski and Kkrysztafkiewicz, 2001;
Jiang et al., 2007; Iijima et al., 2007; Wieczorek et al., 2004).
Generally, silane coupling agents may possess two functional
active groups, i.e. an alkoxy group capable of reacting with
surface silanol, and an organic functionality, generally having
amino, epoxy and acrylic groups in its structure. These may
participate in the curing system leading to a possible strong
linkage between the silica and the polymer (Jiang et al., 2007).Consequently, a silane coupling agent can function as a bridge
between silica and polymer, thereby enhancing interaction
between these two. Many types of silane coupling agents,
varying in chemistry and reactivity are available, ofwhich amino
silanes are among those usually used for silica modification
(Chen et al., 2007; Jesionowski and Kkrysztafkiewicz, 2001;
Wieczorek et al., 2004).The action of alkoxysilanes starts with hydrolysis. The rate
of hydrolysis significantly depends on the pH as well as on the
type of organo- and silicon-functional groups (Roberts and
Bergna, 2006; Xhanthos, 2005). Different factors can affect
the reaction of silane with inorganic particles, among which,
the natural pH of the silane, isoelectric point of the particle,
ratio of water to silane as well as the pH of the reaction media,
and the method of dispersion can be considered as the more
important ones (Xhanthos, 2005). At high and very low pH
values, the rate of hydrolysis is higher than that of the silane
natural pH, at which silanes are most stable. For example,
The current issue and full text archive of this journal is available at
www.emeraldinsight.com/0369-9420.htm
Pigment & Resin Technology
40/6 (2011) 363–373
q Emerald Group Publishing Limited [ISSN 0369-9420]
[DOI 10.1108/03699421111180509]
363
the rate of reaction of a monomeric trialkoxysilane in acetic
acid solution increases by a factor of ten upon reducing the
pH value from 4 to 3.The overall purpose of surface treatment of silica is to
render the surface functionalised and hydrophobic comparedwith the pristine particle. There are various reports on the
surface treatment of nano silica with silane coupling agents,especially using amino silanes. For example, Ishida and his
co-workers treated E-glass fibres and silica powder with
aminopropyltriethoxy silane. They varied the pH of treatingbath and reported that the maximum number of molecules
was adsorbed when silica was treated with a silane solution atits natural pH (10.6) (Wieczorek et al., 2004). Other
researchers have also reported the treatment of silica with
different types of organo functional silanes including amino,vinyl, methacryloxy and mercapto.Jesionowski and Kkrysztafkiewicz (2001) and Krysztafkiewicz
et al. (1981) used, however, acidic conditions for treatment of
amino silanewith silica. It seems that adjusting the pHof treatingbath during the reaction remains a challenge.Moreover, the role
of isoelectric point of silica on silane reaction has not been taken
into consideration systematically. This latter property maygreatly affect the state of reaction of amino silane with silica.
In addition, in previous works in this field, the ratios of couplingagent to silica were varied between 1 and 10weight parts per 100
parts silica. These seem to bewell below the stoichiometric value
of coupling agent to react with the existing surface silanols.In the work reported here, we aimed at treating fume silica
with aminopropyltrimethoxysilane (APTMS) at differentconditions in which the pH value was varied prior to and
during the reaction. The properties of the treated silica wereinvestigated using thermogravimetric analysis (TGA), FT-IR
spectroscopy and CHN analysis. Also, particles were
characterised by measuring their pH, zeta potential anddensity. The dispersion stability of the particles in different
solvents was also studied and the rheological behaviour of thetreated particles was investigated. It was attempted to discuss
the results of these analyses based on the chemistry of treated
particle at different process parameters.
Experimental
Materials
Hydrophilic fumed silica (Aerosil 200) having a specific
surface area 200m2/g and particle diameter of 12 nm wasobtained from Degussa Co. The pH of a 4wt% silica
dispersion (according ISO 787-9) and the number of hydroxylgroups of silica were 3.7-4.7 and 4.6 OH.nm21, respectively,
(Degussa web site). Aminopropyltrimethoxysilane (APTMS),97 percent in ethanol, was purchased from Degussa Co. All
other chemical reagents, including ethanol, hydrochloric acid
and caustic soda were purchased from Merck Co. Allmaterials were used as received.For the rheological studies, an acrylic polyol resin was used.
The resin was kindly provided by Tak Resin Co. (Iran) and
contained55wt%solid andhadanacidvalueof5-10mgKOH/g.
Method for silica treatment
Samples were refluxed in a glass round-bottom flaskequipped with a Graham condenser and a heating oil bath.
The amounts of silica and saline were calculated according toa stoichiometric value (unity), and hydrolysis ratio of 3
(h ¼ 3) as follows (Mrkoci, 2001):
M ¼ 3 £ SSSi £mSi £MSilane £OH:No £ 1019
NA
where M is the amount of silane (in grams), SsSi is the surface
area of silica, mSi is weight of silica, andMSilane is the molecularweight of silane. OH.No is the number of hydroxyl groups
per nm2 on silica surface, NA is the Avogadro number and 1019
is a conversion factor. All the reactions were performed athydrolysis ratio of 3 (the ratio of water to silane). Silane was
poured drop-wise at the rate of 0.5 g/min. The amounts of
materials in the reaction vessel are shown in Table I.To investigate the performance of the treated particles, six
different reaction conditions were conducted, as shown in
Table II.A mechanical homogeniser (IKA) was used for all samples at
19,000 rpm. All reactions lasted for two hours. The resultingslurries were first centrifuged at 5,000 rpm, followed by washing
for three times with ethanol. In each washing stage, the
suspensions were centrifuged. Then, the sedimented particleswere dispersed inwater:ethanol (50:50) solution and dried using
a spray dryer at 1108C to collect the variously treated silicas.
Method for preparation of acrylic polyol/silica mixtures
Treated and untreated silica particles were ultrasonicallydispersed in methoxy propyl acetate (MPA) for five minutes
and then added to the polyol. The content of silica was kept
constant at 4wt% for all samples. The dispersion of particlesin resin was achieved in one hour by pearl milling using
0.5mm zirconia beads at 1,200 rpm shear rate. The ratio of
zirconia beads to polyol was 1:1wt/wt.
Method for characterisation of treated particlesMeasurement of pHpH of each powder in the mixture of ethanol and water was
measured according to ISO-787-9 standard.
Measurement of densityApparent densities were recorded using a helium picknometer.
FT-IR spectroscopic analysisTo further study the attachment of silane coupling agent tosilica, FTIR spectroscopy was performed. The IR spectra of
samples were recorded using an FTIR Perkin Elmer
Spectrum One with KBr-sample discs.
TGATo investigate the efficacy of surface treatment, TGA wasperformed at N2 atmosphere with a heating rate of 108C
min21 from room temperature to 6008C by a TGA-DTA
Pyris Diamond SII Analyzer.
Elemental analysisElemental analysis for carbon, hydrogen and nitrogen content
of the modified and unmodified silica samples was performedaccording to ASTM- D5291 by a Foss-Herueus CHN-D-
Rapid Analyzer.
Table I Amount of materials in treatment reaction
Materials g
Amino silane 4.1
Silica 5
Absolute ethanol 85.44
Water 3.56
Effect of pH on an amino silane treated nano silica
Mehran Rostami, Mohsen Mohseni and Zahra Ranjbar
Pigment & Resin Technology
Volume 40 · Number 6 · 2011 · 363–373
364
NTU measurementTurbidity or dispersion stability of dispersed silica powders ina solvent can be considered as an indication of its surface
polarity. To this end, a HACH 2100AN Turbidimeter wasused to study the dispersibility of treated and untreatedsamples in solvents differing in Hansen solubility parameter(HSP) components according to ASTM-D4046. Table III
lists the solvents used together with their corresponding polar,disperse and hydrogen bonding HSP values. These solventswere used due to the similarity of gd (Hansen, 2000). Theclarity of upper phase and the rate of sedimentation ofparticles were also recorded as an indication of dispersibility.
Measurement of viscosityThe rheological studies were conducted using a ModularCompact Rheometer MCR300 on 4wt% silica dispersion atthe shear rate of 0-50 s21 at ambient temperature.
Zeta potential analysisTo discuss the different surface treatment approaches on thesurface charge of each sample, a ZETA Sizer MALVERN3000HS was used to measure the zeta potential at different
pHs. To this end, 0.15wt% silica was dispersed in a mixtureof ethanol: H2O (50:50wt/wt).
Characterisation of the morphology of particles
For morphological studies, a JEOL JEM2010 TEM operated
with a thermionic emission gun at accelerating voltage of 200keV was used. Samples were prepared by depositing a verydiluted suspension of particles in ethanol on carbon coatedcupper grids and further drying at ambient.
Results and discussion
Chemical modification of silica surface using alkoxysilanes hasbeen reported by many researchers (Culler et al., 1986;
Jesionowski and Kkrysztafkiewicz, 2001; Naviroj et al., 1984;Pham et al., 2007; Vansant et al., 1995; Wieczorek et al.,2004). Low concentration of amino and epoxy silanesolutions were often used to modify silica surfaces(Kang et al., 2001; Shen et al., 2004; Vejayakumaran et al.,2008). The report by Vansant et al. (1995) showed that
low concentration of silane coupling agents has prevented the
occurrence of multi-layer adsorption of alkoxysilanes on
the silica surface. Moreover, it has been discussed that a
high concentration of alkoxysilanes has led to a multi-modal
size distribution and an increase in the average particle
size (Jesionowski and Krysztafkiewicz, 2002). Therefore,
a stoichiometric amount of APTMS was used in the present
study and the reaction time of two hours was utilised to react
silica with the silane.In treating method S1, APTMS was added to the slurry of
silica and ethanol at pH 7. At this pH, silane has low reactivity
(Xhanthos, 2005). Silane was added drop-wise (0.5 g/min)
and the slurry pH reached 9-10. At this condition, the
reactivity of silane is high, so it could be hydrolysed into
silanol and then condensed with silica. At this condition, the
condensation of silane seemed very fast and both silica surface
and silanol groups in silane are negatively charged, so they
may not show affinity to each other. It may be expected that
silica hydroxyl groups and hydrolysed silane interact with each
other through hydrogen bonding. The reactivity of silanol
groups at pH 9-10 was high, resulting in condensation and
formation of Si–O–Si networks. Therefore, the increased
viscosity of slurry may be explained due to this reactivity.In method S2, silica was added to the mixture of ethanol
and water according to Table II. It was dispersed by a
homogeniser for about 30 minutes and then 1ml hydrochloric
acid was added to change pH from 7 to 1.24. At this pH,
silica surface is positively charged. The silane was then added
drop wise. The pH of slurry changed from 1.24 to 9 and the
viscosity increased rapidly.In method S3, silica was first added to the mixture of
ethanol and water. Three microlitre acid was then added to
lower the initial pH to 1. At this condition, silica surface has
positive charges. Silane (diluted in ethanol) was then added
drop wise. In this case, silane has high reactivity and form
silanol. The pH of slurry reached two and the viscosity
increased. After a few minutes, 3ml caustic soda was added
and the pH of reaction changed to 4.5.In method S4, silane was first added to the mixture of
ethanol and water. The pH of ethanol changed from 7 to 10.
The initial pH of the mixture before the addition of silica was
ten. At this condition silica has negative charges and Si–O2
groups may not show affinity to silica surface. At this pH,
silane has high reactivity and changes into silanol, with no
obvious change in viscosity. At this condition, compared to
method S1, silane may have enough time to condense with
itself and form oligomers. Then silica was added and the
viscosity of slurry increased rapidly.In method S5, silane was first added to the mixture of
ethanol and water, to which was added 3ml HCl to change
Table II Conditions of treatment
Samples Components prior to treatment pH (initial)
Added component
for treatment
PH (in the course
of reaction) Final pH
S1 H2O þ EtOH þ Silica 7 Silane 9-10 9-10
S2 H2O þ EtOH þ Silica þ HCl(1cc) 1-2 Silane 8-9 8-9
S3 H2O þ EtOH þ Silica þ HCl(3cc) 1-2 Silane 1-2 4-6 NaOH (2cc)
S4 H2O þ EtOH þ Silane 9-10 Silica 9-10 9-10
S5 H2O þ EtOH þ Silane þ HCl(3cc) 1-2 Silica 1-2 4-6 added NaOH (2cc)
S6 H2O þ EtOH þ Silane þ HCl(3cc) 1-2 Silica 1-2 1-2
Table III HSPs of solvents
Y(MPa0.5)
Solvent YH Yd Yp
Butyl acetate 6.3 15.8 3.7
2-Propanol 16.4 15.8 6.1
MEK 5.1 16 9
Effect of pH on an amino silane treated nano silica
Mehran Rostami, Mohsen Mohseni and Zahra Ranjbar
Pigment & Resin Technology
Volume 40 · Number 6 · 2011 · 363–373
365
pH from 10 to 1.4. At pH 10, silane has high reactivity andchanges to silanol. Silanol reactivity is high at pHs lower andhigher than three. Silica was then introduced to this mixture.About 2ml of 5wt% caustic soda was added. At thiscondition, the pH of reaction was 4.4, and the protonatedamino groups may have formed. These positively chargedgroups have affinity to surface.Method S6 is similar to method S5 but in the absence of
caustic soda. The pH of treating bath was adjusted at 1-2using 3 ml HCl. At this condition, the hydrolysis of silane isgreater. In addition, silica contains positive charge with whichsilane groups more easily react. The pH was kept acidicduring the course of reaction. This led to lowered affinity ofprotonated amino groups to react with silica.All observations made above can be discussed based on the
hydrolysis conditions of silane and its ability to react withsilica particle depending on the pH. Silanols are mostly stableat around pH 3, and their reactivity is higher at the pH lowerthan 1.5 or higher than 4.5. Silanols condense to formoligomers and, ultimately, two- and three-dimensionalnetworks may form. When considering silane hydrolysis andcondensation, a different reactivity in different pH ranges canbe expected. At very low pH, silanes hydrolyse very quickly.The formed silanols are relatively stable and, over time, formcoordinated networks. At neutral pH, however, silaneshydrolyse very slowly to silanols, which are unstable andtherefore condense. Thus, in both cases, there is still a slowreaction in the transition from silanes to Si–O–Si networks(Li et al., 2006; Wypyeh, 1999; Xhanthos, 2005). At pH . 8,silanes become highly reactive again and form silanols veryquickly. These silanols are very unstable and condense to giveuncoordinated Si–O–Si networks. Therefore, it is predictedto observe different behaviour for the above treated silicas asprepared according to Table II. It may be expected that thetreated sample with method S6, in which pH adjustment oftreating procedure is kept at 1-2, may contain greater graftedsilane. It should be noted that the isoelectric point of silica isthree, meaning that the possibility of reacting negative Si–O2
groups with the positive charges of surface may be higherbelow this pH. These may mean that the sample preparedusing method S6 probably contains higher amount of graftedsilane. On the other hand, as the silane contains aminofunctional groups, the existence of greater amount of siloxanestructure will coincide with the presence of more aminofunctionalities.
Particles characterisationpH and density measurementsTo further study the behaviour of treated particles, pH valuesof each sample together with that of the untreated one weremeasured, as shown in Table IV.The untreated fumed silica has a pH of 4.1 according to
Table IV, the pHs of treated fumed silicas are higher thanthat of the untreated one (S0). This means that treatedfumed silicas have become more alkaline, the extent ofwhich depends on the presence of amino functionalities at
the surface. As can be seen from Table IV, sample S6 has the
highest pH among the other samples. This is in agreement
with the hypothesis made above suggesting that sample S6may be composed of a higher amount of silane grafted.
In turn, sample S4 in which the pH of treating bath is very
alkaline, may have lower amount of silane grafted, judging
from its pH being closer to that of untreated silica. According
to methods S5 and S3, amino groups in these samples have
probably protonated and reacted with negatively charged
silica surface. So, the pH values of samples S5 and S3 are
lower than S6. This may suggest that the attachment of silane
to silica has occurred from the amino side rather than from
silanol (upside down). These more ionic silanes attached to
silica may be easily washed away.The density of each particle was also measured by Helium
Piknometer. The density of all treated particles has decreased
(Table IV) because of the presence of an organic layer and the
increased particle volume. Accordingly, the mass per unit
volume (r) of treated particles decreased. Sample S6 has the
lowest density. This is again in agreement with the result of
pH measurement. The decreased density, however, may not
seem very significant. But, with respect to treating procedures
adopted, it may reveal that the particles which densities are
closer to that of S0 may have possibly lower amount of
grafting silane at the surface and lesser organic functionalities.
The lowest density is seen for sample S6, meaning that, the
silane grafting is the highest among other samples.
FT-IR studies
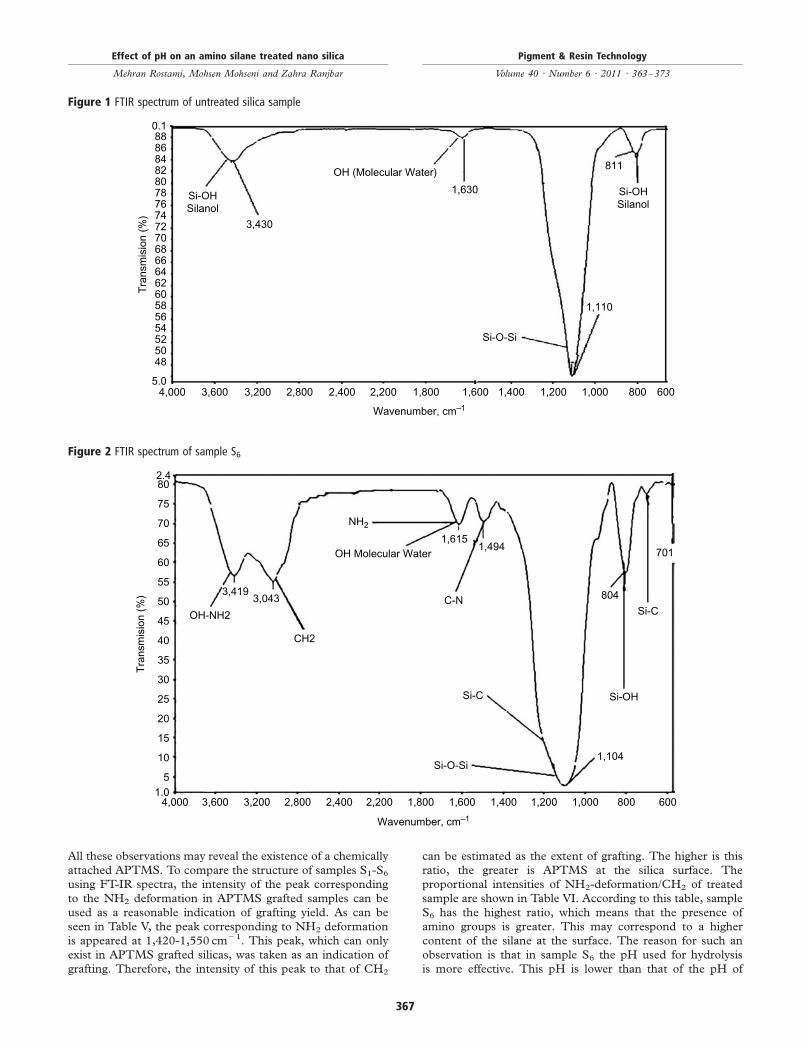
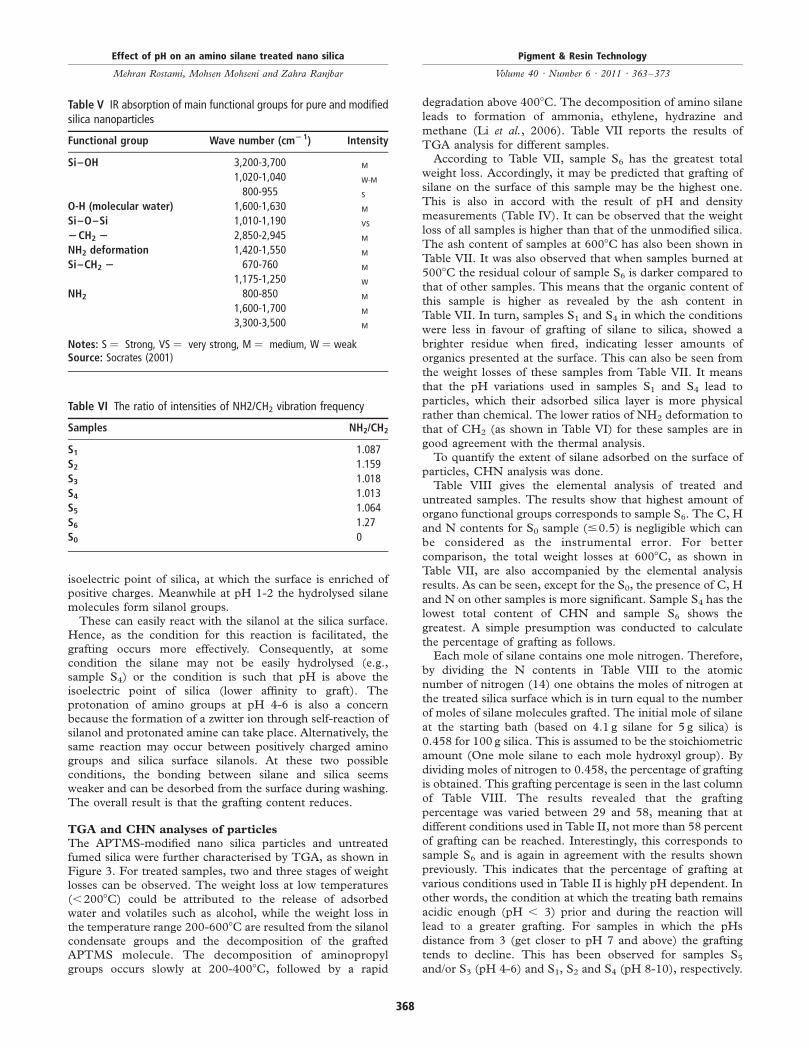
Figures 1 and 2 show the FTIR spectra of the untreated (S0),
and sample S6. The characteristic IR absorption peaks for pure
and modified samples are also summarised in Table V (from
Socrates, 2001). A sharp and strong Si–O–Si stretching peak
(1,010-1,190 cm21) is observed for both samples, indicating
that the main structure has not changed by the modification
reactions (Naviroj et al., 1984; Plueddmann, 1982; Socrates,
2001). The peak at 800-900 cm21 corresponding the silanol
groups can be observed for both samples, confirming that after
the reaction between the silica surface and APTMS, not all
silanol groups are consumed. This also suggests that the
modification reactions occurred primarily on the silica surface
rather than in the internal structure. The peak at 670-760 cm21
and 1,170-1,250 cm21 corresponding to Si–C groups can be
observed in Figure 2. The latter is suppressed by the presence of
Si–O–Si peak at around 1,110 cm21. The broadness of this
peak for the treated sample, compared to S0, may also confirm
the presence of Si–C peak which is absent in Figure 1.The peak observed at 1,600-1,630 cm21 may indicate the
presence of physically adsorbed water.The FTIR spectrum of sample S6 shows an absorption
band at ,2,920 cm21, which is attributed to –CH2 due to
the presence of propyl groups in APTMS. The peak observed
at 1,430-1,500 cm21 corresponds to NH2 deformation.
The peak attributing to NH2 stretching has overlapped with
the stretching vibrations of O-H groups at 3,200-3,500 cm21.
Table IV pH value and density of treated and untreated fumed
Samples S0 S1 S2 S3 S4 S5 S6
PH value 4.1 8.4 8.8 8.2 7.1 8 9.6
Density(g/cm3) 6 0.0001 2.1405 2.0614 2.0302 2.0373 2.0806 2.0188 1.9621
Effect of pH on an amino silane treated nano silica
Mehran Rostami, Mohsen Mohseni and Zahra Ranjbar
Pigment & Resin Technology
Volume 40 · Number 6 · 2011 · 363–373
366
All these observations may reveal the existence of a chemically
attached APTMS. To compare the structure of samples S1-S6using FT-IR spectra, the intensity of the peak corresponding
to the NH2 deformation in APTMS grafted samples can be
used as a reasonable indication of grafting yield. As can be
seen in Table V, the peak corresponding to NH2 deformation
is appeared at 1,420-1,550 cm21. This peak, which can only
exist in APTMS grafted silicas, was taken as an indication of
grafting. Therefore, the intensity of this peak to that of CH2
can be estimated as the extent of grafting. The higher is this
ratio, the greater is APTMS at the silica surface. The
proportional intensities of NH2-deformation/CH2 of treated
sample are shown in Table VI. According to this table, sample
S6 has the highest ratio, which means that the presence of
amino groups is greater. This may correspond to a higher
content of the silane at the surface. The reason for such an
observation is that in sample S6 the pH used for hydrolysis
is more effective. This pH is lower than that of the pH of
Figure 1 FTIR spectrum of untreated silica sample
0.1
Si-OHSilanol
Si-O-Si
3,430
OH (Molecular Water)
1,630
1,110
811
Si-OHSilanol
888684828078767472
Tra
nsm
isio
n (%
)
706866646260585654525048
5.04,000 3,600 3,200 2,800 2,400 2,200 1,800 1,600
Wavenumber, cm–1
1,400 1,200 1,000 800 600
Figure 2 FTIR spectrum of sample S6
2.480
75
70
65
60
55
50
45
40
35
30
25
20
15
10
51.0
Tra
nsm
isio
n (%
)
4,000 3,600 3,200 2,800 2,400 2,200 1,800 1,600
Wavenumber, cm–1
1,400 1,200 1,000 800 600
OH-NH2
Si-C
Si-O-Si
CH2
NH2
OH Molecular Water
3,4193,043
1,615
804
701
Si-C
Si-OH
1,104
1,494
C-N
Effect of pH on an amino silane treated nano silica
Mehran Rostami, Mohsen Mohseni and Zahra Ranjbar
Pigment & Resin Technology
Volume 40 · Number 6 · 2011 · 363–373
367
isoelectric point of silica, at which the surface is enriched ofpositive charges. Meanwhile at pH 1-2 the hydrolysed silanemolecules form silanol groups.These can easily react with the silanol at the silica surface.
Hence, as the condition for this reaction is facilitated, the
grafting occurs more effectively. Consequently, at somecondition the silane may not be easily hydrolysed (e.g.,sample S4) or the condition is such that pH is above theisoelectric point of silica (lower affinity to graft). Theprotonation of amino groups at pH 4-6 is also a concernbecause the formation of a zwitter ion through self-reaction ofsilanol and protonated amine can take place. Alternatively, thesame reaction may occur between positively charged aminogroups and silica surface silanols. At these two possibleconditions, the bonding between silane and silica seemsweaker and can be desorbed from the surface during washing.
The overall result is that the grafting content reduces.
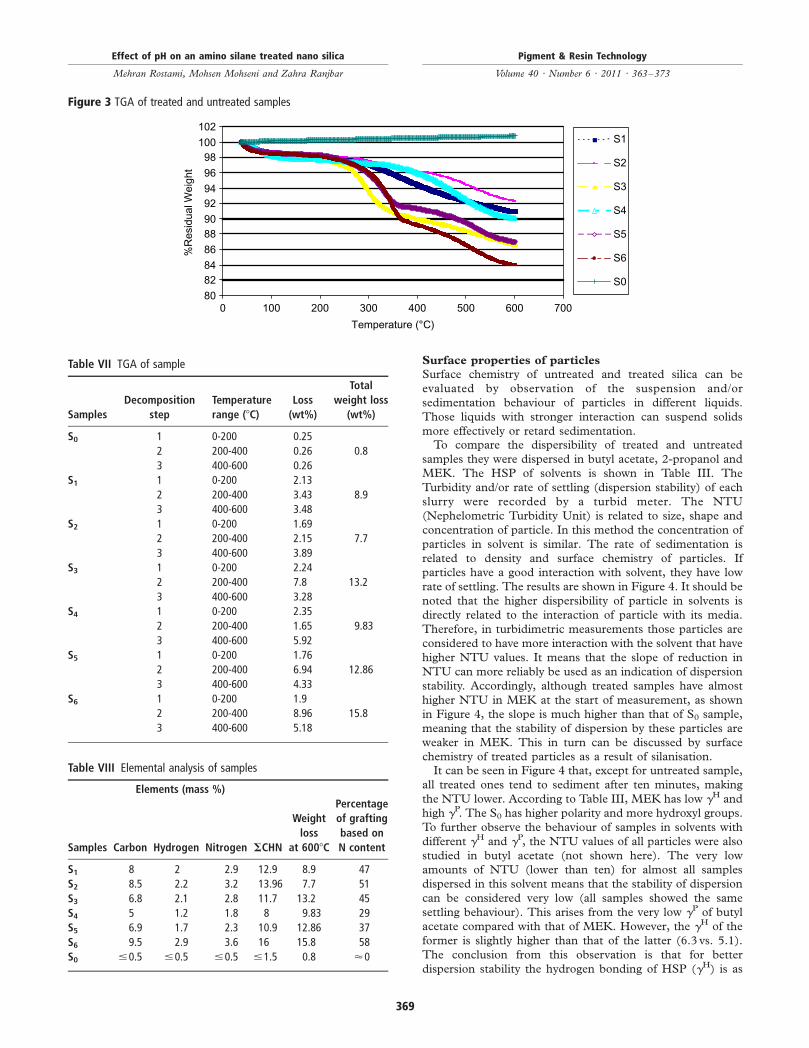
TGA and CHN analyses of particles
The APTMS-modified nano silica particles and untreatedfumed silica were further characterised by TGA, as shown inFigure 3. For treated samples, two and three stages of weightlosses can be observed. The weight loss at low temperatures
(,2008C) could be attributed to the release of adsorbedwater and volatiles such as alcohol, while the weight loss inthe temperature range 200-6008C are resulted from the silanolcondensate groups and the decomposition of the graftedAPTMS molecule. The decomposition of aminopropylgroups occurs slowly at 200-4008C, followed by a rapid
degradation above 4008C. The decomposition of amino silane
leads to formation of ammonia, ethylene, hydrazine and
methane (Li et al., 2006). Table VII reports the results of
TGA analysis for different samples.According to Table VII, sample S6 has the greatest total
weight loss. Accordingly, it may be predicted that grafting of
silane on the surface of this sample may be the highest one.
This is also in accord with the result of pH and density
measurements (Table IV). It can be observed that the weight
loss of all samples is higher than that of the unmodified silica.
The ash content of samples at 6008C has also been shown in
Table VII. It was also observed that when samples burned at
5008C the residual colour of sample S6 is darker compared to
that of other samples. This means that the organic content of
this sample is higher as revealed by the ash content in
Table VII. In turn, samples S1 and S4 in which the conditions
were less in favour of grafting of silane to silica, showed a
brighter residue when fired, indicating lesser amounts of
organics presented at the surface. This can also be seen from
the weight losses of these samples from Table VII. It means
that the pH variations used in samples S1 and S4 lead to
particles, which their adsorbed silica layer is more physical
rather than chemical. The lower ratios of NH2 deformation to
that of CH2 (as shown in Table VI) for these samples are in
good agreement with the thermal analysis.To quantify the extent of silane adsorbed on the surface of
particles, CHN analysis was done.Table VIII gives the elemental analysis of treated and
untreated samples. The results show that highest amount of
organo functional groups corresponds to sample S6. The C, H
and N contents for S0 sample (#0.5) is negligible which can
be considered as the instrumental error. For better
comparison, the total weight losses at 6008C, as shown in
Table VII, are also accompanied by the elemental analysis
results. As can be seen, except for the S0, the presence of C, H
and N on other samples is more significant. Sample S4 has the
lowest total content of CHN and sample S6 shows the
greatest. A simple presumption was conducted to calculate
the percentage of grafting as follows.Each mole of silane contains one mole nitrogen. Therefore,
by dividing the N contents in Table VIII to the atomic
number of nitrogen (14) one obtains the moles of nitrogen at
the treated silica surface which is in turn equal to the number
of moles of silane molecules grafted. The initial mole of silane
at the starting bath (based on 4.1 g silane for 5 g silica) is
0.458 for 100 g silica. This is assumed to be the stoichiometric
amount (One mole silane to each mole hydroxyl group). By
dividing moles of nitrogen to 0.458, the percentage of grafting
is obtained. This grafting percentage is seen in the last column
of Table VIII. The results revealed that the grafting
percentage was varied between 29 and 58, meaning that at
different conditions used in Table II, not more than 58 percent
of grafting can be reached. Interestingly, this corresponds to
sample S6 and is again in agreement with the results shown
previously. This indicates that the percentage of grafting at
various conditions used in Table II is highly pH dependent. In
other words, the condition at which the treating bath remains
acidic enough (pH , 3) prior and during the reaction will
lead to a greater grafting. For samples in which the pHs
distance from 3 (get closer to pH 7 and above) the grafting
tends to decline. This has been observed for samples S5
and/or S3 (pH 4-6) and S1, S2 and S4 (pH 8-10), respectively.
Table V IR absorption of main functional groups for pure and modifiedsilica nanoparticles
Functional group Wave number (cm21) Intensity
Si–OH 3,200-3,700 M
1,020-1,040 W-M
800-955 S
O-H (molecular water) 1,600-1,630 M
Si–O–Si 1,010-1,190 VS
2CH2 2 2,850-2,945 M
NH2 deformation 1,420-1,550 M
Si–CH2 2 670-760 M
1,175-1,250 W
NH2 800-850 M
1,600-1,700 M
3,300-3,500 M
Notes: S ¼ Strong, VS ¼ very strong, M ¼ medium, W ¼ weakSource: Socrates (2001)
Table VI The ratio of intensities of NH2/CH2 vibration frequency
Samples NH2/CH2
S1 1.087
S2 1.159
S3 1.018
S4 1.013
S5 1.064
S6 1.27
S0 0
Effect of pH on an amino silane treated nano silica
Mehran Rostami, Mohsen Mohseni and Zahra Ranjbar
Pigment & Resin Technology
Volume 40 · Number 6 · 2011 · 363–373
368
Surface properties of particles
Surface chemistry of untreated and treated silica can be
evaluated by observation of the suspension and/or
sedimentation behaviour of particles in different liquids.
Those liquids with stronger interaction can suspend solids
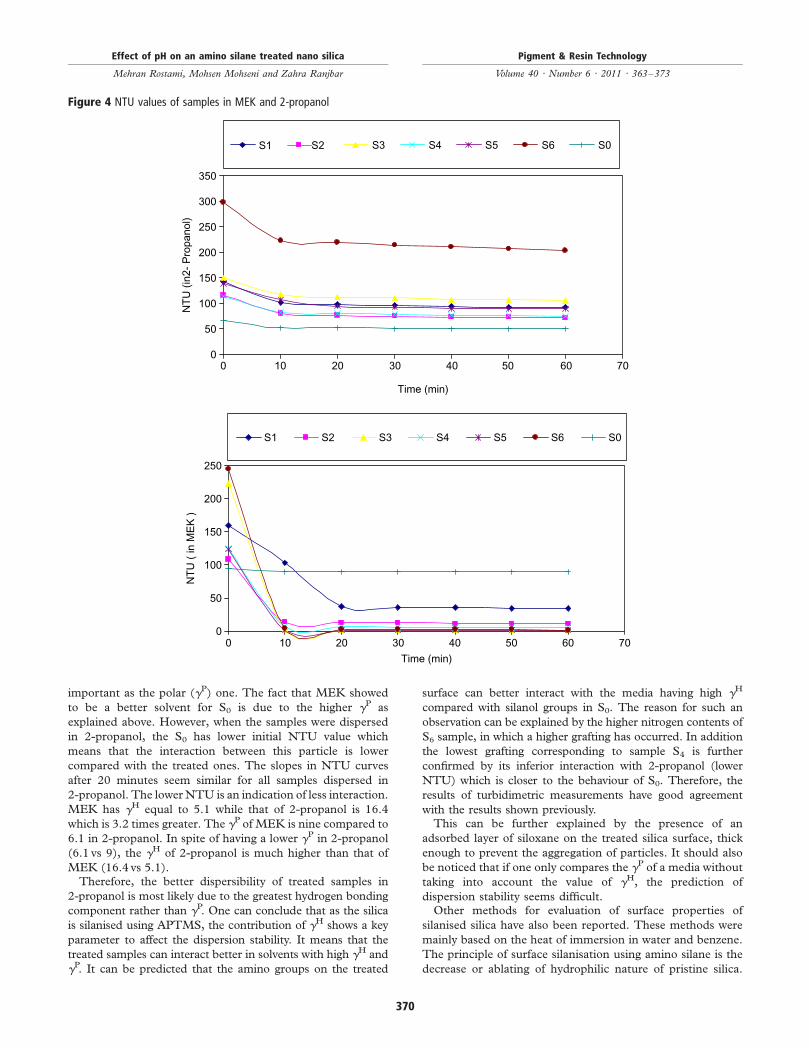
more effectively or retard sedimentation.To compare the dispersibility of treated and untreated
samples they were dispersed in butyl acetate, 2-propanol and
MEK. The HSP of solvents is shown in Table III. The
Turbidity and/or rate of settling (dispersion stability) of each
slurry were recorded by a turbid meter. The NTU
(Nephelometric Turbidity Unit) is related to size, shape and
concentration of particle. In this method the concentration of
particles in solvent is similar. The rate of sedimentation is
related to density and surface chemistry of particles. If
particles have a good interaction with solvent, they have low
rate of settling. The results are shown in Figure 4. It should be
noted that the higher dispersibility of particle in solvents is
directly related to the interaction of particle with its media.
Therefore, in turbidimetric measurements those particles are
considered to have more interaction with the solvent that have
higher NTU values. It means that the slope of reduction in
NTU can more reliably be used as an indication of dispersion
stability. Accordingly, although treated samples have almost
higher NTU in MEK at the start of measurement, as shown
in Figure 4, the slope is much higher than that of S0 sample,
meaning that the stability of dispersion by these particles are
weaker in MEK. This in turn can be discussed by surface
chemistry of treated particles as a result of silanisation.It can be seen in Figure 4 that, except for untreated sample,
all treated ones tend to sediment after ten minutes, making
the NTU lower. According to Table III, MEK has low gH and
high gP. The S0 has higher polarity and more hydroxyl groups.
To further observe the behaviour of samples in solvents with
different gH and gP, the NTU values of all particles were also
studied in butyl acetate (not shown here). The very low
amounts of NTU (lower than ten) for almost all samples
dispersed in this solvent means that the stability of dispersion
can be considered very low (all samples showed the same
settling behaviour). This arises from the very low gP of butyl
acetate compared with that of MEK. However, the gH of the
former is slightly higher than that of the latter (6.3 vs. 5.1).
The conclusion from this observation is that for better
dispersion stability the hydrogen bonding of HSP (gH) is as
Figure 3 TGA of treated and untreated samples
80
8284
86
8890
9294
96
98100
102
0 100 200 300 400 500 600 700
Temperature (°C)
%R
esid
ual W
eigh
t
S1
S2
S3
S4
S5
S6
S0
Table VII TGA of sample
Samples
Decomposition
step
Temperature
range (8C)
Loss
(wt%)
Total
weight loss
(wt%)
S0 1 0-200 0.25
2 200-400 0.26 0.8
3 400-600 0.26
S1 1 0-200 2.13
2 200-400 3.43 8.9
3 400-600 3.48
S2 1 0-200 1.69
2 200-400 2.15 7.7
3 400-600 3.89
S3 1 0-200 2.24
2 200-400 7.8 13.2
3 400-600 3.28
S4 1 0-200 2.35
2 200-400 1.65 9.83
3 400-600 5.92
S5 1 0-200 1.76
2 200-400 6.94 12.86
3 400-600 4.33
S6 1 0-200 1.9
2 200-400 8.96 15.8
3 400-600 5.18
Table VIII Elemental analysis of samples
Elements (mass %)
Samples Carbon Hydrogen Nitrogen SCHN
Weight
loss
at 6008C
Percentage
of grafting
based on
N content
S1 8 2 2.9 12.9 8.9 47
S2 8.5 2.2 3.2 13.96 7.7 51
S3 6.8 2.1 2.8 11.7 13.2 45
S4 5 1.2 1.8 8 9.83 29
S5 6.9 1.7 2.3 10.9 12.86 37
S6 9.5 2.9 3.6 16 15.8 58
S0 #0.5 #0.5 #0.5 #1.5 0.8 <0
Effect of pH on an amino silane treated nano silica
Mehran Rostami, Mohsen Mohseni and Zahra Ranjbar
Pigment & Resin Technology
Volume 40 · Number 6 · 2011 · 363–373
369
important as the polar (gP) one. The fact that MEK showed
to be a better solvent for S0 is due to the higher gP as
explained above. However, when the samples were dispersed
in 2-propanol, the S0 has lower initial NTU value which
means that the interaction between this particle is lower
compared with the treated ones. The slopes in NTU curves
after 20 minutes seem similar for all samples dispersed in
2-propanol. The lowerNTU is an indication of less interaction.
MEK has gH equal to 5.1 while that of 2-propanol is 16.4
which is 3.2 times greater. The gP of MEK is nine compared to
6.1 in 2-propanol. In spite of having a lower gP in 2-propanol
(6.1 vs 9), the gH of 2-propanol is much higher than that of
MEK (16.4 vs 5.1).Therefore, the better dispersibility of treated samples in
2-propanol is most likely due to the greatest hydrogen bonding
component rather than gP. One can conclude that as the silica
is silanised using APTMS, the contribution of gH shows a key
parameter to affect the dispersion stability. It means that the
treated samples can interact better in solvents with high gH and
gP. It can be predicted that the amino groups on the treated
surface can better interact with the media having high gH
compared with silanol groups in S0. The reason for such an
observation can be explained by the higher nitrogen contents of
S6 sample, in which a higher grafting has occurred. In addition
the lowest grafting corresponding to sample S4 is further
confirmed by its inferior interaction with 2-propanol (lower
NTU) which is closer to the behaviour of S0. Therefore, the
results of turbidimetric measurements have good agreement
with the results shown previously.This can be further explained by the presence of an
adsorbed layer of siloxane on the treated silica surface, thick
enough to prevent the aggregation of particles. It should also
be noticed that if one only compares the gP of a media without
taking into account the value of gH, the prediction of
dispersion stability seems difficult.Other methods for evaluation of surface properties of
silanised silica have also been reported. These methods were
mainly based on the heat of immersion in water and benzene.
The principle of surface silanisation using amino silane is the
decrease or ablating of hydrophilic nature of pristine silica.
Figure 4 NTU values of samples in MEK and 2-propanol
00 10 20 30 40 50 60 70
50
100
150
200
250
300
350
Time (min)
0 10 20 30 40 50 60 70
Time (min)
NT
U (
in2-
Pro
pano
l)
S1 S2 S3 S4 S5 S6 S0
0
50
100
150
200
250
NT
U (
in M
EK
)
S1 S2 S3 S4 S5 S6 S0
Effect of pH on an amino silane treated nano silica
Mehran Rostami, Mohsen Mohseni and Zahra Ranjbar
Pigment & Resin Technology
Volume 40 · Number 6 · 2011 · 363–373
370
The presence of amino groups at the surface provides it with
new organo functional groups while reduces its hydrophilicity.
Jesionowski and Kkrysztafkiewicz (2001) measured the heatof immersion of treated silica with amino silane. They found
that the heat of immersion of amino treated silicas increased inboth water and benzene. However, the authors reported that
the degree of hydrophobisation of amino silane treated silicahad increased. This means that the presence of amino silane
has two roles. The first role results from the siloxane and
alkyl structure (hydrophobic) and the second comes fromthe amino functionality (hydrophilic). The overall result is
reducing hydrophilic properties of silica and imparting surfacefunctional groups. Further studies with these treated particles
are being performed in our laboratory to investigate the effectof these particles in a polyurethane film.
Rheological studies of particles suspension
The rheological properties of the fumed silica dispersions areinfluenced by both the dispersion state and the interaction
between particles and the medium (Naviroj et al., 1984).However, it is difficult to discuss the respective contribution
of these effects, as the dispersion state is also related to thesurface interaction. To study the effect of surface chemistry on
the rheological behaviour of samples on acrylic based polyol
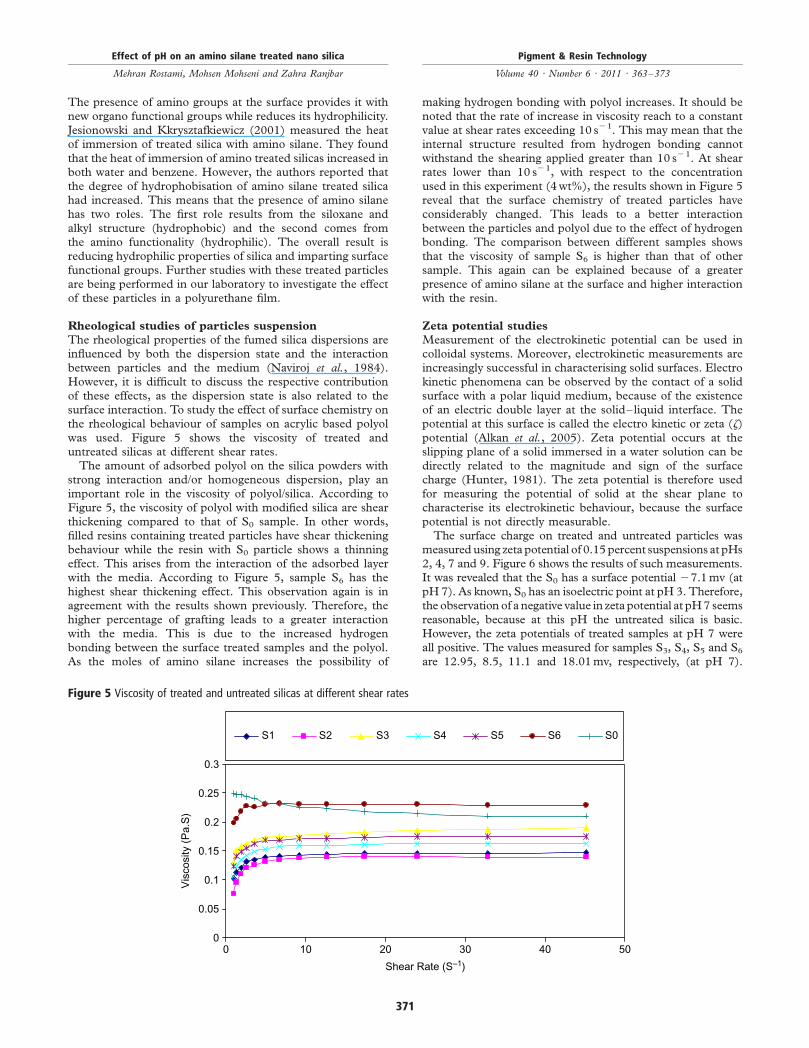
was used. Figure 5 shows the viscosity of treated anduntreated silicas at different shear rates.The amount of adsorbed polyol on the silica powders with
strong interaction and/or homogeneous dispersion, play an
important role in the viscosity of polyol/silica. According toFigure 5, the viscosity of polyol with modified silica are shear
thickening compared to that of S0 sample. In other words,
filled resins containing treated particles have shear thickeningbehaviour while the resin with S0 particle shows a thinning
effect. This arises from the interaction of the adsorbed layerwith the media. According to Figure 5, sample S6 has the
highest shear thickening effect. This observation again is inagreement with the results shown previously. Therefore, the
higher percentage of grafting leads to a greater interaction
with the media. This is due to the increased hydrogenbonding between the surface treated samples and the polyol.
As the moles of amino silane increases the possibility of
making hydrogen bonding with polyol increases. It should be
noted that the rate of increase in viscosity reach to a constant
value at shear rates exceeding 10 s21. This may mean that theinternal structure resulted from hydrogen bonding cannot
withstand the shearing applied greater than 10 s21. At shearrates lower than 10 s21, with respect to the concentration
used in this experiment (4wt%), the results shown in Figure 5reveal that the surface chemistry of treated particles have
considerably changed. This leads to a better interaction
between the particles and polyol due to the effect of hydrogenbonding. The comparison between different samples shows
that the viscosity of sample S6 is higher than that of othersample. This again can be explained because of a greater
presence of amino silane at the surface and higher interactionwith the resin.
Zeta potential studies
Measurement of the electrokinetic potential can be used incolloidal systems. Moreover, electrokinetic measurements are
increasingly successful in characterising solid surfaces. Electrokinetic phenomena can be observed by the contact of a solid
surface with a polar liquid medium, because of the existenceof an electric double layer at the solid–liquid interface. The
potential at this surface is called the electro kinetic or zeta (z)
potential (Alkan et al., 2005). Zeta potential occurs at theslipping plane of a solid immersed in a water solution can be
directly related to the magnitude and sign of the surfacecharge (Hunter, 1981). The zeta potential is therefore used
for measuring the potential of solid at the shear plane tocharacterise its electrokinetic behaviour, because the surface
potential is not directly measurable.The surface charge on treated and untreated particles was
measuredusing zeta potential of 0.15percent suspensions at pHs
2, 4, 7 and 9. Figure 6 shows the results of such measurements.It was revealed that the S0 has a surface potential 27.1mv (at
pH 7). As known, S0 has an isoelectric point at pH 3. Therefore,the observation of a negative value in zeta potential at pH7 seems
reasonable, because at this pH the untreated silica is basic.
However, the zeta potentials of treated samples at pH 7 wereall positive. The values measured for samples S3, S4, S5 and S6are 12.95, 8.5, 11.1 and 18.01mv, respectively, (at pH 7).
Figure 5 Viscosity of treated and untreated silicas at different shear rates
00 10 20 30 40 50
0.05
0.1
0.15
0.2
0.25
0.3
Shear Rate (S–1)
Vis
cosi
ty (
Pa.
S)
S1 S2 S3 S4 S5 S6 S0
Effect of pH on an amino silane treated nano silica
Mehran Rostami, Mohsen Mohseni and Zahra Ranjbar
Pigment & Resin Technology
Volume 40 · Number 6 · 2011 · 363–373
371
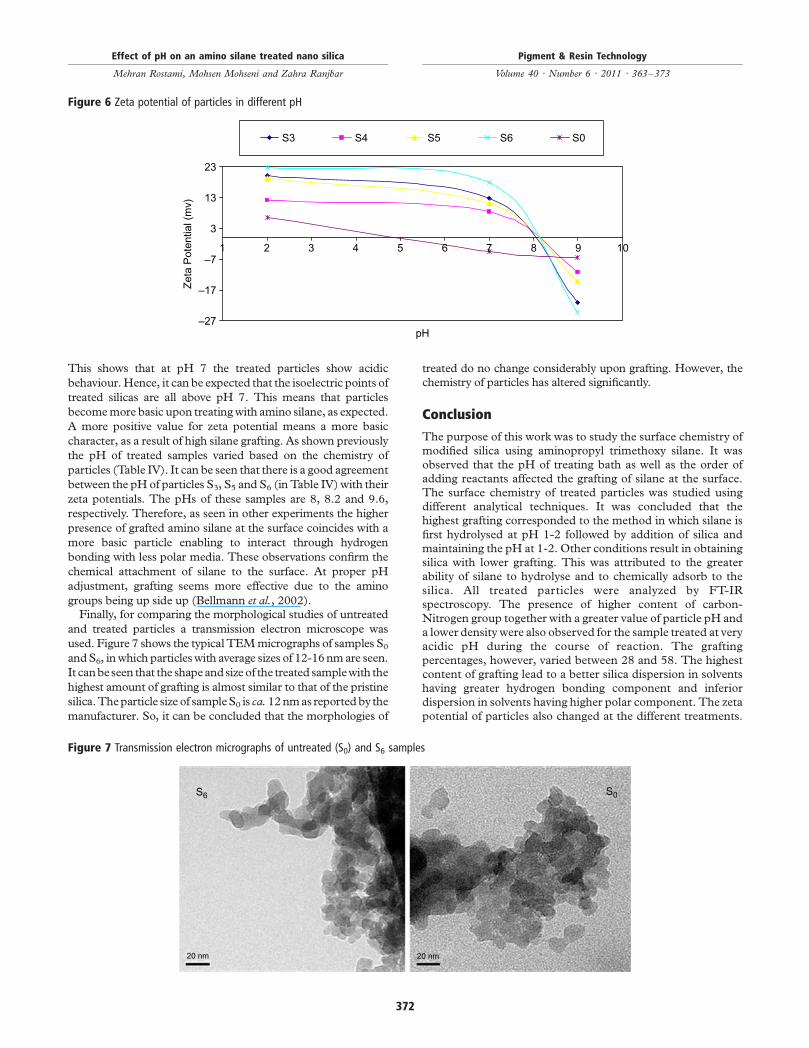
This shows that at pH 7 the treated particles show acidic
behaviour.Hence, it can be expected that the isoelectric points of
treated silicas are all above pH 7. This means that particles
becomemore basic upon treatingwith amino silane, as expected.
A more positive value for zeta potential means a more basic
character, as a result of high silane grafting. As shown previously
the pH of treated samples varied based on the chemistry of
particles (Table IV). It can be seen that there is a good agreement
between the pHof particles S3, S5 and S6 (in Table IV)with their
zeta potentials. The pHs of these samples are 8, 8.2 and 9.6,
respectively. Therefore, as seen in other experiments the higher
presence of grafted amino silane at the surface coincides with a
more basic particle enabling to interact through hydrogen
bonding with less polar media. These observations confirm the
chemical attachment of silane to the surface. At proper pH
adjustment, grafting seems more effective due to the amino
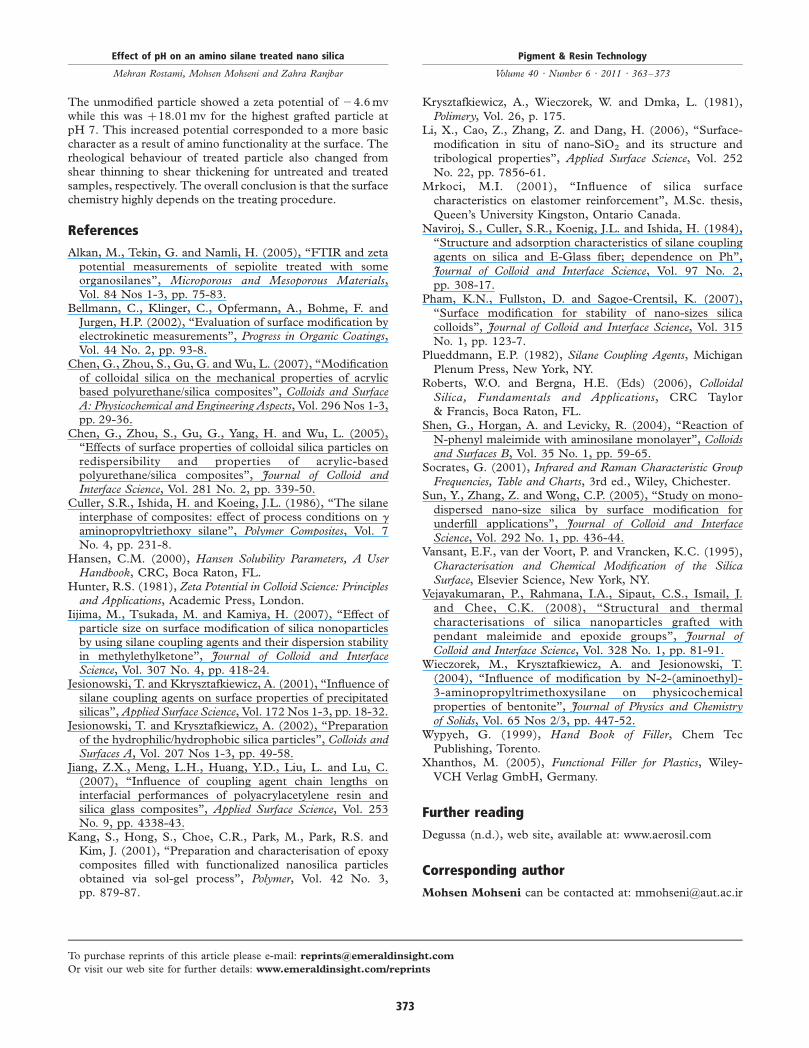
groups being up side up (Bellmann et al., 2002).Finally, for comparing the morphological studies of untreated
and treated particles a transmission electron microscope was
used. Figure 7 shows the typicalTEMmicrographs of samples S0andS6, inwhich particleswith average sizes of 12-16nmare seen.
It canbeseen that the shapeandsizeof the treated samplewith the
highest amount of grafting is almost similar to that of the pristine
silica.Theparticle size of sampleS0 is ca.12nmas reportedby the
manufacturer. So, it can be concluded that the morphologies of
treated do no change considerably upon grafting. However, the
chemistry of particles has altered significantly.
Conclusion
The purpose of this work was to study the surface chemistry ofmodified silica using aminopropyl trimethoxy silane. It was
observed that the pH of treating bath as well as the order ofadding reactants affected the grafting of silane at the surface.The surface chemistry of treated particles was studied usingdifferent analytical techniques. It was concluded that thehighest grafting corresponded to the method in which silane is
first hydrolysed at pH 1-2 followed by addition of silica andmaintaining the pH at 1-2. Other conditions result in obtainingsilica with lower grafting. This was attributed to the greaterability of silane to hydrolyse and to chemically adsorb to the
silica. All treated particles were analyzed by FT-IRspectroscopy. The presence of higher content of carbon-Nitrogen group together with a greater value of particle pH anda lower density were also observed for the sample treated at very
acidic pH during the course of reaction. The graftingpercentages, however, varied between 28 and 58. The highestcontent of grafting lead to a better silica dispersion in solventshaving greater hydrogen bonding component and inferiordispersion in solvents having higher polar component. The zeta
potential of particles also changed at the different treatments.
Figure 6 Zeta potential of particles in different pH
–27
–17
–7
3
13
23
1 2 3 4 5 6 7 8 9 10
pH
Zet
a P
oten
tial (
mv)
S3 S4 S5 S6 S0
Figure 7 Transmission electron micrographs of untreated (S0) and S6 samples
S6 S0
20 nm 20 nm
Effect of pH on an amino silane treated nano silica
Mehran Rostami, Mohsen Mohseni and Zahra Ranjbar
Pigment & Resin Technology
Volume 40 · Number 6 · 2011 · 363–373
372
The unmodified particle showed a zeta potential of 24.6mvwhile this was þ18.01mv for the highest grafted particle atpH 7. This increased potential corresponded to a more basiccharacter as a result of amino functionality at the surface. Therheological behaviour of treated particle also changed fromshear thinning to shear thickening for untreated and treatedsamples, respectively. The overall conclusion is that the surfacechemistry highly depends on the treating procedure.
References
Alkan, M., Tekin, G. and Namli, H. (2005), “FTIR and zetapotential measurements of sepiolite treated with someorganosilanes”, Microporous and Mesoporous Materials,Vol. 84 Nos 1-3, pp. 75-83.
Bellmann, C., Klinger, C., Opfermann, A., Bohme, F. andJurgen, H.P. (2002), “Evaluation of surface modification byelectrokinetic measurements”, Progress in Organic Coatings,Vol. 44 No. 2, pp. 93-8.
Chen, G., Zhou, S., Gu, G. and Wu, L. (2007), “Modificationof colloidal silica on the mechanical properties of acrylicbased polyurethane/silica composites”, Colloids and SurfaceA: Physicochemical and Engineering Aspects, Vol. 296 Nos 1-3,pp. 29-36.
Chen, G., Zhou, S., Gu, G., Yang, H. and Wu, L. (2005),“Effects of surface properties of colloidal silica particles onredispersibility and properties of acrylic-basedpolyurethane/silica composites”, Journal of Colloid andInterface Science, Vol. 281 No. 2, pp. 339-50.
Culler, S.R., Ishida, H. and Koeing, J.L. (1986), “The silaneinterphase of composites: effect of process conditions on g
aminopropyltriethoxy silane”, Polymer Composites, Vol. 7No. 4, pp. 231-8.
Hansen, C.M. (2000), Hansen Solubility Parameters, A UserHandbook, CRC, Boca Raton, FL.
Hunter, R.S. (1981), Zeta Potential in Colloid Science: Principlesand Applications, Academic Press, London.
Iijima, M., Tsukada, M. and Kamiya, H. (2007), “Effect ofparticle size on surface modification of silica nonoparticlesby using silane coupling agents and their dispersion stabilityin methylethylketone”, Journal of Colloid and InterfaceScience, Vol. 307 No. 4, pp. 418-24.
Jesionowski, T. and Kkrysztafkiewicz, A. (2001), “Influence ofsilane coupling agents on surface properties of precipitatedsilicas”, Applied Surface Science, Vol. 172 Nos 1-3, pp. 18-32.
Jesionowski, T. and Krysztafkiewicz, A. (2002), “Preparationof the hydrophilic/hydrophobic silica particles”, Colloids andSurfaces A, Vol. 207 Nos 1-3, pp. 49-58.
Jiang, Z.X., Meng, L.H., Huang, Y.D., Liu, L. and Lu, C.(2007), “Influence of coupling agent chain lengths oninterfacial performances of polyacrylacetylene resin andsilica glass composites”, Applied Surface Science, Vol. 253No. 9, pp. 4338-43.
Kang, S., Hong, S., Choe, C.R., Park, M., Park, R.S. andKim, J. (2001), “Preparation and characterisation of epoxycomposites filled with functionalized nanosilica particlesobtained via sol-gel process”, Polymer, Vol. 42 No. 3,pp. 879-87.
Krysztafkiewicz, A., Wieczorek, W. and Dmka, L. (1981),
Polimery, Vol. 26, p. 175.Li, X., Cao, Z., Zhang, Z. and Dang, H. (2006), “Surface-
modification in situ of nano-SiO2 and its structure and
tribological properties”, Applied Surface Science, Vol. 252
No. 22, pp. 7856-61.Mrkoci, M.I. (2001), “Influence of silica surface
characteristics on elastomer reinforcement”, M.Sc. thesis,
Queen’s University Kingston, Ontario Canada.Naviroj, S., Culler, S.R., Koenig, J.L. and Ishida, H. (1984),
“Structure and adsorption characteristics of silane coupling
agents on silica and E-Glass fiber; dependence on Ph”,
Journal of Colloid and Interface Science, Vol. 97 No. 2,
pp. 308-17.Pham, K.N., Fullston, D. and Sagoe-Crentsil, K. (2007),
“Surface modification for stability of nano-sizes silica
colloids”, Journal of Colloid and Interface Science, Vol. 315No. 1, pp. 123-7.
Plueddmann, E.P. (1982), Silane Coupling Agents, Michigan
Plenum Press, New York, NY.Roberts, W.O. and Bergna, H.E. (Eds) (2006), Colloidal
Silica, Fundamentals and Applications, CRC Taylor
& Francis, Boca Raton, FL.Shen, G., Horgan, A. and Levicky, R. (2004), “Reaction of
N-phenyl maleimide with aminosilane monolayer”, Colloidsand Surfaces B, Vol. 35 No. 1, pp. 59-65.
Socrates, G. (2001), Infrared and Raman Characteristic GroupFrequencies, Table and Charts, 3rd ed., Wiley, Chichester.
Sun, Y., Zhang, Z. and Wong, C.P. (2005), “Study on mono-
dispersed nano-size silica by surface modification for
underfill applications”, Journal of Colloid and InterfaceScience, Vol. 292 No. 1, pp. 436-44.
Vansant, E.F., van der Voort, P. and Vrancken, K.C. (1995),
Characterisation and Chemical Modification of the SilicaSurface, Elsevier Science, New York, NY.
Vejayakumaran, P., Rahmana, I.A., Sipaut, C.S., Ismail, J.
and Chee, C.K. (2008), “Structural and thermal
characterisations of silica nanoparticles grafted with
pendant maleimide and epoxide groups”, Journal ofColloid and Interface Science, Vol. 328 No. 1, pp. 81-91.
Wieczorek, M., Krysztafkiewicz, A. and Jesionowski, T.
(2004), “Influence of modification by N-2-(aminoethyl)-
3-aminopropyltrimethoxysilane on physicochemical
properties of bentonite”, Journal of Physics and Chemistryof Solids, Vol. 65 Nos 2/3, pp. 447-52.
Wypyeh, G. (1999), Hand Book of Filler, Chem Tec
Publishing, Torento.Xhanthos, M. (2005), Functional Filler for Plastics, Wiley-
VCH Verlag GmbH, Germany.
Further reading
Degussa (n.d.), web site, available at: www.aerosil.com
Corresponding author
Mohsen Mohseni can be contacted at: [email protected]
Effect of pH on an amino silane treated nano silica
Mehran Rostami, Mohsen Mohseni and Zahra Ranjbar
Pigment & Resin Technology
Volume 40 · Number 6 · 2011 · 363–373
373
To purchase reprints of this article please e-mail: [email protected]
Or visit our web site for further details: www.emeraldinsight.com/reprints