Embed Size (px)
Citation preview
i |
Investigation into mechanisms
of biofilm formation by
Klebsiella pneumoniae
Thesis submitted by
Nur Asyura Binti Nor Amdan
For the degree of
DOCTOR OF PHILOSOPHY
in the
Faculty of Medical Sciences
University College London
Department of Microbial Diseases UCL Eastman Dental Institute
256 Gray’s Inn Road London WC1X 8LD
UK
2018

ii |
For mama and abah..
Verily, with every difficulty, there is relief (94:5)

iii |
Declaration
I hereby certify that the work embodied in this thesis is the result of my own
investigation except where otherwise stated.
iv |
Abstract
Klebsiella pneumoniae is a Gram-negative opportunistic pathogen that
normally causes nosocomial infections such as urinary tract infections,
septicaemia, and respiratory tract infections. K. pneumoniae has become
progressively resistant to the vast majority of antibiotics, and treatment of
these particular infections is very challenging. At present, the emergence of
antibiotic resistance is a widespread phenomenon that has been established
as a major global healthcare threat. The ability of K. pneumoniae to form
biofilms is known as one of the most important factors that contributes to the
spread of this antibiotic-resistant bacterium. Due to that fact, understanding
the mechanisms behind biofilm formation by K. pneumoniae is of the utmost
importance.
Numerous studies have shown that sub-inhibitory concentrations of antibiotics
could induce biofilm formation by clinically important pathogens, for example,
Escherichia coli, Pseudomonas aeruginosa, and Staphylococcus aureus. In
this study, we report for the first time on the effect of sub-minimum inhibitory
concentrations (sub-MICs) of gentamicin and ciprofloxacin on biofilm formation
by K. pneumoniae.
In addition, by using biofilm inhibition and disruption assays, we have also
assessed the role of proteins in formation and composition of K. pneumoniae
biofilms upon cultivation in nutritious and nutrient-poor media. As well as
proteins, the role of polysaccharides and extracellular DNA was also
determined.
v |
Furthermore, the role of type 1 fimbriae (T1F) in biofilm formation by
K. pneumoniae was also determined. Transcription of fimA (the major subunit
of T1F) is phase variable, as its promoter is on an invertible DNA element, fim-
switch (fimS). We investigated the orientation of fimS in all K. pneumoniae
strains used in this study, in planktonic and as biofilm cells, upon cultivation in
tryptic soy broth (TSB) and artificial urine medium (AUM).
Finally, we have also determined the role of outer membrane porins, OmpK35
and OmpK36 in biofilm formation by K. pneumoniae. We developed isogenic
mutants of ∆ompK35 and ∆ompK36 strains. The capacity to form biofilms by
the mutant strains compared to parental strains was examined in two different
models, a microtitre plate model and a model using catheter pieces.
Currently, we still lack a full understanding on the mechanisms of biofilm
formation by K. pneumoniae which is important in order to develop new
treatments to reduce the threat of biofilm-mediated infections by
K. pneumoniae.
vi |
Impact statement
An understanding of the mechanisms of biofilm formation by Klebsiella
pneumoniae is very important since this pathogen is classified as one of the
most prevalent bacterial species that cause nosocomial infections. Having the
capacity to form biofilms is among the contributing factors that result in
tolerance to antibiotics by K. pneumoniae.
The findings in this study have shown that exposure of K. pneumoniae to sub-
minimum inhibitory concentrations (sub-MICs) of commonly used antibiotics:
gentamicin and ciprofloxacin in three different conditions, did not induce biofilm
formation by K. pneumoniae. This contrasts with several studies which have
shown that antibiotics at sub-inhibitory concentrations could induce biofilm
formation by other clinically important pathogens such as Escherichia coli and
Pseudomonas aeruginosa.
Our data also suggest that proteins could play an important role in the
composition of extracellular polymeric substances (EPS) and biofilm formation
by K. pneumoniae. This data provides important insights on biofilm formation
by K. pneumoniae since very little is known with regard to the composition of
biofilms of K. pneumoniae.
We also investigated the orientation of the fim-switch (fimS) which controls
expression of type 1 fimbriae (T1F) in biofilm formation by K. pneumoniae.
The orientation of fimS was determined in planktonic and biofilm cells upon
cultivation of seven examined K. pneumoniae strains in two different media.
vii |
This data provide further knowledge on the orientation of fimS which controls
the expression of T1F in nutritious and nutrient-poor media.
Due to the fact that K. pneumoniae contributes to a high number of cases of
biofilm-associated infections such as catheter-associated urinary tract
infections, we have provided further knowledge on the causing factors to this
problem. The data in this study has also shown that OmpK35 and OmpK36
do not contribute to biofilm formation by K. pneumoniae upon growth on
clinically relevant surfaces such as silicone catheter surfaces.
Currently, commonly prescribed antibiotics for antibiotic resistant
K. pneumoniae infections are not very effective at eradicating these kinds of
infections. Thus, new approaches such as targeting the contributing factors
leading to biofilm formation by K. pneumoniae are important. This study
provides insight on biofilm formation by K. pneumoniae that could be useful for
future investigation.

viii |
Acknowledgements
My utmost gratitude and appreciation goes to my supervisors, Dr Sean P. Nair
and Dr Adam P. Roberts who have guided and supported me throughout my
research and dissertation. Their constant encouragement and great
supervision were truly inspiring.
This dissertation would not have been possible without the steadfast
encouragement and moral support from my beloved family especially my dad,
my mum, Along, Kak Yati, Kakak Alia, and Adik Aida. Thank you for always
being there for me.
I want to especially express my appreciation to my close friends (you know
who you are), my travel buddies (Najiah, Ayna, Zawa, and Hanim) and these
four ‘culprits’ (Supathep, Shirene, Supanan, and Sophia) whose
companionship has helped me tremendously in this journey.
I am indebted to my gracious and helpful laboratory members from Department
of Microbial Diseases, especially Dr Haitham Hussain, Dr Anna Tymon, and
also to Vanessa, Franky, Liam, Ajijur, Enas, Marika, Zeina, Ladan, Mehmet,
Deena, Hadeel, Shatha, Ingrid, Tracey, Arely, Khadija, Erni, Catie, Sarah,
Andre, Dallas, Ahmed, Carolina, and all my colleagues whose support,
assistance and opinion have enabled me to develop and undertake my
research as planned.
I would also like to express my gratitude to all Malaysian friends in London and
in the UK (Asrah, Shikin, Mazlina, Ashraf, Irina, Nisaa, Juzaili, Awis, Muzamir,
Shahrul, Hazeeq, Shafiq, Azizi, Ehsan, Iqbal, Siti, Kak Kurshiah, Faten,

ix |
Fadilah, Sudin, Firdaus, Asrar, Amal, and Afzal) for their unwavering mental
support and assistance.
Last but not least, it is with much honour I would like to thank the Government
of Malaysia for providing me the financial support under the Majlis Amanah
Rakyat (MARA) Sponsorship Award.
x |
Table of contents
Declaration .................................................................................................. iii
Abstract ....................................................................................................... iv
Impact statement ........................................................................................ vi
Acknowledgements .................................................................................. viii
Table of contents ......................................................................................... x
List of figures .......................................................................................... xviii
List of tables ............................................................................................. xxii
List of abbreviations ............................................................................... xxiv
1.0 General introduction ....................................................................... 1
1.1 Klebsiella genus ................................................................................ 4
1.1.1 Klebsiella pneumoniae ...................................................................... 5
1.2. Antibiotherapy for K. pneumoniae infection....................................... 6
1.3 Clinical manifestation of infections caused by K. pneumoniae ......... 8
1.4 Mechanisms of antibiotic resistance ............................................... 10
1.4.1 Extended spectrum β-lactamase (ESBL) and carbapenemase-
producing K. pneumoniae ............................................................... 14
1.4.2 Evolution of β-lactamases in K. pneumoniae .................................. 17
1.4.3 Epidemiology of multidrug-resistant K. pneumoniae ....................... 19
1.5 Mechanisms of K. pneumoniae pathogenicity ................................. 25
1.5.1 The capsule .................................................................................... 27
1.5.2 Lipopolysaccharides (LPS) ............................................................. 28
1.5.3 Siderophores ................................................................................... 29
1.5.4 Fimbriae .......................................................................................... 30
1.5.5 Outer membrane porins (Omps) ..................................................... 31
xi |
1.6 Biofilm formation by K. pneumoniae ............................................... 34
1.7 Mechanisms of antibiotic resistance in bacterial biofilms ................ 41
1.8 Aims and hypothesis of this study ................................................... 43
2.0 Materials and Methods ................................................................. 46
2.1 Sources of media, enzymes and reagent ........................................ 46
2.2 Bacterial strains and plasmids ........................................................ 47
2.3 Growth condition and storage of bacteria........................................ 56
2.4 Molecular biology methods ............................................................. 56
2.4.1 Genomic DNA and plasmid extraction ............................................ 56
2.4.2 Oligo synthesis ................................................................................ 57
2.4.3 Polymerase chain reaction (PCR) amplification .............................. 61
2.4.4 Agarose gel electrophoresis ............................................................ 61
2.4.5 PCR purification and DNA purification from gels ............................. 62
2.4.6 DNA sequencing ............................................................................. 62
2.4.7 In silico sequence analysis and protein structural analysis ............. 63
2.4.8 Restriction endonuclease reactions ................................................ 65
2.4.9 DNA ligation reaction ...................................................................... 65
2.4.10 Dephosphorylation reactions ........................................................... 65
2.4.11 Transformation of plasmids into E. coli -select silver efficiency
competent cells ............................................................................... 66
2.4.12 Blue/white screening ....................................................................... 66
2.5 Statistical analysis ........................................................................... 67
3.0 Investigation into the effect of antibiotic exposure on
Klebsiella pneumoniae biofilm formation ................................................ 68
3.1 Introduction ..................................................................................... 69
3.1.1 In vitro biofilm models ..................................................................... 69
xii |
3.1.2 The effects of antibiotic exposure on biofilm formation ................... 70
3.1.3 Justification of the experimental design .......................................... 73
3.1.4 Modes of action and mechanisms of resistance of antibiotics ......... 74
3.1.4.1 Gentamicin ............................................................................. 74
3.1.4.2 Ciprofloxacin ........................................................................... 77
3.1.5 Aims of this chapter ........................................................................ 79
3.2 Materials and methods .................................................................... 80
3.2.1 Biofilm formation under different growth conditions and in different
media .............................................................................................. 80
3.2.2 Pre-exposure of cultures to antibiotics prior to biofilm formation ..... 80
3.2.3 Exposure of mid-log phase cultures to antibiotics during biofilm
formation ......................................................................................... 81
3.2.4 Exposure of mature biofilms to antibiotics ....................................... 82
3.2.5 Crystal violet quantification of biofilm formation .............................. 82
3.3 Results ............................................................................................ 84
3.3.1 Optimisation of growth conditions and growth media for biofilm
formation assays ............................................................................. 84
3.3.2 Pre-exposure of cultures to gentamicin or ciprofloxacin prior to biofilm
formation ......................................................................................... 89
3.3.3 Exposure of mid-log phase cultures to gentamicin or ciprofloxacin
during 24 h biofilm formation ........................................................... 91
3.3.4 Exposure of mature biofilms to antibiotics ....................................... 93
3.4 Discussion ....................................................................................... 97
3.5 Conclusion .................................................................................... 102
4.0 Investigation into extracellular polymeric substances (EPS) of
Klebsiella pneumoniae biofilms ............................................................. 104
xiii |
4.1 Introduction ................................................................................... 104
4.1.1 The biofilm matrix .......................................................................... 104
4.1.1.1 Proteins ................................................................................ 105
4.1.1.2 Extracellular DNA (eDNA) .................................................... 105
4.1.1.3 Polysaccharides ................................................................... 106
4.1.1.3.1 Cellulose ............................................................................... 106
4.1.1.3.2 Poly-N-acetylglucosamine (PNAG) ....................................... 107
4.1.2 Extracellular polymeric substances (EPS) produced by
K. pneumoniae during biofilm formation ........................................ 108
4.1.2.1 Biofilm EPS of K. pneumoniae upon cultivation in nutrient-rich
media .................................................................................... 108
4.1.3 Artificial urine medium (AUM) ....................................................... 109
4.1.4. Aims of this chapter ...................................................................... 110
4.2 Materials and methods .................................................................. 111
4.2.1 Bioinformatic analysis ................................................................... 111
4.2.2 Media ............................................................................................ 111
4.2.3 Growth kinetics of examined K. pneumoniae strains in
TSB and AUM ............................................................................... 114
4.2.3.1 Determination of relationship between absorbance (OD600) and
colony forming unit per ml (CFU/ml) ..................................... 114
4.2.3.2 Determination of bacterial growth rate .................................. 115
4.2.4 Biofilm assays in TSB and AUM ................................................... 117
4.2.5 Biofilm inhibition and disruption assays ........................................ 117
4.2.5.1 Biofilm inhibition assays ....................................................... 117
4.2.5.2 Biofilm disruption assays ...................................................... 118
4.3 Results .......................................................................................... 119
4.3.1 Bioinformatic analysis ................................................................... 119
xiv |
4.3.1.1 Comparative analysis of bacterial cellulose synthase (bcs)
operon .................................................................................. 119
4.3.1.2 Comparative analysis of pga operon .................................... 128
4.3.2 Determination of the relationship between absorbance and colony
forming unit per ml (CFU/ml) ......................................................... 134
4.3.3 Growth kinetics of K. pneumoniae strains in TSB and AUM ......... 138
4.3.4 Quantification of K. pneumoniae biofilm upon cultivation in
TSB and AUM ............................................................................... 143
4.3.5 Biofilm inhibition and disruption assays ........................................ 145
4.3.5.1 Effect of 100 µg/ml proteinase K on biofilm formation and on
24 h pre-formed biofilms ....................................................... 146
4.3.5.2 Effect of 100 µg/ml of DNase on biofilm formation and on
24 h pre-formed biofilms ....................................................... 149
4.3.5.3 Effect of NaIO4 on 24 h pre-formed biofilms ......................... 152
4.3.5.4 Effect of cellulase on biofilm formation and on
24 h pre-formed biofilms ....................................................... 154
4.4 Discussion ..................................................................................... 157
4.5 Conclusion .................................................................................... 168
5.0 Investigation into the orientation of the Klebsiella pneumoniae
fim-switch which controls expression of type 1 fimbriae..................... 170
5.1 Introduction ................................................................................... 170
5.1.1 Major fimbriae of K. pneumoniae ...................................................... 170
5.1.1.1 Type 1 fimbriae (T1F) ........................................................... 173
5.1.1.1.1 Fim-switch (fimS) orientation ................................................ 177
5.1.1.2 Type 3 fimbriae (T3F) ........................................................... 179
5.1.2 Role of type 1 fimbriae (T1F) in biofilm formation by
K. pneumoniae .............................................................................. 181
xv |
5.2 Materials and Methods .................................................................. 187
5.2.1 DNA isolation from planktonic and biofilm cells ............................. 187
5.2.2 Determination of the invertible element (fimS) orientation............. 188
5.2.3 Bioinformatic analysis of the T1F operon ...................................... 188
5.3 Results .......................................................................................... 189
5.3.1 Determination of fimS orientation .................................................. 189
5.3.2 Analysis of the T1F operon sequences ......................................... 192
5.4 Discussion ..................................................................................... 197
5.5 Conclusion .................................................................................... 203
6.0 Role of OmpK35 and OmpK36 porins in biofilm formation by
Klebsiella pneumoniae ............................................................................ 205
6.1 Introduction ................................................................................... 205
6.1.1 K. pneumoniae outer membrane porins (Omps) ........................... 206
6.1.2 Major non-specific porins of K. pneumoniae ................................. 207
6.1.2.1 OmpK35 ............................................................................... 207
6.1.2.2 OmpK36 ............................................................................... 208
6.1.2.3 Structure of non-specific porins ............................................ 210
6.1.3 Role of outer membrane porins (Omps) in biofilm formation ......... 212
6.1.4 Regulation of OmpK35 and OmpK36 expression ........................ 217
6.1.4.1 EnvZ-OmpR two-component system .................................... 217
6.1.5 K. pneumoniae and urinary tract infections ................................... 219
6.1.5.1 Catheter-associated urinary tract infections (CAUTIs) .......... 220
6.1.5.2 Biofilms on catheters ............................................................ 220
6.1.6 Aims of this chapter ...................................................................... 221
6.2 Materials and methods .................................................................. 222
6.2.1 Bacterial strains and plasmid ........................................................ 222
xvi |
6.2.2 Determination of genetic context of ompK35 and ompK36 of
K. pneumoniae .............................................................................. 222
6.2.3 Analysis of protein structure .......................................................... 223
6.2.4 Development of ompK35 and ompK36 mutant strains .................. 225
6.2.4.1 Screening of ompK35 and ompK36 ...................................... 225
6.2.4.2 Construction of mutant constructs using SOE PCR .............. 225
6.2.4.3 Construction of new mutant cassettes using aad9 as a selective
marker .................................................................................. 230
6.2.4.4 Modification of the pKD46 helper plasmid by replacing bla with
aac(3)-IV ............................................................................... 233
6.2.4.5 Preparation of electrocompetent K. pneumoniae cells ....... 236
6.2.4.6 Electroporation of pKD46-apra into electrocompetent
K. pneumoniae cells ............................................................. 237
6.2.4.7 Preparation of electrocompetent K. pneumoniae harbouring
pKD46-apra cells .................................................................. 238
6.2.4.8 Electroporation of ompK35 and ompK36 mutant cassettes into
electrocompetent K. pneumoniae harbouring
pKD46-apra cells .................................................................. 239
6.2.5 Complementation of ompK35 and ompK36 strains .................. 241
6.2.5.1 Preparation of ompK35 and ompK36 complementation
constructs ............................................................................. 241
6.2.6 Epsilometer test (E-test) method ................................................... 243
6.2.7 Determination of MIC using agar and broth dilution methods ....... 243
6.2.8 Growth kinetics of wild type and mutant strains in TSB and AUM . 244
6.2.9 Biofilm formation assays in microtitre plate ................................... 244
6.2.10 Biofilm formation assays on catheter pieces ................................. 245
6.2.10.1 Staining and enumeration of biofilm cells on catheter pieces 247
6.3 Results .......................................................................................... 249
xvii |
6.3.1 Determination of genetic context of ompK35 and ompK36 ........... 249
6.3.2 Analysis of OmpC, OmpK35 and OmpK36 protein structure ........ 258
6.3.3 Amplification of ompK35 and ompK36 .......................................... 261
6.3.4 Development of mutant constructs ................................................ 263
6.3.5 Development of ΔompK35 or ΔompK36 strains ............................ 265
6.3.6 Development of complemented strains ........................................ 271
6.3.6.1 Construction of ompK35 complementation construct harbouring
tet(M) .................................................................................... 271
6.3.7 Antimicrobial susceptibility testing ................................................. 274
6.3.8 Growth kinetics of wild type and mutant strains upon cultivation in
TSB and AUM ............................................................................... 277
6.3.9 Role of OmpK35 and OmpK36 in biofilm formation by K. pneumoniae
in 96-well polystyrene tissue culture treated plates ....................... 284
6.3.10 Role of OmpK35 and OmpK36 in biofilm formation by K. pneumoniae
on catheter pieces ......................................................................... 286
6.4 Discussion ..................................................................................... 289
6.5 Conclusion .................................................................................... 300
7.0 General discussion and future directions ................................ 303
7.1 General discussion ....................................................................... 303
7.2 Future directions ........................................................................... 309
8.0 References ................................................................................... 313
Appendices............................................................................................... 369
xviii |
List of figures
Figure 1-1 Mechanisms of antibiotic resistance in Gram-negative bacteria. .. 2
Figure 1-2 Hypermucoviscous morphology of K. pneumoniae strain
Kpneu_110. ................................................................................... 5
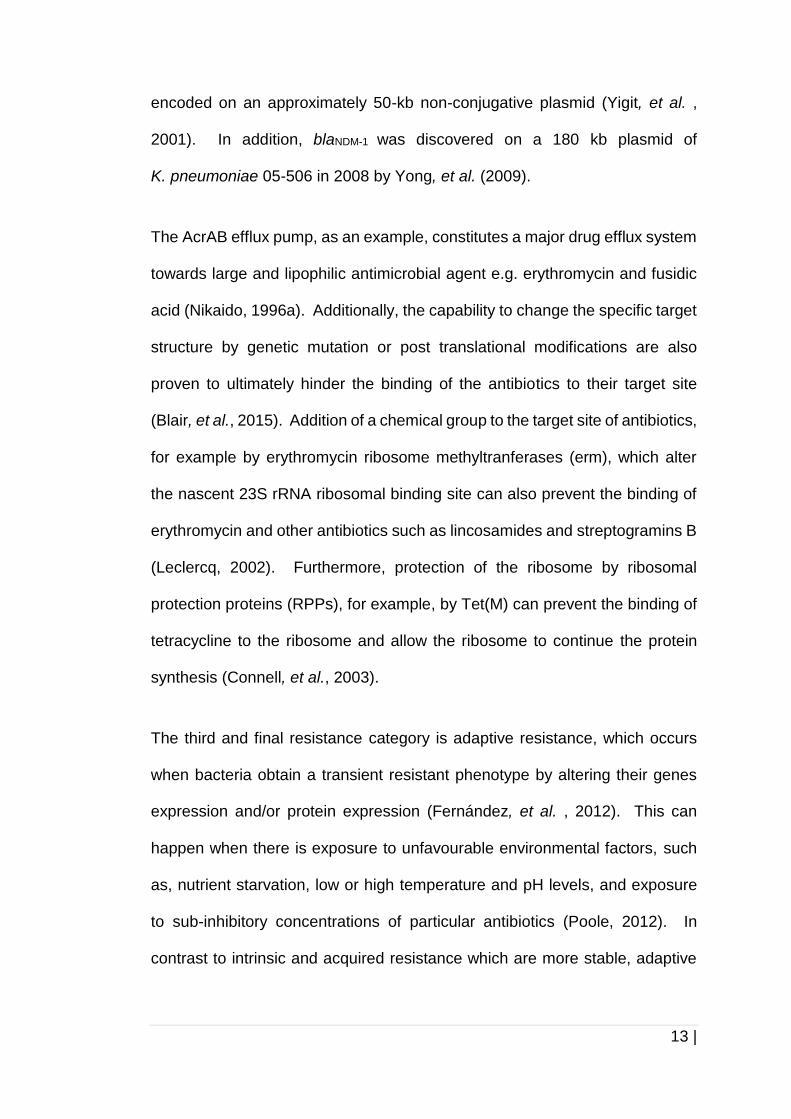
Figure 1-3 Chemical structure of ampicillin. β- lactam ring is circled
in black. ....................................................................................... 14
Figure 1-4 The resistance movement of carbapenem-resistant
Enterobacteriaceae. .................................................................... 20
Figure 1-5 Surveillance atlas of the increasing number of K. pneumoniae
antibiotic resistance cases starting from A) 2005 to B) 2016
in Europe. .................................................................................... 22
Figure 1-6 Virulence factors of K. pneumoniae. ........................................... 26
Figure 1-7 Gram-positive and Gram-negative cell walls. ............................. 32
Figure 3-1 The modes of action of gentamicin. ............................................ 74
Figure 3-2 Chemical structure of gentamicin. .............................................. 76
Figure 3-3 Chemical structure of ciprofloxacin. ............................................ 77
Figure 3-4 Simplified diagram of methodology used in this chapter. ............ 83
Figure 3-5 Biofilm formation by K. pneumoniae under different growth
conditions. ................................................................................... 86
Figure 3-6 Biofilm formation by K. pneumoniae in two different media. ....... 88
Figure 3-7 Effect of pre-exposure of cultures to gentamicin or ciprofloxacin
prior to biofilm formation by K. pneumoniae. ............................... 90
Figure 3-8 Effect of antibiotic exposure during 24 h incubation on biofilm
formation by K. pneumoniae. ...................................................... 92
Figure 3-9 Effect of antibiotic exposure on growth of K. pneumoniae. ......... 94
xix |
Figure 3-10 Effect of antibiotic exposure on mature biofilms of
K. pneumoniae. ........................................................................... 96
Figure 4-1 Schematic presentation of bcs operons of K. pneumoniae. ...... 122
Figure 4-2 Partial multiple sequence alignment of bcsO and BcsO. .......... 123
Figure 4-3 Partial multiple sequence alignment of bcsQ and BcsQ. .......... 124
Figure 4-4 Partial multiple sequence alignment of bcsB_I and BcsB_I. ..... 125
Figure 4-5 Partial multiple sequence alignment of bcsC_I and BcsC_I. ..... 126
Figure 4-6 Schematic presentation of pgaABCD operon. .......................... 129
Figure 4-7 Pairwise sequence alignment of Pga amino acid. .................... 133
Figure 4-8 The relationship between absorbance and CFU/ml of
K.pneumoniae upon cultivation in TSB. .................................... 136
Figure 4-9 Growth of K. pneumoniae in two different growth media. ......... 141
Figure 4-10 Biofilm formation by K. pneumoniae in TSB and AUM............ 144
Figure 4-11 Biofilm inhibition and disruption assays in the presence of
100 µg/ml proteinase K. ............................................................ 148
Figure 4-12 Biofilm inhibition and disruption assays in the presence of
100 µg/ml DNase. ..................................................................... 151
Figure 4-13 Biofilm disruption assays in the presence of 10 mM NaIO4. ... 153
Figure 4-14 Biofilm inhibition and disruption assays in the presence of
0.1 % cellulase. ......................................................................... 156
Figure 4-15 Periodate oxidation of cellulose monomer. ............................. 165
Figure 5-1 The chaperon-usher (CU) pathway of T1F biogenesis. ............ 172
Figure 5-2 The structure of T1F mannose-sensitive fimbriae. .................... 174
Figure 5-3 Schematic diagram of T1F operon............................................ 176
Figure 5-4 Schematic diagram of fimE, fimS and fimA. .............................. 178
xx |
Figure 5-5 The structure of T3F mannose-resistant fimbriae. .................... 180
Figure 5-6 Determination of fimS orientation in biofilm cells. ..................... 191
Figure 5-7 Multiple sequence alignment of FimK. ...................................... 196
Figure 6-1 The structure of nonspecific porin. ............................................ 211
Figure 6-2 Regulation of the porin genes by EnvZ/OmpR system. ............ 218
Figure 6-3 Schematic diagram of development of mutant constructs using
ompK35 as an example. ........................................................... 228
Figure 6-4 Schematic diagram of erm1(B) replacement with aad9 in ompK35
cassette as an example. ........................................................... 232
Figure 6-5 Schematic diagram of the replacement of bla with aac(3)-IV
in pKD46. .................................................................................. 235
Figure 6-6 Flow diagram of the gene replacement by double cross over
homologous recombination in K. pneumoniae. ......................... 240
Figure 6-7 Construction of pUC19-tet(M)_ompK35 complementation
construct. .................................................................................. 242
Figure 6-8 Biofilm formation assay on catheter pieces .............................. 246
Figure 6-9 Genetic context of ompK35 and ompK36. ................................ 249
Figure 6-10 Multiple sequence alignment of upstream and downstream
regions of ompK35. ................................................................... 253
Figure 6-11 The upstream region of ompK36 with a putative promoter site
of rcsD. ...................................................................................... 254
Figure 6-12 Multiple sequence alignment of upstream and downstream
regions of ompK36. ................................................................... 257
Figure 6-13 Amino acid multiple sequence alignment of OmpC, OmpK36 and
OmpK35. ................................................................................... 260
xxi |
Figure 6-14 Screening for ompK35 and ompK36. ...................................... 262
Figure 6-15 Amplification of ompK35 and ompK36 mutant cassettes. ....... 264
Figure 6-16 Location of the external primers for confirmation of mutant
strains. ...................................................................................... 268
Figure 6-17 Confirmation of mutant strains by PCR. .................................. 270
Figure 6-18 Construction of ompK35 complementation constructs. ........... 272
Figure 6-19 Confirmation of the complementation constructs by digestion. 273
Figure 6-20 Growth curve of Kpneu_1, C3091, and isogenic mutants
in TSB. ...................................................................................... 279
Figure 6-21 Growth curve of Kpneu_1, C3091, and isogenic mutants
in AUM. ..................................................................................... 281
Figure 6-22 Biofilm formation of Kpneu_1, C3091, and their isogenic mutants
in TSB and AUM. ...................................................................... 285
Figure 6-23 Biofilm formation and cell viability of Kpneu_1 and its isogenic
mutants on silicone catheter surfaces. ...................................... 287
Figure 6-24 Biofilm formation and cell viability of C3091 and its isogenic
mutants on silicone catheter surfaces. ...................................... 288
xxii |
List of tables
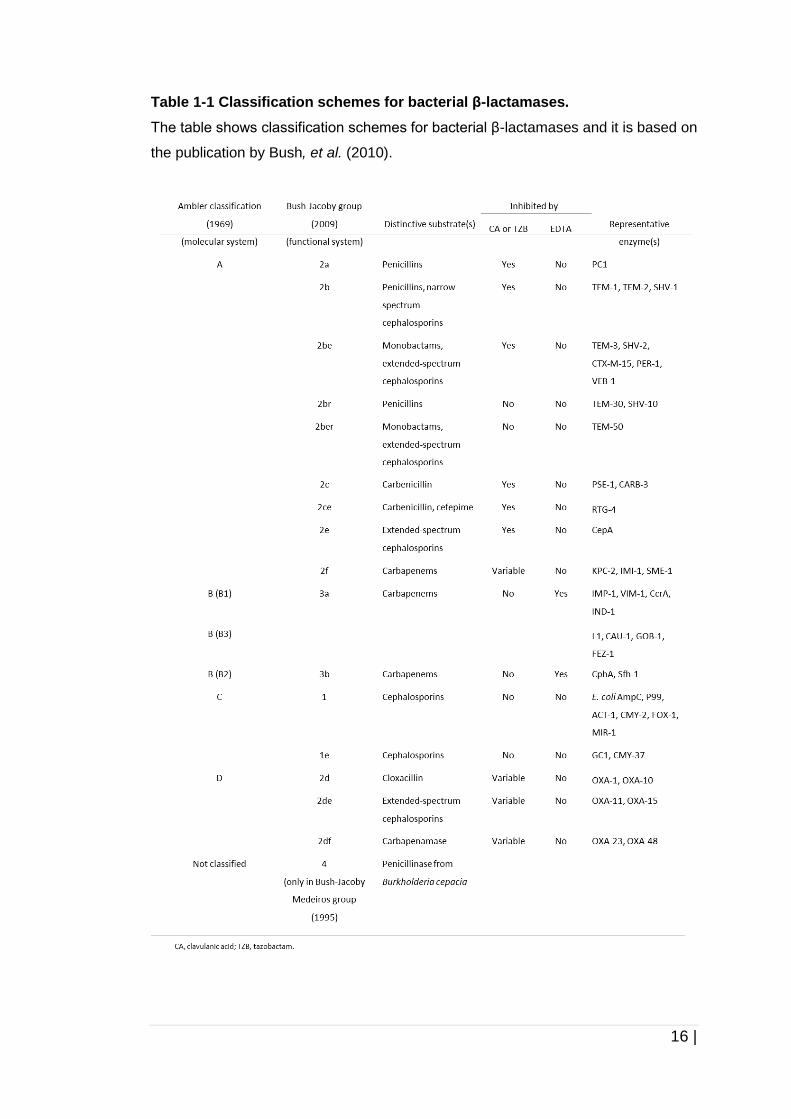
Table 1-1 Classification schemes for bacterial β-lactamases. ..................... 16
Table 1-2 Involvement of capsule in biofilm formation by several
K. pneumoniae strains. ............................................................... 37
Table 2-1 Bacterial strains used in this study. .............................................. 47
Table 2-2 Antibiotic susceptibility profile of clinical isolates of K. pneumoniae
used in this study. ....................................................................... 50
Table 2-3 Determination of MIC of antibiotics for K. pneumoniae strains used
in this study using E-test. ............................................................ 51
Table 2-4 Distribution of antibiotic resistance genes in isolates used in this
study. .......................................................................................... 52
Table 2-5 Distribution of virulence clusters in isolates used in this study. .... 53
Table 2-6 Plasmids used in this study .......................................................... 54
Table 2-7 Primers used throughout this study. ............................................ 57
Table 2-8 Bioinformatic programmes used in this study. ............................. 63
Table 4-1 Media used in this study ............................................................ 112
Table 4-2 Amino acid variation in proteins encoded by the bcs operon. .... 127
Table 4-3 Amino acid variation in proteins encoded by pga operon........... 129
Table 4-4 Growth rate constant (µ) and doubling time (td) of K. pneumoniae
strains upon cultivation in TSB using OD600 and CFU/ml as
parameters ................................................................................ 137
Table 4-5 Growth rate constant (µ) and doubling time (td) of K. pneumoniae
strains upon cultivation in TSB and AUM. ................................. 142
Table 5-1 Involvement of fimbriae in biofilm formation by
Enterobacteriaceae. .................................................................. 183
xxiii |
Table 5-2 Orientation of fimS in planktonic and biofilm cells of
K. pneumoniae. ......................................................................... 190
Table 5-3 Amino acid substitutions identified in FimF, FimI, and FimK. ..... 194
Table 6-1 K. pneumoniae porins ................................................................ 207
Table 6-2 Involvement of Omps in initial adhesion or biofilm formation on
abiotic surfaces by Enterobacteriaceae. ................................... 215
Table 6-3 The MIC value of spectinomycin and apramycin against
K. pneumoniae. ......................................................................... 266
Table 6-4 Median MIC of antibiotics and antiseptics for Kpneu_1, C3091, and
their isogenic mutants. .............................................................. 276
Table 6-5 Growth rate constant (µ) and doubling time (td) of Kpneu_1 and
C3091, and their isogenic mutant strains upon cultivation in
TSB and AUM. .......................................................................... 283
xxiv |
List of abbreviations
α Alpha
β Beta
γ Gamma
λ Lambda
°C Degree Celsius
Å Ångström
aa Amino acid
AUM Artificial urine medium
BHI Brain heart infusion
BLAST Basic Local Alignment Search Tool
bp Base pair
CAUTI Catheter-associated urinary tract infection
c-di-GMP Cyclic dimeric guanosine monophosphate
CIAP Calf Intestinal Alkaline Phosphatase
cm Centimeter
CPC Cetylpyridium chloride
CTAB Cetyltrimethylammonium bromide
CFU Colony forming unit
CV Crystal violet
DNA Deoxyribonucleic acid
eDNA Extracellular DNA
EPS Extracellular polymeric substances
ESBL-E ESBL-producing Enterobacteriaceae
fimS Fim-switch
g-force (rcf) Gravitational force (relative centrifugal force)
h Hour
kb Kilobase
LB Luria-Bertani
LPS Lipopolysaccharide
µl Microlitre
µg Microgram
µM Micromolar
xxv |
µF Microfarad
ml Millimetre
mM Millimolar
min Minute
MQ H2O Milli-Q water
nM Nanometer
Ω Ohm
OD Optical density
PBS Phosphate buffered saline
PCR Polymerase chain reaction
PNAG Poly-N-acetylglucosamine
RBS Ribosome binding site
rpm Revolutions per minute
sec Second
SOC Super optimal broth with catabolite repression
SOE Splicing by overlap extension
T1F Type 1 fimbriae
T3F Type 3 fimbriae
TAE Tris acetate EDTA
TSB Tryptic soy broth
UTI Urinary tract infection
X-Gal 5-bromo-4-chloro-3-indolyl-β-D-galactopyranoside
V Volt
v/v volume/volume
v/w volume/weight

1 |
Chapter 1. 0
General introduction
2 |
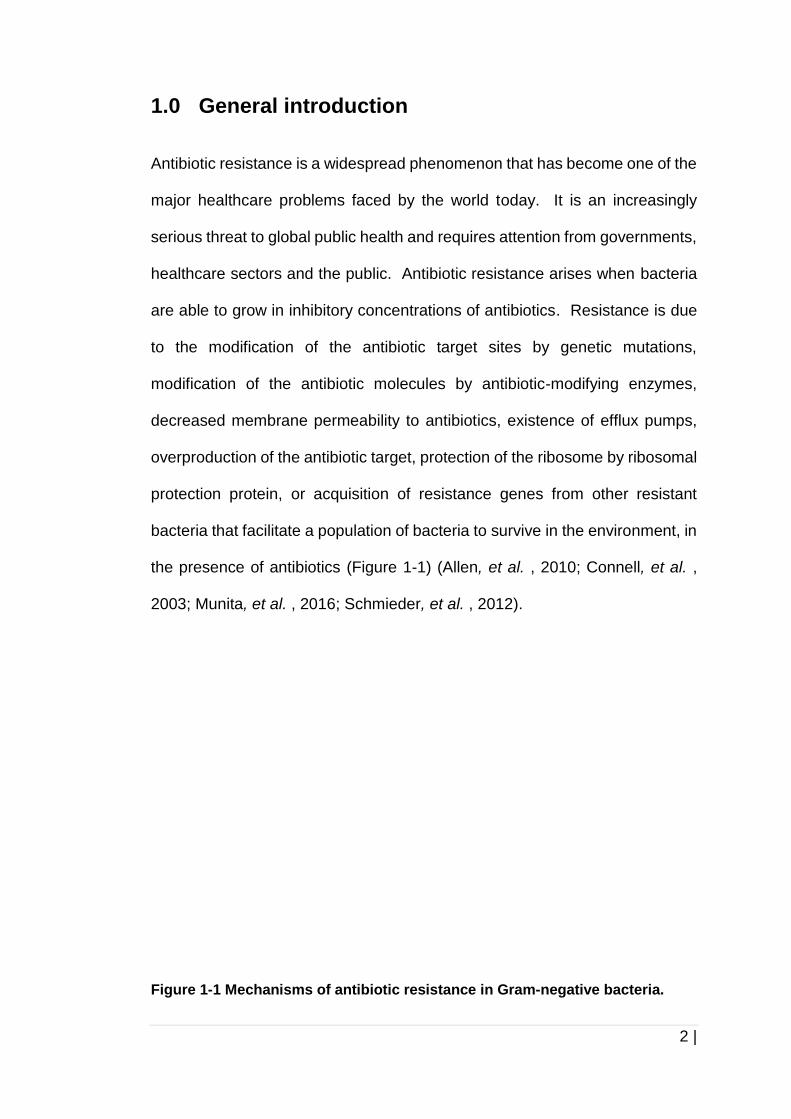
1.0 General introduction
Antibiotic resistance is a widespread phenomenon that has become one of the
major healthcare problems faced by the world today. It is an increasingly
serious threat to global public health and requires attention from governments,
healthcare sectors and the public. Antibiotic resistance arises when bacteria
are able to grow in inhibitory concentrations of antibiotics. Resistance is due
to the modification of the antibiotic target sites by genetic mutations,
modification of the antibiotic molecules by antibiotic-modifying enzymes,
decreased membrane permeability to antibiotics, existence of efflux pumps,
overproduction of the antibiotic target, protection of the ribosome by ribosomal
protection protein, or acquisition of resistance genes from other resistant
bacteria that facilitate a population of bacteria to survive in the environment, in
the presence of antibiotics (Figure 1-1) (Allen, et al. , 2010; Connell, et al. ,
2003; Munita, et al. , 2016; Schmieder, et al. , 2012).
Figure 1-1 Mechanisms of antibiotic resistance in Gram-negative bacteria.
3 |
Several examples of mechanisms of antibiotic resistance in Gram-negative bacteria
include a) impermeability barrier (e.g. preventing erythromycin uptake), b) multidrug
resistance efflux pumps (e.g. for tetracyclines), c) resistance mutations (e.g.
fluoroquinolones), and d) drug inactivation (e.g. β-lactamases against β-lactams).
Figure is re-published with permission (Allen, et al., 2010).
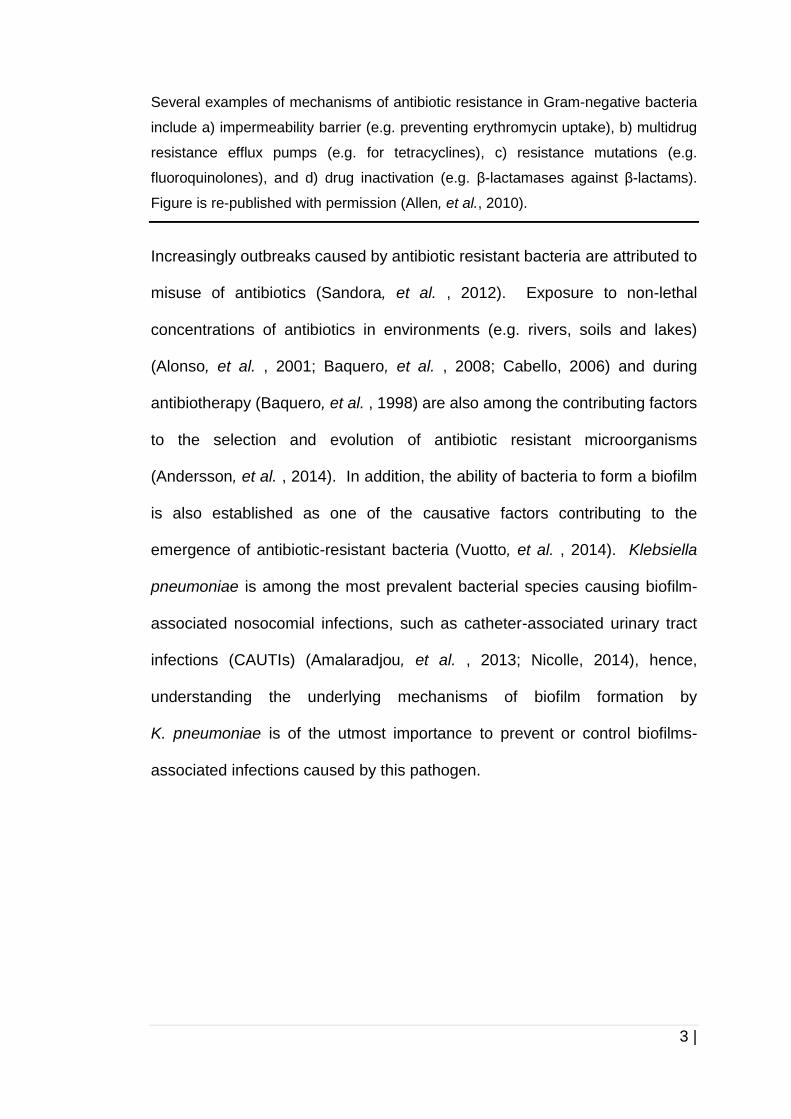
Increasingly outbreaks caused by antibiotic resistant bacteria are attributed to
misuse of antibiotics (Sandora, et al. , 2012). Exposure to non-lethal
concentrations of antibiotics in environments (e.g. rivers, soils and lakes)
(Alonso, et al. , 2001; Baquero, et al. , 2008; Cabello, 2006) and during
antibiotherapy (Baquero, et al. , 1998) are also among the contributing factors
to the selection and evolution of antibiotic resistant microorganisms
(Andersson, et al. , 2014). In addition, the ability of bacteria to form a biofilm
is also established as one of the causative factors contributing to the
emergence of antibiotic-resistant bacteria (Vuotto, et al. , 2014). Klebsiella
pneumoniae is among the most prevalent bacterial species causing biofilm-
associated nosocomial infections, such as catheter-associated urinary tract
infections (CAUTIs) (Amalaradjou, et al. , 2013; Nicolle, 2014), hence,
understanding the underlying mechanisms of biofilm formation by
K. pneumoniae is of the utmost importance to prevent or control biofilms-
associated infections caused by this pathogen.
4 |
1.1 Klebsiella genus
Klebsiella is a genus in the Enterobacteriaceae family together with other
clinically relevant species such as Escherichia coli, Salmonella spp., Yersinia
pestis, Shigella spp., Proteus spp., Serratia spp., Citrobacter spp. and
Enterobacter spp.. Bacteria belonging to the Klebsiella genus are ubiquitous,
frequently colonise humans and animals as commensals, particularly on the
mucosal surfaces of the gastrointestinal tract (Hennequin, et al. , 2009). They
are also abundant in the environment (Struve, et al. , 2004), for instance, in
sewage, water reservoirs, cultivation and vegetation areas and industrial
effluent (Bagley, 1985; Brown, et al. , 1973). The Klebsiella species are
characterised according to the diseases they cause and their distinct habitats.
K. pneumoniae itself contains three subspecies, which have been subdivided
according to the disease they caused: K. pneumoniae subspecies
pneumoniae, K. pneumoniae subspecies K. ozaenae, and K. pneumoniae
subspecies K. rhinoscleromatis (Ørskov, 1984). K. pneumoniae infections
commonly occur in blood, the urinary tract and within lung tissues, which will
eventually turn to a thick, bloody-mucoid sputum known as currant jelly
sputum. While K. ozaenae causes chronic atrophic rhinitis (ozaenae) and
K. rhinoscleromatis, causes chronic upper airways infections or rhinoscleroma
(Botelho-Nevers, et al. , 2007). Other than those prevalent subspecies, there
are seven additional Klebsiella species that have been identified (Brisse, et al.
, 2006): K. granulomatis (Carter, et al. , 1999) K. oxytoca (Lautrop, 1956),
K. planticola (Bagley, et al. , 1981), K. ornithinolytica (Sakazaki, et al. , 1989),
K.terrigena (Izard, et al. , 1981), K. mobilis (Bascomb, et al. , 1971), and
K. variicola (Rosenblueth, et al. , 2004).
5 |
1.1.1 Klebsiella pneumoniae
The genus Klebsiella was named after the famous German physician and
bacteriologist, Edwin Klebs. Discovered by the German bacteriologist and
pathologist, Carl Friedlander in 1882 (Brisse, et al., 2006), K. pneumoniae is a
non-motile, encapsulated, Gram-negative, rod-shaped (Abbott, 2007), and
facultative anaerobic pathogen. K. pneumoniae is also lactose positive, and
its colonies are normally dome-shaped, about 3-4 mm in diameter with mucoid
and sometimes sticky phenotypes, depending on the medium composition and
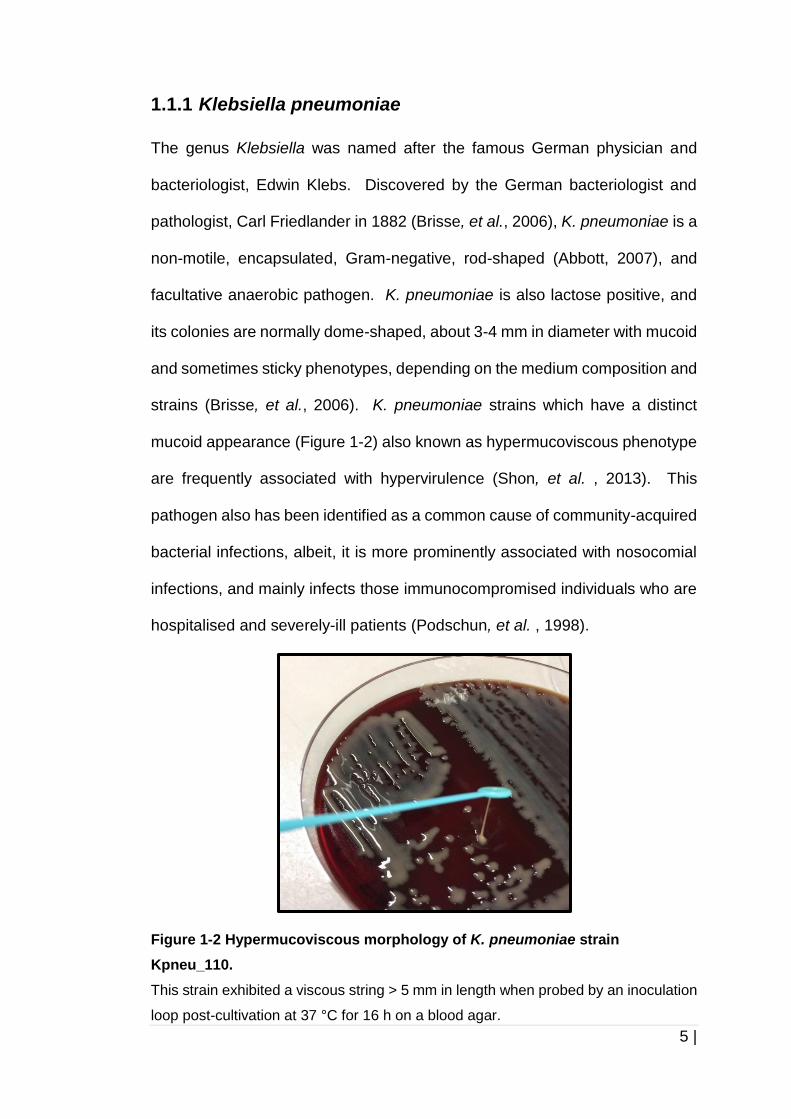
strains (Brisse, et al., 2006). K. pneumoniae strains which have a distinct
mucoid appearance (Figure 1-2) also known as hypermucoviscous phenotype
are frequently associated with hypervirulence (Shon, et al. , 2013). This
pathogen also has been identified as a common cause of community-acquired
bacterial infections, albeit, it is more prominently associated with nosocomial
infections, and mainly infects those immunocompromised individuals who are
hospitalised and severely-ill patients (Podschun, et al. , 1998).
Figure 1-2 Hypermucoviscous morphology of K. pneumoniae strain
Kpneu_110.
This strain exhibited a viscous string > 5 mm in length when probed by an inoculation
loop post-cultivation at 37 °C for 16 h on a blood agar.
6 |
1.2. Antibiotherapy for K. pneumoniae infection
K. pneumoniae has become progressively resistant to the vast majority of
antibiotics. Treatment of these particular infections is very challenging not only
because this pathogen is intrinsically resistance to ampicillin, but also
resistance to the majority of the antibiotics (Stahlhut, et al. , 2012) used for
treating bacterial infections in human. By harbouring blaSHV-1 (sulphydryl
variable type 1) on the chromosome, K. pneumoniae is known be intrinsically
resistant to ampicillin, amoxicillin, piperacillin, and also to early classes of
cephalosporins, for example, cephalothin (French, et al. , 1996; Haeggman, et
al. , 1997; Simpson, et al. , 1980).
Severely ill-patients who are infected by extended spectrum β-lactamase
(ESBL)-producing isolates are treated with 4th generation cephalosporins (e.g.
cefepime) (LaBombardi, et al. , 2006), aminoglycosides (e.g. gentamicin),
fluoroquinolones (e.g. ciprofloxacin) and the antibiotics of last resort,
carbapenems (e.g. imipenem or meropenem) (Paterson, et al. , 2004). These
antimicrobial agents can be prescribed as a monotherapy or a combination
therapy. Clinical success rates, however, are much higher when combination
therapies are used for treatment.
A previous study by Benenson, et al. (2009) showed that the combination of
gentamicin and a colistin was effective for carbapenem resistant
K. pneumoniae endocarditis. The combination of polymyxin B and rifampicin
proved to have a synergistic effect against K. pneumoniae carbapenemase-
producing strains in vitro (Bratu, Tolaney, et al. , 2005). Treatment options for
Klebsiella pneumoniae carbapenemase (KPC)-producing K. pneumoniae are
7 |
limited to colistin or tigecycline (Roy, et al. , 2013), and combination of both of
these antibiotics (Hirsch, et al. , 2010; Humphries, et al. , 2010). Furthermore,
studies by Deris, et al. (2012) and Zhang, et al. (2017) showed that the
combination of colistin or tigecycline with doripenem has a synergistic effect in
vitro. Ceftazidime/avibactam has also been proven to have excellent in vitro
activity, and might be suitable as a treatment to combat KPC infections (van
Duin, et al. , 2016).
In addition, bacterial infections that are caused by the non-ESBL producing
K. pneumoniae isolates are usually treated using 3rd generation
cephalosporins (e.g. cefotaxime), fluoroquinolones or a combination of a
β-lactam with a β-lactamase inhibitor, for example, ampicillin/sulbactam,
piperacillin/tazobactam or ticarcillin/clavulanate (Bhavnani, et al. , 2006).
8 |
1.3 Clinical manifestation of infections caused by
K. pneumoniae
K. pneumoniae is a commensal microorganism ubiquitously found colonising
human mucosal surfaces, for example, the gastrointestinal tract and
nasopharynx. Infections of K. pneumoniae can be divided into two groups:
community-acquired infections and hospital-acquired infections. Most
community-acquired infections cause pneumoniae or urinary tract infections.
A distinct K. pneumoniae invasive syndrome that causes pyogenic liver
abscess is being increasingly reported in Asian countries such as Taiwan in
the past two decades and have since emerged as a global disease (Ko, et al.
, 2002). It is also spreading rapidly as one of the most important causes of
hospital-acquired infections (nosocomial infections) in hospitals worldwide
(Onori, et al. , 2015; Podschun, et al., 1998). Hospital-acquired infections can
be defined as infections which develop in a patient at least 48 h after admission
to a hospital, without any symptoms prior to hospitalisation (Ducel, et al. ,
2002).
As an opportunistic pathogen, K. pneumoniae not only causes urinary tract
infections (UTIs), respiratory tract infections (RTIs), and liver abscess (Siu, et
al. , 2012), but it is also able to cause osteomyelitis (Prokesch, et al. , 2016),
septicaemia (Fane, et al. , 2005), and wound or surgical site infections (Virgilio,
et al. , 2016). K. pneumoniae is the second most prominent pathogen that
cause bacteraemia after E. coli (Yinnon, et al. , 1996) and amongst the most
common uropathogens that cause UTIs (Ronald, 2002). While invasive liver
abscess is established to be prevalent in Asian countries, the cause of this
9 |
predominance in Asian populations is still unknown. The strains isolated from
infected Asian people have been found to be more virulent than the strains
isolated from the patients outside Asia. Most of the patients with liver abscess
were observed to be infected exclusively by K1 and K2 capsular type
K. pneumoniae isolates (Siu, et al., 2012). These particular hypervirulent
strains are also known to be carried by healthy adult carriers in their intestines
and are suggested to be the origin of the infecting isolates (Fung, et al. , 2012).
Other than this antibiotic resistance attribute, the invasive syndrome that
causes liver abscess is also alarming since it has been increasingly reported
in Taiwan during the past few decades and has the highest prevalence of
cases related to liver abscesses (Siu, et al., 2012). Due to this fact, one of our
strains used in this study was isolated from a pyogenic liver abscess patient
and also was charaterised to have a hypermucoviscous phenotype and K2
capsular type (see Table 2-1).
In addition, K. pneumoniae is also known to cause medical device-associated
infections, for example, infections on urinary catheters (Nicolle, 2014),
endotracheal tubing (Boddicker, et al. , 2006), prostheses (de Sanctis, et al. ,
2014), central venous catheters (Buckley, et al. , 2007), artificial heart valve
(Raymond, et al. , 2014), and ventilators (Sbrana, et al. , 2016).
10 |
1.4 Mechanisms of antibiotic resistance
Antibiotic resistant bacteria have emerged not only in hospital settings, but also
in community settings. This suggests that reservoirs of antibiotic resistance
are also present outside hospitals, for example, in wastewater systems,
pharmaceutical and manufacturing effluent, and aquaculture and animal farms
(Berendonk, et al. , 2015). The emergence of antibiotic resistant bacteria is a
growing problem, while development of novel and efficient antibiotics is
progressing very slowly.
There are three primary antibiotic resistance categories: intrinsic, acquired and
adaptive. Intrinsic also referred to as ‘natural’ resistance of a bacterial species,
is due to inherent properties and functional characteristic of the cells. These
include harbouring of β-lactamases genes, and the capacity to reduce the
permeability of the bacterial cell membrane by alteration, modification and
decreased expression of porins (Mallea, et al. , 1998; Nikaido, 2003; Pangon,
et al. , 1989).
Numerous bacterial species are known to have intrinsic resistance to
β-lactams because they harbour β-lactamase genes on their chromosome.
Among the genes are AmpC β-lactamase gene, blaCMY-2, which is likely to be
originated from the chromosome of Citrobacter freundii (Bauernfeind, et al. ,
1996) and β-lactamase resistance genes that encode for CTX-M enzymes
which are suggested to have originated from the chromosome of Kluyvera
ascorbata (Humeniuk, et al. , 2002). In addition, intrinsic β-lactam resistance
in Stenotrophomonas maltophilia is mediated by two chromosomal-mediated
inducible β-lactamases resistance genes, blaL1 and/or blaL2 (Lin, et al. , 2009).
11 |
Other than these examples, intrinsic resistance in K. pneumoniae to penicillin,
ampicillin, amoxicillin, carbenicillin, oxacillin, and ticarcallin is mediated by
blaSHV-1, a gene that encodes for SHV-1 enzyme which is prevalently found on
the chromosome of vast majority of K. pneumoniae isolates (Paterson, et al. ,
2014).
The existence of an outer membrane in Gram-negative bacteria acts as an
intrinsic barrier to large antibiotic molecules that are effective against Gram-
positive bacteria (Blair, et al. , 2015; Miller, 2016). For example, the large
molecular size of vancomycin precludes it from being efficient to be used
against E. coli (Zhou, et al. , 2015) and K. pneumoniae (Pultz, et al. , 2005).
Another example of intrinsic resistance is resistance against erythromycin by
several Gram-negative bacteria for example K. pneumoniae (Sugawara, et al.
, 2016). This is due to the hydrophilic part of LPS at the outer membrane of
several Gram-negative bacteria, which interrupts the diffusion of erythromycin
into the cells, and subsequently provides a membrane impermeability to this
lipophilic antibiotic (Nikaido, 2003).
The second type is acquired resistance, where mobile genetic elements
(MGEs) are incorporated into the genome of susceptible bacteria, leading to
antibiotic resistance (Tenover, 2006). MGEs can be classified into two
different groups: elements that can transfer from one bacterial cell to another
cell, for example, plasmids and transposons, and those elements that can
translocate from one particular location to another location in the same
bacterial cell such as integrons and insertion sequences (Bennett, 2008). The
incorporation of MGEs into bacterial genomes happens by transferring the
12 |
genetic elements e.g. conjugative plasmid from one bacterium to another by
conjugation, translocation of mobile genetic elements e.g. transposons from
one location to another in the genome of a bacterium, and transducing the
portion of DNA from one bacterium to another by bacteriophages (van Hoek,
et al. , 2011). Conjugation by plasmids and transposons is known as one of
the most important mechanisms of acquired resistance as it could promote to
the direct transfer of antibiotic resistance genes from chromosome to
chromosome (Munita, et al., 2016).
The capacity to inactivate antibiotics is one of the significant resistance
mechanisms (Ammor, et al. , 2007), which is caused by acquisition of genes
encoding for antibiotic-degradation enzymes such as NDM-1 and antibiotic-
modifying enzymes for example, aminoglycosides N-acetyltransferases
(AAC). These AAC enzymes can modify aminoglycosides by catalysing
acetylation on the substrates (e.g. gentamicin), which subsequently leads to
poor binding of modified aminoglycosides to the 30S ribosomal subunit
(Ramirez, et al. , 2010) (details in Chapter 3, section 3.1.4.1).
Acquisition of genes encoding for β-lactamases and/or efflux pumps which can
be located on plasmids can also contribute to antibiotic resistance (Weinstein,
et al. , 2005). For instance, the spread of ESBL and KPC-producing
K. pneumoniae strains is usually facilitated by the transfer of plasmids
harbouring β-lactam and carbapenem resistance genes, for example,
blaCTX-M-15, blaKPC-1 and blaNDM-1. The blaCTX-M-15 gene was first discovered by
Karim, et al. (2001) on large plasmids with an insertion sequence, IS Ecp1
located upstream of the 5’ end of blaCTX-M-15 while blaKPC-1 was found to be
13 |
encoded on an approximately 50-kb non-conjugative plasmid (Yigit, et al. ,
2001). In addition, blaNDM-1 was discovered on a 180 kb plasmid of
K. pneumoniae 05-506 in 2008 by Yong, et al. (2009).
The AcrAB efflux pump, as an example, constitutes a major drug efflux system
towards large and lipophilic antimicrobial agent e.g. erythromycin and fusidic
acid (Nikaido, 1996a). Additionally, the capability to change the specific target
structure by genetic mutation or post translational modifications are also
proven to ultimately hinder the binding of the antibiotics to their target site
(Blair, et al., 2015). Addition of a chemical group to the target site of antibiotics,
for example by erythromycin ribosome methyltranferases (erm), which alter
the nascent 23S rRNA ribosomal binding site can also prevent the binding of
erythromycin and other antibiotics such as lincosamides and streptogramins B
(Leclercq, 2002). Furthermore, protection of the ribosome by ribosomal
protection proteins (RPPs), for example, by Tet(M) can prevent the binding of
tetracycline to the ribosome and allow the ribosome to continue the protein
synthesis (Connell, et al., 2003).
The third and final resistance category is adaptive resistance, which occurs
when bacteria obtain a transient resistant phenotype by altering their genes
expression and/or protein expression (Fernández, et al. , 2012). This can
happen when there is exposure to unfavourable environmental factors, such
as, nutrient starvation, low or high temperature and pH levels, and exposure
to sub-inhibitory concentrations of particular antibiotics (Poole, 2012). In
contrast to intrinsic and acquired resistance which are more stable, adaptive
14 |
resistance is transitory, and the bacteria normally revert back to their initial
phenotype after the inducing factor is removed (Fernández, et al., 2012).
1.4.1 Extended spectrum β-lactamase (ESBL) and
carbapenemase-producing K. pneumoniae
Beta-lactam family are a large group of antibiotics that includes penicillins,
cephalosporins, carbapenems, and monobactams (Danziger, et al. , 2011).
They are the most widely used antibiotics for bacterial infections particularly
for K. pneumoniae infections. There are two major antibiotic resistance
mechanisms that are common in K. pneumoniae: production of β-lactamases,
specifically expression of extended spectrum β-lactamases (ESBLs) which
render resistance to a broad range of β-lactam antibiotics including 3rd
generation cephalosporins (Paterson, et al., 2004) and production of
carbapenemases which render resistance to most β-lactam antibiotics
including carbapenems (Nordmann, et al. , 2009). These enzymes are
universally carried on the plasmids and also on chromosomes (Rawat, et al. ,
2010) They hydrolyse β-lactam by cleaving the β-lactam ring which is located
on the molecular structure of β-lactam antibiotics (Figure 1-3).
Figure 1-3 Chemical structure of ampicillin. β- lactam ring is circled in black.
15 |
Beta-lactamases can be classified into four major classes following the Ambler
or Jacoby and Bush classifications. Ambler classification is based on
conserved and distinguishing amino acid homology and divides β-lactamases
in four different classes. Class A, C and D are classified as serine beta-
lactamases, and hydrolyse β-lactams through a serine active site, whilst, class
B (metallo-β-lactamases) hydrolyse their substrates by utilising a zinc ion at
their active site (Bush, et al. , 2010; Paterson, 2006). While Jacoby and Bush
classification is based on the functional properties of enzymes, for example,
the substrate and the inhibitor profiles. The classification are divided into
group 1, 2, 3 (Bush, et al., 2010) and 4 (only in Bush-Jacoby Medeiros group
(Bush, et al. , 1995)) (refer Table 1-1).
16 |
Table 1-1 Classification schemes for bacterial β-lactamases.
The table shows classification schemes for bacterial β-lactamases and it is based on
the publication by Bush, et al. (2010).
17 |
1.4.2 Evolution of β-lactamases in K. pneumoniae
To date, antibiotic resistant bacterial infections have spread widely and have
become one of the most problematic nosocomial infections (Nordmann, et al.
, 2011). Rapid emergence of ESBL-producing K. pneumoniae and
carbapenemase-producing Enterobacteriaceae are occurring worldwide and
their threat is classified as serious and concerning health issue. Most ESBLs
are normally encoded by plasmids or chromosomes and generally are
derivatives of non-ESBL enzymes, such as, blaTEM-1, blaTEM-2 or blaSHV-1 (Bush,
et al., 1995). They underwent simple point mutations which resulted to
alteration of the amino acid sequence around the enzyme active sites and
become ESBLs, such as, blaTEM-3 or blaSHV-2. TEM and SHV-type ESBLs are
found in E. coli and K. pneumoniae and other genera of Enterobacteriaceae.
The first plasmid-borne β-lactamase (blaTEM-1) in the Enterobacteriaceae was
discovered early 1965 in Athens, Greece. It was originally found in
E. coli which was isolated from the blood culture of a patient named
Temoneira, hence, it got its designation, TEM (Datta, et al. , 1965; Medeiros,
1984). The first TEM-type enzymes, blaTEM-3, that conferred ESBL phenotype
was reported in 1988. This variant was found to have two amino acid
substitutions in comparison to blaTEM-2 at position E102K and G236S
(Sougakoff, et al. , 1988). In addition, the first case of ESBL-producing
K. pneumoniae was reported at University Hospital in Frankfurt, Germany in
1983 (Knothe, et al. , 1983). This enzyme could hydrolyse oxyimino-
cephalosporins and was designated as blaSHV-2, which was derived from
blaSHV-1. It differs from blaSHV-1 of E. coli p452 by one amino acid substitution
18 |
at position G213S (Barthelemy, et al. , 1988) and all blaSHV variants reported
nowadays are derivation of blaSHV-1.
In the last few years, a newly discovered family, the CTX-M-family enzymes
have replaced TEM and SHV-derived enzymes as the most prevalent in
clinical Enterobacteriaceae isolates. The first CTX-M-1 was discovered in
1989 in Munich from E. coli strain GRI, which was isolated from an exudate of
the ear of a newborn suffering from otitis media (Bauernfeind, et al. , 1990). In
addition, CTX-M-15 and CTX-M-14 are by far is the most important enzymes
and the most common CTX-M variants identified worldwide (Zhao, et al. ,
2013). These enzymes were designated as CTX-M (cefotaximase, Munich)
because of their capacity to hydrolyze cefotaxime more efficiently than
ceftazidime (Tzouvelekis, et al. , 2000).
Apart from these enzymes, carbapenemase such as KPC-1 is also identified
as one of the most important β-lactamases and this resistance mechanism is
established as a causative factor contributing to the global spread of antibiotic
resistant bacterial infections. The first K. pneumoniae carbapenemase (KPC)-
producing K. pneumoniae isolate was discovered in a North Carolina hospital
in 1996 (Yigit, et al., 2001) and emerged rapidly in the New York City hospitals
outbreak (Bratu, Landman, et al. , 2005). A recent case of pan-resistant
K. pneumoniae was reported in January 2017. The report on the 70-years-old
woman in Nevada, United States was deeply worrying since she was infected
with K. pneumoniae which harboured the New Delhi metallo-β-lactamase
(blaNDM-1) (Yong, et al., 2009) resistance gene and could not be treated with
any relevant and available antibiotics in the United States (Chen, et al. , 2017).
19 |
The ESBL-producing strains of K. pneumoniae are able to hydrolyse
β-lactams, for instance 3rd generation cephalosporins (e.g. cefotaxime,
ceftazidime, and ceftriaxone), and monobactams (e.g aztreonam).
Additionally, they can also possess resistance against different groups of
antibiotics, as an example, aminoglycosides and fluoroquinolones (Turner,
2005). In addition, worse than ESBL-producing strains, bacterial isolates that
harbouring carbapenemases are resistant to nearly all antibiotics including to
β-lactams, such as penicillins, 3rd and 4th generation cephalosporins,
monobactams, fluoroquinolones, aminoglycosides, and carbapenems (Arnold,
et al. , 2011).
1.4.3 Epidemiology of multidrug-resistant K. pneumoniae
The expansion of antibiotic resistance cases involving multidrug-resistant
K. pneumoniae have been increasingly reported over the past few decades.
The rapid spread of particular strains harbouring antibiotic resistance genes,
such as carbapenemase resistance genes across a region and a country is
also worrying.
The first isolate of K. pneumoniae harbouring blaKPC on a plasmid was isolated
in 1996 in North Carolina and it was then observed to spread rapidly across
New York City in 2003. By 2007, it was reported that 21 % of Klebsiella strains
in the city carried this blaKPC gene in comparison to the average of 5 % across
the rest of the United States (Hidron, et al. , 2008). This rapid dissemination
was thought to travel from person to person since Enterobacteriaceae such as
K. pneumoniae inhabit the human gut and it can be carried away by
asymptomatic patients. Bacteria harbouring blaKPC were then moved to Tel
20 |
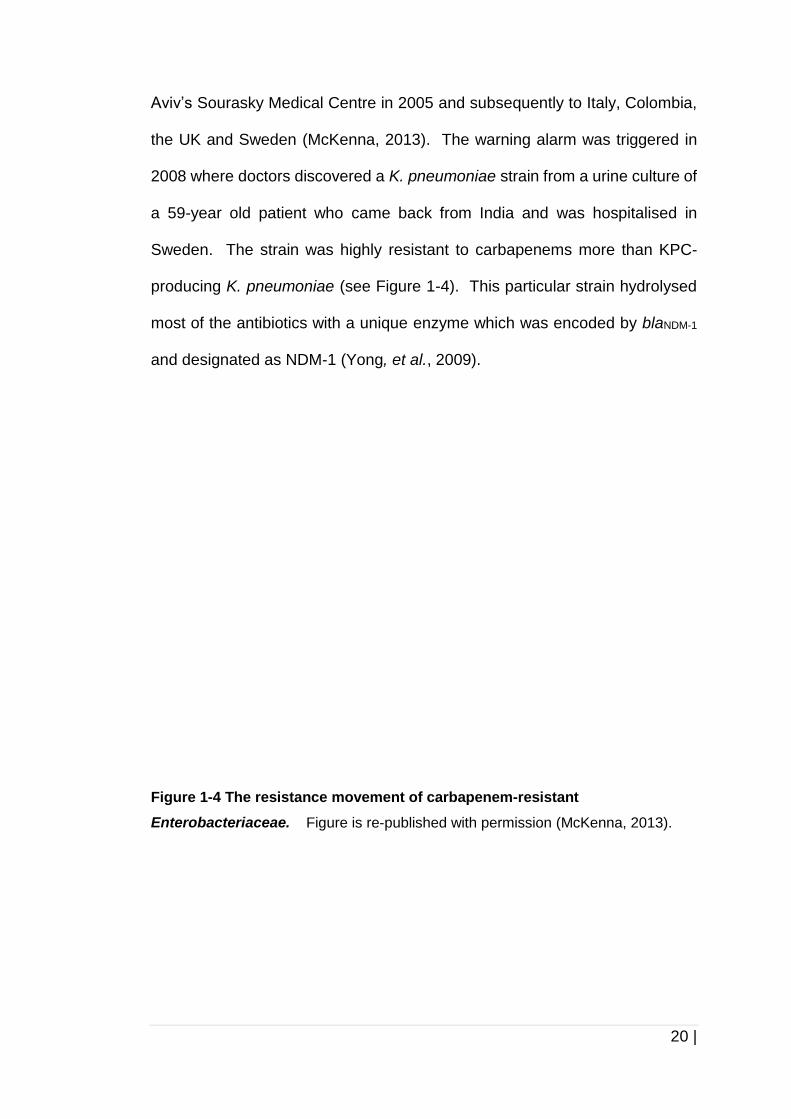
Aviv’s Sourasky Medical Centre in 2005 and subsequently to Italy, Colombia,
the UK and Sweden (McKenna, 2013). The warning alarm was triggered in
2008 where doctors discovered a K. pneumoniae strain from a urine culture of
a 59-year old patient who came back from India and was hospitalised in
Sweden. The strain was highly resistant to carbapenems more than KPC-
producing K. pneumoniae (see Figure 1-4). This particular strain hydrolysed
most of the antibiotics with a unique enzyme which was encoded by blaNDM-1
and designated as NDM-1 (Yong, et al., 2009).
Figure 1-4 The resistance movement of carbapenem-resistant
Enterobacteriaceae.
Figure is re-published with permission (McKenna, 2013).

21 |
In addition to the movement of carbapenem-resistant Enterobacteriaceae
worldwide, the movement of other resistance mechanisms of K. pneumoniae
has also been reported in Europe for over the last decade. The antibiotic
resistance rates in Europe have been observed to increase particularly from
year 2005 until year 2016 for most of the countries except the UK (Figure 1-
5).
22 |
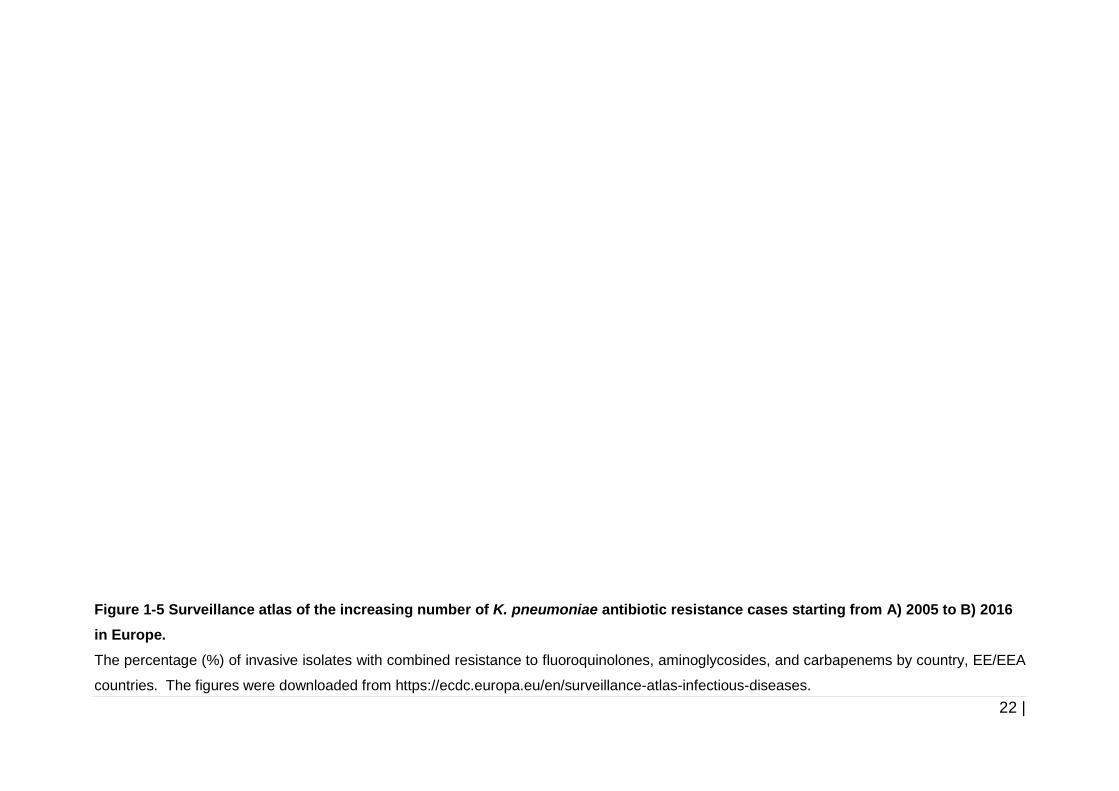
Figure 1-5 Surveillance atlas of the increasing number of K. pneumoniae antibiotic resistance cases starting from A) 2005 to B) 2016
in Europe.
The percentage (%) of invasive isolates with combined resistance to fluoroquinolones, aminoglycosides, and carbapenems by country, EE/EEA
countries. The figures were downloaded from https://ecdc.europa.eu/en/surveillance-atlas-infectious-diseases.
23 |
The largest increase was observed for Italy which was reported to have less
than 1 % of resistance cases in 2005, which increased to somewhere between
25 % to < 50 % of cases in 2016. There was no increase seen for Greece
which had high number of cases in 2005 until 2016 (25 % to < 50 %). Italy and
Greece were also the only countries in the Europe to have highest incidence
of carbapenemase-producing Enterobacteriaceae infections. It had been
reported that both of these countries were having an ‘endemic situation’ for
these particular bacterial infections in 2013-2014 which hospitalisation cases
in most of the hospital in both of the countries were from local population and
sources (Albiger, et al. , 2015).
There was a slight reduction in the number of cases that were reported in the
UK in 2016 (1 % to < 5 %) in comparison to 5 % to < 10 % in 2005. Based on
the ECDC Surveillance Report of Antimicrobial Resistance in Europe 2016, at
the European Union/ European Economic Area (EU/EEA) level, 34.5 % of
K. pneumoniae isolates were reported to The European Antimicrobial
Resistance Surveillance Network (EARS-Net) in 2016 were resistant to at least
one of the regular surveillance antibiotics groups, fluoroquinolones, third-
generation cephalosporins, aminoglycosides, and carbapenems. The highest
percentage of antibiotic resistance was reported for 3rd generation
cephalosporins (25.7 %). This is followed by fluoroquinolones with 24.6 %
cases, aminoglycosides with 19.0 % and carbapenems with 6.1 % cases
(ECDC, 2017).
24 |
Beside Europe, the spread of multidrug-resistant K. pneumoniae is increasing
globally including in the Middle East and also in Asian region countries. Egypt
was found to be one of the countries with the highest rates of ESBL among
Enterobacteriaceae (38.5 %) (Abdallah, et al. , 2015) according to the report
of study in 2001 – 2002 by Pan European Antimicrobial Resistance Local
Surveillance (PEARLS) in 13 European countries, three Middle East countries,
and also South Africa.
Owing to high rates of antibiotic resistance cases in Egypt, it is important to
investigate the prevalence of resistance mechanisms from year to year in this
country. Since information about ESBL-producing Enterobacteriaceae (ESBL-
E) in Egypt is still limited (Abdallah, et al., 2015) and to obtain more information
on this, all of the clinical K. pneumoniae isolates used in this study are the
strains that were isolated from community or hospital-acquired infections in
2000, 2003, and 2009 from three different university hospitals in Egypt (see
Table 2-1). All of the strains were also confirmed as multidrug resistant strains
(see Table 2-2).
Apart from Europe and Middle East countries, the emergence of ESBL-E has
also been reported in Asian countries. The Study for Monitoring Antimicrobial
Resistance Trends (SMART) in 2008 which examined the in vitro antimicrobial
susceptibility to 2370 unique facultative-aerobic Gram-negative bacilli isolates,
which associated with intra-abdominal infections to 12 antimicrobial agents,
high rates of ESBL-producing E. coli and K. pneumoniae isolates were
observed in China with 59.1 % and 34.4 % respectively, while in India, the
25 |
rates were 61.2 % and 48.8 % respectively, and in Thailand, they were
53.0 % and 23.1 % respectively (Hsueh, et al. ).
In addition, there was also an evidence of increasing number of ESBL-
producing K. pneumoniae isolates from 15 % – 23.4 % in a 7-year study
starting from 2001 to 2008 at the largest tertiary hospital in Taiwan (Shu, et al.
, 2009). The emerging threat of antibiotic resistant bacterial infections in
Taiwan is shown to be related with nosocomial infections that are caused by
ESBL-producing K. pneumoniae, however, the data regarding community-
acquired infections are still limited (Lin, et al. , 2016).
1.5 Mechanisms of K. pneumoniae pathogenicity
Understanding the mechanisms of virulence are pivotal to determine their
complex interaction with host cells and could explain the underlying process
that leads to bacterial pathogenesis. The most common site for
K. pneumoniae infection is the urinary tract and K. pneumoniae possesses a
number of virulence determinants to colonise that particular tract by adhering
and invading the host cells (Struve, et al. , 2008), and to escape the natural
host defense mechanisms, such as protection from phagocytosis (Clegg, et al.
, 2016; Schembri, et al. , 2005). Those factors are capsules,
lipopolysaccharides, siderophores and fimbriae (Figure 1-6). Even though the
outer membrane porins (Omps) have not yet been thoroughly characterised
and have received less attention, some have previously been found to play a
role in virulence mechanisms of K. pneumoniae (Tsai, et al. , 2011).

26 |
Figure 1-6 Virulence factors of K. pneumoniae.
There are four well-studied virulence factors of K. pneumoniae: capsule, LPS,
siderophores and fimbriae (type 1 and type 3). Omps (e.g. OmpK35 and OmpK36)
have received less attention, even though, their role in virulence in murine model has
been demonstrated (Tsai, et al., 2011). Figure is re-published with permission
(Fernández, et al., 2012; Paczosa, et al. , 2016).
OMP
27 |
1.5.1 The capsule
The capsule, also known as the K antigen, is a dense and thick
polysaccharides matrix (~160 nm of capsule thickness) (Amako, et al. , 1988).
It is known as a major surface-located virulence factor, and encases the whole
bacterial cell (Schembri, et al., 2005). There are around 78 different capsular
types which have been reported up until 2013 (Pan, et al. , 2013).
Overproduction of the capsule is known as a hypercapsule, or a
hypermucoviscous phenotype and is associated with hypervirulent strains of
K. pneumoniae. Such strains have a mucoviscous polysaccharide which is
more robust than the typical capsule (refer to Figure 1-2). The capsule
protects K. pneumoniae against desiccation and phage attack (Schembri, et
al. , 2004), and the role of capsule in pathogenicity of K. pneumoniae infections
is also well understood. The capsule is well-known to protect
K. pneumoniae against the host immune response during infection through
several important mechanisms: evading phagocytosis by immune cells such
as polymorphonuclear leukocytes (i.e. neutrophils), dendritic cells and
macrophages (Collins, et al. , 1996), preventing activation of early immune
responses which leads to a more severe infections, and also escaping cell
lysis mediated by complement and antimicrobial peptides (Doorduijn, et al. ,
2016).
Hypervirulent K. pneumoniae strains are also considered to be more resistant
to phagocytosis because of modified polysaccharides in the capsule structure,
and indirectly circumvent the binding to phagocytic cells. As an example,
Klebsiella strains which produce capsule with certain repeating mannose and
28 |
rhamnose sequences, for instance, mannose-α2/3-mannose or L-rhamnose-
α2/3- L-rhamnose disaccharide can bind efficiently to a mannose specific lectin
which is normally found on tissue macrophages. Whilst, capsule types K1, K2,
K7, K12, K21a K24, K32, and K55 which do not contain these repeating units
are not recognised easily by macrophages, and this possibly causes
resistance to host immune responses (Athamna, et al. , 1991; Collins, et al.,
1996). As reported previously, K2 serotypes have a modified glycan
composition to thwart recognition by the lectin pathways (Sahly, et al. , 2009).
1.5.2 Lipopolysaccharides (LPS)
K. pneumoniae endotoxin also called lipopolysaccharides (LPS) is a major and
necessary component of the outer leaflet of the Gram-negative bacteria cell
membranes, which is important in maintaining the structure and outer
membrane stability, and also for environmental adaptation. It is comprised of
three distinct structural domains: i) the hydrophobic lipid A, ii) the core
oligosaccharide antigen, which is connected to lipid A and provides the
attaching side for iii) O- antigen which is the long chain of polysaccharides
(Clements, et al. , 2008).
Lipid A, a hydrophobic membrane anchor is a pathogen associated molecular
pattern (PAMP) which is recognised by a host pattern recognition receptor
(PRR), for example, toll-like receptor 4 (TLR4) which is present on many cell
types including macrophages and dendritic cells, and initiates the clearance of
bacterial infection (Steimle, et al. , 2016). The capsule is proposed to play a
synergistic role with lipid A by partially shielding the PAMP from detection by
PRR. The core antigen, which connects O antigen to lipid A molecules
29 |
consists of negatively charged mono, di or oligosaccharides, for instance, two
to three 3-deoxy-D-manno-oct-ulosonic acid (KDO) residues (Clements, et al.,
2008). The outmost component of LPS, glycan polymer or O antigen consists
of a polymer of oligosaccharide repeating units. There are 11 different
O-antigen types that have been identified in K. pneumoniae isolates in contrast
to the large group of capsular serotypes (Vinogradov, et al. , 2002).
1.5.3 Siderophores
Siderophores are low molecular weight iron-chelating molecules that maintain
a higher affinity for iron compared to host iron transport system. Siderophores
scavenge iron in the environment and sequester iron from host-iron chelating
proteins to grow efficiently in that particular host tissue. Iron is critical for many
cellular mechanisms of K. pneumoniae, including oxygen metabolism, DNA
replication and as a cofactor for the electron transport chain (Messenger, et al.
, 1983). Because of this, K. pneumoniae needs to acquire iron from the host
in order to propagate or to survive in low-iron environments.
There are several siderophores that are produced by K. pneumoniae:
enterobactin (Ent), yersiniabactin (Ybt), salmochelin (Sal) and aerobactin.
Enterobactin, a prototypic catecholate siderophore is the primary iron uptake
system in K. pneumoniae, and is prevalent in respiratory tract isolates of
K. pneumoniae. Yersiniabactin is a phenolate siderophore, while salmochelin
is a c-glucosylated derivative form of enterobactin (Holden, et al. ; Russo, et
al. , 2015). Aerobactin, an uncommon citrate hydroxamate iron-chelating
compound is the dominant siderophore produced by hypermucoviscous
K. pneumoniae strains (Russo, et al., 2015).
30 |
1.5.4 Fimbriae
Bacteria adhere to host cells in order to aid initial colonisation. Fimbriae
mediate adhesion of bacterial cells to host cells through interaction of the
adhesins with receptors on host surfaces. There are many types of bacterial
appendages which are important for adhering to host cell surfaces, for
example, fimbriae, curli and also flagella. Those surface appendages must be
sufficiently sturdy and firm, to anchor on the host cell surface to resist forces,
such as the impact of aqueous flushes or gaseous flushes in the urethra or the
respiratory tract, respectively (Chen, et al. , 2011). Fimbriae are among the
most important surface appendages in K. pneumoniae. The most common
K. pneumoniae fimbriae are the type 1 fimbriae (T1F) and type 3 fimbriae (T3F)
which were initially identified in Klebsiella strains as ‘MS adhesin’ (mannose-
sensitive) and ‘MR adhesin’ (mannose-resistant), respectively (Duguid, 1959).
Additionally, K. pneumoniae has other types of fimbriae, for example, Kpc
fimbriae (Wu, et al. , 2010), and E. coli common pilus (EPC) (Alcántar-Curiel,
et al. , 2013). The details of T1F and T3F are discussed in Chapter 5.
31 |
1.5.5 Outer membrane porins (Omps)
The outer membrane of Gram-negative bacteria consists of a lipid bilayer,
which is essential as a first line shield against any toxic substances, and it is
also impermeable to large and charged molecules, such as some antibiotic
molecules (Pagès, et al. , 2008).
The influx transport system embedded in bacterial outer membrane is partly
facilitated by porins (Delcour, 2003; Nikaido, 2003; Pagès, et al., 2008),
proteins found in the outer membrane layer of Gram-negative bacteria
(Sutcliffe, et al. , 1983). Porins are abundant water-filled channels, which
permit the passive penetration of hydrophilic molecules through the outer
membrane layer (Figure 1-7) (Galdiero, et al. , 2008; Nikaido, 2003). Outer
membrane porins (Omps) are crucial to allow different substances to penetrate
(e.g. ions, amino acid, nucleosides, iron, and nutrients) the cells and to extrude
molecules (e.g. toxic and waste products) from the cells across the outer
membrane barrier, specifically in Gram-negative pathogens (Martínez‐
Martínez, 2008).
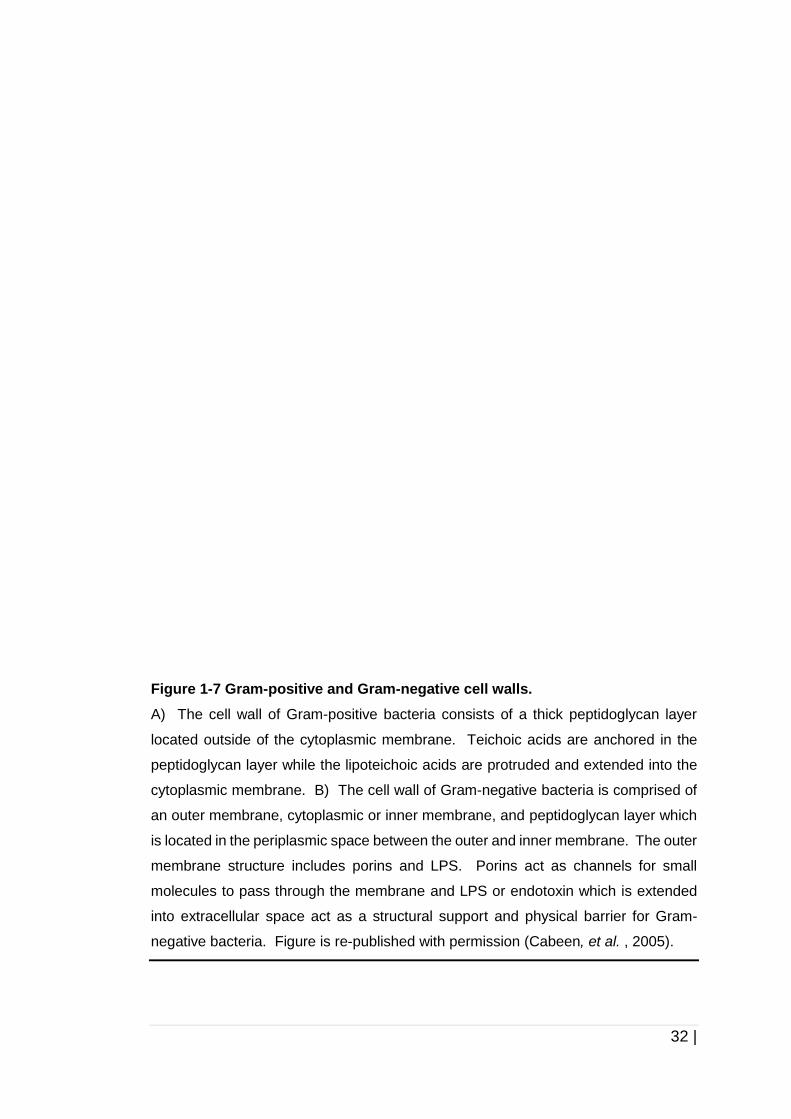
32 |
Figure 1-7 Gram-positive and Gram-negative cell walls.
A) The cell wall of Gram-positive bacteria consists of a thick peptidoglycan layer
located outside of the cytoplasmic membrane. Teichoic acids are anchored in the
peptidoglycan layer while the lipoteichoic acids are protruded and extended into the
cytoplasmic membrane. B) The cell wall of Gram-negative bacteria is comprised of
an outer membrane, cytoplasmic or inner membrane, and peptidoglycan layer which
is located in the periplasmic space between the outer and inner membrane. The outer
membrane structure includes porins and LPS. Porins act as channels for small
molecules to pass through the membrane and LPS or endotoxin which is extended
into extracellular space act as a structural support and physical barrier for Gram-
negative bacteria. Figure is re-published with permission (Cabeen, et al. , 2005).
33 |
Generally, porins are divided into two distinct types according to their activity:
non-specific porins and specific porins. Nonspecific porins (e.g. OmpC, OmpF
and PhoE) for example, in E. coli and K. pneumoniae, are responsible for a
general diffusion of small and polar molecules, by having eyelet (also known
as L3 structure) within the porins that permit permeating solutes of
approximately 600 Da (Nikaido, 1994). While specific porins (e.g. sucrose-
specific porin (ScrY) and maltose-induced maltoporin, (LamB)) aid in diffusion
of specific substances (Doménech-Sánchez, et al. , 1999; Hardesty, et al. ,
1991). Most hydrophilic and small antibiotics, for instance, β-lactams (Nikaido,
1988), tetracycline, fluoroquinolones, and chloramphenicol (Nikaido, 1996a)
penetrate the outer membrane layer through porin channels. β-barrel porins
not only provide exclusion limits of typically 600 Da for many antibiotic
molecules but they also limit the passive diffusion of large-scaffold antibiotics
molecules, for example, erythromycin (734 Da), rifampicin (823 Da) and
vancomycin (1450 Da) into Gram-negative bacterial cells. These large
antibiotics are thought to diffuse through LPS instead of porins, but the process
is inefficient and considered to be ineffective to be used against Gram-negative
bacteria (Muheim, et al. , 2017).
Depending on the species and environment, bacteria can have up until 105
porins per cell (Nikaido, 1988). Delcour (2003) suggested that OmpF and
OmpC families allow diffusion of cationic molecules, whereas PhoE favours
inorganic phosphate and anions (Nikaido, 1996b). The details of OMP of
K. pneumoniae are discussed in Chapter 6.
34 |
1.6 Biofilm formation by K. pneumoniae
Biofilms are microbial aggregates, which adhere to inert, living or non-living
surfaces (i.e. metals, plastics, soil particles, indwelling medical devices, and
host tissues). They are enclosed in a self-produced matrix of hydrated
extracellular polymeric substances (EPS). The biofilms can be made up of
single and multiple species of microorganisms that adhere to substratum in
aqueous environment and produce slimy EPS matrix (Flemming, et al. , 2010;
Mah, et al. , 2001) for protection. EPS can consist of polysaccharides,
proteins, extracellular DNA (eDNA) and glycolipids. These biopolymers are
responsible for interactions including for cohesion between cells in the biofilms,
adhesion of cells to surfaces, providing mechanical stability to the biofilms, and
protection from dehydration and the host immune defense cells (Flemming,
2011). EPS is also important in bacterial pathogenesis since it mediates
resistance of bacteria to antibiotics, protects the biofilms from host immune
responses, and promotes the development of persister cells (Bales, et al. ,
2013). The structure of biofilms depends on several factors including the
environment, nutrients, shear forces, hydrodynamic conditions, intercellular
communications and metabolic pathways (Flemming, et al., 2010).
The identification of the main components of K. pneumoniae biofilm EPS is still
yet to be established. However, Flemming, et al. (2010) suggested that
cellulose might play an important part in the biofilm EPS of K. pneumoniae.
This is supported by the study by Huertas, et al. (2014), showing that deletion
of yfiR, increased the expression of yfiN and resulted in increased cellulose
production. Increased cellulose production led to robust biofilm formation by
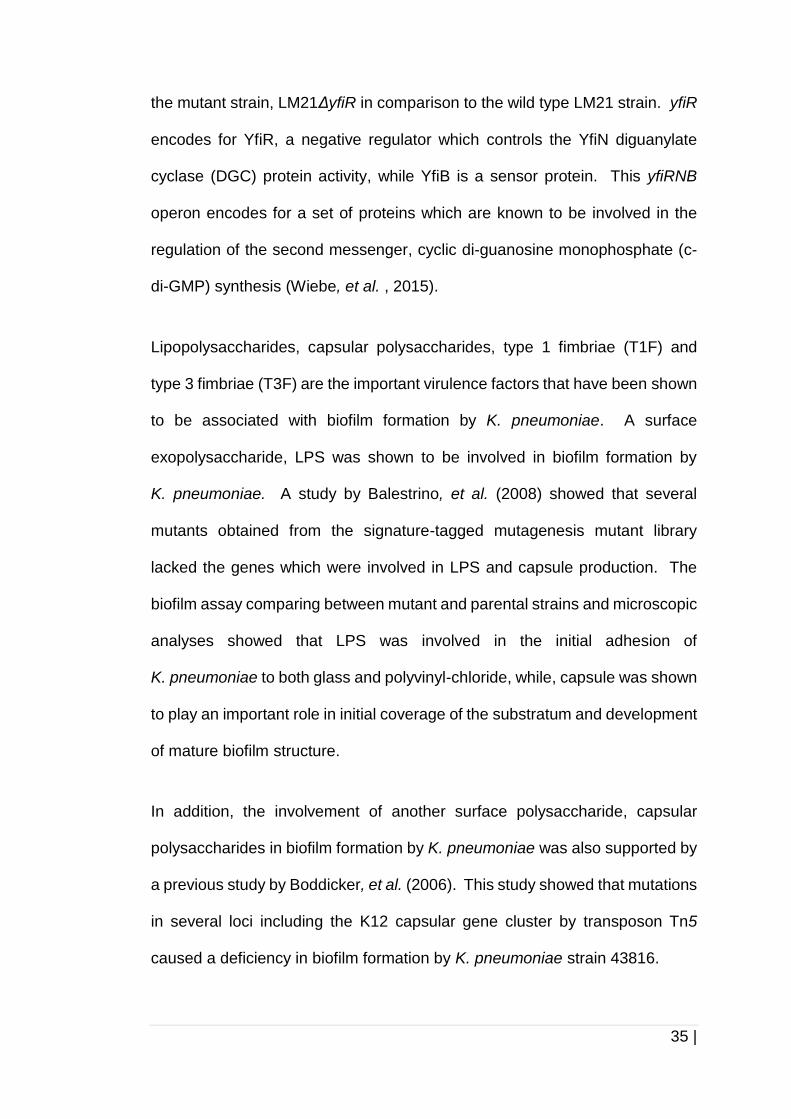
35 |
the mutant strain, LM21ΔyfiR in comparison to the wild type LM21 strain. yfiR
encodes for YfiR, a negative regulator which controls the YfiN diguanylate
cyclase (DGC) protein activity, while YfiB is a sensor protein. This yfiRNB
operon encodes for a set of proteins which are known to be involved in the
regulation of the second messenger, cyclic di-guanosine monophosphate (c-
di-GMP) synthesis (Wiebe, et al. , 2015).
Lipopolysaccharides, capsular polysaccharides, type 1 fimbriae (T1F) and
type 3 fimbriae (T3F) are the important virulence factors that have been shown
to be associated with biofilm formation by K. pneumoniae. A surface
exopolysaccharide, LPS was shown to be involved in biofilm formation by
K. pneumoniae. A study by Balestrino, et al. (2008) showed that several
mutants obtained from the signature-tagged mutagenesis mutant library
lacked the genes which were involved in LPS and capsule production. The
biofilm assay comparing between mutant and parental strains and microscopic
analyses showed that LPS was involved in the initial adhesion of
K. pneumoniae to both glass and polyvinyl-chloride, while, capsule was shown
to play an important role in initial coverage of the substratum and development
of mature biofilm structure.
In addition, the involvement of another surface polysaccharide, capsular
polysaccharides in biofilm formation by K. pneumoniae was also supported by
a previous study by Boddicker, et al. (2006). This study showed that mutations
in several loci including the K12 capsular gene cluster by transposon Tn5
caused a deficiency in biofilm formation by K. pneumoniae strain 43816.
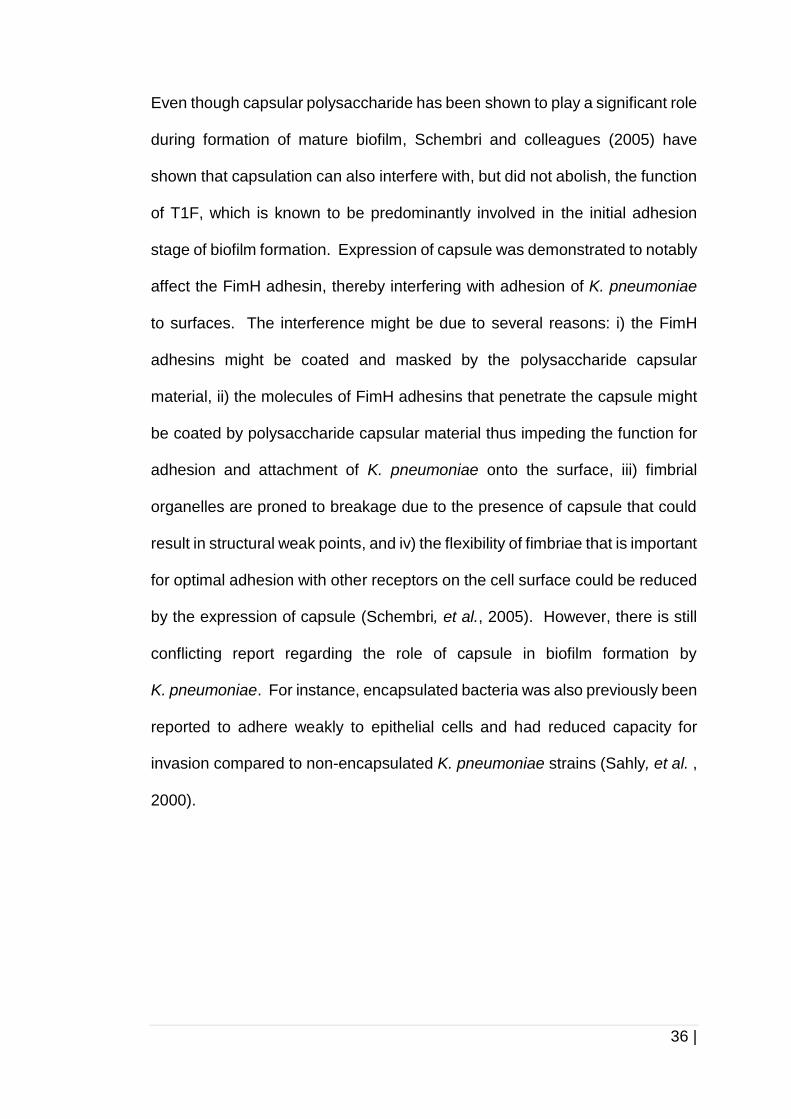
36 |
Even though capsular polysaccharide has been shown to play a significant role
during formation of mature biofilm, Schembri and colleagues (2005) have
shown that capsulation can also interfere with, but did not abolish, the function
of T1F, which is known to be predominantly involved in the initial adhesion
stage of biofilm formation. Expression of capsule was demonstrated to notably
affect the FimH adhesin, thereby interfering with adhesion of K. pneumoniae
to surfaces. The interference might be due to several reasons: i) the FimH
adhesins might be coated and masked by the polysaccharide capsular
material, ii) the molecules of FimH adhesins that penetrate the capsule might
be coated by polysaccharide capsular material thus impeding the function for
adhesion and attachment of K. pneumoniae onto the surface, iii) fimbrial
organelles are proned to breakage due to the presence of capsule that could
result in structural weak points, and iv) the flexibility of fimbriae that is important
for optimal adhesion with other receptors on the cell surface could be reduced
by the expression of capsule (Schembri, et al., 2005). However, there is still
conflicting report regarding the role of capsule in biofilm formation by
K. pneumoniae. For instance, encapsulated bacteria was also previously been
reported to adhere weakly to epithelial cells and had reduced capacity for
invasion compared to non-encapsulated K. pneumoniae strains (Sahly, et al. ,
2000).
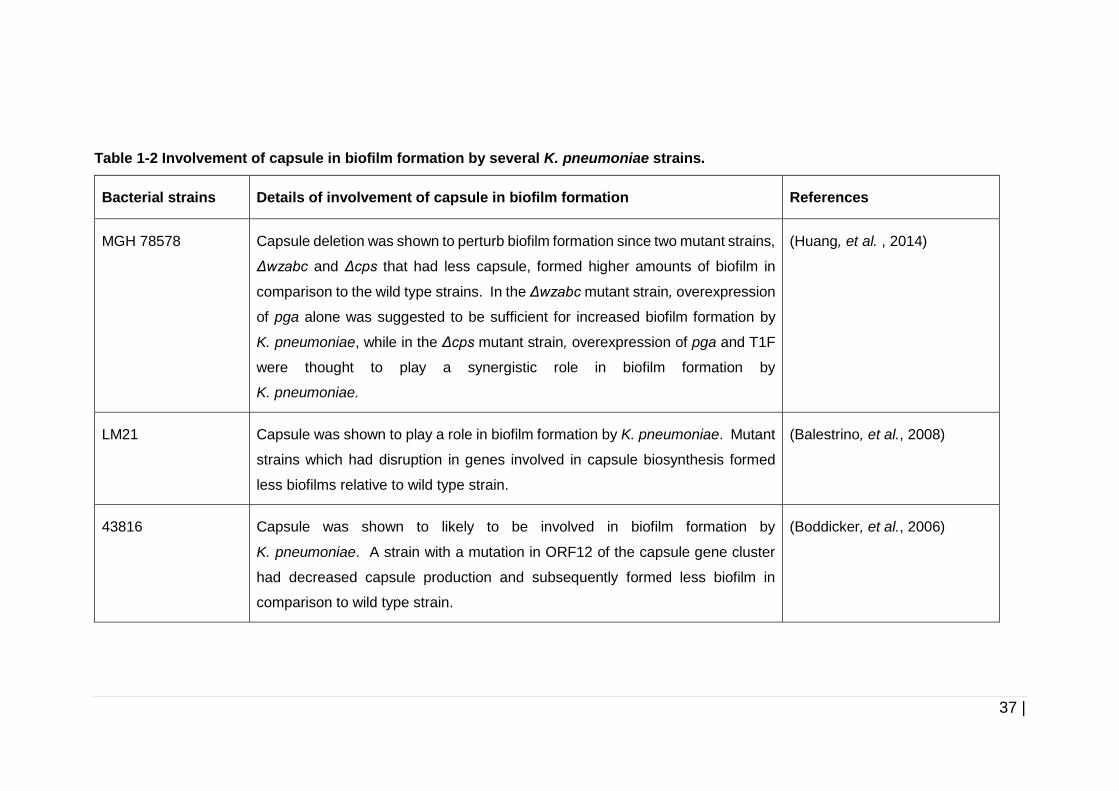
37 |
Table 1-2 Involvement of capsule in biofilm formation by several K. pneumoniae strains.
Bacterial strains Details of involvement of capsule in biofilm formation References
MGH 78578 Capsule deletion was shown to perturb biofilm formation since two mutant strains,
Δwzabc and Δcps that had less capsule, formed higher amounts of biofilm in
comparison to the wild type strains. In the Δwzabc mutant strain, overexpression
of pga alone was suggested to be sufficient for increased biofilm formation by
K. pneumoniae, while in the Δcps mutant strain, overexpression of pga and T1F
were thought to play a synergistic role in biofilm formation by
K. pneumoniae.
(Huang, et al. , 2014)
LM21 Capsule was shown to play a role in biofilm formation by K. pneumoniae. Mutant
strains which had disruption in genes involved in capsule biosynthesis formed
less biofilms relative to wild type strain.
(Balestrino, et al., 2008)
43816 Capsule was shown to likely to be involved in biofilm formation by
K. pneumoniae. A strain with a mutation in ORF12 of the capsule gene cluster
had decreased capsule production and subsequently formed less biofilm in
comparison to wild type strain.
(Boddicker, et al., 2006)
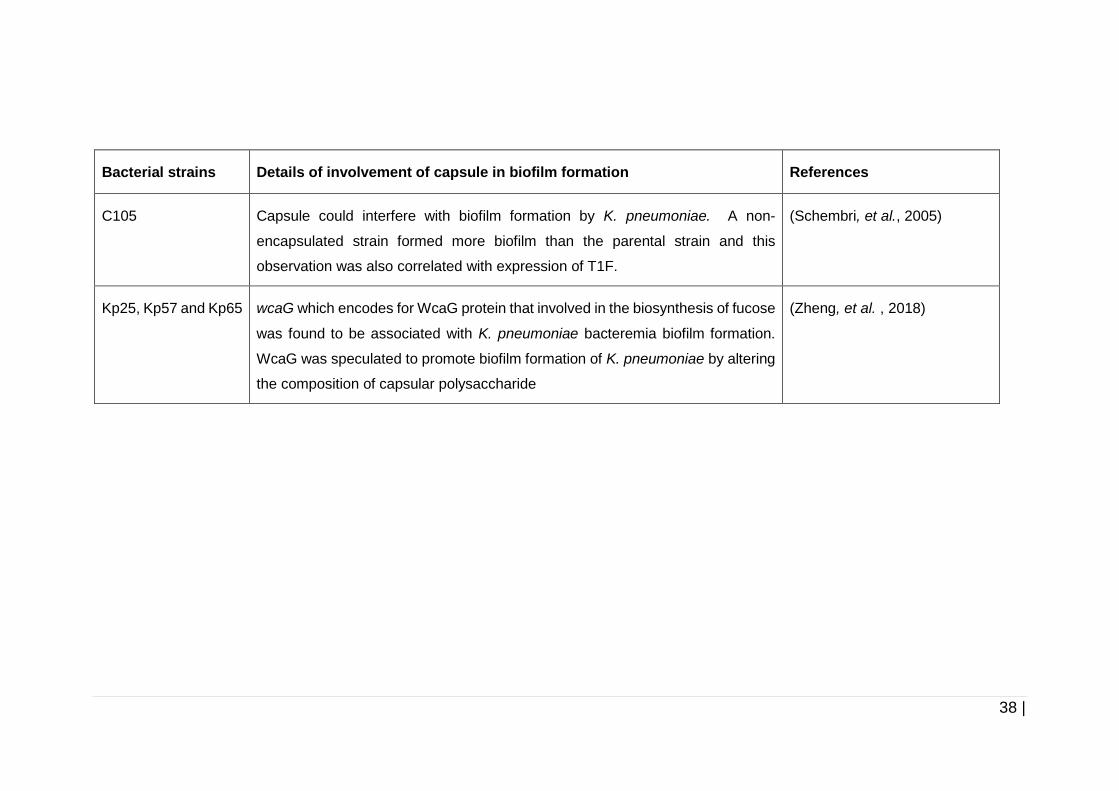
38 |
Bacterial strains Details of involvement of capsule in biofilm formation References
C105 Capsule could interfere with biofilm formation by K. pneumoniae. A non-
encapsulated strain formed more biofilm than the parental strain and this
observation was also correlated with expression of T1F.
(Schembri, et al., 2005)
Kp25, Kp57 and Kp65 wcaG which encodes for WcaG protein that involved in the biosynthesis of fucose
was found to be associated with K. pneumoniae bacteremia biofilm formation.
WcaG was speculated to promote biofilm formation of K. pneumoniae by altering
the composition of capsular polysaccharide
(Zheng, et al. , 2018)
39 |
Beside capsule, previous studies have shown that T1F and T3F are
coordinately controlled in biofilm formation by K. pneumoniae. A study by
Murphy, et al. (2013) found both of these fimbriae contributed to bacterial
adherence in a murine catheter associated urinary tract infection model, and
Stahlhut, et al. (2012) also showed that T1F and T3F were coordinately
controlled under a strict co-regulation system and the capacity to form biofilm
was severely diminished when both of them were absent.
However, the role of T1F in biofilm formation is shown to be dependent on the
experimental conditions such as the experimental model, characteristics of the
substratum, and growth medium used for cultivation of the biofilm. For
example, by using well defined isogenic mutants, Schroll, et al. (2010) reported
that T3F but not T1F promoted biofilm formation by K. pneumoniae C3091
upon cultivation in a fastidious anaerobic medium in a flow system. T1F was
found to be downregulated in the biofilm community upon cultivation under this
conditions. While, Stahlhut, et al. (2012) reported that T1F are as important
as T3F in promoting biofilm formation on catheter upon cultivation in pooled
human urine in a catheterised bladder model. This study also clearly showed
that both fimbrial types are coordinately controlled which means that T1F and
T3F do not simultaneously express in one individual cells; if T1F is expressed,
T3F is not expressed and vice versa. For example, during biofilm formation
on urinary catheters, each individual cell was observed to express either T1F
or T3F, but not both. However, neither of the fimbriae were found to be
expressed in planktonic cells.
40 |
To date, the relationship between Omps and biofilm formation by
K. pneumoniae is still unclear. However, there is evidence from several
studies that demonstrated that OmpC of E. coli and OmpC of Salmonella
enterica serovar Typhi, homologs of OmpK36 of K. pneumoniae could play a
role in initial adhesion or biofilm formation by E. coli, S. enterica ser. Typhi or
S. enterica ser. Typhimurium on biotic and abiotic surfaces (Gonzalez-
Escobedo, et al. , 2011; Rolhion, et al. , 2007). In addition, the ompC of E. coli
K-12 was observed to be among the upregulated genes in sessile bacteria
compared to planktonic cells in a high osmolarity environment (Prigent-
Combaret, et al. , 1999). The OmpC of S. enterica ser. Typhimurium, which is
identical to the OmpC S. enterica ser. Typhi was also shown to be essential
for binding and biofilm formation by S. enterica ser. Typhimurium on
cholesterol surfaces in the presence of bile (Crawford, et al. , 2010). OmpC is
thought to be essential for biofilm formation in the presence of bile possibly
because it mediates the electrostatic interaction between bacterial cells and
the cholesterol surface, acts as a nutrient channel which is involved in biofilm
health and also controls cell-cell interactions in the biofilm as it does in biofilms
of E. coli (Pruss, et al. , 2006). This finding is also supported by Gonzalez-
Escobedo, et al. (2011), who demonstrated that loss of OmpC negatively
affected the initial binding of S. enterica ser. Typhi on cholesterol gallstones.
In the light of these previous findings, the role of OmpK35 and OmpK36 in
pathogenic K. pneumoniae biofilm formation was investigated in this study.
41 |
1.7 Mechanisms of antibiotic resistance in bacterial biofilms
The formation of biofilms is an important resistance mechanism towards
antibiotics and confers protection against host defense mechanisms. Bacteria
have an increased capacity to withstand antibiotic-mediated killing once a
biofilm is formed. The ability of biofilms to endure in the environment in the
presence of high concentrations of antibiotics is defined as recalcitrance
(Lebeaux, et al. , 2014). The recalcitrance phenomenon toward antibiotics in
biofilms is still clinically difficult to manage. It can lead to failure of treatment,
recurrence of infection, and mortality. Tissue-related and device-related
infections by K. pneumoniae are very problematic and have been associated
with recurring infections. There is a lot of evidence showing that biofilm
communities of K. pneumoniae are more resistant to antimicrobial agents than
their planktonic counterparts (Davies, 2003; Lewis, 2001). The resistance
mechanisms which enable biofilms to be less susceptible to antibiotics than
planktonic cells have been attributed to several main hypotheses (Mah, et al.,
2001; Stewart, 2002).
The first hypothesis is the delay or failure of the antibiotic to penetrate through
biofilms. The biofilm matrix layer which is complex and dense matrix or EPS
can consist of polysaccharides, proteins, eDNA, and lipids which interrupts the
penetration of antibiotics through the thick layer of matrix (Stewart, et al. ,
2001).
The second hypothesis posits that bacteria grow slower in biofilms. Bacteria
which are deep within biofilms are dividing at relatively slower rates than those
which are closer to the surface. This is probably due to gradient of nutrients

42 |
and oxygen, signalling factors, waste products, and other substrates within
biofilms that leads to metabolically inactive and slow growth of the cells in the
biofilm community (Wimpenny, et al. , 2000). Slow growing or non-growing
bacterial cells are resistant to antimicrobial challenge as most of the antibiotics
act upon rapidly dividing cells. Penicillin and ampicillin, for example, only kill
growing cells instead of non-dividing cells (Lewis, 2001).
43 |
1.8 Aims and hypothesis of this study
K. pneumoniae is an opportunistic pathogen that primarily causes urinary tract
infections, septicaemia, and respiratory tract infections. The ability to form
biofilms on a medical device, for example, urinary catheters, is known as one
of the important causative factors contributing to the nosocomial
K. pneumoniae infections, and subsequently, the treatment of K. pneumoniae
infections becomes unmanageable.
We hypothesised that exposure of K. pneumoniae cultures and mature biofilms
to sub-minimum inhibitory concentrations (sub-MICs) of antibiotics would
enhance biofilm formation by K. pneumoniae. The aims of the first chapter of
this PhD project were to identify the effect of antibiotic (with different modes of
actions) exposure on biofilm formation by K. pneumoniae since there are
studies showing that antibiotic exposure could enhance and stimulate biofilm
formation in other pathogenic bacteria.
We also hypothesised that the capacity to form biofilm in different
environments and the main components of the biofilm matrix of K. pneumoniae
biofilms are strain dependent. To test this hypothesis, in the second chapter,
we determined the capacity of K. pneumoniae to form biofilm in two different
media, nutrient-rich and nutrient-poor media and identify the EPS produced by
tested K. pneumoniae strains during biofilm formation in both of the media.
We conducted enzymatic biofilm inhibition assays and biofilm disruption
assays upon cultivation of the examined K. pneumoniae strains in nutrient-rich
medium, tryptic soy broth (TSB), and nutrient-poor medium, artificial urine
medium (AUM).
44 |
In the third chapter, we hypothesised that T1F possibly plays a role in biofilm
formation by K. pneumoniae upon cultivation in TSB and AUM. The role of
T1F in biofilm formation was investigated by determining the orientation of fimS
which controls the expression of fimA, the major subunit of T1F, in planktonic
and biofilm cells cultivated in TSB and AUM. To examine this, biofilm mass
for all of the examined strains was compared upon cultivation in TSB and AUM,
and the orientation of fimS was then determined. This knowledge could
improve the understanding of T1F regulation and their involvement in biofilm
formation by K. pneumoniae in different environments.
In addition, based on the findings in Chapter 4, we also hypothesised that outer
membrane porins (Omps), could possibly be involved in biofilm formation by
K. pneumoniae since other studies have shown a role for Omps. For example,
OmpC was shown to be involved in biofilm formation by S. enterica ser. Typhi
and was also found to be upregulated in biofilm cells of E. coli. The role of
Omps in biofilm formation was investigated by developing ∆ompK35 and
∆ompK36 mutant strains of K. pneumoniae, and comparing their capacity to
form biofilm on abiotic surfaces in comparison to the parental wild type strains.
Kpneu_1 and C3091, and its mutant strains were subsequently tested for their
capacity to form biofilms on silicone catheter cultivated in TSB and AUM. To
examine this, biofilm assays using catheter pieces inoculated with mutant or
wild type strains cultivated in TSB and AUM were conducted.

45 |
Chapter 2.0
Materials and Methods
46 |
2.0 Materials and Methods
This chapter describes the materials and methods that were used throughout
the study. The specific materials and methods for each experiment within a
chapter are outlined at the beginning of that particular chapter.
2.1 Sources of media, enzymes and reagent
Tryptic soy broth (TSB), Luria-Bertani (LB), agar bacteriological no 1, Mueller-
Hinton (MH) broth, and brain heart infusion (BHI) were obtained from Sigma
(Sigma, UK). All antibiotics were obtained from Sigma-Aldrich (Poole, UK) and
were used at a concentration of 100 µg/ml ampicillin (amp), 100 µg/ml
spectinomycin (spc), 50 µg/ml apramycin (apra) and 12.5 µg/ml tetracycline
(tet). Erythromycin (erm), gentamicin (gen), and ciprofloxacin (cipro) were
used at different concentrations depending on the experiments. All of the
restriction enzymes were obtained from New England Biolabs (NEB),
(Hertfordshire, UK).
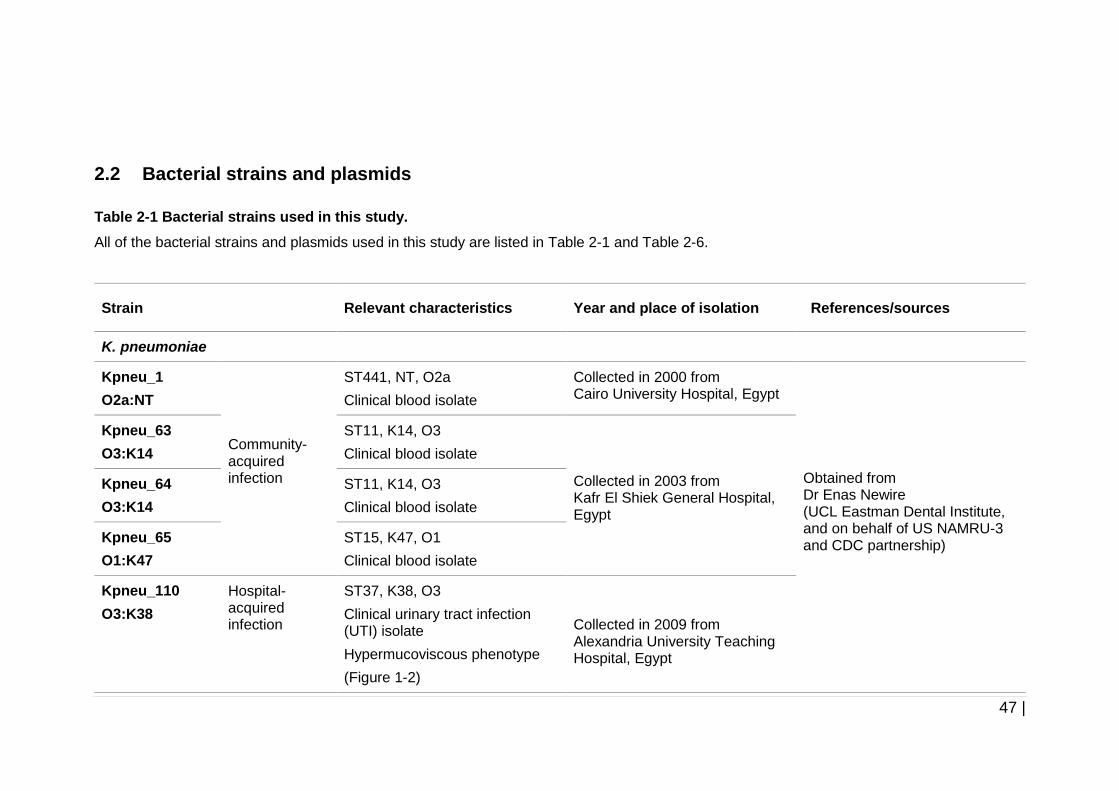
47 |
2.2 Bacterial strains and plasmids
Table 2-1 Bacterial strains used in this study.
All of the bacterial strains and plasmids used in this study are listed in Table 2-1 and Table 2-6.
Strain Relevant characteristics Year and place of isolation References/sources
K. pneumoniae
Kpneu_1
O2a:NT
Community-acquired infection
ST441, NT, O2a
Clinical blood isolate
Collected in 2000 from Cairo University Hospital, Egypt
Obtained from Dr Enas Newire (UCL Eastman Dental Institute, and on behalf of US NAMRU-3 and CDC partnership)
Kpneu_63
O3:K14
ST11, K14, O3
Clinical blood isolate
Collected in 2003 from Kafr El Shiek General Hospital, Egypt
Kpneu_64
O3:K14
ST11, K14, O3
Clinical blood isolate
Kpneu_65
O1:K47
ST15, K47, O1
Clinical blood isolate
Kpneu_110
O3:K38
Hospital-acquired infection
ST37, K38, O3
Clinical urinary tract infection (UTI) isolate
Hypermucoviscous phenotype
(Figure 1-2)
Collected in 2009 from Alexandria University Teaching Hospital, Egypt
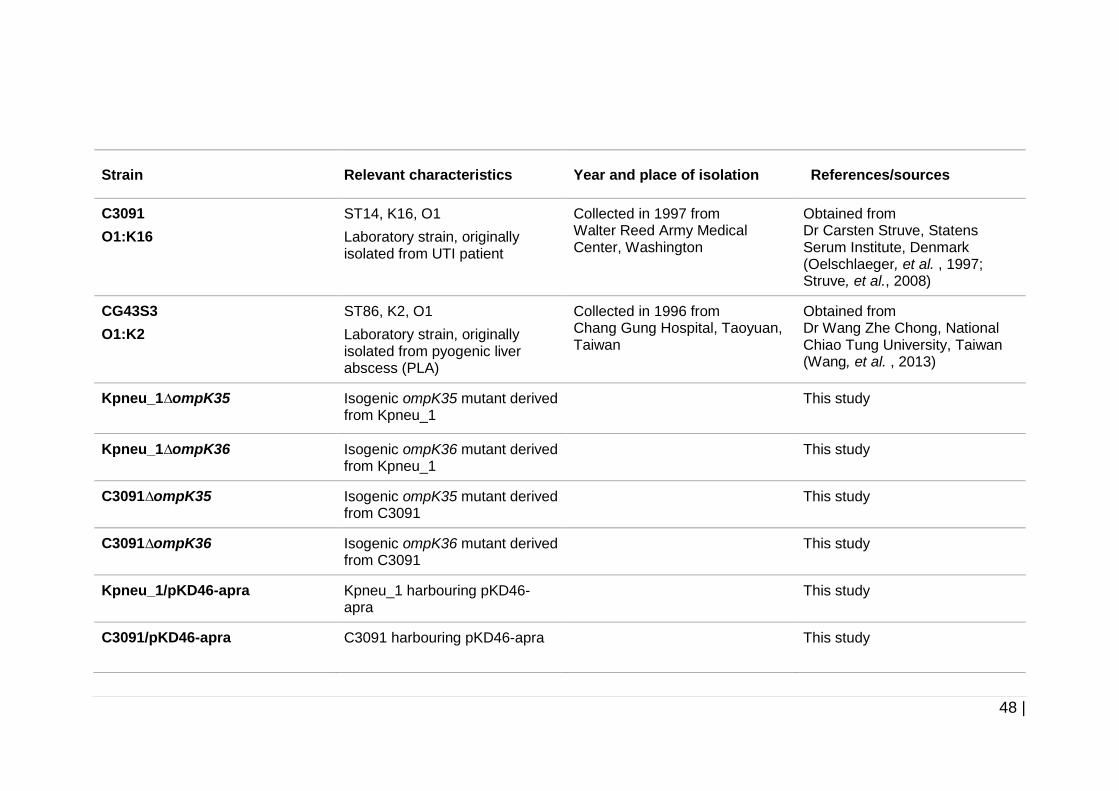
48 |
Strain Relevant characteristics Year and place of isolation References/sources
C3091
O1:K16
ST14, K16, O1
Laboratory strain, originally isolated from UTI patient
Collected in 1997 from Walter Reed Army Medical Center, Washington
Obtained from Dr Carsten Struve, Statens Serum Institute, Denmark (Oelschlaeger, et al. , 1997; Struve, et al., 2008)
CG43S3
O1:K2
ST86, K2, O1
Laboratory strain, originally isolated from pyogenic liver abscess (PLA)
Collected in 1996 from Chang Gung Hospital, Taoyuan, Taiwan
Obtained from Dr Wang Zhe Chong, National Chiao Tung University, Taiwan (Wang, et al. , 2013)
Kpneu_1∆ompK35 Isogenic ompK35 mutant derived from Kpneu_1
This study
Kpneu_1∆ompK36 Isogenic ompK36 mutant derived from Kpneu_1
This study
C3091∆ompK35 Isogenic ompK35 mutant derived from C3091
This study
C3091∆ompK36 Isogenic ompK36 mutant derived from C3091
This study
Kpneu_1/pKD46-apra Kpneu_1 harbouring pKD46-apra
This study
C3091/pKD46-apra C3091 harbouring pKD46-apra This study
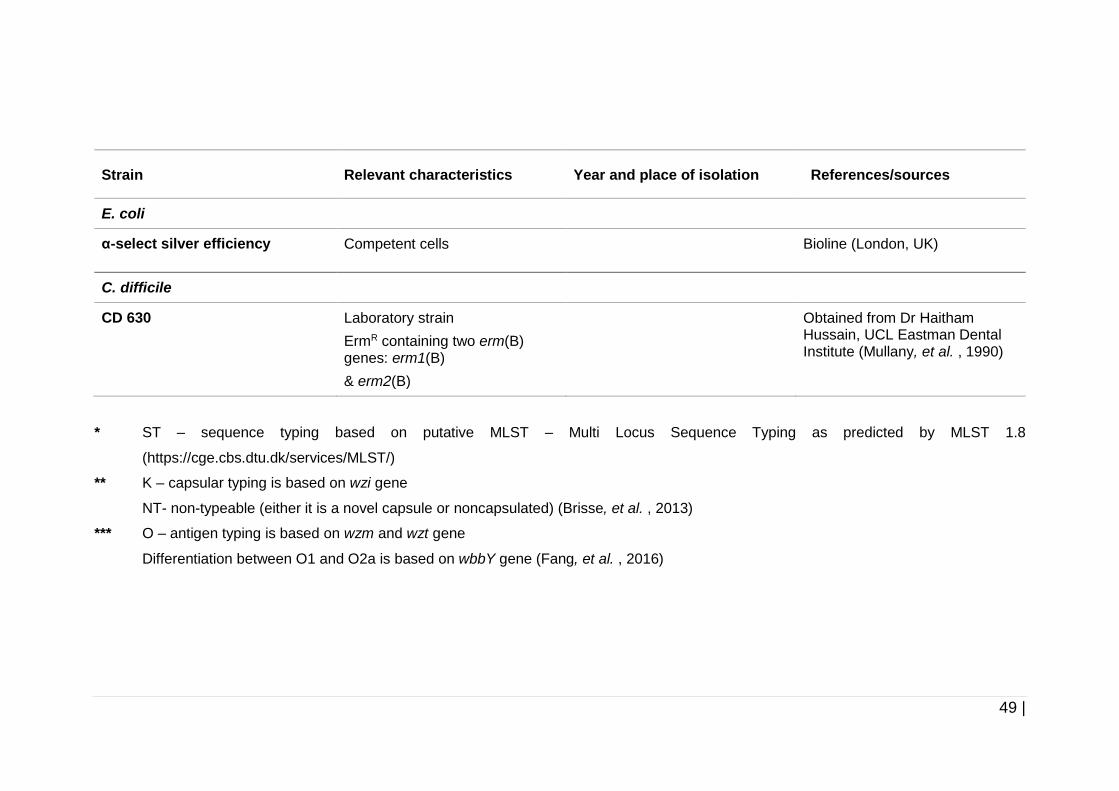
49 |
Strain Relevant characteristics Year and place of isolation References/sources
E. coli
α-select silver efficiency Competent cells Bioline (London, UK)
C. difficile
CD 630 Laboratory strain
ErmR containing two erm(B) genes: erm1(B)
& erm2(B)
Obtained from Dr Haitham Hussain, UCL Eastman Dental Institute (Mullany, et al. , 1990)
* ST – sequence typing based on putative MLST – Multi Locus Sequence Typing as predicted by MLST 1.8
(https://cge.cbs.dtu.dk/services/MLST/)
** K – capsular typing is based on wzi gene
NT- non-typeable (either it is a novel capsule or noncapsulated) (Brisse, et al. , 2013)
*** O – antigen typing is based on wzm and wzt gene
Differentiation between O1 and O2a is based on wbbY gene (Fang, et al. , 2016)
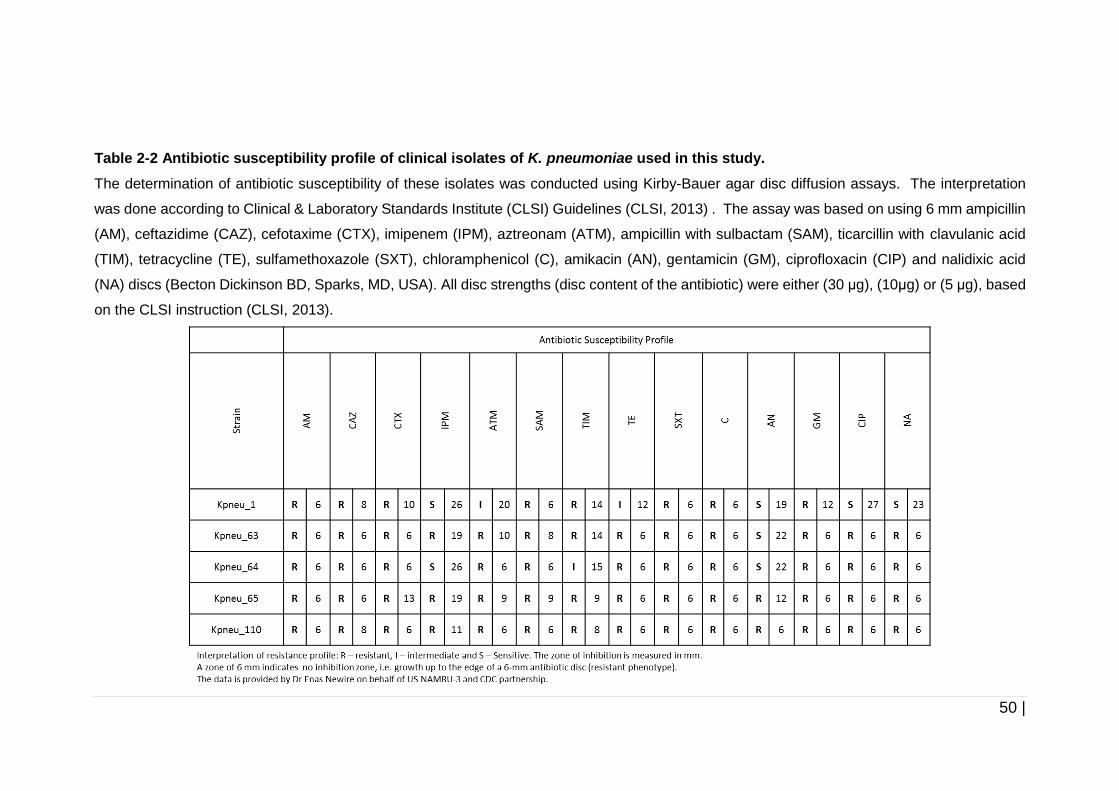
50 |
Table 2-2 Antibiotic susceptibility profile of clinical isolates of K. pneumoniae used in this study.
The determination of antibiotic susceptibility of these isolates was conducted using Kirby-Bauer agar disc diffusion assays. The interpretation
was done according to Clinical & Laboratory Standards Institute (CLSI) Guidelines (CLSI, 2013) . The assay was based on using 6 mm ampicillin
(AM), ceftazidime (CAZ), cefotaxime (CTX), imipenem (IPM), aztreonam (ATM), ampicillin with sulbactam (SAM), ticarcillin with clavulanic acid
(TIM), tetracycline (TE), sulfamethoxazole (SXT), chloramphenicol (C), amikacin (AN), gentamicin (GM), ciprofloxacin (CIP) and nalidixic acid
(NA) discs (Becton Dickinson BD, Sparks, MD, USA). All disc strengths (disc content of the antibiotic) were either (30 μg), (10μg) or (5 μg), based
on the CLSI instruction (CLSI, 2013).
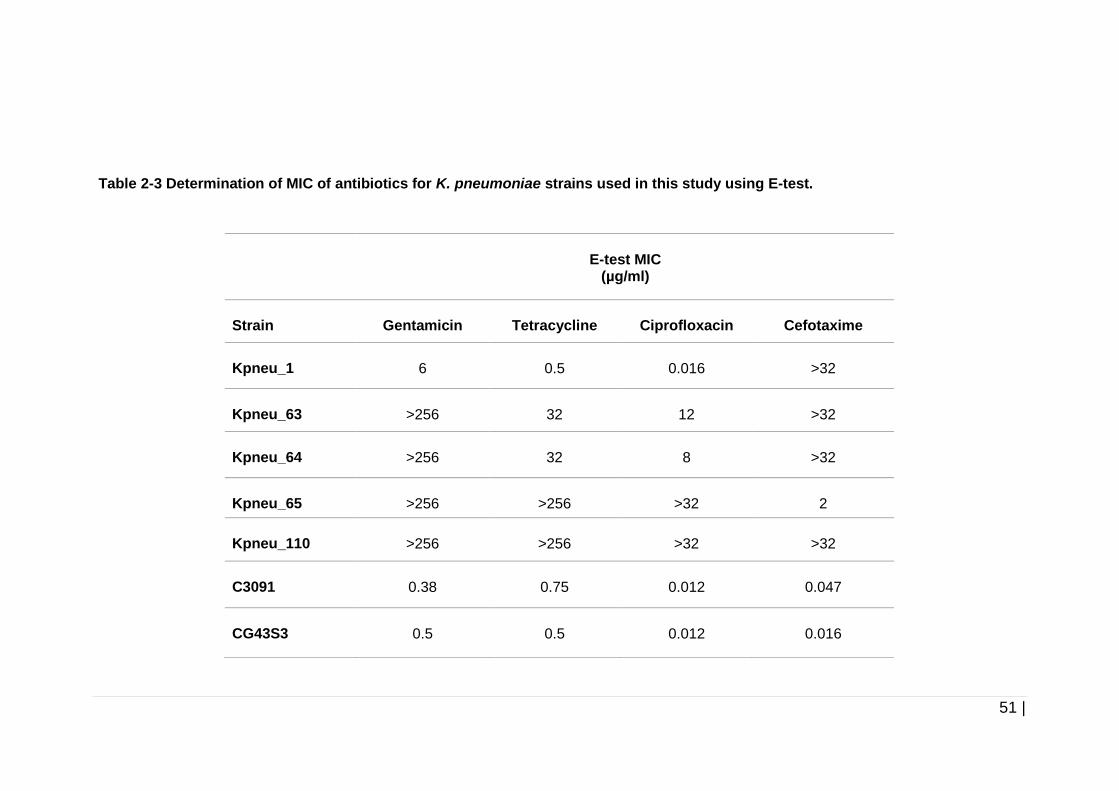
51 |
Table 2-3 Determination of MIC of antibiotics for K. pneumoniae strains used in this study using E-test.
E-test MIC
(µg/ml)
Strain
Gentamicin
Tetracycline
Ciprofloxacin
Cefotaxime
Kpneu_1
6
0.5
0.016
>32
Kpneu_63
>256
32
12
>32
Kpneu_64
>256
32
8
>32
Kpneu_65
>256
>256
>32
2
Kpneu_110
>256
>256
>32
>32
C3091
0.38
0.75
0.012
0.047
CG43S3
0.5
0.5
0.012
0.016
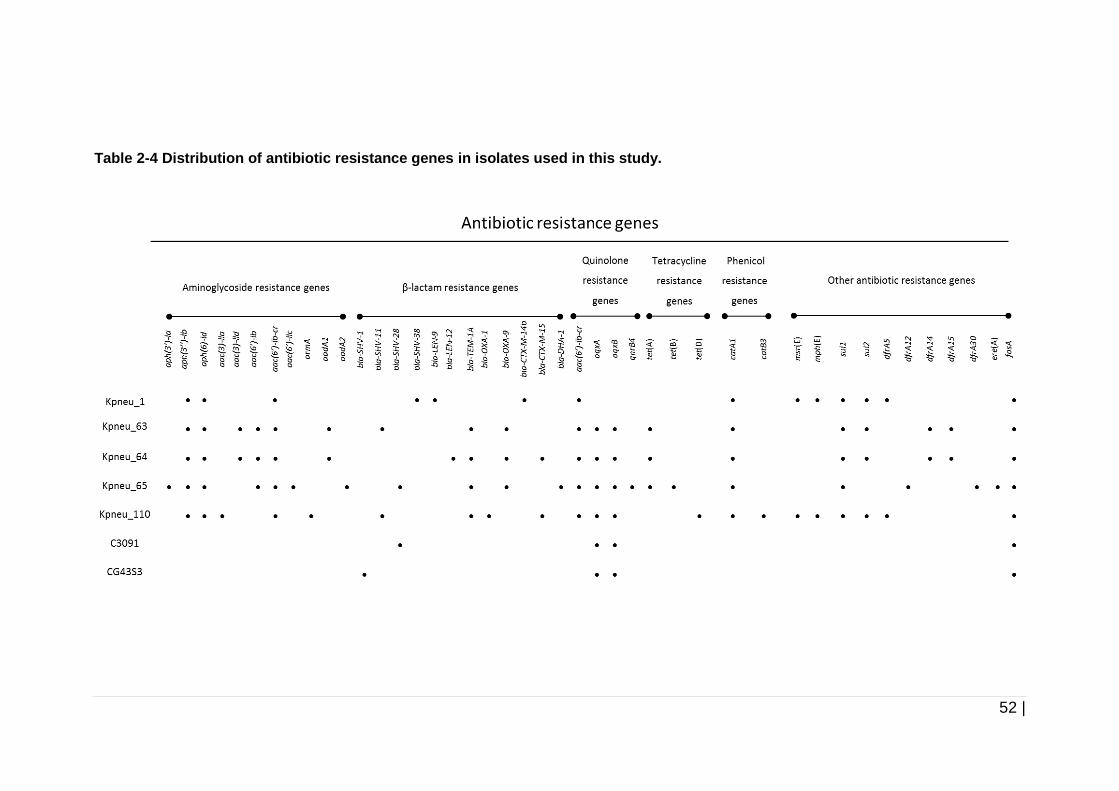
52 |
Table 2-4 Distribution of antibiotic resistance genes in isolates used in this study.
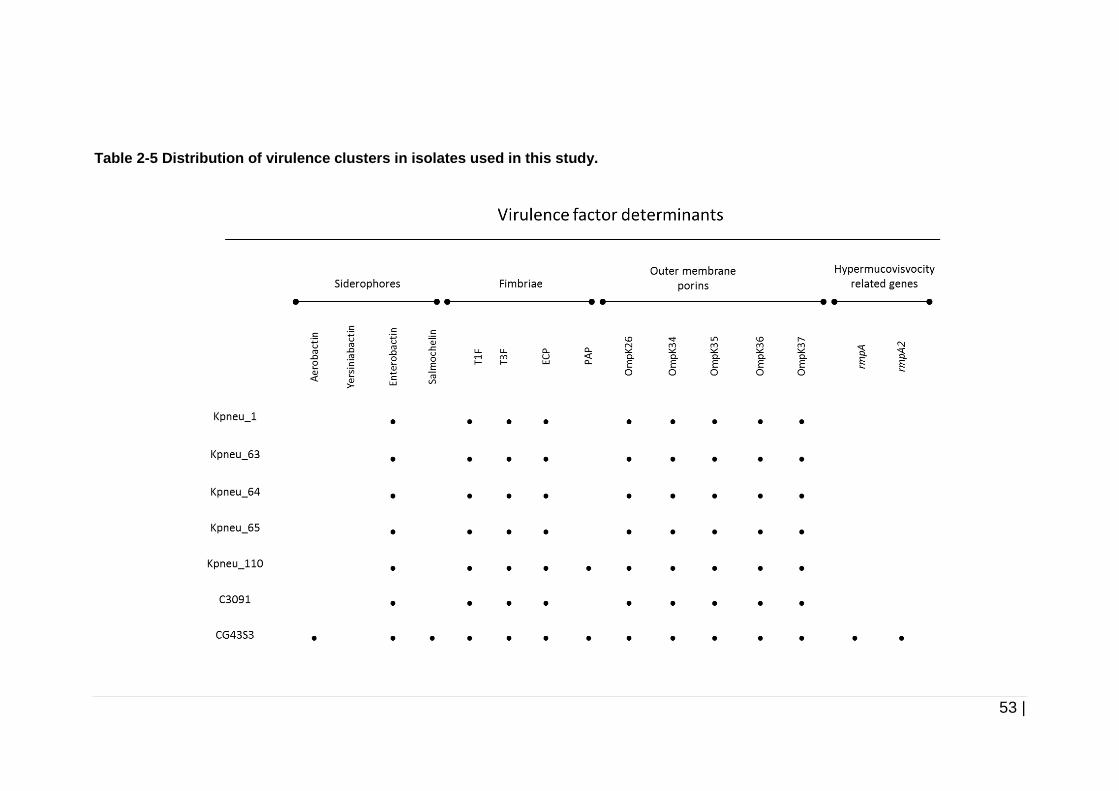
53 |
Table 2-5 Distribution of virulence clusters in isolates used in this study.
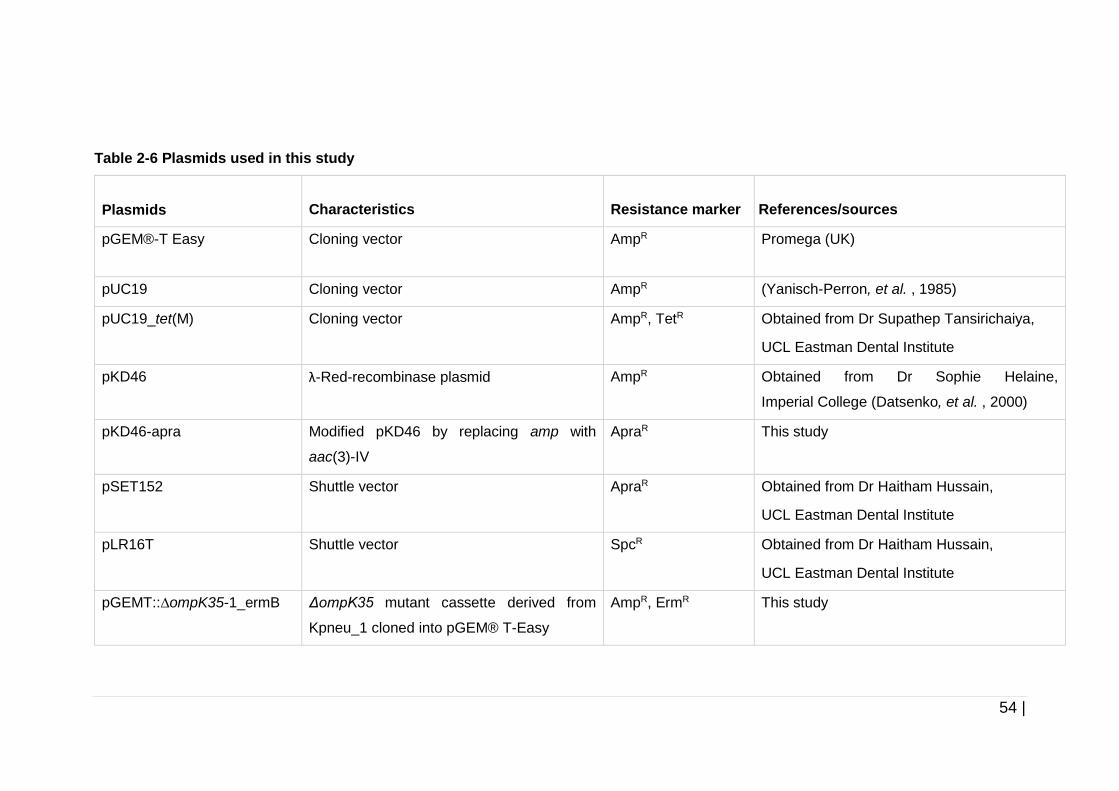
54 |
Table 2-6 Plasmids used in this study
Plasmids
Characteristics
Resistance marker
References/sources
pGEM®-T Easy Cloning vector AmpR Promega (UK)
pUC19 Cloning vector AmpR (Yanisch-Perron, et al. , 1985)
pUC19_tet(M) Cloning vector AmpR, TetR Obtained from Dr Supathep Tansirichaiya,
UCL Eastman Dental Institute
pKD46 λ-Red-recombinase plasmid AmpR Obtained from Dr Sophie Helaine,
Imperial College (Datsenko, et al. , 2000)
pKD46-apra Modified pKD46 by replacing amp with
aac(3)-IV
ApraR This study
pSET152 Shuttle vector ApraR Obtained from Dr Haitham Hussain,
UCL Eastman Dental Institute
pLR16T Shuttle vector SpcR Obtained from Dr Haitham Hussain,
UCL Eastman Dental Institute
pGEMT::∆ompK35-1_ermB ΔompK35 mutant cassette derived from
Kpneu_1 cloned into pGEM® T-Easy
AmpR, ErmR This study
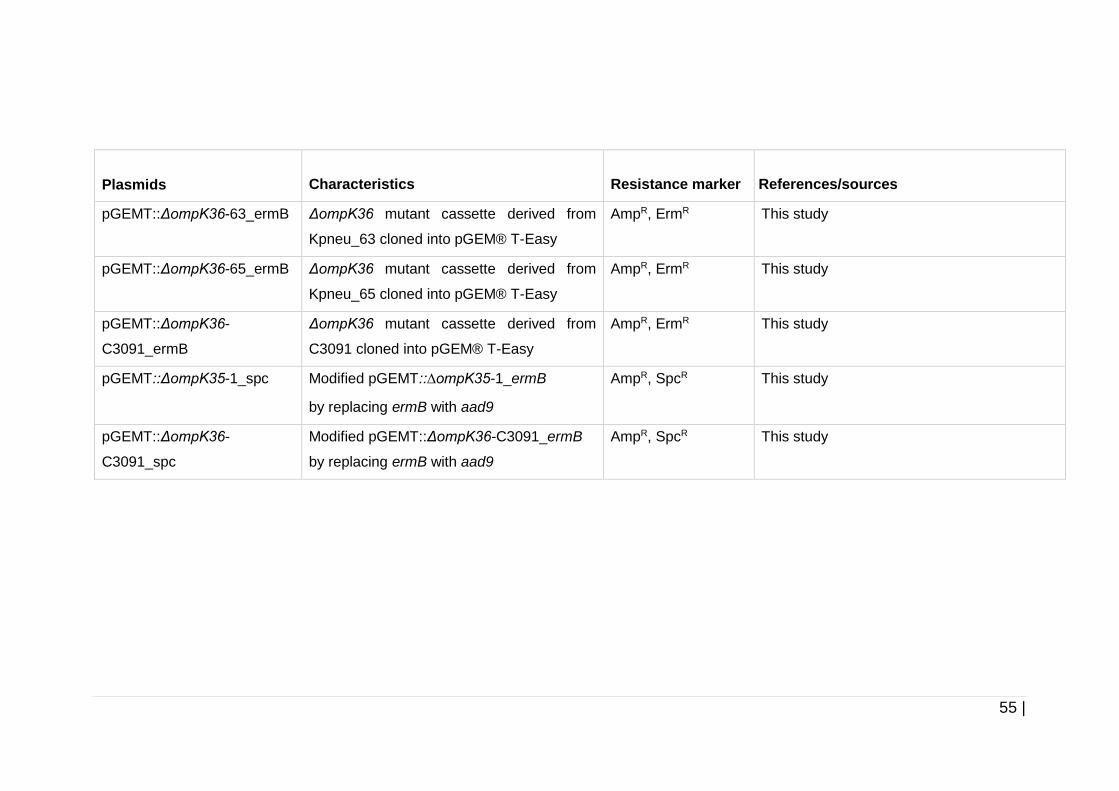
55 |
Plasmids
Characteristics
Resistance marker
References/sources
pGEMT::ΔompK36-63_ermB ΔompK36 mutant cassette derived from
Kpneu_63 cloned into pGEM® T-Easy
AmpR, ErmR This study
pGEMT::ΔompK36-65_ermB ΔompK36 mutant cassette derived from
Kpneu_65 cloned into pGEM® T-Easy
AmpR, ErmR This study
pGEMT::ΔompK36-
C3091_ermB
ΔompK36 mutant cassette derived from
C3091 cloned into pGEM® T-Easy
AmpR, ErmR This study
pGEMT::ΔompK35-1_spc Modified pGEMT::∆ompK35-1_ermB
by replacing ermB with aad9
AmpR, SpcR This study
pGEMT::ΔompK36-
C3091_spc
Modified pGEMT::ΔompK36-C3091_ermB
by replacing ermB with aad9
AmpR, SpcR This study
56 |
2.3 Growth condition and storage of bacteria
The bacterial strains used in this study are listed in Table 2-1. All the
K. pneumoniae strains were cultivated on LB agar unless stated otherwise
(with appropriate concentrations of antibiotics when needed) and incubated
aerobically at 37 °C for 16 h statically or on a rotary shaker at 200 rpm when
grown in broth unless stated otherwise. The C. difficile strain was grown in
BHI supplemented with C. difficile selective supplement and 5 % horse blood.
The culture was incubated in a MACS-MG-1000 anaerobic workstation (Don
Whitley Scientific) containing 10 % H2, 10 % CO2 and 80 % N2 at 37 °C for
48 h. All of the bacterial strains were stored at -80 °C in growth medium
containing 20 % (v/v) sterile glycerol.
2.4 Molecular biology methods
2.4.1 Genomic DNA and plasmid extraction
Genomic DNA of K. pneumoniae strains was extracted using Puregene
Yeast/Bact Kit for Gram-negative bacteria (Qiagen, UK), and genomic DNA for
C. difficile 630 was isolated using Puregene Yeast/Bact Kit for Gram-positive
bacteria (Qiagen, UK). All the plasmids used in this study were extracted using
QIAprep Spin Miniprep Kit (Qiagen, UK). All the methods were conducted
according to manufacturer’s protocol with some modifications. The DNA was
eluted using molecular grade water (Sigma-Aldrich) instead of the elution
buffer supplied by the manufacturer.
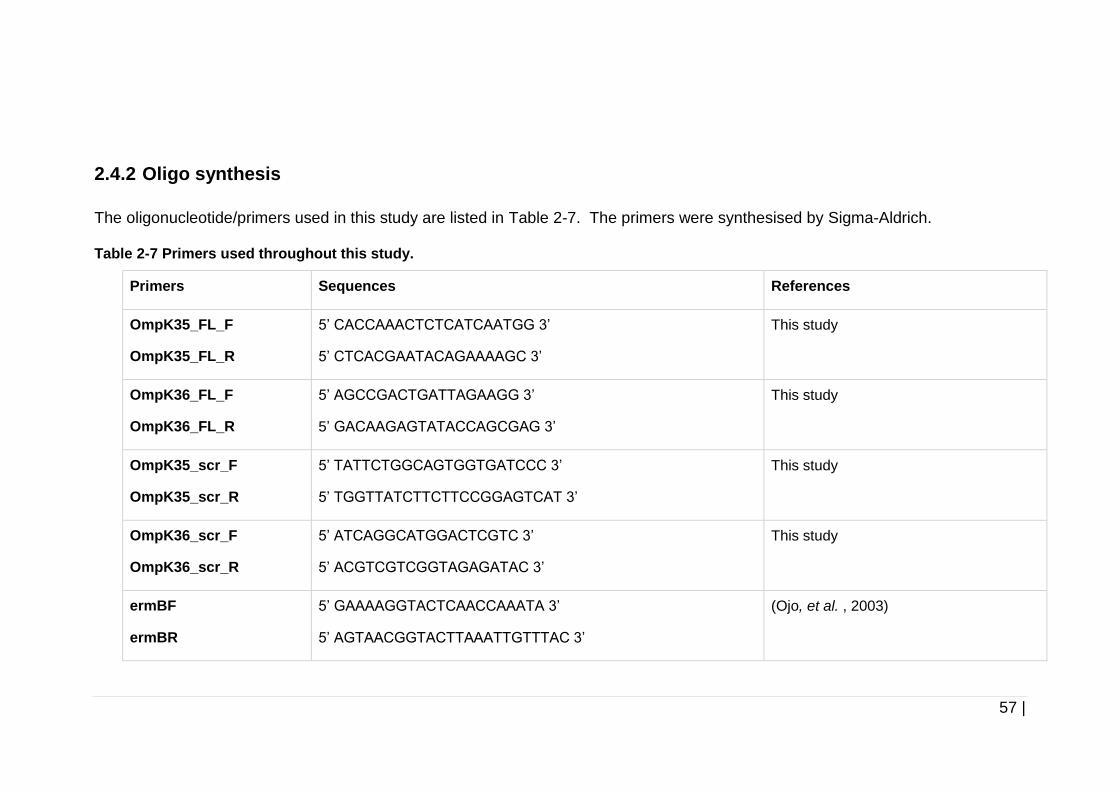
57 |
2.4.2 Oligo synthesis
The oligonucleotide/primers used in this study are listed in Table 2-7. The primers were synthesised by Sigma-Aldrich.
Table 2-7 Primers used throughout this study.
Primers Sequences References
OmpK35_FL_F
OmpK35_FL_R
5’ CACCAAACTCTCATCAATGG 3’
5’ CTCACGAATACAGAAAAGC 3’
This study
OmpK36_FL_F
OmpK36_FL_R
5’ AGCCGACTGATTAGAAGG 3’
5’ GACAAGAGTATACCAGCGAG 3’
This study
OmpK35_scr_F
OmpK35_scr_R
5’ TATTCTGGCAGTGGTGATCCC 3’
5’ TGGTTATCTTCTTCCGGAGTCAT 3’
This study
OmpK36_scr_F
OmpK36_scr_R
5’ ATCAGGCATGGACTCGTC 3’
5’ ACGTCGTCGGTAGAGATAC 3’
This study
ermBF
ermBR
5’ GAAAAGGTACTCAACCAAATA 3’
5’ AGTAACGGTACTTAAATTGTTTAC 3’
(Ojo, et al. , 2003)
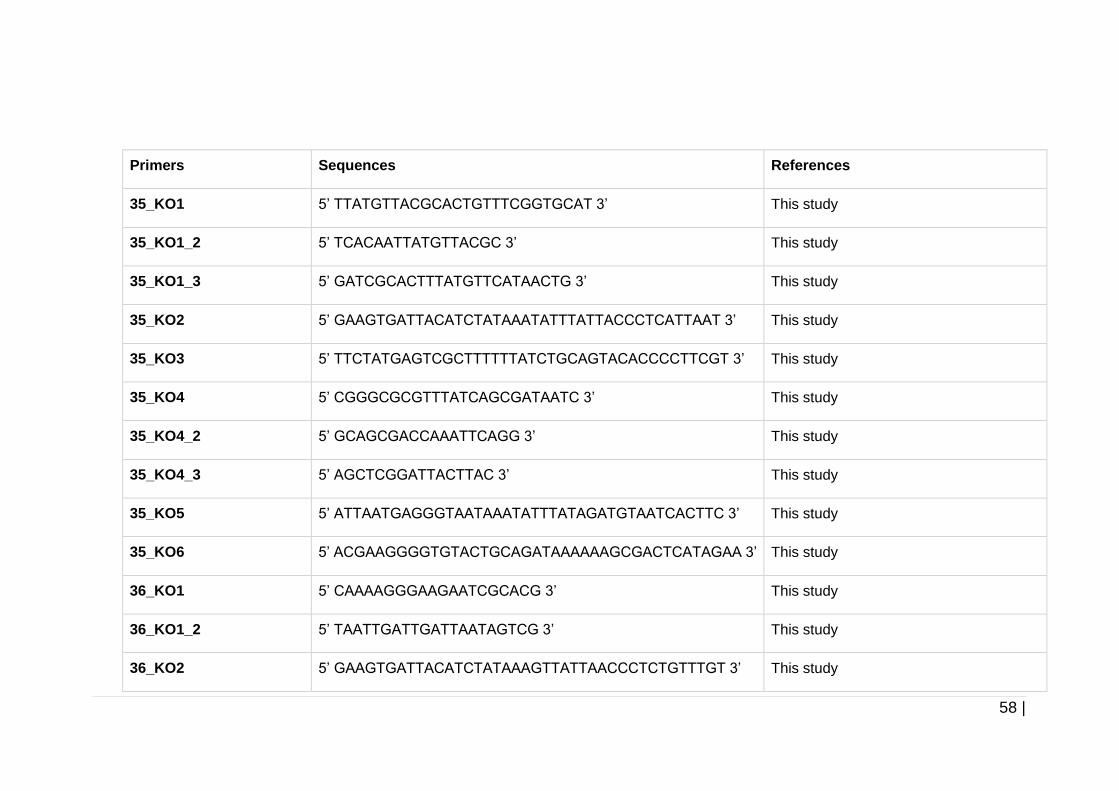
58 |
Primers Sequences References
35_KO1 5’ TTATGTTACGCACTGTTTCGGTGCAT 3’ This study
35_KO1_2 5’ TCACAATTATGTTACGC 3’ This study
35_KO1_3 5’ GATCGCACTTTATGTTCATAACTG 3’ This study
35_KO2 5’ GAAGTGATTACATCTATAAATATTTATTACCCTCATTAAT 3’ This study
35_KO3 5’ TTCTATGAGTCGCTTTTTTATCTGCAGTACACCCCTTCGT 3’ This study
35_KO4 5’ CGGGCGCGTTTATCAGCGATAATC 3’ This study
35_KO4_2 5’ GCAGCGACCAAATTCAGG 3’ This study
35_KO4_3 5’ AGCTCGGATTACTTAC 3’ This study
35_KO5 5’ ATTAATGAGGGTAATAAATATTTATAGATGTAATCACTTC 3’ This study
35_KO6 5’ ACGAAGGGGTGTACTGCAGATAAAAAAGCGACTCATAGAA 3’ This study
36_KO1 5’ CAAAAGGGAAGAATCGCACG 3’ This study
36_KO1_2 5’ TAATTGATTGATTAATAGTCG 3’ This study
36_KO2 5’ GAAGTGATTACATCTATAAAGTTATTAACCCTCTGTTTGT 3’ This study
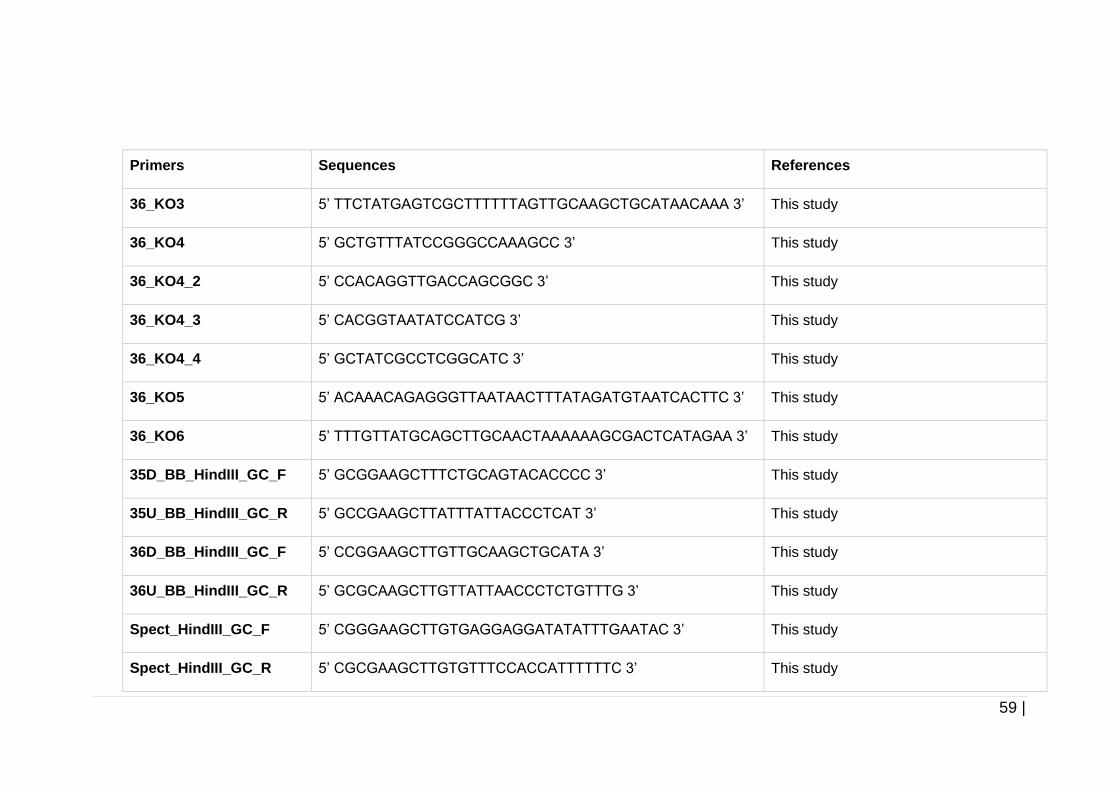
59 |
Primers Sequences References
36_KO3 5’ TTCTATGAGTCGCTTTTTTAGTTGCAAGCTGCATAACAAA 3’ This study
36_KO4 5’ GCTGTTTATCCGGGCCAAAGCC 3’ This study
36_KO4_2 5’ CCACAGGTTGACCAGCGGC 3’ This study
36_KO4_3 5’ CACGGTAATATCCATCG 3’ This study
36_KO4_4 5’ GCTATCGCCTCGGCATC 3’ This study
36_KO5 5’ ACAAACAGAGGGTTAATAACTTTATAGATGTAATCACTTC 3’ This study
36_KO6 5’ TTTGTTATGCAGCTTGCAACTAAAAAAGCGACTCATAGAA 3’ This study
35D_BB_HindIII_GC_F 5’ GCGGAAGCTTTCTGCAGTACACCCC 3’ This study
35U_BB_HindIII_GC_R 5’ GCCGAAGCTTATTTATTACCCTCAT 3’ This study
36D_BB_HindIII_GC_F 5’ CCGGAAGCTTGTTGCAAGCTGCATA 3’ This study
36U_BB_HindIII_GC_R 5’ GCGCAAGCTTGTTATTAACCCTCTGTTTG 3’ This study
Spect_HindIII_GC_F 5’ CGGGAAGCTTGTGAGGAGGATATATTTGAATAC 3’ This study
Spect_HindIII_GC_R 5’ CGCGAAGCTTGTGTTTCCACCATTTTTTC 3’ This study
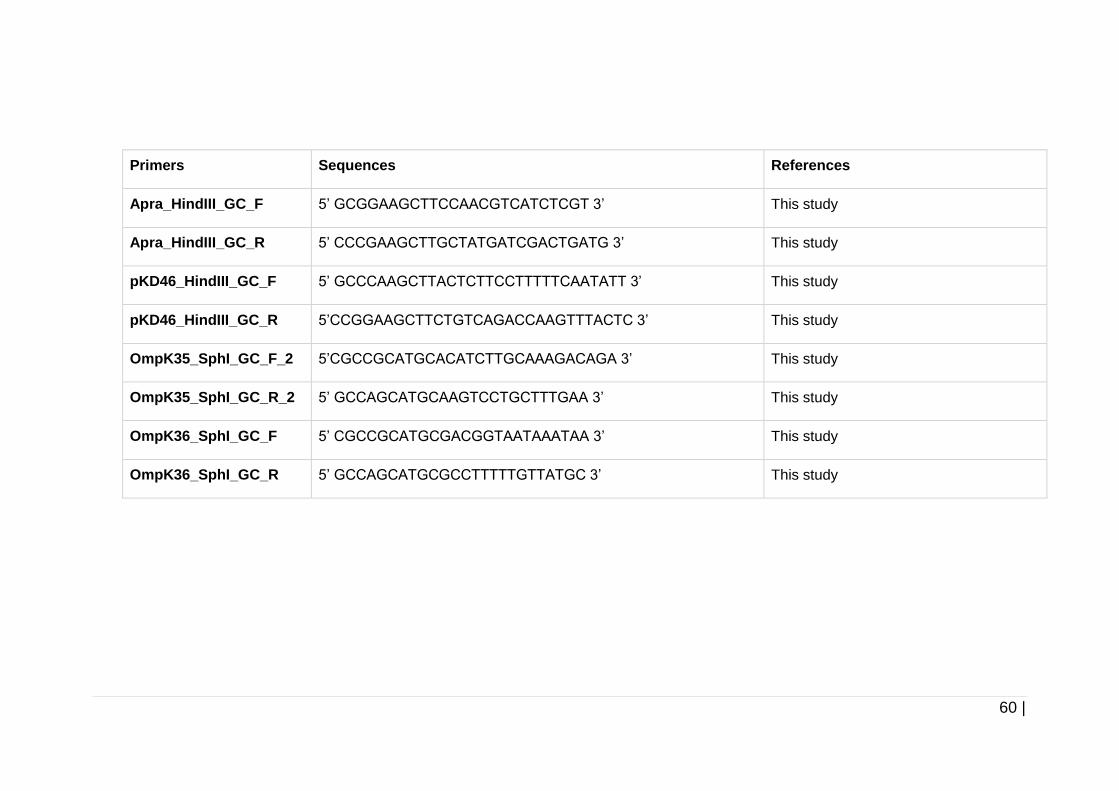
60 |
Primers Sequences References
Apra_HindIII_GC_F 5’ GCGGAAGCTTCCAACGTCATCTCGT 3’ This study
Apra_HindIII_GC_R 5’ CCCGAAGCTTGCTATGATCGACTGATG 3’ This study
pKD46_HindIII_GC_F 5’ GCCCAAGCTTACTCTTCCTTTTTCAATATT 3’ This study
pKD46_HindIII_GC_R 5’CCGGAAGCTTCTGTCAGACCAAGTTTACTC 3’ This study
OmpK35_SphI_GC_F_2 5’CGCCGCATGCACATCTTGCAAAGACAGA 3’ This study
OmpK35_SphI_GC_R_2 5’ GCCAGCATGCAAGTCCTGCTTTGAA 3’ This study
OmpK36_SphI_GC_F 5’ CGCCGCATGCGACGGTAATAAATAA 3’ This study
OmpK36_SphI_GC_R 5’ GCCAGCATGCGCCTTTTTGTTATGC 3’ This study
61 |
2.4.3 Polymerase chain reaction (PCR) amplification
Polymerase chain reactions were performed in 20 μl reaction volumes
containing 1 μl of 100 ng/μl of DNA template, 10 μl of 2X BioMix Red (contains
Taq DNA polymerase) (Bioline, UK) or Q5 High Fidelity 2X Master Mix (NEB,
UK) (contains Q5® High-Fidelity DNA polymerase for high fidelity
amplification), 1 μl of 10 μM of each primer and 7 μl of molecular grade water
(Sigma-Aldrich, UK) using a Biometra T3000 Thermocycler (Biometra,
Netherlands) with these following programmes:
A) Standard condition for 2X BioMix Red: initial denaturation at 94 °C for
2 min, and 30 cycles of denaturation step at 94 °C for 2 min (depending on the
template size), annealing step at 40 °C – 71.4 °C (depending on -5 °C of the
melting temperature) for 30 sec, extension step at 72 °C for 2 min to 5 min
(depending on the expected product sizes) and a final extension step at 72 °C
for 2 min to 5 min.
B) Standard condition for Q5 High Fidelity 2X Master Mix: initial
denaturation at 98 °C for 30 sec, and 35 cycles of denaturation step at 98 °C
for 10 sec, annealing step at 40 °C – 71.4 °C (depending on -5 °C of the melting
temperature) for 30 sec, extension step at 72 °C for 45 sec – 2 min (depending
on the expected product sizes) and a final extension step at 72 °C for 2 min.
2.4.4 Agarose gel electrophoresis
DNA was separated using a 1 % (unless stated otherwise) agarose gel by
electrophoresis. One percent (w/v) agarose gels were prepared in 1 X Tris
Acetate EDTA (TAE) buffer, and 0.3 µg/ml of ethidium bromide (EtBr) (Life
Technologies, UK) was added for visualization purposes. One microliter of
62 |
HyperLadderTM 1 kb (Bioline, UK) was loaded as a marker. The DNA sample
was mixed with 5 X loading dye (Qiagen, UK) and loaded onto the prepared
gel. The gel was electrophoresed in 1 X TAE at 90 V for appropriate times
(60 - 100 min). The gels were visualised under UV illumination using an Alpha
Imager (Alpha InnoTech, UK), and the image was captured by Alpha View
version 1.0.1.10 (Alpha InnoTech, UK). The size of the DNA fragments was
determined by comparing the obtained bands with DNA marker.
2.4.5 PCR purification and DNA purification from gels
The separated amplified regions were subjected to gel purification or PCR
purification using a QIAquick Gel Extraction kit (Qiagen, UK) or a QIAquick
PCR Purification kit (Qiagen, UK), respectively, according to the manufactures
recommendations. The elution step was done using molecular grade water
(Sigma-Aldrich) instead of the elution buffer supplied by the manufacturer.
2.4.6 DNA sequencing
All of the purified DNA samples were sequenced using Sanger sequencing
method (ABI 3730XL) performed by a DNA sequencing service, GeneWiz
(formerly known as Beckman Coulter Genomics), UK. Whole genome
sequencing by Illumina MiSeq platform was provided by MicrobesNG
(http://www.microbesng.uk), which is supported by the BBSRC (grant number
BB/L024209/1).
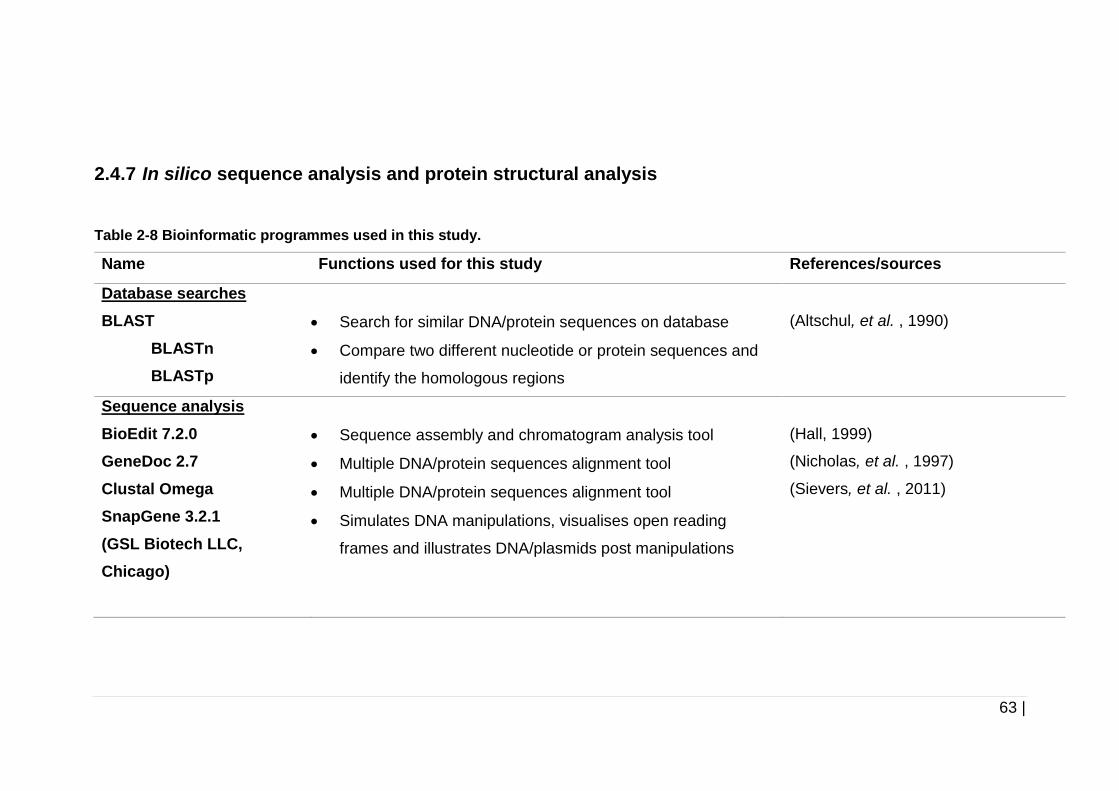
63 |
2.4.7 In silico sequence analysis and protein structural analysis
Table 2-8 Bioinformatic programmes used in this study.
Name Functions used for this study References/sources
Database searches
BLAST
BLASTn
BLASTp
Search for similar DNA/protein sequences on database
Compare two different nucleotide or protein sequences and
identify the homologous regions
(Altschul, et al. , 1990)
Sequence analysis
BioEdit 7.2.0
GeneDoc 2.7
Clustal Omega
SnapGene 3.2.1
(GSL Biotech LLC,
Chicago)
Sequence assembly and chromatogram analysis tool
Multiple DNA/protein sequences alignment tool
Multiple DNA/protein sequences alignment tool
Simulates DNA manipulations, visualises open reading
frames and illustrates DNA/plasmids post manipulations
(Hall, 1999)
(Nicholas, et al. , 1997)
(Sievers, et al. , 2011)
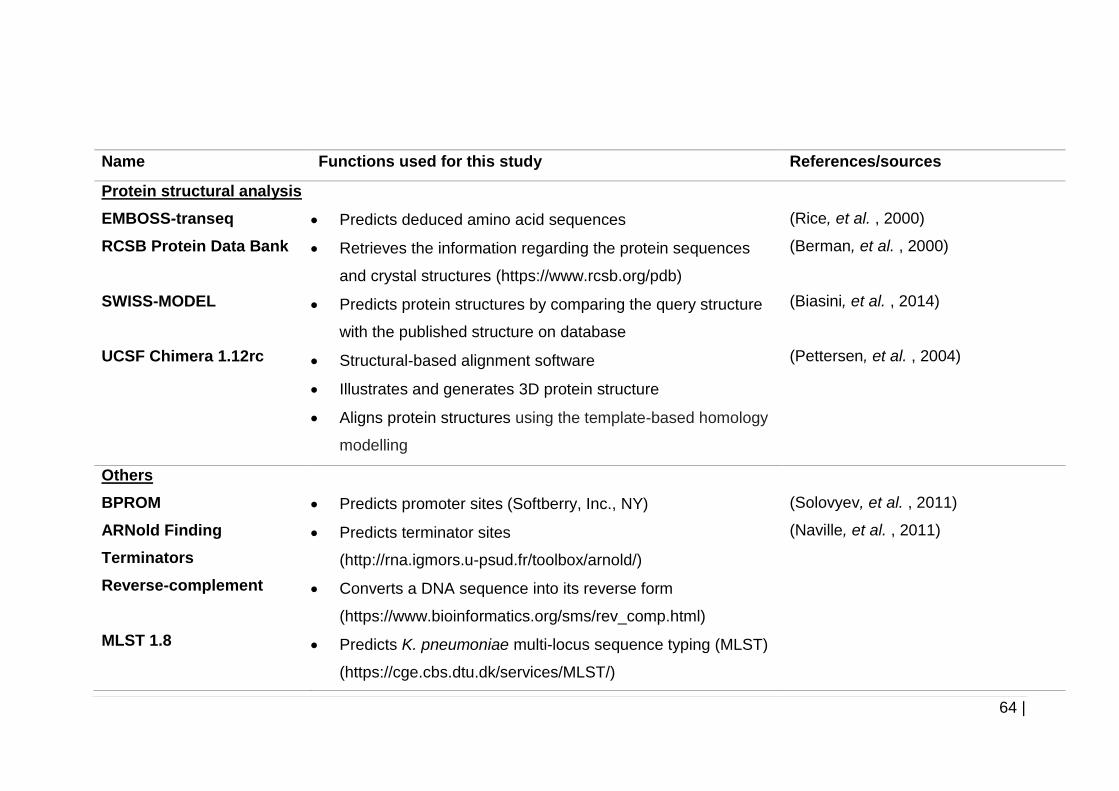
64 |
Name Functions used for this study References/sources
Protein structural analysis
EMBOSS-transeq
RCSB Protein Data Bank
SWISS-MODEL
UCSF Chimera 1.12rc
Predicts deduced amino acid sequences
Retrieves the information regarding the protein sequences
and crystal structures (https://www.rcsb.org/pdb)
Predicts protein structures by comparing the query structure
with the published structure on database
Structural-based alignment software
Illustrates and generates 3D protein structure
Aligns protein structures using the template-based homology
modelling
(Rice, et al. , 2000)
(Berman, et al. , 2000)
(Biasini, et al. , 2014)
(Pettersen, et al. , 2004)
Others
BPROM
ARNold Finding
Terminators
Reverse-complement
MLST 1.8
Predicts promoter sites (Softberry, Inc., NY)
Predicts terminator sites
(http://rna.igmors.u-psud.fr/toolbox/arnold/)
Converts a DNA sequence into its reverse form
(https://www.bioinformatics.org/sms/rev_comp.html)
Predicts K. pneumoniae multi-locus sequence typing (MLST)
(https://cge.cbs.dtu.dk/services/MLST/)
(Solovyev, et al. , 2011)
(Naville, et al. , 2011)
65 |
2.4.8 Restriction endonuclease reactions
Digestion of DNA was conducted using restriction endonucleases (NEB,
Hertfordshire, UK) according to the manufacturer’s protocols. The digested
product was purified using QIAquick PCR Purification Kit prior to ligation steps.
2.4.9 DNA ligation reaction
DNA was ligated using T4 DNA ligase (NEB, Hertfordshire, UK) according to
the manufacturer’s instructions with some modifications. The amount of vector
and insert DNA was added according to the molar ratio of 1:3 vector to insert.
The ligation mixture was incubated at 16 °C for 16 h and the enzyme was heat-
inactivated at 65 °C for 10 min in a Biometra T3000 Thermocycler (Biometra,
Netherlands).
2.4.10 Dephosphorylation reactions
Dephosphorylation of plasmids was carried out to minimise self-ligation of the
vector during ligation step. Seven microlitres of linearised vector (~200 ng/µl)
(to be used for ligation) was incubated with 1 μl (1 U/µl) of Calf Intestine
Alkaline Phosphatase (CIAP), 2 μl of 10X CIAP Reaction buffer (Promega, UK)
and 10 µl of molecular grade water and incubated at 37 °C for 30 min in a
water bath. After 30 min, 1 μl of CIAP was added to the mixture and re-
incubated for an additional 30 min. The dephosphorylated vector was purified
using QIAquick PCR Purification Kit prior to ligation.
66 |
2.4.11 Transformation of plasmids into E. coli -select silver
efficiency competent cells
E. coli transformations were conducted using E. coli α-select silver efficiency
competent cells (Bioline, London, UK). Five microlitres of ~100 ng/µl DNA
(ligation mix) was added to 50 µl of thawed competent cells, and the mixture
was mixed gently by tapping the bottom of the tube. The mixture was
incubated on ice for 30 min and heat shocked in a 42 °C water bath for
45 sec. The cells were transferred quickly to an ice bucket and incubated for
2 min. Nine hundred microliters of SOC broth (NEB, UK) was added to the
mixture and incubated at 37 °C for 1 h with shaking at 200 rpm. Two hundred
microlitres of cells were spread onto an LB agar supplemented with an
appropriate antibiotic for selection and LB agar without any supplement as a
control. All the plates were then incubated for at 37 °C for 16 h.
2.4.12 Blue/white screening
The pGEMT-easy plasmids containing a DNA fragment of interest were
transformed into E. coli α-select silver efficiency competent cells (Bioline, UK).
Putative transformants were selected on an LB agar containing 100 µg/ml
ampicillin, 40 µg/ml 5-bromo-4-chloro-indolyl-β-D-galactopyranoside (X-gal),
100 mM isopropyl-β-D-thiogalactopyranoside (IPTG), and additional
antibiotics (if any). Plates were incubated at 37 °C for 16 h. White colonies
indicated the presence of recombinant plasmids containing the insert of
interest, while blue colonies indicated self-ligated plasmids. White colonies
were then selected for further confirmation by colony PCR or plasmid
extraction using QIAprep Spin Miniprep Kit (Qiagen, UK).
67 |
2.5 Statistical analysis
All data were presented as mean ± standard deviations (SD). Nonparametric
Mann-Whitney test was used to analyse differences between two different
groups. Nonparametric Kruskal-Wallis with post-hoc Dunn’s test was used to
compare differences between more than two groups with one parameter. Both
of these analyses were used for non-normally distributed data. Analysis of
variance, one-way ANOVA was carried out to compare differences between
more than two groups with one parameter, and two-way ANOVA was carried
out to compare differences between more than two groups with more than one
parameters. Both of the ANOVAs were corrected using Dunnett’s or
Bonferroni’s post hoc tests depending on the experiments. Dunnett’s post hoc
test was conducted to compare one group (control group) with the others, and
Bonferroni’s post hoc test was chosen for multiple comparison between the
groups. A difference was considered significant if p<0.05 (*). All statistical
analyses were conducted using GraphPad Prism version 6.0 (GraphPad
Software, San Diego, CA, USA).
68 |
Chapter 3.0
Investigation into the effect of
antibiotic exposure on
Klebsiella pneumoniae
biofilm formation
69 |
3.0 Investigation into the effect of antibiotic exposure
on K. pneumoniae biofilm formation
3.1 Introduction
3.1.1 In vitro biofilm models
Surface-adhered bacterial communities or biofilms play an important role in
nosocomial infections. The ability of bacteria to form a biofilm on medical
devices leads to biofilm-associated infections, which are recalcitrant toward
antibiotics (Lebeaux, et al., 2014; Lynch, et al. , 2008). Hence, it is very
important to develop experimental models that mimic real environmental
conditions for a better understanding of the mechanisms of biofilm formation.
Although these models only approximate real conditions, findings obtained
from the experimental models, can still provide us with information on the
phenotypic and genotypic differences between motile and sessile bacterial
communities.
There are several models/apparatuses that researchers use to examine
biofilms. Among them are the microtitre plate (O'Toole, 2011), the Calgary
device (Ceri, et al. , 1999), the Biofilm Ring test (Olivares, et al. , 2016), the
modified Robbins device (McCoy, et al. , 1981), flow chambers (Wolfaardt, et
al. , 1994), the constant depth film fermenter (CDFF) (Peters, et al. , 1987), the
drip flow biofilm reactor, the rotary biofilm device (BioSurface Technologies
Corporation) (Schwartz, et al. , 2010) and microfluidic biochips (Richter, et al.
, 2007). Biofilm formation assays using microtitre plates are the most common
model because this method is cost-effective, easy to handle, reproducible,
suitable for high-throughput screening, and less complicated in comparison to
70 |
the other methods (Azeredo, et al. , 2017; Lebeaux, et al. , 2013). Despite
these advantages, biofilm formation assays in microtitre plates do have some
pitfalls. For example, the biofilm yield obtained from wells of a microtitre plate
is very limited and it is normally inadequate to be used for gene or protein
expression studies specifically in 96-well microtitre plates.
3.1.2 The effects of antibiotic exposure on biofilm formation
As a rule of thumb, matrix-encased biofilms are more resistant to antibiotics
than their planktonic counterpart (Davies, 2003). Exposure to low dose
antibiotics has been suggested to be a contributing factor to stimulation of
biofilm formation (Kaplan, 2011) and this phenomenon might have clinical
relevance. Several studies have proven that exposure to sub-inhibitory
concentrations of antibiotics in vitro can affect various bacterial activities
including: increase in virulence (Geisinger, et al. , 2015), increase in random
mutagenesis (Foster, 2007), and stimulation of biofilm formation (Kaplan,
2011). Formation of biofilm upon exposure to low-level antibiotics also is
proposed to be one of the defensive mechanisms and adaptation responses
to the presence of antibiotics in the environment (Hoffman, et al. , 2005).
Many studies have investigated the mechanisms of antibiotic-induced biofilm
formation upon exposure of bacteria in different growth states to sub-MICs of
antibiotics in several pathogens, for example in Staphylococcus aureus
(Bisognano, et al. , 1997; Blickwede, et al. , 2004), Staphylococcus epidermidis
(Rachid, et al. , 2000), Pseudomonas aeruginosa (Bagge, et al. , 2004;
Hoffman, et al., 2005; Linares, et al. , 2006), Escherichia coli (Hoffman, et al.,
2005), and Acinetobacter baumanni (Nucleo, et al. , 2009).
71 |
As an example, one-quarter of the MIC of ciprofloxacin was shown to induce
the expression of fibronectin adhesins such as fibronectin binding proteins
(FnBPs) in fluoroquinolone resistant S. aureus strains upon growth in Mueller-
Hinton (MH) broth. This subsequently resulted in increased adhesion of
fluoroquinolone resistant strains on fibronectin-coated coverslips compared to
the strains which were grown in antibiotic-free medium (Bisognano, et al.,
1997).
Rachid, et al. (2000) also showed that exposure of S. epidermidis cultures to
sub-inhibitory concentrations of tetracycline or streptogramin could also
promote the production of exopolysaccharides in S. epidermidis. The
transcription of the ica operon, which contains genes that encode for proteins
involved in the synthesis of polysaccharide intercellular adhesin (PIA) was
observed to be induced after treatment with a very low dosage of tetracycline
or combination of streptogramin compounds, (quinupristin-dalfopristin) ranging
from 1/70 to 1/2 X MIC. This subsequently resulted in an enhancement of
biofilm formation by S. epidermidis.
Exposing P. aeruginosa biofilms to no more than 1/10 X MIC of imipenem
(0.2 µg/ml) was also shown to upregulate the genes that encode for alginate
biosynthesis. Enhancing production of alginate stimulated biofilm formation by
this pathogen (Bagge, et al., 2004). Besides imipenem, biofilms of
P. aeruginosa were also found to be induced upon exposure to 1 µg/ml of
tobramycin which is equal to less than 0.3 X MIC of tobramycin for this strain
(Hoffman, et al., 2005). The aminoglycoside response regulator (arr) that was
predicted to encode an inner-membrane phosphodiesterase that catalysed
72 |
hydrolysis of c-di-GMP was believed to be involved in the biofilm induction
upon exposure to tobramycin. This study proposed that tobramycin either
directly or indirectly enhanced the enzymatic activity of Arr cytoplasmic EAL
domain, which resulted in increased biofilm formation by decreasing the c-di-
GMP level in the cytoplasm.
This finding, however, is in contradiction to other studies which have shown
that higher levels of c-di-GMP are important in bacterial biofilm formation. As
an example, a previous study showed that intracellular levels of c-di-GMP are
involved in regulation of EPS production by P. aeruginosa. Increased levels
of c-di-GMP were shown to correlate with increased biofilm formation and
decreased levels of c-di-GMP resulted in reduction of biofilm production by
P. aeruginosa. Low levels of c-di-GMP were also suggested to prevent the
initiation step of biofilm formation (Hickman, et al. , 2005).
Exposure of E. coli to sub-inhibitory concentrations of translation inhibitor
antibiotics (erythromycin, chloramphenicol, tetracycline, and streptomycin)
were shown to induce biofilm formation by upregulating poly-β-1, 6-N-acetyl-
glucosamine (PNAG) through two biosynthetic proteins, PgaA and PgaD.
Enhanced production of PgaA and PgaD leads to increase PNAG and
enhances the formation of biofilm. PNAG production is controlled by bacterial
intracellular signaling molecules guanosine-bis 3’ 5’ diphosphate (ppGpp)
and c-di-GMP (Boehm, et al. , 2009). Owing to the fact that K. pneumoniae
also has high degree of amino acid sequence identity (see Chapter 4, section
4.3.1.2) and machinery for the synthesis and secretion of PNAG with E. coli,
(Chen, et al. , 2014), exposure of K. pneumoniae to sub-inhibitory
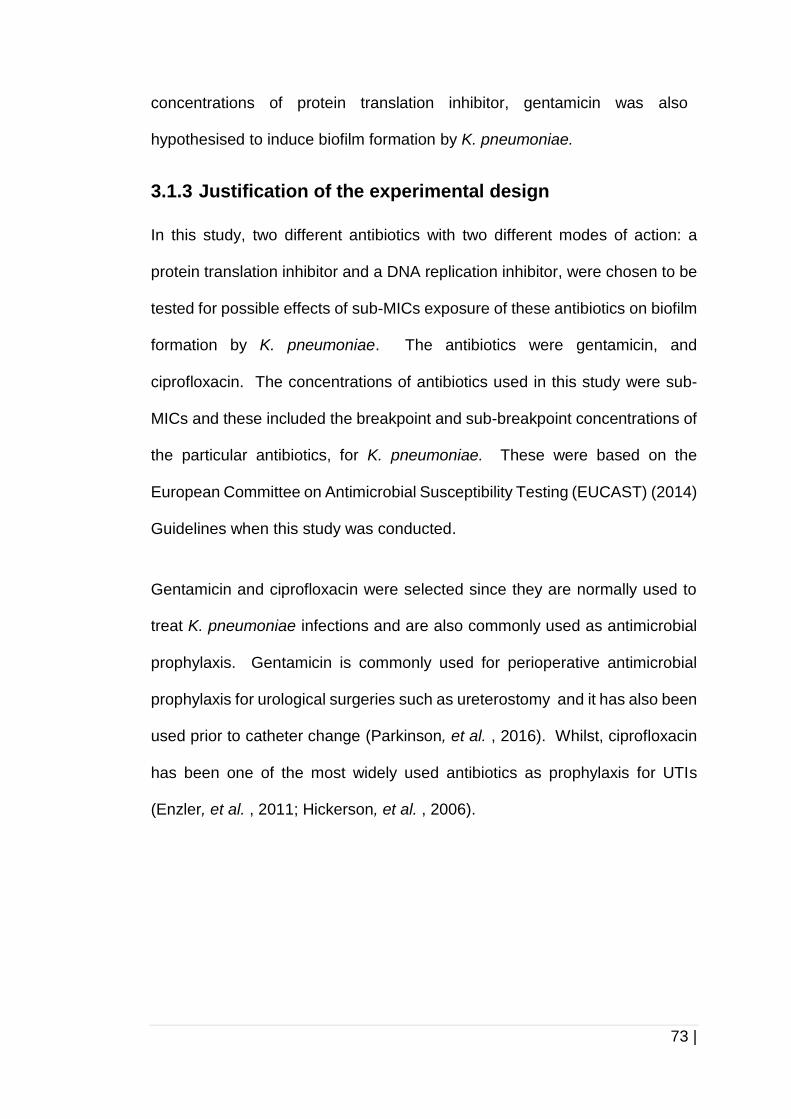
73 |
concentrations of protein translation inhibitor, gentamicin was also
hypothesised to induce biofilm formation by K. pneumoniae.
3.1.3 Justification of the experimental design
In this study, two different antibiotics with two different modes of action: a
protein translation inhibitor and a DNA replication inhibitor, were chosen to be
tested for possible effects of sub-MICs exposure of these antibiotics on biofilm
formation by K. pneumoniae. The antibiotics were gentamicin, and
ciprofloxacin. The concentrations of antibiotics used in this study were sub-
MICs and these included the breakpoint and sub-breakpoint concentrations of
the particular antibiotics, for K. pneumoniae. These were based on the
European Committee on Antimicrobial Susceptibility Testing (EUCAST) (2014)
Guidelines when this study was conducted.
Gentamicin and ciprofloxacin were selected since they are normally used to
treat K. pneumoniae infections and are also commonly used as antimicrobial
prophylaxis. Gentamicin is commonly used for perioperative antimicrobial
prophylaxis for urological surgeries such as ureterostomy and it has also been
used prior to catheter change (Parkinson, et al. , 2016). Whilst, ciprofloxacin
has been one of the most widely used antibiotics as prophylaxis for UTIs
(Enzler, et al. , 2011; Hickerson, et al. , 2006).
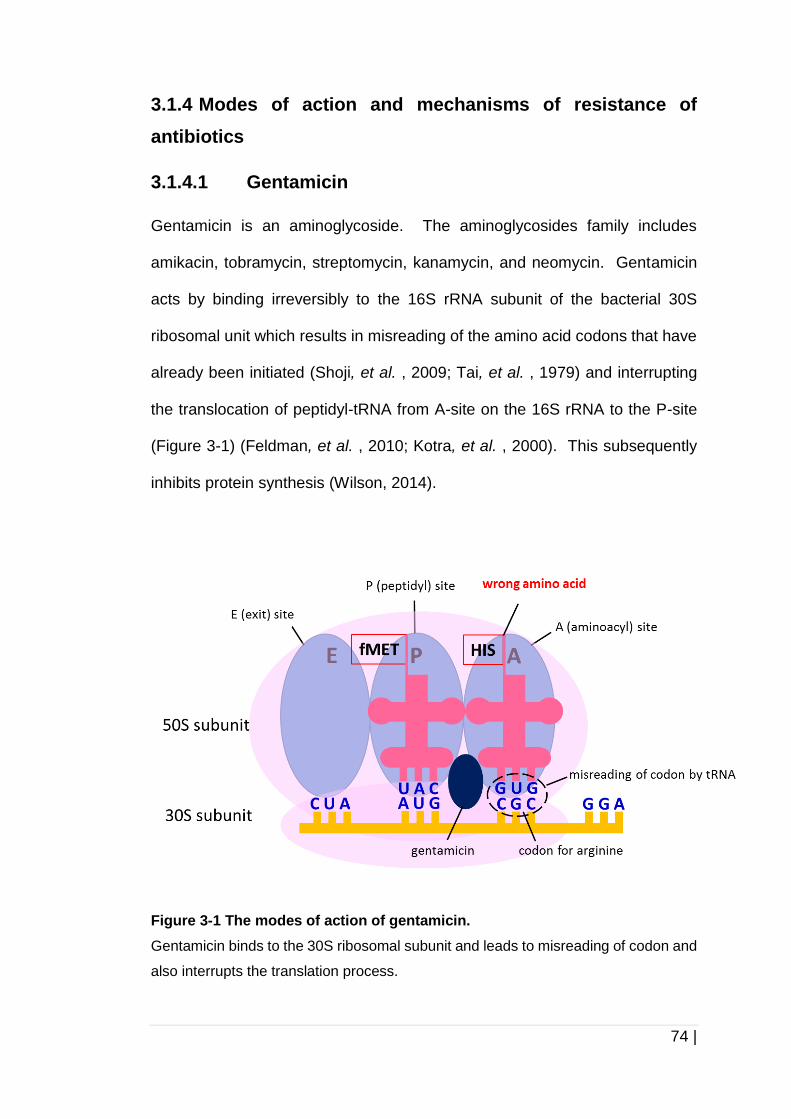
74 |
3.1.4 Modes of action and mechanisms of resistance of
antibiotics
3.1.4.1 Gentamicin
Gentamicin is an aminoglycoside. The aminoglycosides family includes
amikacin, tobramycin, streptomycin, kanamycin, and neomycin. Gentamicin
acts by binding irreversibly to the 16S rRNA subunit of the bacterial 30S
ribosomal unit which results in misreading of the amino acid codons that have
already been initiated (Shoji, et al. , 2009; Tai, et al. , 1979) and interrupting
the translocation of peptidyl-tRNA from A-site on the 16S rRNA to the P-site
(Figure 3-1) (Feldman, et al. , 2010; Kotra, et al. , 2000). This subsequently
inhibits protein synthesis (Wilson, 2014).
Figure 3-1 The modes of action of gentamicin.
Gentamicin binds to the 30S ribosomal subunit and leads to misreading of codon and
also interrupts the translation process.
75 |
There are several aminoglycoside resistance mechanisms including pumping
out aminoglycosides by active efflux system, alteration of the ribosome target
sites, (Magnet, et al. , 2005) and inactivation of aminoglycosides by
aminoglycosides-modifying enzymes (AMEs). AcrD in E. coli (Rosenberg, et
al. , 2000) and MexXY-OprM in P. aeruginosa (Hocquet, et al. , 2003) are
amongst the most effective efflux pumps which are necessary for resistance
against aminoglycosides. Alteration of the ribosome target sites can prevent
the binding of the aminoglycosides to the ribosome. For example,
methyltransferases which are known as 16S rRNA methylases can modify 16S
ribosomal RNA which acts as the aminoglycosides binding site. These
methyltransferases include aminoglycoside resistance methyltransferase A
which encodes by armA (Galimand, et al. , 2003). AMEs are the most
important resistance mechanisms found in K. pneumoniae (Ramirez, et al.,
2010) and are typically found on MGEs such as plasmids or transposons. The
modifying enzymes that are involved in gentamicin inactivation include
aminoglycosides acetyltransferases (AAC), aminoglycosides acetylnucleotidyl
transferases (ANT), and aminoglycosides acetylphosphotransferases (APH)
(Figure 3-2) (Mingeot-Leclercq, et al. , 1999; Tangy, et al. , 1985).
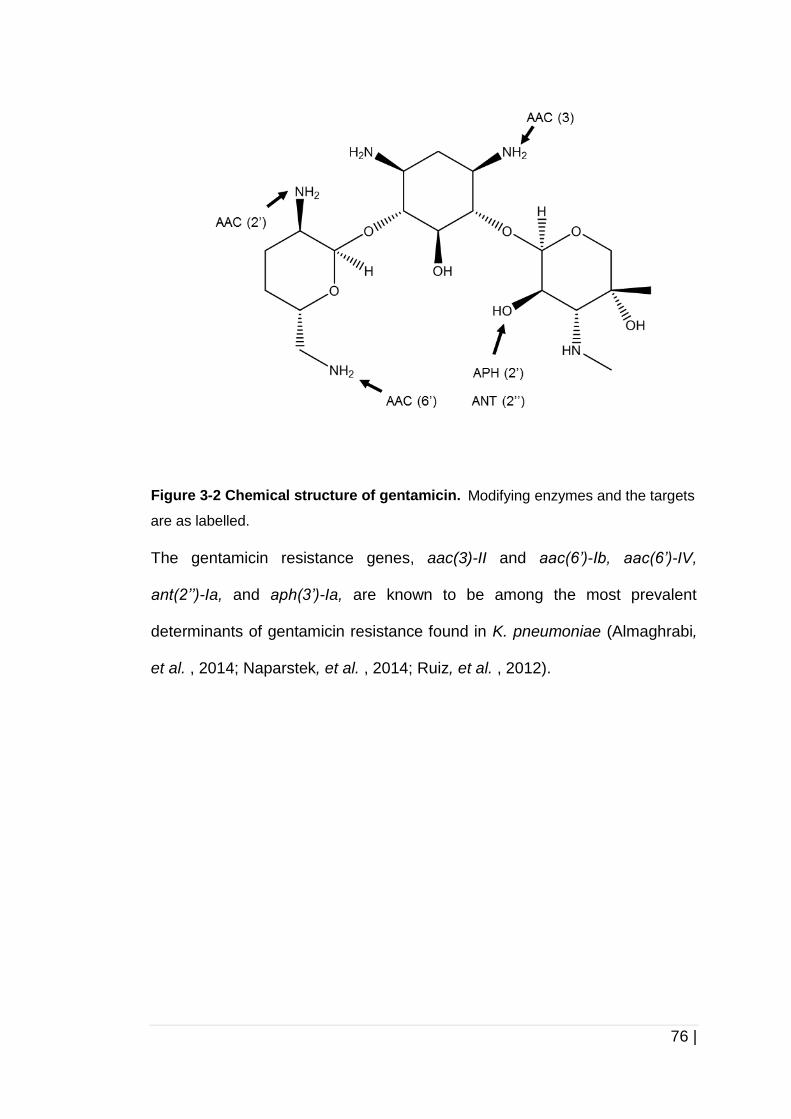
76 |
Modifying enzymes and the targets
are as labelled.
Figure 3-2 Chemical structure of gentamicin.
The gentamicin resistance genes, aac(3)-II and aac(6’)-Ib, aac(6’)-IV,
ant(2’’)-Ia, and aph(3’)-Ia, are known to be among the most prevalent
determinants of gentamicin resistance found in K. pneumoniae (Almaghrabi,
et al. , 2014; Naparstek, et al. , 2014; Ruiz, et al. , 2012).
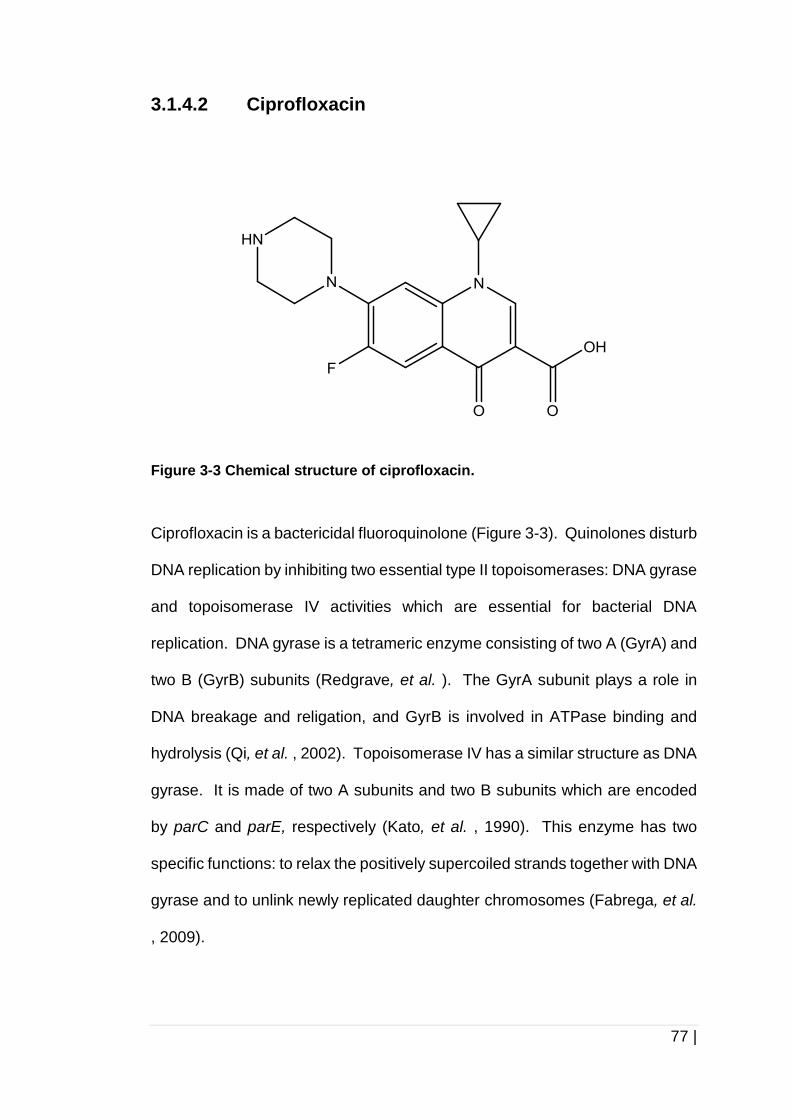
77 |
3.1.4.2 Ciprofloxacin
Figure 3-3 Chemical structure of ciprofloxacin.
Ciprofloxacin is a bactericidal fluoroquinolone (Figure 3-3). Quinolones disturb
DNA replication by inhibiting two essential type II topoisomerases: DNA gyrase
and topoisomerase IV activities which are essential for bacterial DNA
replication. DNA gyrase is a tetrameric enzyme consisting of two A (GyrA) and
two B (GyrB) subunits (Redgrave, et al. ). The GyrA subunit plays a role in
DNA breakage and religation, and GyrB is involved in ATPase binding and
hydrolysis (Qi, et al. , 2002). Topoisomerase IV has a similar structure as DNA
gyrase. It is made of two A subunits and two B subunits which are encoded
by parC and parE, respectively (Kato, et al. , 1990). This enzyme has two
specific functions: to relax the positively supercoiled strands together with DNA
gyrase and to unlink newly replicated daughter chromosomes (Fabrega, et al.
, 2009).
78 |
Mutations or alterations in specific domains for both gyrA and gyrB, and
secondary drug targets ParC and ParE, respectively (M. E. Jones, et al. ,
2000), and also, protection of DNA gyrase and topoisomerase IV by Qnr
protein are among the most common resistance mechanisms to ciprofloxacin
(Tran, et al. , 2002).
The first plasmid (pMG252) mediated harbouring quinolone resistance gene,
qnrA was found in a clinical K. pneumoniae strain isolated in 1994 at the
University of Alabama at Birmingham Medical Centre, USA (Jacoby, et al. ,
2003; Martinez-Martinez, et al. , 1998). qnrA encodes for the 218-amino-acid
protein, QnrA, which belongs to pentapeptide repeat family. This protein
protects the quinolone targets, DNA gyrase and topoisomerase IV from
inhibitory activity of the antibiotics. (Tran, et al. , 2005).
Another additional quinolone resistance mechanism which is common in
Enterobacteriaceae and also K. pneumoniae (Ruiz, et al., 2012) is mediated
by an aminoglycosides-modifying enzyme, AAC(6)-Ib-cr, which can cause
resistance to aminoglycosides and fluoroquinolones simultaneously. This
enzyme is a variant of aminoglycoside acetyltransferase with two amino acid
differences, Trp102Arg and Asp179Tyr and is thought to be more prevalent
than the Qnr protein. The alterations allow it to inactivate ciprofloxacin through
the acetylation of its piperazinyl substituent (Robicsek, et al. , 2005;
Strahilevitz, et al. , 2009).
79 |
3.1.5 Aims of this chapter
To determine the effect of exposure of: i) cultures during bacterial growth until
mid-log phase, ii) cultures during biofilm formation, and iii) mature biofilms of
K. pneumoniae to sub-MICs of antibiotics under shaking condition. The
antibiotics, gentamicin and ciprofloxacin were tested at sub-MICs. The usage
of these concentrations can be considered clinically relevant since the sub-
MICs specifically breakpoint concentration is correlated to achievable serum
drug levels using standard dosing for treatment (Levison, et al. , 2009).
Bacteria are also possibly exposed to low antibiotic concentrations several
hours at the beginning, between doses and end of antibiotherapy (Craig,
1998), or after continuous low-dose antibiotics prophylaxis which is normally
used to treat UTI and surgical wounds (Parkinson, et al., 2016). In this study,
we wanted to determine whether exposure of these different condition of
culture and mature biofilm to these antibiotics would increase biofilm
formation by K. pneumoniae.
80 |
3.2 Materials and methods
3.2.1 Biofilm formation under different growth conditions and
in different media
A 16 h old culture of each isolate was adjusted to an optical density at
600 nm (OD600) of 0.05 by adding 100 µl of the culture into 10 ml of TSB.
The cultures were incubated at 37 °C with agitation at 200 rpm (SANYO MIR-
22RU, Japan) until they reached mid-log phase (approximately after 2 h).
Bacteria at mid-log phase (see Chapter 4, section 4.3.2) were diluted to a
OD600 of ~1.0 (~109 cfu/ml) and 20 μl of the suspension was added into
wells of a flat-bottom 96-well polystyrene tissue culture treated plate
(Sarstedt, Germany) containing 180 μl of fresh TSB or TSB + 2 % glucose.
TSB only (without bacterial culture) was included in each test as a blank
control. The cultures were then incubated at 37 °C for 24 h under static
conditions or with shaking at 200 rpm on an orbital shaker (Luckham, UK).
The biofilms were then quantified using a crystal violet assays.
3.2.2 Pre-exposure of cultures to antibiotics prior to biofilm
formation
To examine the effect of pre-exposure of cultures to sub-MICs of antibiotics
on biofilm formation, a 16 h old culture of each isolate was adjusted to OD600
of 0.05 by adding 100 µl of the culture into 10 ml of TSB. The antibiotics,
gentamicin (4 μg/ml, 2 μg/ml or 1 μg/ml) or ciprofloxacin (1 μg/ml, 0.5 μg/ml
or 0.25 μg/ml) were added into the suspension. The tube with TSB inoculated
with culture only (without any antibiotic) acted as a control. The cultures were
incubated until the bacteria reached mid-log phase and they were diluted to
OD600 of ~1.0 (~109 cfu/ml). Twenty microlitres of the suspension were
81 |
inoculated into the wells of a flat-bottom 96-well polystyrene tissue culture
treated plate (Sarstedt, Germany) containing 180 μl of fresh TSB. The cover
was replaced with a microtitre plate breathable film cover (Anachem, UK) to
minimise evaporation and ‘edge effects’. The breathable film covers were
used for all subsequent biofilm formation assays in this study. The plate was
incubated at 37 °C for 24 h under shaking conditions at 200 rpm on an orbital
shaker (Luckham, UK) and the biofilms were then quantified using a crystal
violet assays.
3.2.3 Exposure of mid-log phase cultures to antibiotics during
biofilm formation
To investigate the effect of exposure of mid-log phase cultures to sub-MICs
of antibiotics during biofilm formation, 180 μl of TSB only or TSB with
respective concentrations of antibiotics [(4 μg/ml, 2 μg/ml or 1 μg/ml) for
gentamicin, or (1 μg/ml, 0.5 μg/ml or 0.25 μg/ml) for ciprofloxacin)] were
added to the wells of microtiter plates. Twenty microlitres of diluted mid-log
phase cultures (OD600 of ~1.0 (~109 cfu/ml) were used to inoculate wells
containing TSB only or TSB with antibiotics. The TSB only wells were
labelled as control groups. The plate was incubated as mentioned before
and biofilms were then quantified using crystal violet.
82 |
3.2.4 Exposure of mature biofilms to antibiotics
Biofilms were grown at 37 °C for 24 h as previously mentioned, and after
24 h incubation, planktonic cells were removed from the wells containing 24 h
old biofilms. The wells were washed three times carefully (to avoid disturbance
to the biofilm) with sterile phosphate buffer saline (PBS). Fresh TSB medium
or TSB with respective concentrations of antibiotics [(4 μg/ml, 2 μg/ml or 1
μg/ml) for gentamicin, or (1 μg/ml, 0.5 μg/ml or 0.25 μg/ml) for ciprofloxacin)]
were added into the wells containing 24 h old biofilms. The TSB only wells
were labelled as controls. The 24 h old biofilms in fresh medium were then re-
incubated at 37 °C for 24 h under shaking conditions at 200 rpm. After
24 h incubation, the absorbance of planktonic cells (represents the bacterial
growth) were measured using a microplate reader (Dynex MRX TC II, MTX
Labsystem, USA) prior to quantification of biofilms using crystal violet.
3.2.5 Crystal violet quantification of biofilm formation
Planktonic cells were removed from the incubated plate and the wells were
washed three times with 200 μl of PBS to remove the non-adherent cells. The
plate was then air-dried at 37 °C for 10 min and the biofilms were stained with
300 μl of 0.005 % of crystal violet (CV) (Pro-Lab Diagnostics, UK) and
incubated at room temperature for 30 min. The CV was discarded and the
plate was washed twice with 300 μl of PBS to remove the unbound CV. Three
hundred microlitres of ethanol (90 %) was added into the wells to solubilise the
stain and the plate was incubated for 15 min. The absorbance (OD590) was
measured using a microplate reader (Dynex MRX TC II, MTX Labsystem,
USA).
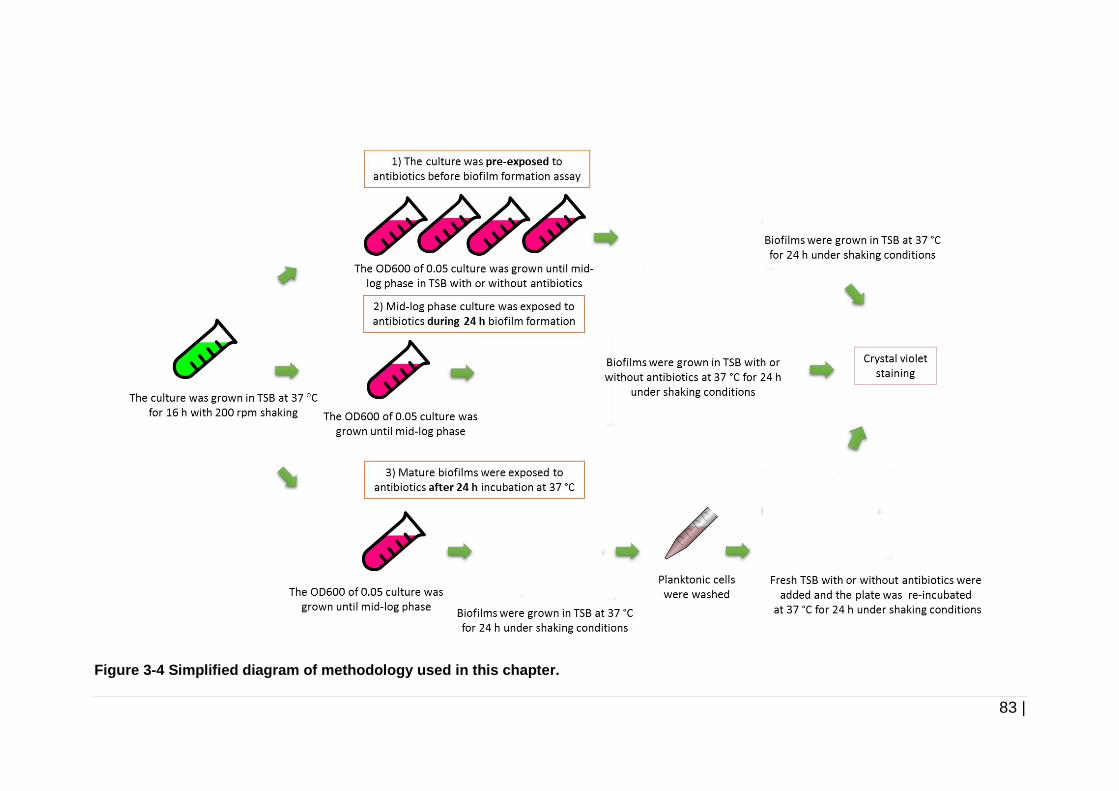
83 |
Figure 3-4 Simplified diagram of methodology used in this chapter.
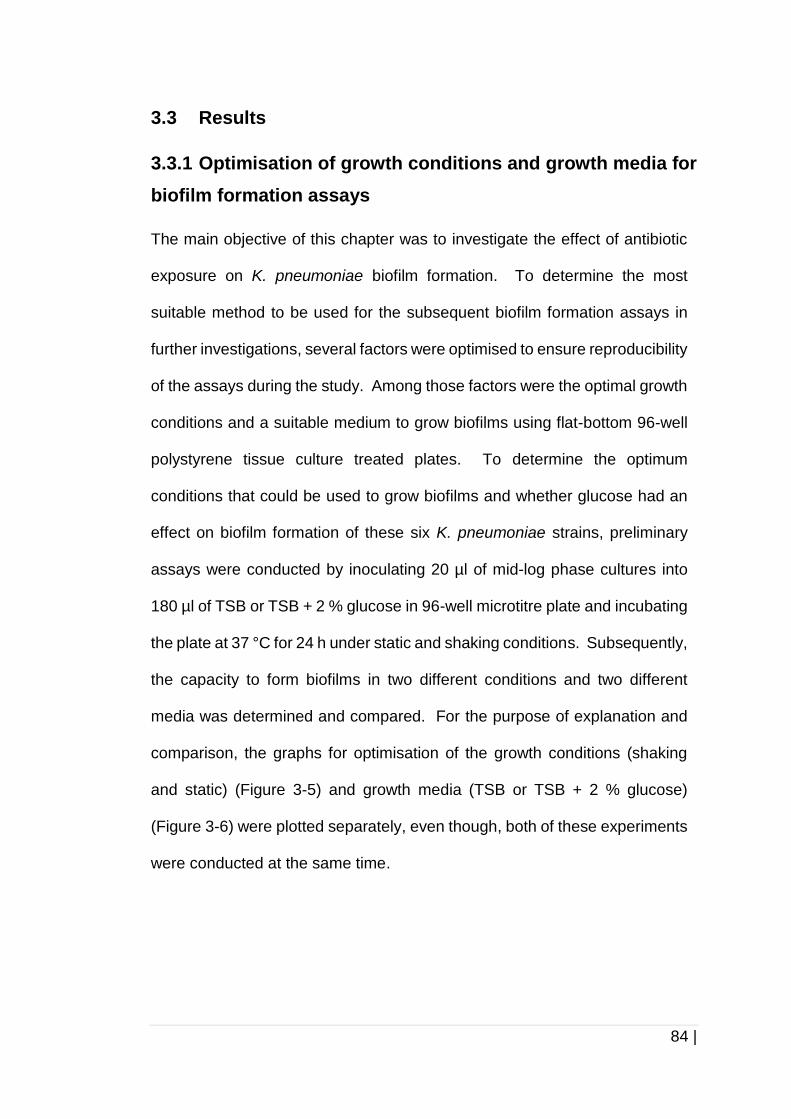
84 |
3.3 Results
3.3.1 Optimisation of growth conditions and growth media for
biofilm formation assays
The main objective of this chapter was to investigate the effect of antibiotic
exposure on K. pneumoniae biofilm formation. To determine the most
suitable method to be used for the subsequent biofilm formation assays in
further investigations, several factors were optimised to ensure reproducibility
of the assays during the study. Among those factors were the optimal growth
conditions and a suitable medium to grow biofilms using flat-bottom 96-well
polystyrene tissue culture treated plates. To determine the optimum
conditions that could be used to grow biofilms and whether glucose had an
effect on biofilm formation of these six K. pneumoniae strains, preliminary
assays were conducted by inoculating 20 µl of mid-log phase cultures into
180 µl of TSB or TSB + 2 % glucose in 96-well microtitre plate and incubating
the plate at 37 °C for 24 h under static and shaking conditions. Subsequently,
the capacity to form biofilms in two different conditions and two different
media was determined and compared. For the purpose of explanation and
comparison, the graphs for optimisation of the growth conditions (shaking
and static) (Figure 3-5) and growth media (TSB or TSB + 2 % glucose)
(Figure 3-6) were plotted separately, even though, both of these experiments
were conducted at the same time.
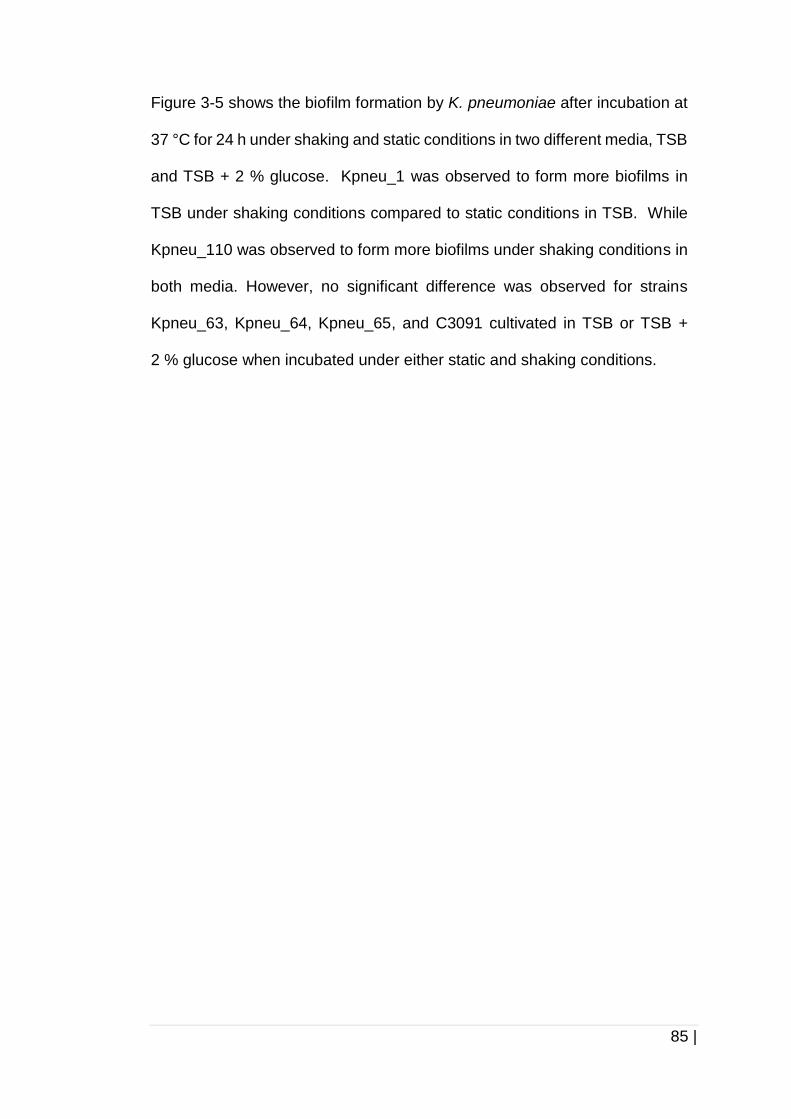
85 |
Figure 3-5 shows the biofilm formation by K. pneumoniae after incubation at
37 °C for 24 h under shaking and static conditions in two different media, TSB
and TSB + 2 % glucose. Kpneu_1 was observed to form more biofilms in
TSB under shaking conditions compared to static conditions in TSB. While
Kpneu_110 was observed to form more biofilms under shaking conditions in
both media. However, no significant difference was observed for strains
Kpneu_63, Kpneu_64, Kpneu_65, and C3091 cultivated in TSB or TSB +
2 % glucose when incubated under either static and shaking conditions.
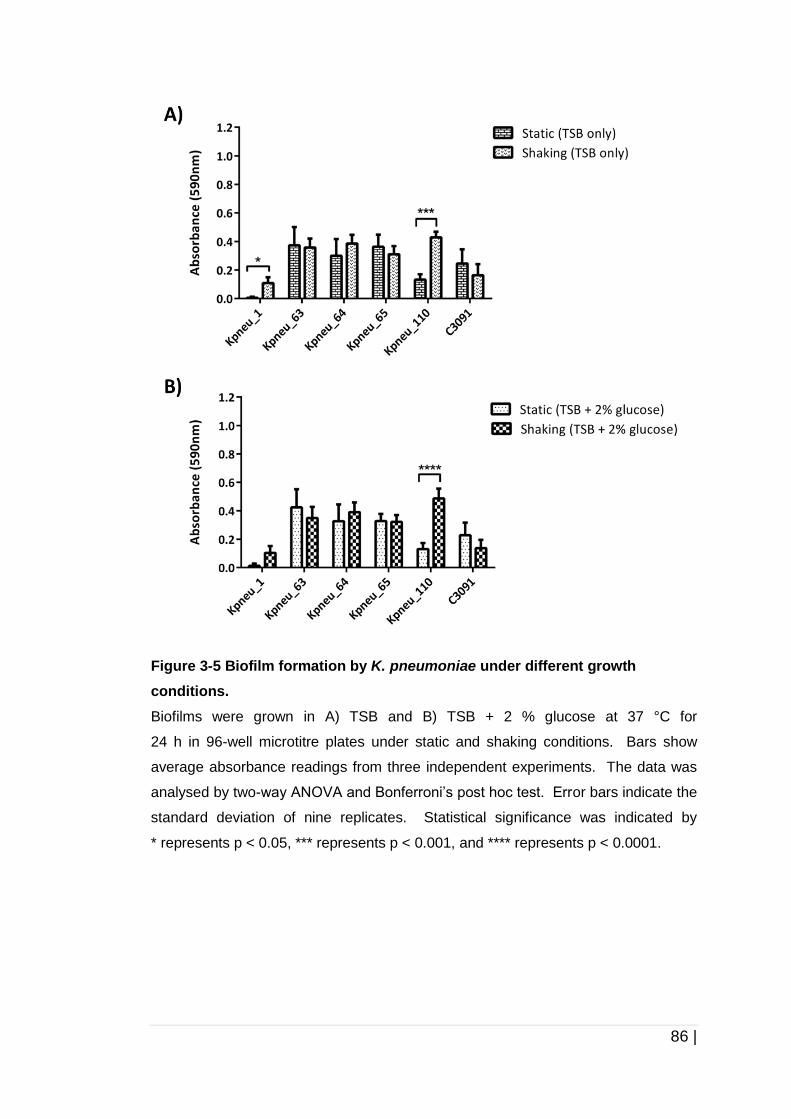
86 |
Figure 3-5 Biofilm formation by K. pneumoniae under different growth
conditions.
Biofilms were grown in A) TSB and B) TSB + 2 % glucose at 37 °C for
24 h in 96-well microtitre plates under static and shaking conditions. Bars show
average absorbance readings from three independent experiments. The data was
analysed by two-way ANOVA and Bonferroni’s post hoc test. Error bars indicate the
standard deviation of nine replicates. Statistical significance was indicated by
* represents p < 0.05, *** represents p < 0.001, and **** represents p < 0.0001.

87 |
Figure 3-6 shows that no significant difference was found between biofilm
formation in TSB compared to TSB + 2 % glucose under static or shaking
conditions. The presence of 2 % glucose in TSB was shown to have no effect
on biofilm formation by any of the strains. Given this finding, all of the
subsequent biofilm assays were carried out under shaking conditions in TSB
only.
88 |
Figure 3-6 Biofilm formation by K. pneumoniae in two different media.
Biofilms were grown under A) static and B) shaking conditions in 96-well microtitre
plates at 37 °C for 24 h in two different media, TSB and TSB + 2 % glucose. Bars
show average absorbance readings for three independent experiments. The data
was analysed by two-way ANOVA and Bonferroni’s post hoc test. Error bars indicate
the standard deviation of nine replicates. No significant difference was observed for
all the strains between the biofilm formation in TSB and TSB + 2 % glucose.
89 |
3.3.2 Pre-exposure of cultures to gentamicin or ciprofloxacin
prior to biofilm formation
In order to determine the effect of antibiotic pre-exposure on
biofilm formation by K. pneumoniae, the K. pneumoniae culture was
pre-exposed to antibiotics: gentamicin or ciprofloxacin during 2 h incubation
until it reached mid-log phase. Figure 3-7 shows the result of pre-exposure to
A) gentamicin and B) ciprofloxacin on biofilm formation by K. pneumoniae.
Strains Kpneu_1, Kpneu_64, and Kpneu_110 showed a significant reduction
of biofilm formation upon exposure to 1 µg/ml and 2 µg/ml gentamicin
compared to the control group. Whereas, no significant difference was seen
upon pre-exposure of strains Kpneu_63 and Kpneu_65 to gentamicin. Strain
C3091 was not included in this pre-exposure to gentamicin biofilm assays
since it was susceptible to gentamicin and addition of gentamicin in the
growth medium for incubation until mid-log phase killed the cells. Figure 3-7
shows that strain Kpneu_65 had a significant reduction in biofilm formation
upon pre-exposure to 0.25 µg/ml, 0.5 µg/ml and 1 µg/ml of ciprofloxacin while
Kpneu_110 showed a significant reduction upon pre-exposure to 0.5 µg/ml
and 1 µg/ml of ciprofloxacin compared to controls. Two susceptible strains:
strains Kpneu_1 and C3091 were not included in this pre-exposure to
ciprofloxacin biofilm assays since they were susceptible to ciprofloxacin and
did not survive during the incubation until mid-log phase with addition of of
ciprofloxacin in growth medium. The graph in Figure 3-7 shows that pre-
exposure of K. pneumoniae cultures during 2 h of incubation until they
reached mid-log to sub-MICs of gentamicin or ciprofloxacin did not increase
the biofilm mass of all the strains used in this study.
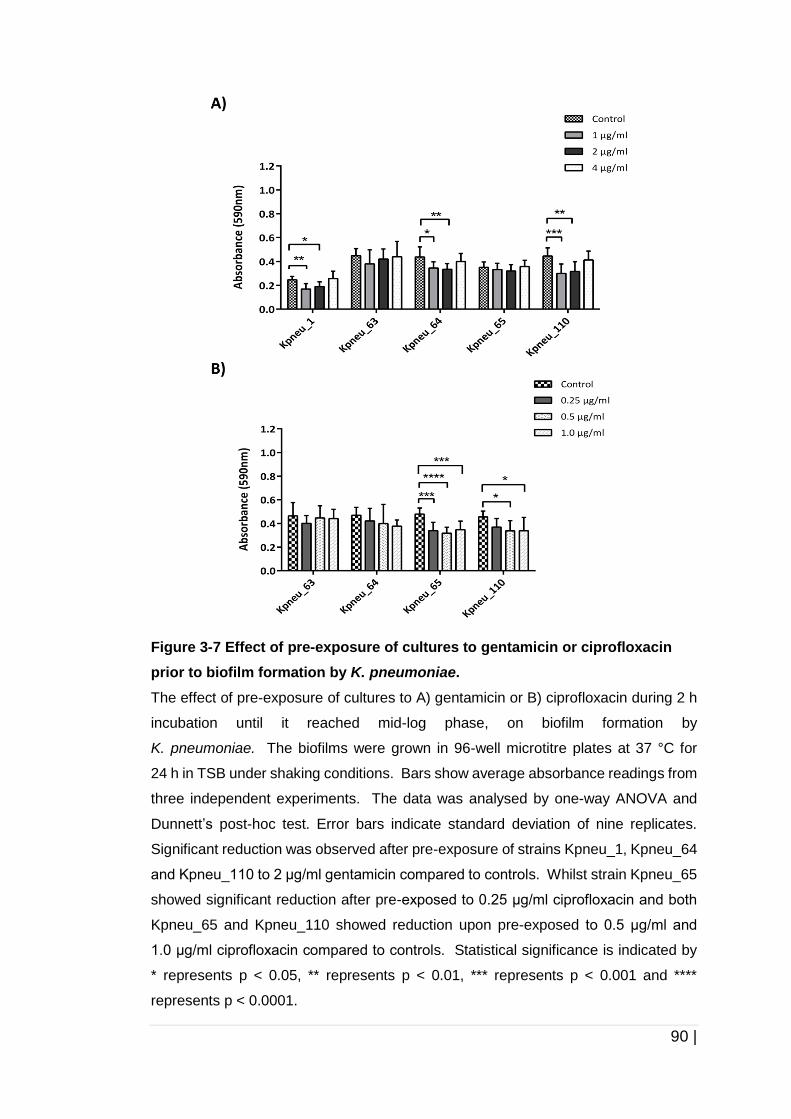
90 |
Figure 3-7 Effect of pre-exposure of cultures to gentamicin or ciprofloxacin
prior to biofilm formation by K. pneumoniae.
The effect of pre-exposure of cultures to A) gentamicin or B) ciprofloxacin during 2 h
incubation until it reached mid-log phase, on biofilm formation by
K. pneumoniae. The biofilms were grown in 96-well microtitre plates at 37 °C for
24 h in TSB under shaking conditions. Bars show average absorbance readings from
three independent experiments. The data was analysed by one-way ANOVA and
Dunnett’s post-hoc test. Error bars indicate standard deviation of nine replicates.
Significant reduction was observed after pre-exposure of strains Kpneu_1, Kpneu_64
and Kpneu_110 to 2 μg/ml gentamicin compared to controls. Whilst strain Kpneu_65
showed significant reduction after pre-exposed to 0.25 μg/ml ciprofloxacin and both
Kpneu_65 and Kpneu_110 showed reduction upon pre-exposed to 0.5 μg/ml and
1.0 μg/ml ciprofloxacin compared to controls. Statistical significance is indicated by
* represents p < 0.05, ** represents p < 0.01, *** represents p < 0.001 and ****
represents p < 0.0001.
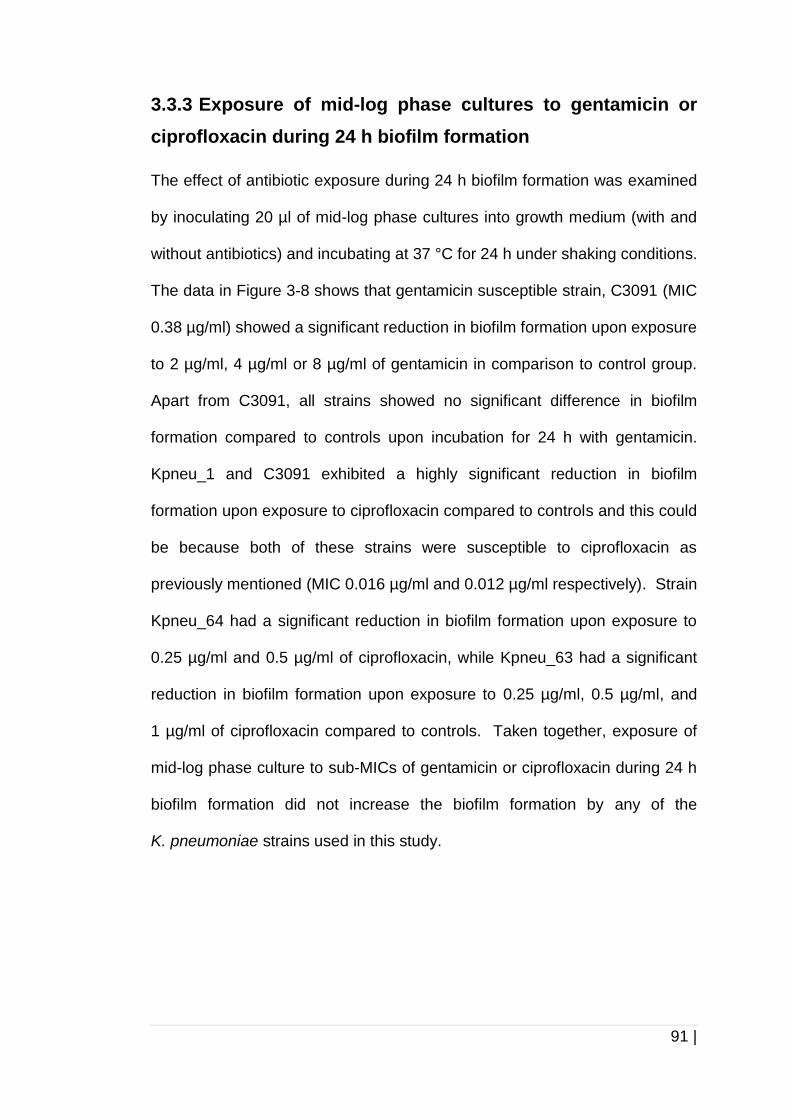
91 |
3.3.3 Exposure of mid-log phase cultures to gentamicin or
ciprofloxacin during 24 h biofilm formation
The effect of antibiotic exposure during 24 h biofilm formation was examined
by inoculating 20 µl of mid-log phase cultures into growth medium (with and
without antibiotics) and incubating at 37 °C for 24 h under shaking conditions.
The data in Figure 3-8 shows that gentamicin susceptible strain, C3091 (MIC
0.38 µg/ml) showed a significant reduction in biofilm formation upon exposure
to 2 µg/ml, 4 µg/ml or 8 µg/ml of gentamicin in comparison to control group.
Apart from C3091, all strains showed no significant difference in biofilm
formation compared to controls upon incubation for 24 h with gentamicin.
Kpneu_1 and C3091 exhibited a highly significant reduction in biofilm
formation upon exposure to ciprofloxacin compared to controls and this could
be because both of these strains were susceptible to ciprofloxacin as
previously mentioned (MIC 0.016 µg/ml and 0.012 µg/ml respectively). Strain
Kpneu_64 had a significant reduction in biofilm formation upon exposure to
0.25 µg/ml and 0.5 µg/ml of ciprofloxacin, while Kpneu_63 had a significant
reduction in biofilm formation upon exposure to 0.25 µg/ml, 0.5 µg/ml, and
1 µg/ml of ciprofloxacin compared to controls. Taken together, exposure of
mid-log phase culture to sub-MICs of gentamicin or ciprofloxacin during 24 h
biofilm formation did not increase the biofilm formation by any of the
K. pneumoniae strains used in this study.
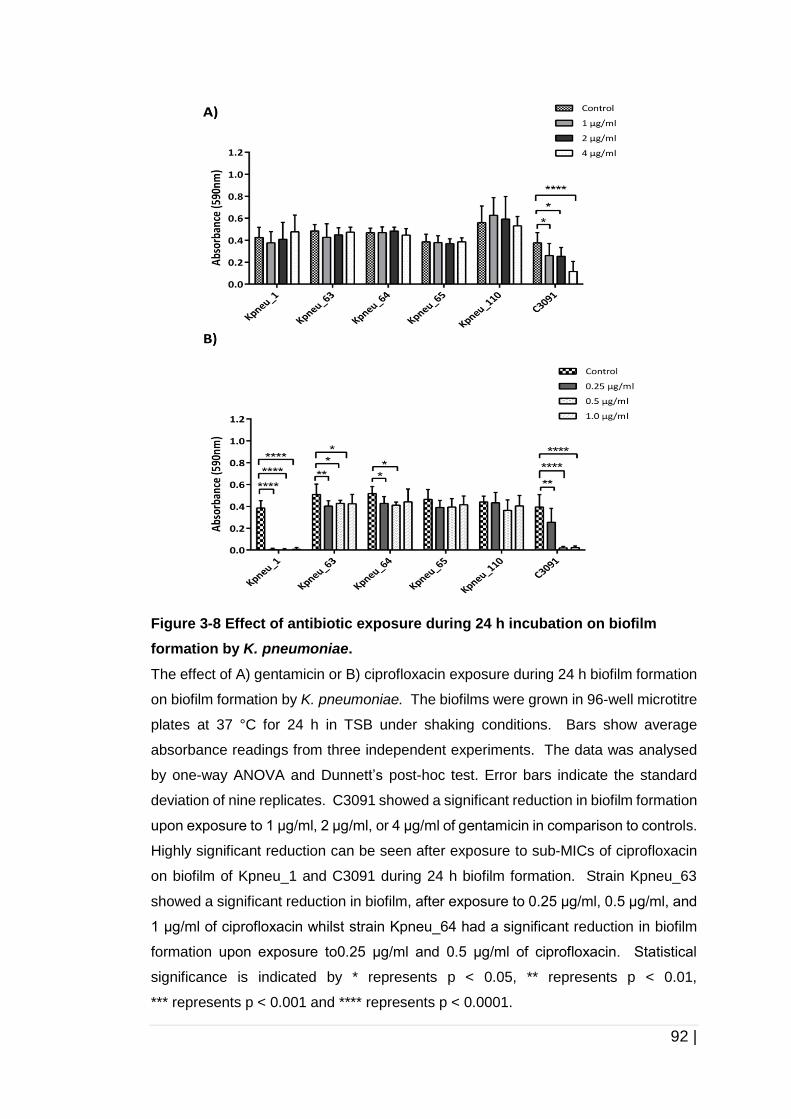
92 |
Figure 3-8 Effect of antibiotic exposure during 24 h incubation on biofilm
formation by K. pneumoniae.
The effect of A) gentamicin or B) ciprofloxacin exposure during 24 h biofilm formation
on biofilm formation by K. pneumoniae. The biofilms were grown in 96-well microtitre
plates at 37 °C for 24 h in TSB under shaking conditions. Bars show average
absorbance readings from three independent experiments. The data was analysed
by one-way ANOVA and Dunnett’s post-hoc test. Error bars indicate the standard
deviation of nine replicates. C3091 showed a significant reduction in biofilm formation
upon exposure to 1 μg/ml, 2 μg/ml, or 4 μg/ml of gentamicin in comparison to controls.
Highly significant reduction can be seen after exposure to sub-MICs of ciprofloxacin
on biofilm of Kpneu_1 and C3091 during 24 h biofilm formation. Strain Kpneu_63
showed a significant reduction in biofilm, after exposure to 0.25 μg/ml, 0.5 μg/ml, and
1 μg/ml of ciprofloxacin whilst strain Kpneu_64 had a significant reduction in biofilm
formation upon exposure to0.25 μg/ml and 0.5 μg/ml of ciprofloxacin. Statistical
significance is indicated by * represents p < 0.05, ** represents p < 0.01,
*** represents p < 0.001 and **** represents p < 0.0001.
93 |
3.3.4 Exposure of mature biofilms to antibiotics
The effects of exposure to antibiotics on the growth of K. pneumoniae are
shown in Figure 3-9 while the effects of gentamicin or ciprofloxacin exposure
to mature K. pneumoniae biofilms are presented in Figure 3-10. To evaluate
the effect of antibiotics exposure to pre-formed K. pneumoniae biofilms, the
biofilms were grown as previously mentioned at 37 °C for 24 h under shaking
conditions. The 24 h old biofilms were then exposed to sub-MICs of antibiotics.
Figure 3-10 shows the absorbance of planktonic bacteria upon re-incubation
of the mature biofilms in a fresh TSB in the presence of gentamicin or
ciprofloxacin at sub-MICs. The growth of strain C3091, however, was
observed to be reduced upon exposure to 2 µg/ml of gentamicin compared to
control. Planktonic cells of ciprofloxacin susceptible strains, Kpneu_1 and
C3091 were also observed to be significantly reduced upon incubation in TSB
in the presence of 0.25 µg/ml, 0.5 µg/ml and 1 µg/ml of ciprofloxacin compared
to controls. Apart from these two strains, a significant reduction in growth was
also seen for Kpneu_64 upon exposure to 1 µg/ml of ciprofloxacin compared
to control.
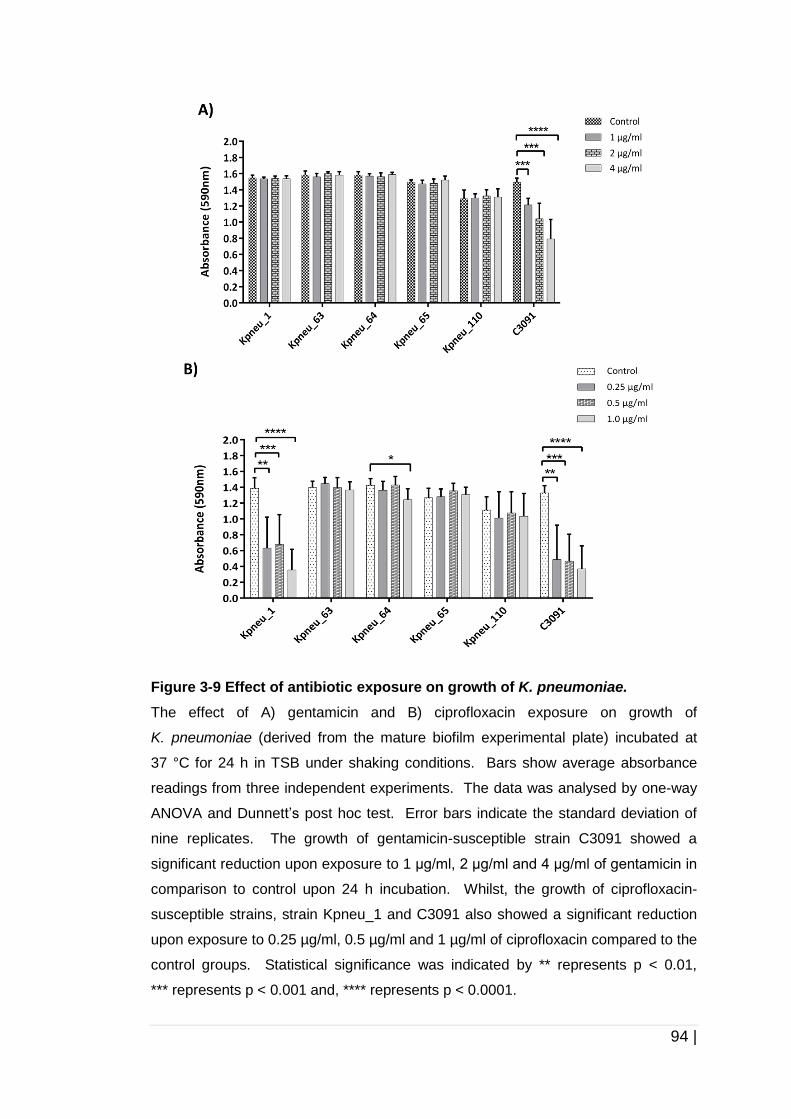
94 |
Figure 3-9 Effect of antibiotic exposure on growth of K. pneumoniae.
The effect of A) gentamicin and B) ciprofloxacin exposure on growth of
K. pneumoniae (derived from the mature biofilm experimental plate) incubated at
37 °C for 24 h in TSB under shaking conditions. Bars show average absorbance
readings from three independent experiments. The data was analysed by one-way
ANOVA and Dunnett’s post hoc test. Error bars indicate the standard deviation of
nine replicates. The growth of gentamicin-susceptible strain C3091 showed a
significant reduction upon exposure to 1 μg/ml, 2 μg/ml and 4 μg/ml of gentamicin in
comparison to control upon 24 h incubation. Whilst, the growth of ciprofloxacin-
susceptible strains, strain Kpneu_1 and C3091 also showed a significant reduction
upon exposure to 0.25 µg/ml, 0.5 µg/ml and 1 µg/ml of ciprofloxacin compared to the
control groups. Statistical significance was indicated by ** represents p < 0.01,
*** represents p < 0.001 and, **** represents p < 0.0001.
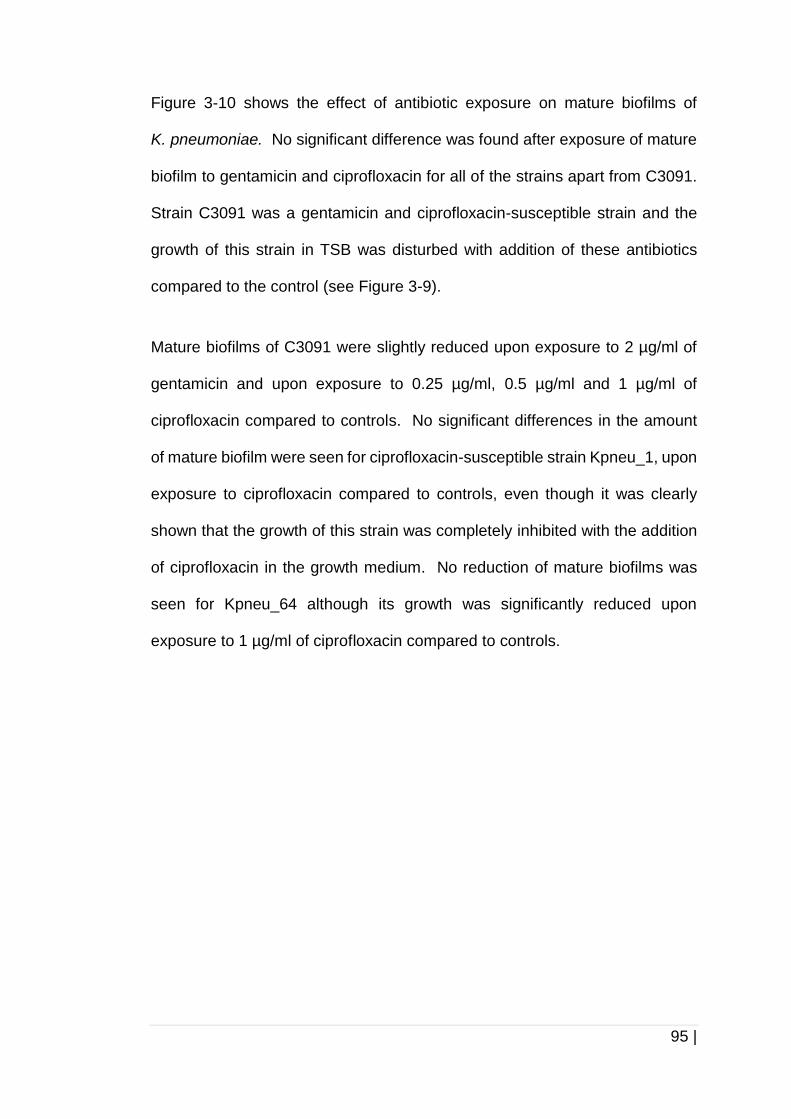
95 |
Figure 3-10 shows the effect of antibiotic exposure on mature biofilms of
K. pneumoniae. No significant difference was found after exposure of mature
biofilm to gentamicin and ciprofloxacin for all of the strains apart from C3091.
Strain C3091 was a gentamicin and ciprofloxacin-susceptible strain and the
growth of this strain in TSB was disturbed with addition of these antibiotics
compared to the control (see Figure 3-9).
Mature biofilms of C3091 were slightly reduced upon exposure to 2 µg/ml of
gentamicin and upon exposure to 0.25 µg/ml, 0.5 µg/ml and 1 µg/ml of
ciprofloxacin compared to controls. No significant differences in the amount
of mature biofilm were seen for ciprofloxacin-susceptible strain Kpneu_1, upon
exposure to ciprofloxacin compared to controls, even though it was clearly
shown that the growth of this strain was completely inhibited with the addition
of ciprofloxacin in the growth medium. No reduction of mature biofilms was
seen for Kpneu_64 although its growth was significantly reduced upon
exposure to 1 µg/ml of ciprofloxacin compared to controls.
96 |
Figure 3-10 Effect of antibiotic exposure on mature biofilms of K. pneumoniae.
The effect of exposure of mature biofilms of K. pneumoniae to A) gentamicin and B)
ciprofloxacin upon cultivation in 96-well microtitre plates at 37 °C for 24 h in TSB under
shaking conditions. Bars show average absorbance readings from three independent
experiments. The data was analysed by one-way ANOVA and Dunnett’s post hoc
test. Error bars indicate the standard deviation of nine replicates. Strain C3091
showed a significant reduction upon exposure to 2 μg/ml of gentamicin and also upon
exposure to 0.25 μg/ml, 0.5 μg/ml and 1.0 μg/ml ciprofloxacin in comparison to
controls. No significant difference was seen for all the other strains upon exposure of
mature biofilm to gentamicin and ciprofloxacin. Statistical significance was indicated
by * represents p < 0.05, ** represents p < 0.01 and, *** represents p < 0.001.
97 |
3.4 Discussion
The initial part of this chapter described an optimisation of the biofilm
formation assays that would be used for subsequent experiments involving
any biofilm mass quantification. Biofilm formation assays in our study were
performed on 24 h biofilms. This was based on our data, that showed the
absorbance readings of crystal violet that was used for staining of biofilm
mass post 24 h and 48 h was almost similar (Figure 3-7 and Figure 3-8, and
Figure 3-10) for all of the strains. Hence, all of the biofilm assays were
conducted on 24 h old biofilms for all subsequent experiments.
The first optimisation was cultivation of K. pneumoniae under static and
shaking conditions. K. pneumoniae was observed to form biofilms more
efficiently under shaking conditions compared to static conditions for strains
Kpneu_1 and strain Kpneu_110. Shaking conditions provide shear stress
(Moreira, et al. , 2013); by means of the friction force between liquid in wells
and wall surfaces (Liu, et al. , 2002; Saur, et al. , 2017). Our findings showed
that formation of biofilm was significantly higher for strain Kpneu_1 and
Kpneu_110 under shaking conditions (Figure 3-5).
The ability of bacteria to form more biofilms under shaking conditions in
microtitre plates might be because of the existence of shear stress they
experience in the wells. Also shaking conditions could bring more bacterial
cells into contact with the well surfaces (Stoodley, et al. , 1998) and this
results in increased cell attachment on the wells. Shaking conditions could
also result in higher cell density (Paris, et al. , 2007) provided by the higher
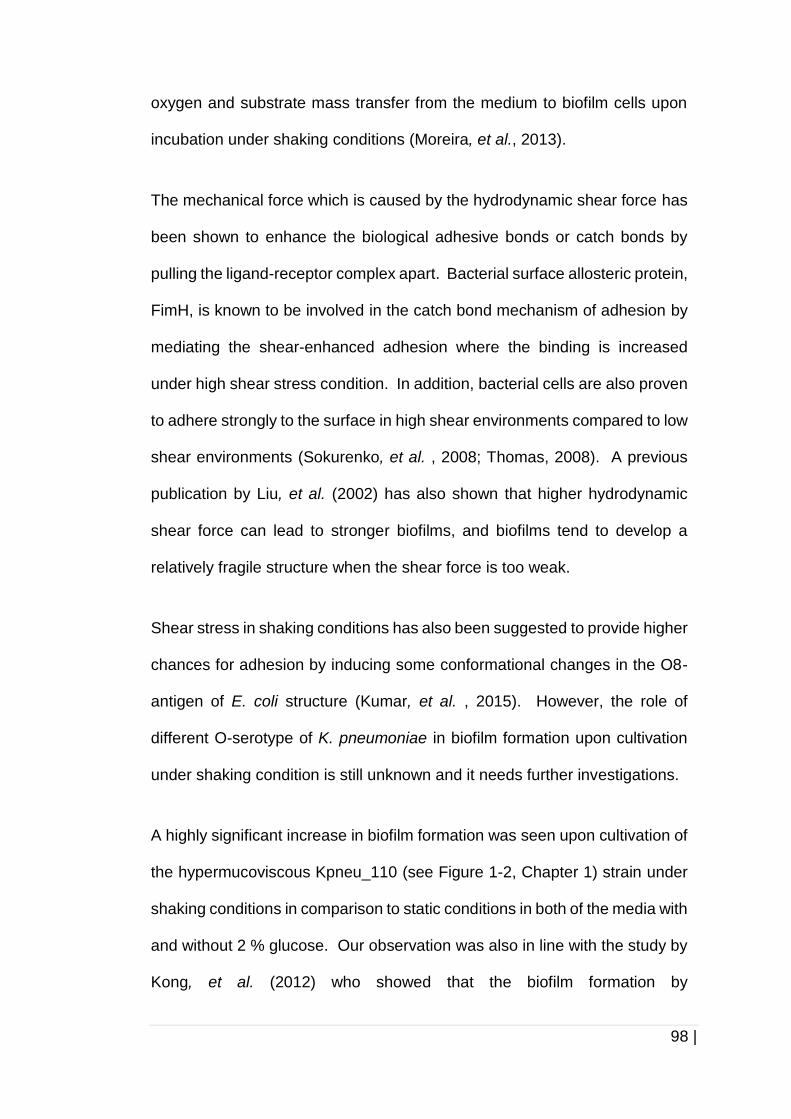
98 |
oxygen and substrate mass transfer from the medium to biofilm cells upon
incubation under shaking conditions (Moreira, et al., 2013).
The mechanical force which is caused by the hydrodynamic shear force has
been shown to enhance the biological adhesive bonds or catch bonds by
pulling the ligand-receptor complex apart. Bacterial surface allosteric protein,
FimH, is known to be involved in the catch bond mechanism of adhesion by
mediating the shear-enhanced adhesion where the binding is increased
under high shear stress condition. In addition, bacterial cells are also proven
to adhere strongly to the surface in high shear environments compared to low
shear environments (Sokurenko, et al. , 2008; Thomas, 2008). A previous
publication by Liu, et al. (2002) has also shown that higher hydrodynamic
shear force can lead to stronger biofilms, and biofilms tend to develop a
relatively fragile structure when the shear force is too weak.
Shear stress in shaking conditions has also been suggested to provide higher
chances for adhesion by inducing some conformational changes in the O8-
antigen of E. coli structure (Kumar, et al. , 2015). However, the role of
different O-serotype of K. pneumoniae in biofilm formation upon cultivation
under shaking condition is still unknown and it needs further investigations.
A highly significant increase in biofilm formation was seen upon cultivation of
the hypermucoviscous Kpneu_110 (see Figure 1-2, Chapter 1) strain under
shaking conditions in comparison to static conditions in both of the media with
and without 2 % glucose. Our observation was also in line with the study by
Kong, et al. (2012) who showed that the biofilm formation by
99 |
hypermucoviscous K. pneumoniae strain hvKP1 was greater upon incubation
in LB under shaking conditions compared to static conditions.
A suitable medium to be used for biofilm formation was then determined by
cultivating biofilms in TSB and TSB + 2 % glucose. The addition of glucose
is based on a previous study which mentioned that supplementation of
1 % glucose to TSB increased the carbon to nitrogen ratio in growth medium,
which was associated with enhancement of capsule production in
K. pneumoniae (Domenico, et al. , 1999; Thornton, et al. , 2012). Addition of
glucose in LB broth was also shown to restore capsule production in
a K. pneumoniae trehalose-6-phosphate hydrolase (treC) mutant strain and
subsequently increased biofilm formation of this strain (Wu, et al. , 2011).
Capsule production is suggested to be involved in biofilm formation of
K. pneumoniae, and it is also important for construction of mature biofilm
architecture (Balestrino, et al., 2008). Decreased production of capsule is
thought to be responsible for decreased biofilm formation in K. pneumoniae
(Boddicker, et al., 2006). Supplementation of 2 % glucose in growth medium
such as modified TSB, TSB, and BHI was also shown to enhance biofilm
formation by other bacterial species, for example, E. faecalis. Addition of
glucose was shown to increase the multi-layered biofilm structural and
cellular viability of E. faecalis (Seneviratne, et al. , 2013). Our result,
however, showed no significant difference in biofilm formation by
K. pneumoniae in microtiter plates upon cultivation in TSB or TSB with 2 %
of glucose (Figure 3-6). For that reason, all of the subsequent biofilm assays
were conducted using TSB without any glucose.
100 |
Sub-inhibitory concentrations of antibiotics are known to induce stress in
several bacterial species (Kaplan, 2011). The aim of this research was to
determine whether sub-inhibitory concentrations of common antibiotics used
to treat K. pneumoniae infections may enhance biofilm formation. We tested
the hypothesis by exposing the K. pneumoniae strains to two different
antibiotics which have different modes of action since very few studies have
been carried out to investigate the effect of antibiotic exposure on biofilm
formation by K. pneumoniae. A study by Singla, et al. (2013) which
specifically tested the susceptibility of different phases of biofilm formation,
such as planktonic cells at mid-log phase, planktonic cells at stationary
phase, adherent monolayers and mature biofilms, to three different antibiotics
from different families (piperacillin, amikacin and ciprofloxacin) were different
from our study since they investigated the susceptibility of K. pneumoniae
upon exposure to far higher concentrations of antibiotics, which ranged from
0.062 µg/ml to 1024 µg/ml.
A publication by Romero, et al. (2011), suggests that antibiotics are signalling
molecules. They have been shown to be involved in quorum-sensing and
also interfere with global transcriptional responses at sub-inhibitory
concentrations, for example, in AI-2/LuxS autoinducer signalling. A study by
Ahmed, et al. (2009), showed that 0.04 µg/ml ampicillin, 0.1 µg/ml
ciprofloxacin, and 0.1 µg/ml tetracycline could induce biofilm formation by
S. intermedius wild type strain but not the biofilm formation by a luxS mutant
strain. These antibiotics were shown to increase luxS expression which
encodes for an autoinducer synthase (LuxS). LuxS is known to be involved
101 |
in this AI-2/LuxS signalling system and associated with several bacterial
global regulatory and genetic networks.
The relevance of pre-exposure of cultures to antibiotics prior to biofilm
formation was to investigate if there were any short-term exposure effects of
antibiotics on gene expression that could affect biofilm formation by
K. pneumoniae. Our findings, suggest that there is no significant increase in
biofilm formation by K. pneumoniae after pre-exposure to sub-MICs of
gentamicin and ciprofloxacin compared to controls. We also investigated the
effect of antibiotic exposure on biofilm formation during 24 h incubation. Data
from our study showed that exposure of cultures during 24 h biofilm formation
to some commonly used antibiotics for treatment of infection and
antimicrobial prophylaxis of K. pneumoniae also did not induce biofilm
formation. In addition, we also conducted experiments to examine the effect
of antibiotic exposure on mature biofilms of K. pneumoniae and no increase
in biofilm mass was observed.
Even though, several studies have demonstrated that exposure of bacterial
to sub-MICs of antibiotics could induce biofilm formation of other bacterial
species such as P. aeruginosa (Aka, et al. , 2015), and S. enterica ser.
Infantis (Tezel, et al. , 2016), our findings, however, showed that gentamicin
and ciprofloxacin exposure leads to decreased biofilm formation by several
K. pneumoniae strains, and no increase in biofilm formation was found upon
exposure of different states of growth to different classes of antibiotics.
Owing to the fact that the modes of action of antibiotics and their target are
very specific, it is worth investigating the effect of other antibiotics apart from
102 |
gentamicin and ciprofloxacin on biofilm formation by K. pneumoniae since
very little is known about the mechanisms of antibiotic-induced biofilm
formation in this pathogen.
3.5 Conclusion
In summary, exposure of i) cultures during bacterial growth until mid-log
phase, ii) cultures during biofilm formation, and iii) mature biofilms of
K. pneumoniae cultivated in TSB to sub-MICs of gentamicin and ciprofloxacin
in microtitre plates under shaking conditions does not significantly increase
biofilms of the K. pneumoniae strains used in this study.
103 |
Chapter 4.0
Investigation into extracellular
polymeric substances (EPS) of
Klebsiella pneumoniae
biofilms
104 |
4.0 Investigation into extracellular polymeric
substances (EPS) of K. pneumoniae biofilms
4.1 Introduction
Based on the data in Chapter 3, we concluded that exposure of K. pneumoniae
to two different group of antibiotics did not increase the biofilm formation by
the tested strains. We were then interested in obtaining some insights into
K. pneumoniae extracellular polymeric substances (EPS) compositions since
this pathogen is well-known as one of the species responsible for antibiotic
resistant and biofilm-associated infections. Despite the numerous findings
regarding biofilm-mediated resistance (Bandeira, et al. , 2017; Singla, et al.,
2013; Vuotto, et al., 2014; Vuotto, et al. , 2017) and virulence mechanisms
(Clegg, et al., 2016) of K. pneumoniae, very little is known about the main
constituents of K. pneumoniae biofilm EPS.
4.1.1 The biofilm matrix
In general, the biofilm matrix also known as EPS is composed of proteins,
extracellular DNA (eDNA), exopolysaccharides, and lipids (Flemming, et al.,
2010). Extracellular polysaccharides are regularly identified as the most
prominent components in biofilms (Limoli, et al. , 2015). The exact
composition of EPS differs greatly depending on bacterial species and even
between isolates. Other factors that can affect EPS composition include
growth environments, such as growth media (e.g. nutritious and nutrient-poor
media) and growth conditions such as temperature and external forces (e.g.
shear and hydrodynamic forces).
105 |
4.1.1.1 Proteins
Proteins are suggested to play a significant role in biofilm formation by
providing three-dimensional structural integrity such as amyloid in E. coli and
Pseudomonas spp. (Dueholm, et al. , 2013; Hobley, et al. , 2015; Taglialegna,
et al. , 2016). Proteins in biofilm matrix can be classified as secreted
extracellular proteins and cell surface proteins (Fong, et al. , 2015). Some
secreted proteins act as degrading enzymes or dispersion enzymes that can
enzymatically degrade polysaccharides, proteins, and eDNA (Fong, et al.,
2015). For instance, the glycosyl hydrolase dispersin B (DspB), a soluble N-
acetylglucosaminidase that has been shown to cause detachment of
Actinobacillus actinomycetemcomitans biofilms (Kaplan, et al. , 2003). While,
cell surface proteins can be categorised as non-fimbrial cell surface adhesins
such as Ag43 in E. coli (Berne, et al. , 2015; Hasman, et al. , 1999) and fimbrial
adhesins such as flagella, curli and fimbriae (Latasa, et al. , 2006). These
proteinaceous components are known to be involved in cell-surface
attachment, to interact synergistically with other EPS, such as
exopolysaccharides and eDNA components for stabilisation of the biofilm
matrix, and also to contribute in three-dimensional biofilm architecture (Fong,
et al., 2015).
4.1.1.2 Extracellular DNA (eDNA)
Apart from proteins, extracellular DNA (eDNA) also plays an important role in
the early stage of structural integrity (Das, et al. , 2013) and stability (Song, et
al. , 2016) of biofilms by binding with other matrix components such as
polysaccharides and proteins (Das, et al., 2013). The release of bacterial
106 |
chromosomal DNA into the environment as eDNA is normally caused by cell
autolysis (Montanaro, et al. , 2011). eDNA is also found to be secreted actively
by bacteria, for example, by Neisseria gonorrhoeae (Zweig, et al. , 2014). It is
believed that eDNA could attach to the bacterial surfaces and forms an
extension loop that facilitates the adhesion of the cells to substratum (Song, et
al., 2016). In addition, eDNA also is shown to bind with other biopolymers in
biofilm EPS, for instance, DNABII, the histone like proteins in E. coli
(Goodman, et al. , 2011) and N-acetylglucosamine in Listeria monocytogenes
(Harmsen, et al. , 2010), and these binding mechanisms are important for
bacterial adhesion and improve biofilm structural stability. The role of eDNA
in K. pneumoniae biofilm structure has not been determined, but eDNA is
established to act as a component of biofilms in some other Gram-negative
bacterial species, for example, P. aeruginosa (Whitchurch, et al. , 2002).
4.1.1.3 Polysaccharides
4.1.1.3.1 Cellulose
Other than proteins and eDNA, polysaccharides are also known to play an
important role in biofilm EPS, for example, cellulose and PNAG. Cellulose is
a linear polymer of β-(1-4)-D-glucose produced by a variety of Gram-negative
bacteria as a component of the biofilm matrix, for example, in
S. enterica ser. Typhimurium and E. coli (Zogaj, et al. , 2001). As an example,
cellulose is co-produced with thin aggregative fimbriae by E. coli and
Salmonella spp. to form inert and hydrophobic EPS that mediates cell-cell
interconnections (Zogaj, et al., 2001). Cellulose production in K. pneumoniae
is directed by two bcs operons, cellulose synthase operon I and cellulose
107 |
synthase operon II, and one divergently oriented operon, bEFG operon. The
existence of two bacterial cellulose synthase (bcs) operons in the
K. pneumoniae genome potentially provides this bacterial species with higher
flexibility in term of cellulose production and biofilm formation, and it is
suggested to be due to the lateral gene transfer with extra bcs genes (Römling,
et al. , 2015). The details regarding regulatory mechanisms of biosynthesis of
cellulose in K. pneumoniae are still unknown.
4.1.1.3.2 Poly-N-acetylglucosamine (PNAG)
Poly-N-acetylglucosamine (PNAG: also known as polysaccharide intercellular
adhesin [PIA] and poly-β-1,6-N-acetyl-D-glucosamine [PGA]) is established as
one of many polysaccharides that are important in the biofilm architecture.
This bacterial polysaccharide is known to be involved in the intercellular
cohesion and cell-surface adhesion. PNAG is reported to mediate biofilm
formation by S. epidermidis (Mack, et al. , 1996) and E. coli (Wang, et al. ,
2004), and identified as a major component of B. subtilis biofilm matrix (Roux,
et al. , 2015). Additionally, it is also known to play a role in host bacteria-
interactions, for example, it is crucial for protection of S. epidermidis from the
killing by human innate immunity (Vuong, et al. , 2004) and essential for
bacterial virulence, for instance, in S. aureus (Kropec, et al. , 2005). PNAG is
synthesised by four proteins encoded by a four-gene operon, termed
pgaABCD (polyglucosamine) in E. coli. The pga operon of K. pneumoniae has
a very high similarity with the E. coli pga operon (Chen, et al., 2014) and since
the pgaABCD locus is conserved amongst most K. pneumoniae strains, it is
postulated that K. pneumoniae will have PNAG as a component in its biofilms
(Chen, et al., 2014).
108 |
4.1.2 Extracellular polymeric substances (EPS) produced by
K. pneumoniae during biofilm formation
4.1.2.1 Biofilm EPS of K. pneumoniae upon cultivation in
nutrient-rich media
Little is known about the biofilm EPS of K. pneumoniae. A study by Bandeira,
et al. (2017) found that EPS composition of three K. pneumoniae strains were
richer in exopolysaccharides than eDNA upon cultivation in MH broth in
96-well polystyrene plates. The protein content, however, differed between
each strain where one of them showed a particularly high percentage of protein
content around 65 % in its biofilm in comparison to PNAG and eDNA.
A publication by Flemming, et al. (2010) suggested that cellulose could be an
important biofilm EPS of K. pneumoniae This is supported by Wang, et al.
(2016) who showed that cellulose was a major biofilm component when
K. pneumoniae was grown under a simulated microgravity environment (SMG)
in LB medium compared to controls. A carbapenem-resistant K. pneumoniae
strain ATCC BAA-1705 was grown aerobically in LB broth in two different
conditions. The test group (SMG) was conducted by growing the bacterial
cells in high-aspect ratio vessels (HARV) bioreactors and rotating the
bioreactor with its axis perpendicular to gravity, while, the control (NG) was
conducted by growing the bacteria in HARV reactors with its axis parallel to
gravity.
109 |
4.1.3 Artificial urine medium (AUM)
Since previous studies have shown that cultivation in different rich media has
an effect on the composition of EPS of K. pneumoniae biofilm, we wondered
what the effect of cultivation in a nutrient-poor medium such as human urine
would be on the composition of EPS. Since K. pneumoniae is often associated
with urinary tract infections, the usage of artificial urine medium (AUM) has
clinical relevance since it is chemically more representative of real human
urine than nutrient-rich media like MH or LB. Whilst usage of real human urine
could be considered to be more relevant than using AUM for cultivation, it does
have some pitfalls. The chemical composition of human urine obtained from
the donors is highly dependent on the donors’ diet, fluid intake, and life style.
By eating more carbohydrate-rich foods, monosaccharide levels (e.g. glucose)
will be affected and consumption of more sodium-rich foods will affect the
sodium level in urine. The amount of fluid intake will also affect the
concentrations of nutrients in urine. These variations could make it very
difficult to reproduce experiments. By using an AUM, the composition of the
nutrients can be kept constant, making experiments more reproducible. In the
study described in this chapter, we used an AUM based on that designed by
Brooks, et al. (1997) with some additions to mimic human urine.
110 |
4.1.4. Aims of this chapter
In this chapter, we investigated the capacity of seven K. pneumoniae strains
to form biofilms in nutritious medium, tryptic soy broth (TSB) and nutrient-poor
medium, artificial urine medium (AUM). It is still unclear what EPS are
produced by K. pneumoniae during biofilm formation, since very few studies
have been published regarding this matter. The purpose of the work described
in this chapter was to determine the components of EPS produced by
K. pneumoniae that contributed to biofilms using enzymatic treatment
(proteinase K, DNase I and cellulase) and a mild oxidising agent (sodium
metaperiodate, NaIO4) upon cultivation in nutrient-rich and nutrient-poor
medium.
111 |
4.2 Materials and methods
4.2.1 Bioinformatic analysis
Using a bioinformatic approach, the operons involved in the production of
polysaccharides such as cellulose and PNAG were identified in the draft whole
genome sequence of the strains used in this study. Comparative analysis of
the DNA sequences was conducted to compare the operons amongst the
strains using BLASTn, BLASTp (Altschul, et al., 1990), EMBOSS-transeq
(Rice, et al., 2000), Clustal Omega (Sievers, et al., 2011), and Genedoc. The
details of the software were described in Chapter 2, Table 2-8.
4.2.2 Media
Media used in this study were tryptic soy broth, TSB (Sigma, T8907) and
artificial urine medium (AUM). TSB was prepared according to the
manufacturer’s protocol (Sigma), while AUM was prepared according to the
method published by Brooks, et al. (1997) with some modifications. The
components of the media are described in the table below (Table 4-1). The
TSB was autoclaved at 121 °C for 15 min. The AUM was prepared by
dissolving all the components in autoclaved ultrapure Milli-Q water (MQ H2O)
(Millipore, UK). The final pH for the AUM was adjusted to pH 6.5 and the
medium was then filter sterilised with a 0.2 µM PES filter (Nalgene, UK) and
kept at 4 °C.
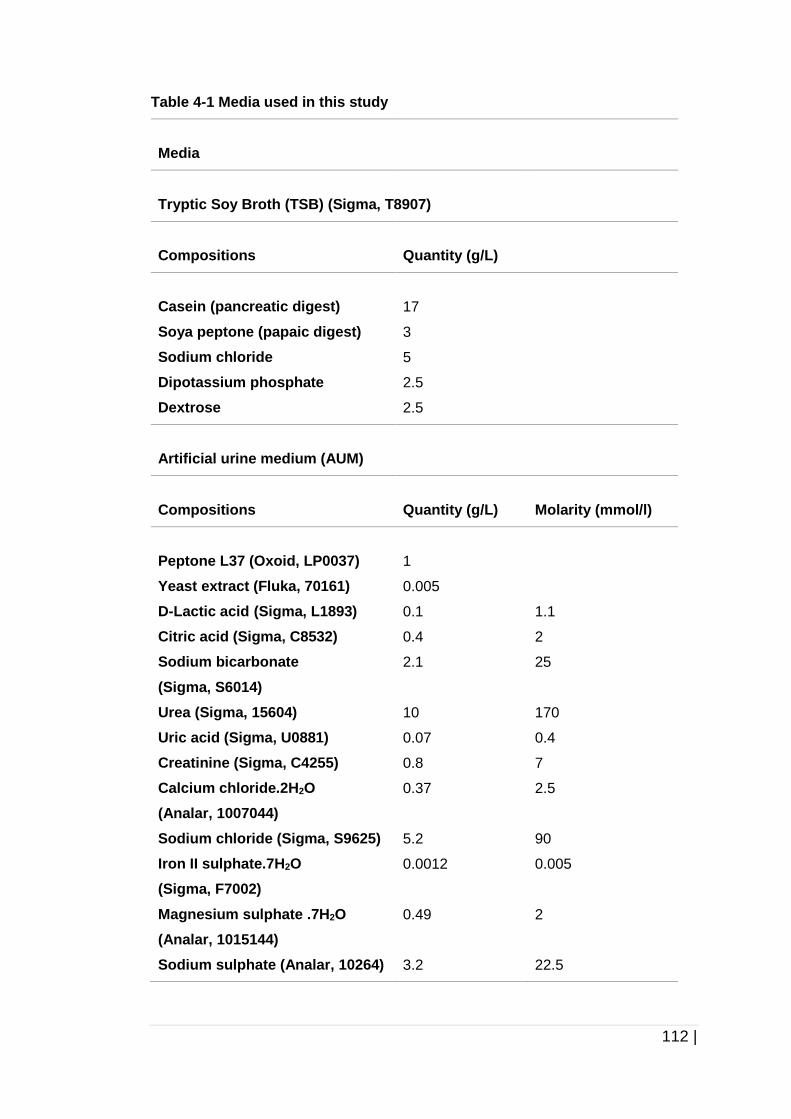
112 |
Table 4-1 Media used in this study
Media
Tryptic Soy Broth (TSB) (Sigma, T8907)
Compositions
Quantity (g/L)
Casein (pancreatic digest)
Soya peptone (papaic digest)
Sodium chloride
Dipotassium phosphate
Dextrose
17
3
5
2.5
2.5
Artificial urine medium (AUM)
Compositions
Quantity (g/L)
Molarity (mmol/l)
Peptone L37 (Oxoid, LP0037)
Yeast extract (Fluka, 70161)
D-Lactic acid (Sigma, L1893)
Citric acid (Sigma, C8532)
Sodium bicarbonate
(Sigma, S6014)
Urea (Sigma, 15604)
Uric acid (Sigma, U0881)
Creatinine (Sigma, C4255)
Calcium chloride.2H2O
(Analar, 1007044)
Sodium chloride (Sigma, S9625)
Iron II sulphate.7H2O
(Sigma, F7002)
Magnesium sulphate .7H2O
(Analar, 1015144)
Sodium sulphate (Analar, 10264)
1
0.005
0.1
0.4
2.1
10
0.07
0.8
0.37
5.2
0.0012
0.49
3.2
1.1
2
25
170
0.4
7
2.5
90
0.005
2
22.5
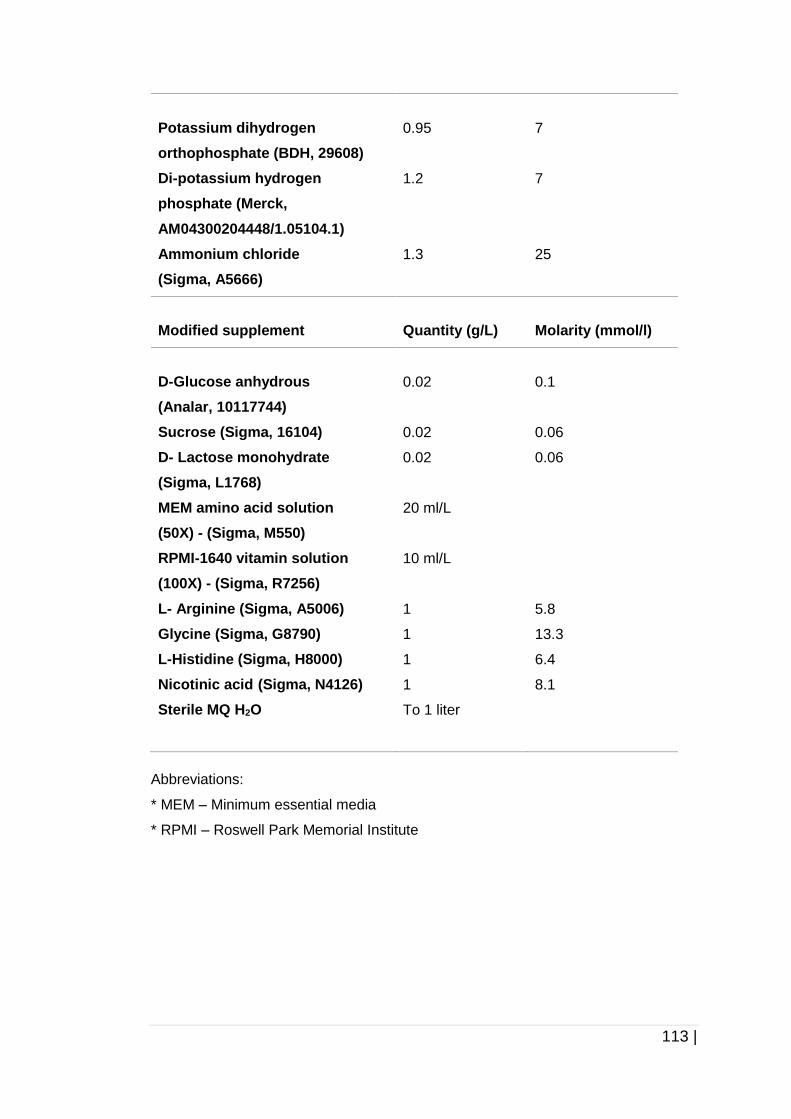
113 |
Potassium dihydrogen
orthophosphate (BDH, 29608)
Di-potassium hydrogen
phosphate (Merck,
AM04300204448/1.05104.1)
Ammonium chloride
(Sigma, A5666)
0.95
1.2
1.3
7
7
25
Modified supplement
Quantity (g/L)
Molarity (mmol/l)
D-Glucose anhydrous
(Analar, 10117744)
Sucrose (Sigma, 16104)
D- Lactose monohydrate
(Sigma, L1768)
MEM amino acid solution
(50X) - (Sigma, M550)
RPMI-1640 vitamin solution
(100X) - (Sigma, R7256)
L- Arginine (Sigma, A5006)
Glycine (Sigma, G8790)
L-Histidine (Sigma, H8000)
Nicotinic acid (Sigma, N4126)
Sterile MQ H2O
0.02
0.02
0.02
20 ml/L
10 ml/L
1
1
1
1
To 1 liter
0.1
0.06
0.06
5.8
13.3
6.4
8.1
Abbreviations:
* MEM – Minimum essential media
* RPMI – Roswell Park Memorial Institute
114 |
4.2.3 Growth kinetics of examined K. pneumoniae strains in
TSB and AUM
A single colony of each K. pneumoniae strain was separately inoculated into
5 ml of TSB or AUM and the culture was incubated at 37 °C for 16 h on a rotary
shaker at 200 rpm. The 16 h culture was subsequently diluted to an optical
density at 600 nm (OD600) of 0.05 and inoculated into a 50 ml tube containing
10 ml of fresh TSB or AUM. The culture was further incubated at 37 °C on the
rotary shaker and the absorbance (OD600) was determined using a WPA
CO8000 cell density meter (Biochrom Ltd, UK) at hourly time intervals.
4.2.3.1 Determination of relationship between absorbance
(OD600) and colony forming unit per ml (CFU/ml)
Three different strains of K. pneumoniae were chosen to determine the
correlation between absorbance (OD600) and colony forming unit per ml
(CFU/ml) upon growth in suitable media. They were Kpneu_1, a clinical strain,
Kpneu_110, a hypermucoviscous strain, and C3091, a laboratory strain. The
correlation was determined by measuring the absorbance (OD600) at hourly
time intervals, and subsequently making a series of serial dilutions of the
corresponding suspensions.
The 16 h culture was diluted to OD600 of 0.05 and inoculated into a 50 ml tube
containing 10 ml of fresh TSB. The culture was incubated at 37 °C on the
rotary shaker and the absorbance (OD600) was determined. The suspension
was diluted accordingly once the OD600 reached the range of OD600 ~1.0
and the exact OD600 was determined by multiplying the absorbance reading
obtained with the dilution factor. The series of diluted suspensions were
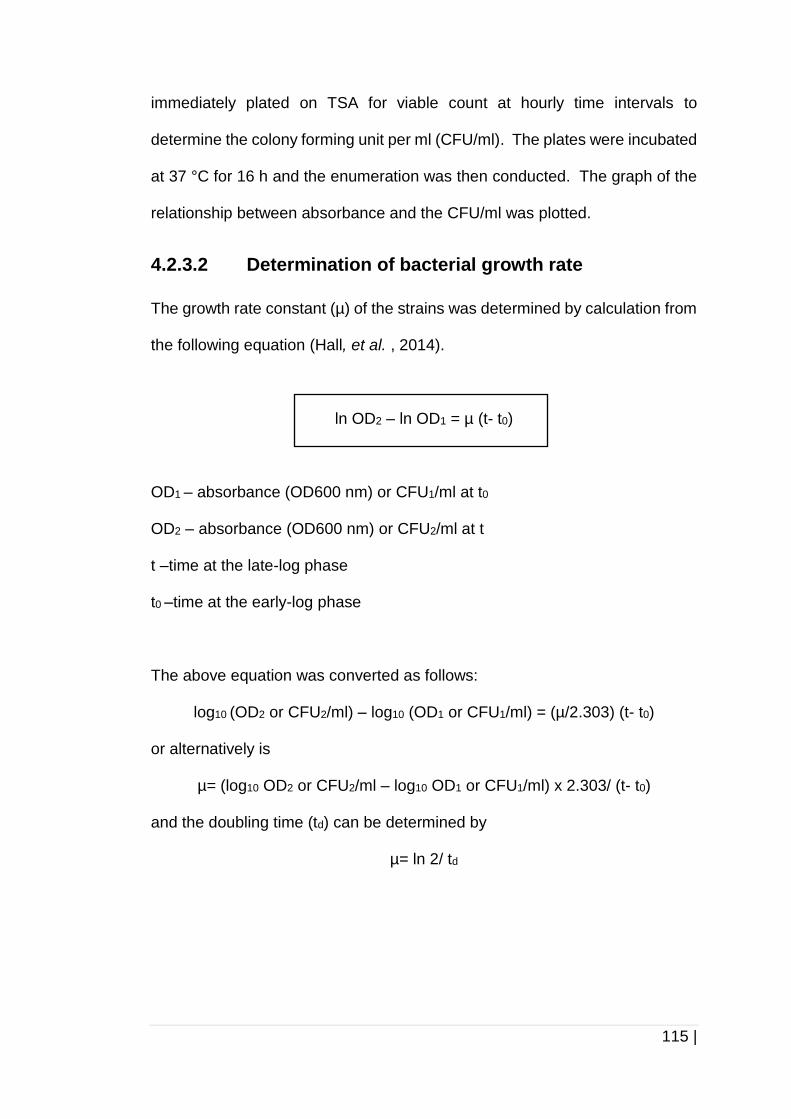
115 |
immediately plated on TSA for viable count at hourly time intervals to
determine the colony forming unit per ml (CFU/ml). The plates were incubated
at 37 °C for 16 h and the enumeration was then conducted. The graph of the
relationship between absorbance and the CFU/ml was plotted.
4.2.3.2 Determination of bacterial growth rate
The growth rate constant (µ) of the strains was determined by calculation from
the following equation (Hall, et al. , 2014).
ln OD2 – ln OD1 = µ (t- t0)
OD1 – absorbance (OD600 nm) or CFU1/ml at t0
OD2 – absorbance (OD600 nm) or CFU2/ml at t
t –time at the late-log phase
t0 –time at the early-log phase
The above equation was converted as follows:
log10 (OD2 or CFU2/ml) – log10 (OD1 or CFU1/ml) = (µ/2.303) (t- t0)
or alternatively is
µ= (log10 OD2 or CFU2/ml – log10 OD1 or CFU1/ml) x 2.303/ (t- t0)
and the doubling time (td) can be determined by
µ= ln 2/ td
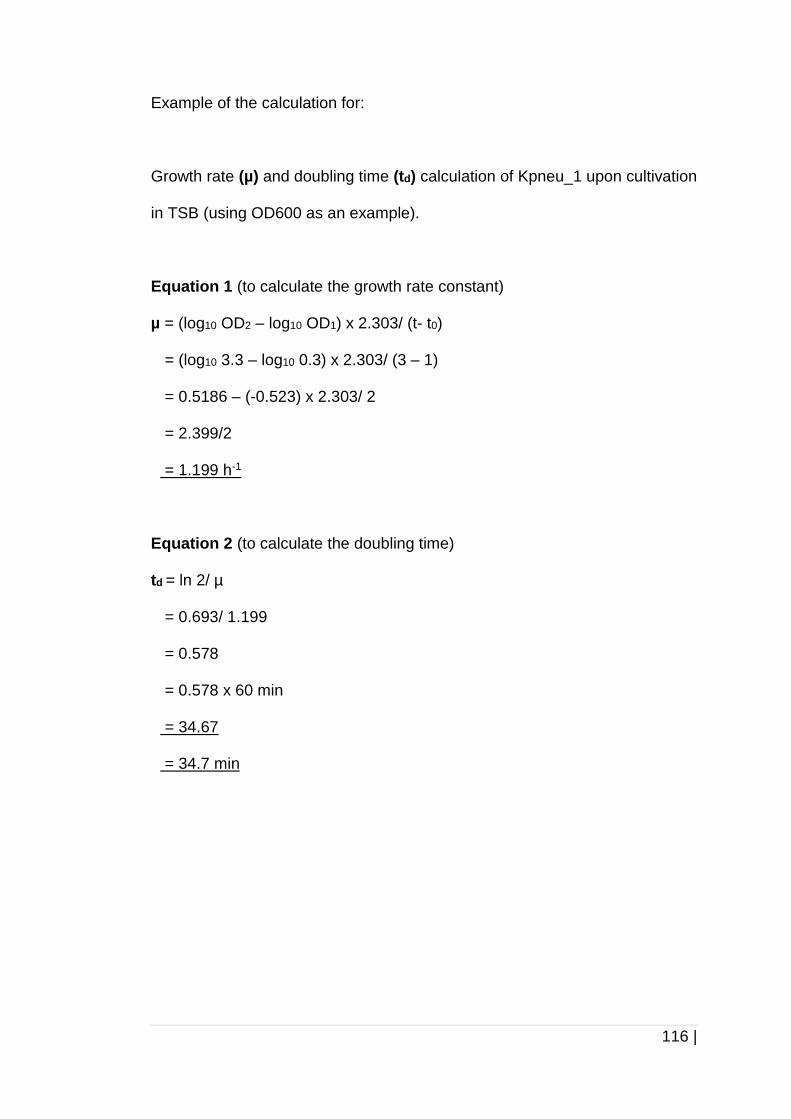
116 |
Example of the calculation for:
Growth rate (µ) and doubling time (td) calculation of Kpneu_1 upon cultivation
in TSB (using OD600 as an example).
Equation 1 (to calculate the growth rate constant)
µ = (log10 OD2 – log10 OD1) x 2.303/ (t- t0)
= (log10 3.3 – log10 0.3) x 2.303/ (3 – 1)
= 0.5186 – (-0.523) x 2.303/ 2
= 2.399/2
= 1.199 h-1
Equation 2 (to calculate the doubling time)
td = ln 2/ µ
= 0.693/ 1.199
= 0.578
= 0.578 x 60 min
= 34.67
= 34.7 min
117 |
4.2.4 Biofilm assays in TSB and AUM
The biofilms were grown in TSB and AUM in flat-bottom 96-well polystyrene
tissue culture treated plates (Sarstedt, Germany) and incubated at 37 °C for
24 h according to the previously mentioned method in Chapter 3, section 3.2.1.
4.2.5 Biofilm inhibition and disruption assays
4.2.5.1 Biofilm inhibition assays
To determine the composition of EPS within biofilms of K. pneumoniae in TSB
and AUM, biofilm inhibition and disruption assays in the presence of
i) proteinase K ([EC 3.4.21.64] [≥30 units/mg] [Sigma, P2308]),
ii) deoxyribonuclease I from bovine pancreas ([DNase I] [EC 3.1.21.1] [≥400
KUnitz units/mg] [Sigma, DN25]), or iii) cellulase ([EC 3.2.1.4] [≥700 units/g]
[Sigma, 2730]) were conducted. For the inhibition assays, the biofilm-forming
assays was carried out in the presence of 100 µg/ml proteinase K, 100 µg/ml
DNase, or 0.1 % cellulase in the medium, and the strains were allowed to form
biofilms at 37 °C for 24 h under shaking condition at 200 rpm on an orbital
shaker (Luckham, UK). No inhibition assays in the presence of NaIO4 was
conducted since NaIO4 is established to inhibit bacterial growth when added
into the growth medium. The biofilms grown in media without any
proteinase K, DNase, and cellulose acted as controls. The media without any
inoculation were used as a sterility control. The biofilm mass was quantified
using the CV staining assays detailed in the Chapter 3 section 3.2.5.
118 |
4.2.5.2 Biofilm disruption assays
Biofilms were grown at 37 °C for 24 h and the planktonic culture from the wells
containing 24 h old biofilms were removed, and the wells were washed
carefully with 200 µl PBS. The pre-formed biofilms were treated with
proteinase K, DNase, NaIO4, or cellulase. Three hundred microlitres of
i) 100 µg/ml proteinase K in 20 mM Tris-HCl (pH 7.5) and 100 mM NaCl,
ii) 100 µg/ml DNase in 150 mM NaCl, iii) NaIO4 (Sigma, S1878) in MQ H2O, or
iv) 0.1 % cellulase (v/v) in 0.05 M citrate buffer (pH 4.8) were added into the
wells. The treated biofilms were further incubated at 37 °C for 3 h for
proteinase K, at 37 °C for 24 h for DNase, at 4 °C for 24 h for NaIO4, and at
45 °C for 24 h for cellulase. The biofilms treated with corresponding buffers
only, acted as controls. The biofilms were then quantified using the CV staining
assay.
119 |
4.3 Results
4.3.1 Bioinformatic analysis
Bioinformatic analysis was conducted to determine if operons identified in
other bacteria as being involved in biofilm formation may be present in
K. pneumoniae before conducting any further experiments. Cellulose and
PNAG operons (Figure 4-1 and Figure 4-6) were chosen to be investigated
since these polysaccharides were speculated to contribute to biofilm
composition of K. pneumoniae (Chen, et al., 2014; Huertas, et al., 2014). The
bcs and pga operons of the strains were identified in the draft whole genome
sequences data. Comparative analysis was conducted between all the strains
for both bcs and pga operons, and also between Kpneu_1 and E. coli MG1655
for pga operon only. These analyses were conducted to identify any
differences in the genes in these operons. We also wanted to compare the
amino acid sequences and identify any amino acid variations between the
strains.
4.3.1.1 Comparative analysis of bacterial cellulose
synthase (bcs) operon
We performed the comparative analysis to confirm the existence of a complete
bcs operon and to identify if there were any defects in the genes that could
result in a truncated protein in the genome of all the strains used in this study.
Comparative analysis was conducted by comparing the genes in bcs operons
between all of the strains (Figure 4-1). Our results revealed differences in
several genes including bcsO (deletion of 1 bp) in CG43S3 which would result
in a truncated BcsO (Figure 4-2), bcsQ_I (deletion of 1 bp) in Kpneu_63 and

120 |
Kpneu_64 which would result in a truncated BcsQ (Figure 4-3), bcsB_I
(insertion of 5 bp) and bcsC_I (deletion of 52 bp) in Kpneu_1 which would
result in a truncated BcsB_I and BcsC_I proteins (Figure 4-4 and Figure 4-5)
compared to the rest of the strains. Several single nucleotide polymorphisms
(SNPs) in other genes were also identified among the strains. The SNPs
resulted in amino acid variations were shown in Table 4-2.
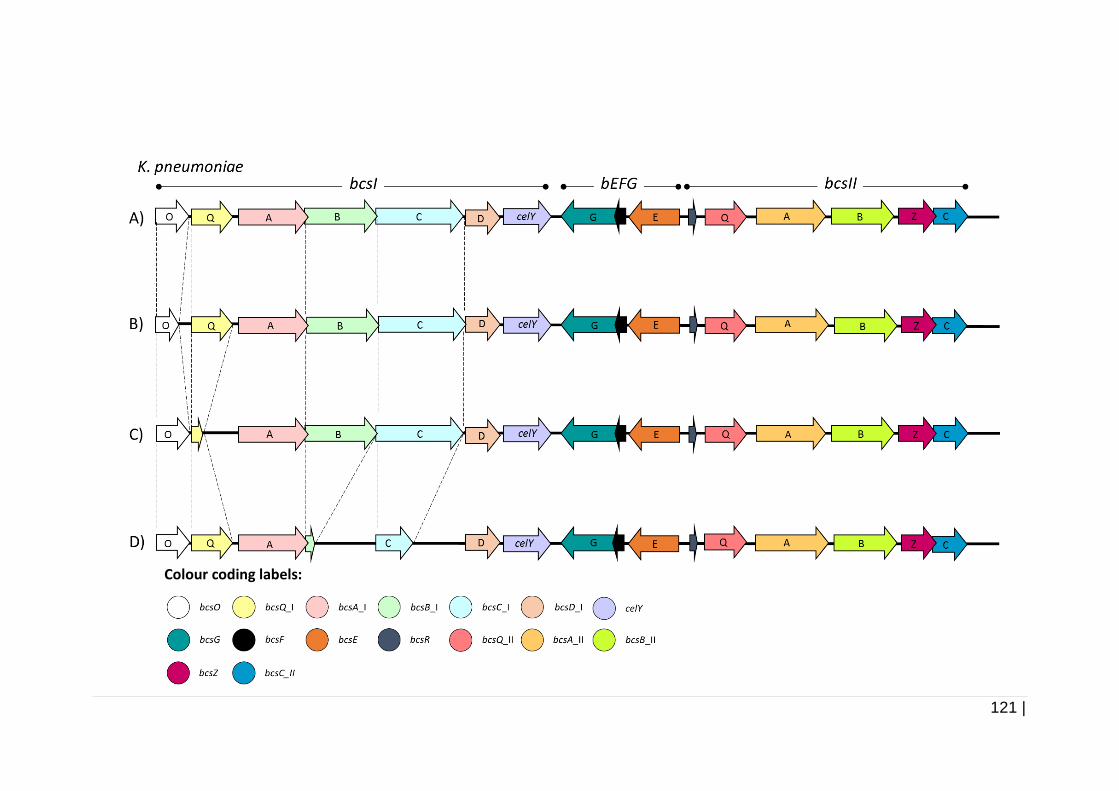
121 |
Colour coding labels:
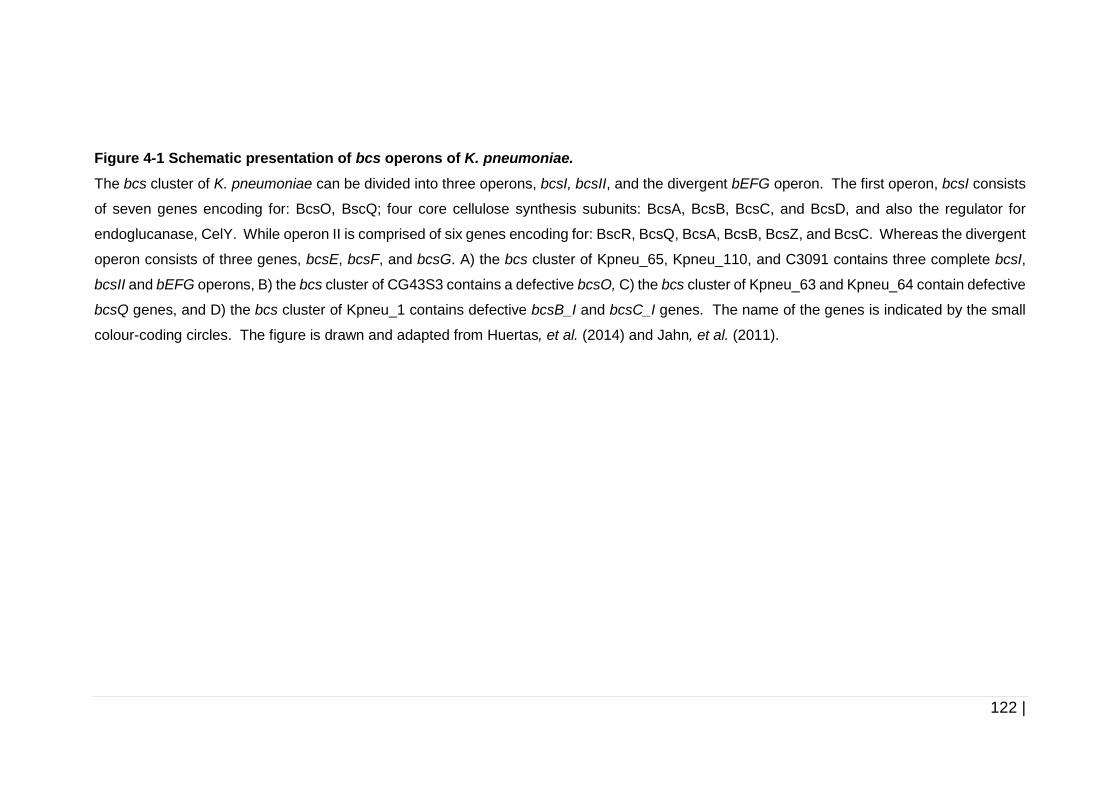
122 |
Figure 4-1 Schematic presentation of bcs operons of K. pneumoniae.
The bcs cluster of K. pneumoniae can be divided into three operons, bcsI, bcsII, and the divergent bEFG operon. The first operon, bcsI consists
of seven genes encoding for: BcsO, BscQ; four core cellulose synthesis subunits: BcsA, BcsB, BcsC, and BcsD, and also the regulator for
endoglucanase, CelY. While operon II is comprised of six genes encoding for: BscR, BcsQ, BcsA, BcsB, BcsZ, and BcsC. Whereas the divergent
operon consists of three genes, bcsE, bcsF, and bcsG. A) the bcs cluster of Kpneu_65, Kpneu_110, and C3091 contains three complete bcsI,
bcsII and bEFG operons, B) the bcs cluster of CG43S3 contains a defective bcsO, C) the bcs cluster of Kpneu_63 and Kpneu_64 contain defective
bcsQ genes, and D) the bcs cluster of Kpneu_1 contains defective bcsB_I and bcsC_I genes. The name of the genes is indicated by the small
colour-coding circles. The figure is drawn and adapted from Huertas, et al. (2014) and Jahn, et al. (2011).
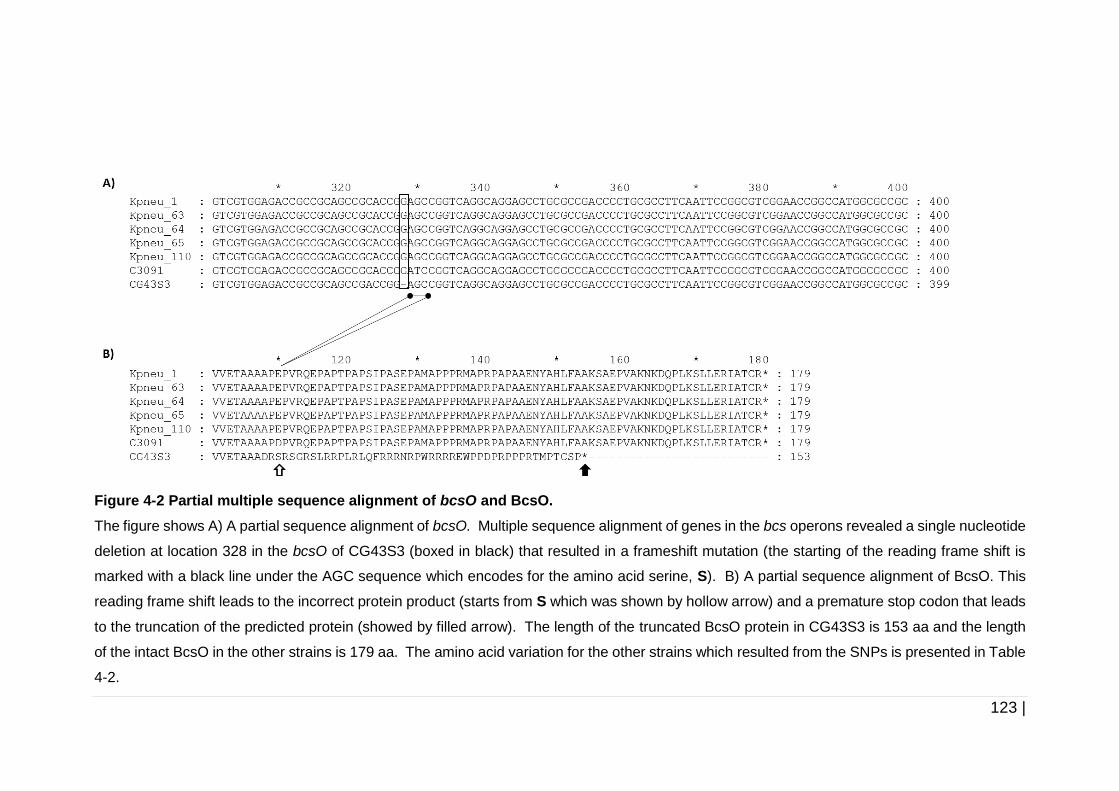
123 |
Figure 4-2 Partial multiple sequence alignment of bcsO and BcsO.
The figure shows A) A partial sequence alignment of bcsO. Multiple sequence alignment of genes in the bcs operons revealed a single nucleotide
deletion at location 328 in the bcsO of CG43S3 (boxed in black) that resulted in a frameshift mutation (the starting of the reading frame shift is
marked with a black line under the AGC sequence which encodes for the amino acid serine, S). B) A partial sequence alignment of BcsO. This
reading frame shift leads to the incorrect protein product (starts from S which was shown by hollow arrow) and a premature stop codon that leads
to the truncation of the predicted protein (showed by filled arrow). The length of the truncated BcsO protein in CG43S3 is 153 aa and the length
of the intact BcsO in the other strains is 179 aa. The amino acid variation for the other strains which resulted from the SNPs is presented in Table
4-2.
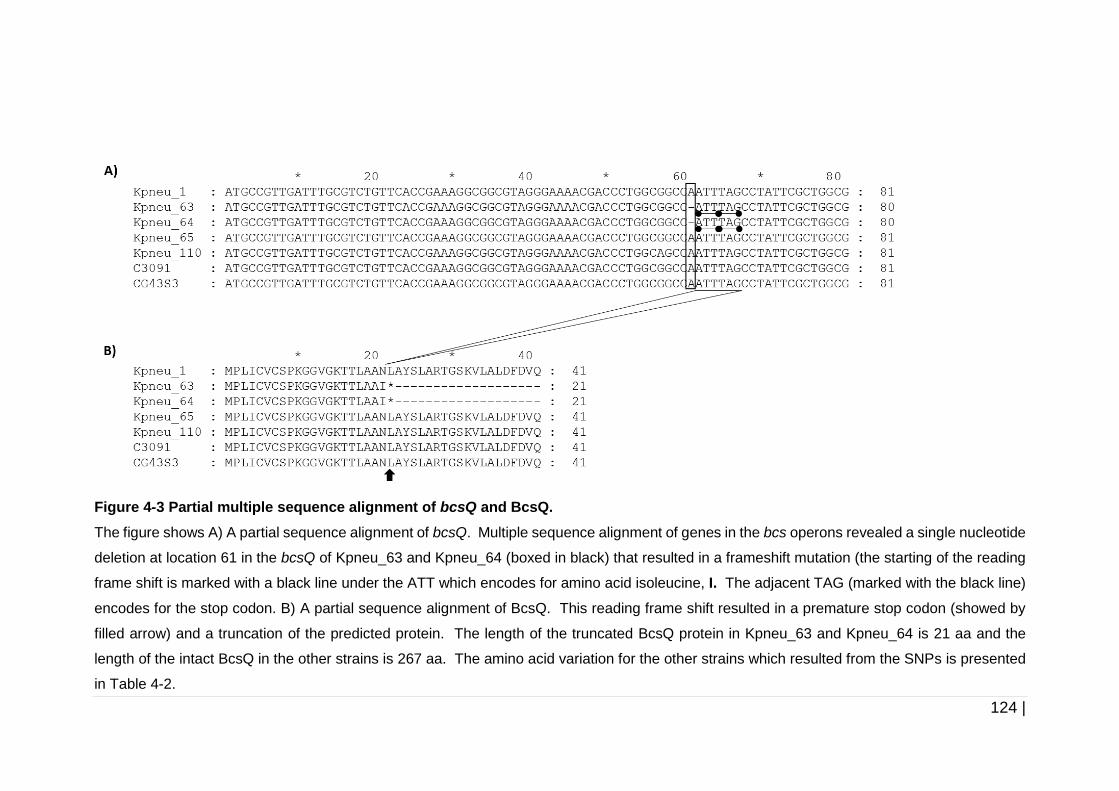
124 |
Figure 4-3 Partial multiple sequence alignment of bcsQ and BcsQ.
The figure shows A) A partial sequence alignment of bcsQ. Multiple sequence alignment of genes in the bcs operons revealed a single nucleotide
deletion at location 61 in the bcsQ of Kpneu_63 and Kpneu_64 (boxed in black) that resulted in a frameshift mutation (the starting of the reading
frame shift is marked with a black line under the ATT which encodes for amino acid isoleucine, I. The adjacent TAG (marked with the black line)
encodes for the stop codon. B) A partial sequence alignment of BcsQ. This reading frame shift resulted in a premature stop codon (showed by
filled arrow) and a truncation of the predicted protein. The length of the truncated BcsQ protein in Kpneu_63 and Kpneu_64 is 21 aa and the
length of the intact BcsQ in the other strains is 267 aa. The amino acid variation for the other strains which resulted from the SNPs is presented
in Table 4-2.
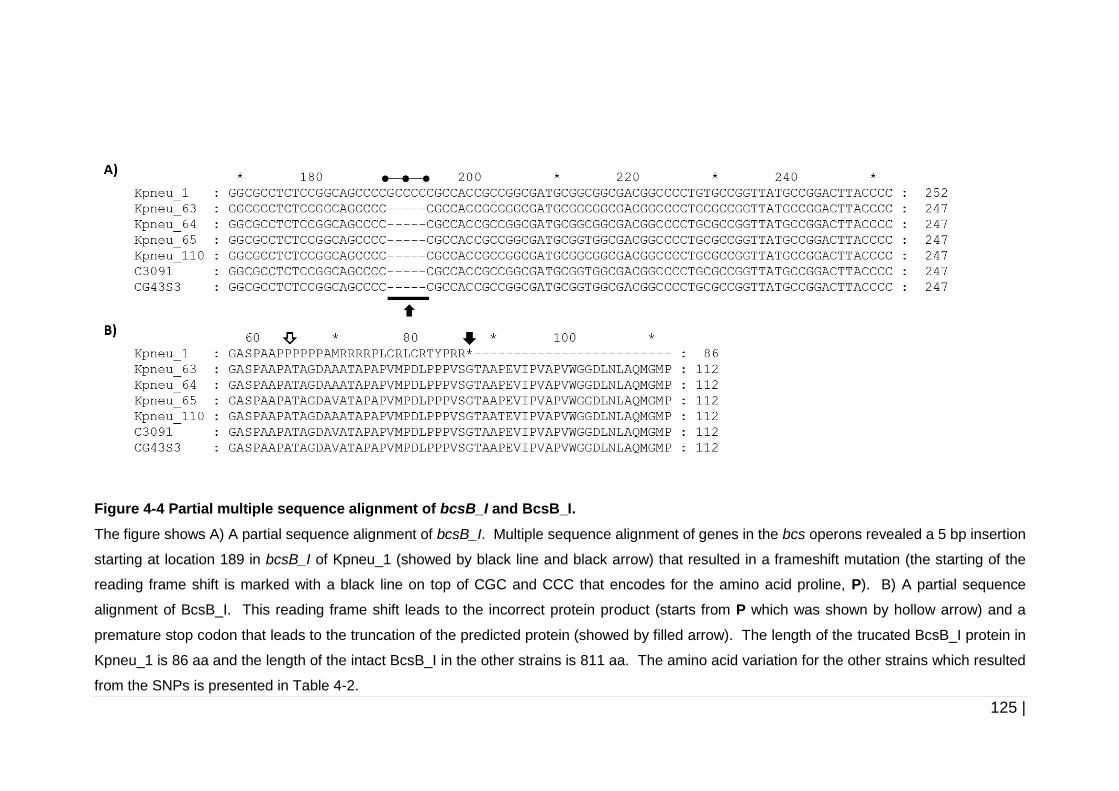
125 |
Figure 4-4 Partial multiple sequence alignment of bcsB_I and BcsB_I.
The figure shows A) A partial sequence alignment of bcsB_I. Multiple sequence alignment of genes in the bcs operons revealed a 5 bp insertion
starting at location 189 in bcsB_I of Kpneu_1 (showed by black line and black arrow) that resulted in a frameshift mutation (the starting of the
reading frame shift is marked with a black line on top of CGC and CCC that encodes for the amino acid proline, P). B) A partial sequence
alignment of BcsB_I. This reading frame shift leads to the incorrect protein product (starts from P which was shown by hollow arrow) and a
premature stop codon that leads to the truncation of the predicted protein (showed by filled arrow). The length of the trucated BcsB_I protein in
Kpneu_1 is 86 aa and the length of the intact BcsB_I in the other strains is 811 aa. The amino acid variation for the other strains which resulted
from the SNPs is presented in Table 4-2.
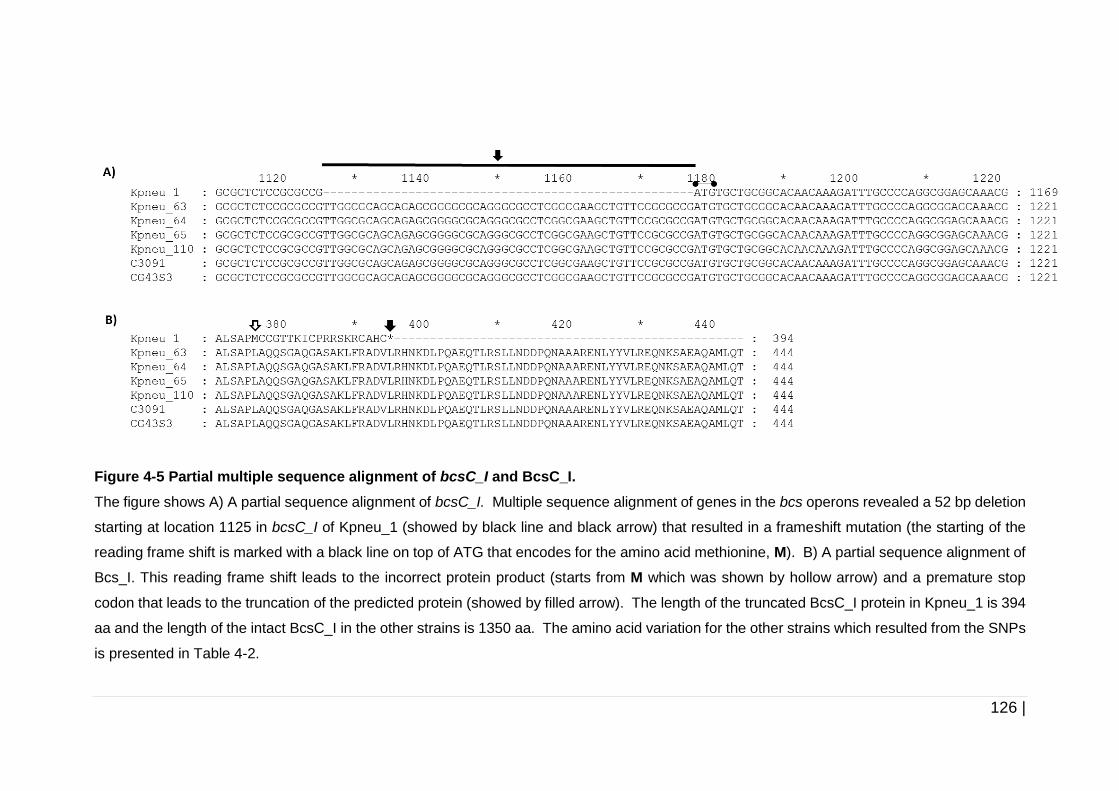
126 |
Figure 4-5 Partial multiple sequence alignment of bcsC_I and BcsC_I.
The figure shows A) A partial sequence alignment of bcsC_I. Multiple sequence alignment of genes in the bcs operons revealed a 52 bp deletion
starting at location 1125 in bcsC_I of Kpneu_1 (showed by black line and black arrow) that resulted in a frameshift mutation (the starting of the
reading frame shift is marked with a black line on top of ATG that encodes for the amino acid methionine, M). B) A partial sequence alignment of
Bcs_I. This reading frame shift leads to the incorrect protein product (starts from M which was shown by hollow arrow) and a premature stop
codon that leads to the truncation of the predicted protein (showed by filled arrow). The length of the truncated BcsC_I protein in Kpneu_1 is 394
aa and the length of the intact BcsC_I in the other strains is 1350 aa. The amino acid variation for the other strains which resulted from the SNPs
is presented in Table 4-2.
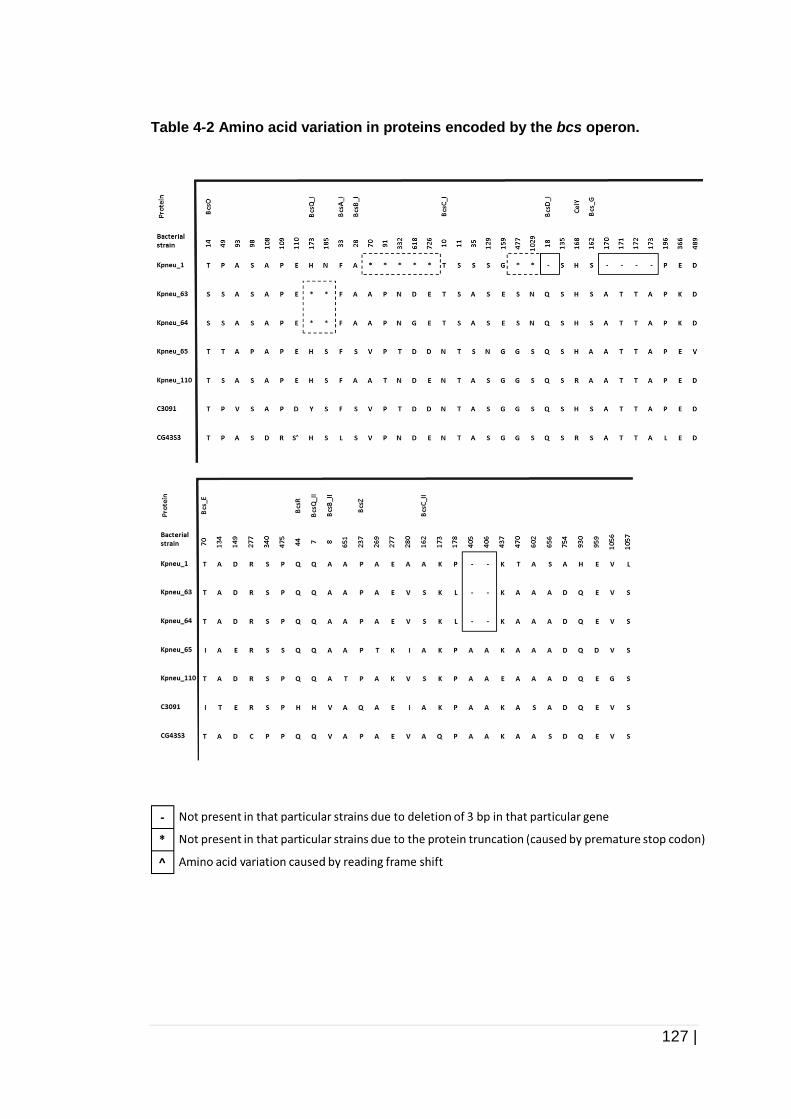
127 |
Table 4-2 Amino acid variation in proteins encoded by the bcs operon.
128 |
4.3.1.2 Comparative analysis of pga operon
To verify the existence of a complete pga operon in all of the genomes of the
examined strains, comparative analyses of amino acid sequences were
conducted by comparing the deduced amino acids of PgaA, PgaB, PgaC and
PgaD among the strains. The amino acid variation between strains are shown
in Table 4-3. In addition, a pairwise amino acid sequence alignment of PgaA,
PgaB, PgaC, and PgaD of E. coli MG1655 and K. pneumoniae strain Kpneu_1
was also conducted to identify the amino acid sequence identity between
E. coli and K. pneumoniae. (Figure 4-6). Comparison between deduced amino
acid sequences of PgaA, PgaB, PgaC, and PgaD of K. pneumoniae showed
high level of amino acid identity percentage with Pga proteins of E. coli
MG1655.
Figure 4-6 shows the schematic diagram of the pga operon. Both E. coli and
K. pneumoniae pga operons consist of four genes encoding for proteins
associated with the synthesis of PNAG. PgaA of Kpneu_1 K. pneumoniae
(829 aa) had 41 % amino acid identity with PgaA of E. coli (807 aa) (Figure
4.7A); PgaB of Kpneu_1 (671 aa) had 53 % amino acid identity with PgaB of
E. coli (672 aa) (Figure 4.7B). While PgaC of Kpneu_1 (442 aa) had about
65 % amino acid identity with PgaC of E. coli (441 aa) (Figure 4.7C), and
PgaD of Kpneu_1 (149 aa) had 25 % amino acid identity with PgaD of E. coli
(137 aa) (Figure 4.7D). The pairwise amino acid sequence alignment of Pga
of E. coli MG1655 and Kpneu_1 is presented in Figure 4-7.
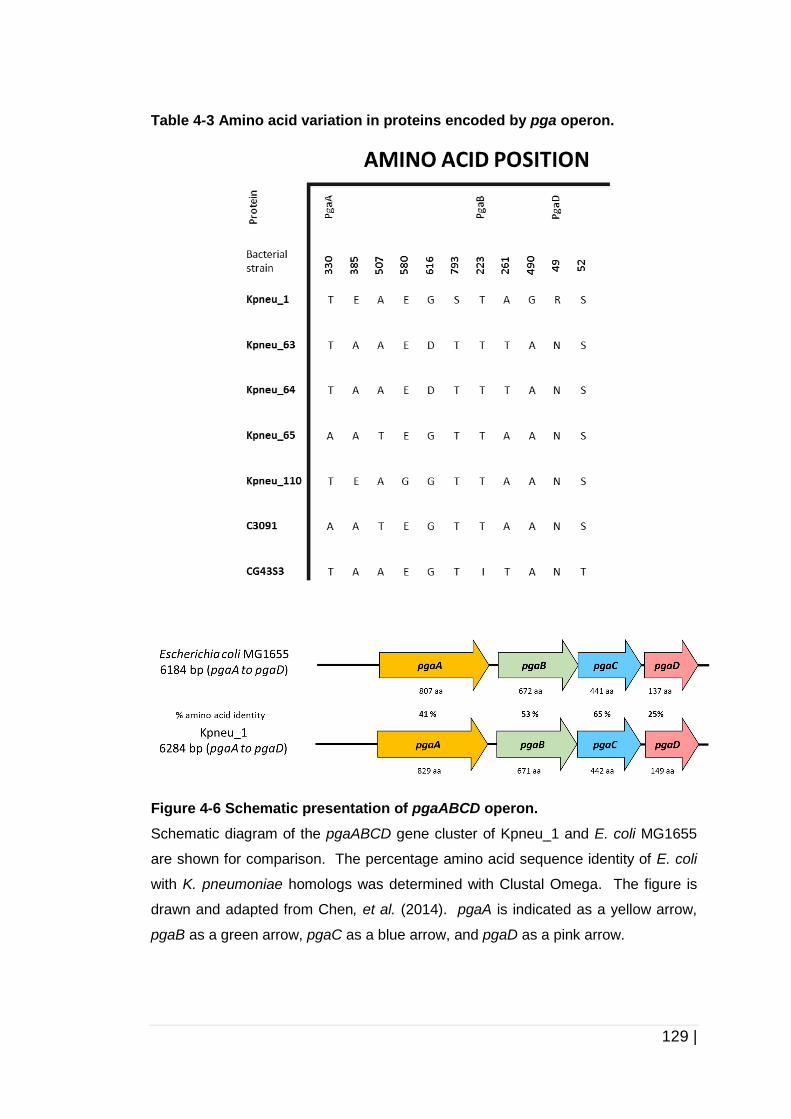
129 |
Table 4-3 Amino acid variation in proteins encoded by pga operon.
Figure 4-6 Schematic presentation of pgaABCD operon.
Schematic diagram of the pgaABCD gene cluster of Kpneu_1 and E. coli MG1655
are shown for comparison. The percentage amino acid sequence identity of E. coli
with K. pneumoniae homologs was determined with Clustal Omega. The figure is
drawn and adapted from Chen, et al. (2014). pgaA is indicated as a yellow arrow,
pgaB as a green arrow, pgaC as a blue arrow, and pgaD as a pink arrow.
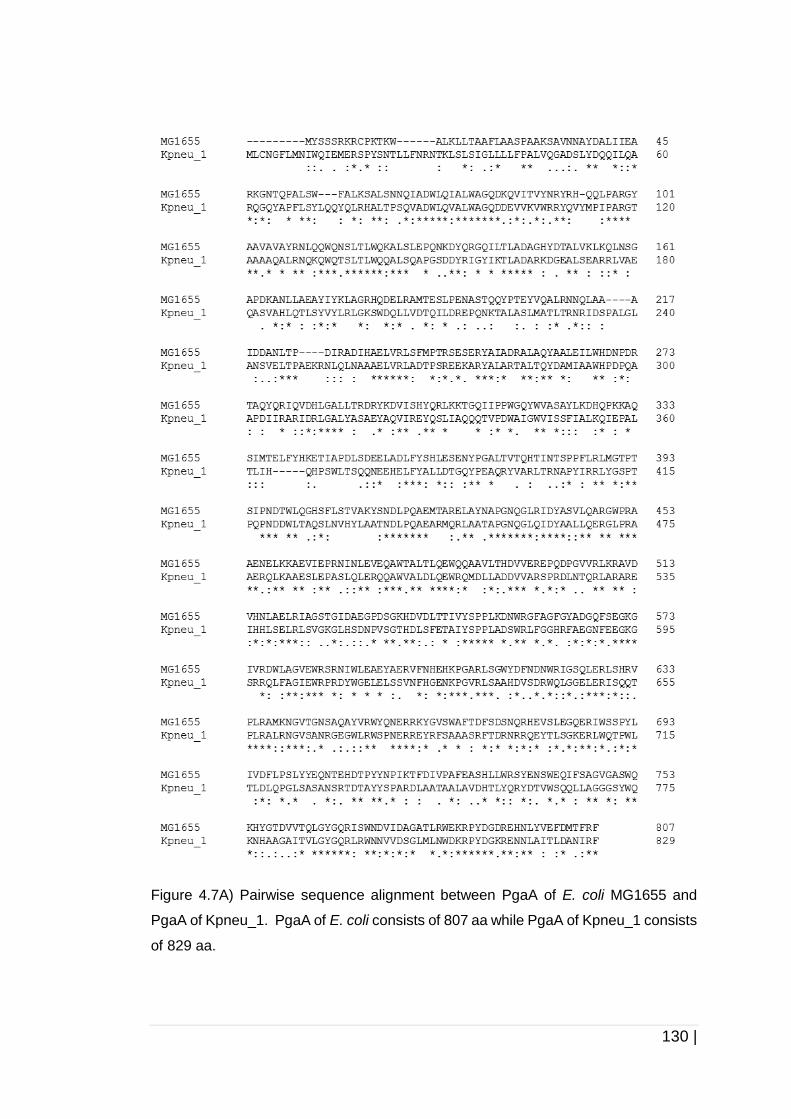
130 |
Figure 4.7A) Pairwise sequence alignment between PgaA of E. coli MG1655 and
PgaA of Kpneu_1. PgaA of E. coli consists of 807 aa while PgaA of Kpneu_1 consists
of 829 aa.
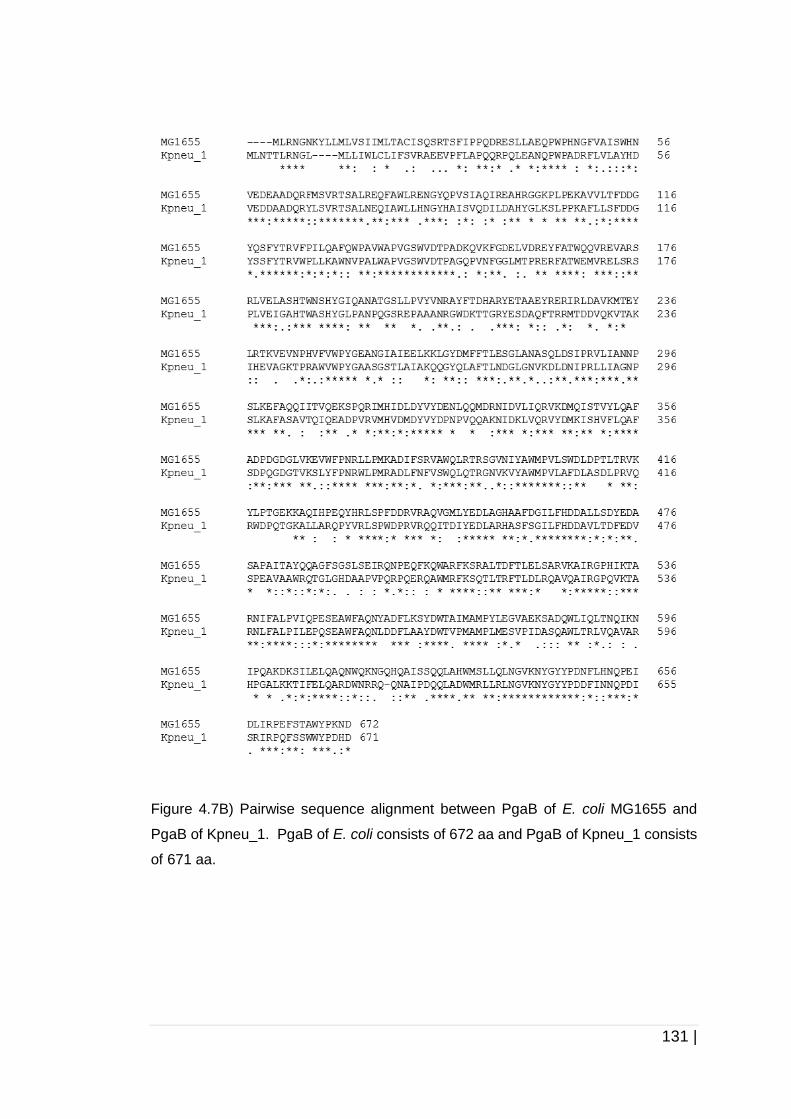
131 |
Figure 4.7B) Pairwise sequence alignment between PgaB of E. coli MG1655 and
PgaB of Kpneu_1. PgaB of E. coli consists of 672 aa and PgaB of Kpneu_1 consists
of 671 aa.
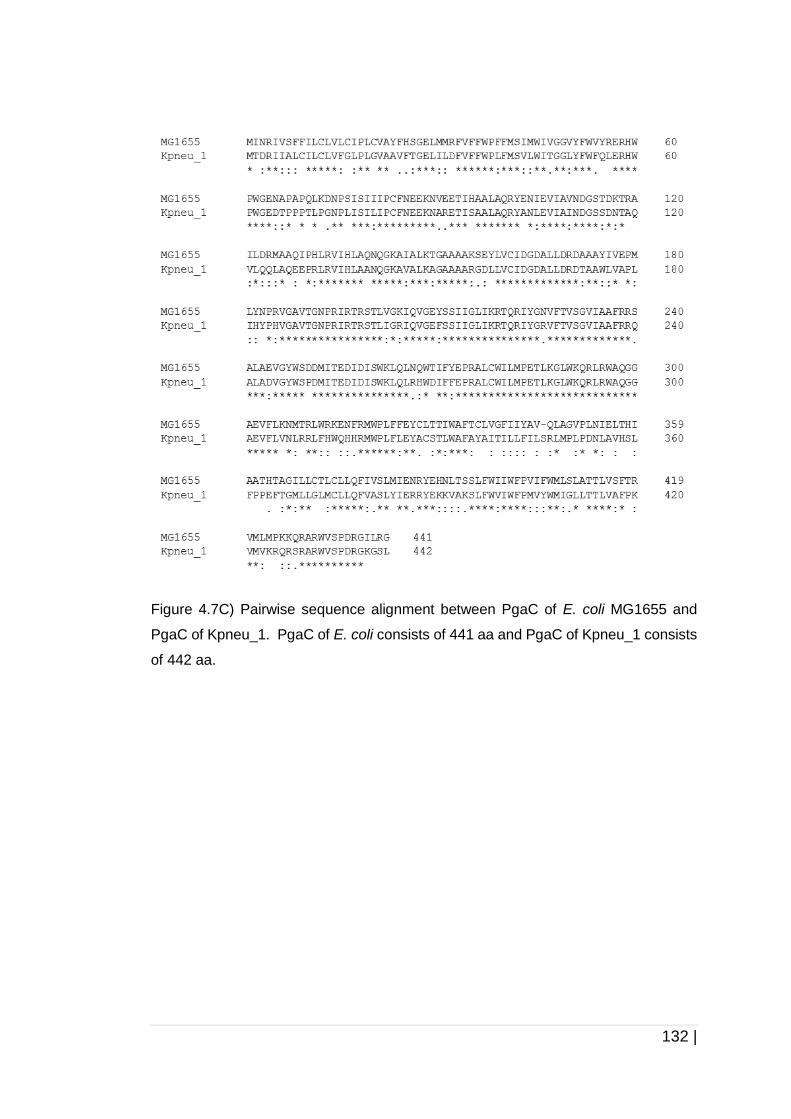
132 |
Figure 4.7C) Pairwise sequence alignment between PgaC of E. coli MG1655 and
PgaC of Kpneu_1. PgaC of E. coli consists of 441 aa and PgaC of Kpneu_1 consists
of 442 aa.
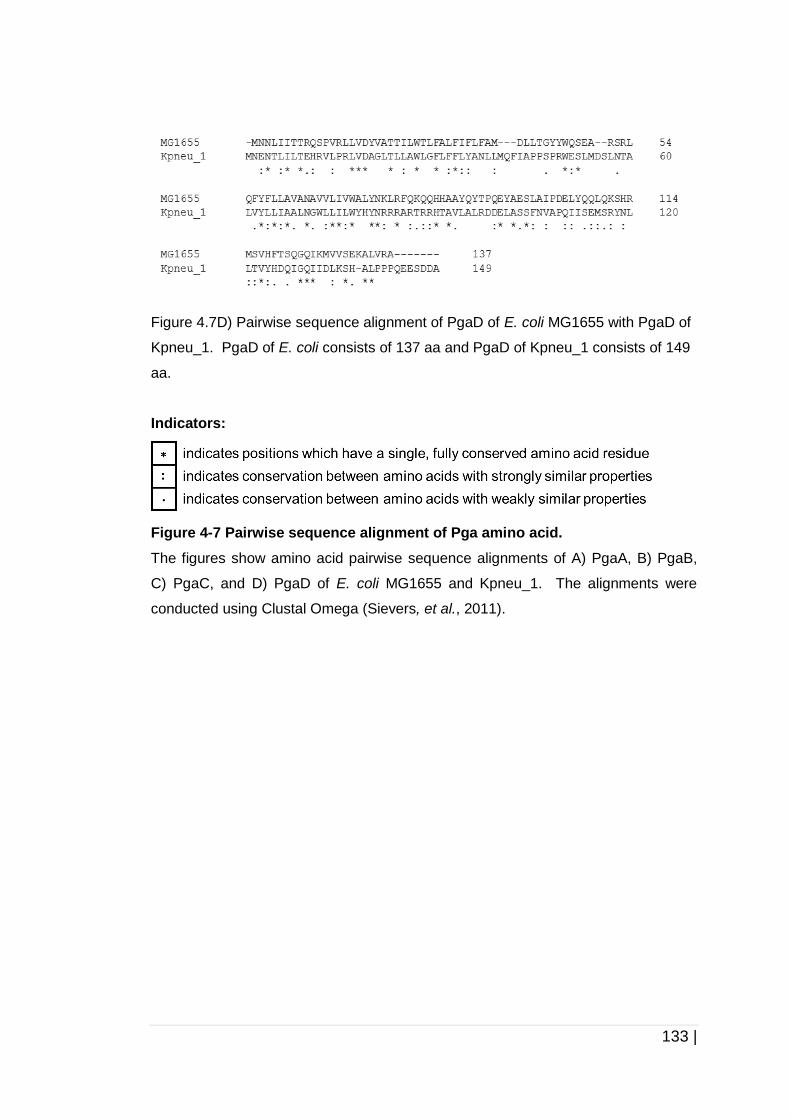
133 |
Figure 4.7D) Pairwise sequence alignment of PgaD of E. coli MG1655 with PgaD of
Kpneu_1. PgaD of E. coli consists of 137 aa and PgaD of Kpneu_1 consists of 149
aa.
Indicators:
Figure 4-7 Pairwise sequence alignment of Pga amino acid.
The figures show amino acid pairwise sequence alignments of A) PgaA, B) PgaB,
C) PgaC, and D) PgaD of E. coli MG1655 and Kpneu_1. The alignments were
conducted using Clustal Omega (Sievers, et al., 2011).
134 |
4.3.2 Determination of the relationship between absorbance
and colony forming unit per ml (CFU/ml)
The relationship between absorbance and CFU/ml was determined by
measuring the absorbance at hourly time intervals and immediately plating the
diluted suspensions on the TSA. The graphs in Figure 4.8 show the growth
curve and the CFU/ml of the different isolates, Kpneu_1, Kpneu_110, and
C3091 upon growth in TSB. From the calculation based on the equation in
Chapter 4 section 4.2.3.2, it was found that, the growth rate constant and
doubling times obtained from the calculation of the two parameters, the
absorbance and CFU/ml of these three strains were considered no difference
since no significant difference was found upon statistical analysis. All the
strains had approximately 30 min doubling time (Table 4-4). The growth rate
(µ) is the number of generations per hour, while the doubling time (td) is the
average time required for a particular bacterial population to double. All of the
graphs obtained in these experiments also showed that OD600 ~1.0 is equal
to ~109 CFU/ml after 2 h incubation in TSB for all three strains. Since we could
relate the absorbance value directly to the number of CFU/ml, absorbance
readings were used for the determination of the growth rates and doubling
times of the other strains in the subsequent experiments.
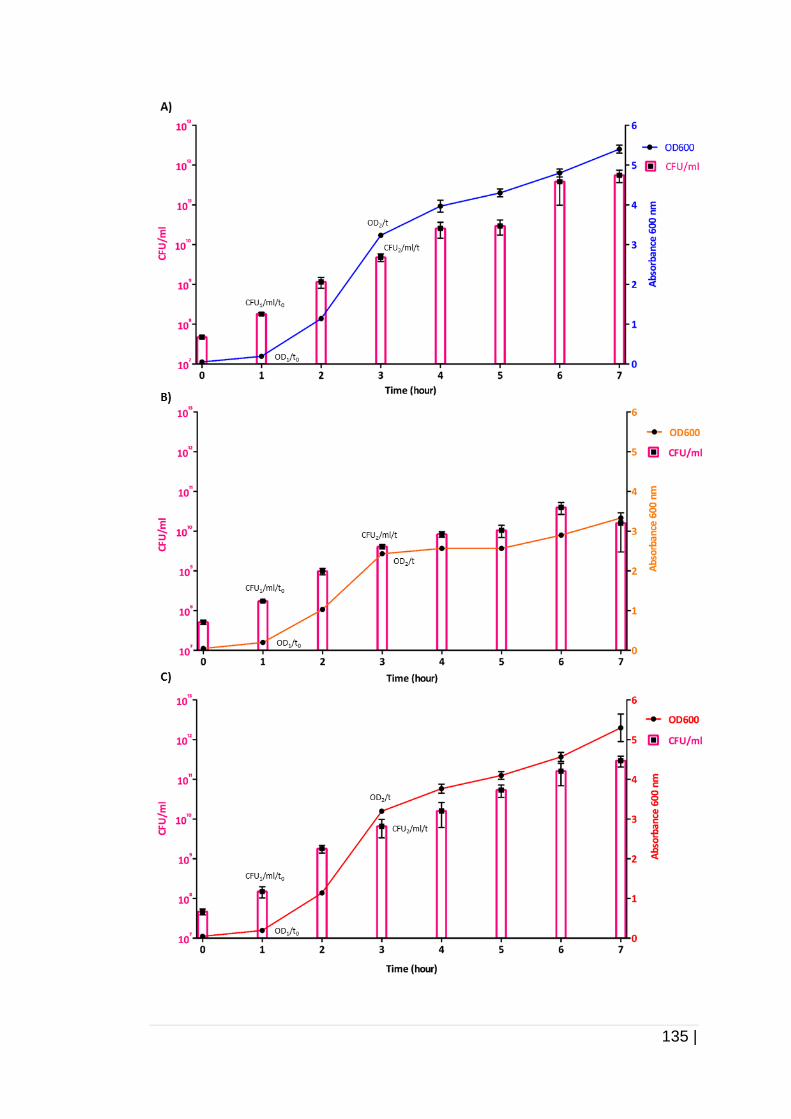
135 |
136 |
Figure 4-8 The relationship between absorbance and CFU/ml of K.pneumoniae
upon cultivation in TSB.
The figure shows the growth curve and CFU/ml of A) Kpneu_1, B) Kpneu_110, and
C) C3091 upon cultivation in TSB. Data presented are the mean of three replicates
and error bars indicate the standard deviations. All of the strains showed almost
similar growth upon cultivation in TSB. The OD1/t0 or CFU1/ml/t0 and OD2/t or
CFU2/ml/t used for calculation of the growth rate constant and doubling time are as
labelled. The graph lines indicate as follow: blue: Kpneu_1, orange: Kpneu_110, red:
C3091 and fuchsia: CFU/ml for all the strains. The OD1 and OD2 are the absorbance
values, CFU1/ml and CFU2/ml are the colony forming unit per ml and t0 and t are the
time, at early and late log phase used for calculation based on the equation in Chapter
4 section 4.2.3.2.
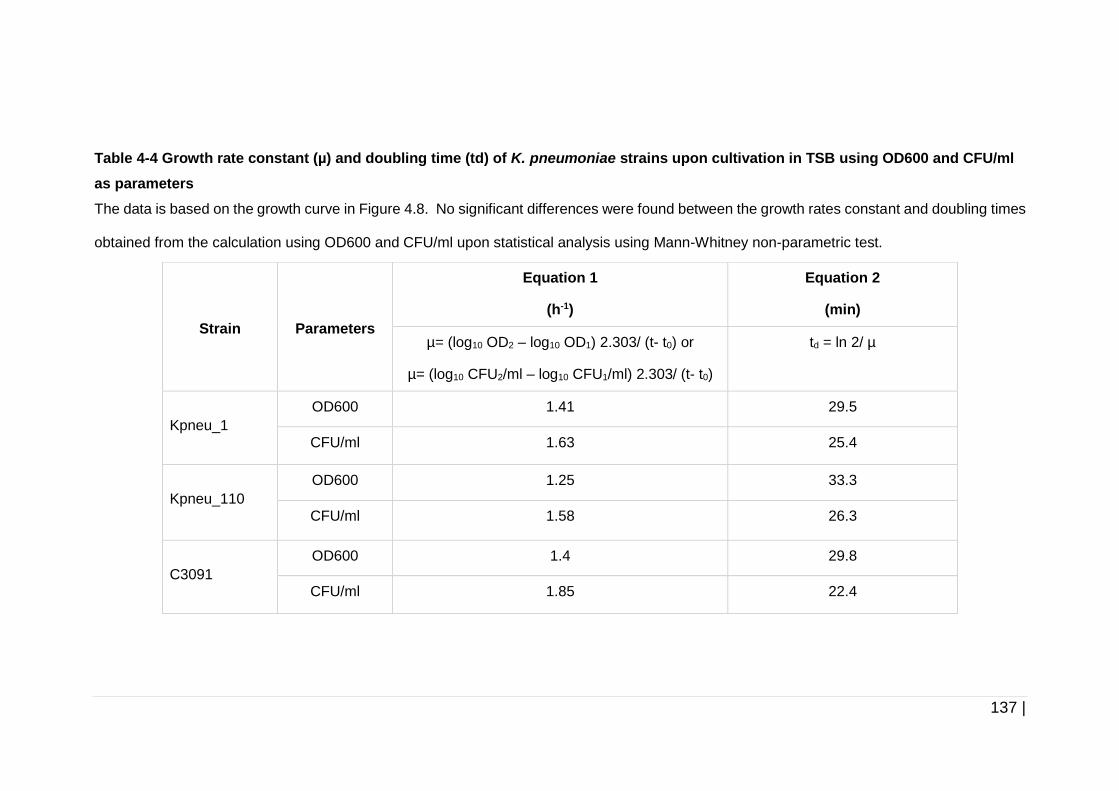
137 |
Table 4-4 Growth rate constant (µ) and doubling time (td) of K. pneumoniae strains upon cultivation in TSB using OD600 and CFU/ml
as parameters
The data is based on the growth curve in Figure 4.8. No significant differences were found between the growth rates constant and doubling times
obtained from the calculation using OD600 and CFU/ml upon statistical analysis using Mann-Whitney non-parametric test.
Strain
Parameters
Equation 1
(h-1)
Equation 2
(min)
µ= (log10 OD2 – log10 OD1) 2.303/ (t- t0) or
µ= (log10 CFU2/ml – log10 CFU1/ml) 2.303/ (t- t0)
td = ln 2/ µ
Kpneu_1
OD600 1.41 29.5
CFU/ml 1.63 25.4
Kpneu_110
OD600 1.25 33.3
CFU/ml 1.58 26.3
C3091
OD600 1.4 29.8
CFU/ml 1.85 22.4
138 |
4.3.3 Growth kinetics of K. pneumoniae strains in TSB and
AUM
From the data obtained in the previous sub-chapter, the growth kinetics of
K. pneumoniae was then determined in TSB and AUM. Growth curves were
performed in TSB and AUM for all examined strains and showed that all the
strains grew faster in TSB compared to AUM. This can be seen by the duration
for the strains to reach mid-log phase and mean generation time or doubling
time. The growth rate (µ) is the number of generations per hour while the
doubling time (td) is the average time required for those particular bacterial
population to double. The growth constant rate and the doubling time were
determined by the calculations (Equation 1 and Equation 2) explained in
section 4.3.2. All strains reached mid-log phase after 2 h upon cultivation in
TSB (Figure 4-9Ai) while they approached the mid-log phase approximately
after 4 h upon cultivation in AUM (Figure 4-9Bi).
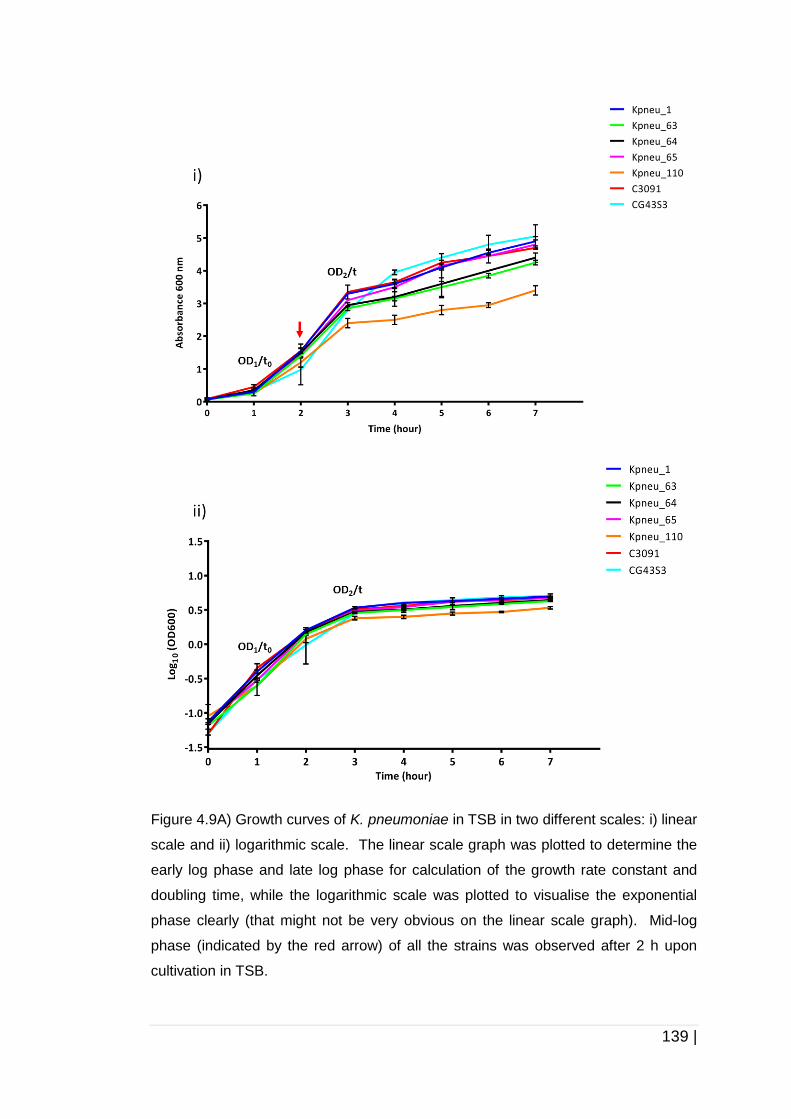
139 |
Figure 4.9A) Growth curves of K. pneumoniae in TSB in two different scales: i) linear
scale and ii) logarithmic scale. The linear scale graph was plotted to determine the
early log phase and late log phase for calculation of the growth rate constant and
doubling time, while the logarithmic scale was plotted to visualise the exponential
phase clearly (that might not be very obvious on the linear scale graph). Mid-log
phase (indicated by the red arrow) of all the strains was observed after 2 h upon
cultivation in TSB.
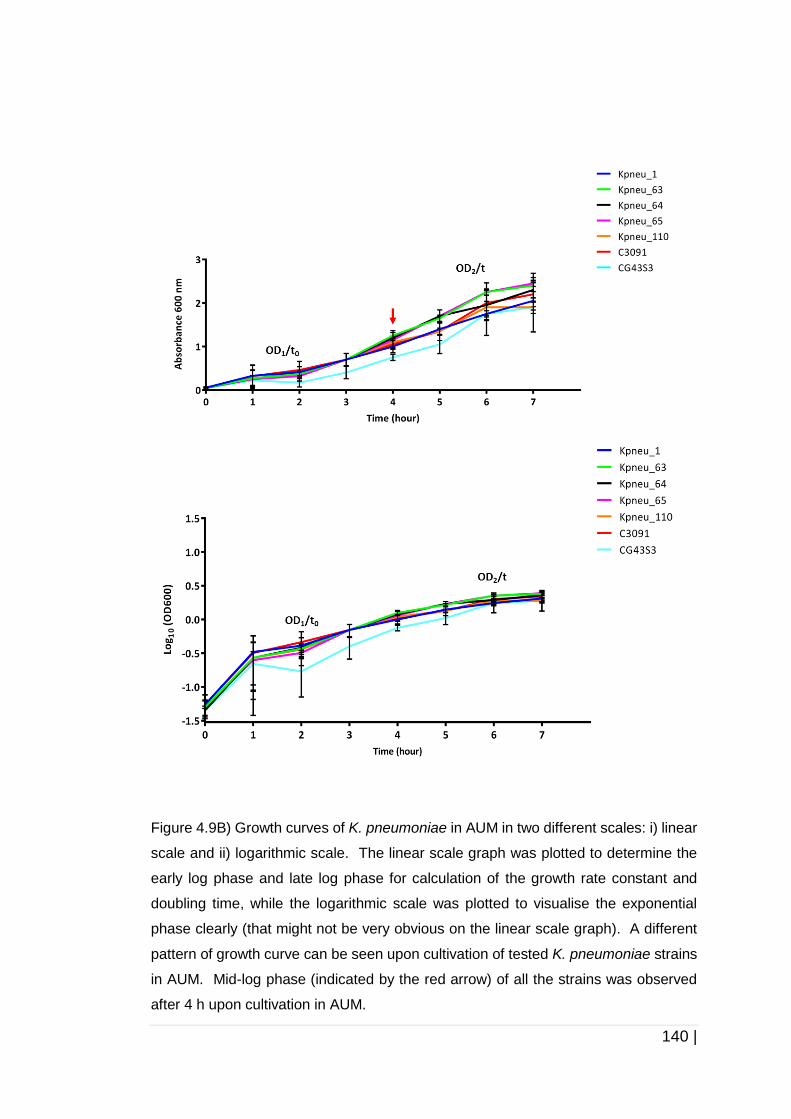
140 |
Figure 4.9B) Growth curves of K. pneumoniae in AUM in two different scales: i) linear
scale and ii) logarithmic scale. The linear scale graph was plotted to determine the
early log phase and late log phase for calculation of the growth rate constant and
doubling time, while the logarithmic scale was plotted to visualise the exponential
phase clearly (that might not be very obvious on the linear scale graph). A different
pattern of growth curve can be seen upon cultivation of tested K. pneumoniae strains
in AUM. Mid-log phase (indicated by the red arrow) of all the strains was observed
after 4 h upon cultivation in AUM.
141 |
Figure 4-9 Growth of K. pneumoniae in two different growth media.
The figures show growth kinetics of K. pneumoniae upon cultivation in A) TSB and B)
AUM. Data presented are the mean of two independent experiments and error bars
indicate the standard deviation. The graph lines are indicated as follow: blue:
Kpneu_1, light green: Kpneu_63, black: Kpneu_64, magenta: Kpneu_65, orange:
Kpneu_110, red: C3091 and light blue: CG43S3.
An example of the calculation is shown in section 4.2.3.1, and the growth rate
constant (µ) and doubling time (td) of all the strains tested in this study are
presented in Table 4-5. Based on the calculations, C3091 had longer doubling
time (41 min) compared to the rest of the strains, which was about 34-39 min
upon cultivation in TSB (Figure 4-9A). Whilst, strain Kpneu_1, and C3091 had
the longest doubling time, which was about 114 min (113 -115 min) upon
cultivation in AUM (Figure 4-9B). This was followed by strain Kpneu_64 and
Kpneu_110 which was about 101 min (100 – 102 min) and strain Kpneu_63
which was 92 min. Strain CG43S3 had a shortest doubling time upon growth
in AUM which was about 71 min.
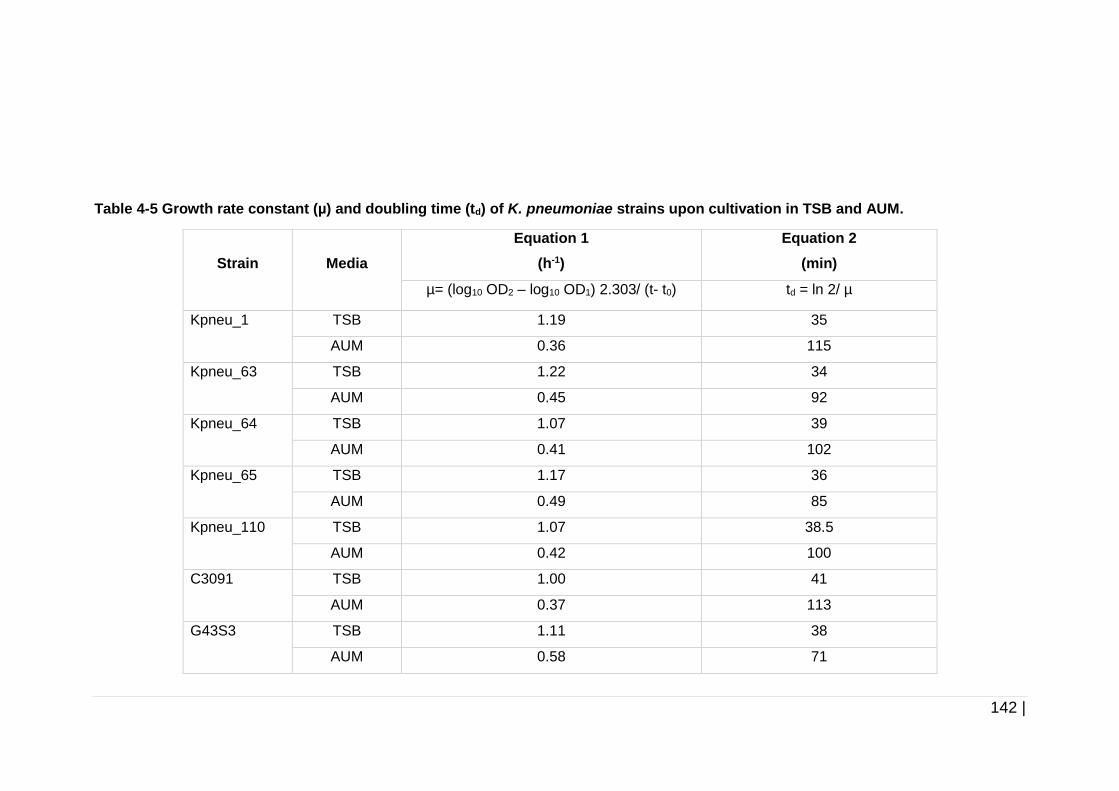
142 |
Table 4-5 Growth rate constant (µ) and doubling time (td) of K. pneumoniae strains upon cultivation in TSB and AUM.
Strain
Media
Equation 1
(h-1)
Equation 2
(min)
µ= (log10 OD2 – log10 OD1) 2.303/ (t- t0) td = ln 2/ µ
Kpneu_1 TSB 1.19 35
AUM 0.36 115
Kpneu_63 TSB 1.22 34
AUM 0.45 92
Kpneu_64 TSB 1.07 39
AUM 0.41 102
Kpneu_65 TSB 1.17 36
AUM 0.49 85
Kpneu_110 TSB 1.07 38.5
AUM 0.42 100
C3091 TSB 1.00 41
AUM 0.37 113
G43S3 TSB 1.11 38
AUM 0.58 71
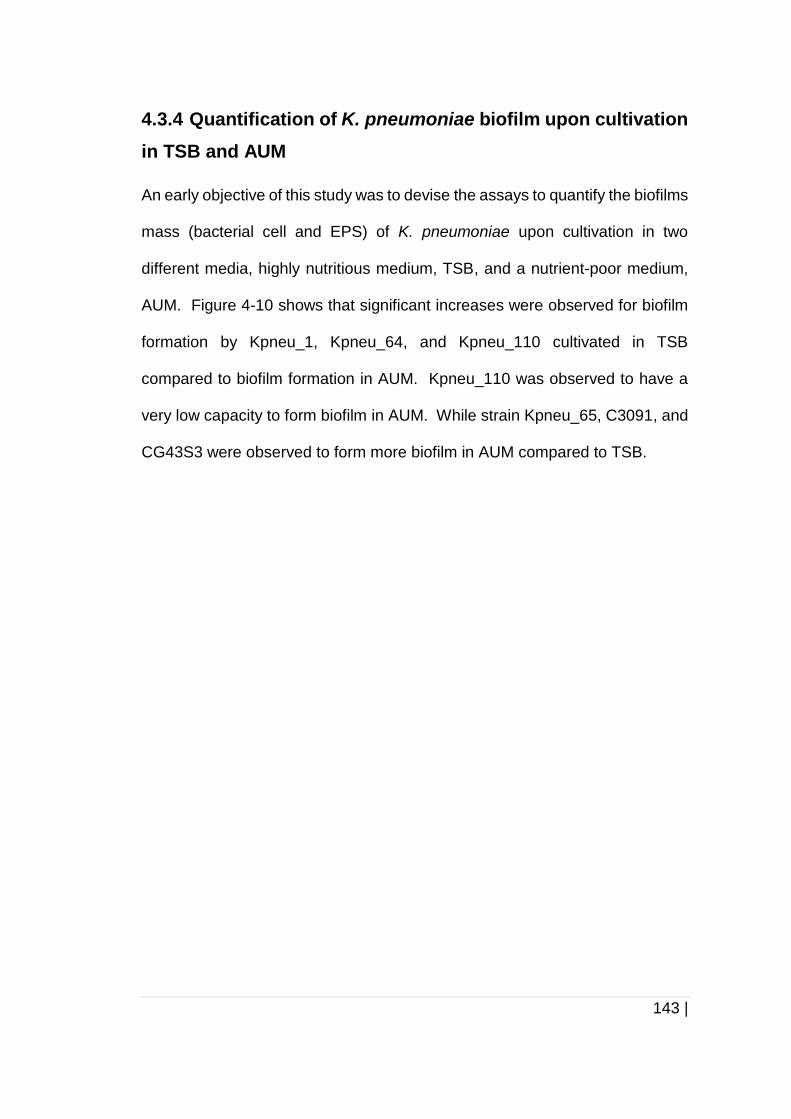
143 |
4.3.4 Quantification of K. pneumoniae biofilm upon cultivation
in TSB and AUM
An early objective of this study was to devise the assays to quantify the biofilms
mass (bacterial cell and EPS) of K. pneumoniae upon cultivation in two
different media, highly nutritious medium, TSB, and a nutrient-poor medium,
AUM. Figure 4-10 shows that significant increases were observed for biofilm
formation by Kpneu_1, Kpneu_64, and Kpneu_110 cultivated in TSB
compared to biofilm formation in AUM. Kpneu_110 was observed to have a
very low capacity to form biofilm in AUM. While strain Kpneu_65, C3091, and
CG43S3 were observed to form more biofilm in AUM compared to TSB.
144 |
Figure 4-10 Biofilm formation by K. pneumoniae in TSB and AUM.
The figure shows biofilm formation by K. pneumoniae in TSB and AUM upon
incubation at 37 °C for 24 h under shaking conditions. Bars show the average
absorbance obtained using the CV staining assays from three independent
experiments. The data was analysed by a Mann-Whitney non-parametric test. Error
bars indicate standard deviation of n = 15. Significant increases were observed for
biofilm formation by strain Kpneu_1, Kpneu_64, and Kpneu_110, cultivated in TSB
compared to AUM, while strain Kpneu_65, C3091, and CG43S3 were observed to
form more biofilms in AUM compared to TSB. There was no significant difference
found for strain Kpneu_63 upon cultivation in both media. Statistical significance is
indicated by * represents p < 0.05, ** represents p < 0.01, *** represents p < 0.001
and **** represents p < 0.0001.
145 |
4.3.5 Biofilm inhibition and disruption assays
In order to study the components of K. pneumoniae biofilm EPS upon
cultivation in two different media, biofilm inhibition and biofilm disruption
assays were conducted. Proteinase K, DNase, and cellulase were used in
both of the assays, while NaIO4 was only used in the disruption assays.
Proteinase K catalyses the hydrolysis of peptide bonds in peptide or protein
substrates (Saenger, 2013). Cellulase catalyses the breakdown of cellulose
into glucose by endohydrolysis of the β-(1-4)-D glucosidic linkages in cellulose
(Liao, et al. , 2011). While, DNase I catalyses the endonucleolytic cleavage of
substrate to yield 5’-phosphodinucleotide and 5’-phosphooligonucleotide end
products (Kishi, et al. , 2001).
The biofilm inhibition assays were conducted by incubating the culture in
control medium (without any enzymes) or in medium with these particular
enzymes in 96-well microtitre plates. The culture was then incubated at 37 °C
for 24 h. The biofilm disruption assays were conducted by treating the 24 h
pre-formed biofilms with proteinase K, DNase, cellulase or NaIO4. The treated
biofilms were then incubated at 37 °C for 3 h or 1 h for proteinase K and DNase,
respectively, at 48 °C for 24 h for cellulase, and at 4 °C for 24 h for NaIO4.
Pre-formed biofilms incubated in buffer only (without any enzymes or NaIO4)
acted as controls.
146 |
4.3.5.1 Effect of 100 µg/ml proteinase K on biofilm
formation and on 24 h pre-formed biofilms
The biofilm inhibition assays (Figure 4-11A and Figure 4-11B) in the presence
of 100 µg/ml of proteinase K showed that biofilm formation by Kpneu_1
cultivated in TSB and biofilm formation by Kpneu_63, Kpneu_65, C3091, and
CG43S3 cultivated in AUM was significantly lower in the presence of
proteinase K (100 µg/ml) compared to controls. Whilst, biofilm formation by
Kpneu_110 was significantly increased upon cultivation in TSB in the presence
of proteinase K (100 µg/ml). The biofilm disruption assays (Figure 4-11C and
Figure 4-11D) showed that apart from Kpneu_110 and CG43S3, pre-formed
biofilms of Kpneu_1, Kpneu_63, Kpneu_64, Kpneu_65, and C3091 in TSB
were significantly disturbed upon treatment with proteinase K (100 µg/ml).
While upon cultivation in AUM, pre-formed biofilms of Kpneu_65 and
Kpneu_110 were observed to be disrupted by proteinase K.
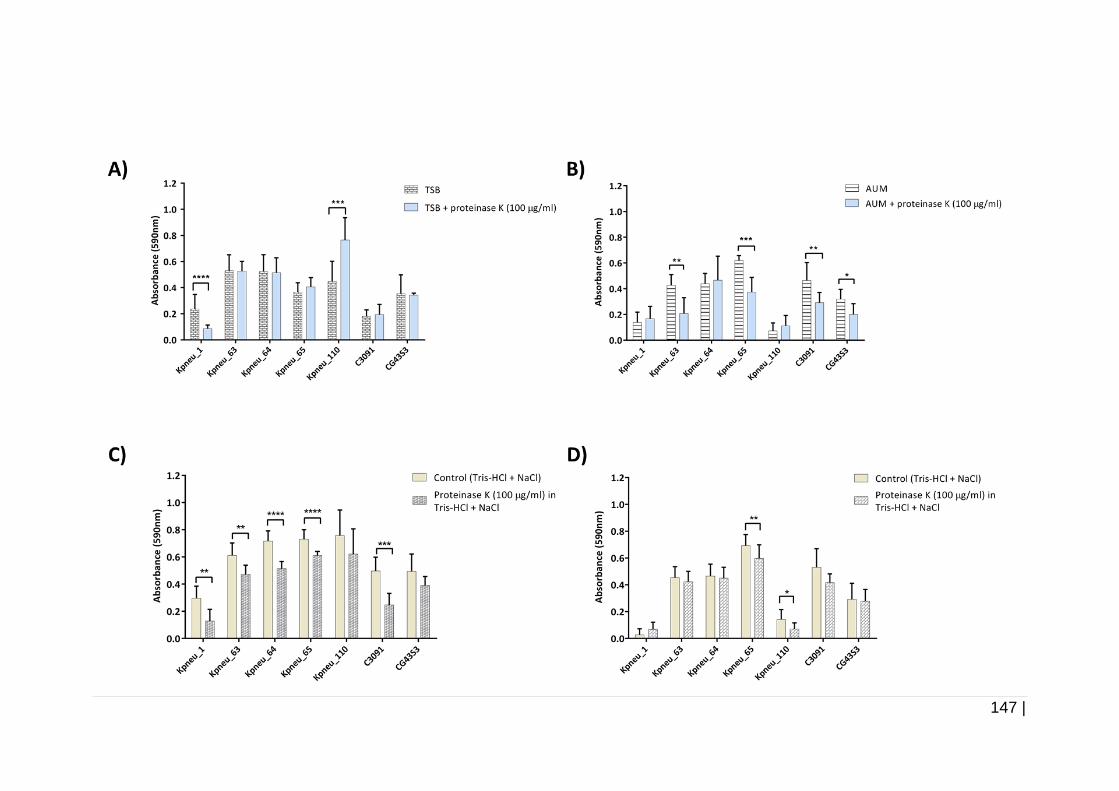
147 |
148 |
Figure 4-11 Biofilm inhibition and disruption assays in the presence of 100 µg/ml proteinase K.
The graph shows biofilm inhibition assays of K. pneumoniae cultivated in A) TSB and B) AUM in the presence of proteinase K (100 g/ml)
incubated at 37 °C for 24 h, and disruption of pre-formed biofilms cultivated in C) TSB and D) AUM upon treatment with proteinase K (100 g/ml)
at 37 °C for 3 h. Bars show average absorbance readings using the CV assays from three independent experiments. The data was analysed by
a Mann-Whitney non-parametric test. Error bars indicate standard deviation of nine replicates. Kpneu_1 was observed to have significantly lower
biofilm formation and Kpneu_110 showed significantly higher biofilm formation upon cultivation in TSB in the presence of proteinase K (100 g/ml)
compared to control. While Kpneu_63, Kpneu_65, C3091 and CG43S3 had significantly lower biofilms upon cultivation in AUM in the presence
of proteinase K (100 g/ml) in comparison to controls. The biofilm disruption assays demonstrated that pre-formed biofilms of Kpneu_1,
Kpneu_63, Kpneu_64, Kpneu_65, and C3091 in TSB were significantly reduced as well as pre-formed biofilm of Kpneu_65 and Kpneu_110 in
AUM upon treatment with proteinase K (100 g/ml) compared to controls. Statistical significance is indicated by * represents p < 0.05,
** represents p < 0.01, *** represents p < 0.001 and **** represents p < 0.0001.
149 |
4.3.5.2 Effect of 100 µg/ml of DNase on biofilm formation
and on 24 h pre-formed biofilms
Since it is established that eDNA has an important role in stabilising the biofilm
structure in other bacterial species, e.g. P. aeruginosa (Whitchurch, et al.,
2002), we also investigated its role in biofilm formation and on pre-formed
biofilms of K. pneumoniae. Biofilm formation by Kpneu_63 and C3091 was
significantly increased upon cultivation in TSB in the presence of
100 µg/ml of DNase (Figure 4-12A), while biofilm formation by Kpneu_65 was
significantly reduced upon cultivation in AUM in the presence of 100 µg/ml of
DNase compared to controls (Figure 4-12B). The treatment of pre-formed
Kpneu_110 biofilms with 100 µg/ml of DNase resulted in a significantly higher
CV absorbance readings compared to controls, whereas, treatment of pre-
formed C3091 biofilms with 100 µg/ml of DNase exhibited a significant
reduction of the pre-formed biofilm in comparison to the control group (Figure
4-12C and Figure 4-12D). Our result suggested that eDNA possibly play a
significant role in biofilm formation by Kpneu_65 upon cultivation in AUM and
it is also suggested that eDNA possibly acts as a major composition in pre-
formed biofilms of C3091 upon cultivation in AUM.
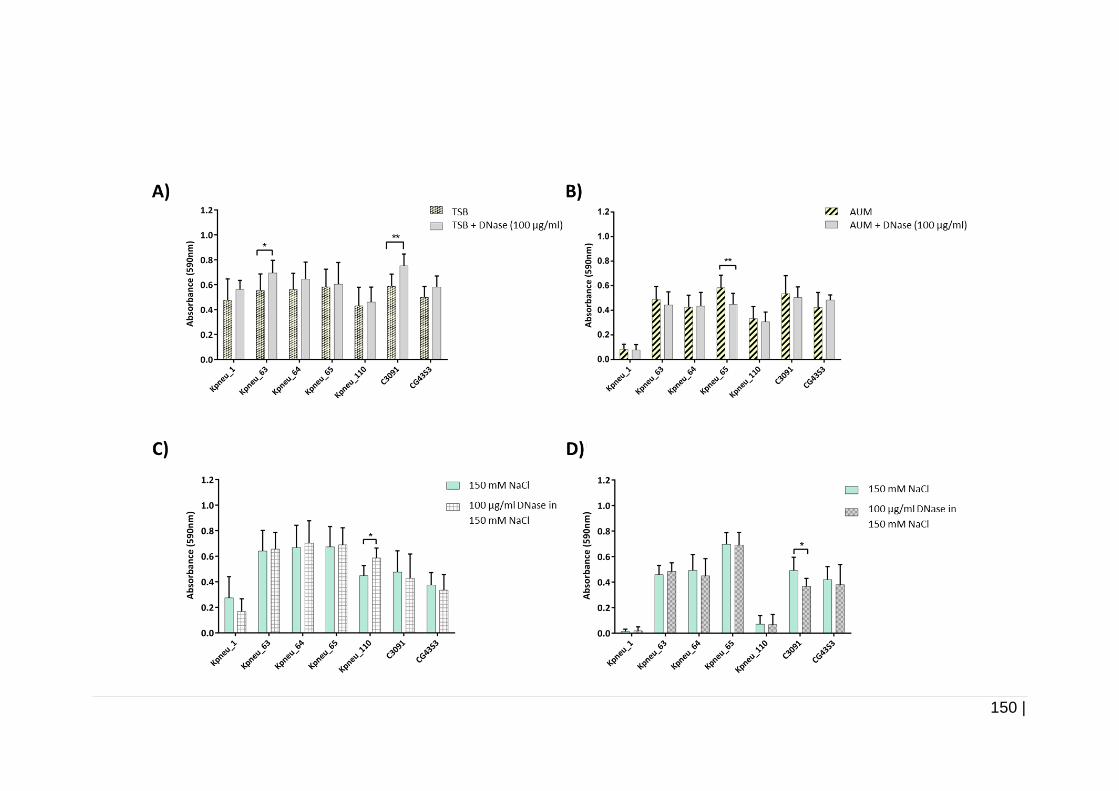
150 |
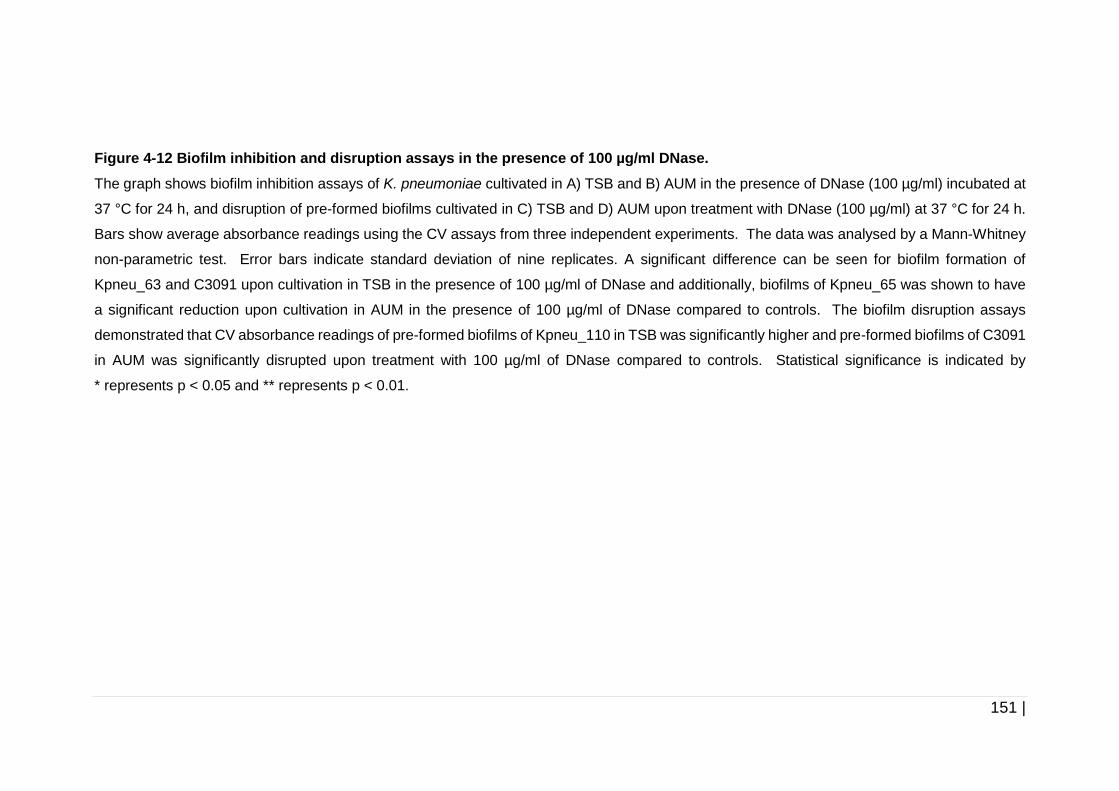
151 |
Figure 4-12 Biofilm inhibition and disruption assays in the presence of 100 µg/ml DNase.
The graph shows biofilm inhibition assays of K. pneumoniae cultivated in A) TSB and B) AUM in the presence of DNase (100 µg/ml) incubated at
37 °C for 24 h, and disruption of pre-formed biofilms cultivated in C) TSB and D) AUM upon treatment with DNase (100 µg/ml) at 37 °C for 24 h.
Bars show average absorbance readings using the CV assays from three independent experiments. The data was analysed by a Mann-Whitney
non-parametric test. Error bars indicate standard deviation of nine replicates. A significant difference can be seen for biofilm formation of
Kpneu_63 and C3091 upon cultivation in TSB in the presence of 100 µg/ml of DNase and additionally, biofilms of Kpneu_65 was shown to have
a significant reduction upon cultivation in AUM in the presence of 100 µg/ml of DNase compared to controls. The biofilm disruption assays
demonstrated that CV absorbance readings of pre-formed biofilms of Kpneu_110 in TSB was significantly higher and pre-formed biofilms of C3091
in AUM was significantly disrupted upon treatment with 100 µg/ml of DNase compared to controls. Statistical significance is indicated by
* represents p < 0.05 and ** represents p < 0.01.
152 |
4.3.5.3 Effect of NaIO4 on 24 h pre-formed biofilms
We then assayed the sensitivity of pre-formed biofilms produced by the
K. pneumoniae strains to NaIO4, which is known to cause disruption of
polysaccharides in biofilm by oxidising the carbon to carbon bond at vicinal
diols in carbohydrate rings (Meile, et al. , 2014). The results showed that the
CV absorbance of the pre-formed biofilms of all seven strains cultivated in TSB
were significantly higher upon treatment with NaIO4 (Figure 4-13A) compared
to controls. Whereas, only five of the seven strains, CV absorbance of the pre-
formed biofilm was significantly higher upon treatment of pre-formed biofilm
cultivated in AUM with NaIO4 (Figure 4-13B). Our result shows that treatment
of pre-formed biofilm with NaIO4 upon cultivation in TSB and AUM could
possibly effect the polysaccharides in the biofilms of K. pneumoniae, even
though, no reduction of pre-formed biofilm was observed upon the treatment.
This is clearly shown by the highly significant higher CV absorbance value
post-treatment of pre-formed biofilm with NaIO4 for all the strains upon
cultivation in TSB as well as upon cultivation in AUM except for strain Kpneu_1
and Kpneu_110. Further explanation is discussed in the discussion.
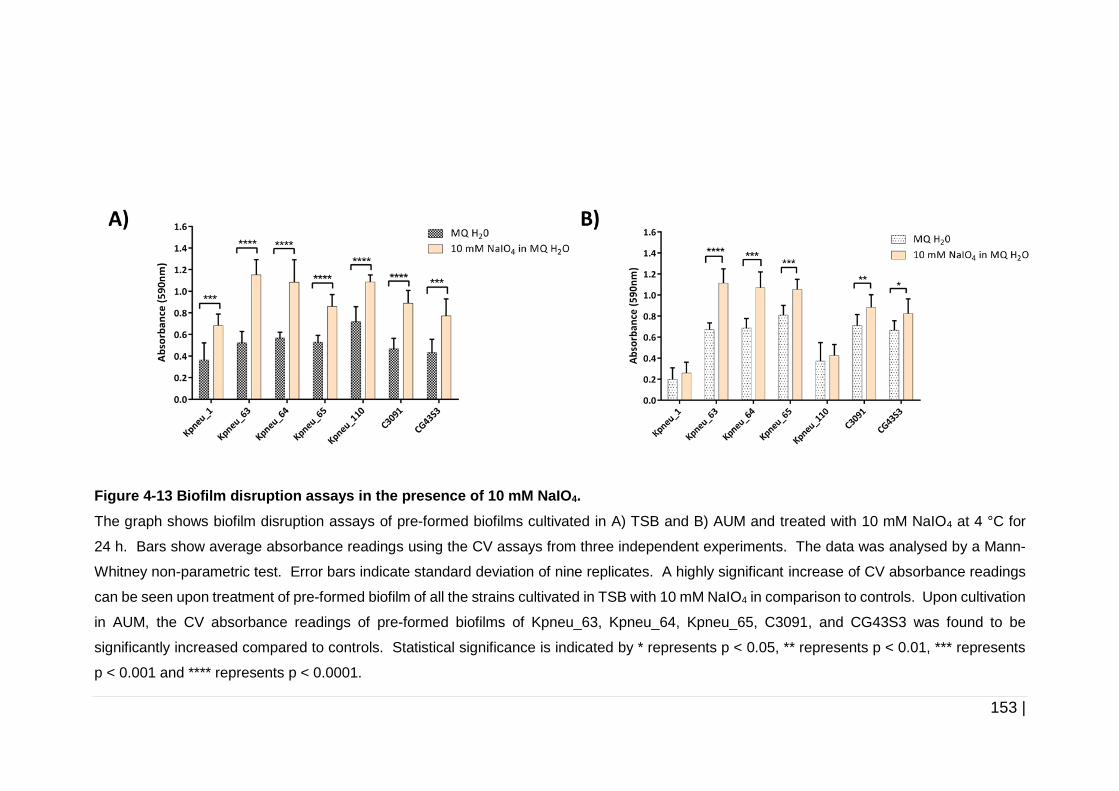
153 |
Figure 4-13 Biofilm disruption assays in the presence of 10 mM NaIO4.
The graph shows biofilm disruption assays of pre-formed biofilms cultivated in A) TSB and B) AUM and treated with 10 mM NaIO4 at 4 °C for
24 h. Bars show average absorbance readings using the CV assays from three independent experiments. The data was analysed by a Mann-
Whitney non-parametric test. Error bars indicate standard deviation of nine replicates. A highly significant increase of CV absorbance readings
can be seen upon treatment of pre-formed biofilm of all the strains cultivated in TSB with 10 mM NaIO4 in comparison to controls. Upon cultivation
in AUM, the CV absorbance readings of pre-formed biofilms of Kpneu_63, Kpneu_64, Kpneu_65, C3091, and CG43S3 was found to be
significantly increased compared to controls. Statistical significance is indicated by * represents p < 0.05, ** represents p < 0.01, *** represents
p < 0.001 and **** represents p < 0.0001.
154 |
4.3.5.4 Effect of cellulase on biofilm formation and on 24 h
pre-formed biofilms
Since our data shows that NaIO4 could possibly affect polysaccharides in
biofilms of K. pneumoniae, we then tried to identify the polysaccharides.
Cellulase was tested to determine the effect on biofilm formation by
K. pneumoniae and on pre-formed biofilms. Biofilm inhibition assays in the
presence of 0.1 % cellulase and treatment of pre-formed biofilms with
0.1 % cellulase were conducted. The biofilm inhibition assays in the presence
of 0.1 % cellulase (Figure 4-14A and Figure 4-14B) showed that biofilm
formation by C3091 upon cultivation in TSB and biofilm formation by Kpneu_63
and Kpneu_110 upon cultivation in AUM were significantly increased in the
presence of 0.1 % cellulase compared to controls. No significant reduction in
biofilm formation was observed upon growth in both media in the presence of
0.1 % cellulase. The treatment of pre-formed biofilms with 0.1 % cellulase was
observed to significantly disrupt the pre-formed biofilm of Kpneu_64 and
Kpneu_65 upon cultivation in TSB, and pre-formed biofilm of Kpneu_63 and
Kpneu_64 upon cultivation in AUM in comparison to the controls (Figure 4-14C
and Figure 4-14D).
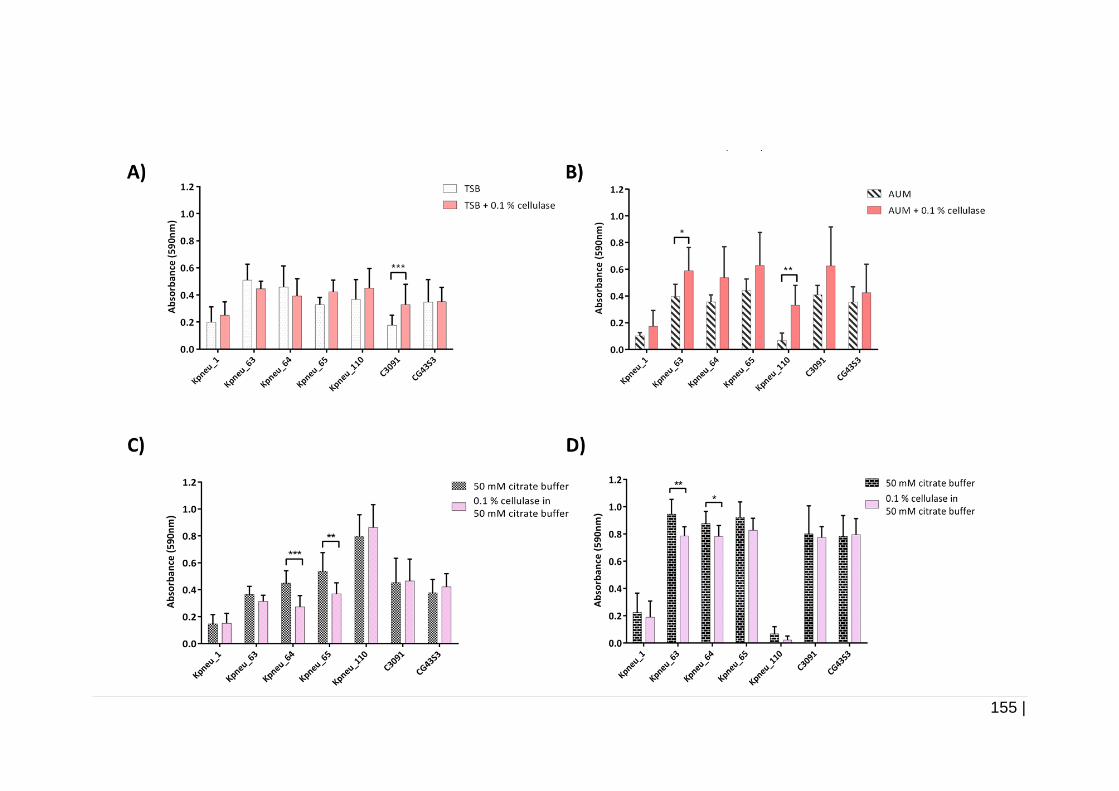
155 |
156 |
Figure 4-14 Biofilm inhibition and disruption assays in the presence of 0.1 % cellulase.
The graph shows biofilm inhibition assays of K. pneumoniae cultivated in A) TSB and B) AUM in the presence of 0.1 % cellulase incubated at
37 °C for 24 h, and disruption of pre-formed biofilms cultivated in C) TSB and D) AUM upon treatment with 0.1 % cellulase at 45 °C for 24 h. Bars
show average absorbance readings using the CV assays from three independent experiments. The data was analysed by a Mann-Whitney non-
parametric test. Error bars indicate standard deviation of nine replicates. Biofilm formation of C3091 upon cultivation in TSB and biofilm formation
of Kpneu_63 and Kpneu_110 upon cultivation in AUM were observed to be significantly increased in the presence of 0.1 % cellulase compared
to controls. The biofilm disruption assays demonstrated that pre-formed biofilms of Kpneu_64 and Kpneu_65 in TSB were significantly disrupted
as well as pre-formed biofilm of Kpneu_63 and Kpneu_64 in AUM upon treatment with 0.1 % cellulase in comparison to the controls. Statistical
significance is indicated by * represents p < 0.05, ** represents p < 0.01 and *** represents p < 0.001.
157 |
4.4 Discussion
In the study described in this chapter, the components of K. pneumoniae
biofilms EPS were investigated upon cultivation in two different media, TSB
and AUM in 96-well microtitre plates. The planktonic growth kinetics of all the
strains were determined prior to biofilm assays. The mid-log phase in TSB
was observed about 2 h into growth and was equal to ~109 CFU/ml. Our data
is in accordance with several previous findings that measure the growth rate
of K. pneumoniae upon cultivation in TSB. For example, studies by Dulek, et
al. (2014) and Tsao, et al. (2015) mentioned that K. pneumoniae reached mid-
log phase after 2 h incubation at 37 °C in TSB and that an OD600 of 1 was
equal to 109 CFU/ml, respectively. In addition, less growth of the
K. pneumoniae strains was observed upon cultivation in AUM compared to
TSB and the duration for the bacteria to reach the mid-log phase was longer
in AUM than in TSB.
The AUM was developed by Brooks, et al. (1997). This AUM was designed to
correspond to the median values for electrolytes found in diluted human urine.
We did a modification by supplementing a very low concentration of glucose
and other sugar components such as sucrose and lactose, some additional
amino acids, and vitamins.
Since K. pneumoniae is a urease-producing species, growth limitation also
could probably be due to the catabolism of urea that causes a rise in pH and
slows down the growth of the K. pneumoniae strains used in this study (Tsuji,
et al. , 1982). Since all of the tested strains harbour a ure operon (data not
158 |
shown), they were predicted to catalyse the hydrolysis of urea (H2NCONH2) to
ammonia (NH3)2 by producing urease. Further production of ammonium
(NH4)2 ions would increase the pH of the AUM. At alkaline pH, trivalent
phosphate ions (PO4)3- are formed in urine, which then combine with water
(H2O), ammonium ions (NH4)+, and magnesium ions (Mg+) to form magnesium
ammonium phosphate (MgNH4PO4.H2O) or struvite. The trivalent phosphate
ions (PO4)3- could also combine with calcium ions (Ca2+) and CO32- to produce
carbonate apatite (Ca10(PO4)6CO3. Both of these compounds result in the
formation of calculi in catheters (Thomas, et al. , 2008).
In this study, we hypothesised that cellulose and PNAG might be amongst the
polysaccharides that play a role in K. pneumoniae biofilms (Chen, et al., 2014;
Wang, et al., 2016). In order to confirm the existence of the genes that encode
for the proteins that are involved in the synthesis of these polysaccharides in
the genome of all tested strains, we analysed and conducted a comparative
analysis of these polysaccharide biosynthetic gene clusters. The operons
examined were the bcs cluster which contains three operons and the pga
operon. The proteins encoded by the genes in bcs operon are established to
contribute to cellulose biosynthesis (Römling, et al., 2015) while the proteins
encoded by the genes in pga operon are known to be involved in synthesis of
PNAG. Cellulose biosynthetic gene clusters consist of three operons, bcsI,
bcsII and bEFG, while the PNAG biosynthetic gene cluster consists of one
pgaABCD operon. Apart from K. pneumoniae, cellulose was also shown to be
involved in biofilm formation of other bacterial species, e.g. E. coli. A previous
study showed that an E. coli 1094bcsC mutant lost its capacity to form biofilm
in microfermentors (Da Re, et al. , 2006).
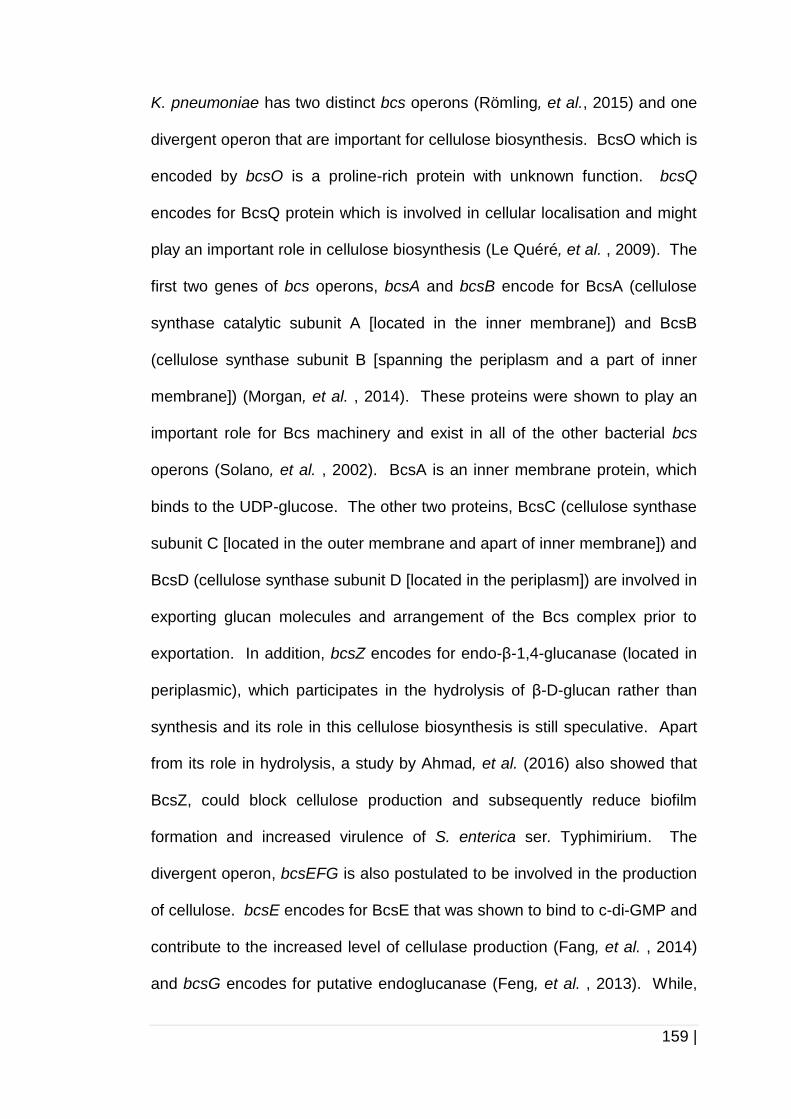
159 |
K. pneumoniae has two distinct bcs operons (Römling, et al., 2015) and one
divergent operon that are important for cellulose biosynthesis. BcsO which is
encoded by bcsO is a proline-rich protein with unknown function. bcsQ
encodes for BcsQ protein which is involved in cellular localisation and might
play an important role in cellulose biosynthesis (Le Quéré, et al. , 2009). The
first two genes of bcs operons, bcsA and bcsB encode for BcsA (cellulose
synthase catalytic subunit A [located in the inner membrane]) and BcsB
(cellulose synthase subunit B [spanning the periplasm and a part of inner
membrane]) (Morgan, et al. , 2014). These proteins were shown to play an
important role for Bcs machinery and exist in all of the other bacterial bcs
operons (Solano, et al. , 2002). BcsA is an inner membrane protein, which
binds to the UDP-glucose. The other two proteins, BcsC (cellulose synthase
subunit C [located in the outer membrane and apart of inner membrane]) and
BcsD (cellulose synthase subunit D [located in the periplasm]) are involved in
exporting glucan molecules and arrangement of the Bcs complex prior to
exportation. In addition, bcsZ encodes for endo-β-1,4-glucanase (located in
periplasmic), which participates in the hydrolysis of β-D-glucan rather than
synthesis and its role in this cellulose biosynthesis is still speculative. Apart
from its role in hydrolysis, a study by Ahmad, et al. (2016) also showed that
BcsZ, could block cellulose production and subsequently reduce biofilm
formation and increased virulence of S. enterica ser. Typhimirium. The
divergent operon, bcsEFG is also postulated to be involved in the production
of cellulose. bcsE encodes for BcsE that was shown to bind to c-di-GMP and
contribute to the increased level of cellulase production (Fang, et al. , 2014)
and bcsG encodes for putative endoglucanase (Feng, et al. , 2013). While,
160 |
the function of the protein encoded by bcsF is still unknown (Ahmad, et al.,
2016).
Bioinformatic analysis revealed that one of the weak biofilm formers, Kpneu_1
had defects in bcsB_I and bcsC_I. These defects were caused by a 5 bp
insertion and a deletion of 52 bp in bcsB_I and bcsC_I respectively
(Figure 4-4 and Figure 4-5). These would result in a truncated BcsB_I and
BcsC_I proteins. Due to the fact that BcsB and BcsC proteins play an
important role in cellulose synthesis, the differences in the bcs operon I of
Kpneu_1 compared to the other strains could be why it formed less biofilms.
Other than a truncated BcsO in CG43S3, and truncated BcsB_I and BcsC_I in
Kpneu_1, we also identified truncated BcsQ in Kpneu_63 and Kpneu_64. We,
however, were unable to confirm the relationship between truncated BcsQ and
cellulose biosynthesis in K. pneumoniae since very little information is known
regarding mechanisms of cellulose synthesis in K. pneumoniae and this needs
further experiment to confirm its function.
Since Kpneu_110 is a UTI isolate, it is unclear why Kpneu_110 had less
capacity to form biofilm but could grow very well, at about the same rate as
Kpneu_64 upon cultivation in AUM (Figure 4-9). Another isolate, C3091, which
was originally isolated from a UTI patient, however, was seen to have more
biofilm upon cultivation in AUM compared to TSB. We hypothesised that AUM
might not be suitable for Kpneu_110 to form biofilms compared to in human
urine. Human urine is known to have some natural constituents including
hormones, iron chelators, pyrophosphates (Ipe, et al. , 2016) and proteins
which could promote the growth of K. pneumoniae and facilitate biofilm
161 |
formation by this pathogen in the urinary tract, which are lacking in AUM. As
human urine has its own natural proteins that do not exist in AUM, this could
be one of the reasons that resulted in less capacity of several strains such as
Kpneu_1 and Kpneu_110 to form biofilms under laboratory conditions in this
artificial environment. For example, Tamm-Horsfall protein (THP) also known
as uromodulin, is the most abundant protein in urine. THP is involved in natural
resistance of humans to uropathogenic bacteria. THP has been shown to bind
to > 90 % of E. coli isolates from UTI patients (Wu, et al. , 1996), and it can
bind specifically to type 1 fimbriated E. coli (Pak, et al. , 2001). THP is a
polymeric glycoprotein which is produced in the thick ascending limb of the
Loop of Henle in renal tissue (Serafini-Cessi, et al. , 2003). Uropathogenic
bacteria have been shown to bind to THP and as a result are flushed from the
human urinary tract by urination (Dou, et al. , 2005). A previous study has also
shown that THP enhances the adherence of E. coli on silicone and latex
catheters (Raffi, et al. , 2012). Lack of THP in AUM could be the reason why
the biofilm formation by Kpneu_1 and Kpneu_110 was found to be low in AUM.
Furthermore, since UTIs cases are not always associated with biofilms and
catheters, it is not necessarily for this strain to have a high capacity to form
biofilms in AUM. This could be another reason why the biofilm formation by
Kpneu_110 was found to be very low in AUM, even though it was isolated from
UTI patient.
Little is known regarding the biofilm matrix composition of K. pneumoniae in
different media. We investigated some of the components of K. pneumoniae
biofilms upon cultivation in TSB and AUM by conducting a biofilm inhibition
and disruption assays. Our data showed that 100 µg/ml of proteinase K
162 |
inhibited biofilm formation by Kpneu_1 upon cultivation in TSB and biofilm
formation by Kpneu_63, Kpneu_65, C3091, and CG43S4 upon cultivation in
AUM. Intriguingly, biofilm formation by Kpneu_110 was significantly increased
after cultivation in TSB in the presence of proteinase K. The supportive effect
of proteinase K on Kpneu_110 biofilms was very significant and to the best of
our knowledge, no publications have shown such an effect with
K. pneumoniae. Why this occurred is unknown but we speculate that it could
be that the proteinase K possibly cleaves self-secreted extracellular dispersion
enzyme or signalling molecules resulting in increased biofilm formation by
Kpneu_110. Several previous publications have described a number of self-
secreted extracellular dispersion enzymes by various pathogens, for example,
β-N-acetylglucosaminidase or dispersin B (DspB) that is produced by
A. actinomycetemcomitans. This enzyme was shown to degrade PNAG
structure that facilitates the cell-cell cohesion in biofilms (Kaplan, et al., 2003).
A study by Gilan, et al. (2013) also showed the supportive effect of
proteinase K on biofilm formation. 1 mg/ml of proteinase K was shown to
enhance biofilm formation by Rhodococcus ruber upon growth in minimal salts
medium, increased multi-layered structure of R. ruber biofilms.
We also treated the 24 h pre-formed biofilm with proteinase K to determine
whether protein is a major constituent of K. pneumoniae biofilms. Apart from
Kpneu_110 and CG43S3, treatment of pre-formed biofilm with
100 µg/ml of proteinase K was found to disrupt the pre-formed biofilms of the
rest of the strains upon cultivation in TSB, and also strain Kpneu_65 and
Kpneu_110 upon cultivation in AUM. Our findings are in agreement with a
previous finding which suggested that protein content in EPS of
163 |
K. pneumoniae strain Kp703 biofilms was shown to be relatively high at about
65 %, in comparison to the other EPS components such as eDNA and PNAG
upon cultivation in MH broth (Bandeira, et al., 2017).
Based on these results, proteins could possibly play a role in initial adhesion
or biofilm structure of K. pneumoniae in both media. The biofilms formation
was shown to be inhibited and the mature biofilms of most strains were
disrupted upon treatment with proteinase K. We hypothesised that 100 µg/ml
of proteinase K might degrade the proteinaceous appendages on
K. pneumoniae surface or other matrix components that act as adhesins to
attach on the surfaces.
Besides proteins, extracellular DNA (eDNA) has also been established to be
structural components of the biofilm matrix of many Gram-negative and Gram-
positive bacteria (Okshevsky, et al. , 2014). A study by Whitchurch, et al.
(2002), for example, demonstrated that addition of DNase I in M63 medium
supplemented with 1 mM MgCl2 and 0.5 % casamino acid prevented biofilm
formation by P. aeruginosa in microtiter plates. The results presented in this
chapter show that eDNA involvement in biofilm formation by K. pneumoniae is
strain dependent. On one hand, DNase treatment resulted in increased biofilm
formation by Kpneu_63 and C3091 upon cultivation in TSB. On the other
hand, DNase was shown to inhibit biofilm formation by Kpneu_65 upon
cultivation in AUM.
We also investigated the effect of DNase on 24 h old biofilms of
K. pneumoniae. The data showed that eDNA involvement in biofilm EPS of
164 |
K. pneumoniae is also strain dependent. Pre-formed biofilms of C3091 were
disrupted upon treatment with DNase compared to the untreated groups. This
observation is in line with a previous publication by Tetz, et al. (2009) that
showed that treatment of 24 h pre-formed biofilm of K. pneumoniae with
5 µg/ml of DNase I disrupted the biofilm structure and increased the
penetration of antibiotics to the cells. Strain Kpneu_110 biofilms, however,
showed a slightly higher but statistically significant biofilm level upon CV
staining compared to untreated controls upon cultivation in TSB and the
reason for this is unclear.
Other than proteins and eDNA, we also investigated the role of
polysaccharides in K. pneumoniae biofilms. Upon treatment of pre-formed
biofilms grown in TSB with NaIO4, a highly significant increase of CV
absorbance readings was observed in comparison to the controls for all the
strains used in this study. Apart from Kpneu_1 and Kpneu_110, a highly
significant increase was also observed upon treatment of pre-formed biofilms
by NaIO4 for the rest of strains compared to controls upon cultivation in AUM.
We speculated the reason for the higher readings of CV absorbance for the
treated group could possibly be because of the chemical reaction of cleaved
polysaccharide complexes with CV. NaIO4 reacts by oxidising the carbons
bearing vicinal OH group. For examples, NaIO4 cleaves the C3-C4 bonds of
N-acetyl-glucosamine (Chaignon, et al. , 2007) and C2-C3 bonds of cellulose
structure (Figure 4-15) (D. Chen, et al. , 2016). This reaction results in a
modified chain and open ring with two aldehyde groups in the polysaccharides.
The details for the mechanism of periodate oxidation is shown in Appendix 1.
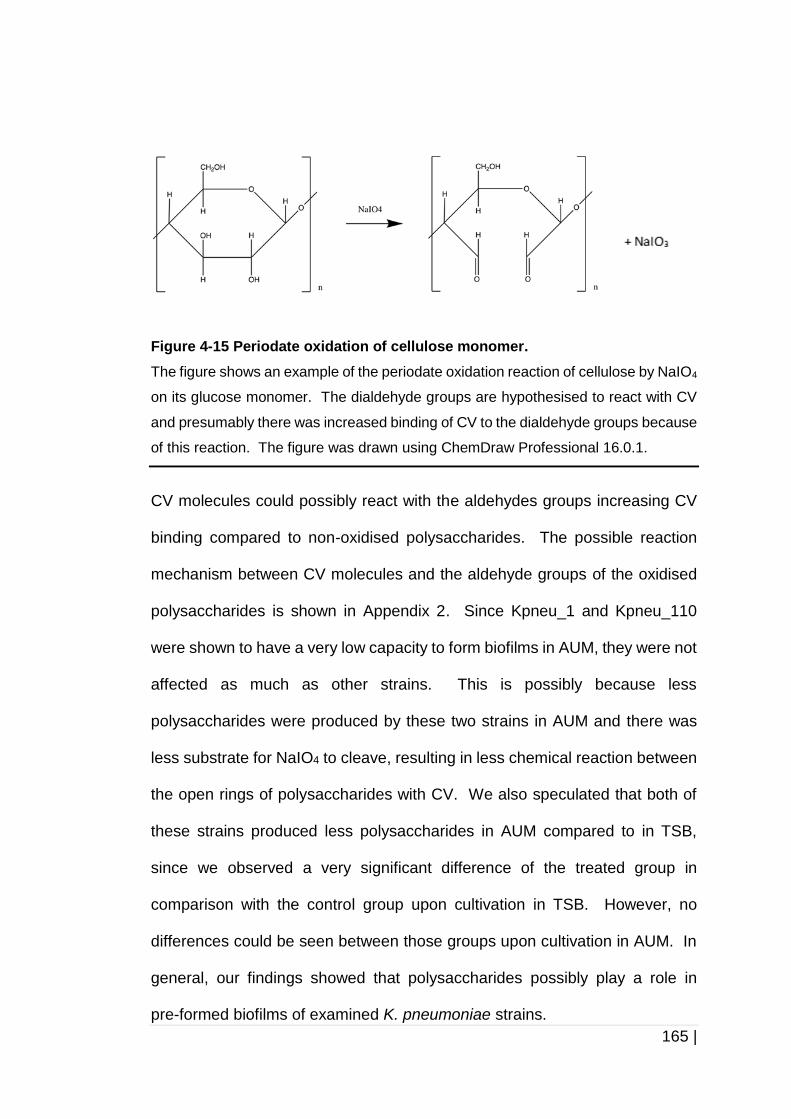
165 |
Figure 4-15 Periodate oxidation of cellulose monomer.
The figure shows an example of the periodate oxidation reaction of cellulose by NaIO4
on its glucose monomer. The dialdehyde groups are hypothesised to react with CV
and presumably there was increased binding of CV to the dialdehyde groups because
of this reaction. The figure was drawn using ChemDraw Professional 16.0.1.
CV molecules could possibly react with the aldehydes groups increasing CV
binding compared to non-oxidised polysaccharides. The possible reaction
mechanism between CV molecules and the aldehyde groups of the oxidised
polysaccharides is shown in Appendix 2. Since Kpneu_1 and Kpneu_110
were shown to have a very low capacity to form biofilms in AUM, they were not
affected as much as other strains. This is possibly because less
polysaccharides were produced by these two strains in AUM and there was
less substrate for NaIO4 to cleave, resulting in less chemical reaction between
the open rings of polysaccharides with CV. We also speculated that both of
these strains produced less polysaccharides in AUM compared to in TSB,
since we observed a very significant difference of the treated group in
comparison with the control group upon cultivation in TSB. However, no
differences could be seen between those groups upon cultivation in AUM. In
general, our findings showed that polysaccharides possibly play a role in
pre-formed biofilms of examined K. pneumoniae strains.
166 |
Since we could observe an increased in the CV absorbance value upon
treatment of pre-formed biofilms with NaIO4, we speculated that NaIO4 could
possibly oxidise the polysaccharides in biofilms of K. pneumoniae. To test the
hypothesis that polysaccharide could play a role in pre-formed biofilms by
K. pneumoniae, we investigated a possible role for one of the polysaccharides
that is suggested to be involved in biofilm formation by K. pneumoniae
(Huertas, et al., 2014). Cellulose was chosen as one of the potential
polysaccharides that could be produced by K. pneumoniae since four of our
strains were shown to have the complete bcs operons (Figure 4-1).
Cultivating the tested strains in TSB in the presence of 0.1 % cellulase showed
that cellulase induced biofilm formation by C3091. Two of the strains
(Kpneu_63 and Kpneu_110) also showed a significantly higher biofilm
formation upon the cultivation in AUM in the presence of 0.1 % cellulase. Even
though the rest of the five strains did not show any significant differences, but
the biofilm formation of these five strains was found to be relatively higher upon
cultivation in AUM in the presence of 0.1 % cellulase compared to control
groups. In addition, the growth of all of the strains used in this study was also
increased upon cultivation in AUM in the presence of 0.1 % cellulase upon
incubation for 24 h (data not shown).
We speculated that small amount of sorbitol which acted as preservative in the
cellulase solution could act as an extra carbon source (Bren, et al. , 2016) in
the AUM other than small amount of glucose, sucrose and lactose in AUM
itself. This hypothesis was made due to the fact that K. pneumoniae could
metabolise D-sorbitol (Brisse, et al., 2006). Furthermore, all of our
167 |
K. pneumoniae strains were shown to have a complete gutAEBDMRQ operon
which is important for D-sorbitol metabolism, upon analysis using Rapid
Annotation using Subsystem Technology (RAST) software (Aziz, et al. , 2008).
Figure 4-7 revealed that all of the strains had a complete predicted pga operon
which consists of four genes, pgaA, pgaB, pgaB, and pgaD. The pga operon
of the K. pneumoniae strains used in this study had similarity with the pga
operon of E. coli MG1655 (Chen, et al., 2014) and the genes in pga operon of
E. coli are known to contribute to biofilm formation by E. coli (Wang, et al.,
2004). Although we investigated the role of proteins, eDNA, and
polysaccharides such as cellulose in biofilm formation by K. pneumoniae, we,
however, have not confirmed the role of PNAG as one of the components of
K. pneumoniae biofilm EPS. Having the data that all the strains have the
complete pgaABCD operon, it suggested that K. pneumoniae could possibly
produce PNAG. Since PNAG has been shown to be involved in biofilm
formation by K. pneumoniae in the presence of bile salts (Chen, et al., 2014),
it would be beneficial to determine if PNAG has a role in biofilms in the
nutritious and nutrient-poor media. The role of PNAG in biofilm formation and
pre-formed biofilms can be tested by using the enzyme
β-acetylglucosaminidase, also known as dispersin B, and this should be
considered as a future direction for this research. This enzyme cleaves β-1,
6-glycosidic bond in N-acetylglucosamine polymer (Ramasubbu, et al. , 2005).
It should be noted that the findings presented in this chapter are based on
experiments, which were conducted in 96-well microtitre plates, and it is
possible that the EPS composition of the biofilm varies in different
168 |
environments. Taken together, although there were some common EPS
components produced by multiple strains of K. pneumoniae, our data
suggested that EPS composition and K. pneumoniae biofilms are strain
dependent. It not only varies between the bacterial strains but is also
dependent on the growth media.
4.5 Conclusion
All of the strains used in this study had a complete pga operon but several
strains were shown to have defects in genes in the bcsI operon. All of the
examined strains had the capacity to form biofilms in TSB. Apart from strain
Kpneu_110, all the strains were also found to have the capacity to form
biofilms in AUM. However, the amount of biofilm formed was strain specific
and Kpneu_110 had the lowest capacity to form biofilms in AUM. Proteins
were found to play a role in biofilm formation and were a component of pre-
formed biofilms of most of the strains used in this study. The role of eDNA in
biofilm formation and pre-formed biofilms was found to be strain dependent.
Treatment of pre-formed biofilms with NaIO4 may have oxidised some of the
polysaccharides in the biofilm matrix of K. pneumoniae but the specific
polysaccharides involved in biofilms of K. pneumoniae are still undetermined.
We also showed that cellulase in a liquid form with sorbitol as a preservative
is not suitable for biofilm inhibition assays in AUM.
169 |
Chapter 5.0
Investigation into the
orientation of the
Klebsiella pneumoniae
fim-switch which controls
expression of type 1 fimbriae
170 |
5.0 Investigation into the orientation of the
K. pneumoniae fim-switch which controls
expression of type 1 fimbriae
5.1 Introduction
In earlier work described in this thesis in Chapter 4, proteins were identified as
one of the components of K. pneumoniae biofilm EPS. There are quite a
number of proteins, which are speculated to be involved in biofilm formation
by K. pneumoniae and among them are fimbriae. Type 1 fimbriae (T1F) and
type 3 fimbriae (T3F) are known as the major fimbriae of K. pneumoniae. We
decided to investigate the role of T1F in biofilm formation by K. pneumoniae
since a role for T3F in biofilm formation by K. pneumoniae has already been
determined (Jagnow, et al. , 2003; Johnson, et al. , 2011). We hypothesised
that T1F could also be involved in biofilm formation by K. pneumoniae upon
cultivation in TSB and AUM. Cleavage of these surface-exposed proteins by
proteinase K would probably contribute to the disruption of pre-formed biofilm
of K. pneumoniae as described in chapter 4.
5.1.1 Major fimbriae of K. pneumoniae
T1F and T3F belong to the chaperone-usher class fimbriae family (Stahlhut,
et al., 2012). The chaperon-usher (CU) pathway of pilus biogenesis involves
the membrane-embedded assembly and secretion of the adhesive tips. This
CU secretion system is commonly clustered into an operon containing a
minimum of three genes encoding for essential proteins: a major fimbrial
subunit, a chaperone, and an usher protein. These operons also regularly
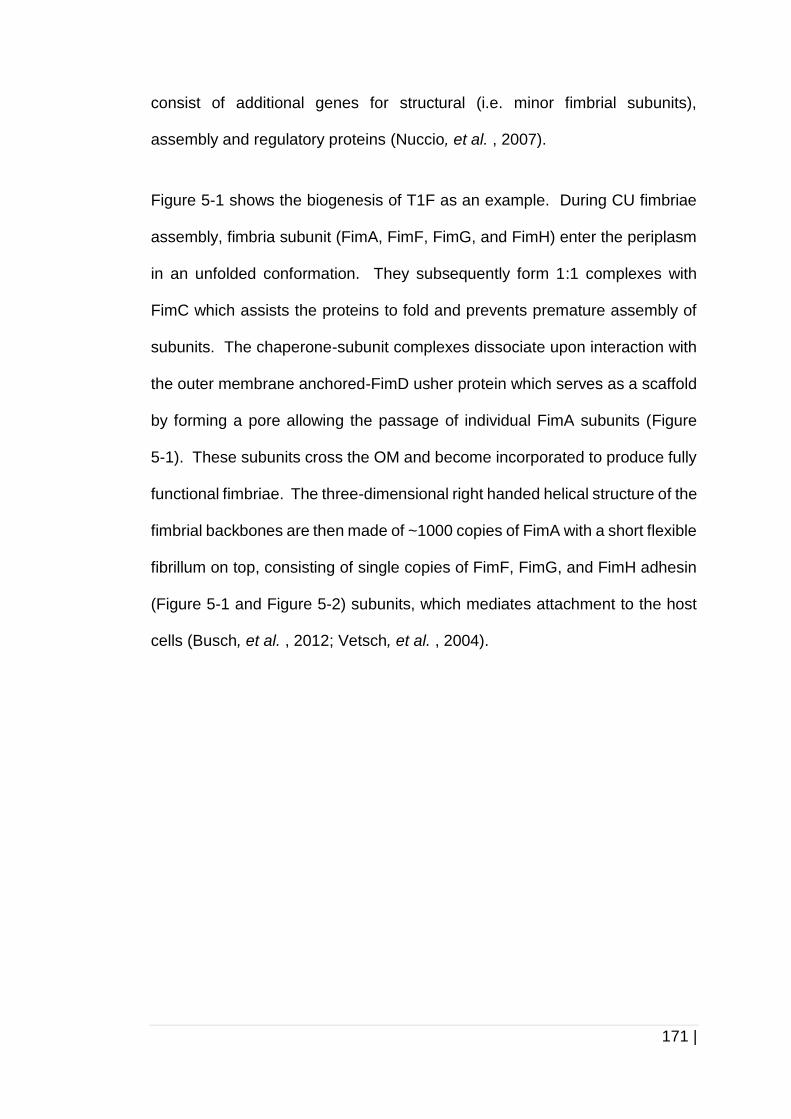
171 |
consist of additional genes for structural (i.e. minor fimbrial subunits),
assembly and regulatory proteins (Nuccio, et al. , 2007).
Figure 5-1 shows the biogenesis of T1F as an example. During CU fimbriae
assembly, fimbria subunit (FimA, FimF, FimG, and FimH) enter the periplasm
in an unfolded conformation. They subsequently form 1:1 complexes with
FimC which assists the proteins to fold and prevents premature assembly of
subunits. The chaperone-subunit complexes dissociate upon interaction with
the outer membrane anchored-FimD usher protein which serves as a scaffold
by forming a pore allowing the passage of individual FimA subunits (Figure
5-1). These subunits cross the OM and become incorporated to produce fully
functional fimbriae. The three-dimensional right handed helical structure of the
fimbrial backbones are then made of ~1000 copies of FimA with a short flexible
fibrillum on top, consisting of single copies of FimF, FimG, and FimH adhesin
(Figure 5-1 and Figure 5-2) subunits, which mediates attachment to the host
cells (Busch, et al. , 2012; Vetsch, et al. , 2004).
172 |
Figure 5-1 The chaperon-usher (CU) pathway of T1F biogenesis.
A schematic drawing of the T1F chaperone usher pathway as an example. IM: inner
membrane, OM: outer membrane. The figure is drawn and adapted from Vetsch, et
al. (2004) and Korea, et al. (2011).
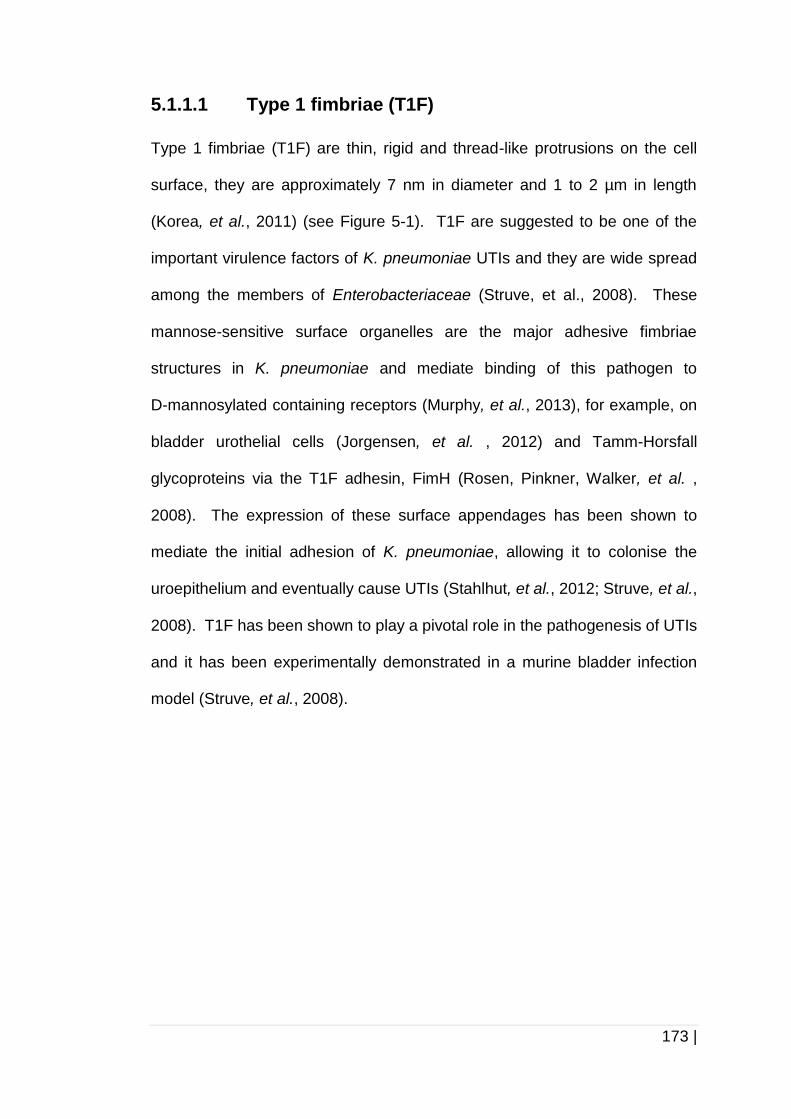
173 |
5.1.1.1 Type 1 fimbriae (T1F)
Type 1 fimbriae (T1F) are thin, rigid and thread-like protrusions on the cell
surface, they are approximately 7 nm in diameter and 1 to 2 µm in length
(Korea, et al., 2011) (see Figure 5-1). T1F are suggested to be one of the
important virulence factors of K. pneumoniae UTIs and they are wide spread
among the members of Enterobacteriaceae (Struve, et al., 2008). These
mannose-sensitive surface organelles are the major adhesive fimbriae
structures in K. pneumoniae and mediate binding of this pathogen to
D-mannosylated containing receptors (Murphy, et al., 2013), for example, on
bladder urothelial cells (Jorgensen, et al. , 2012) and Tamm-Horsfall
glycoproteins via the T1F adhesin, FimH (Rosen, Pinkner, Walker, et al. ,
2008). The expression of these surface appendages has been shown to
mediate the initial adhesion of K. pneumoniae, allowing it to colonise the
uroepithelium and eventually cause UTIs (Stahlhut, et al., 2012; Struve, et al.,
2008). T1F has been shown to play a pivotal role in the pathogenesis of UTIs
and it has been experimentally demonstrated in a murine bladder infection
model (Struve, et al., 2008).
174 |
Figure 5-2 The structure of T1F mannose-sensitive fimbriae.
FimA is the major subunit, and FimH is the adhesin that binds to mannosylated
glycoprotein receptors (Paczosa, et al., 2016). The figure is re-published with
permission.
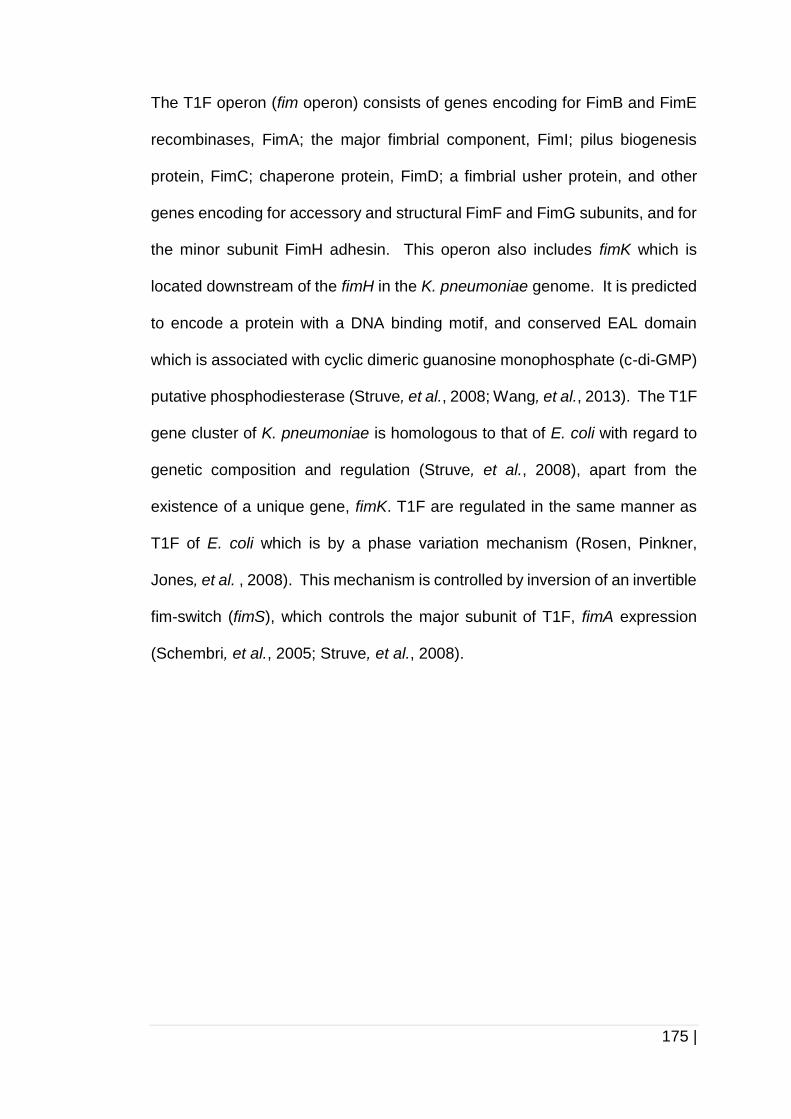
175 |
The T1F operon (fim operon) consists of genes encoding for FimB and FimE
recombinases, FimA; the major fimbrial component, FimI; pilus biogenesis
protein, FimC; chaperone protein, FimD; a fimbrial usher protein, and other
genes encoding for accessory and structural FimF and FimG subunits, and for
the minor subunit FimH adhesin. This operon also includes fimK which is
located downstream of the fimH in the K. pneumoniae genome. It is predicted
to encode a protein with a DNA binding motif, and conserved EAL domain
which is associated with cyclic dimeric guanosine monophosphate (c-di-GMP)
putative phosphodiesterase (Struve, et al., 2008; Wang, et al., 2013). The T1F
gene cluster of K. pneumoniae is homologous to that of E. coli with regard to
genetic composition and regulation (Struve, et al., 2008), apart from the
existence of a unique gene, fimK. T1F are regulated in the same manner as
T1F of E. coli which is by a phase variation mechanism (Rosen, Pinkner,
Jones, et al. , 2008). This mechanism is controlled by inversion of an invertible
fim-switch (fimS), which controls the major subunit of T1F, fimA expression
(Schembri, et al., 2005; Struve, et al., 2008).
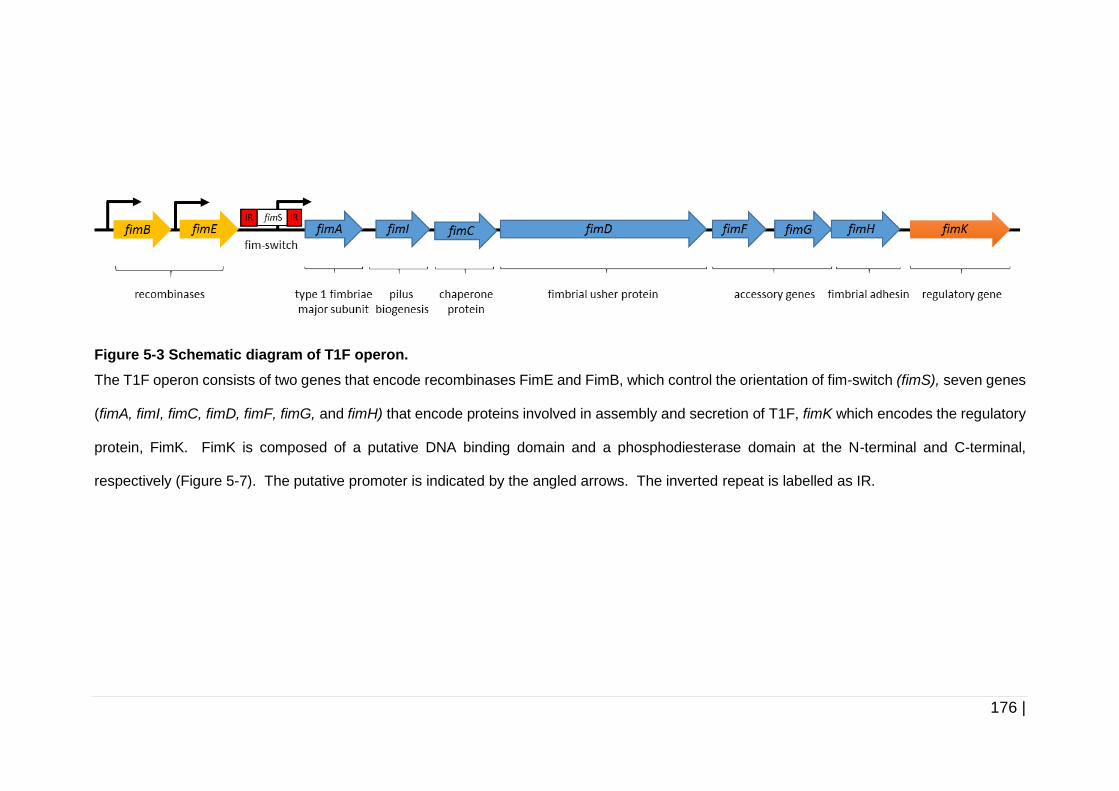
176 |
Figure 5-3 Schematic diagram of T1F operon.
The T1F operon consists of two genes that encode recombinases FimE and FimB, which control the orientation of fim-switch (fimS), seven genes
(fimA, fimI, fimC, fimD, fimF, fimG, and fimH) that encode proteins involved in assembly and secretion of T1F, fimK which encodes the regulatory
protein, FimK. FimK is composed of a putative DNA binding domain and a phosphodiesterase domain at the N-terminal and C-terminal,
respectively (Figure 5-7). The putative promoter is indicated by the angled arrows. The inverted repeat is labelled as IR.
177 |
5.1.1.1.1 Fim-switch (fimS) orientation
The regulation of T1F in K. pneumoniae is similar to that in E. coli. It is
controlled by a phase variation mechanism via inversion of an invertible DNA
element, the fim-switch (fimS). fimS is flanked by 9 bp inverted repeats (IR).
The inversion of fimS is mediated by the site-specific tyrosine-integrases, FimE
and FimB (McCusker, et al. , 2008). FimE catalyses the inversion of fimS from
the ‘ON-to-OFF’ orientation and FimB catalyse the switch of fimS to both of the
‘ON-to-OFF’ and ‘OFF-to-ON’ orientations. Inversion of the switch results in a
fimbriated cell state when it is in the ‘ON’ orientation and an afimbriated cell
state when it is in the ‘OFF’ orientation (Dorman, et al. , 2009).
The invertible DNA element, fimS contains a promoter for fimA, the major
subunit of T1F. The orientation of fimS can be determined by amplifying the
switch region using the forward and reverse primers (Figure 5-4), and digesting
the amplified PCR product with HinfI. Due to the asymmetric location of HinfI
restriction sites within fimS, it will result in different digestion patterns
depending on the orientation of fimS. The length of amplified/undigested fimS
is 817 bp. The ‘ON’ orientation of fimS results in 212 bp and 605 bp fragments
on digestion of the PCR product, while the ‘OFF’ orientation of fimS results in
496 bp and 321 bp fragments (Figure 5-4).
178 |
Figure 5-4 Schematic diagram of fimE, fimS and fimA.
Figure shows the invertible DNA element of fimS located in between fimE and fimA in
the T1F operon. The inverted repeat is labelled as IR. The promoter is indicated by
the angled arrow. The direction of the primers is as labelled. The figure is adapted
from Struve, et al. (2008).
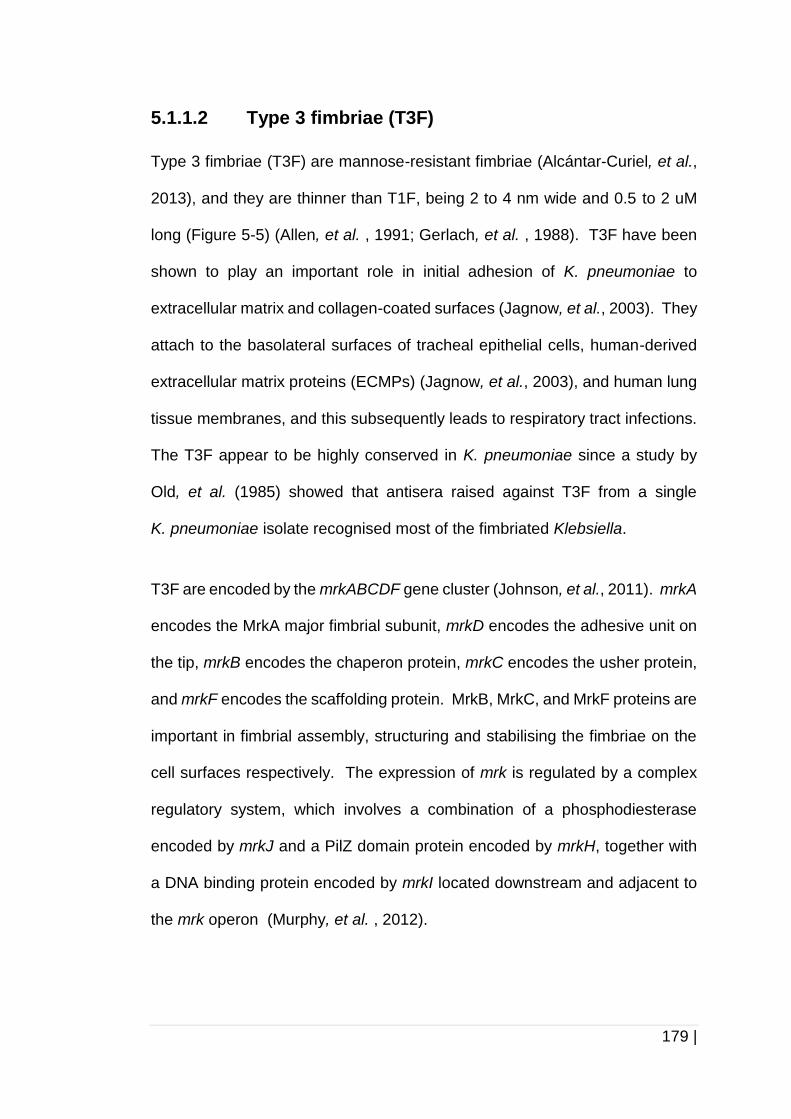
179 |
5.1.1.2 Type 3 fimbriae (T3F)
Type 3 fimbriae (T3F) are mannose-resistant fimbriae (Alcántar-Curiel, et al.,
2013), and they are thinner than T1F, being 2 to 4 nm wide and 0.5 to 2 uM
long (Figure 5-5) (Allen, et al. , 1991; Gerlach, et al. , 1988). T3F have been
shown to play an important role in initial adhesion of K. pneumoniae to
extracellular matrix and collagen-coated surfaces (Jagnow, et al., 2003). They
attach to the basolateral surfaces of tracheal epithelial cells, human-derived
extracellular matrix proteins (ECMPs) (Jagnow, et al., 2003), and human lung
tissue membranes, and this subsequently leads to respiratory tract infections.
The T3F appear to be highly conserved in K. pneumoniae since a study by
Old, et al. (1985) showed that antisera raised against T3F from a single
K. pneumoniae isolate recognised most of the fimbriated Klebsiella.
T3F are encoded by the mrkABCDF gene cluster (Johnson, et al., 2011). mrkA
encodes the MrkA major fimbrial subunit, mrkD encodes the adhesive unit on
the tip, mrkB encodes the chaperon protein, mrkC encodes the usher protein,
and mrkF encodes the scaffolding protein. MrkB, MrkC, and MrkF proteins are
important in fimbrial assembly, structuring and stabilising the fimbriae on the
cell surfaces respectively. The expression of mrk is regulated by a complex
regulatory system, which involves a combination of a phosphodiesterase
encoded by mrkJ and a PilZ domain protein encoded by mrkH, together with
a DNA binding protein encoded by mrkI located downstream and adjacent to
the mrk operon (Murphy, et al. , 2012).
180 |
Figure 5-5 The structure of T3F mannose-resistant fimbriae.
MrkA is the major fimbrial subunit and MrkD is the mannose-resistant adhesin
(Paczosa, et al., 2016). The figure is re-published with permission.
181 |
5.1.2 Role of type 1 fimbriae (T1F) in biofilm formation by
K. pneumoniae
The T1F gene cluster of K. pneumoniae has an overall high degree of
structural resemblance with the well-studied T1F gene cluster of E. coli
(Struve, et al., 2008). As previously mentioned, there is only one difference
that can be identified between these two T1F operons; the existence of a gene
that encodes for regulatory protein, fimK, which is exclusive to K. pneumoniae
(Struve, et al., 2008) located downstream of the fimH. T1F are known to be
involved in biofilm formation of uropathogenic E. coli (UPEC) strains. As
previously mentioned, the T1F operon of E. coli has a high similarity in terms
of genetic organisation with T1F operon of K. pneumoniae except for fimK.
Since the role of T3F in biofilm formation by K. pneumoniae is well established
and T1F also was reported to play a key role as crucial as T3F in biofilm
formation by K. pneumoniae upon cultivation in human pooled urine (Stahlhut,
et al., 2012), we postulated that T1F of K. pneumoniae could also be involved
in biofilm formation by K. pneumoniae in our experimental settings.
Some studies have revealed that T1F are involved in biofilm formation by
K. pneumoniae but at the same time, several studies have proven that T1F do
not contribute to the biofilm formation by K. pneumoniae (Paczosa, et al.,
2016). For instance, T1F were shown to play a complementary role with T3F
in biofilm formation by K. pneumoniae TOP52, an acute cystitis clinical isolate
(Johnson, et al. , 2014), and contribute to bacterial adherence in a murine
catheter-associated urinary tract infection model (Murphy, et al., 2013). A
study by Stahlhut, et al. (2012) also concluded that K. pneumoniae requires
182 |
either T1F or T3F to form biofilms on urinary catheters. Absence both of the
fimbriae significantly reduced the colonisation and biofilm formation by
K. pneumoniae C3091 on catheter surfaces and complementation of the T1F
or T3F mutant strains with either one fimbrial type restores the phenotype of
the wild type. Both of the fimbriae also independently promote biofilm
formation on urinary catheters compared to nonfimbriated E. coli upon
transformation and expression of T1F or T3F gene cluster. In contrast,
isogenic mutants of K. pneumoniae C3091 (∆fim), which was developed by
Schroll, et al. (2010) suggested that T1F did not have a significant role in the
biofilm formation by K. pneumoniae upon growth in modified fastidious
anaerobe broth in flow chambers.
These observations could be because all of the experiments were conducted
in different experimental settings, models and media which could contribute to
these differences. Therefore, the exact contribution of T1F to biofilm formation
by K. pneumoniae is still unclear. In the study described in this chapter, we
investigated further, the role of T1F in biofilm formation by determining the
orientation of fimS in two different growth states, planktonic and biofilm cells
upon cultivation in two different media, highly nutritious medium, TSB and
nutrient-poor medium, AUM in 96-well microtitre plates.
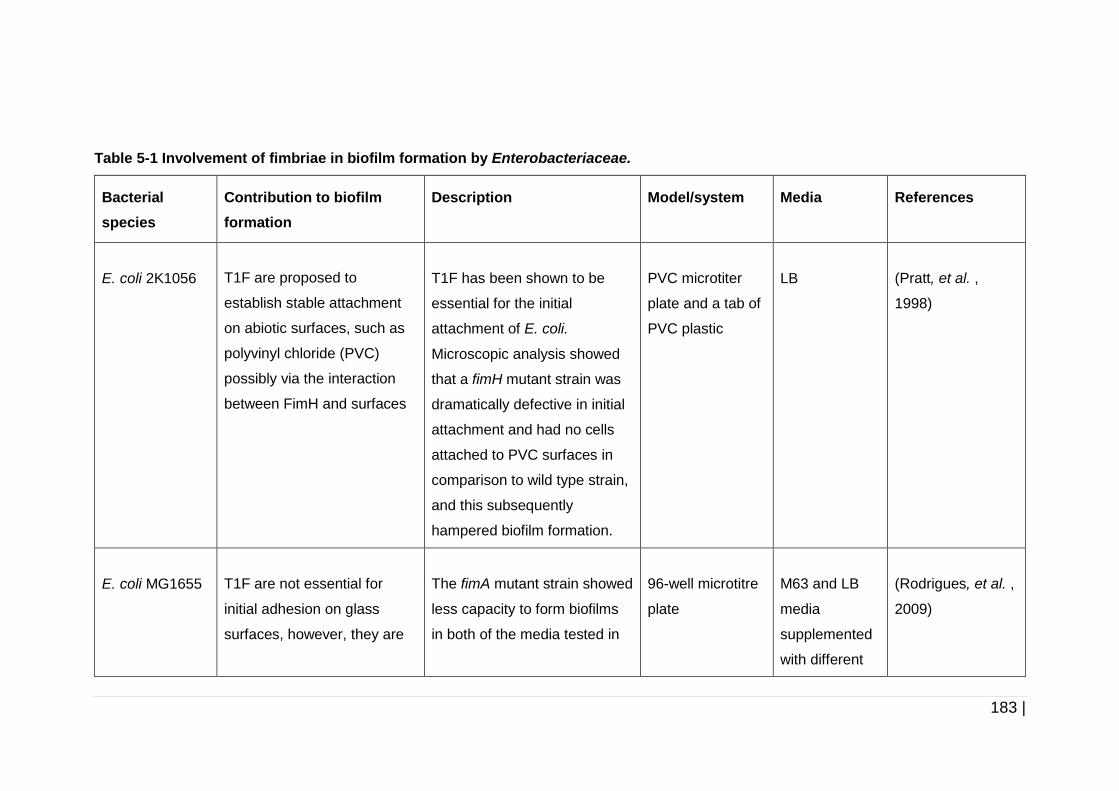
183 |
Table 5-1 Involvement of fimbriae in biofilm formation by Enterobacteriaceae.
Bacterial
species
Contribution to biofilm
formation
Description Model/system Media References
E. coli 2K1056
T1F are proposed to
establish stable attachment
on abiotic surfaces, such as
polyvinyl chloride (PVC)
possibly via the interaction
between FimH and surfaces
T1F has been shown to be
essential for the initial
attachment of E. coli.
Microscopic analysis showed
that a fimH mutant strain was
dramatically defective in initial
attachment and had no cells
attached to PVC surfaces in
comparison to wild type strain,
and this subsequently
hampered biofilm formation.
PVC microtiter
plate and a tab of
PVC plastic
LB
(Pratt, et al. ,
1998)
E. coli MG1655
T1F are not essential for
initial adhesion on glass
surfaces, however, they are
The fimA mutant strain showed
less capacity to form biofilms
in both of the media tested in
96-well microtitre
plate
M63 and LB
media
supplemented
with different
(Rodrigues, et al. ,
2009)
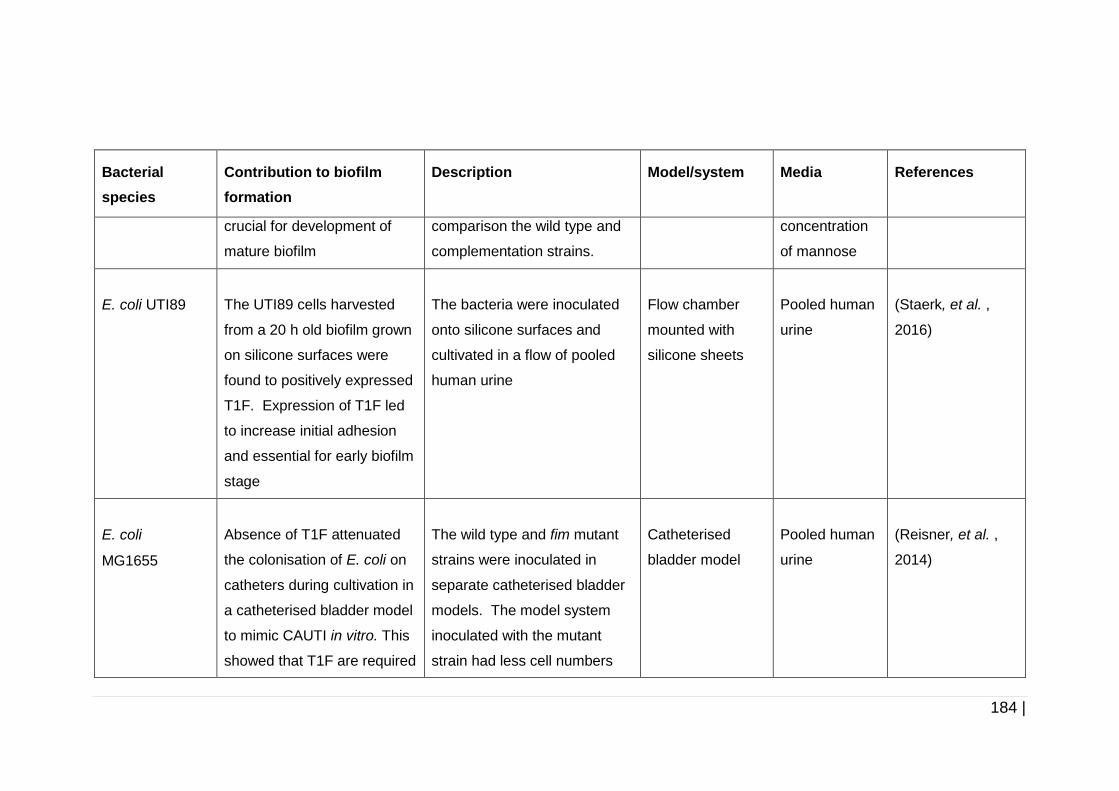
184 |
Bacterial
species
Contribution to biofilm
formation
Description Model/system Media References
crucial for development of
mature biofilm
comparison the wild type and
complementation strains.
concentration
of mannose
E. coli UTI89
The UTI89 cells harvested
from a 20 h old biofilm grown
on silicone surfaces were
found to positively expressed
T1F. Expression of T1F led
to increase initial adhesion
and essential for early biofilm
stage
The bacteria were inoculated
onto silicone surfaces and
cultivated in a flow of pooled
human urine
Flow chamber
mounted with
silicone sheets
Pooled human
urine
(Staerk, et al. ,
2016)
E. coli
MG1655
Absence of T1F attenuated
the colonisation of E. coli on
catheters during cultivation in
a catheterised bladder model
to mimic CAUTI in vitro. This
showed that T1F are required
The wild type and fim mutant
strains were inoculated in
separate catheterised bladder
models. The model system
inoculated with the mutant
strain had less cell numbers
Catheterised
bladder model
Pooled human
urine
(Reisner, et al. ,
2014)
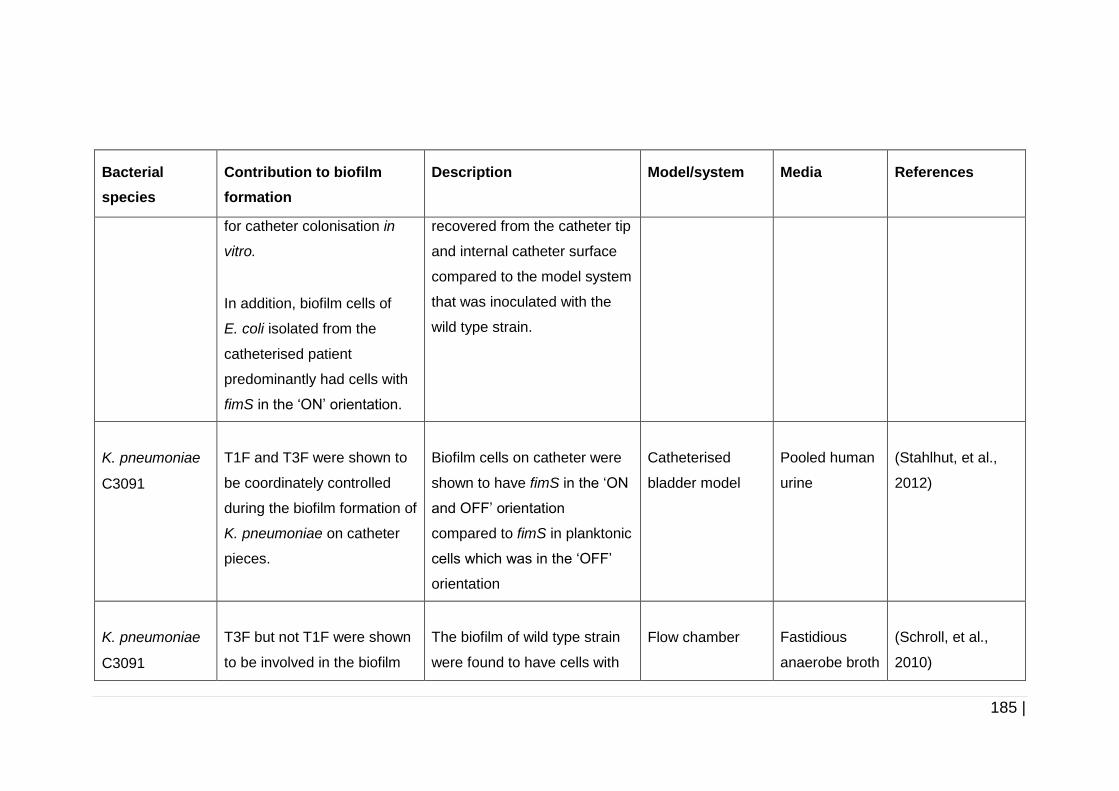
185 |
Bacterial
species
Contribution to biofilm
formation
Description Model/system Media References
for catheter colonisation in
vitro.
In addition, biofilm cells of
E. coli isolated from the
catheterised patient
predominantly had cells with
fimS in the ‘ON’ orientation.
recovered from the catheter tip
and internal catheter surface
compared to the model system
that was inoculated with the
wild type strain.
K. pneumoniae
C3091
T1F and T3F were shown to
be coordinately controlled
during the biofilm formation of
K. pneumoniae on catheter
pieces.
Biofilm cells on catheter were
shown to have fimS in the ‘ON
and OFF’ orientation
compared to fimS in planktonic
cells which was in the ‘OFF’
orientation
Catheterised
bladder model
Pooled human
urine
(Stahlhut, et al.,
2012)
K. pneumoniae
C3091
T3F but not T1F were shown
to be involved in the biofilm
The biofilm of wild type strain
were found to have cells with
Flow chamber
Fastidious
anaerobe broth
(Schroll, et al.,
2010)
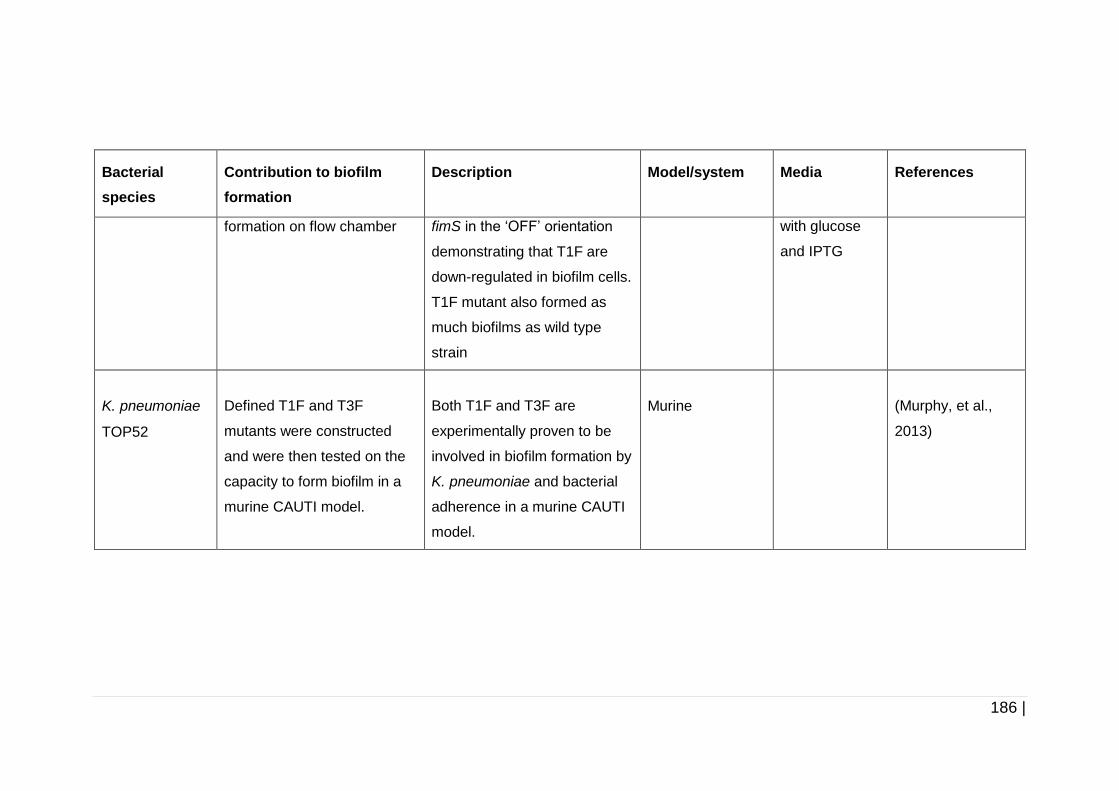
186 |
Bacterial
species
Contribution to biofilm
formation
Description Model/system Media References
formation on flow chamber fimS in the ‘OFF’ orientation
demonstrating that T1F are
down-regulated in biofilm cells.
T1F mutant also formed as
much biofilms as wild type
strain
with glucose
and IPTG
K. pneumoniae
TOP52
Defined T1F and T3F
mutants were constructed
and were then tested on the
capacity to form biofilm in a
murine CAUTI model.
Both T1F and T3F are
experimentally proven to be
involved in biofilm formation by
K. pneumoniae and bacterial
adherence in a murine CAUTI
model.
Murine
(Murphy, et al.,
2013)
187 |
5.2 Materials and Methods
5.2.1 DNA isolation from planktonic and biofilm cells
Biofilms were grown in microtitre plates according to the protocol in
Chapter 3, section 3.2.1. After 24 h incubation at 37 °C under shaking
conditions, planktonic cells were removed from 96-well microtitre plates
and transferred into a microcentrifuge tube. The cells were centrifuged at
15700 x g (Eppendorf 5415D) for 15 min and the supernatant was
decanted. The pellet was resuspended in 100 µl of molecular grade water.
These samples were labelled as planktonic cells. For the isolation of DNA
from biofilm cells, the wells (without planktonic cells) were washed
carefully with molecular grade water to remove the non-adherent cells.
Biofilm cells were scraped from the bottom and wall of the 96-well
microtitre plates using pipette tips and resuspended in 50 µl molecular
grade water in a microcentrifuge tube. The suspension was then
centrifuged at 15 700 x g (Eppendorf 5415D) for 15 min and the
supernatant was decanted and resuspended in 30 µl molecular grade
water. These samples were labelled as biofilm cells. The resuspended
pellets of planktonic cells and biofilm cells were boiled for 5 min in a
heating block, and quickly transferred into ice. The suspension was
centrifuged at 15 700 x g (Eppendorf 5415D) for 5 min. The supernatant
was then used as a DNA template for amplification of the fimS region.
188 |
5.2.2 Determination of the invertible element (fimS) orientation
The orientation of the K. pneumoniae invertible DNA element containing the
fimA promoter was determined using PCR-based assays. Extracted DNA was
used as a template following a previously described method by
Struve, et al. (2008) with some modifications. Primer fimF
(GGGACAGATACGCGTTTGAT) and fimR (GGCCTAACTGAACGGTTTGA)
were used to amplify 817 bp of the fimS region. PCR was performed according
to the protocol mentioned in Chapter 2, section 2.4.3. The PCR product was
separated on a 1 % agarose gel by electrophoresis. The orientation of fimS
was determined by digesting the PCR product using HinfI (NEB, UK) at 37 °C
in a heating block for one hour and deactivated at 80 °C for 20 min. The
digested product was then separated on a 1.2 % agarose gel by
electrophoresis.
5.2.3 Bioinformatic analysis of the T1F operon
The DNA sequences of the genes in the T1F operon for all isolates were
obtained from their corresponding draft genome sequences. The fim operon
alignment was done using GeneDoc version 2.7 (Pittsburgh, USA) and Clustal
Omega. Deduced amino acid sequences for all the T1F genes were obtained
using EMBOSS-Transeq (Rice, et al., 2000).
189 |
5.3 Results
5.3.1 Determination of fimS orientation
To investigate the influence of growth state and growth environment on T1F
phase switching, the orientation of the invertible DNA element containing the
promoter of fimA, was compared between the cells harvested from planktonic
and biofilm cells upon cultivation in TSB and AUM under shaking conditions.
Digestion of the PCR amplified fimS region, using HinfI, harvested from the
planktonic cells of strain Kpneu_1, Kpneu_63, Kpneu_64, Kpneu_65,
Kpneu_110, C3091, and CG43S3 grown in TSB resulted in two fragments that
were of expected sizes corresponding to the fimS being in the ‘OFF’ position.
The orientation of the fimS obtained from the biofilm cells of strain Kpneu_1,
Kpneu_65, C3091, and CG43S3 was in the ‘ON and OFF’ orientation in TSB.
The biofilms of the other three strains, Kpneu_63, Kpneu_64, and Kpneu_110,
however, showed the ‘OFF’ orientation for fimS when cultured in TSB (Table
5-2).
We also determined the orientation of fimS by digestion of the PCR amplified
fimS region obtained from planktonic and biofilm cells of K. pneumoniae
cultivated in AUM. The orientation of fimS in all strains was in the ‘OFF’
orientation in both planktonic and biofilm cells (Table 5-2). The differences of
HinfI digestion pattern of amplified fimS region in biofilm cells cultivated in TSB
and AUM can be seen in Figure 5-6.
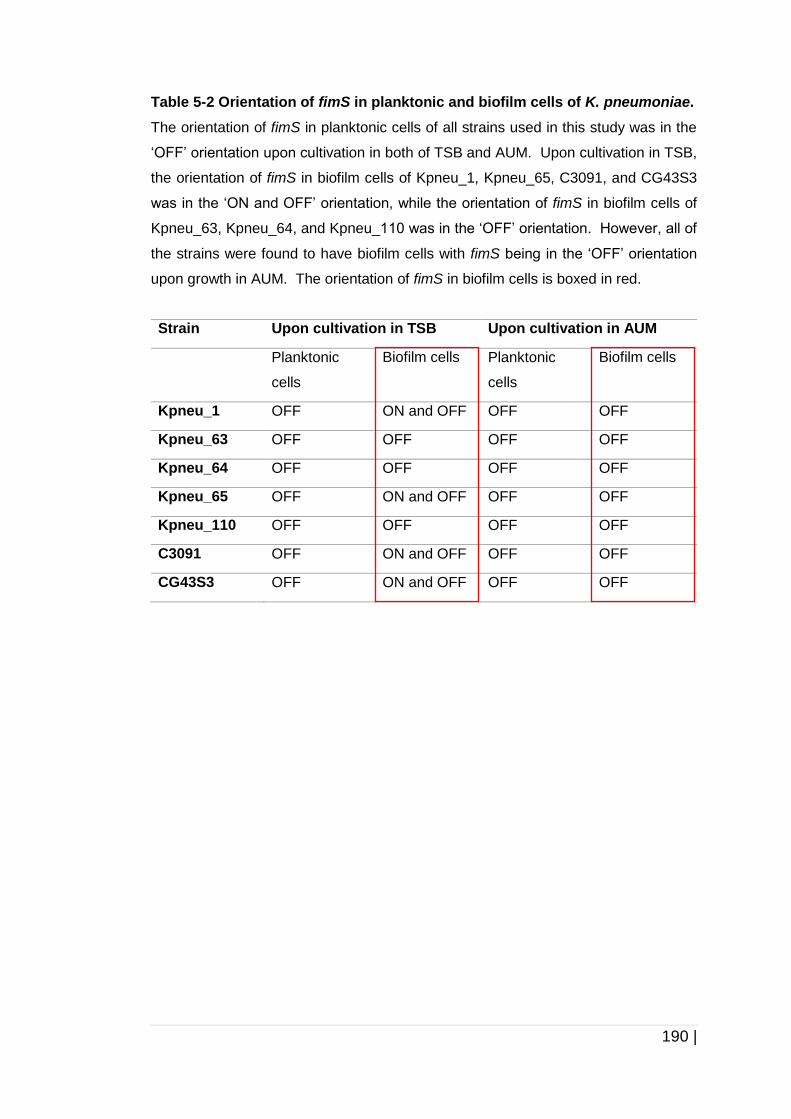
190 |
Table 5-2 Orientation of fimS in planktonic and biofilm cells of K. pneumoniae.
The orientation of fimS in planktonic cells of all strains used in this study was in the
‘OFF’ orientation upon cultivation in both of TSB and AUM. Upon cultivation in TSB,
the orientation of fimS in biofilm cells of Kpneu_1, Kpneu_65, C3091, and CG43S3
was in the ‘ON and OFF’ orientation, while the orientation of fimS in biofilm cells of
Kpneu_63, Kpneu_64, and Kpneu_110 was in the ‘OFF’ orientation. However, all of
the strains were found to have biofilm cells with fimS being in the ‘OFF’ orientation
upon growth in AUM. The orientation of fimS in biofilm cells is boxed in red.
Strain Upon cultivation in TSB Upon cultivation in AUM
Planktonic
cells
Biofilm cells Planktonic
cells
Biofilm cells
Kpneu_1 OFF ON and OFF OFF OFF
Kpneu_63 OFF OFF OFF OFF
Kpneu_64 OFF OFF OFF OFF
Kpneu_65 OFF ON and OFF OFF OFF
Kpneu_110 OFF OFF OFF OFF
C3091 OFF ON and OFF OFF OFF
CG43S3 OFF ON and OFF OFF OFF
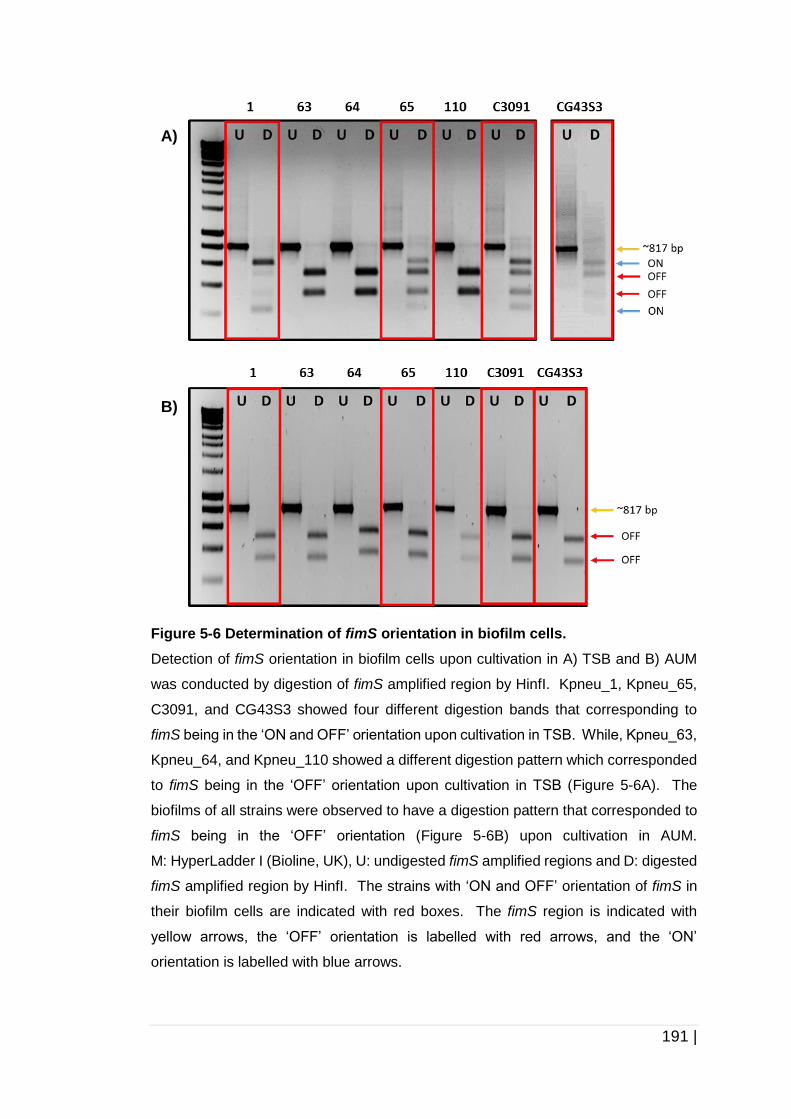
191 |
Figure 5-6 Determination of fimS orientation in biofilm cells.
Detection of fimS orientation in biofilm cells upon cultivation in A) TSB and B) AUM
was conducted by digestion of fimS amplified region by HinfI. Kpneu_1, Kpneu_65,
C3091, and CG43S3 showed four different digestion bands that corresponding to
fimS being in the ‘ON and OFF’ orientation upon cultivation in TSB. While, Kpneu_63,
Kpneu_64, and Kpneu_110 showed a different digestion pattern which corresponded
to fimS being in the ‘OFF’ orientation upon cultivation in TSB (Figure 5-6A). The
biofilms of all strains were observed to have a digestion pattern that corresponded to
fimS being in the ‘OFF’ orientation (Figure 5-6B) upon cultivation in AUM.
M: HyperLadder I (Bioline, UK), U: undigested fimS amplified regions and D: digested
fimS amplified region by HinfI. The strains with ‘ON and OFF’ orientation of fimS in
their biofilm cells are indicated with red boxes. The fimS region is indicated with
yellow arrows, the ‘OFF’ orientation is labelled with red arrows, and the ‘ON’
orientation is labelled with blue arrows.
A)
B)
192 |
5.3.2 Analysis of the T1F operon sequences
Since the orientation of the fimS was in the ‘ON and OFF’ orientation in biofilm
cells of strains Kpneu_1, Kpneu_65, C3091, and CG43S3 and in the ‘OFF’
orientation in biofilm cells of strains Kpneu_63, Kpneu_64, and Kpneu_110,
we hypothesised that a difference in the T1F operons between strains may
account for this finding. For the purpose of explanation, Kpneu_1, Kpneu_65,
C3091, and CG43S3 will be mentioned as the ‘ON and OFF’ group while
Kpneu_63, Kpneu_64, and Kpneu_110 will be mentioned as the ‘OFF’ group
in the further description and discussion.
The sequences of the T1F operon of all strains were obtained from their
corresponding draft whole genome sequences. The length of this operon was
about 10,255 bp. Sequences were analysed using GeneDoc to obtain multiple
sequence alignments and EMBOSS-Transeq for amino acid translation.
Based on the multiple sequence alignments, various SNPs were identified in
several genes of the fim operon, and they resulted in amino acid variations
(Appendix 3). Among all of these amino acid variations, some of them were
specific for the ‘ON’ and OFF’ group (Kpneu_1, Kpneu_65, C3091, and
CG43S3), and some for the ‘OFF’ group (Kpneu_64, Kpneu_64, and
Kpneu_110). These specific SNPs were located in fimF, fimI and fimK and
these SNPs resulted in the amino acid substitutions of FimF, FimI and FimK.
(Table 5-3). The SNPs in fimF resulted in the amino acid substitutions at
position A38T and A106T (Appendix 10). This substitution is a conservative
substitution. Other than fimF, three SNPs were identified in fimI (Appendix
11). This SNPs resulted in two conservative amino acid substitutions at
193 |
position R44H and A136T, and one non-conservative amino acid substitution
at position P146R. The most remarkable SNP between the ‘ON and OFF’
group (Kpneu_1, Kpneu_65, C3091, CG43S3) and the ‘OFF’ group
(Kpneu_63, Kpneu_64, and Kpneu_110) was in fimK which resulted in a
premature termination codon at position 441 (Q441*) in the ‘OFF’ group
(Figure 5-7). This substitution was conserved in the ‘OFF’ group, Kpneu_63,
Kpneu_64, and Kpneu_110. Several SNPs were also identified in the
intergenic regions between fimB and fimE (Appendix 4, Appendix 5, and
Appendix 6) and fimS (Appendix 7, Appendix 8, and Appendix 9) between
these two groups. Six SNPs were identified in the intergenic region between
fimB and fimE at position T-61C, A-63T, A-204G, G-247A, A-257G, and
T-265G for the ‘OFF’ group. These positions are based on the start codon of
fimE, ATG (Appendix 6). While two SNPs were identified in the fimS region at
position of A-321C, and A-204C in the upstream of fimA for the ‘OFF’ group.
The position is based on the fimA start codon GTG (Appendix 9). Analysis of
the intergenic regions indicates that the intergenic SNPs probably do not affect
any putative promoter or rho-independent terminator sites in these regions.
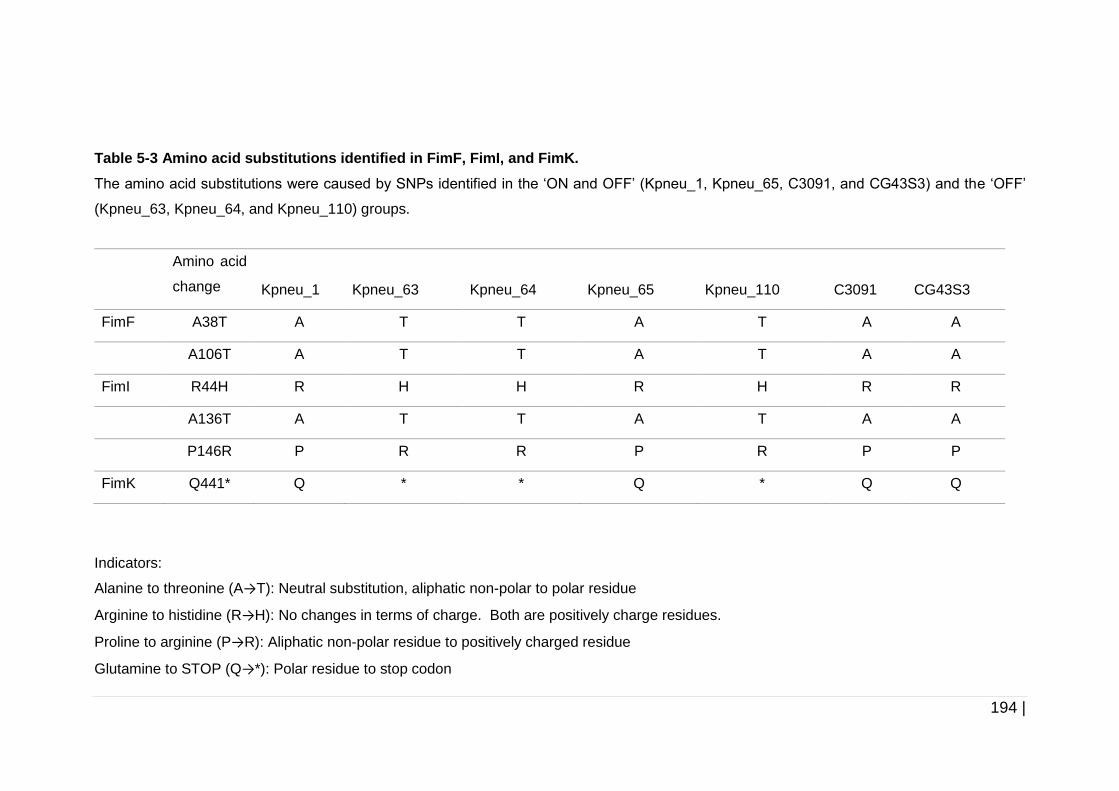
194 |
Table 5-3 Amino acid substitutions identified in FimF, FimI, and FimK.
The amino acid substitutions were caused by SNPs identified in the ‘ON and OFF’ (Kpneu_1, Kpneu_65, C3091, and CG43S3) and the ‘OFF’
(Kpneu_63, Kpneu_64, and Kpneu_110) groups.
Indicators:
Alanine to threonine (A→T): Neutral substitution, aliphatic non-polar to polar residue
Arginine to histidine (R→H): No changes in terms of charge. Both are positively charge residues.
Proline to arginine (P→R): Aliphatic non-polar residue to positively charged residue
Glutamine to STOP (Q→*): Polar residue to stop codon
Amino acid
change
Kpneu_1
Kpneu_63
Kpneu_64
Kpneu_65
Kpneu_110
C3091
CG43S3
FimF A38T A T T A T A A
A106T A T T A T A A
FimI R44H R H H R H R R
A136T A T T A T A A
P146R P R R P R P P
FimK Q441* Q * * Q * Q Q
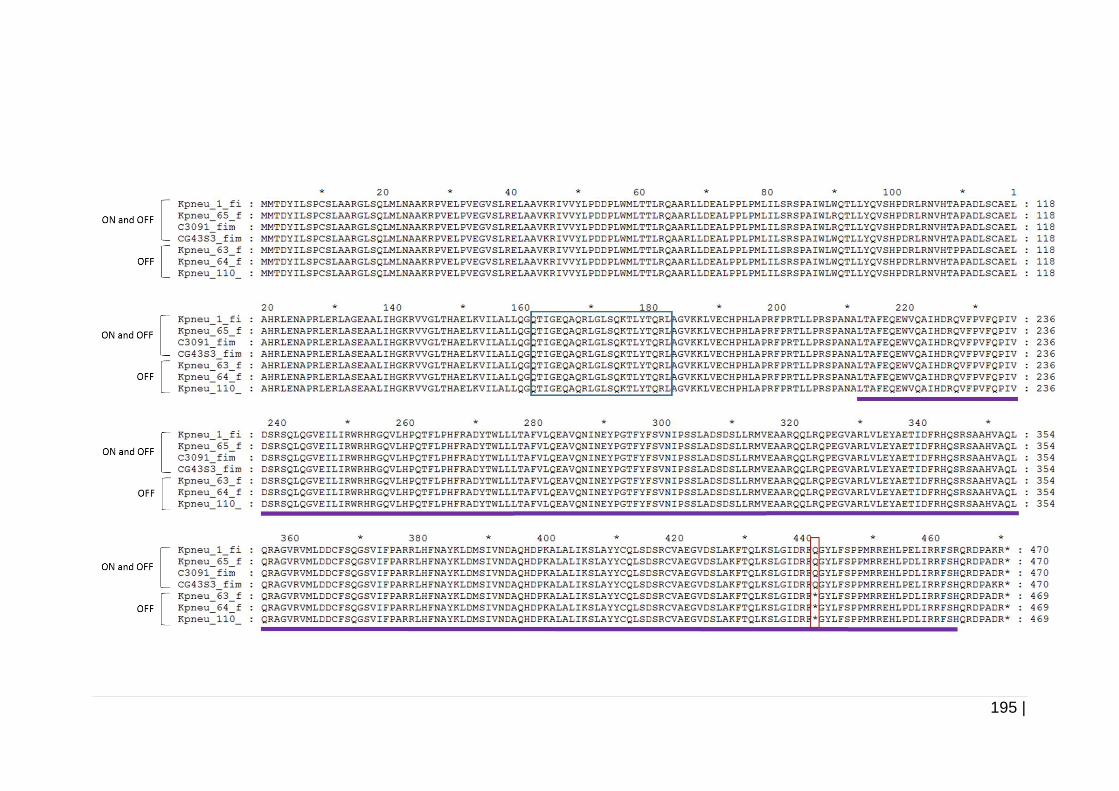
195 |
196 |
Figure 5-7 Multiple sequence alignment of FimK.
The multiple amino acid sequence alignment of FimK was conducted using GeneDoc. The amino acid substitutions resulted from the SNPs are
boxed in red. The predicted helix-turn-helix (HTH) DNA-binding domain is boxed in blue. The HTH domain region was predicted using an HTH
prediction software (https://npsa-prabi.ibcp.fr) (Combet, et al. , 2000). The predicted EIL/EAL domain, which is underlined with purple. This
domain is proposed to act as a diguanylate phosphodiesterase. The domain is predicted using PROSITE (http://prosite.expasy.org). The ‘ON
and OFF’ and ‘OFF’ groups are as indicated.
197 |
5.4 Discussion
Initial adhesion and biofilm formation of K. pneumoniae on host cell surfaces,
for example, on urothelial cells are commonly associated with two major
fimbrial adhesins, the mannose-sensitive T1F and mannose-resistant T3F
(Alcántar-Curiel, et al., 2013). Besides these two major surface appendages,
Kpc fimbriae (Wu, et al., 2010) and a homolog of the E. coli common pilus
(Ecp) (Saldaña, et al. , 2014) are also present in K. pneumoniae. Besides
these fimbriae, there is also a less investigated fimbrial adhesin of
K. pneumoniae called KPF-28 and an afimbrial adhesin named CF29K that is
encoded by genes on the R-plasmid of K. pneumoniae strain CF914-1 (Brisse,
et al. , 2009; Di Martino, et al. , 1995; Di Martino, et al. , 1996). The vast
majority of K. pneumoniae strains, specifically clinical isolates have the
capacity to produce T1F and T3F fimbriae suggesting that they are important
surface appendages in K. pneumoniae (Podschun, et al., 1998; Schroll, et al.,
2010). The interaction between T1F and terminally exposed mannose
residues in N-linked oligosaccharides that are normally located on cell
surfaces is facilitated by the FimH, adhesin subunit of T1F (Figure 5-1 and
Figure 5-2) (Stahlhut, et al. , 2009).
Our findings reveal that regardless of the growth media used for cultivation, all
the examined strains had planktonic cells with fimS being in the ‘OFF’
orientation, which is normally associated with no expression of T1F. The
observation of fimS being in the ‘OFF’ orientation in planktonic cells upon
cultivation in AUM is in line with the previous study by Stahlhut, et al. (2012).
Stahlhut, et al. (2012) also showed that orientation of fimS in planktonic cells
198 |
of strain C3091 was also in the ‘OFF’ orientation upon cultivation in pooled
human urine under hydrodynamic conditions. Moreover, our results showed
that four of the strains used in this study, had biofilm cells with fimS in the ‘ON
and OFF’ orientation and three strains had biofilm cells with fimS in the ‘OFF’
orientation upon cultivation in TSB. Surprisingly, all the strains had the biofilm
cells with fimS in the ‘OFF’ orientation upon cultivation in AUM.
Our observation suggested the existence of a mixed population of fimbriated
and nonfimbriated cells in the biofilm community upon cultivation in TSB. This
subsequently resulted in the detection of fimS being in the ‘ON and OFF’
orientation of biofilm cells of strain Kpneu_1, Kpneu_65, C3091, and CG43S3.
The biofilms community might consist of i) adherent cells on the polystyrene
surface which are most likely to have cells with fimS being in the ‘ON’
orientation and ii) cells with fimS being in the ‘OFF’ orientation that are just
about to disperse from the adhered community.
Our investigation of the DNA sequences of the genes in the T1F operon in the
examined strains revealed various SNPs at multiple locations. SNPs that
specifically related to the ‘ON and OFF’ group (Kpneu_1, Kpneu_65, C3091,
and CG43S3) or the ‘OFF’ group (Kpneu_63, Kpneu_64, and Kpneu_110)
were identified in fimI, fimF and fimK (Table 5-3). All of these SNPs resulted
in amino acid substitutions in FimI (Appendix 10), FimF (Appendix 11) and
FimK (Figure 5-7). There were also a number of SNPs in the intergenic region
of fimB and fimE (Appendix 4, 5, and 6) and also in the fimS located in the
intergenic region of fimE or fimA (Appendix 7, 8, and 9). Intergenic regions
may carry various important elements such as promoter sites, terminator sites,
199 |
transcription factors binding sites, integrase binding sites, regulatory protein
binding sites, pseudogenes, and inverted repeats (Sharples, et al. , 1990).
However, the effect of these SNPs on the orientation of fimS in K. pneumoniae
is still unknown. Because of this, it is worth analysing the effect of these
intergenic SNPs on the orientation of fimS in future studies as this may lead to
a better understanding of their impact on the expression of T1F in
K. pneumoniae.
Both SNPs in fimF and two SNPs in fimI resulted in conservative substitutions.
These substitutions are known to have no or smaller effects on protein function
than non-conservative substitutions (Prakash, 2008). In addition, one SNPs
in fimI resulted in non-conservative substitution. The effect of the non-
conservative substitution on fimS orientation, however, is still unknown. We
hypothesised the SNP in fimK, could probably has a significant effect since it
results in a premature termination codon which would result in a truncated
FimK for strains Kpneu_63, Kpneu_64, and Kpneu_110. Since T1F are
secreted through the chaperone-usher pathway, defects in one of the proteins
may influence the biogenesis of T1F (Figure 5-1). We speculate that the
truncated FimK protein could possibly account for fimS being in the ‘OFF’
orientation in Kpneu_63, Kpneu_64, and Kpneu_110.
Given the importance of fimK as a gene that encodes for a regulatory protein,
it might affect the orientation of fimS and interrupt the expression of fimA and
T1F. FimK consists of helix-turn-helix (HTH) putative DNA-binding domain at
the N-terminus and putative EAL/EIL domain, at C-terminus (Wang, et al.,
2013). The EAL/EIL domain is associated with phosphodiesterases which
200 |
have been implicated in hydrolysis of c-di-GMP (Schmidt, et al. , 2005). Wang,
et al. (2013) also previously demonstrated that expression of T1F in
CG43S3∆mrk∆fimK was reduced and the putative DNA-binding region at the
N-terminus of FimK was proposed to positively affect the transcription of fimA,
but not the C-terminal domain. Our findings showed a premature termination
codon was located in the C-terminal region which we speculate could affect
the orientation of fimS. The length of the intact FimK protein is predicted to be
470 aa while the length of truncated protein caused by the premature
termination codon is predicted to be 430 aa (Figure 5-7). Whilst, the mutant
strain with a deleted EIL domain (CG43S3∆mrkA∆EILfimK) in the
aforementioned study by Wang, et al. (2013) had a different length of truncated
FimK (275 aa) compared to the truncated FimK identified in our study (430 aa).
These differences in size of truncated proteins could possibly act differently on
the orientation of fimS.
Previous work by Rosen, et al. (2008) was also not in line with our hypothesis.
FimK was shown to reduce the expression of T1F in
K. pneumoniae cystitis isolate, strain TOP52 and also suggested to act as an
inhibitory factor for biofilm formation of this strain. The isogenic mutant of
TOP52, TOP52∆fimK was observed to predominantly have fimS being in the
‘ON’ orientation and higher expression levels of T1F, in comparison to its wild
type, which generally had cells with fimS being in the ‘OFF’ orientation. The
TOP52∆fimK also had the capacity to form biofilm after 48 h incubation at room
temperature but its wild type strain failed to form biofilm in such conditions.
They concluded that loss of FimK increased the c-di-GMP signalling, which
has been correlated with formation of biofilms by regulating the transition
201 |
between the sessile and motile bacterial states (Römling, 2012; Song, et al.,
2016). Since the C-terminal of FimK contains the EIL/EAL domain, which is
normally implicated with phosphodiesterases that cleave c-di-GMP, this would
be an important point to study in future.
Our findings show that all of the strains had biofilm cells with fimS being in the
‘OFF’ orientation upon cultivation in AUM. We speculated that the ‘OFF’
orientation for ‘Kpneu_63, Kpneu_64, and Kpneu_110 could be because of the
SNP that resulted in the truncated FimK. This could be the reason why
Kpneu_63, Kpneu_64, and Kpneu_110 had the biofilm cells in the ‘OFF’
orientation upon cultivation in both of the media. Thus, further discussion on
the orientation of fimS is focused on strains Kpneu_1, Kpneu_65, C3091, and
CG43S3 only.
Our results showed that fimS orientation in biofilm cells of strain C3091 upon
cultivation in TSB in 96-well microtitre plates agree with the findings by
Stahlhut, et al. (2012) which showed that the same strain, C3091 had biofilm
cells with fimS being in the ‘ON and OFF’ upon cultivation of this strain in
pooled human urine and on catheter pieces under hydrodynamic conditions.
This suggests that the findings conducted in TSB used in the study described
in this thesis mimic the experimental results which obtained in pooled human
urine (Stahlhut, et al., 2012) rather than AUM even though the experimental
environments were different in both of the studies.
The discrepancy observed between the results conducted in AUM and pooled
human urine from the previous study by Stahlhut, et al. (2012) could be due to

202 |
differences in the experimental models that we used. We harvested the biofilm
cells from 96-well microtitre plates, while Stahlhut, et al. (2012) harvested the
cells from biofilms in the in vitro bladder model. Their model would probably
provide hydrodynamic conditions that mimic the real conditions in UTI patients.
In addition, their model also would supply more fresh-medium to bacteria by
providing constant flow rate of urine medium to the culture. Since phase
variable expression is highly dependent on the physical environment,
(Khandige, et al. , 2016) this could be another reason on the different
observation from our study.
203 |
5.5 Conclusion
Our results demonstrated that fimS in biofilm cells of Kpneu_1, Kpneu_65,
C3091, and CG43S3 was in the ‘ON’ and ‘OFF’ orientation upon cultivation in
TSB. However, the orientation of fimS in the biofilm cell of these four strains
was in the ‘OFF’ orientation upon cultivation in AUM. This suggests that T1F
possibly plays a role in biofilm formation of Kpneu_1, Kpneu_65, C3091, and
CG43S3 upon cultivation in TSB, but the role of T1F in biofilm formation
conducted in AUM is still call into question in our experimental settings. Our
data also shows that fimS is in the ‘OFF’ orientation in biofilm cells of strain
Kpneu_63, Kpneu_64, and Kpneu_110 regardless of the medium that we used
to grow them. This suggests that transcription of fimA and expression of T1F
might not be involved in the biofilm formation by those strains, but expression
studies are warranted to confirm this observation. Our data show that there
was no direct correlation between the orientation of fimS, which controls the
expression of fimA, and the capacity to form biofilms by K. pneumoniae upon
cultivation in AUM. The most remarkable SNP identified upon our analysis is
Q441* which resulted in a truncation in FimK. This substitution is conserved
in the OFF group (Kpneu_63, Kpneu_64, and Kpneu_110). This is hypothesed
to be a possible reason for fimS being in the ‘OFF’ orientation upon cultivation
in TSB for these three strains.
204 |
Chapter 6.0
Role of OmpK35 and OmpK36
porins in biofilm formation by
Klebsiella pneumoniae
205 |
6.0 Role of OmpK35 and OmpK36 porins in biofilm
formation by K. pneumoniae
6.1 Introduction
Gram-negative bacteria have distinct outer membrane porin (Omp) structures,
located at the outer membrane layer of Gram-negative cell wall (Nikaido,
1994). They are important for transportation of small hydrophilic solutes (600
Da) (Nikaido, 2003). It is notable that trimeric unique water channel-forming
Omps play an important role in uptake of nutrients to the periplasmic space
through the outer membrane layer, and secretion of toxic and waste molecules
from the cytoplasm (Schulz, 2004). These porins can be divided into three
different groups: i) general porins or porins for general diffusion e.g. OmpK35,
OmpK36, and PhoE, ii) specific porins or porins with an exclusive binding site
for specific solute, for example, maltodextrins which bind to the LamB
maltoporin (Klebba, 2002) and sucrose which binds to the ScrY porins (Sun,
et al. , 2016), and iii) porins that actively transport and consume energy such
as porins which are involved in the uptake of ferric-siderophore (Danelon, et
al. , 2004). These ferric-siderophore complexes require specific porins or
receptors to penetrate the outer membrane layer since these large complexes
exceed the molecular weight cut-off of general porins, for example, ferric
enterobactin receptor (FepA) (Buchanan, et al. , 1999; Krewulak, et al. , 2008).
There are two major non-specific porins in K. pneumoniae, which are known
as OmpK35 and OmpK36. These porins are homologs to OmpF and OmpC
of E. coli and S. enterica ser. Typhi with the percentage of amino acid identity
about 60 % and 80 % respectively (Balasubramaniam, et al. , 2012;
206 |
Hernández-Allés, et al. , 1999; Sugawara, et al., 2016). They have been
identified to play an important role in antibiotic resistance (Doménech-
Sánchez, et al. , 2003; Landman, et al. , 2009; Shakib, et al. , 2012), and
virulence (Chen, et al. , 2010) of K. pneumoniae (specifically for OmpK36). In
addition, OmpK35 has ~ 60 % amino acid homology to OmpK36 and ~ 58 %
amino acid identity to PhoE according to SWISS-MODEL prediction.
6.1.1 K. pneumoniae outer membrane porins (Omps)
K. pneumoniae expresses a variety of general porins, for example, OmpK35
and OmpK36. In addition, K. pneumoniae also might express several
additional porins. Beside these two major non-specific porins, some studies
have reported on another three porins, which are also important in
K. pneumoniae: OmpK26, OmpK34, and OmpK37 (Table 6-1).
A previous study by Doménech-Sánchez, et al. (1999) showed that expression
of K. pneumoniae OmpK37 porin, resulted in less susceptibility to β- lactam
antibiotics. However, more recent research by the other researchers,
demonstrated that OmpK37 played an insignificant role in antibiotic resistance
(Kaczmarek, et al. , 2006). Nevertheless, the functions of the other two porins,
OmpK26 and OmpK34, are currently not understood. As OmpK35 and
OmpK36 have been described to be involved in the penetration of antibiotics
into bacterial cells and virulence mechanisms of K. pneumoniae, we focused
on these two particular porins in this study.
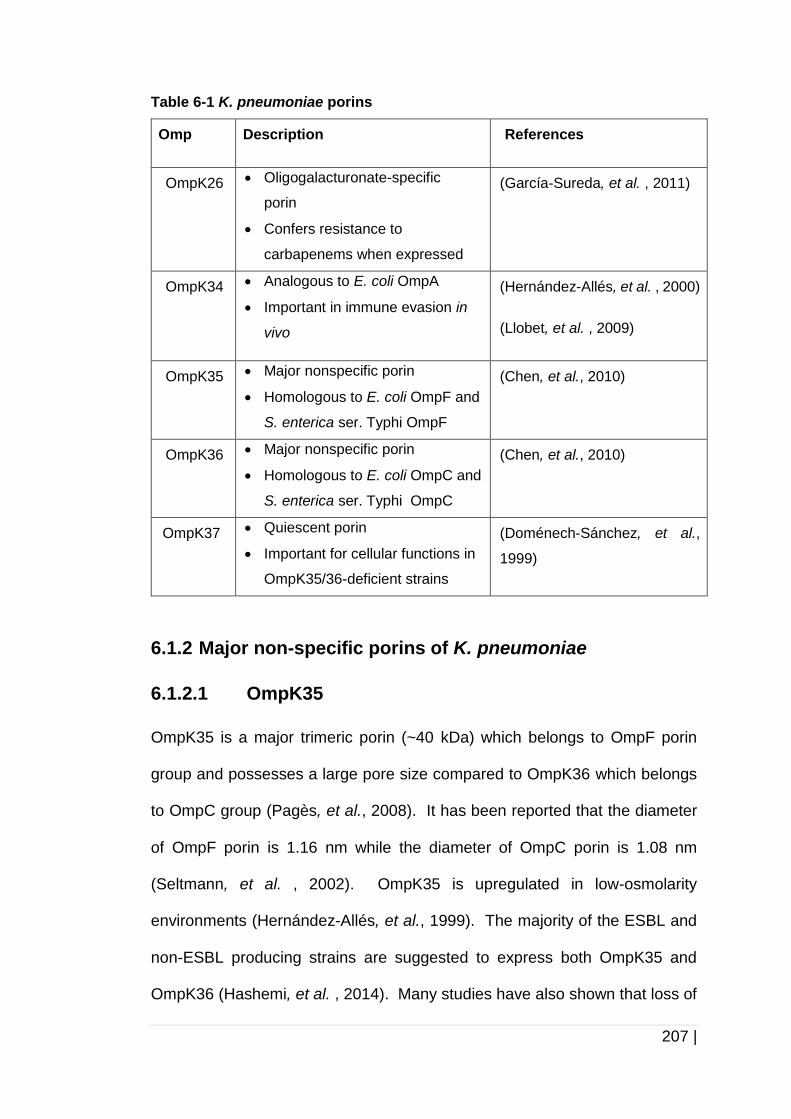
207 |
Table 6-1 K. pneumoniae porins
Omp Description References
OmpK26
Oligogalacturonate-specific
porin
Confers resistance to
carbapenems when expressed
(García-Sureda, et al. , 2011)
OmpK34
Analogous to E. coli OmpA
Important in immune evasion in
vivo
(Hernández-Allés, et al. , 2000)
(Llobet, et al. , 2009)
OmpK35
Major nonspecific porin
Homologous to E. coli OmpF and
S. enterica ser. Typhi OmpF
(Chen, et al., 2010)
OmpK36
Major nonspecific porin
Homologous to E. coli OmpC and
S. enterica ser. Typhi OmpC
(Chen, et al., 2010)
OmpK37 Quiescent porin
Important for cellular functions in
OmpK35/36-deficient strains
(Doménech-Sánchez, et al.,
1999)
6.1.2 Major non-specific porins of K. pneumoniae
6.1.2.1 OmpK35
OmpK35 is a major trimeric porin (~40 kDa) which belongs to OmpF porin
group and possesses a large pore size compared to OmpK36 which belongs
to OmpC group (Pagès, et al., 2008). It has been reported that the diameter
of OmpF porin is 1.16 nm while the diameter of OmpC porin is 1.08 nm
(Seltmann, et al. , 2002). OmpK35 is upregulated in low-osmolarity
environments (Hernández-Allés, et al., 1999). The majority of the ESBL and
non-ESBL producing strains are suggested to express both OmpK35 and
OmpK36 (Hashemi, et al. , 2014). Many studies have also shown that loss of
208 |
OmpK35 and/or OmpK36 contribute to increased resistance of K. pneumoniae
to antibiotics specifically for ESBL-producing strains. For example, loss of
OmpK35 porin may result in antibiotic resistance in K. pneumoniae
(Kaczmarek, et al., 2006), since several studies have shown that absence of
OmpK35 is quite prominent in most ESBL-producing strains with increased
resistance to cephalosporins and carbapenems (Doménech-Sánchez, et al.,
2003; Jacoby, et al. , 2004). However, other studies have shown that OmpK35
and/or OmpK36 deficiency appeared to serve as a minor factor and does not
significantly alter the MICs of carbapenems to K. pneumoniae (Hernández-
Allés, et al., 2000; Jiang, et al. , 2009).
6.1.2.2 OmpK36
OmpK36 is a ~38 kDa trimeric porin which belongs to the OmpC porin group.
It has a smaller channel size in comparison to OmpK35, (Schembri, et al.,
2004), owing to the existence of two bulkier side chains (Trp80 and Tyr123)
(Albertí, et al. , 1995) at the pore constriction site (Dutzler, et al. , 1999).
OmpK36 is among the most abundant Omps in K. pneumoniae as well as
OmpA (Hernández-Allés, et al., 1999). This osmoporin is upregulated in high
osmolarity medium specifically in high salt or high sugar concentration
environments (Lugtenberg, et al. , 1983).
As suggested by Tsai, et al. (2011), OmpK36 might play a role in virulence of
K. pneumoniae. An ompK36 mutant of K. pneumoniae strain NVT2001 was
shown to have decreased virulence and bacterial survival, compared to wild
type strain and OmpK35 mutant in a murine model. This was possibly due to
the increase susceptibility of OmpK36 mutant to phagocytic clearance by
209 |
neutrophils (Tsai, et al., 2011). The reduced virulence has also speculated to
be due to the build up of internal toxic substances, and subsequently blocking
of the channels that are used for import of nutrients, even though, no
observable effect on OmpK36 mutant growth was noted (Chen, et al., 2010).
In addition, Omps are also suggested to be involved in host-pathogen
interactions (Alcántar-Curiel, et al., 2013; Galdiero, et al., 2008). As
demonstrated by Albertí, et al. (1995), OmpK36 might be involved in C1q
interaction since a binding site for C1q (Lys279 and Lys281 from β strand 13
and Asp282 of L7) (Dutzler, et al., 1999) was found in the crystal structure of
OmpK36. Further studies by this group also confirmed that C1q binds to
OmpK36 porin at its globular domain (Albertí, et al. , 1996) to activate the
complement classical pathway.
Tsai, et al. (2011) and Wang, et al. (2009) also showed that loss of both or one
of the porins may reduce susceptibility to cephalosporins and carbapenems
respectively. Synergistic mechanisms between loss of porins and production
of β-lactams is also suggested to contribute to the emergence of antibiotic
resistant K. pneumoniae strains. A study by Kaczmarek, et al. (2006) showed
that carbapenem-resistance is mediated by ESBL or AmpC β-lactamases in
combination with the loss of OmpK35 or/and OmpK36 or by carbapenemases
alone. Findings by Wang, et al. (2009) also showed that OmpK36 might play
a significant role in the reduced susceptibility to carbapenems in
K. pneumoniae producing AmpC and β-lactamases. However, there are no
in-depth studies regarding the specific functions of these particular porins in
K. pneumoniae adhesion and biofilm formation to abiotic surfaces.
210 |
6.1.2.3 Structure of non-specific porins
In general, the structure of non-specific porins, for example, OmpK36 consists
of three water-filled functional units making up a trimer. In each monomer,
there are 16 antiparallel strands which form a β-barrel to transverse the cell
membrane with short turns at the periplasmic side and large loops at the
outside of the cells (Schulz, 2004). The strands are tilted by 30 ° to 60 ° in
reference to the β-barrel axis and the diameter increases depending on the
degree of tilting. The third loop, L3, however, extends into the barrel (often
called ‘the eyelet’) and is not exposed at a cell surface, forming a constricted
region to determine the permeability properties towards certain substances
(Figure 6-1) (Danelon, et al., 2004; Nikaido, 2003). The specific porins are
thought to have a similar structure to non-specific porins, even though they
have 18-strands in their β-barrel structures, in contrast to the non-specific
porins which just have 16-strands (Schulz, 2004).
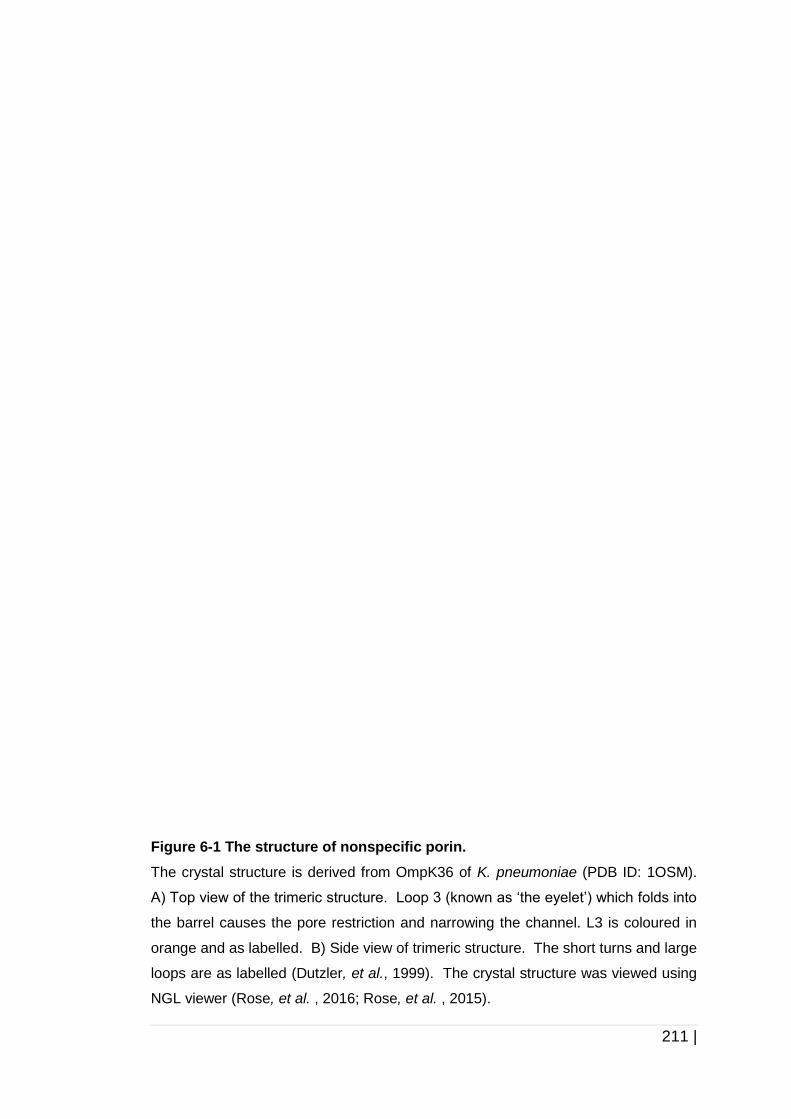
211 |
Figure 6-1 The structure of nonspecific porin.
The crystal structure is derived from OmpK36 of K. pneumoniae (PDB ID: 1OSM).
A) Top view of the trimeric structure. Loop 3 (known as ‘the eyelet’) which folds into
the barrel causes the pore restriction and narrowing the channel. L3 is coloured in
orange and as labelled. B) Side view of trimeric structure. The short turns and large
loops are as labelled (Dutzler, et al., 1999). The crystal structure was viewed using
NGL viewer (Rose, et al. , 2016; Rose, et al. , 2015).
212 |
6.1.3 Role of outer membrane porins (Omps) in biofilm
formation
Based on the results in Chapter 4, we found that proteins are likely to play an
important role in biofilm architecture and biofilm formation by K. pneumoniae.
We tested our hypothesis by investigating the role of type 1 fimbriae (T1F) in
biofilm formation by K. pneumoniae (Chapter 5), however, we could not really
establish a role for T1F in biofilm formation upon cultivation in both TSB and
AUM. We further hypothesised that another protein, outer membrane porins
(Omps), OmpK35 and OmpK36 could possibly have role in biofilm formation
by K. pneumoniae. This hypothesis was based on several previous
publications which have shown that ompC gene of E. coli, a homolog of
ompK36, has been found to be upregulated in cells growing within a biofilm of
E. coli (Prigent-Combaret, et al., 1999). In addition, OmpC also was
suggested to be involved in the first step of biofilm formation: initial adhesion
and also invasion of adherent-invasive E. coli (AIEC) to intestinal epithelial
cells, intestine-407 cells, under high osmolarity conditions (Rolhion, et al.,
2007).
Besides, the regulation of ompC is also shown to affect curli fimbriae
production (Prigent-Combaret, et al., 1999; Smith, et al. , 2017). Curli fimbriae
are essential surface components which are known to be involved in biofilm
formation by E. coli. The regulation of ompC and ompF is controlled under the
two-component EnvZ/OmpR system (detail is in section 6.14). This two-
component system is also implicated in the regulation of curli fimbriae
expression (Barnhart, et al. , 2006). Curli formation in E. coli are encoded by
two adjacent divergently transcribed csgBA and csgDEFG. csgB and csgA
213 |
encode for CsgB, the major structural subunit or curlin and CsgA, the nucleator
protein, respectively. While, csgD encodes for CsgD, a positive transcriptional
regulator for csgBA operon and also for csgEFG operon which encodes for
assembly components and transport factors (Barnhart, et al., 2006).
Increased phosphorylated outer membrane regulator (OmpR) is known to be
involved in increased transcriptional activation of ompC (Feng, et al. , 2003).
This subsequently affects the production of curli fimbriae since OmpR is known
to positively regulate curli fimbriae expression by activating csgD expression
(Prigent-Combaret, et al. , 2001). Since curli fimbrae assembly occurs at the
cell surfaces, genes involved in cell envelope and outer membrane biogenesis
are also thought to affect the production of curli fimbriae including ompC,
waaC, lpcA, and waaE (Smith, et al., 2017).
Although the correlation between regulation of ompC and curli fimbriae
expression in E. coli has been reported previously, there is still no evidence
regarding this kind of regulation in K. pneumoniae. Thus, it is important to
evaluate the contribution of Omps in biofilm formation by K. pneumoniae and
identify either the regulation of these porins would affect other surface proteins
(if any), such as fimbriae in K. pneumoniae that could eventually affect the
biofilm formation.
In addition, knowing the role of OmpC in the initial adhesion of E. coli on biotic
surfaces and also due to the fact that ompC is upregulated in E. coli biofilms,
we decided to explore the role of OmpK36 in biofilm formation by
K. pneumoniae on abiotic surfaces such as a silicone urinary catheter, as
214 |
almost 70-80 % of UTI (Nicolle, 2014) cases are attributed to the usage of
indwelling urinary catheters. In addition, it is clinically relevant since
K. pneumoniae is known as one of the most prevalent species causing
catheter-associated urinary tract infection (CAUTI) (Nicolle, 2014). Indwelling
devices also constitute a more attractive surface for bacterial adhesion and
biofilm formation since they do not have the protective mechanisms of mucosal
surfaces to bacterial infection, for example, exfoliation of bladder epithelial
cells (Ferrieres, et al. , 2007). Based on the previous observation, it is
suggested that exfoliation of epithelial cells and clearance of infected and
damaged bladder cells act as host defense mechanisms (Ferrieres, et al.,
2007; Mulvey, et al. , 2000).
Even though very few studies have looked for a relationship between Omps
and biofilm formation, there is still intriguing evidence from several studies,
which suggest that Omps might be involved in the formation of biofilms. OmpC
of S. enterica ser. Typhimurium was proposed to be involved in biofilm
formation of S. enterica ser. Typhimurium on cholesterol-coated surface
(Crawford, et al., 2010). In addion, a study by Prigent-Combaret, et al. (1999)
also suggested that ompC was upregulated in biofilm cells of E. coli. However,
to the best of our knowledge, there are no studies showing the relationship of
OmpK36, the homolog of these OmpC on biofilm formation by K. pneumoniae.
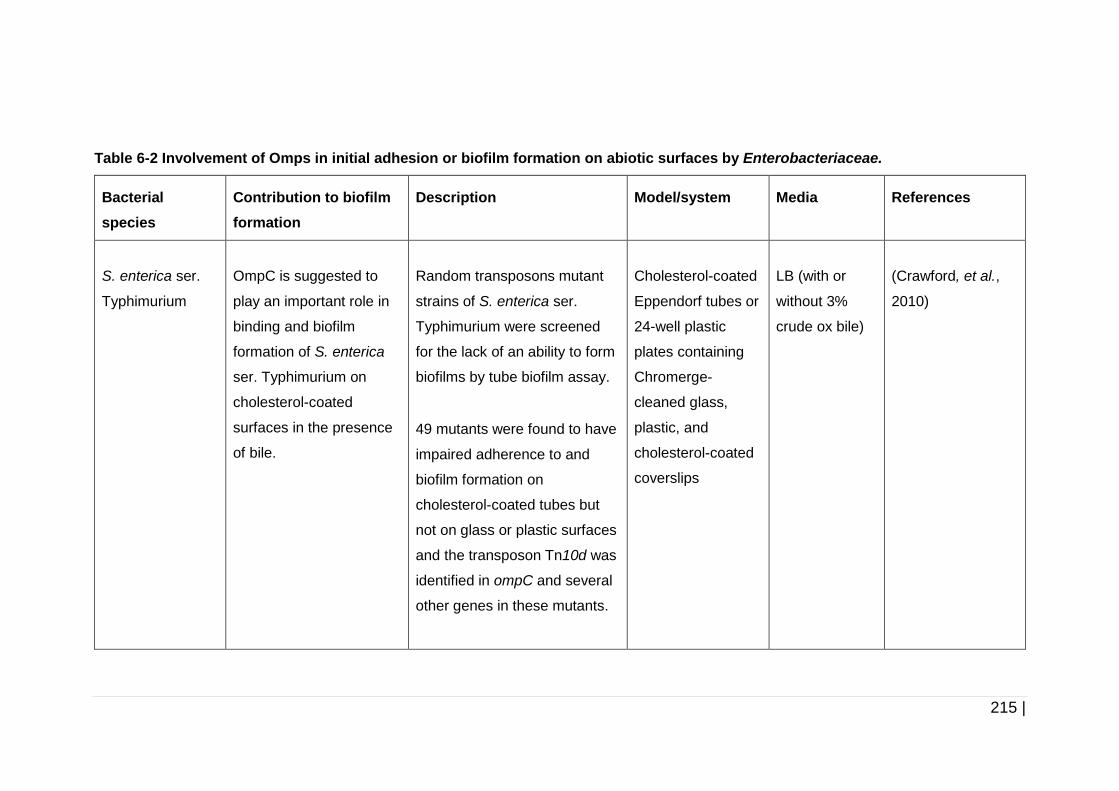
215 |
Table 6-2 Involvement of Omps in initial adhesion or biofilm formation on abiotic surfaces by Enterobacteriaceae.
Bacterial
species
Contribution to biofilm
formation
Description Model/system Media References
S. enterica ser.
Typhimurium
OmpC is suggested to
play an important role in
binding and biofilm
formation of S. enterica
ser. Typhimurium on
cholesterol-coated
surfaces in the presence
of bile.
Random transposons mutant
strains of S. enterica ser.
Typhimurium were screened
for the lack of an ability to form
biofilms by tube biofilm assay.
49 mutants were found to have
impaired adherence to and
biofilm formation on
cholesterol-coated tubes but
not on glass or plastic surfaces
and the transposon Tn10d was
identified in ompC and several
other genes in these mutants.
Cholesterol-coated
Eppendorf tubes or
24-well plastic
plates containing
Chromerge-
cleaned glass,
plastic, and
cholesterol-coated
coverslips
LB (with or
without 3%
crude ox bile)
(Crawford, et al.,
2010)
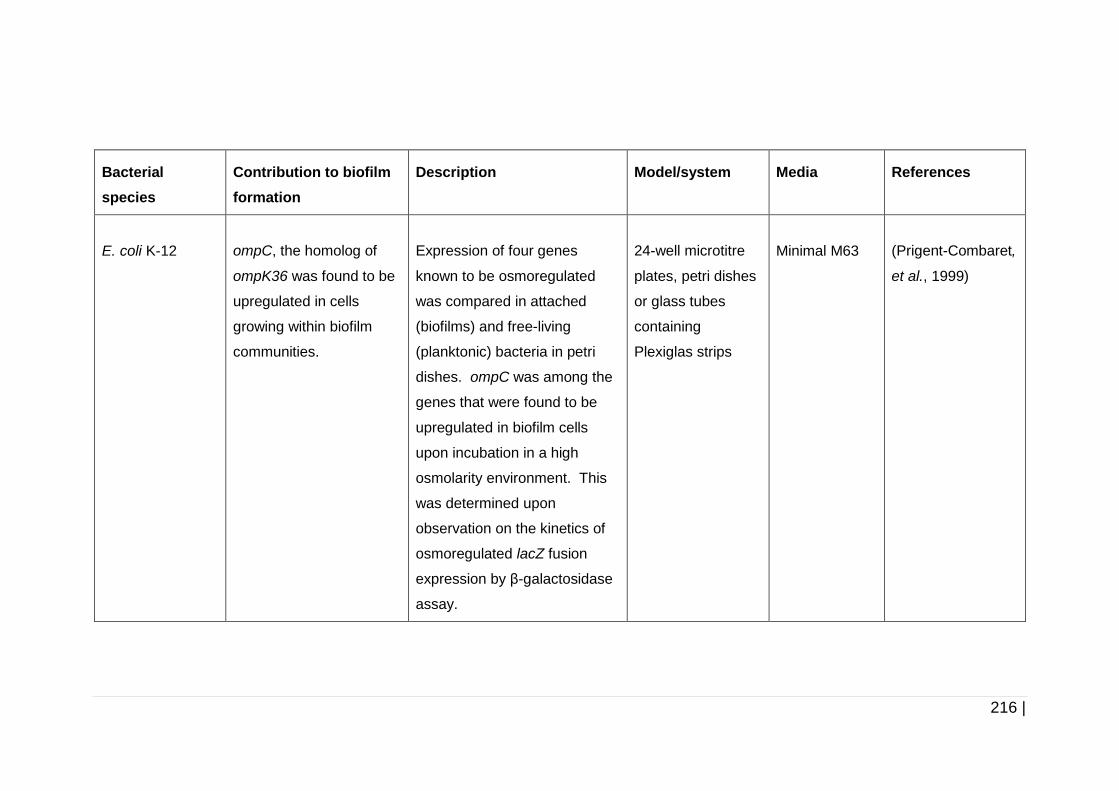
216 |
Bacterial
species
Contribution to biofilm
formation
Description Model/system Media References
E. coli K-12
ompC, the homolog of
ompK36 was found to be
upregulated in cells
growing within biofilm
communities.
Expression of four genes
known to be osmoregulated
was compared in attached
(biofilms) and free-living
(planktonic) bacteria in petri
dishes. ompC was among the
genes that were found to be
upregulated in biofilm cells
upon incubation in a high
osmolarity environment. This
was determined upon
observation on the kinetics of
osmoregulated lacZ fusion
expression by β-galactosidase
assay.
24-well microtitre
plates, petri dishes
or glass tubes
containing
Plexiglas strips
Minimal M63
(Prigent-Combaret,
et al., 1999)
217 |
6.1.4 Regulation of OmpK35 and OmpK36 expression
6.1.4.1 EnvZ-OmpR two-component system
The expression of OmpK35-OmpK36 (or OmpC-OmpF) is controlled by an
EnvZ-OmpR two-component system. This EnvZ-OmpR system is involved in
osmoregulation and responds to osmolarity changes in the environment
(Walthers, et al. , 2004). Expression of OmpK35 and OmpK36 is constitutive,
however, the expression levels of these porins individually is dependent on
the medium osmolarity. In low-osmolarity medium, OmpF (homolog of
OmpK35) is abundantly expressed, while in high-osmolarity medium,
expression of OmpF/OmpK35 is downregulated and expression of OmpC
(homolog of OmpK36) is upregulated (Feng, et al., 2003).
EnvZ is an osmosensor histidine kinase homodimer molecule, which
comprises of sensory histidine kinase domain (Feng, et al., 2003). This inner
membrane protein is comprised of short N-terminus tail in the cytoplasm, two
transmembrane regions, a periplasmic loop, and a large cytoplasmic domain
which contains histidine for EnvZ autophosphorylation (Wang, et al. , 2012).
OmpR is a cognate response regulator molecule; it consists of a receiver
domain and a DNA binding domains which binds to the OmpK35 or OmpK36
promoter and initiates the differential expression of these two porins
depending on the osmolality of the environment (Walthers, et al., 2004)
(Figure 6-2). The signaling cascade of this osmoregulation system can be
elucidated as i) the osmotic signal is detected by EnvZ and the sensor of this
histidine kinase is activated. Conformational changes in EnvZ are triggered
by variation of osmolarity in the environment, ii) EnvZ undergoes
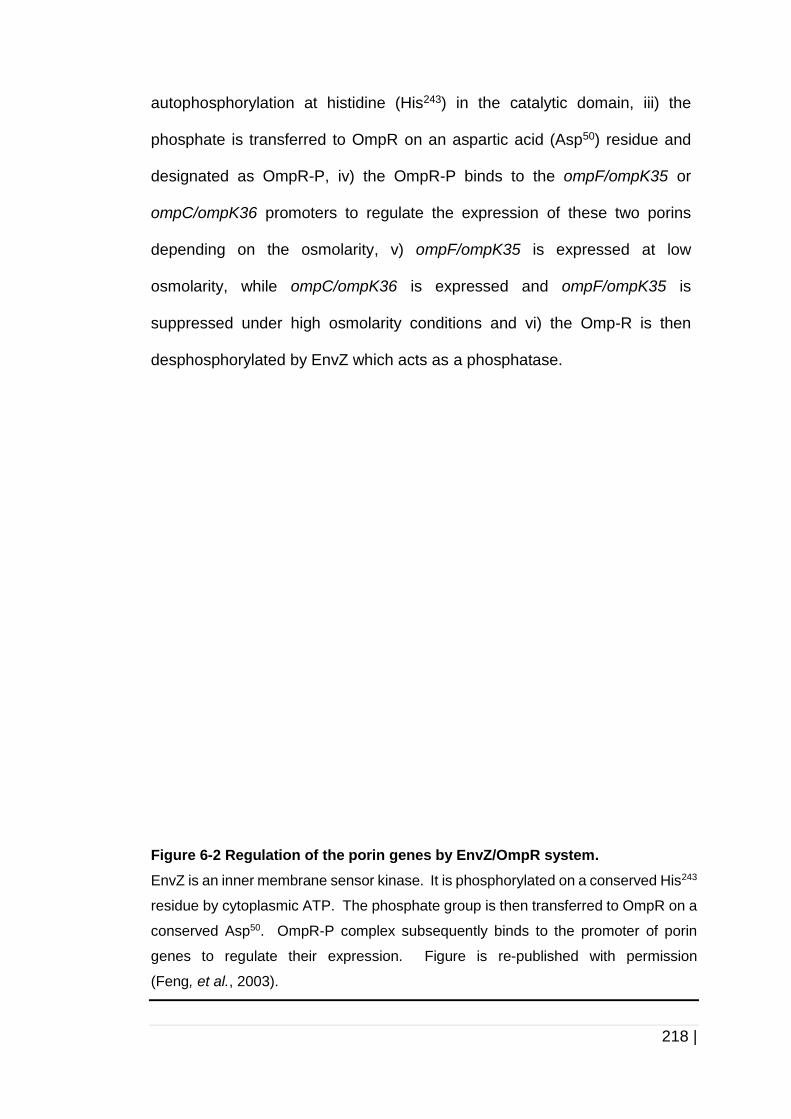
218 |
autophosphorylation at histidine (His243) in the catalytic domain, iii) the
phosphate is transferred to OmpR on an aspartic acid (Asp50) residue and
designated as OmpR-P, iv) the OmpR-P binds to the ompF/ompK35 or
ompC/ompK36 promoters to regulate the expression of these two porins
depending on the osmolarity, v) ompF/ompK35 is expressed at low
osmolarity, while ompC/ompK36 is expressed and ompF/ompK35 is
suppressed under high osmolarity conditions and vi) the Omp-R is then
desphosphorylated by EnvZ which acts as a phosphatase.
Figure 6-2 Regulation of the porin genes by EnvZ/OmpR system.
EnvZ is an inner membrane sensor kinase. It is phosphorylated on a conserved His243
residue by cytoplasmic ATP. The phosphate group is then transferred to OmpR on a
conserved Asp50. OmpR-P complex subsequently binds to the promoter of porin
genes to regulate their expression. Figure is re-published with permission
(Feng, et al., 2003).
219 |
6.1.5 K. pneumoniae and urinary tract infections
Urinary tract infections (UTIs) are the most common bacterial infections that
can affect the upper urinary tract, which comprised of the kidneys
(pyelonephritis), and the lower urinary tract, which includes the ureter, bladder
(cystitis), and urethra (urethritis) (Amalaradjou, et al. , 2011). UTIs normally
start as a cystitis (bladder infection) but can spread by infecting the kidneys
(pyelonephritis) which can result in renal failure. The infection can spread to
the circulatory system if the pathogens which caused the UTIs cross the
tubular epithelial barrier in the kidneys (Flores-Mireles, et al. , 2015).
UTIs can be categorised into two classes: uncomplicated and complicated.
Uncomplicated UTIs normally affect healthy individuals who have no structural
or functional urinary tract abnormalities, are not pregnant and who have not
been fitted with indwelling devices such as urinary catheters (Foxman, 2010).
While complicated UTIs are defined as infections, which are associated with
several factors that may compromise the urinary tract or host defense such as
immunosuppression, renal failure, pregnancy, presence of foreign bodies such
as indwelling catheters and calculi. In addition, medical or surgical
comorbidities are also frequently associated with complicated UTIs (Flores-
Mireles, et al., 2015; Neal, 2008). UTIs can be caused by Gram-negative and
Gram-positive bacteria. The most prevalent species that causes UTIs is
uropathogenic E. coli (UPEC), and these are followed by K. pneumoniae,
E. faecalis, P. mirabilis, and S. saprophyticus (Flores-Mireles, et al., 2015).
220 |
6.1.5.1 Catheter-associated urinary tract infections
(CAUTIs)
Catheter-associated urinary tract infections (CAUTIs) are the most common
nosocomial infections prevalent in US hospitals and nursing homes. They are
associated with over than 1 million cases each year (Tambyah, et al. , 2000).
In England, 19.7 % of nosocomial infections are related with UTIs, and
between 43 % and 56 % of these cases are reported to be associated with
urinary catheter (Hopkins, et al. , 2012; Loveday, et al. , 2014; Smyth, et al. ,
2008). Urinary tract catheters are prescribed as soon as an individual has
impaired bladder function and reduced capacity to permit urinary drainage.
Other than this reason, there are several factors that contribute to prescription
of urinary catheters, for example, urinary retention, urinary incontinence,
bladder irrigation, and post-operative patients (Feneley, et al. , 2015). The
usage of indwelling urinary catheters is classified as short term if the catheters
are in situ for less than a month and long term when in situ for more than 30
days (Tambyah, et al., 2000).
6.1.5.2 Biofilms on catheters
Biofilm formation in catheters is a serious problem related to nosocomial
infections and it is noted that eradication of biofilms is very difficult.
K. pneumoniae is established as one of the important causes of CAUTIs right
after E. coli (Wilson, et al. , 2004). This is partly because of the capacity of
K. pneumoniae to produce urease (Nicolle, 2014), which catalyses the
hydrolysis of urea to carbon dioxide and ammonia. The production of urease
may facilitate the formation of a crystalline biofilm and this subsequently will
cause biofilm-associated infections. Biofilms in a catheter normally form in
221 |
the eyehole, in the catheter itself (Stickler, et al. , 2003), or in the drainage
bag (Nicolle, 2014).
6.1.6 Aims of this chapter
In our study, we generated ompK35 and ompK36 mutants in two different
strains of K. pneumoniae: Kpneu_1, a clinical strain isolated from blood and
C3091, a laboratory strain, which was originally isolated from UTI patient. The
molecular techniques used for mutant construction of ompK35 and ompK36
will be discussed in this chapter. The phenotypic assays comparing the MIC
of antibiotics and antiseptic for Kpneu_1 and C3091 parental strains and their
isogenic mutant strains will also be presented. Subsequently, the capacity of
these mutant strains to form biofilm on abiotic surfaces will be described.
222 |
6.2 Materials and methods
6.2.1 Bacterial strains and plasmid
E. coli -select (silver efficiency) was used for cloning of pGEM-T Easy
(Promega, UK) mutant constructs harbouring mutant cassettes (containing
flanking regions of the gene of interest with erm1(B) or aad9 selective marker
genes inserted in between of the flanking regions) or pUC19-tet(M)
harbouring putative complementation cassettes (containing ompK35 or
ompK36 with their putative promoters). Six strains: Kpneu_1, Kpneu_63,
Kpneu_64, Kpneu_65, Kpneu_110, and C3091 were used for ompK35 and
ompK36 screening. The mutant cassettes were constructed using the
ompK35 sequences from Kpneu_1 and ompK36 sequences from Kpneu_63,
Kpneu_65, and C3091. Strain Kpneu_1 and C3091 were used as the hosts
for development of ompK35 or ompK36 mutant strains. All strains were grown
on LB agar at 37 C for 16 h or with shaking at 200 rpm if cultivated in broth
with appropriate concentrations of antibiotic(s). All the constructs and strains
used in this study are summarised in Table 2-1 and Table 2-6 in Chapter 2.
6.2.2 Determination of genetic context of ompK35 and
ompK36 of K. pneumoniae
The genetic context of ompK35 and ompK36 was determined by first,
amplifying ~500 bp upstream and downstream regions of ompK35 and
ompK36 of K. pneumoniae. The upstream and downstream regions of
ompK35 and ompK36 were amplified using 35_KO1_2 and 35_KO4_3 or
36_KO1 and 36_KO4_4 primer sets, respectively. The PCR product was then
purified and sequenced. Multiple sequence alignment of upstream and
223 |
downstream regions of ompK35 and ompK36 were then conducted using
BioEdit and GeneDoc. The promoter and terminator sites for ompK35 and
ompK36, and also for the genes located upstream and downstream of ompK35
and ompK36 were predicted using BPROM (Softberry, Inc., NY) and ARNold
Finding Terminators (Naville, et al., 2011). The promoter site of rscD was
predicted based on the sequence obtained from Genbank (Accession no:
CP006648.1) since the amplified upstream region of ompK36 derived from the
strains used in this study could not cover the region with predicted promoter
site for rcsD.
6.2.3 Analysis of protein structure
We previously hypothesised that OmpK36 could possibly have an effect on
biofilm formation by K. pneumoniae since its homolog, OmpC was established
to be involved in the first step of biofilm formation, initial adhesion of E. coli on
epithelial cells. Before we further investigated the role of OmpK36 in biofilm
formation by K. pneumoniae, we firstly compared the protein structure of
OmpC (as a template) and OmpK36 (as a target). In addition, we also
compared the protein structure of OmpK36 (as a template) with predicted
structure of OmpK35 (as a target). Comparative protein structural analysis
was conducted by comparing the amino acid sequences and structural
alignment of the templates with the target sequence or structure. The
purposes of this protein structural analysis were; i) to align three-dimensional
(3D) structures of OmpC and OmpK36 and to obtain an idea regarding their
structural similarity and ii) to predict OmpK35 protein structure using homology
modelling using OmpK36 as a template. The dataset used for the templates
224 |
were obtained from Protein Data Bank (PDB). It included the amino acid
sequences and 3D structures of OmpC (PDB ID: 2J1N) and OmpK36 (PDB
ID: 1OSM) of E. coli and K. pneumoniae respectively. The 3D structures were
then generated using USCF Chimera 1.12rc (Pettersen, et al., 2004)
software.
The deduced amino acid sequence of OmpK35 derived from Kpneu_1 was
obtained by translating the nucleotide sequence using EMBOSS-Transeq
(Rice, et al., 2000). The in silico 3D structure prediction of OmpK35 was
conducted using template-based homology modelling. It was carried out by
searching the PDB for known protein structures using OmpK35 amino acid
sequences as the query, and the structure was then predicted using SWISS-
MODEL (Biasini, et al., 2014). The template structure was chosen based on
the highest sequence similarity to the query sequence. OmpK36 (PDB ID:
1OSM) was selected as a template for OmpK35 structure prediction and the
prediction was conducted by SWISS-MODEL (Biasini, et al., 2014). The
predicted model was illustrated using Chimera 1.12rc (Pettersen, et al.,
2004). The target-template alignment for comparative modelling was
established by superimposing the 3D structural alignment or superimposition
of OmpC and OmpK36, and also between OmpK36 and OmpK35. The
percentage of amino acid sequence identity and root-mean-square distance
(RMSD) between both structures were recorded. RMSD is the average
distance of atoms pairs in two macromolecules. This RMSD value is
calculated to determine the structural similarity between two 3D protein
structures, the reference protein structure and the superimpose protein
structure (Carugo, et al. , 2001). Two identical protein structures will have
225 |
RMSD value of 0 Å and the higher the RMSD the more dissimilar the protein
structures.
6.2.4 Development of ompK35 and ompK36 mutant strains
6.2.4.1 Screening of ompK35 and ompK36
All of the six strains were screened for ompK35 and ompK36 prior to mutant
development. The PCR was conducted using the following method mentioned
in Chapter 2 and list of primers are listed in Table 2-7 in Chapter 2.
6.2.4.2 Construction of mutant constructs using SOE PCR
Mutant constructs of ompK35 or ompK36 were generated by conducting
splicing by overlap and extension (SOE) PCR that amplifying a region
upstream (~500 bp) (5’) and a region downstream (~500 bp) (3’) from a
targeted gene, with an erythromycin resistance gene (erm1(B)). The erm1(B)
gene was chosen as a selective marker since none of the six K. pneumoniae
strains harboured the erm1(B) gene (data not shown). Two DNA fragments
(~500 bp for each upstream or downstream region) that flanked the regions
to be deleted (ompK35 or ompK36) were amplified using specific primers,
listed in Table 2-7 (in Chapter 2, section 2.4.2), from genomic DNA of
Kpneu_1, Kpneu_63, Kpneu_65, and C3091 strains. For ompK35 mutant
construction, the primer sets of 35_KO1 and 35_KO2 (to amplify Fragment
1_35 – the upstream region of ompK35) and 35_KO3 and 35_KO4 (to amplify
Fragment 2_35 – the downstream region of ompK35) were used. While the
flanking regions of ompK36 were amplified using primer sets of 36_KO1 and
36_KO2 (to amplify Fragment 1_36 – the upstream region of ompK36) and
36_KO3 and 36_KO4 for Kpneu_1, Kpneu_63, and Kpneu_65 or combination
226 |
between 36_KO3 and 36_KO4_2 for Kpneu_64, Kpneu_110, and C3091) (to
amplify Fragment 2_36 – the downstream region of ompK36) primer sets.
The upstream 40 bp primers of 35_KO2 and 36_KO2 (the reverse primers to
amplify Fragment_1) contained 20 bp with complementary to the upstream
region of the gene to be replaced and 20 bp of nucleotide sequence that was
homology to the first 20 bp of erm1(B) including the ribosome binding site
(RBS). Whilst, the downstream 40 bp primers of 35_KO3 and 36_KO3 (the
forward primers to amplify Fragment 2) contained 20 bp of nucleotide
sequence that complementary to the last 20 bp of erm1(B) gene and 20 bp
homology to the downstream region of the gene to be replaced. The erm1(B)
gene cassette was amplified from C. difficile 630 genomic DNA using 35_KO5
and 35_KO6 (to amplify the Fragment 3 with the 20 bp complementary to the
upstream and homology to downstream regions of ompK35) or 36_KO5 and
36_KO6 (to amplify the Fragment 3 with the 20 bp complementary to the
upstream and homology to the downstream regions of ompK36) primer sets.
The 40 bp primers of 35_KO5 and 35_KO6, and 36_KO5 and 36_KO6 primer
sets contained first 20 bp complementary and last 20 bp homology of the
erm1(B) gene and extension of 20 bp with complementary to the upstream
and homology to downstream region of ompK35 or ompK36.
These three purified PCR products (Fragment 1, Fragment 2, and Fragment
3) obtained from individual PCR were mixed at equimolar concentrations. This
was followed by an overlap and extension PCR using the 35_KO1_3 and
35_KO4_2 or the 36_KO1_2 and 36_KO4_3 primer sets to generate a mutant
cassette consisting of erm1(B), flanked by ~500 bp of the upstream and
downstream regions of the target gene to be replaced. The simplified method

227 |
is shown in Figure 6-3. The resulted ~1.8 kbp PCR product was purified by
gel extraction and ligated into the pGEMT-Easy vector (Promega, UK).
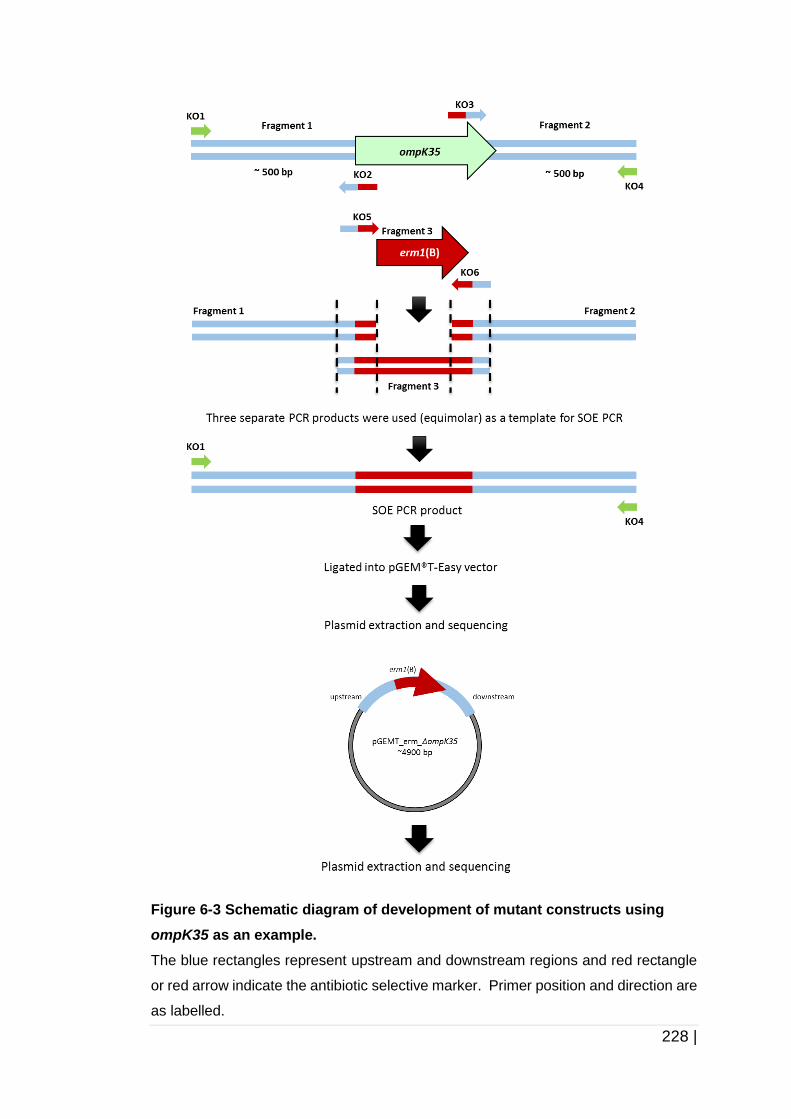
228 |
Figure 6-3 Schematic diagram of development of mutant constructs using
ompK35 as an example.
The blue rectangles represent upstream and downstream regions and red rectangle
or red arrow indicate the antibiotic selective marker. Primer position and direction are
as labelled.
229 |
Transformation by heat shock was conducted as described in Chapter 2,
section 2.4.11. The cells were subsequently plated onto LB agar plates
containing 100 µg/ml ampicillin (amp), 200 µg/ml erythromycin (erm),
50 µg/ml X-gal and 100 µM IPTG, and incubated at 37 °C for 48 h. The white
colonies were selected and grown at 37 °C for 16 h in LB broth containing
100 µg/ml amp and 200 µg/ml erm under 200 rpm shaking conditions. The
plasmid was then extracted and digested with EcoRI (NEB, UK). The digested
product was separated on a 1.0 % agarose gel by electrophoresis to
determine the size of the constructs and plasmids with the correct insert size
were sent for sequencing. A plasmid with correct insert and sequence was
designated as pGEMT_erm_∆ompK35 and pGEMT_erm_∆ompK36. The
plasmid was then used as a template for PCR to amplify the mutant cassettes
using high fidelity (HF) polymerase, Q5 polymerase (Chapter 2 section 2.4.3).
The amplified HF-PCR product was then purified by gel extraction and the
DNA was concentrated (SPD1010 Integrated SpeedVac, Thermo Scientific,
UK) prior to electroporation into electrocompetent K. pneumoniae cells.
Uncountable colonies were observed after incubation at 37 C for 16 h on
LB-erm 400 µg/ml. The colonies were then selected and screened for allelic
exchange using: 1) 35_KO1_2 and 35_KO4_3 primers for confirmation of
ompK35 deletion and 36_KO1 and 36_KO4_4 primers for confirmation of
ompK36 deletion, 2) specific target genes primer, OmpK35_scr_F and
OmpK35_scr_R, or OmpK36_scr_F and OmpK36_scr_R for ompK35 and
ompK36 respectively, and 3) selectable marker gene primer, ermBF and
ermBR to amplify erm1(B) region. However, no mutants were successfully
obtained. Suspecting that erm1(B) was not a suitable marker to be used for
230 |
mutant construct development, the mutant constructs were then re-developed
by replacing erm1(B) with a different selective marker, spectinomycin
resistance gene (aad9).
6.2.4.3 Construction of new mutant cassettes using aad9
as a selective marker
Since the development of mutant strains using erm1(B) as a selective marker
was unsuccessful, construction of new mutant cassettes was carried out by
replacing erm1(B) with add9 (Figure 6-4). aad9 was amplified using primer
Spect_HindIII_GC_F and Spect_HindIII_GC_R primer set and plasmid
pLR16T as a template. The pGEMT backbone together with upstream and
downstream regions of ompK35 or ompK36 was amplified using 35D_BB
_HindIII_GC_F and 35U_BB_HindIII_GC_R primer set for plasmid backbone
including ompK35 flanking regions and 36D_BB_HindIII_GC_F and
36U_BB_HindIII_GC_R primer set for plasmid backbone including ompK36
flanking regions, and pGEMT_erm_∆ompK35 and pGEMT_erm_∆ompK36
as template. The amplified PCR products, including the plasmid backbone
and aad9 were purified and digested using HindIII at 37 °C for 1 h. The
plasmid backbone was dephosphorylated and further purified together with
the digested aad9 fragment. Purified insert (aad9) and plasmid backbone
were ligated using T4 DNA ligase at 16 C for 16 h. The ligated product was
transformed into E. coli -select competent cells using the heat shock
method. Transformants were selected on LB agar plates containing
100 µg/ml amp, 100 µg/ml spectinomycin (spc), 50 µg/ml X-gal and 100 µM
IPTG. After 16 h incubation at 37 C, colonies were picked and grown in LB
broth containing 100 µg/ml amp and 100 µg/ml spc and incubated at 37 °C
231 |
for 16 h under 200 rpm shaking condition for plasmid extraction. The
extracted plasmids were digested with HindIII to confirm the correct size of
the insert. The plasmids were also used as a template for colony PCR
screening using insert primer, Spect_HindIII_F_GC and Spect_HindIII_R_GC
and mutant cassette primer sets, 35_KO1_3 and 35_KO4_2 or 36_KO1_2
and 36_KO4_3. The amplicons were separated on a 1.0 % agarose gel by
electrophoresis. The plasmids with the correct insert size were sent for
sequencing to confirm the correct insert. Plasmids with the correct insert and
sequences were designated as pGEMT_spc_∆ompK35 and
pGEMT_spc_∆ompK36. The plasmids obtained from this experiment were
listed in Table 2-6 in Chapter 2.
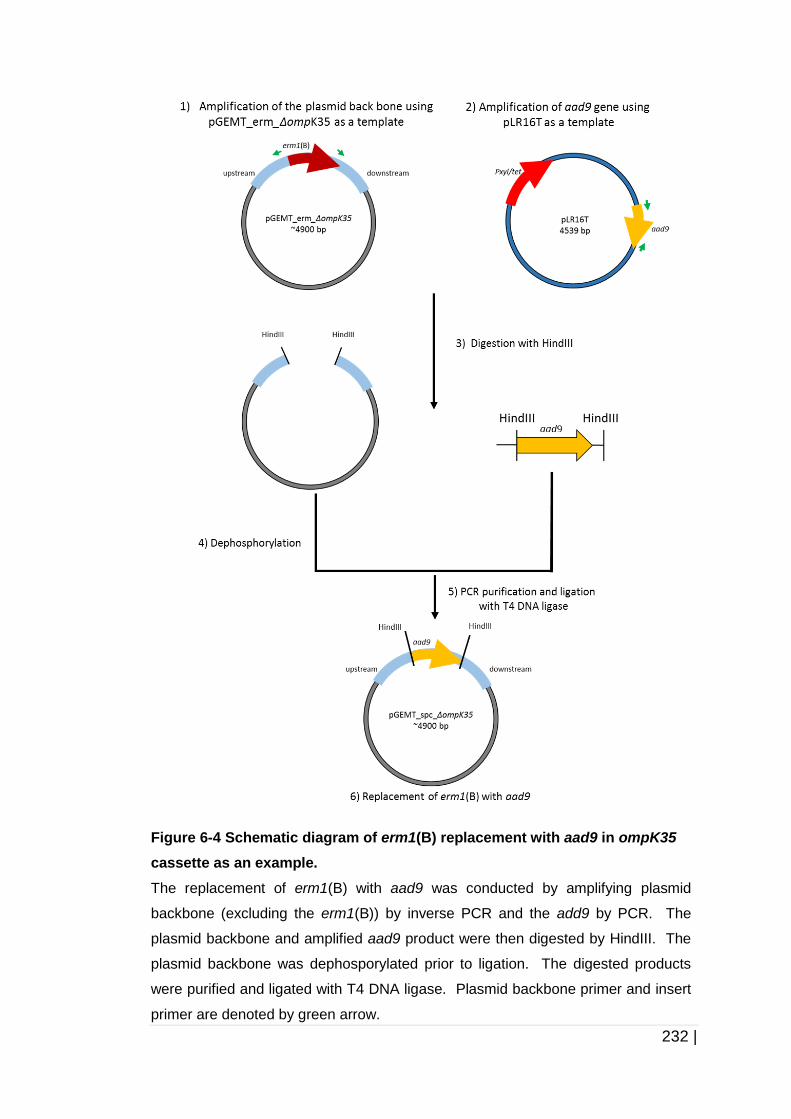
232 |
Figure 6-4 Schematic diagram of erm1(B) replacement with aad9 in ompK35
cassette as an example.
The replacement of erm1(B) with aad9 was conducted by amplifying plasmid
backbone (excluding the erm1(B)) by inverse PCR and the add9 by PCR. The
plasmid backbone and amplified aad9 product were then digested by HindIII. The
plasmid backbone was dephosporylated prior to ligation. The digested products
were purified and ligated with T4 DNA ligase. Plasmid backbone primer and insert
primer are denoted by green arrow.
233 |
6.2.4.4 Modification of the pKD46 helper plasmid by
replacing bla with aac(3)-IV
An attempt was taken to use a recombineering (homologous recombination-
mediated genetic engineering) method based on the Red recombinase
system (Wei, et al. , 2012) since previous attemps without pKD46 as a helper
plasmid did not result in any K. pneumoniae mutant strains. Temperature
sensitive pKD46 was used in this recombineering approach (provided
generously by Dr Sophie Halen, Imperial College) (Datsenko, et al., 2000).
This plasmid harbours exo, beta, and gam, which encode for Exo, Bet and
Gam proteins. Exo (red α), is an exonuclease (5’-3’) that digests the double-
stranded DNA and generates 3’ single-stranded DNA tails. While Bet (red β)
is a single strand DNA annealing protein that binds to the complementary
ssDNA strand, and Gam (red γ) protein protects linear extraneous DNA from
being degraded by host nucleases, RecBCD (Wei, et al. , 2013; Wei, et al.,
2012). The ampicillin resistance marker in pKD46, bla was replaced with
aac(3)-IV, apramycin resistance gene (the same approach as mentioned in
Figure 6-4) since all of the examined K. pneumoniae strains were resistant to
ampicillin. The aac(3)-IV gene was amplified using apra_HindIII_GC_F and
apra_HindIII_GC_R primer set and plasmid pSET152 as a template. Whilst,
the backbone of plasmid pKD46 (without the bla) was amplified using primer
pKD46_HindIII_GC_F and pKD46_HindIII_GC_R primer set and plasmid
pKD46 as a template. The amplified PCR products (pKD46 backbone and
aac(3)-IV insert) were purified, digested using HindIII, ligated (see Figure 6-
5) and transformed into E. coli -select competent cells as previously
mentioned. LB agar plates containing 50 µg/ml apramycin (apra) were used
234 |
as selective media. After incubation at 30 C for 24 h, colonies were picked
and grown in LB broth containing 100 µg/ml amp and 50 µg/ml apra, and
incubated at 30 °C for 16 h for plasmid extraction. Since pKD46 has a
temperature sensitive origin of replication, oriR101/repA101ts, cells
harbouring the plasmid must be grown at 30 C. The extracted plasmid was
digested with HindIII to confirm the insert. The plasmid was also used as a
template for PCR screening using apra_HindIII_GC_F and
apra_HindIII_GC_R primer set. The purified insert from the putative plasmids
were then sequenced and the confirmed plasmid was designated as pKD46-
apra. The plasmid obtained from this experiment was listed in Table 2-6 in
Chapter 2.
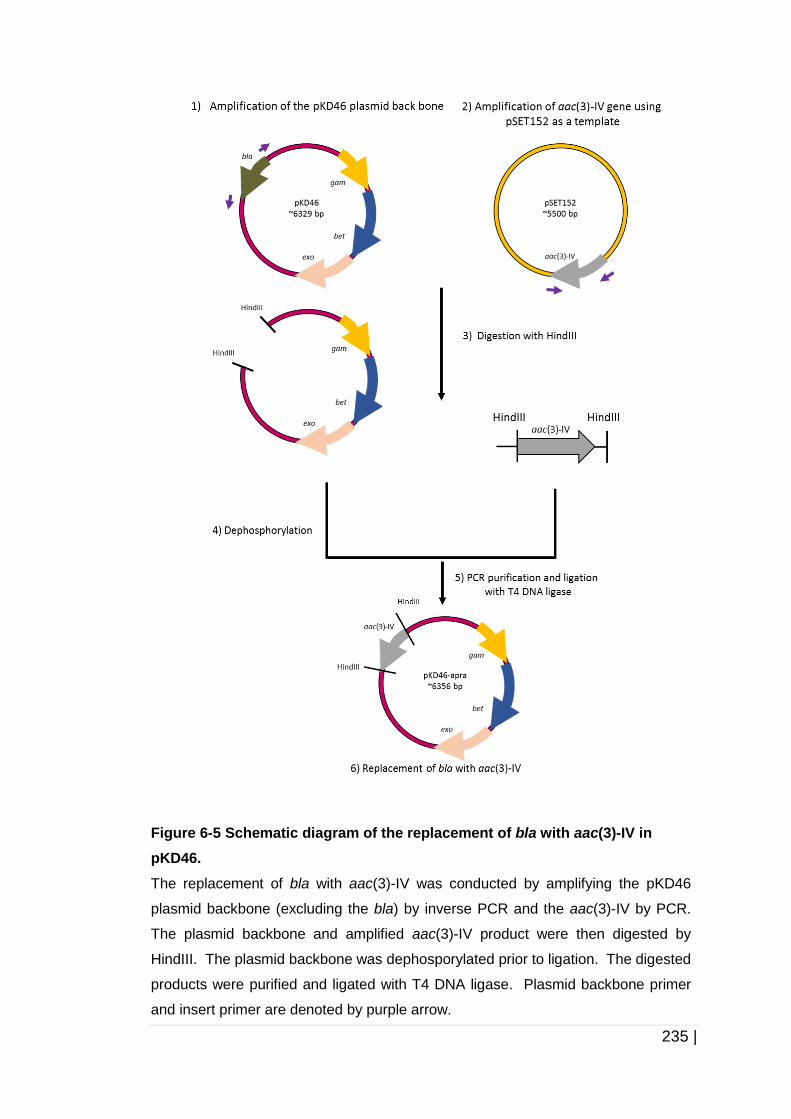
235 |
Figure 6-5 Schematic diagram of the replacement of bla with aac(3)-IV in
pKD46.
The replacement of bla with aac(3)-IV was conducted by amplifying the pKD46
plasmid backbone (excluding the bla) by inverse PCR and the aac(3)-IV by PCR.
The plasmid backbone and amplified aac(3)-IV product were then digested by
HindIII. The plasmid backbone was dephosporylated prior to ligation. The digested
products were purified and ligated with T4 DNA ligase. Plasmid backbone primer
and insert primer are denoted by purple arrow.
236 |
6.2.4.5 Preparation of electrocompetent K. pneumoniae
cells
A single colony of K. pneumoniae was grown in 5 ml of LB broth at 37 C for
16 h with 200 rpm shaking prior to preparation of electrocompetent cells. The
100 µl of 16 h culture was then used as a starter culture and inoculated in
10 ml LB broth (with the starting OD600 of 0.05) and incubated at 37 C with
200 rpm shaking until OD600 of 1.5. The mid-log phase culture was
centrifuged at 11952 x g for 30 min at 4 C (Sorvall RC5B plus, SS-34 Sorvall
rotor). The supernatant was decanted and the pellet was re-suspended with
1 ml of ice-cold molecular grade water. The suspension was then centrifuged
at 17950 x g for 15 min at 4 °C (Eppendorf 5417R). The supernatant was
discarded and the pellet was re-suspended in 1 ml of ice-cold molecular grade
water. This washing step was repeated three times. All the procedures were
carried out on ice. The electrocompetent cells were re-suspended in 1 ml
molecular grade water with 20 % glycerol and kept at -80 C until needed.
237 |
6.2.4.6 Electroporation of pKD46-apra into
electrocompetent K. pneumoniae cells
The electroporation was carried out using the method by Fournet-Fayard, et
al. (1995) with some modifications. The electrocompetent cells were thawed
on ice together with pKD46-apra plasmid DNA. Five microlitres of 200 ng/µl
plasmid DNA was added to 50 µl of thawed electrocompetent cells. The
mixture was mixed by flicking the bottom of the tube. The mixture was
incubated on ice for 5 min and transferred into a pre-chilled 1 mm
electrocuvette (Bio-Rad, US) using a pipette. The plasmid was electroporated
into the electrocompetent cells using a Gene Pulser II (Bio-Rad, UK)
apparatus set at 1.8 kV, 50 µF capacitance, 200 resistance. Following the
pulse, 950 µl of sterile BHI was added to the mixture and incubated at 30 C
for 2 h with 200 rpm shaking. After incubation, 200 µl of the culture was plated
onto LB agar supplemented with apra 50 µg/ml and incubated at 30 C for
24 h. Transformants obtained from the electroporation were then screened
for the aac(3)-IV insert and pKD46 plasmid backbone by PCR using
apra_HindIII_GC_F and apra_HindIII_GC_R, and pKD46_HindIII_GC_F and
pKD46_HindIII_GC_R primer set. The purified PCR product was
subsequently sent for sequencing. The confirmed strains were designated as
Kpneu_1/pKD46-apra or C3091/pKD46-apra. The strains obtained from this
experiment were listed in Table 2-1 in Chapter 2.
238 |
6.2.4.7 Preparation of electrocompetent K. pneumoniae
harbouring pKD46-apra cells
The preparation of electrocompetent Kpneu_1/pKD46-apra and
C3091/pKD46-apra cells was conducted according to the previous method
mentioned in 6.2.4.6 with some modifications. Single colony of
Kpneu_1/pKD46-apra or C3091/pKD46-apra was inoculated into 5 ml of LB
broth with 50 µg/ml of apramycin and incubated at 30 °C for 16 h with
200 rpm shaking. One hundred microlitres of 16 h culture was used as a
starter culture (with an OD600 of 0.05) and inoculated in 10 ml LB broth with
50 µg/ml of apramycin. The culture was grown until it reached OD600 of 0.1
and 100 mM of L-arabinose (Sigma) was added (to induce the PBAD promoter
of the araBAD (arabinose) operon) into the culture and further incubated at
30 °C until it reached OD600 of 0.4. The culture was chilled on ice for 5 min
and centrifuged at 4500 x g for 15 min at 4° C (Eppendorf 5804R). The
supernatant was discarded and the pellet was washed with 2 ml of ice-cold
molecular grade water. The suspension was aliquoted into microcentrifuge
tubes (1 ml for each tube) and centrifuge at 17950 x g for 15 min at 4° C
(Eppendorf 5417R). The supernatant was discarded and the pellet was
washed with 1 ml of ice-cold molecular grade water. This washing step was
repeated for three times. All the procedures were carried out on ice. The
electrocompetent cells were subsequently re-suspended in 1 ml molecular
grade water with 20 % glycerol and kept at -80 C until needed.
239 |
6.2.4.8 Electroporation of ompK35 and ompK36 mutant
cassettes into electrocompetent K. pneumoniae harbouring
pKD46-apra cells
The amplification of mutant cassettes was conducted by high-fidelity PCR
(HF-PCR) using pGEMT_spc_∆ompK35 or pGEMT_spc_∆ompK36 as a
template. The PCR product was separated on a 1 % agarose gel by
electrophoresis and the expected bands were excised and purified. Five
microlitres of the gel purified mutant cassettes DNA (100 ng/µl) was
subsequently electroporated into 50 µl of thawed electrocompetent
Kpneu_1/pKD46-apra or C3091/pKD46-apra cells as previously mentioned
with some modifications. The outgrowth incubation was conducted at 37 °C
for 1 h and 30 min instead of 30 °C for 2 h to cure the thermosensitive pKD46-
apra plasmid. The culture was plated on LB-spc 100 µg/ml and incubated at
37 C for 16 h. Several colonies were obtained upon incubation. The
occurrence of allelic exchange was confirmed by PCR using the 1) 35_KO1_2
and 35_KO4_3 primer for confirmation of ompK35 deletion and 36_KO1 and
36_KO4_4 primer for confirmation of ompK36 deletion, 2) specific target
genes primer, OmpK35_scr_R and OmpK35_scr_F or OmpK36_scr_F and
OmpK36_scr_R for ompK35 and ompK36 respectively, and 3) selectable
marker gene primer, Spect_HindIII_GC_F and Spect_HindIII_GC_R to
amplify the aad9 instead of the primers to amplify erm1(B). The purified PCR
product was then sent for sequencing for validation. The sequencing results
of the PCR products of the mutant strains were analysed by multiple
sequence alignments using BioEdit and GeneDoc.
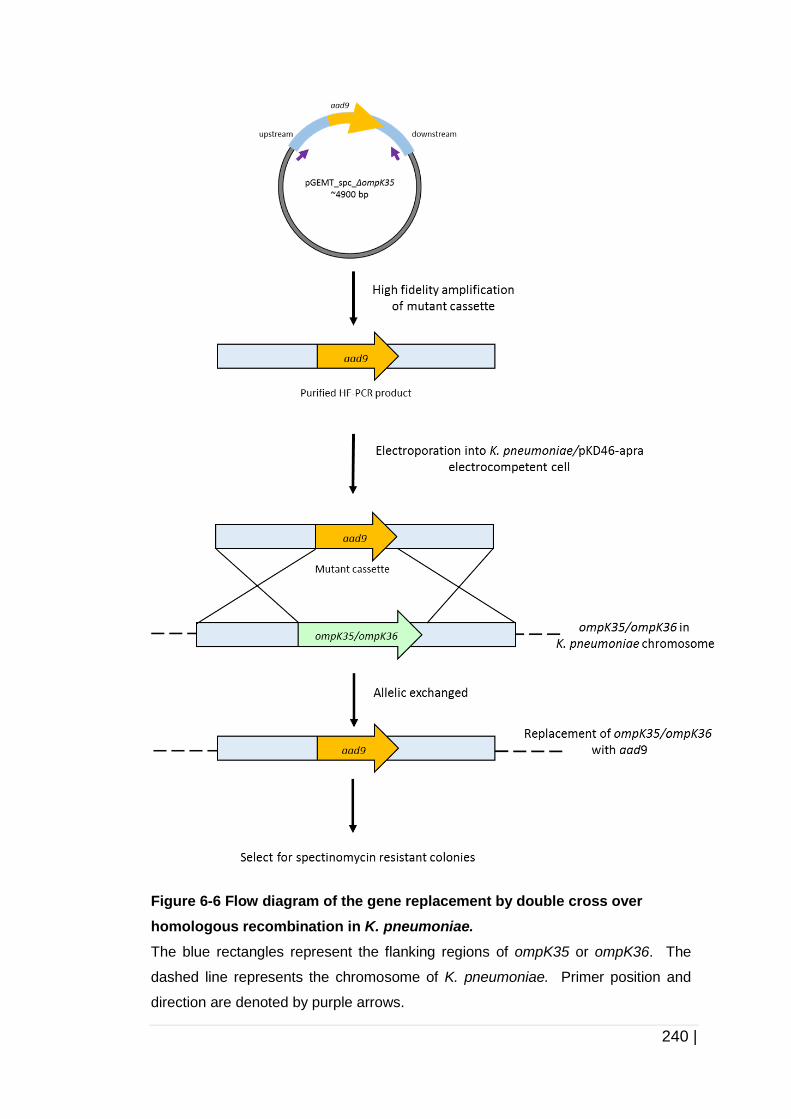
240 |
Figure 6-6 Flow diagram of the gene replacement by double cross over
homologous recombination in K. pneumoniae.
The blue rectangles represent the flanking regions of ompK35 or ompK36. The
dashed line represents the chromosome of K. pneumoniae. Primer position and
direction are denoted by purple arrows.
241 |
6.2.5 Complementation of ompK35 and ompK36 strains
6.2.5.1 Preparation of ompK35 and ompK36
complementation constructs
pUC19-tet(M) (courtesy from Dr Supathep Tansirichaiya) was used to
develop complementation constructs. The ompK35 and ompK36 genes with
their predicted promoters were amplified using genomic DNA from Kpneu_1
and C3091 wild type strains as a template and acted as an insert. The purified
insert and pUC19-tet(M) plasmid were digested with SphI at 37 °C for 1 h.
Digested pUC19-tet(M) was dephosphorylated and purified together with the
digested insert. Both of the purified digested products were then ligated using
T4 DNA ligase. The ligated product was transformed into E. coli α-select
competent cells and plated on LB agar plates containing 15 µg/ml tetracycline
(tet), 50 µg/ml X-gal and 100 µM IPTG. The putative transformants were
screened using blue-white colony screening. The white colonies were grown
in LB broth containing 15 µg/ml tet at 37 °C for 16 h and the plasmid was then
extracted. The extracted plasmid was digested with SphI to determine the
insert size. The plasmid with correct insert size was then sent for sequencing
using M13F and M13R universal primers.
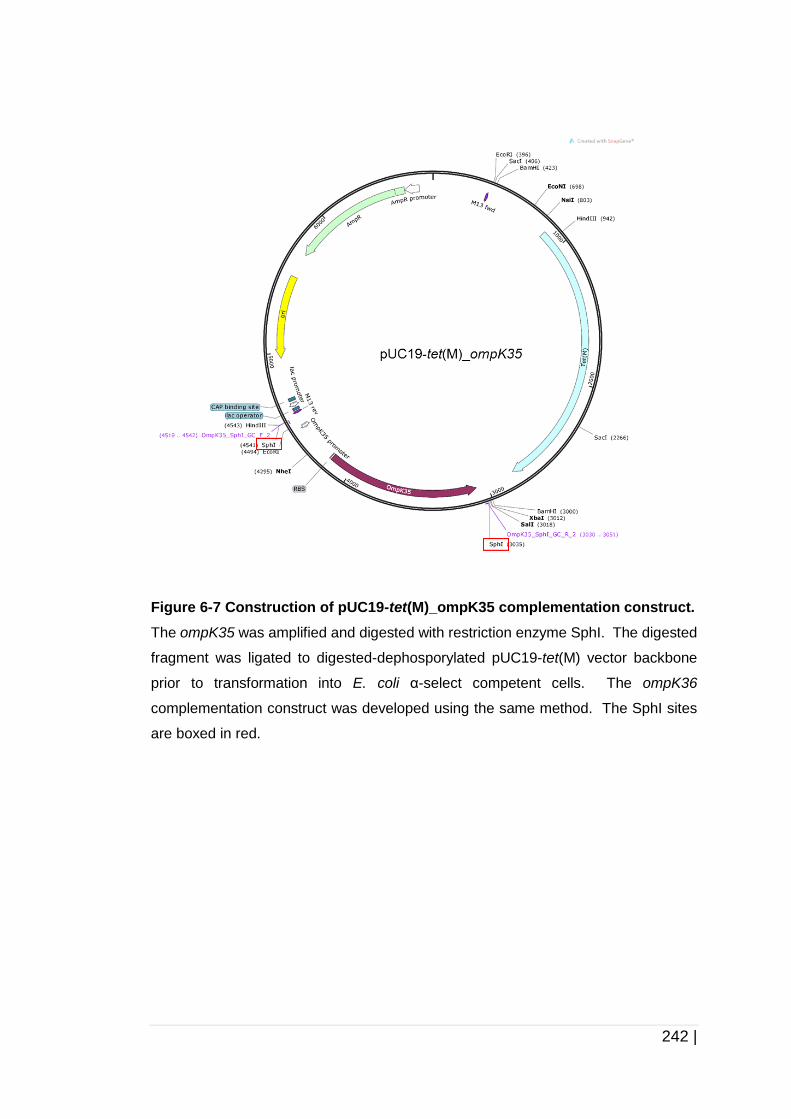
242 |
Figure 6-7 Construction of pUC19-tet(M)_ompK35 complementation construct.
The ompK35 was amplified and digested with restriction enzyme SphI. The digested
fragment was ligated to digested-dephosporylated pUC19-tet(M) vector backbone
prior to transformation into E. coli α-select competent cells. The ompK36
complementation construct was developed using the same method. The SphI sites
are boxed in red.
243 |
6.2.6 Epsilometer test (E-test) method
The wild type and their isogenic mutant bacterial stocks were streaked onto
LB or their selective medium and incubated at 37 °C for 16 h. A single colony
was grown in 5 ml MH broth at 37 °C for 16 h on a 200 rpm rotary shaker.
One hundred microlitres of a 16 h culture was adjusted to OD600 of 0.05 in
fresh MH medium and grown until it reached mid-log phase (data not shown).
The mid-log phase culture was diluted in saline solution (0.85 % NaCl) to
achieve a suspension turbidity equivalent to 0.5 McFarland Standard (OD600
of 0.08-0.1). The suspension was swabbed evenly on MH agar plates using
a cotton swab and allowed to dry for 10 min before applying an E-test strip.
E-test strips (gentamicin, ciprofloxacin, cefotaxime or tetracycline
(Biomerieux, UK)) were then placed carefully on agar plates with the MIC
scale facing upward with the maximum concentration nearest to the plate rim
using sterile forceps and incubated at 37 °C for 16 h. The zone of inhibition
(ellipse) was then observed and recorded.
6.2.7 Determination of MIC using agar and broth dilution
methods
Determination of MIC using agar and broth dilution method was conducted
following method by Wiegand, et al. (2008). Agar dilution method was used
for MIC determination of spectinomycin and apramycin for mutagenesis
purposes. Mid-log phase bacterial suspensions were adjusted to OD600 of
0.01. One microlitre of the diluted suspension was dropped on the MH agar
with different concentrations (12.5 µg/ml – 200 µg/ml for spectinomycin and
2 µg/ml – 256 µg/ml for apramycin) of antibiotics and incubated at 37 °C for
244 |
16 h. The MIC was then recorded based on the lowest concentration of
antibiotics that completely inhibited the growth of bacteria on plates.
The broth dilution method was used for MIC determination of cetylpyridinium
chloride (CPC) and cetyltrimethylammonium bromide (CTAB). Mid-log phase
bacterial suspensions were adjusted to OD600 of 0.01. Hundred microlitres
of MH broth with different dilutions of antiseptics (obtained by serial dilution
of the highest concentration of antiseptics) was added into wells of a 96-well
flat-bottom polystyrene non-treated microtitre plate (Falcon, BD), and
inoculated with 100 µl of diluted suspension in each well. The microtitre plate
was incubated at 37 °C for 16 h with gentle agitation (100 rpm) on a rotary
shaker (IKA ® Vibrax-VXR, Germany). The plate was observed for any
cloudiness and turbidity after incubation. The MIC of the antiseptics was
determined as the lowest concentration that inhibited visible growth.
6.2.8 Growth kinetics of wild type and mutant strains in TSB
and AUM
The growth curves were performed using the method described in Chapter 4,
section 4.2.3.
6.2.9 Biofilm formation assays in microtitre plate
The biofilm assays were performed using the method described in Chapter 3,
section 3.2.1.
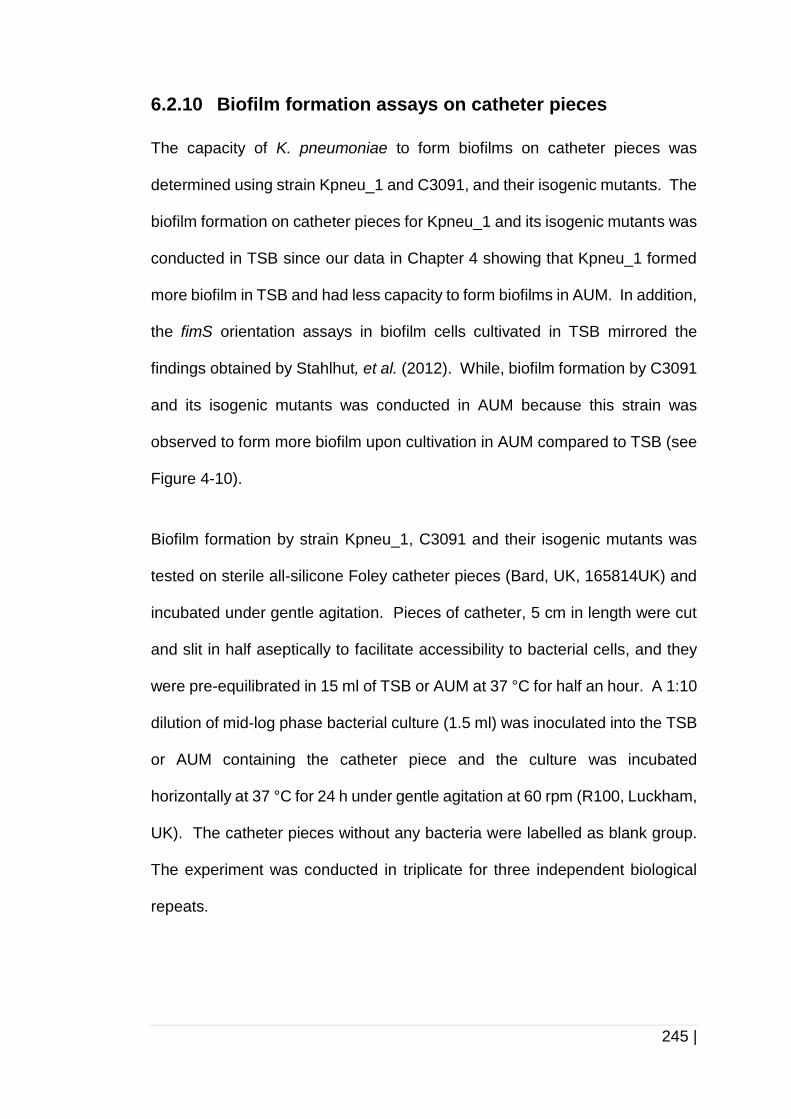
245 |
6.2.10 Biofilm formation assays on catheter pieces
The capacity of K. pneumoniae to form biofilms on catheter pieces was
determined using strain Kpneu_1 and C3091, and their isogenic mutants. The
biofilm formation on catheter pieces for Kpneu_1 and its isogenic mutants was
conducted in TSB since our data in Chapter 4 showing that Kpneu_1 formed
more biofilm in TSB and had less capacity to form biofilms in AUM. In addition,
the fimS orientation assays in biofilm cells cultivated in TSB mirrored the
findings obtained by Stahlhut, et al. (2012). While, biofilm formation by C3091
and its isogenic mutants was conducted in AUM because this strain was
observed to form more biofilm upon cultivation in AUM compared to TSB (see
Figure 4-10).
Biofilm formation by strain Kpneu_1, C3091 and their isogenic mutants was
tested on sterile all-silicone Foley catheter pieces (Bard, UK, 165814UK) and
incubated under gentle agitation. Pieces of catheter, 5 cm in length were cut
and slit in half aseptically to facilitate accessibility to bacterial cells, and they
were pre-equilibrated in 15 ml of TSB or AUM at 37 °C for half an hour. A 1:10
dilution of mid-log phase bacterial culture (1.5 ml) was inoculated into the TSB
or AUM containing the catheter piece and the culture was incubated
horizontally at 37 °C for 24 h under gentle agitation at 60 rpm (R100, Luckham,
UK). The catheter pieces without any bacteria were labelled as blank group.
The experiment was conducted in triplicate for three independent biological
repeats.
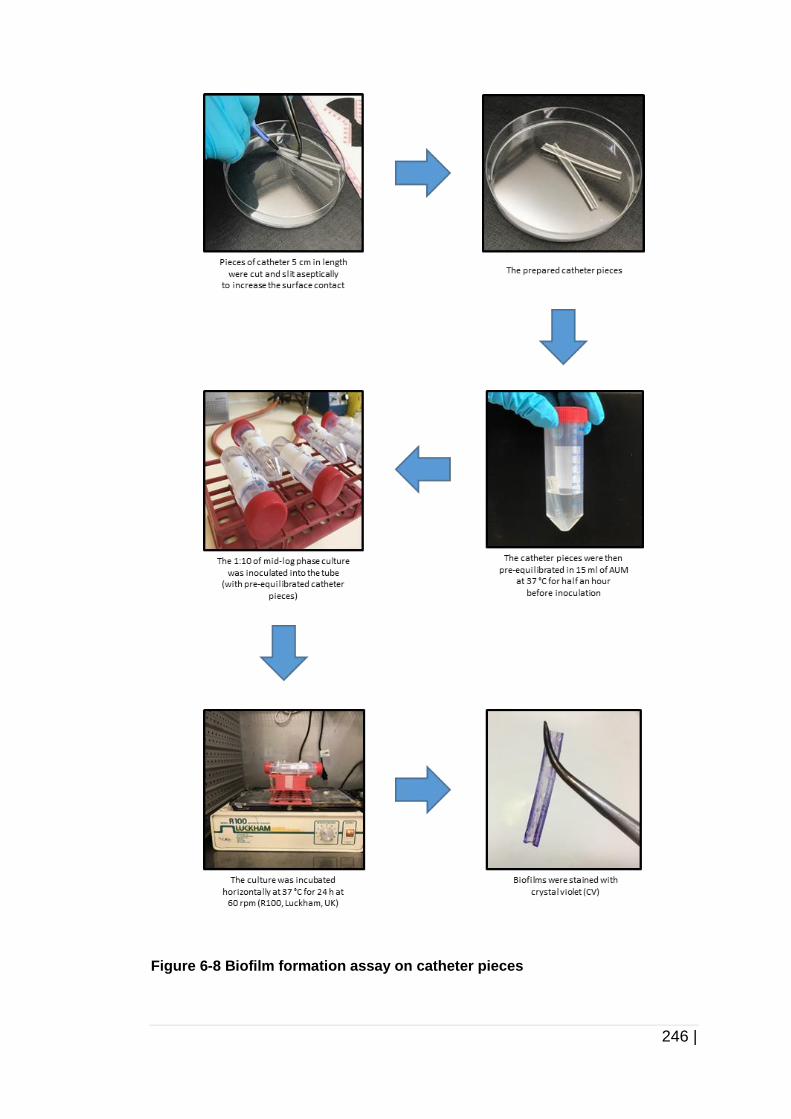
246 |
Figure 6-8 Biofilm formation assay on catheter pieces
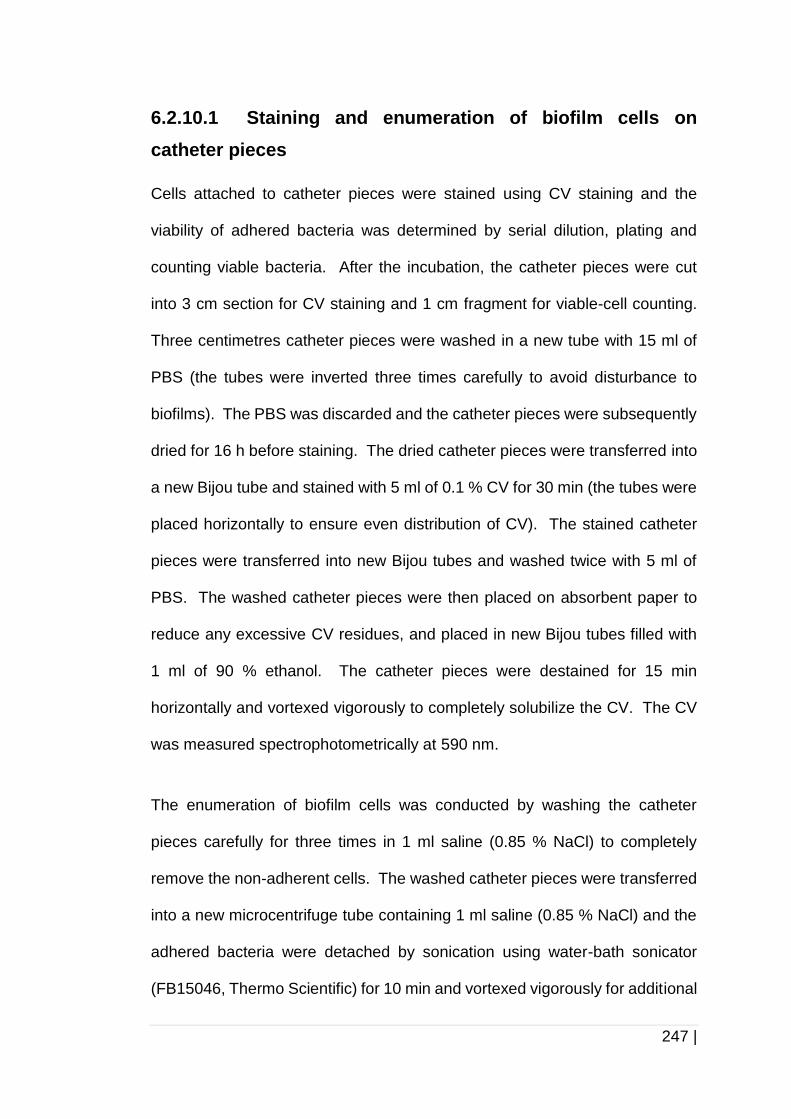
247 |
6.2.10.1 Staining and enumeration of biofilm cells on
catheter pieces
Cells attached to catheter pieces were stained using CV staining and the
viability of adhered bacteria was determined by serial dilution, plating and
counting viable bacteria. After the incubation, the catheter pieces were cut
into 3 cm section for CV staining and 1 cm fragment for viable-cell counting.
Three centimetres catheter pieces were washed in a new tube with 15 ml of
PBS (the tubes were inverted three times carefully to avoid disturbance to
biofilms). The PBS was discarded and the catheter pieces were subsequently
dried for 16 h before staining. The dried catheter pieces were transferred into
a new Bijou tube and stained with 5 ml of 0.1 % CV for 30 min (the tubes were
placed horizontally to ensure even distribution of CV). The stained catheter
pieces were transferred into new Bijou tubes and washed twice with 5 ml of
PBS. The washed catheter pieces were then placed on absorbent paper to
reduce any excessive CV residues, and placed in new Bijou tubes filled with
1 ml of 90 % ethanol. The catheter pieces were destained for 15 min
horizontally and vortexed vigorously to completely solubilize the CV. The CV
was measured spectrophotometrically at 590 nm.
The enumeration of biofilm cells was conducted by washing the catheter
pieces carefully for three times in 1 ml saline (0.85 % NaCl) to completely
remove the non-adherent cells. The washed catheter pieces were transferred
into a new microcentrifuge tube containing 1 ml saline (0.85 % NaCl) and the
adhered bacteria were detached by sonication using water-bath sonicator
(FB15046, Thermo Scientific) for 10 min and vortexed vigorously for additional

248 |
2 min. The suspension was serial diluted and plated on TSA. Based on the
colony counts, the CFU/cm2 were then calculated.
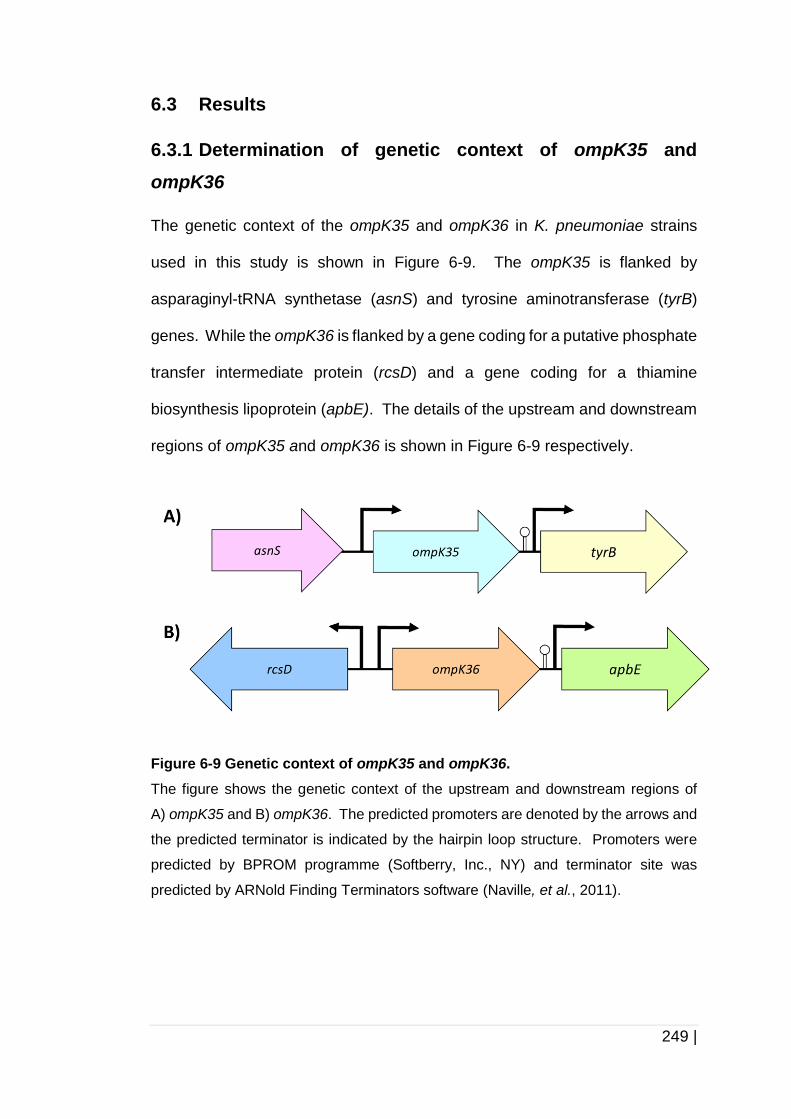
249 |
6.3 Results
6.3.1 Determination of genetic context of ompK35 and
ompK36
The genetic context of the ompK35 and ompK36 in K. pneumoniae strains
used in this study is shown in Figure 6-9. The ompK35 is flanked by
asparaginyl-tRNA synthetase (asnS) and tyrosine aminotransferase (tyrB)
genes. While the ompK36 is flanked by a gene coding for a putative phosphate
transfer intermediate protein (rcsD) and a gene coding for a thiamine
biosynthesis lipoprotein (apbE). The details of the upstream and downstream
regions of ompK35 and ompK36 is shown in Figure 6-9 respectively.
Figure 6-9 Genetic context of ompK35 and ompK36.
The figure shows the genetic context of the upstream and downstream regions of
A) ompK35 and B) ompK36. The predicted promoters are denoted by the arrows and
the predicted terminator is indicated by the hairpin loop structure. Promoters were
predicted by BPROM programme (Softberry, Inc., NY) and terminator site was
predicted by ARNold Finding Terminators software (Naville, et al., 2011).
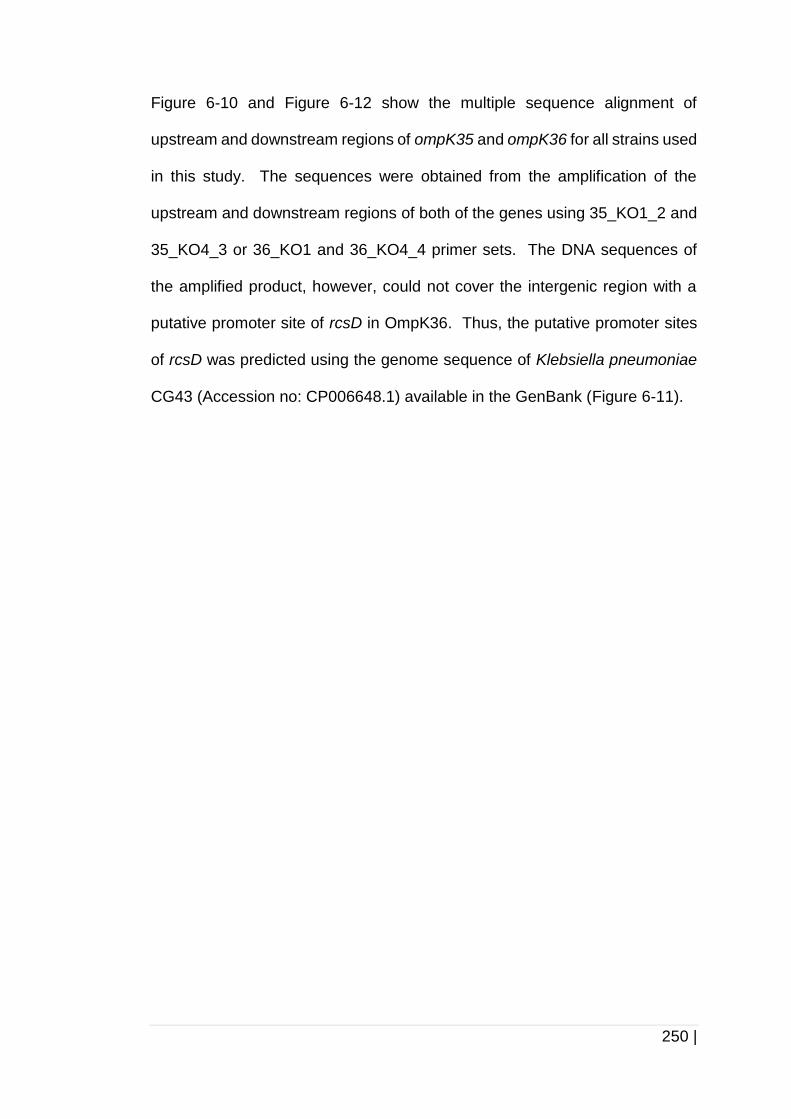
250 |
Figure 6-10 and Figure 6-12 show the multiple sequence alignment of
upstream and downstream regions of ompK35 and ompK36 for all strains used
in this study. The sequences were obtained from the amplification of the
upstream and downstream regions of both of the genes using 35_KO1_2 and
35_KO4_3 or 36_KO1 and 36_KO4_4 primer sets. The DNA sequences of
the amplified product, however, could not cover the intergenic region with a
putative promoter site of rcsD in OmpK36. Thus, the putative promoter sites
of rcsD was predicted using the genome sequence of Klebsiella pneumoniae
CG43 (Accession no: CP006648.1) available in the GenBank (Figure 6-11).
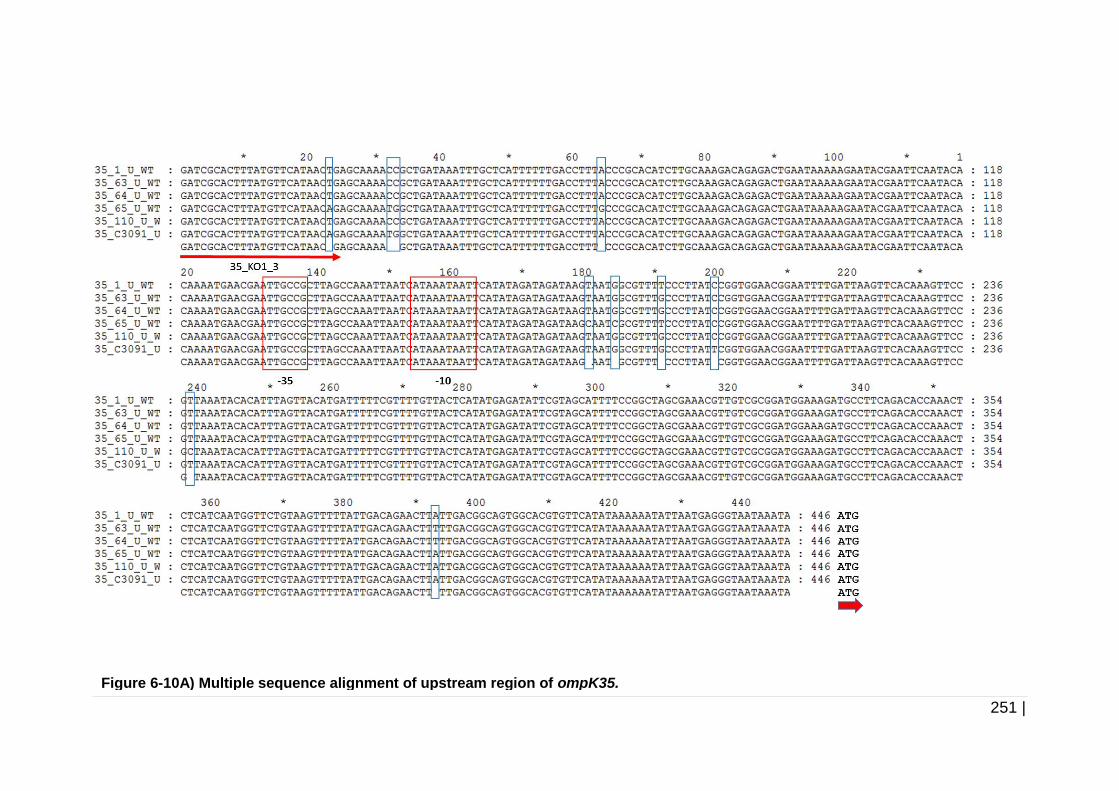
251 |
Figure 6-10A) Multiple sequence alignment of upstream region of ompK35.
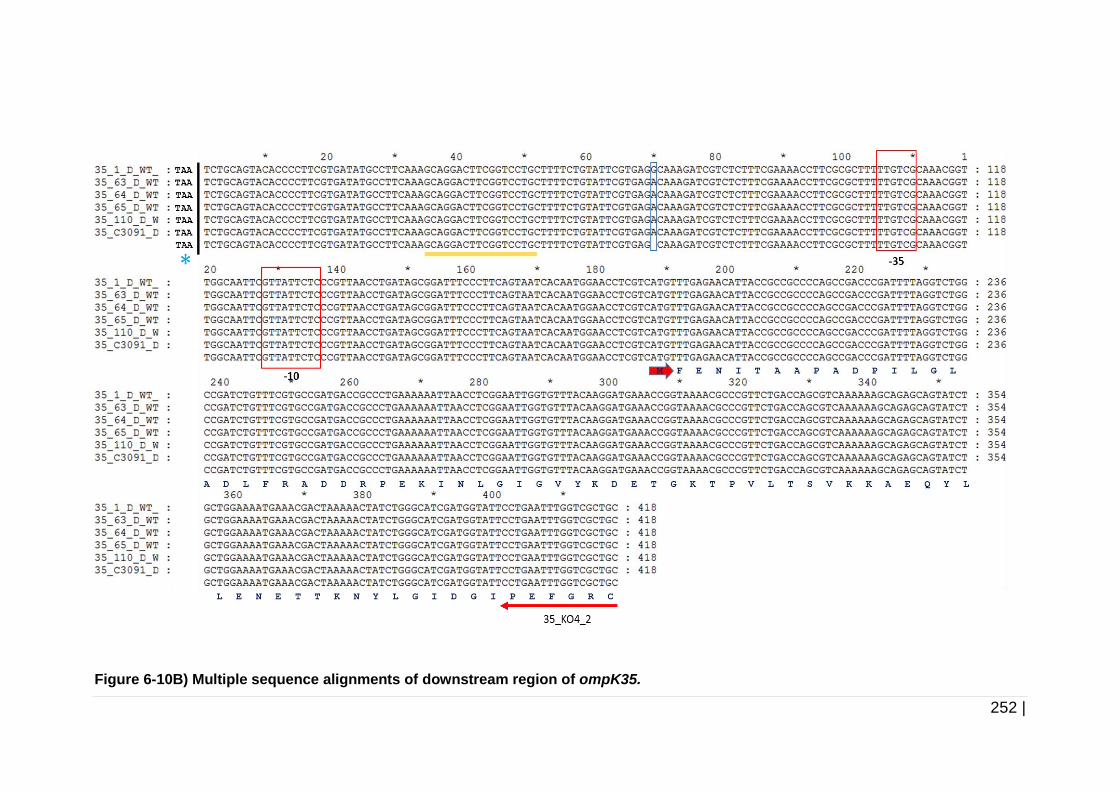
252 |
Figure 6-10B) Multiple sequence alignments of downstream region of ompK35.
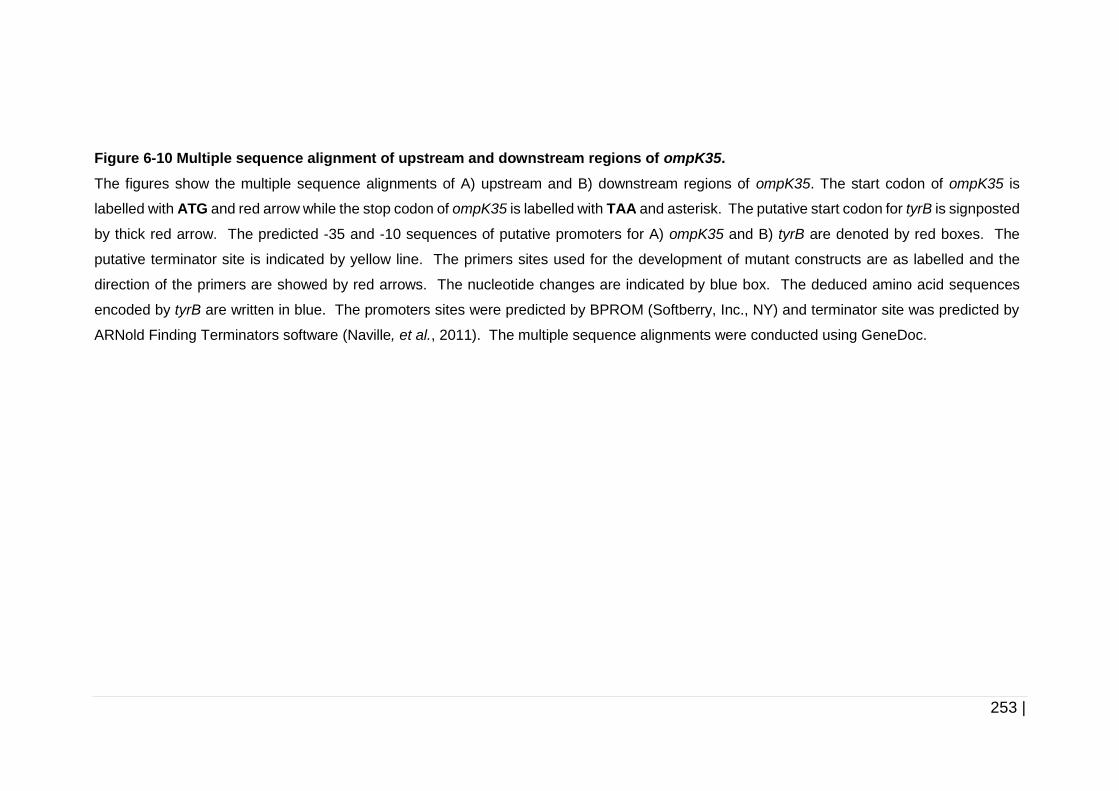
253 |
Figure 6-10 Multiple sequence alignment of upstream and downstream regions of ompK35.
The figures show the multiple sequence alignments of A) upstream and B) downstream regions of ompK35. The start codon of ompK35 is
labelled with ATG and red arrow while the stop codon of ompK35 is labelled with TAA and asterisk. The putative start codon for tyrB is signposted
by thick red arrow. The predicted -35 and -10 sequences of putative promoters for A) ompK35 and B) tyrB are denoted by red boxes. The
putative terminator site is indicated by yellow line. The primers sites used for the development of mutant constructs are as labelled and the
direction of the primers are showed by red arrows. The nucleotide changes are indicated by blue box. The deduced amino acid sequences
encoded by tyrB are written in blue. The promoters sites were predicted by BPROM (Softberry, Inc., NY) and terminator site was predicted by
ARNold Finding Terminators software (Naville, et al., 2011). The multiple sequence alignments were conducted using GeneDoc.
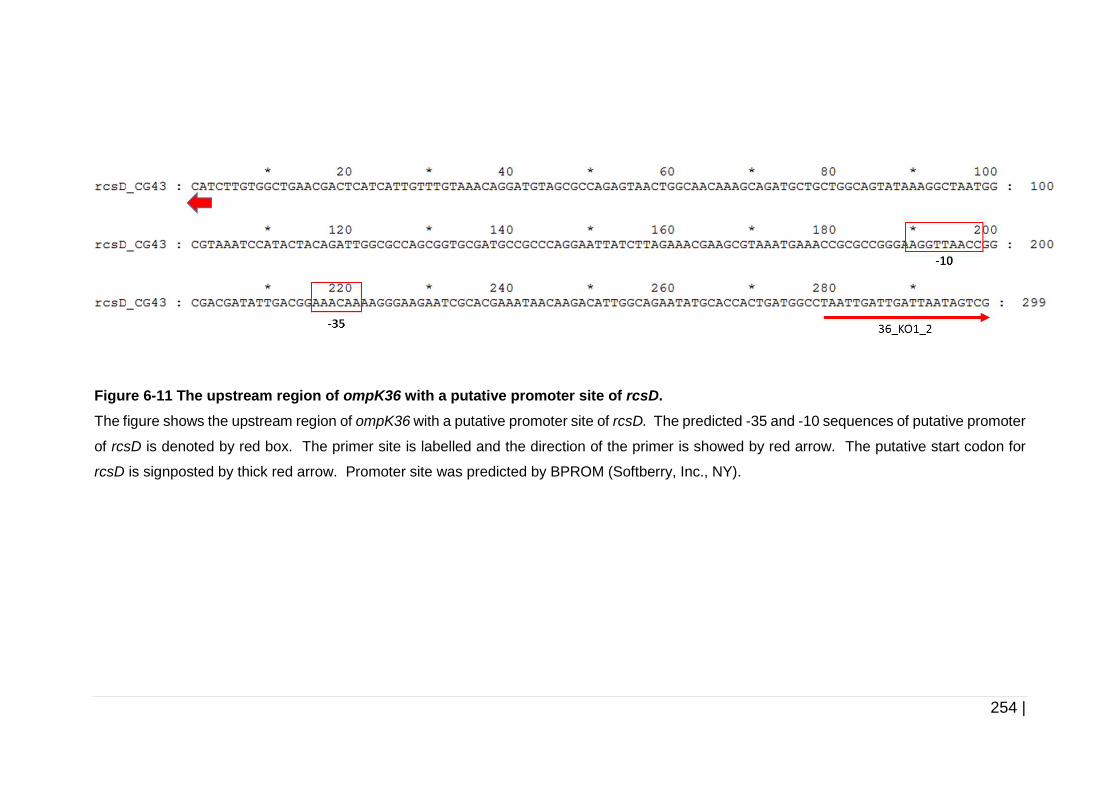
254 |
Figure 6-11 The upstream region of ompK36 with a putative promoter site of rcsD.
The figure shows the upstream region of ompK36 with a putative promoter site of rcsD. The predicted -35 and -10 sequences of putative promoter
of rcsD is denoted by red box. The primer site is labelled and the direction of the primer is showed by red arrow. The putative start codon for
rcsD is signposted by thick red arrow. Promoter site was predicted by BPROM (Softberry, Inc., NY).
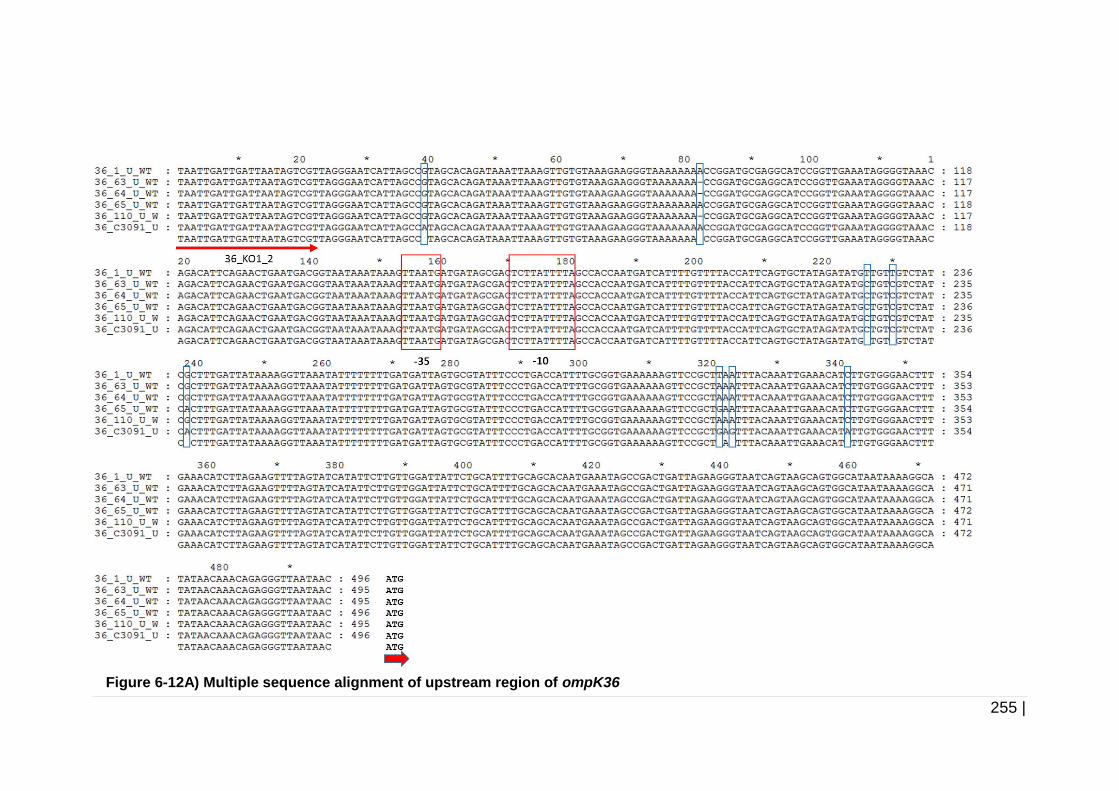
255 |
Figure 6-12A) Multiple sequence alignment of upstream region of ompK36
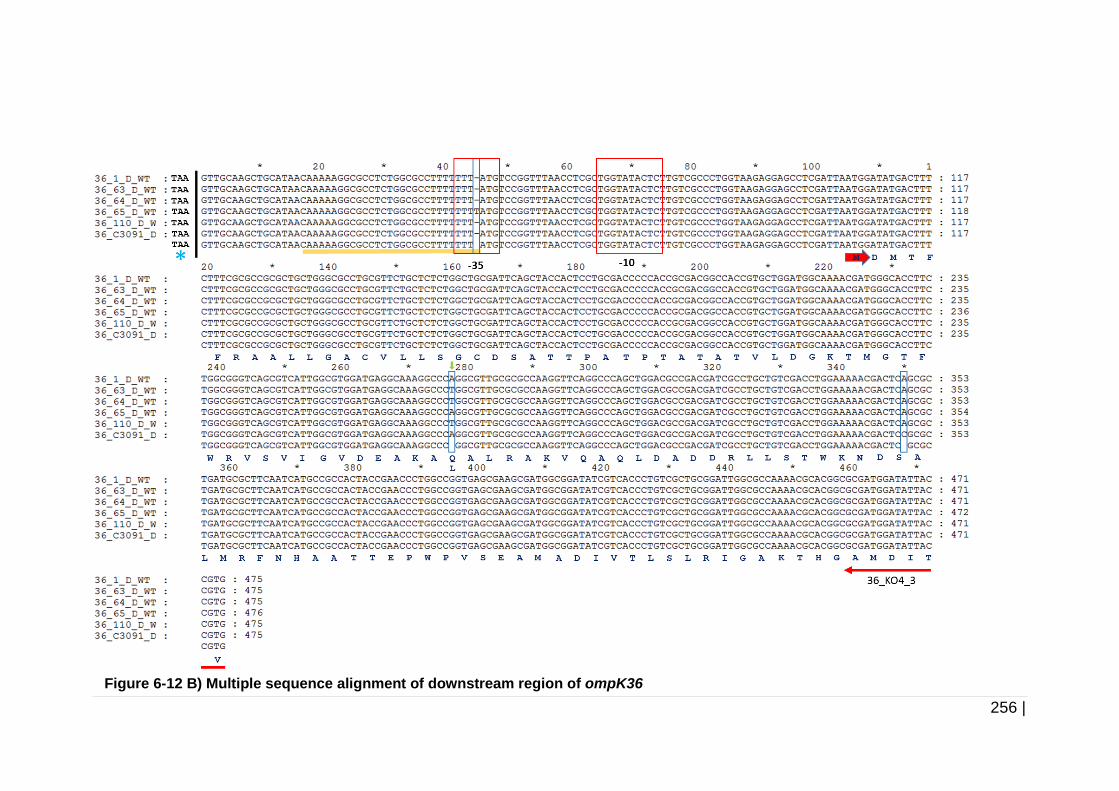
256 |
Figure 6-12 B) Multiple sequence alignment of downstream region of ompK36
257 |
Figure 6-12 Multiple sequence alignment of upstream and downstream regions of ompK36.
The figures show the multiple sequence alignments of A) upstream and B) downstream region of ompK36. The start codon of ompK36 is labelled
with ATG and red arrow while the stop codon of ompK36 is labelled with TAA and asterisk. The putative start codon for apbE is signposted by
thick red arrow. The predicted -35 and -10 sequences of putative promoters for A) ompK36 and B) apbE are denoted by red boxes. The putative
terminator site is indicated by the yellow line. The primers sites used for the development of mutant constructs are as labelled and the direction
of the primers are showed by red arrows. The nucleotide changes are indicated by blue box. The deduced amino acid sequences encoded by
apbE are written in blue. Promoter sites were predicted by BPROM (Softberry, Inc., NY) and terminator site was predicted by ARNold Finding
Terminators software (Naville, et al., 2011). The multiple sequence alignments were conducted using GeneDoc.
258 |
6.3.2 Analysis of OmpC, OmpK35 and OmpK36 protein
structure
In order to approximate a structural characterisation of these three porins
which could allow us to understand possible function of OmpK35 and
OmpK36, we performed a comparative analysis of 3D structures of OmpC of
E. coli and OmpK36 of K. pneumoniae, and between OmpK36 and putative
3D structure of OmpK35. It was previously reported that OmpC showed
~ 80 % identity to OmpK36 but there is no study comparing the 3D protein
structures.
The multiple sequence alignment of OmpC, OmpK36 and OmpK35 derived
from Kpneu_1 is presented in Figure 6-13. The multiple sequence alignments
were conducted using Clustal Omega and GeneDoc. The secondary
structures such as β-strands, loops, and short turns of these OmpC, OmpK36
and OmpK35 are as labelled in Figure 6-13. Based on the analysis, the
percentage of amino acid identity between OmpC and OmpK36 is 80.12 %,
while the percentage of amino acid identity between OmpK36 and OmpK35 is
59.35 %. We generated the image of 3D structures of OmpC, OmpK36 and
OmpK35 using Chimera 1.12rc. The 3D structures of templates, OmpC and
OmpK36 are shown in Appendix 14 and Appendix 15, respectively. While the
predicted structure of OmpK35 is shown in Appendix 16. Using Chimera
1.12rc, we analysed and compared the amino acid sequences and also
conducted the structural superimposition between these two porins, OmpC
and OmpK36. Based on the high percentage of amino acid identity, 80.12 %,
we hypothesised that these 3D structures would be highly similar. It is thought
that when the overall sequence identity is above 40 %, almost 90 % of the
259 |
main-chain atoms are likely to be modeled with a root-mean-square error
(RMSE) around 1 Å (Fiser, 2010; Sánchez, et al. , 1998).
The structural alignment results showed that the 3D structures of OmpC and
OmpK36 monomers were highly similar with a structural alignment RMSD
value of 0.894 Å as shown in Appendix 17. Besides, our analysis data
suggested that structural alignment of OmpK35 using OmpK36 as a template
also showed the integrity of the conserved domain since both of these porins
had a low RMSD value, 0.488 Å which means that the 3D structures were
highly similar Appendix 18.
Even though, OmpC and OmpK36 do have similar 3D structures, and high
percentage in amino acid sequence identity, we, however, cannot confirm that
both of these porins will have exactly the same functions. Similarity in 3D
structures and amino acid sequences does not necessarily lead to the same
function. The protein conformation and protein folding might be different and
to confirm the exact protein function between these two porins, it needs a
further investigation and qualification.
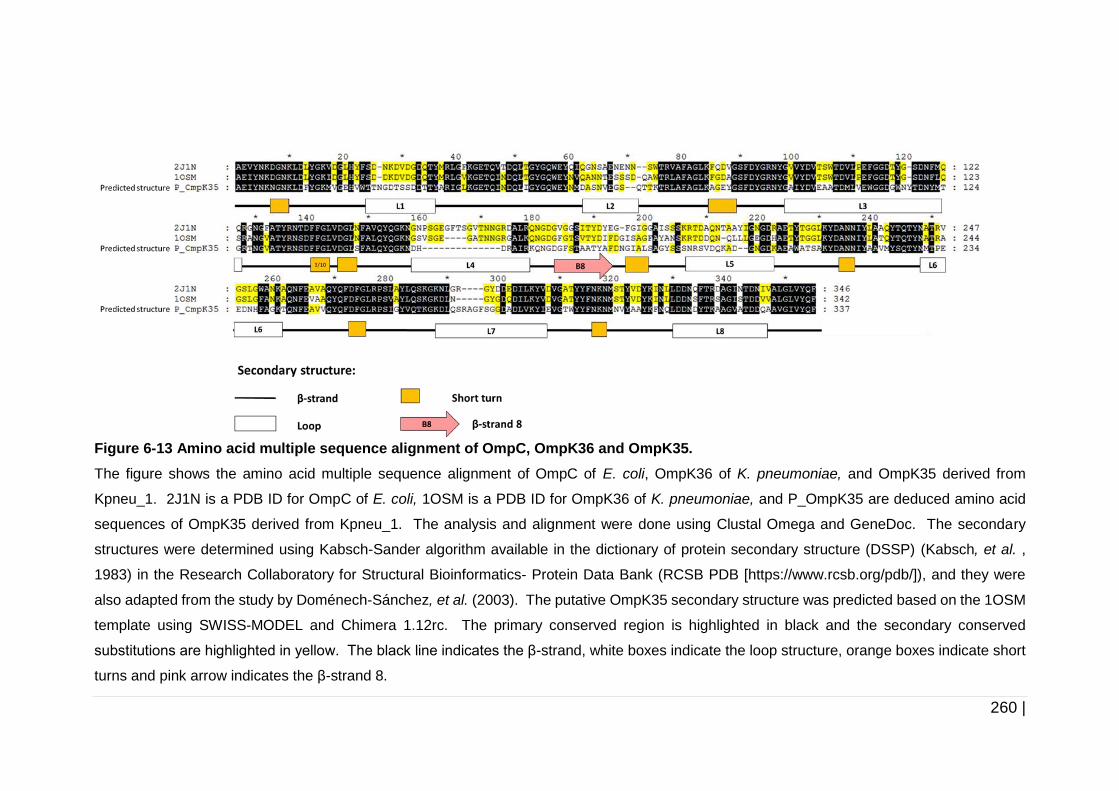
260 |
Figure 6-13 Amino acid multiple sequence alignment of OmpC, OmpK36 and OmpK35.
The figure shows the amino acid multiple sequence alignment of OmpC of E. coli, OmpK36 of K. pneumoniae, and OmpK35 derived from
Kpneu_1. 2J1N is a PDB ID for OmpC of E. coli, 1OSM is a PDB ID for OmpK36 of K. pneumoniae, and P_OmpK35 are deduced amino acid
sequences of OmpK35 derived from Kpneu_1. The analysis and alignment were done using Clustal Omega and GeneDoc. The secondary
structures were determined using Kabsch-Sander algorithm available in the dictionary of protein secondary structure (DSSP) (Kabsch, et al. ,
1983) in the Research Collaboratory for Structural Bioinformatics- Protein Data Bank (RCSB PDB [https://www.rcsb.org/pdb/]), and they were
also adapted from the study by Doménech-Sánchez, et al. (2003). The putative OmpK35 secondary structure was predicted based on the 1OSM
template using SWISS-MODEL and Chimera 1.12rc. The primary conserved region is highlighted in black and the secondary conserved
substitutions are highlighted in yellow. The black line indicates the β-strand, white boxes indicate the loop structure, orange boxes indicate short
turns and pink arrow indicates the β-strand 8.
261 |
6.3.3 Amplification of ompK35 and ompK36
As described in the General introduction, the aim of this study was to develop
the ompK35 or ompK36 mutant strains and compare their capacity to form
biofilm with their wild type strains. In order to knock out ompK35 or ompK36
in K. pneumoniae, all the strains were initially confirmed to harbour both genes
by PCR amplification. The ompK35 and ompK36 genes were amplified using
genomic DNA from those six strains of K. pneumoniae as a template. Primers
were designed to amplify the ompK35 and ompK36 with ~70 bp of flanking
regions. Figure 6-14 shows a PCR amplification of ompK35 and ompK36 for
all the strains. The amplicon size predicted for ompK35 was 1244 bp (Figure
6-14A, lane 1-6) and the amplicon size for ompK36 was 1276 bp for Kpneu_1,
1256 bp for Kpneu_63, Kpneu_64, and Kpneu_65, 1262 bp for Kpneu_110
and 1250 bp for C3091 (Figure 6-14B, lane 1-6). The amplicons were
subsequently purified and sequenced for confirmation.
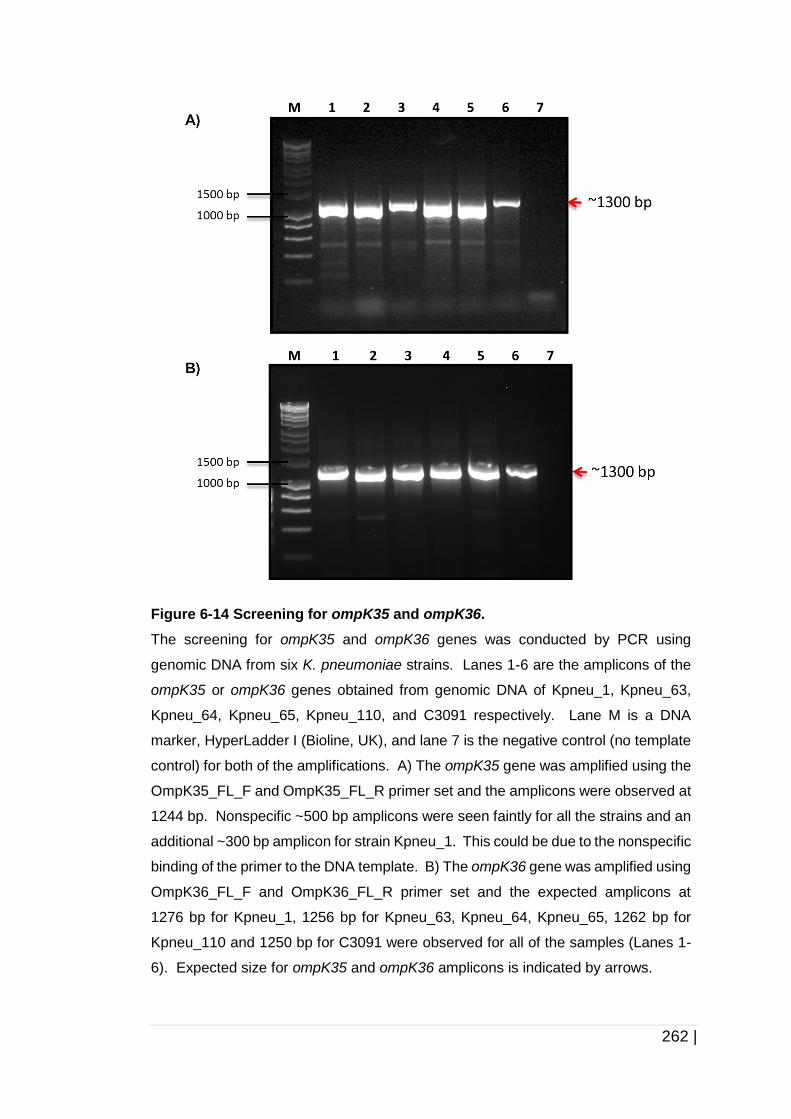
262 |
Figure 6-14 Screening for ompK35 and ompK36.
The screening for ompK35 and ompK36 genes was conducted by PCR using
genomic DNA from six K. pneumoniae strains. Lanes 1-6 are the amplicons of the
ompK35 or ompK36 genes obtained from genomic DNA of Kpneu_1, Kpneu_63,
Kpneu_64, Kpneu_65, Kpneu_110, and C3091 respectively. Lane M is a DNA
marker, HyperLadder I (Bioline, UK), and lane 7 is the negative control (no template
control) for both of the amplifications. A) The ompK35 gene was amplified using the
OmpK35_FL_F and OmpK35_FL_R primer set and the amplicons were observed at
1244 bp. Nonspecific ~500 bp amplicons were seen faintly for all the strains and an
additional ~300 bp amplicon for strain Kpneu_1. This could be due to the nonspecific
binding of the primer to the DNA template. B) The ompK36 gene was amplified using
OmpK36_FL_F and OmpK36_FL_R primer set and the expected amplicons at
1276 bp for Kpneu_1, 1256 bp for Kpneu_63, Kpneu_64, Kpneu_65, 1262 bp for
Kpneu_110 and 1250 bp for C3091 were observed for all of the samples (Lanes 1-
6). Expected size for ompK35 and ompK36 amplicons is indicated by arrows.
263 |
6.3.4 Development of mutant constructs
Upon confirmation of ompK35 and ompK36 in all the strains used in this
chapter, we then continued to develop the mutant constructs for deletion of
ompK35 and ompK36 by a homologous recombination approach. The mutant
constructs were developed using SOE PCR method. The genomic DNA of
K. pneumoniae and C. difficile were extracted and used as template to amplify
individual ~ 500 bp upstream region and ~ 500 bp downstream region from
the gene to be deleted, and erm1(B) (790 bp) gene respectively. The
individual PCR fragments were ligated by SOE PCR. The SOE PCR of
ompK35 and ompK36 mutant cassettes with erm1(B) as a selective marker
was conducted using 35_KO1_3 and 35_KO4_2 or the 36_KO1_2 and
36_KO4_3 primer sets. The expected amplicon for the ompK35 mutant
cassette was 1654 bp. While the expected amplicon for the ompK36 mutant
cassettes were 1760 bp for Kpneu_63, 1762 bp for Kpneu_65 and 1761 bp
for C3091 (Figure 6-15).
Based on the multiple sequence alignments of the ompK35 and ompK36
flanking regions between the six strains, ten nucleotide differences in the
upstream and one nucleotide difference in the downstream region of ompK35
were identified and all of them were located in non-coding regions (see Figure
6-10). The mutant construct for ompK35 was then developed based on the
flanking regions, which was derived from Kpneu_1 strain since the nucleotide
differences did not result in any amino acid substitution and they were not
located on any regulatory sites such as predicted promoter. In addition, eight
nucleotide differences in the upstream region and three nucleotide differences
264 |
in the downstream region of ompK36 were identified from the multiple
sequence alignments of ompK36 flanking region of six strains (Figure 6-12).
All of the other differences were located in non-coding regions apart from the
nucleotide differences at position 173 (A→T). The nucleotide differences at
position 173 resulted in modification of protein sequence (Q58L) of apbE (see
Figure 6.12). For that reason, the mutant constructs of ompK36 for strain
Kpneu_1, Kpneu_65, and C3091 which had glutamine could be used
interchangeably between respective strains since they encoded the same
amino acid at position 56, as well as the constructs for Kpneu_63, Kpneu_64,
and Kpneu_110 which had the same amino acid, leucine at position 56 (see
Figure 6-12).
Figure 6-15 Amplification of ompK35 and ompK36 mutant cassettes.
The figure shows the amplification product of the mutant cassettes by PCR. The
pGEMT_ erm_ΔompK35 and pGEMT_erm_ΔompK36 constructs were used as a
template for amplification of mutant cassettes comprising erm1(B) and ~500 bp of
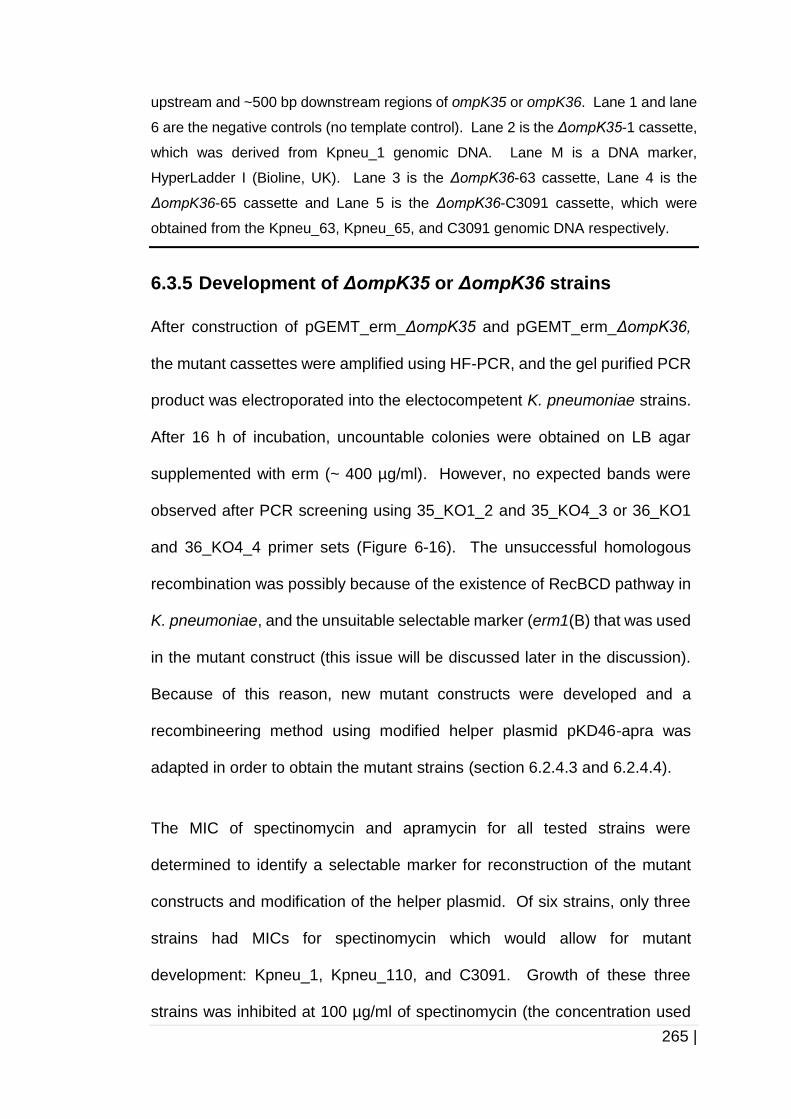
265 |
upstream and ~500 bp downstream regions of ompK35 or ompK36. Lane 1 and lane
6 are the negative controls (no template control). Lane 2 is the ΔompK35-1 cassette,
which was derived from Kpneu_1 genomic DNA. Lane M is a DNA marker,
HyperLadder I (Bioline, UK). Lane 3 is the ΔompK36-63 cassette, Lane 4 is the
ΔompK36-65 cassette and Lane 5 is the ΔompK36-C3091 cassette, which were
obtained from the Kpneu_63, Kpneu_65, and C3091 genomic DNA respectively.
6.3.5 Development of ΔompK35 or ΔompK36 strains
After construction of pGEMT_erm_ΔompK35 and pGEMT_erm_ΔompK36,
the mutant cassettes were amplified using HF-PCR, and the gel purified PCR
product was electroporated into the electocompetent K. pneumoniae strains.
After 16 h of incubation, uncountable colonies were obtained on LB agar
supplemented with erm (~ 400 µg/ml). However, no expected bands were
observed after PCR screening using 35_KO1_2 and 35_KO4_3 or 36_KO1
and 36_KO4_4 primer sets (Figure 6-16). The unsuccessful homologous
recombination was possibly because of the existence of RecBCD pathway in
K. pneumoniae, and the unsuitable selectable marker (erm1(B) that was used
in the mutant construct (this issue will be discussed later in the discussion).
Because of this reason, new mutant constructs were developed and a
recombineering method using modified helper plasmid pKD46-apra was
adapted in order to obtain the mutant strains (section 6.2.4.3 and 6.2.4.4).
The MIC of spectinomycin and apramycin for all tested strains were
determined to identify a selectable marker for reconstruction of the mutant
constructs and modification of the helper plasmid. Of six strains, only three
strains had MICs for spectinomycin which would allow for mutant
development: Kpneu_1, Kpneu_110, and C3091. Growth of these three
strains was inhibited at 100 µg/ml of spectinomycin (the concentration used
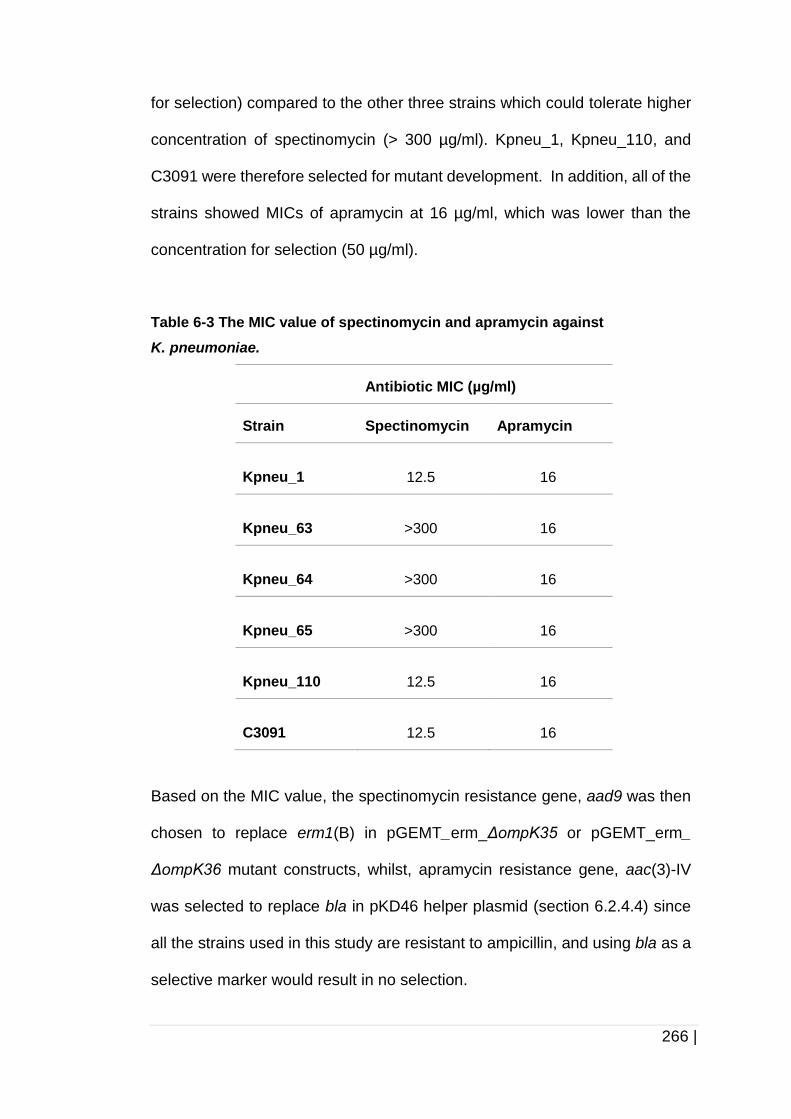
266 |
for selection) compared to the other three strains which could tolerate higher
concentration of spectinomycin (> 300 µg/ml). Kpneu_1, Kpneu_110, and
C3091 were therefore selected for mutant development. In addition, all of the
strains showed MICs of apramycin at 16 µg/ml, which was lower than the
concentration for selection (50 µg/ml).
Table 6-3 The MIC value of spectinomycin and apramycin against
K. pneumoniae.
Antibiotic MIC (µg/ml)
Strain Spectinomycin Apramycin
Kpneu_1
12.5
16
Kpneu_63
>300
16
Kpneu_64
>300
16
Kpneu_65
>300
16
Kpneu_110
12.5
16
C3091
12.5
16
Based on the MIC value, the spectinomycin resistance gene, aad9 was then
chosen to replace erm1(B) in pGEMT_erm_ΔompK35 or pGEMT_erm_
ΔompK36 mutant constructs, whilst, apramycin resistance gene, aac(3)-IV
was selected to replace bla in pKD46 helper plasmid (section 6.2.4.4) since
all the strains used in this study are resistant to ampicillin, and using bla as a
selective marker would result in no selection.
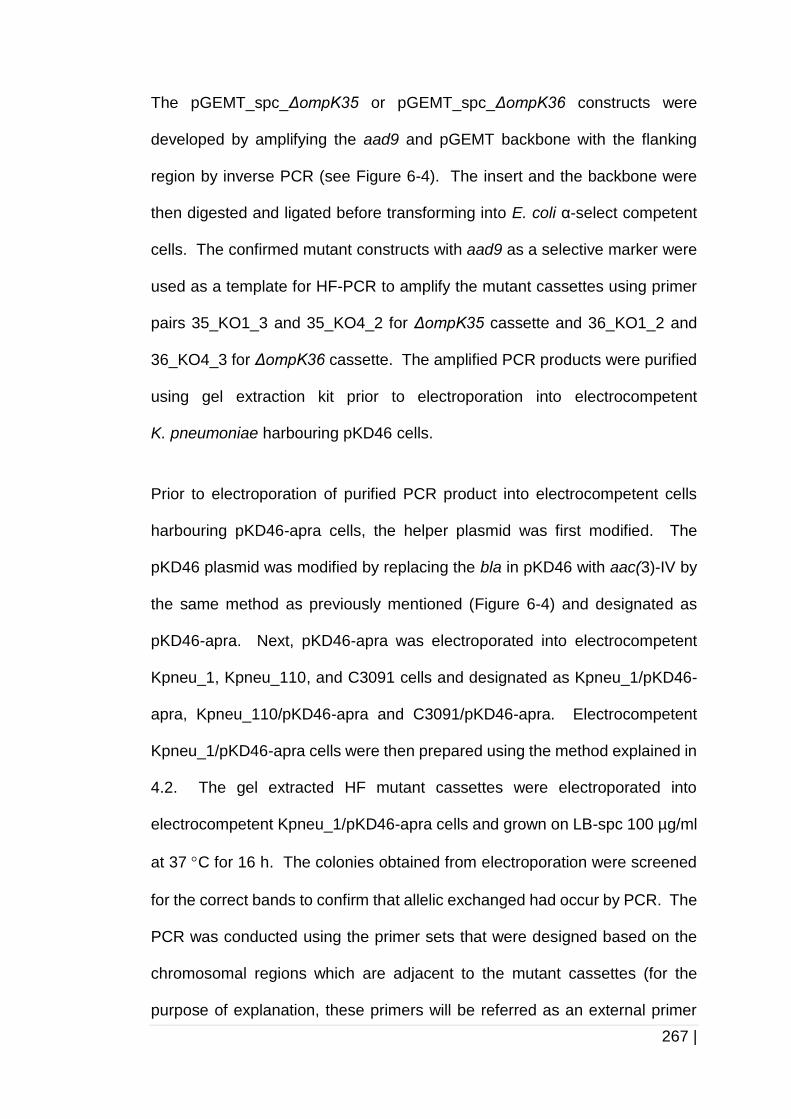
267 |
The pGEMT_spc_ΔompK35 or pGEMT_spc_ΔompK36 constructs were
developed by amplifying the aad9 and pGEMT backbone with the flanking
region by inverse PCR (see Figure 6-4). The insert and the backbone were
then digested and ligated before transforming into E. coli α-select competent
cells. The confirmed mutant constructs with aad9 as a selective marker were
used as a template for HF-PCR to amplify the mutant cassettes using primer
pairs 35_KO1_3 and 35_KO4_2 for ΔompK35 cassette and 36_KO1_2 and
36_KO4_3 for ΔompK36 cassette. The amplified PCR products were purified
using gel extraction kit prior to electroporation into electrocompetent
K. pneumoniae harbouring pKD46 cells.
Prior to electroporation of purified PCR product into electrocompetent cells
harbouring pKD46-apra cells, the helper plasmid was first modified. The
pKD46 plasmid was modified by replacing the bla in pKD46 with aac(3)-IV by
the same method as previously mentioned (Figure 6-4) and designated as
pKD46-apra. Next, pKD46-apra was electroporated into electrocompetent
Kpneu_1, Kpneu_110, and C3091 cells and designated as Kpneu_1/pKD46-
apra, Kpneu_110/pKD46-apra and C3091/pKD46-apra. Electrocompetent
Kpneu_1/pKD46-apra cells were then prepared using the method explained in
4.2. The gel extracted HF mutant cassettes were electroporated into
electrocompetent Kpneu_1/pKD46-apra cells and grown on LB-spc 100 µg/ml
at 37 C for 16 h. The colonies obtained from electroporation were screened
for the correct bands to confirm that allelic exchanged had occur by PCR. The
PCR was conducted using the primer sets that were designed based on the
chromosomal regions which are adjacent to the mutant cassettes (for the
purpose of explanation, these primers will be referred as an external primer
268 |
(see Figure 6-16), the specific aad9 primer set and the target gene ompK35 or
ompK36 primer sets.
Figure 6-16 Location of the external primers for confirmation of mutant
strains.
The figure shows the location of the external primers that are located at the
chromosomal regions adjacent to the mutant cassettes. The external primers were
used to distinguish between the mutant strains and wild type strains. These primers
were used to confirm occurrence of gene replacement by amplifying the mutant
cassettes including flanking regions of the gene of interest, aad9 selectable marker
gene (for mutant strains) or ompK35/ompK36 (for wild type strains) and a
chromosomal region adjacent to the cassettes. The expected amplicon size for each
strain is as shown. Flanking region is indicated by blue boxes and K. pneumoniae
chromosomal region adjacent to the mutant cassettes is denoted by dashed line.
269 |
The expected band for the Kpneu_1 wild type strain was 2142 bp and
2224 bp for ompK35 and ompK36, respectively. While, the expected band
for its isogenic mutant strains, ΔompK35 and ΔompK36 were 1839 bp and
1883 bp, respectively. A detectable reduction in the size of wild type strain
and mutant strain was observed on a 1.0 % agarose gel by electrophoresis.
Using the same protocol of electroporation, ΔompK35 and ΔompK36 isogenic
mutant strains of C3091 were also successfully obtained (Figure 6-17). The
expected band for the C3091 wild type strain was 2142 bp and 2242 bp for
ompK35 and ompK36, respectively. While the expected band for its isogenic
mutant strains, ΔompK35 and ΔompK36 were 1839 bp and 1894 bp,
respectively. Strain Kpneu_110, however could not be genetically modified.
Kpneu_110 was notable because it had a hypermucoviscous morphology
(discussed in the discussion below).
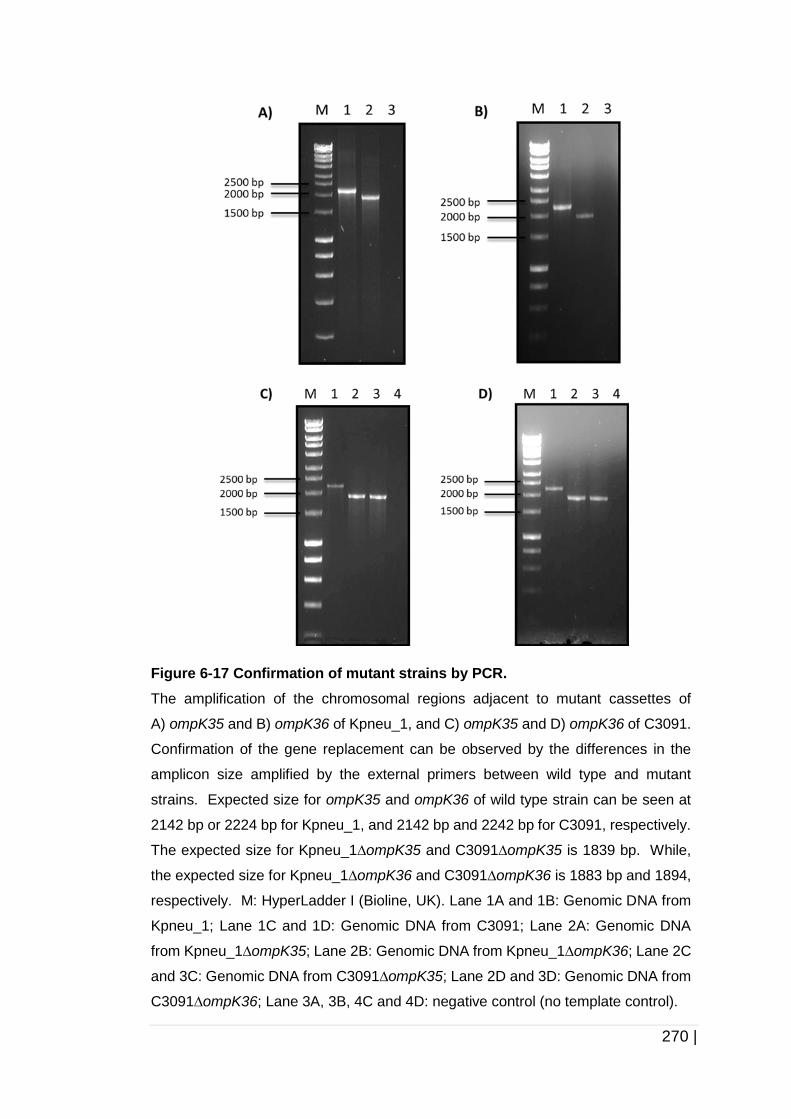
270 |
Figure 6-17 Confirmation of mutant strains by PCR.
The amplification of the chromosomal regions adjacent to mutant cassettes of
A) ompK35 and B) ompK36 of Kpneu_1, and C) ompK35 and D) ompK36 of C3091.
Confirmation of the gene replacement can be observed by the differences in the
amplicon size amplified by the external primers between wild type and mutant
strains. Expected size for ompK35 and ompK36 of wild type strain can be seen at
2142 bp or 2224 bp for Kpneu_1, and 2142 bp and 2242 bp for C3091, respectively.
The expected size for Kpneu_1∆ompK35 and C3091∆ompK35 is 1839 bp. While,
the expected size for Kpneu_1∆ompK36 and C3091∆ompK36 is 1883 bp and 1894,
respectively. M: HyperLadder I (Bioline, UK). Lane 1A and 1B: Genomic DNA from
Kpneu_1; Lane 1C and 1D: Genomic DNA from C3091; Lane 2A: Genomic DNA
from Kpneu_1∆ompK35; Lane 2B: Genomic DNA from Kpneu_1∆ompK36; Lane 2C
and 3C: Genomic DNA from C3091∆ompK35; Lane 2D and 3D: Genomic DNA from
C3091∆ompK36; Lane 3A, 3B, 4C and 4D: negative control (no template control).
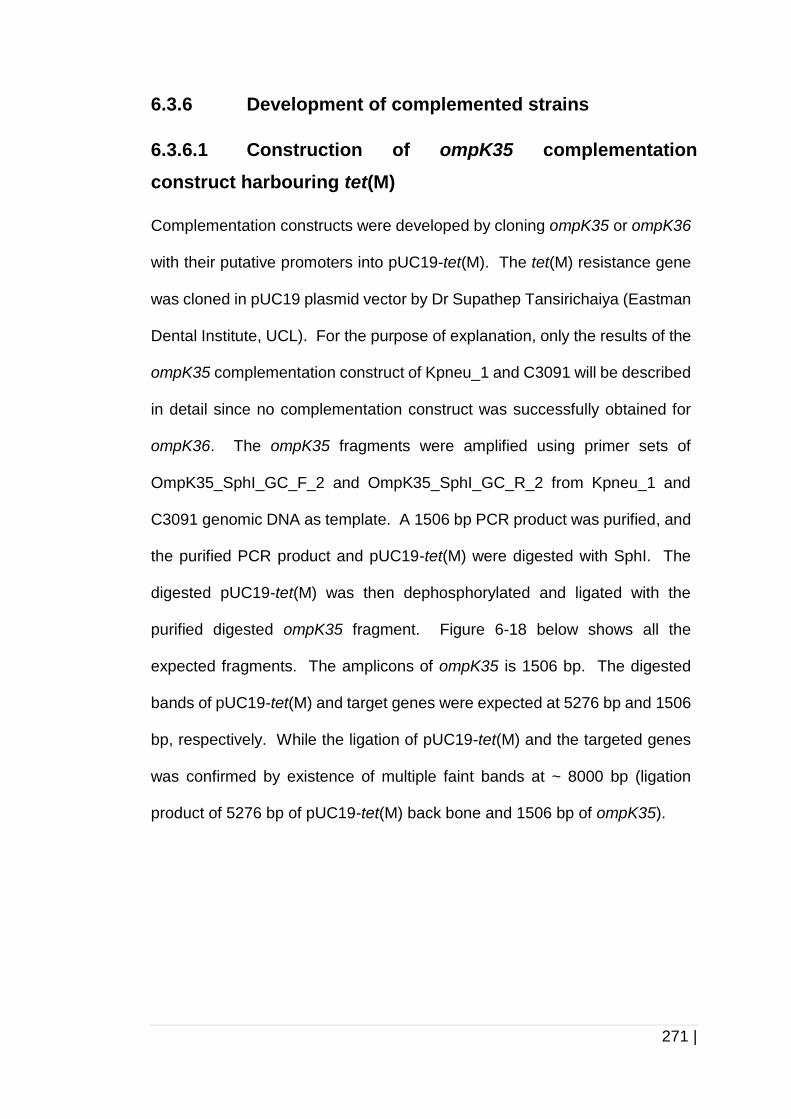
271 |
6.3.6 Development of complemented strains
6.3.6.1 Construction of ompK35 complementation
construct harbouring tet(M)
Complementation constructs were developed by cloning ompK35 or ompK36
with their putative promoters into pUC19-tet(M). The tet(M) resistance gene
was cloned in pUC19 plasmid vector by Dr Supathep Tansirichaiya (Eastman
Dental Institute, UCL). For the purpose of explanation, only the results of the
ompK35 complementation construct of Kpneu_1 and C3091 will be described
in detail since no complementation construct was successfully obtained for
ompK36. The ompK35 fragments were amplified using primer sets of
OmpK35_SphI_GC_F_2 and OmpK35_SphI_GC_R_2 from Kpneu_1 and
C3091 genomic DNA as template. A 1506 bp PCR product was purified, and
the purified PCR product and pUC19-tet(M) were digested with SphI. The
digested pUC19-tet(M) was then dephosphorylated and ligated with the
purified digested ompK35 fragment. Figure 6-18 below shows all the
expected fragments. The amplicons of ompK35 is 1506 bp. The digested
bands of pUC19-tet(M) and target genes were expected at 5276 bp and 1506
bp, respectively. While the ligation of pUC19-tet(M) and the targeted genes
was confirmed by existence of multiple faint bands at ~ 8000 bp (ligation
product of 5276 bp of pUC19-tet(M) back bone and 1506 bp of ompK35).
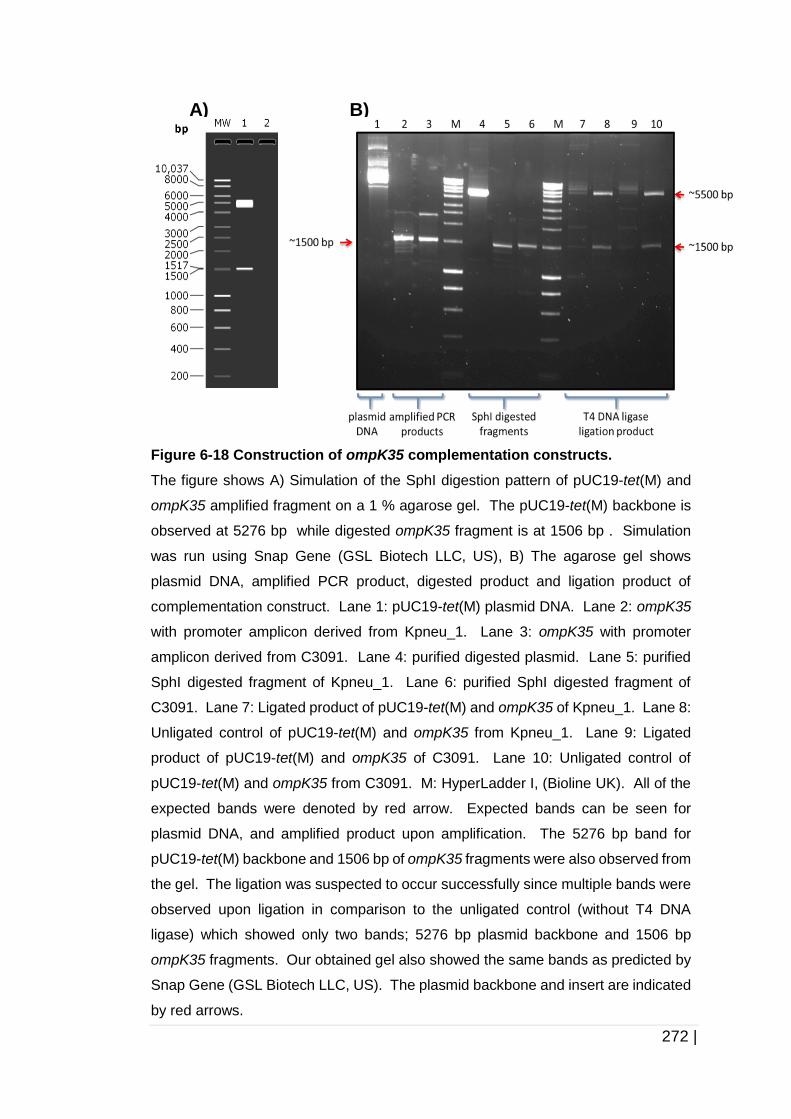
272 |
Figure 6-18 Construction of ompK35 complementation constructs.
The figure shows A) Simulation of the SphI digestion pattern of pUC19-tet(M) and
ompK35 amplified fragment on a 1 % agarose gel. The pUC19-tet(M) backbone is
observed at 5276 bp while digested ompK35 fragment is at 1506 bp . Simulation
was run using Snap Gene (GSL Biotech LLC, US), B) The agarose gel shows
plasmid DNA, amplified PCR product, digested product and ligation product of
complementation construct. Lane 1: pUC19-tet(M) plasmid DNA. Lane 2: ompK35
with promoter amplicon derived from Kpneu_1. Lane 3: ompK35 with promoter
amplicon derived from C3091. Lane 4: purified digested plasmid. Lane 5: purified
SphI digested fragment of Kpneu_1. Lane 6: purified SphI digested fragment of
C3091. Lane 7: Ligated product of pUC19-tet(M) and ompK35 of Kpneu_1. Lane 8:
Unligated control of pUC19-tet(M) and ompK35 from Kpneu_1. Lane 9: Ligated
product of pUC19-tet(M) and ompK35 of C3091. Lane 10: Unligated control of
pUC19-tet(M) and ompK35 from C3091. M: HyperLadder I, (Bioline UK). All of the
expected bands were denoted by red arrow. Expected bands can be seen for
plasmid DNA, and amplified product upon amplification. The 5276 bp band for
pUC19-tet(M) backbone and 1506 bp of ompK35 fragments were also observed from
the gel. The ligation was suspected to occur successfully since multiple bands were
observed upon ligation in comparison to the unligated control (without T4 DNA
ligase) which showed only two bands; 5276 bp plasmid backbone and 1506 bp
ompK35 fragments. Our obtained gel also showed the same bands as predicted by
Snap Gene (GSL Biotech LLC, US). The plasmid backbone and insert are indicated
by red arrows.
A) B)
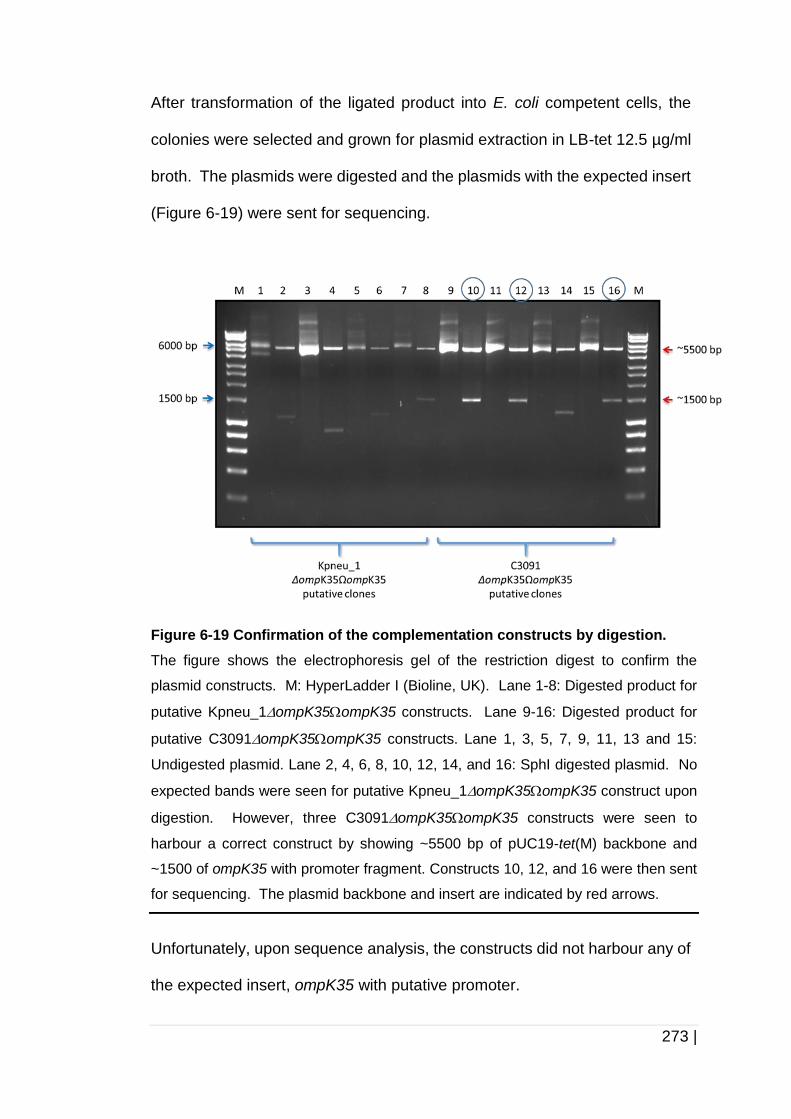
273 |
After transformation of the ligated product into E. coli competent cells, the
colonies were selected and grown for plasmid extraction in LB-tet 12.5 µg/ml
broth. The plasmids were digested and the plasmids with the expected insert
(Figure 6-19) were sent for sequencing.
Figure 6-19 Confirmation of the complementation constructs by digestion.
The figure shows the electrophoresis gel of the restriction digest to confirm the
plasmid constructs. M: HyperLadder I (Bioline, UK). Lane 1-8: Digested product for
putative Kpneu_1ompK35ompK35 constructs. Lane 9-16: Digested product for
putative C3091ompK35ompK35 constructs. Lane 1, 3, 5, 7, 9, 11, 13 and 15:
Undigested plasmid. Lane 2, 4, 6, 8, 10, 12, 14, and 16: SphI digested plasmid. No
expected bands were seen for putative Kpneu_1ompK35ompK35 construct upon
digestion. However, three C3091ompK35ompK35 constructs were seen to
harbour a correct construct by showing ~5500 bp of pUC19-tet(M) backbone and
~1500 of ompK35 with promoter fragment. Constructs 10, 12, and 16 were then sent
for sequencing. The plasmid backbone and insert are indicated by red arrows.
Unfortunately, upon sequence analysis, the constructs did not harbour any of
the expected insert, ompK35 with putative promoter.
274 |
6.3.7 Antimicrobial susceptibility testing
It is very important to determine the factors contributing to the emergence of
antimicrobial resistant K. pneumoniae as it is one of the significant growing
concerns in healthcare settings (O'Neill, 2016). Other than acquisition of
antimicrobial resistance genes, impermeability of the outer membrane layer
(Nikaido, 2003), loss or modification of porin(s) (Pagès, et al., 2008) are also
known to contribute to these factors.
To investigate the role of OmpK35 and OmpK36 in antibiotic and antiseptic
resistance, the antimicrobial susceptibility testing was conducted on the wild
type strains and their isogenic mutant strains. The antibiotics tested in this
study were from different families and had different modes of action. They
were -lactam (cefotaxime), fluoroquinolone (ciprofloxacin), tetracycline
(tetracycline) and the aminoglycoside (gentamicin). While the quaternary
ammonium compound (QAC) antiseptics were cetylpyridinium chloride (CPC)
and cetyltrimethylammonium bromide (CTAB). Due to growing number of
hospital-acquired K. pneumoniae infection cases, it has become important to
investigate the resistance mechanism of QACs in K. pneumoniae as QACs
are among the main components for detergents and antiseptics used in
hospitals.
275 |
Table 6-4 summarises the median MIC (µg/ml) and the range of cefotaxime,
ciprofloxacin, tetracycline, gentamicin, CPC, and CTAB tested for Kpneu_1
and C3091, and their isogenic mutants: Kpneu_1ompK35,
Kpneu_1ompK36, C3091ompK35, and C3091ompK36. The clinical
strain, Kpneu_1 was, in general resistant to more antibiotics compared to the
laboratory strain, C3091 (based on the EUCAST breakpoint). Deletion of
ompK35 and ompK36 was observed to cause increased resistance to several
antibiotics especially to cefotaxime and tetracycline. The increased
resistance to cefotaxime was observed in C3091ompK36 which was
2.5 times higher compared to its wild type and C3091ompK35 counterpart.
However, the increased resistance in strain Kpneu_1 and its isogenic mutants
could not be identified since the median MIC of cefotaxime for all the strains
was > 32 µg/ml and this value is out of the E- test range for cefotaxime.
Moreover, increased resistance to tetracycline was also observed in
Kpneu_1ompK35 and C3091ompK35 compared to their wild type and
ompK36 mutant counterparts. The median MIC of tetracycline for
Kpneu_1ompK35 was 0.75 µg/ml, which was 1.5 times higher than the
median MICs of tetracycline for Kpneu_1 and Kpneu_1ompK36, which were
at 0.5 µg/ml. While the median MIC of tetracycline for C3091ompK35
(1.5 µg/ml) was 1.5 times higher than the median MIC of C3091 (0.75 µg/ml)
and 3 times higher than the median MIC of C3091ompK36 which was only
0.5 µg/ml.
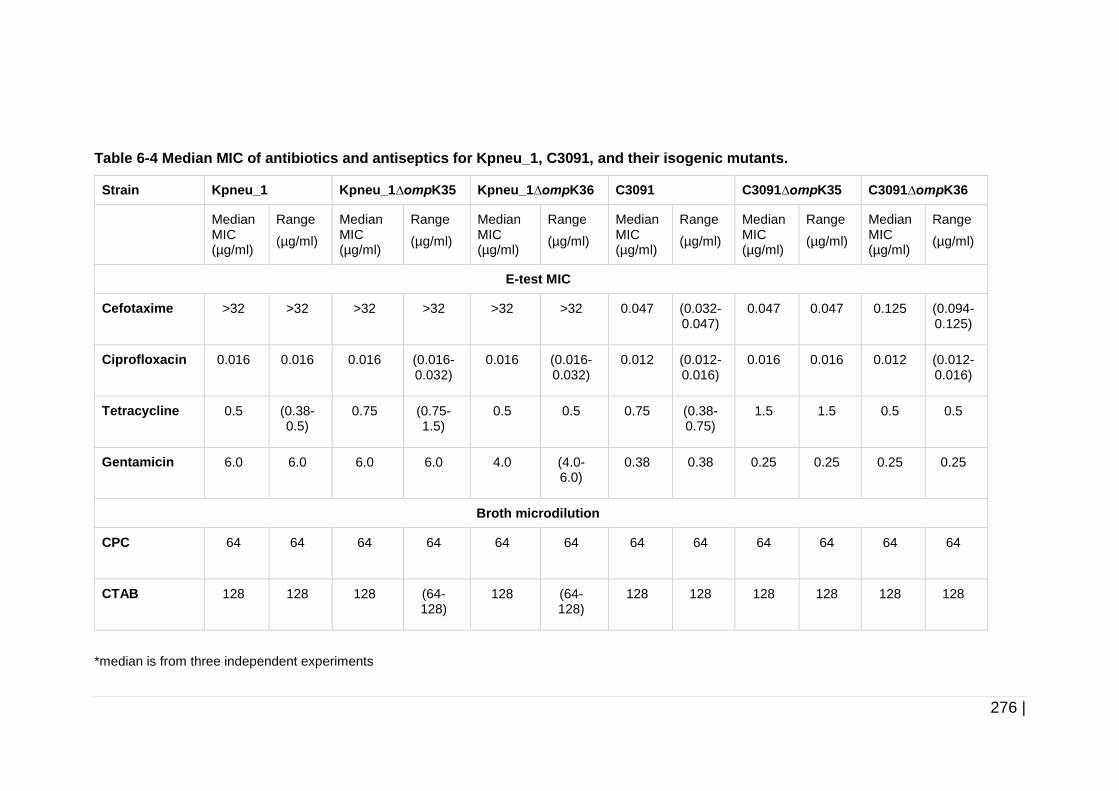
276 |
Table 6-4 Median MIC of antibiotics and antiseptics for Kpneu_1, C3091, and their isogenic mutants.
Strain Kpneu_1 Kpneu_1∆ompK35 Kpneu_1∆ompK36 C3091 C3091∆ompK35 C3091∆ompK36
Median MIC (µg/ml)
Range
(µg/ml)
Median MIC (µg/ml)
Range
(µg/ml)
Median MIC (µg/ml)
Range
(µg/ml)
Median MIC (µg/ml)
Range
(µg/ml)
Median MIC (µg/ml)
Range
(µg/ml)
Median MIC (µg/ml)
Range
(µg/ml)
E-test MIC
Cefotaxime >32 >32 >32 >32 >32 >32
0.047 (0.032-0.047)
0.047 0.047 0.125 (0.094-0.125)
Ciprofloxacin 0.016 0.016 0.016
(0.016-0.032)
0.016 (0.016-0.032)
0.012 (0.012-0.016)
0.016
0.016
0.012
(0.012-0.016)
Tetracycline 0.5
(0.38-0.5)
0.75 (0.75-1.5)
0.5 0.5 0.75 (0.38-0.75)
1.5 1.5 0.5 0.5
Gentamicin 6.0 6.0 6.0 6.0 4.0
(4.0-6.0)
0.38 0.38 0.25 0.25 0.25 0.25
Broth microdilution
CPC 64 64 64 64 64 64
64 64 64 64 64 64
CTAB 128 128 128 (64-128)
128 (64-128)
128 128 128 128 128 128
*median is from three independent experiments
277 |
6.3.8 Growth kinetics of wild type and mutant strains upon
cultivation in TSB and AUM
Growth curves performed in TSB and AUM for Kpneu_1, C3091, and their
isogenic mutant strains showed that all the strains grew faster in TSB
compared to AUM. The difference can be seen from the growth curve which
showed that all the strains reached mid-log phase quicker in TSB in
comparison to AUM (Figure 6-20 and Figure 6-21), and also by the growth rate
constant (µ) and doubling time (td) which are presented in Table 6-5. The
growth rate constant and doubling time was determined using the calculation
mentioned in Chapter 4 section 4.2.3.1. The growth curves of Kpneu_1 and
C3091 wild type strains were almost similar with their isogenic mutants upon
cultivation in TSB and AUM. All strains reached mid-log phase after 2 h
cultivation in TSB (Figure 6-20) while they approached mid-log phase after
4 h cultivation in AUM (Figure 6-21).
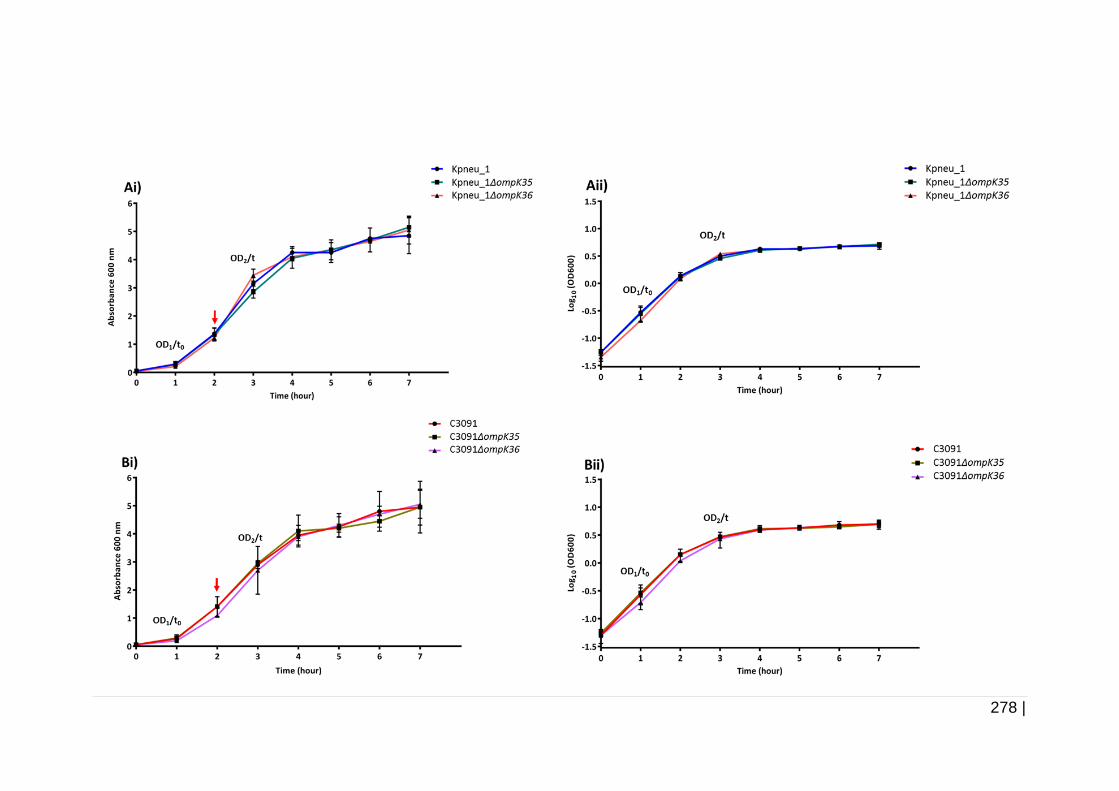
278 |
279 |
Figure 6-20 Growth curve of Kpneu_1, C3091, and isogenic mutants in TSB.
The figure shows growth curve of A) Kpneu_1 and its isogenic mutant strains and B) C3091 and its isogenic mutant strains in TBS plotted in two
different scales: i) linear scale and ii) logarithmic scale. Data presented are the mean of two independent experiments and error bars indicates
the standard deviations. All of the strains showed almost similar growth rate upon cultivation in TSB especially when reaching the exponential
phase. Mid-log phase (indicated by the red arrow) of all the strains was observed after 2 h. The OD1/t0 and OD2/t for growth rate constant and
doubling time determination are as labelled. The graph lines are indicated as follow: blue: Kpneu_1, turquoise: Kpneu_1∆ompK35, light orange:
Kpneu_1∆ompK36, red: C3091, dark green: C3091∆ompK35 and purple: C3091∆ompK36. The OD1 and OD2 are the absorbance value and t0
and t are the time, at late and early log phase used for calculation based on the equation in Chapter 4 section 4.2.3.1
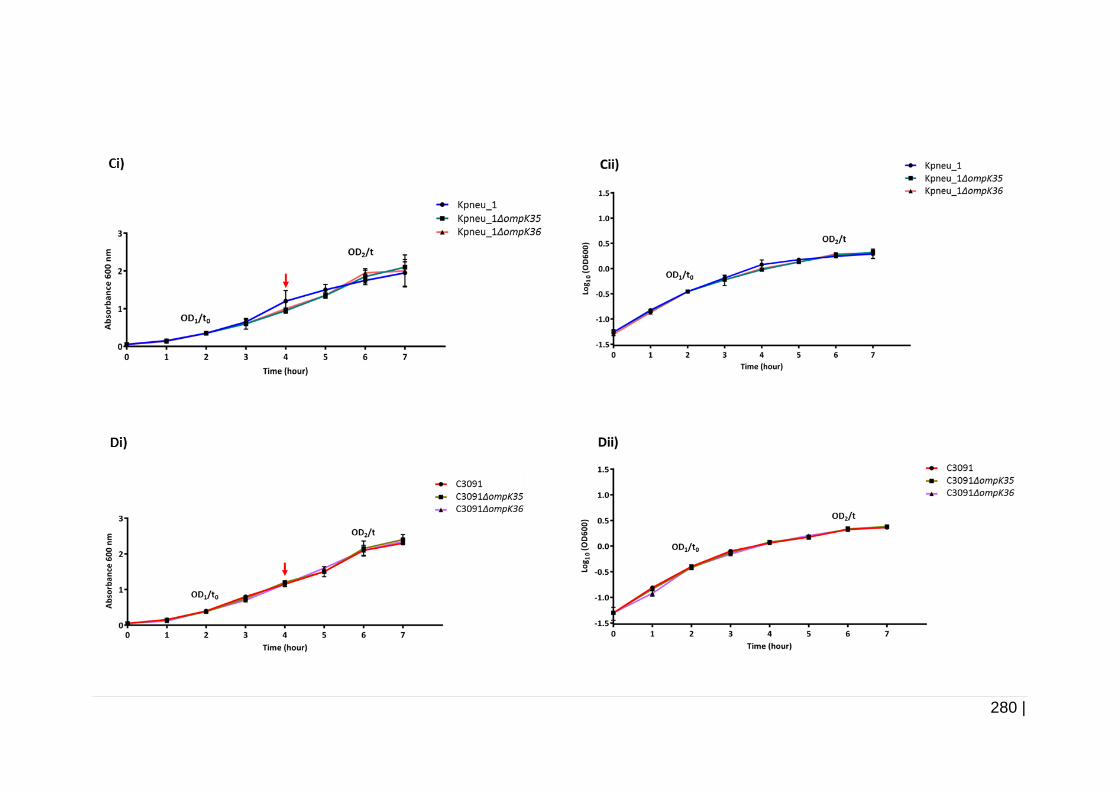
280 |
281 |
Figure 6-21 Growth curve of Kpneu_1, C3091, and isogenic mutants in AUM.
The figure shows growth curve of A) Kpneu_1 and its isogenic mutant strains and B) C3091 and its isogenic mutant strains in AUM plotted in
two different scales: i) linear scale and ii) logarithmic scale. Data presented are the mean of two independent experiments and error bars
indicates the standard deviations. All of the strains showed almost similar growth rate upon cultivation in AUM especially when reaching the
exponential phase. Mid-log phase (indicated by the red arrow) of all the strains was observed after 4 h. The OD1/t0 and OD2/t for growth rate
constant and doubling time determination are as labelled. The graph lines are indicated as follow: blue: Kpneu_1, turquoise: Kpneu_1∆ompK35,
light orange: Kpneu_1∆ompK36, red: C3091, dark green: C3091∆ompK35 and purple: C3091∆ompK36. The OD1 and OD2 are the absorbance
value and t0 and t, are the time at late and early log phase used for calculation based on the equation in Chapter 4 section 4.2.3.1
282 |
The growth rate constant (µ) and doubling time (td) of Kpneu_1 and C3091,
and their isogenic mutant strains were determined according to the calculation
showed in Chapter 4, section 4.2.3.1. Doubling time for strain Kpneu_1 and
C3091 and their isogenic ∆ompK35 strains, Kpneu_1∆ompK35 and
C3091∆ompK35 was 35 min in TSB. While their isogenic mutants,
Kpneu_1∆ompK36 and C3091∆ompK36 had doubling time of 29 min. The
doubling time for all the wild type and mutant strains upon cultivation in AUM
(Figure 6-21) was longer compared to TSB. The doubling times of strain
Kpneu_1 and C3091 upon cultivation in AUM were 103 min and 100 min,
respectively. Their mutant strains showed slightly shorter doubling times
although no obvious differences could be seen from the growth curve. The
doubling times of Kpneu_1∆ompK35 and Kpneu_1∆ompK36 upon cultivation
in AUM were 100 min and 97 min, respectively. While the doubling times of
C3091∆ompK35 and C3091∆ompK36 upon cultivation in AUM were 96 min
and 99 min, respectively (Table 6-5).
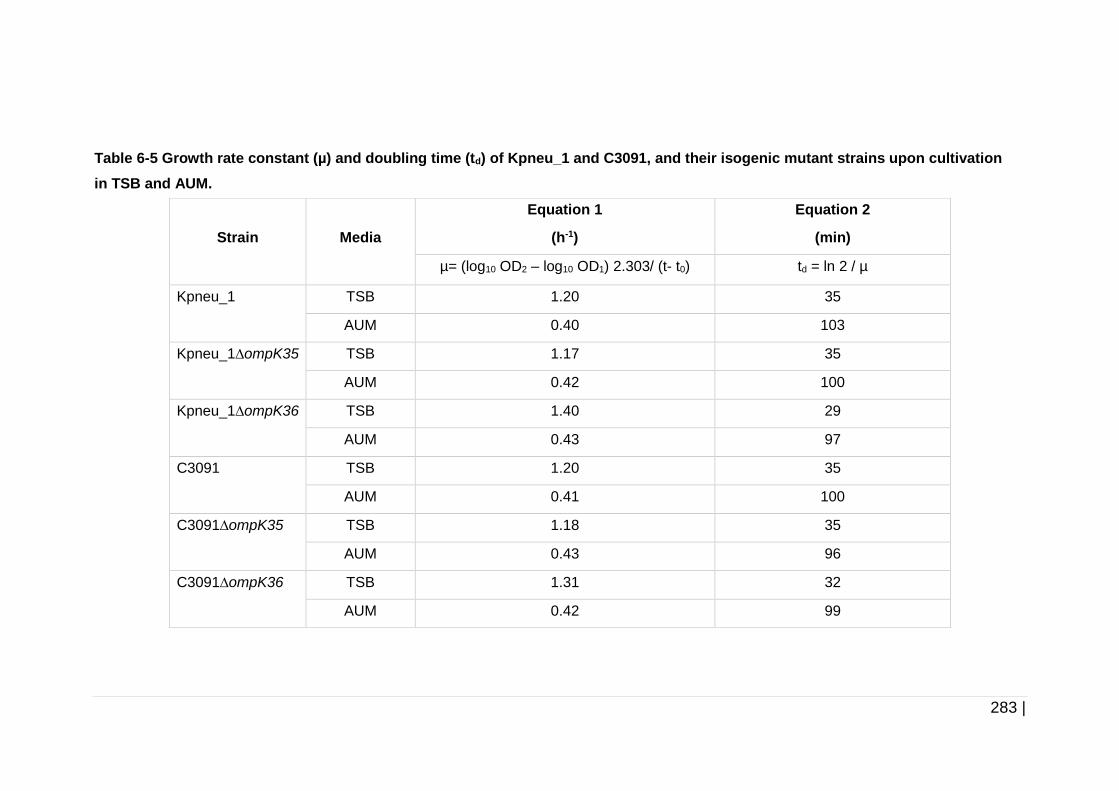
283 |
Table 6-5 Growth rate constant (µ) and doubling time (td) of Kpneu_1 and C3091, and their isogenic mutant strains upon cultivation
in TSB and AUM.
Strain
Media
Equation 1
(h-1)
Equation 2
(min)
µ= (log10 OD2 – log10 OD1) 2.303/ (t- t0) td = ln 2 / µ
Kpneu_1 TSB 1.20 35
AUM 0.40 103
Kpneu_1∆ompK35 TSB 1.17 35
AUM 0.42 100
Kpneu_1∆ompK36 TSB 1.40 29
AUM 0.43 97
C3091 TSB 1.20 35
AUM 0.41 100
C3091∆ompK35 TSB 1.18 35
AUM 0.43 96
C3091∆ompK36 TSB 1.31 32
AUM 0.42 99
284 |
6.3.9 Role of OmpK35 and OmpK36 in biofilm formation by
K. pneumoniae in 96-well polystyrene tissue culture treated
plates
In order to determine a role of OmpK35 and OmpK36 in biofilm formation by
K. pneumoniae, both of the strains, Kpneu_1 and C3091 and their isogenic
mutants were used in this experiment. No significant difference was seen
between Kpneu_1 and its isogenic mutant strains upon cultivation in either
medium. In addition, no significant difference in biofilm formation by strain
C3091 and C3091∆ompK35 could be seen upon cultivation in TSB. However,
strain C3091 was found to form slightly lower biofilm
(p < 0.05) in AUM compared to strain C3091∆ompK36 (Figure 6-22).
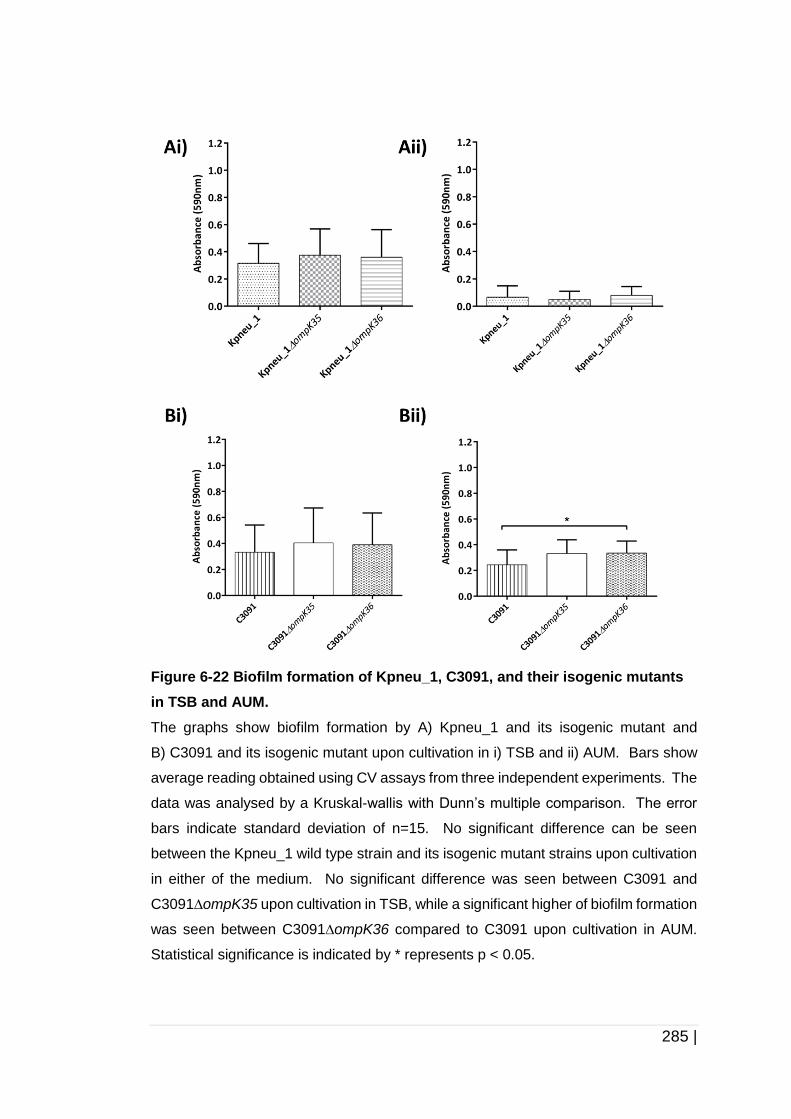
285 |
Figure 6-22 Biofilm formation of Kpneu_1, C3091, and their isogenic mutants
in TSB and AUM.
The graphs show biofilm formation by A) Kpneu_1 and its isogenic mutant and
B) C3091 and its isogenic mutant upon cultivation in i) TSB and ii) AUM. Bars show
average reading obtained using CV assays from three independent experiments. The
data was analysed by a Kruskal-wallis with Dunn’s multiple comparison. The error
bars indicate standard deviation of n=15. No significant difference can be seen
between the Kpneu_1 wild type strain and its isogenic mutant strains upon cultivation
in either of the medium. No significant difference was seen between C3091 and
C3091∆ompK35 upon cultivation in TSB, while a significant higher of biofilm formation
was seen between C3091∆ompK36 compared to C3091 upon cultivation in AUM.
Statistical significance is indicated by * represents p < 0.05.
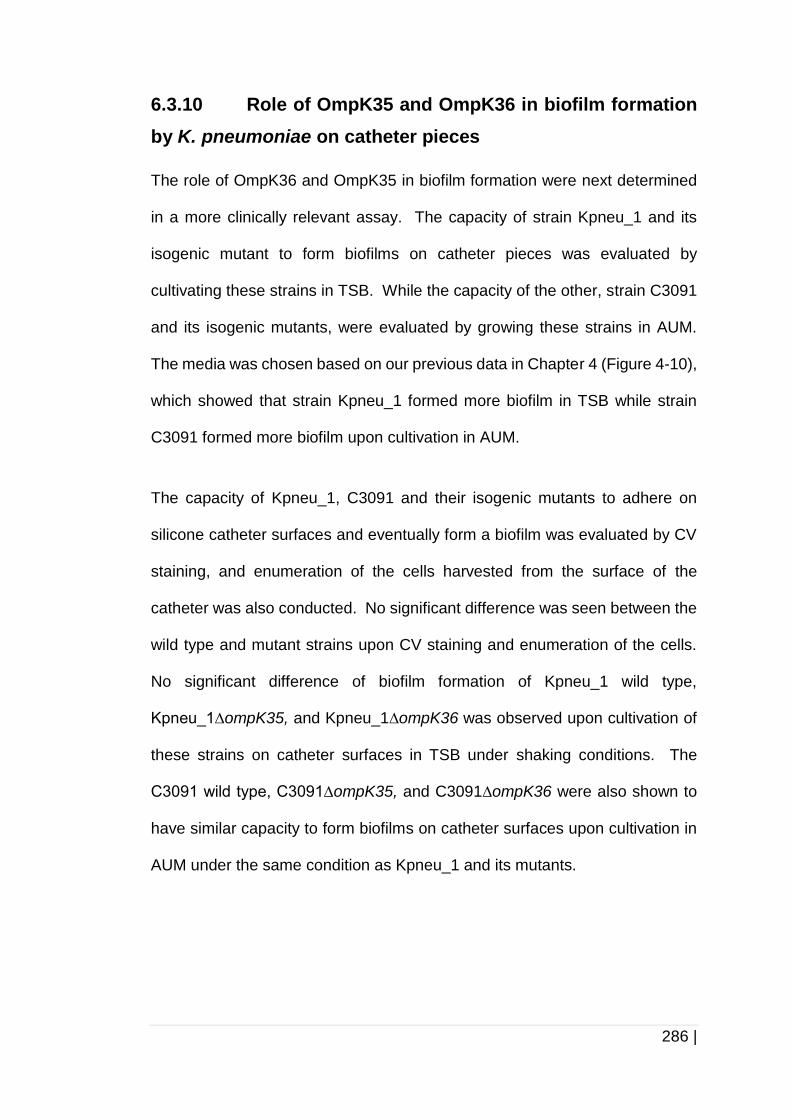
286 |
6.3.10 Role of OmpK35 and OmpK36 in biofilm formation
by K. pneumoniae on catheter pieces
The role of OmpK36 and OmpK35 in biofilm formation were next determined
in a more clinically relevant assay. The capacity of strain Kpneu_1 and its
isogenic mutant to form biofilms on catheter pieces was evaluated by
cultivating these strains in TSB. While the capacity of the other, strain C3091
and its isogenic mutants, were evaluated by growing these strains in AUM.
The media was chosen based on our previous data in Chapter 4 (Figure 4-10),
which showed that strain Kpneu_1 formed more biofilm in TSB while strain
C3091 formed more biofilm upon cultivation in AUM.
The capacity of Kpneu_1, C3091 and their isogenic mutants to adhere on
silicone catheter surfaces and eventually form a biofilm was evaluated by CV
staining, and enumeration of the cells harvested from the surface of the
catheter was also conducted. No significant difference was seen between the
wild type and mutant strains upon CV staining and enumeration of the cells.
No significant difference of biofilm formation of Kpneu_1 wild type,
Kpneu_1∆ompK35, and Kpneu_1∆ompK36 was observed upon cultivation of
these strains on catheter surfaces in TSB under shaking conditions. The
C3091 wild type, C3091∆ompK35, and C3091∆ompK36 were also shown to
have similar capacity to form biofilms on catheter surfaces upon cultivation in
AUM under the same condition as Kpneu_1 and its mutants.
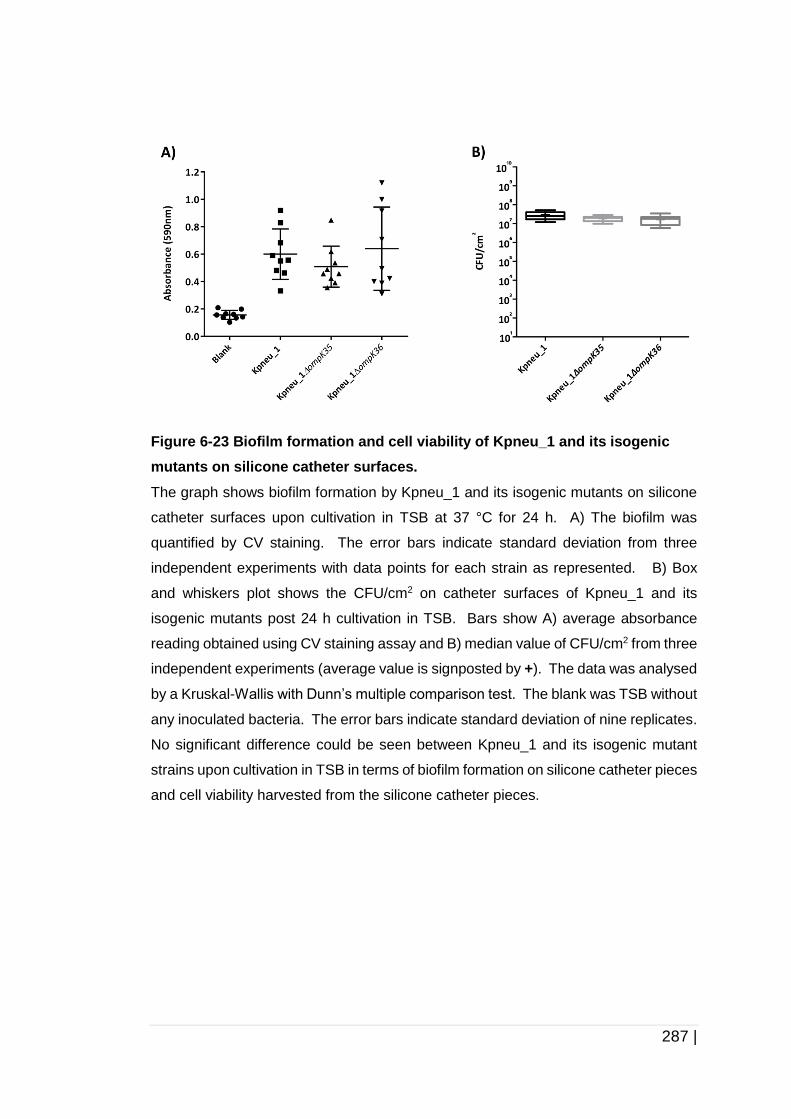
287 |
Figure 6-23 Biofilm formation and cell viability of Kpneu_1 and its isogenic
mutants on silicone catheter surfaces.
The graph shows biofilm formation by Kpneu_1 and its isogenic mutants on silicone
catheter surfaces upon cultivation in TSB at 37 °C for 24 h. A) The biofilm was
quantified by CV staining. The error bars indicate standard deviation from three
independent experiments with data points for each strain as represented. B) Box
and whiskers plot shows the CFU/cm2 on catheter surfaces of Kpneu_1 and its
isogenic mutants post 24 h cultivation in TSB. Bars show A) average absorbance
reading obtained using CV staining assay and B) median value of CFU/cm2 from three
independent experiments (average value is signposted by +). The data was analysed
by a Kruskal-Wallis with Dunn’s multiple comparison test. The blank was TSB without
any inoculated bacteria. The error bars indicate standard deviation of nine replicates.
No significant difference could be seen between Kpneu_1 and its isogenic mutant
strains upon cultivation in TSB in terms of biofilm formation on silicone catheter pieces
and cell viability harvested from the silicone catheter pieces.
288 |
Figure 6-24 Biofilm formation and cell viability of C3091 and its isogenic
mutants on silicone catheter surfaces.
The graph shows biofilm formation by C3091 and its isogenic mutants on silicone
catheter surfaces upon cultivation in AUM at 37 °C for 24 h. A) The biofilm was
quantified by CV staining. The error bars indicate standard deviation from three
independent experiments with data points for each strain as represented. B) Box and
whiskers plot shows the CFU/cm2 on catheter surfaces of C3091 and its isogenic
mutants post 24 h cultivation in AUM. Bars show A) average absorbance reading
obtained using CV staining assay and B) median value of CFU/cm2 from three
independent experiments (average value is signposted by +). The data was analysed
by a Kruskal-Wallis with Dunn’s multiple comparison test. The blank was AUM without
any inoculated bacteria. The error bars indicate standard deviation of nine replicates.
No significant difference could be seen between C3091 and its isogenic mutant
strains upon cultivation in AUM in terms of biofilm formation on silicone catheter
pieces and cell viability harvested from the silicone catheter pieces.
289 |
6.4 Discussion
In the initial part of this study, the University of California, San Francisco,
UCSF Chimera 1.12rc programme (Pettersen, et al., 2004); an open access
molecular modelling software for visualisation, and analysis of protein
structure and functional modelling was used to illustrate and superimpose the
3D structures of OmpC, OmpK36, and predicted structure of OmpK35.
Structure-based alignment is known to be more reliable than sequence-based
alignment since protein structure is thought to be more conserved than
sequence (Chothia, et al. , 1986).
This software was chosen since it provides access to many analysis tools that
were important in our study such as sequence alignment, structure alignment
or superimposition. Protein structures can be visualised automatically with
their amino acid sequences. In addition, this programme can superimpose two
different structures without the existence of pre-existing sequence alignment,
and it can match the sequences and secondary structures of two proteins,
even if they have very low sequence identity. Our protein structural analysis
data demonstrated that OmpC of E. coli and OmpK36 of K. pneumoniae, and
also OmpK36 and OmpK35 have a high degree of structural similarity and a
high percentage of amino acid sequence identity. We then hypothesised that
OmpC, OmpK36 and OmpK35 could possibly play similar functions since they
were shown to have a high degree of structural similarity. Our hypothesis was
also based on the concept that orthologs, possibly play the same or similar
functions in different species (Lee, et al. , 2007). This concept, however, is not
applicable for all orthologs since the specific protein conformation or protein
290 |
fold adopted by any particular protein does not necessarily lead to the same
function (Lee, et al., 2007).
We then developed our ompK35 and ∆ompK36 mutant strains of Kpneu_1
and C3091 by site-directed mutagenesis by homologous recombination using
λ-red recombinase system. Our result showed that a single deletion of
ompK35 and ompK36 occurred by replacement of these genes in the genome
of wild type strains with aad9 from the mutant cassettes. Unfortunately, no
complemented strains were obtained and this will be discussed later.
At the beginning of this study, ompK35 and ompK36 mutant constructs were
designed with erm1(B) as a selective marker. Unfortunately, we had
difficulties with the screening for putative mutant colonies. Uncountable
K. pneumoniae colonies were found to grow on LB plates even with a very
high concentration of erythromycin (~ 400 µg/ml). The background growth of
non-recombinant negative control colonies was also observed on this
selective medium. Hence, the mutant constructs were then re-developed
using a different selective marker to eliminate the appearance of false positive
colonies. The growth of false positive colonies could be due to an intrinsic
resistance of K. pneumoniae to erythromycin.
We concluded that erm1(B) was not a suitable marker to be used for
K. pneumoniae mutagenesis, even though all the strains used in this study
did not harbour erm1(B). This is probably because the outer membrane (OM)
layer of K. pneumoniae is composed of asymmetric bilayer of LPS and
phospholipids. It is proven that intrinsic resistance against erythromycin could
291 |
be due to intact hydrophilic LPS at the OM layer of several Gram-negative
bacteria, which results in slow passive diffusion of erythromycin and
eventually provides a permeability barrier to this lipophilic drug (Nikaido,
2003). The erythromycin resistance also might be due to the existence of an
active efflux pump, which pumps the antibiotics out of the cells through the
membrane that leads to less concentrated antibiotics in the cytoplasm
(Webber, et al. , 2003). Small hydrophilic porin channels that are located in
the OM layer also inhibit the entrance of large hydrophobic molecules such
as erythromycin (Delcour, 2003; Pagès, et al., 2008). This is due to the
existence of an eyelet structure (see Figure 6-1) in porins that provides size
exclusion limits to the entrance of those big molecules (Delcour, 2009).
Since most of the strains used in this study were resistant to almost all
available antibiotics including those antibiotics that are commonly used as
selective markers (see Table 2-3) during cloning, we encountered another
problem to choose a suitable selective marker for the mutagenesis. The initial
mutant constructs were modified by replacing the erm1(B) with aad9. aad9
which encodes for spectinomycin adenyltransferase was first identified in
E. faecalis LDR55 plasmid, pDL412 (LeBlanc, et al. , 1991). This gene was
chosen but with a limitation that only three strains were subjected to be
manipulated, Kpneu_1, Kpneu_110, and C3091, since they had a lower MIC
of spectinomycin (12.5 µg/ml) than the MIC could be used for selection
(100 µg/ml). These strains were also confirmed to not carry aad9 by PCR.
The second reason of the failure to obtain mutant strains was thought to be
due to a host native RecBCD exonuclease pathway in K. pneumoniae
292 |
(C. Chen, et al. , 2016). This pathway is comprised of heterotrimer RecBCD
enzyme, consisting of three distinctly different polypeptides, RecB, RecC and
RecD. This RecBCD complex binds to the end of double-stranded DNA.
Operating from a 3’-5’ translocation polarity at the end of the double stranded
DNA, RecBCD unwinds the duplex by its fast and weak helicases, RecD and
RecB, respectively. Upon recognition of a cross-over hotspot instigator (Chi)
(5’ GCTGGTGG 3’) site on one strand by RecC, the enzyme complex cleaves
the other complementary strand, and exposes the new 3’ single strands end
with the Chi site. The recombinase protein (RecA) is then nucleated onto the
ssDNA to form a nucleoprotein filament. The RecA nucleoprotein filament
scavenges for a homologous strand from the host genome and catalyses the
DNA strand invasion by pairing the invading ssDNA with the host
complementary strand, and displacing the non-complementary strand by
formation of a Holliday junction (Amundsen, et al. , 2007; Chen, et al., 2016;
Dillingham, et al. , 2008). After this process, the RecBCD complex is then
dissembled.
Apart from recombinase, this potent exonuclease is also responsible for rapid
degradation of invading linear DNA (Wilkinson, et al. , 2016). This RecBCD
system directly targets foreign DNA elements that invade into host cells, and
without Chi site, degradation would possibly occur continuously until the whole
duplex DNA strand is digested. This might be happening in our
K. pneumoniae strains resulting in no mutant strains being obtained at first.
An alternative approach was then taken to overcome the RecBCD pathway in
K. pneumoniae strains, which was to increase the recombination efficiency of
linear foreign DNA into the bacterial chromosome.
293 |
Taken together, these approaches allowed us to obtain the ompK35 and
∆ompK36 mutant strains derived from Kpneu_1 and C3091 by reconstructing
new mutant constructs and adapting the recombineering method by λ-red
recombinase using a helper plasmid, pKD46. Exo, Bet and Gam, which are
encoded by exo, bet and gam derived from the red operon of λ-bacteriophage,
also play a significant role in hindering the degradation of our mutant cassettes
by RecBCD pathway upon electroporation and indirectly mediates the
homologous recombination to occur.
In this study, we could not manage to develop a mutant strain for Kpneu_110.
Upon visualization, colonies of this strain had a very distinct
hypermucoviscous phenotype (see Figure 1-2 in Chapter 1) compared to the
other two strains. During preparation of electrocompetent cells of
Kpneu_110, centrifugation and washing step were slightly inefficient since the
cells were difficult to be pelleted down. Our observation similar with a
previous study by Pan, et al. (2011) which mentioned the constraints of using
hypermucoviscous K. pneumoniae strains. This strain, however, was able to
take up the pKD46-apra helper plasmid since it was shown to harbour the
pKD46-apra by amplification of the apramycin resistance gene, aac(3)-IV and
pKD46-apra plasmid backbone (data not shown), but, no homologous
recombination between the target gene, ompK35 or ompK36 with selectable
marker aad9 was observed upon electroporation. The decreased efficiency
of homologous recombination in this strain might be because of the
physicochemical hindrance conferred by thick capsule structure and this
remains to be explored.
294 |
No complemented strains were obtained in this study. Our result might
suggest that usage of a high copy number plasmid such as pUC19 was
unsuitable for development of ompK35 or ompK36 complemented strains
since this may result in high levels of OmpK35 or OmpK36 that might
destabilise the outer membrane. Also, we hypothesised that the host cells
could not survive since abundant production of porins can be detrimental to
the growth of cells (K. L. Jones, et al. , 2000) and lead to porous cells.
Therefore, to develop complemented strains of ompK35 or ompK36, these
genes should be expressed in a low or single copy number plasmid. A low
copy number plasmid could be used instead of high copy number plasmid
(Sugawara, et al., 2016).
In addition, we also could not manage to obtain the complementation
constructs. As shown in Figure 6-18 and Figure 6-19, we managed to get the
putative mutant constructs with the expected size, however, they did not
harbour the complementation cassettes after confirmation by sequencing.
This could be because of a high degree similarity of ompK35 or ompK36 of
K. pneumoniae with ompF and ompC of E. coli which leads to homologous
recombination that could possibly occur. The fact that most of E. coli cloning
hosts are recA deficient to minimise any unexpected homologous
recombination, this homologous recombination is very unlikely to occur but it
is also important to consider this factor since there is still a chance it will
happen. Using a different cloning host as an example, Bacillus subtilis and a
low copy number plasmid, pHCMC05 or a copy control plasmid as in
pCC1BAC would possibly increase the efficiency, but further study is needed
to confirm this hypothesis.
295 |
The effect of OmpK35 and OmpK36 porin loss on antibiotic and antiseptic
resistance was determined using E-test and broth microdilution assays,
respectively. Loss of OmpK36 was shown to have an effect on median MIC
of cefotaxime for strain C3091. This can be seen from our data, which
showed that C3091ompK36, the mutant strain derived from laboratory
strain, had 2.5 times higher median MIC of cefotaxime than for C3091 and
C3091ompK35. The reason is possible due to the lack of channels that can
be used to transport the cefotaxime into the bacterial cell, however, this
hypothesis needs to be confirmed together with the complementation strains.
This data is in contrast to the previous findings by Tsai, et al. (2011) which
showed that loss of one or both of OmpK35 or OmpK36 porin did not affect
the susceptibility of K. pneumoniae strain NVT2001 to cefotaxime. The
median MIC of Kpneu_1 and its isogenic mutant strains, however, could not
be confirmed since it was higher than the detection limit of cefotaxime E-test
strip.
Another prominent difference that could be seen was the increased median
MIC of tetracycline for C3091ompK35 in comparison to its parental strain
and C3091ompK36. The data shows that Kpneu_1ompK35 also had a
higher median MIC of tetracycline than Kpneu_1 and Kpneu_1ompK36.
This suggested that OmpK35 might play a role for tetracycline transportation
across the membrane for both of these strains. Our data is in accordance
with the previous finding by Thanassi, et al. (1995) who also proved that
uptake of tetracycline was reduced in an E. coli ompF mutant, and increased
resistance in mutants with decreased expression of ompF. These finding
296 |
together with our finding clearly suggesting that tetracycline might use
OmpK35 or its homolog, OmpF as a channel to cross the outer membrane
layer of E. coli and K. pneumoniae. Since we did not have the complemented
strains, further study is warranted to confirm this hypothesis.
No large differences could be seen between Kpneu_1 and C3091 and their
isogenic mutants for the median MIC of ciprofloxacin and gentamicin. The
median MIC of ciprofloxacin was the same for Kpneu_1 and its isogenic
mutants, while C3091ompK35 had just only one dilution step of higher of
median MIC of ciprofloxacin (from 0.012 µg/ml to 0.016 µg/ml) compared to
its parental strain, C3091 and C3091ompK36. This is in agreement with the
finding by Hernández-Allés, et al. (2000) who found that deficiency in either
OmpK35 or OmpK36 porin expression did not result in increased MICs of
fluoroquinolones including the hydrophilic compounds, ciprofloxacin, and
gentamicin. A previous study also showed decreased MIC of ciprofloxacin
caused by the expression of OmpK35, was just one dilution step lower
(0.25 µg/ml) than the strain that expressed only OmpK36, and strain that
expressed both of the porins which the MIC was at 0.5 µg/ml (Doménech-
Sánchez, et al., 2003).
We, however, observed that C3091∆ompK35 and C3091∆ompK36 had
increased susceptibility to gentamicin compared to C3091 strain. The median
MIC of both of the mutant strains was found to be 1.5 times lower than their
wild type. In addition, Kpneu_1∆ompK36 was also found to have lower
median MIC to gentamicin compared to its wild type and Kpneu_1∆ompK35.
This observation is not in line with the previous study by Doménech-Sánchez,
297 |
et al. (2003) which showed that lack of OmpK35 or OmpK36 did not result in
any difference in MIC of gentamicin (4 µg/ml) in comparison to the strain that
expressed both of the porins.
Hernández-Allés, et al. (2000) also concluded that loss of expression of a
single porin either OmpK35 or OmpK36 or both porins did not alter the MICs
of aminoglycosides, fluoroquinolones, tetracycline, and chloramphenicol but
the MICs of β-lactams including cefotaxime were observed to increase for
ompK35/ompK36 porin-deficient mutants. Nonetheless, this is not the case
in our study since we found that absence of OmpK35 porin had a difference
in median MIC of tetracycline and loss of OmpK36 porin of C3091 showed
about 2.5 times higher median MIC of cefotaxime compared to its parental
strain and C3091ompK36. The role of porins in antibiotic susceptibility is
well-established. However, the variance of antibiotic susceptibility between
strains could also be due to the existence of other mechanisms of resistance
as an example, having efflux pumps or harbouring any resistance genes
against several classes of antibiotics in the same bacterial cells.
Due to the fact that OmpF and OmpC are charge preference, which prefer
neutral or cationic molecules over anionic molecules, we then hypothesised
that loss of OmpK35 and OmpK36, the homologs of OmpF and OmpC, might
affect MIC of CTAB and CPC against K. pneumoniae (Nikaido, 1994). QACs
are monocationic surfactants, which reduce the surface tension (interfacial
tension) of liquid, or between liquid and solid and form micelles. These
micelles can be easily dispersed in liquid. The following steps of the QACs
mechanisms against bacteria were proposed by McDonnell (2007):
298 |
i) absorption of QACs via the cell wall ii) interaction of QACs with the bacterial
cytoplasmic membrane (phospholipid and LPS) followed by disorientation of
the bacterial membrane iii) released of intracellular lower-weight compounds
iv) degradation of the proteins and DNA v) induction of cell autolysis by
autolytic enzymes (Denyer, et al. , 1998; Gerba, 2015; Maillard, 2002;
McDonnell, et al. , 1999). Data from our investigation, however, showed that
lack of porins, OmpK35 and OmpK36 did not affect the median MIC of CTAB
and CPC. This suggests that OmpK35 and OmpK36 may not be involved in
the entrance of these antiseptics into K. pneumoniae.
Since there was an effect on growth of the ΔompK35 and ΔompK36 (Figure
6-20 and Figure 6-21) mutants compared to wild types in TSB and AUM, it is
suggested that porins could possibly play a role in growth of
K. pneumoniae under high-osmolarity environment. Our observation,
however, is not in agreement with a previous study by Tsai, et al. (2011). This
study showed that wild type strain of NVT2001S had similar growth rate with
its ompK35 and ompK36 mutant strains which were grown in LB and their
generation time was 27 min for each strain. Our data showed similar growth
rates were observed between Kpneu_1 and C3091 and their ∆ompK35 mutant
strains upon growth in TSB with a doubling time of 35 min. Kpneu_1∆ompK36
and C3091∆ompK36 were observed to grow faster in TSB with doubling times
of 29 min and 32 min respectively. All the mutant strains also were observed
to have shorter doubling time upon cultivation in AUM in comparison to their
wild type strains. Thus, our data suggests that loss of OmpK35 does not alter
growth of K. pneumoniae, but loss of OmpK36 may have a very small effect
on the generation time upon growth in TSB. Whilst, loss of OmpK35 and
299 |
OmpK36 could possibly have an effect in generation time upon cultivation in
the nutrient-poor medium, AUM.
No significant difference was observed for biofilm formation by Kpneu_1
compared to its isogenic mutant strains in either of the media tested. In
addition, the same observation was obtained for biofilm formation by C3091
compared to C3091∆ompK35 upon cultivation in 96-well microtitre plates in
TSB. However, a small but significant increase could be seen for biofilm
formation by C3091∆ompK36 compared to C3091. Given the proposed role
of OmpC in biofilm formation by E. coli, we were quite surprised to observe
that loss of OmpK36 slightly increased the biofilm formation by
C3091∆ompK36. Our data suggests that OmpK36 possibly has a small but
significant effect on biofilm formation by K. pneumoniae upon cultivation in
AUM in 96-well microtitre plate.
We then performed another biofilm formation assays to investigate the role of
OmpK35 and OmpK36 in biofilm formation by Kpneu_1, C3091 and its
isogenic mutants in more clinically relevant assay. No significant difference
could be seen for cells number and also biofilm mass produced by Kpneu_1,
C3091 and their isogenic mutants upon cultivation in TSB and AUM,
respectively. This assay suggested that OmpK35 and OmpK36 do not
contribute to the biofilm formation by the tested K. pneumoniae strains upon
growth in TSB and AUM on catheter pieces.
300 |
6.5 Conclusion
In this chapter, we have shown that the amino acid sequences and protein
structure of OmpK36 are highly similar with OmpC of E. coli. In addition,
comparative structural alignment of OmpK36 and a putative structure of
OmpK35 shows high degree of similarity, despite sharing 60 % identity at the
amino acid sequence level.
Our data also shows that erm1(B) is not a suitable selective marker for
K. pneumoniae and the genetic manipulation in K. pneumoniae requires a
helper plasmid, pKD46 since it is likely that the RecBCD machinery would
affect the occurrence of allelic exchange. This is because this helper plasmid
harbours exo, beta, and gam which encode for the protein that facilitate the
occurrence of homologous recombination of the foreign DNA with
K. pneumoniae genome.
In addition, our findings have suggested that OmpK35 might possibly play a
role for transportation of tetracycline in strains Kpneu_1 and C3091, while
OmpK36 was shown to be involved in increased MIC of cefotaxime for
strain C3091ompK36. We have also demonstrated that both of these porins
do not affect the susceptibility of Kpneu_1 and C3091 to QACs such as CTAB
and CPC.
The biofilm formation assays in 96-well microtitre plates have shown that
OmpK35 and OmpK36 do not play a role in biofilm formation by Kpneu_1
upon cultivation in TSB and AUM in 96-well microtitre plates with the
exception of a slight increase in biofilm formation can be seen for
C3091∆ompK36 compared to C3091. Another clinically relevant biofilm

301 |
formation assays on silicone catheter pieces has also shown that OmpK35
and OmpK36 are not involved in the biofilm formation by Kpneu_1 and C3091
on catheter pieces upon growth in TSB and AUM, respectively.

302 |
Chapter 7.0
General discussion and
future directions
303 |
7.0 General discussion and future directions
7.1 General discussion
The rapid emergence of antibiotic resistant bacteria has become a serious
threat to global public health. It is estimated that by 2050, there will be almost
10 million individuals who will die due to antibiotic resistant bacterial infections
(O'Neill, 2016). K. pneumoniae is known as one of the most prevalent species
that causes antibiotic resistant nosocomial infections, and as reported by
O'Neill (2016), K. pneumoniae has been observed to increase in resistance
rapidly. Apart from the acquisition of antibiotic resistance genes, the
emergence of antibiotic resistant K. pneumoniae strains, that could resist
most of the antibiotics available in clinical settings, is probably due to the
capacity of this pathogen to form biofilms on medical devices, for example,
urinary catheters. This phenomenon is known as biofilm-mediated antibiotic
resistance (Vuotto, et al., 2014).
Despite the large amount of research on mechanisms of antibiotic resistance
by K. pneumoniae, very little information exists about the detailed mechanisms
of biofilm formation by this pathogen. Taking this challenge as our research
theme, this study aimed to investigate the mechanisms of biofilm formation by
K. pneumoniae as this information could aid the development of therapeutic
agents against K. pneumoniae infection, and subsequently could provide
further understanding on the contributing factors of biofilm-mediated antibiotic
resistance by K. pneumoniae. Five multidrug resistant clinical isolates and two
laboratory strains, which acted as biofilm producer controls, were used in this
study. The studies presented in this thesis mainly focused on: i) the effect of
304 |
exposure of sub-inhibitory concentrations of antibiotics on biofilm formation by
K. pneumoniae ii) the composition of biofilm EPS of K. pneumoniae upon
cultivation in two different media, TSB and AUM iii) the role of type 1 fimbriae
(T1F) in biofilm formation by K. pneumoniae, and iv) the role of OmpK35 and
OmpK36 in biofilm formation by K. pneumoniae.
The use of antibiotics (both appropriate and inappropriate) will expose bacteria
to low concentrations of antibiotics. This study was conducted as several
previous studies have shown that exposure of bacterial culture to sub-
inhibitory concentrations of antibiotics increased the biofilm formation by
clinically relevant pathogen, for example, P. aeruginosa. A study by Bagge, et
al. (2004) showed that exposure of P. aeruginosa biofilms to sub-inhibitory
concentrations of antibiotics, for example, 0.2 µg/ml of imipenem, increased
the biofilm formation by P. aeruginosa by upregulating the genes which encode
for alginate biosynthesis.
As previously discussed, the capacity to form biofilms by K. pneumoniae is
established as one of the causative factors contributing to the emergence of
antibiotics resistant K. pneumoniae strains. Thus, the aim of the study
reported in Chapter 3 was to investigate the effect of exposure to sub-MICs of
antibiotics, gentamicin and ciprofloxacin, on biofilm formation by
K. pneumoniae. We found that the biofilm formation by all the
K. pneumoniae strains used in this study was not affected by the sub-MICs of
commonly found antibiotics, gentamicin, and ciprofloxacin in clinical settings.
305 |
To our knowledge, we have provided for the first time data on the effect of
antibiotic exposure on biofilm formation by K. pneumoniae. These results have
ruled out the risk factors for the antibiotic-induced biofilm formation by
K. pneumoniae particularly on the multidrug resistant strains in clinical settings.
The findings are clinically relevant since K. pneumoniae is also amongst the
prevalent species that causes nosocomial infections, and the antibiotics used
in this study are amongst the most common antibiotics prescribed for infections
with this bacterium, particularly gentamicin and ciprofloxacin (Enzler, et al.,
2011; Hickerson, et al., 2006; Parkinson, et al., 2016).
In the Chapter 4, we investigated the composition of K. pneumoniae biofilm
EPS since it is not very well understood. Our findings show a positive effect
of proteinase K on biofilm formation by Kpneu_110. Biofilm of Kpneu_110
was found to increase upon treatment with 100 µg/ml of proteinase K in TSB.
Since Kpneu_110 has very distinct morphological characteristics compared
to the rest of the strains (see Figure 1-2), it would be worthwhile to investigate
this observation in the future as this kind of information may be very important
in identifying the contributing factors that could enhance the biofilm formation
by hypermucoviscous K. pneumoniae strains instead of disrupting their
biofilms. Further work is needed to determine if there is any link between the
increased biofilms formation of hypermucoviscous of K. pneumoniae strains
upon treatment with proteinase K.
306 |
We also report for the first time on the analysis of the orientation of fim-switch;
fimS, in multiple antibiotic resistant strain of K. pneumoniae upon cultivation in
two different media in Chapter 5. fimS is an invertible DNA element that
controls the expression of major subunit of type 1 fimbriae (T1F), fimA and
subsequently leads to the expression of T1F. We also showed four of the
strains used in this study had biofilm cells with fimS being in the ‘ON and OFF’
orientation (Kpneu_1, Kpneu_65, C3091, and CG43S3) and three strains
(Kpneu_63, Kpneu_64, and Kpneu_110) had biofilm cells with fimS being in
the ‘OFF’ orientation upon cultivation in TSB. All the strains, however, had
biofilm cells with fimS in the ‘OFF’ orientation upon cultivation in AUM. This
suggested that T1F could be involved in biofilm formation of four of the
examined K. pneumoniae strains used in this study upon cultivation in TSB,
however, the role of T1F in biofilm formation upon cultivation in AUM is still
unclear.
Our investigation on the gene sequences in T1F operon revealed multiple
SNPs that were specific for both of the ‘ON and OFF’ and ‘OFF’ groups.
Interestingly, one of the SNPs resulted in truncated FimK and it is conserved
in all strains which had the fimS being in the ‘OFF’ orientation. We
hypothesised that the truncated FimK could influence the orientation of fimS
since it was only present in strains where the fimS was always in the ‘OFF’
orientation, but further study is warranted to confirm this hypothesis. Upon
analysis of DNA sequences of genes in the T1F operon of all available
K. pneumoniae strains on GenBank (up until August 2016), it revealed out of
56 strains, 22 strains were shown to have this particular SNP that resulted in
a truncated FimK. Most of the strains were identified as clinical isolates from
307 |
different samples such as blood, urine, perirectal swabs and sputum.
However, not all of the genome sequences of clinical K. pneumoniae strains
used in this analysis were identified to have this particular SNP.
We then investigated other proteins that might be involved in biofilm formation
by K. pneumoniae, which were OmpK35 and OmpK36. In the final results
chapter (Chapter 6), defined isogenic mutants of strain Kpneu_1 and C3091,
were constructed by deleting ompK35, and ompK36 and replacing these
genes with spectinomycin resistance gene, aad9. We also tested the capacity
of ompK35 and ompK36 mutant strains to form biofilm in 96-well microtitre
plates and on catheter surfaces together with their wild type strains. Our study
suggested that OmpK35 contributes to increase resistance to tetracycline,
while OmpK36 plays a role in increased resistance to cefotaxime for strains
C3091∆ompK35 and C3091∆ompK36, respectively. This, however, could not
be confirmed since we do not have complemented strains. Due to the fact that
both of these antibiotics, tetracycline and cefotaxime, at sub-inhibitory
concentrations could induce biofilm formation by other Gram-negative bacteria
such as S. enterica ser. Infantis (Tezel, et al., 2016) and S. enterica ser.
Typhimurium (Majtan, et al. , 2008), we hypothesised that, by loss of OmpK35
or OmpK36, K. pneumoniae could possibly form more biofilm upon exposure
to the sub-inhibitory concentration of tetracycline and cefotaxime and this
particular phenomenon is quite difficult to manage. However, further study is
warranted to confirm this hypothesis.
308 |
OmpK35 and OmpK36 were shown to play no role in biofilm formation by
K. pneumoniae in our experimental model, apart from the slight increase of
biofilm formation in C3091∆ompK36 in comparison to control upon cultivation
in 96-well microtitre plates. Due to the fact that K. pneumoniae could adhere
and invade human bladder in pathogenesis of UTIs (Oelschlaeger, et al., 1997;
Sahly, et al. , 2008), it is worth investigating the role of OmpK35 and OmpK36
in mechanisms of adhesion and invasion of K. pneumoniae to human epithelial
cells such as T24 human bladder carcinoma cells.
To conclude, this study extends the current knowledge about mechanisms of
biofilm formation by K. pneumoniae. Exposure to sub-MICs of gentamicin, and
ciprofloxacin do not increase biofilm formation by
K. pneumoniae. We have shown that proteins might play a role in biofilm
formation by K. pneumoniae. Further investigation on the role of one of the
surface proteins, T1F, suggested that role of T1F in biofilm formation by
K. pneumoniae is still speculative, since it has a different role upon cultivation
in different environments. Our study also suggested that OmpK35 and
OmpK36 contributed to increased resistance to tetracycline and cefotaxime
but this needs to be confirmed with the complemented strains. In addition,
OmpK35 and OmpK36 do not play a role in biofilm formation by K. pneumoniae
upon cultivation on clinically relevant surfaces, on catheter surfaces.
It is hoped that this research, which expands the current knowledge and
understanding of mechanisms of biofilm formation by K. pneumoniae could
contribute to future development of effective treatments for biofilm-associated
infection caused by K. pneumoniae.
309 |
7.2 Future directions
Exposure to sub-inhibitory concentrations of gentamicin and ciprofloxacin was
shown to have no effect on biofilm formation by
K. pneumoniae. Since sub-inhibitory concentrations of antibiotics are
suggested to stimulate or repress a large number of gene expressions in target
bacteria at transcription level, (Goh, et al. , 2002), it is worth investigating the
effect of other antibiotics on biofilm formation by K. pneumoniae. This
investigation could possibly provide us more information on risk factors that
could contribute to the antibiotic-induced biofilm formation by K. pneumoniae.
Since the resistance of K. pneumoniae to antibiotics is established to arise
rapidly, and one of the known causes is the capacity to form biofilm by this
pathogen, these data would be very beneficial in highlighting the underlying
effect of the antibiotic exposure on biofilm formation by
K. pneumoniae. If we could identify the antibiotics that could induce biofilm
formation by K. pneumoniae, it is useful to test the clinical isolates from the
patients for biofilm inducibility against the antibiotics before a prescription of
antibiotics in order to control the antibiotic-induced biofilm formation by this
pathogen.
We also found that Kpneu_110 had a very low capacity to form biofilms in
AUM. Knowing this hypermucosviscous strain was isolated from UTI, this is
something worth further investigation. As hypermucoviscous K. pneumoniae
strains are normally associated with hypervirulence, it could be very beneficial
if we could obtain more information about the gene regulation in biofilm
formation by this hypermucosviscous strain (Shon, et al., 2013). Gene
310 |
expression study by comparing between planktonic cells and biofilms of
Kpneu_110 upon cultivation in AUM could be a very good stepping stone for
us to understand the differential gene expression of this particular strain in a
different growth state cultivated in a clinically relevant medium. In addition, it
is also worth comparing the differential gene expression of biofilm cells of
Kpneu_110 and biofilm cells of Kpneu_65 for example, since Kpneu_65 was
observed to form more biofilm in AUM compared to the rest of the strains. By
having this comparison, we could obtain an important information on what
genes are involved in biofilm formation by K. pneumoniae in nutrient-poor
medium. The study on differential gene expressions of biofilm cells upon
growth in clinically relevant medium is utmost important in order for us to
identify the drug targets that could be useful for future development for
treatment of the biofilm-associated infections caused by
K. pneumoniae particularly by hypermucoviscous strains.
Moreover, since biofilm formation of Kpneu_110 was found to be induced by
proteinase K, further investigation into this observation could also be
advantageous. The positive effect on biofilm formation by proteinase K could
provide us some interesting data regarding a putative self-secretion dispersion
enzyme produces by strain Kpneu_110 that could be useful in controlling the
biofilm formation by other bacterial. This putative enzyme might be further
developed to be used as a potential candidate agent to treat biofilm-associated
infections. One of the classic example of this kind of enzyme was previously
identified. Dispersin B, or DspB that produced by A. actinomycetemcomitans
is established to degrade the glycosidic bonds of β-1, 6-N-acetylglucosamine
or PNAG (Ramasubbu, et al., 2005).
311 |
In addition, the SNPs found upon analysis of the gene sequences in T1F
operon could also be further investigated. Particularly the effect of truncation
of FimK on the orientation of fimS in Kpneu_63, Kpneu_64, and Kpneu_110,
since FimK is suggested to play a role in the orientation of fimS. If we could
confirm the role of FimK in the orientation of fimS which controls the expression
of T1F in K. pneumoniae, it could provide us a better understanding on the
regulation of T1F and subsequently determine the role of T1F in biofilm cells
of K. pneumoniae. The exploration of this particular virulence factor could lead
us to a better way to counteract the biofilm-associated K. pneumoniae
infections by using T1F as a drug target.

312 |
Chapter 8.0
References
313 |
8.0 References
Abbott, S. L. (2007). Klebsiella, Enterobacter, Citrobacter, and Serratia. In P.
R. Murray (Ed.), Manual of Clinical Microbiology (9th ed.). Washington
DC: ASM Press.
Abdallah, H. M., Wintermans, B. B., Reuland, E. A., et al. (2015). Extended-
spectrum β-lactamase- and carbapenemase-producing
Enterobacteriaceae isolated from Egyptian patients with suspected
blood stream infection. PLOS ONE, 10(5), e0128120.
Ahmad, I., Rouf, S. F., Sun, L., et al. (2016). BcsZ inhibits biofilm phenotypes
and promotes virulence by blocking cellulose production in Salmonella
enterica serovar Typhimurium. Microbial Cell Factories, 15(1), 177.
Ahmed, N. A., Petersen, F. C., & Scheie, A. A. (2009). AI-2/LuxS is involved
in increased biofilm formation by Streptococcus intermedius in the
presence of antibiotics. Antimicrobial Agents and Chemotherapy,
53(10), 4258-4263.
Aka, S. T., & Haji, S. H. (2015). Sub-MIC of antibiotics induced biofilm
formation of Pseudomonas aeruginosa in the presence of
chlorhexidine. Brazilian Journal of Microbiology, 46(1), 149-154.
Albertí, S., Marques, G., Hernández-Allés, S., et al. (1996). Interaction
between complement subcomponent C1q and the Klebsiella
pneumoniae porin OmpK36. Infection and Immunity, 64(11), 4719-
4725.
Albertí, S., Rodríquez-Quiñones, F., Schirmer, T., et al. (1995). A porin from
Klebsiella pneumoniae: sequence homology, three-dimensional model,
and complement binding. Infection and Immunity, 63(3), 903-910.
314 |
Albiger, B., Glasner, C., Struelens, M. J., et al. (2015). Carbapenemase-
producing Enterobacteriaceae in Europe: assessment by national
experts from 38 countries, May 2015. Eurosurveillance, 20(45), 30062.
Alcántar-Curiel, M. D., Blackburn, D., Saldaña, Z., et al. (2013). Multi-
functional analysis of Klebsiella pneumoniae fimbrial types in
adherence and biofilm formation. Virulence, 4(2), 129-138.
Allen, B. L., Gerlach, G. F., & Clegg, S. (1991). Nucleotide sequence and
functions of mrk determinants necessary for expression of type 3
fimbriae in Klebsiella pneumoniae. Journal of Bacteriology, 173(2), 916-
920.
Allen, H. K., Donato, J., Wang, H. H., et al. (2010). Call of the wild: antibiotic
resistance genes in natural environments. Nature Reviews
Microbiology, 8(4), 251-259.
Almaghrabi, R., Clancy, C. J., Doi, Y., et al. (2014). Carbapenem-resistant
Klebsiella pneumoniae strains exhibit diversity in aminoglycoside-
modifying enzymes, which exert differing effects on plazomicin and
other agents. Antimicrobial Agents and Chemotherapy, 58(8), 4443-
4451.
Alonso, A., Sanchez, P., & Martinez, J. L. (2001). Environmental selection of
antibiotic resistance genes. Environmental Microbiology, 3(1), 1-9.
Altschul, S. F., Gish, W., Miller, W., Myers, E. W., & Lipman, D. J. (1990). Basic
local alignment search tool. Journal of Molecular Cell Biology, 215(3),
403-410.
Amako, K., Meno, Y., & Takade, A. (1988). Fine structures of the capsules of
Klebsiella pneumoniae and Escherichia coli K1. Journal of Bacteriology,
170(10), 4960-4962.
315 |
Amalaradjou, M. A. R., & Venkitanarayanan, K. (2011). Natural approaches
for controlling urinary tract infections. In P. Tenke (Ed.), Urinary Tract
Infections: InTech.
Amalaradjou, M. A. R., & Venkitanarayanan, K. (2013). Role of bacterial
biofilms in catheter-associated urinary tract infections (CAUTI) and
strategies for their control. In T. Nelius (Ed.), Recent Advances in the
Field of Urinary Tract Infections. Rijeka: InTech.
Ammor, M. S., Flórez, A. B., Van Hoek, A. H., et al. (2007). Molecular
characterization of intrinsic and acquired antibiotic resistance in lactic
acid bacteria and bifidobacteria. Journal of Molecular Microbiology &
Biotechnology, 14(1-3), 6-15.
Amundsen, S. K., Taylor, A. F., Reddy, M., & Smith, G. R. (2007). Intersubunit
signaling in RecBCD enzyme, a complex protein machine regulated by
Chi hot spots. Genes & Development, 21(24), 3296-3307.
Andersson, D. I., & Hughes, D. (2014). Microbiological effects of sublethal
levels of antibiotics. Nature Reviews Microbiology, 12(7), 465-478.
Arnold, R. S., Thom, K. A., Sharma, S., et al. (2011). Emergence of Klebsiella
pneumoniae carbapenemase (KPC)-producing bacteria. Southern
Medical Journal, 104(1), 40-45.
Athamna, A., Ofek, I., Keisari, Y., et al. (1991). Lectinophagocytosis of
encapsulated Klebsiella pneumoniae mediated by surface lectins of
guinea pig alveolar macrophages and human monocyte-derived
macrophages. Infection and Immunity, 59(5), 1673-1682.
Azeredo, J., Azevedo, N. F., Briandet, R., et al. (2017). Critical review on
biofilm methods. Critical Review in Microbiology, 43(3), 313-351.
316 |
Aziz, R. K., Bartels, D., Best, A. A., et al. (2008). The RAST Server: Rapid
Annotations using Subsystems Technology. BMC Genomics, 9(1), 75.
Bagge, N., Schuster, M., Hentzer, M., et al. (2004). Pseudomonas aeruginosa
biofilms exposed to imipenem exhibit changes in global gene
expression and β-lactamase and alginate production. Antimicrobial
Agents and Chemotherapy, 48(4), 1175-1187.
Bagley, S. T. (1985). Habitat association of Klebsiella species. Infection
Control & Hospital Epidemiology, 6(2), 52-58.
Bagley, S. T., Seidler, R. J., & Brenner, D. J. (1981). Klebsiella planticola sp.
nov.: A new species of Enterobacteriaceae found primarily in nonclinical
environments. Current Microbiology, 6(2), 105-109.
Balasubramaniam, D., Arockiasamy, A., Kumar, P. D., Sharma, A., &
Krishnaswamy, S. (2012). Asymmetric pore occupancy in crystal
structure of OmpF porin from Salmonella typhi. Journal of Structural
Biology, 178(3), 233-244.
Bales, P. M., Renke, E. M., May, S. L., Shen, Y., & Nelson, D. C. (2013).
Purification and characterization of biofilm-associated EPS
exopolysaccharides from ESKAPE organisms and other pathogens.
PLOS ONE, 8(6), e67950.
Balestrino, D., Ghigo, J. M., Charbonnel, N., Haagensen, J. A., & Forestier, C.
(2008). The characterization of functions involved in the establishment
and maturation of Klebsiella pneumoniae in vitro biofilm reveals dual
roles for surface exopolysaccharides. Environmental Microbiology,
10(3), 685-701.
Bandeira, M., Borges, V., Gomes, J. P., Duarte, A., & Jordao, L. (2017).
Insights on Klebsiella pneumoniae biofilms assembled on different
317 |
surfaces using phenotypic and genotypic approaches. Microorganisms,
5(2), 16.
Baquero, F., Martínez, J., & Cantón, R. (2008). Antibiotics and antibiotic
resistance in water environments. Current Opinion in Biotechnology,
19(3), 260-265.
Baquero, F., Negri, M. C., Morosini, M. I., & Blázquez, J. (1998). Antibiotic-
selective environments. Clinical Infectious Diseases, 27 (Supplement
1), S5-11.
Barnhart, M. M., & Chapman, M. R. (2006). Curli biogenesis and function.
Annual Review of Microbiology, 60, 131-147.
Barthelemy, M., Peduzzi, J., Ben Yaghlane, H., & Labia, R. (1988). Single
amino acid substitution between SHV-1 beta-lactamase and
cefotaxime-hydrolyzing SHV-2 enzyme. FEBS Letters, 231(1), 217-
220.
Bascomb, S., Lapage, S. P., Willcox, W. R., & Curtis, M. A. (1971). Numerical
classification of the tribe Klebsielleae. Microbiology, 66(3), 279-295.
Bauernfeind, A., Schweighart, S., & Grimm, H. (1990). A new plasmidic
cefotaximase in a clinical isolate of Escherichia coli. Infection, 18(5),
294-298.
Bauernfeind, A., Stemplinger, I., Jungwirth, R., & Giamarellou, H. (1996).
Characterization of the plasmidic beta-lactamase CMY-2, which is
responsible for cephamycin resistance. Antimicrobial Agents and
Chemotherapy, 40(1), 221-224.
318 |
Benenson, S., Navon-Venezia, S., Carmeli, Y., et al. (2009). Carbapenem-
resistant Klebsiella pneumoniae endocarditis in a young adult:
Successful treatment with gentamicin and colistin. International Journal
of Infectious Diseases, 13(5), e295-298.
Bennett, P. M. (2008). Plasmid encoded antibiotic resistance: acquisition and
transfer of antibiotic resistance genes in bacteria. British Journal of
Pharmacology, 153(Supplement 1), S347-357.
Berendonk, T. U., Manaia, C. M., Merlin, C., et al. (2015). Tackling antibiotic
resistance: the environmental framework. Nature Reviews
Microbiology, 13(5), 310-317.
Berman, H. M., Westbrook, J., Feng, Z., et al. (2000). The Protein Data Bank.
Nucleic Acids Research, 28(1), 235-242.
Berne, C., Ducret, A., Hardy, G. G., & Brun, Y. V. (2015). Adhesins involved in
attachment to abiotic surfaces by Gram-negative bacteria. Microbiology
Spectrum, 3(4).
Bhavnani, S. M., Ambrose, P. G., Craig, W. A., Dudley, M. N., & Jones, R. N.
(2006). Outcomes evaluation of patients with ESBL- and non–ESBL-
producing Escherichia coli and Klebsiella species as defined by CLSI
reference methods: Report from the SENTRY Antimicrobial
Surveillance Program. Diagnostic Microbiology and Infectious Disease,
54(3), 231-236.
Biasini, M., Bienert, S., Waterhouse, A., et al. (2014). SWISS-MODEL:
modelling protein tertiary and quaternary structure using evolutionary
information. Nucleic Acids Research, 42(W1), W252-W258.
Bisognano, C., Vaudaux, P. E., Lew, D. P., Ng, E. Y., & Hooper, D. C. (1997).
Increased expression of fibronectin-binding proteins by
319 |
fluoroquinolone-resistant Staphylococcus aureus exposed to
subinhibitory levels of ciprofloxacin. Antimicrobial Agents and
Chemotherapy, 41(5), 906-913.
Blair, J. M., Webber, M. A., Baylay, A. J., Ogbolu, D. O., & Piddock, L. J.
(2015). Molecular mechanisms of antibiotic resistance. Nature Reviews
Microbiology, 13(1), 42-51.
Blickwede, M., Valentin-Weigand, P., & Schwarz, S. (2004). Subinhibitory
concentrations of florfenicol enhance the adherence of florfenicol-
susceptible and florfenicol-resistant Staphylococcus aureus. Journal of
Antimicrobial Chemotherapy, 54(1), 286-288.
Boddicker, J. D., Anderson, R. A., Jagnow, J., & Clegg, S. (2006). Signature-
tagged mutagenesis of Klebsiella pneumoniae to identify genes that
influence biofilm formation on extracellular matrix material. Infection
and Immunity, 74(8), 4590-4597.
Boehm, A., Steiner, S., Zaehringer, F., et al. (2009). Second messenger
signalling governs Escherichia coli biofilm induction upon ribosomal
stress. Molecular Microbiology, 72(6), 1500-1516.
Botelho-Nevers, E., Gouriet, F., Lepidi, H., et al. (2007). Chronic nasal
infection caused by Klebsiella rhinoscleromatis or Klebsiella ozaenae:
two forgotten infectious diseases. International Journal of Infectious
Diseases, 11(5), 423-429.
Bratu, S., Landman, D., Haag, R., & et al. (2005). Rapid spread of
carbapenem-resistant Klebsiella pneumoniae in New York City: a new
threat to our antibiotic armamentarium. Archives of Internal Medicine,
165(12), 1430-1435.
320 |
Bratu, S., Tolaney, P., Karumudi, U., et al. (2005). Carbapenemase-producing
Klebsiella pneumoniae in Brooklyn, NY: Molecular epidemiology and in
vitro activity of polymyxin B and other agents. Journal of Antimicrobial
Chemotherapy, 56(1), 128-132.
Bren, A., Park, J. O., Towbin, B. D., et al. (2016). Glucose becomes one of the
worst carbon sources for E.coli on poor nitrogen sources due to
suboptimal levels of cAMP. Scientific Reports, 6, 24834.
Brisse, S., Fevre, C., Passet, V., et al. (2009). Virulent clones of Klebsiella
pneumoniae: Identification and evolutionary scenario based on
genomic and phenotypic characterization. PLOS ONE, 4(3), e4982.
Brisse, S., Grimont, F., & Grimont, P. A. D. (2006). The Genus Klebsiella. In
M. Dworkin, S. Falkow, E. Rosenberg, K.-H. Schleifer & E.
Stackebrandt (Eds.), The Prokaryotes: Volume 6: Proteobacteria:
Gamma Subclass (pp. 159-196). New York, NY: Springer New York.
Brisse, S., Passet, V., Haugaard, A. B., et al. (2013). wzi gene sequencing, a
rapid method for determination of capsular type for Klebsiella strains.
Journal of Clinical Microbiology, 51(12), 4073-4078.
Brooks, T., & Keevil, C. W. (1997). A simple artificial urine for the growth of
urinary pathogens. Letters in Applied Micobiology, 24(3), 203-206.
Brown, C., & Seidler, R. J. (1973). Potential pathogens in the environment:
Klebsiella pneumoniae, a taxonomic and ecological enigma. Applied
Microbiology, 25(6), 900-904.
Buchanan, S. K., Smith, B. S., Venkatramani, L., et al. (1999). Crystal structure
of the outer membrane active transporter FepA from Escherichia coli.
Nature Structural & Molecular Biology, 6(1), 56-63.
321 |
Buckley, J., Coffin, S. E., Lautenbach, E., et al. (2007). Outcome of
Escherichia coli and/or Klebsiella bloodstream infection in children with
central venous catheters. Infection Control & Hospital Epidemiology,
28(11), 1308-1310.
Busch, A., & Waksman, G. (2012). Chaperone–usher pathways: diversity and
pilus assembly mechanism. Philosophical Transactions of the Royal
Society B: Biological Sciences, 367(1592), 1112-1122.
Bush, K., & Jacoby, G. A. (2010). Updated functional classification of β-
lactamases. Antimicrobial Agents and Chemotherapy, 54(3), 969-976.
Bush, K., Jacoby, G. A., & Medeiros, A. A. (1995). A functional classification
scheme for beta-lactamases and its correlation with molecular
structure. Antimicrobial Agents and Chemotherapy, 39(6), 1211-1233.
Cabeen, M. T., & Jacobs-Wagner, C. (2005). Bacterial cell shape. Nature
Reviews Microbiology, 3(8), 601-610.
Cabello, F. C. (2006). Heavy use of prophylactic antibiotics in aquaculture: a
growing problem for human and animal health and for the environment.
Environmental Microbiology, 8(7), 1137-1144.
Carter, J. S., Bowden, F. J., Bastian, I., et al. (1999). Phylogenetic evidence
for reclassification of Calymmatobacterium granulomatis as Klebsiella
granulomatis comb. nov. International Journal of Systematic
Bacteriology, 49 (Pt 4), 1695-1700.
Carugo, O., & Pongor, S. (2001). A normalized root-mean-square distance for
comparing protein three-dimensional structures. Protein Science, 10(7),
1470-1473.
322 |
Ceri, H., Olson, M. E., Stremick, C., et al. (1999). The Calgary biofilm device:
New technology for rapid determination of antibiotic susceptibilities of
bacterial biofilms. Journal of Clinical Microbiology, 37(6), 1771-1776.
Chaignon, P., Sadovskaya, I., Ragunah, C., et al. (2007). Susceptibility of
Staphylococcal biofilms to enzymatic treatments depends on their
chemical composition. Applied Microbiology and Biotechnology, 75(1),
125-132.
Chen, C., Wei, D., Liu, P., et al. (2016). Inhibition of RecBCD in Klebsiella
pneumoniae by Gam and its effect on the efficiency of gene
replacement. Journal of Basic Microbiology, 56(2), 120-126.
Chen, D., & van de Ven, T. G. (2016). Morphological changes of sterically
stabilized nanocrystalline cellulose after periodate oxidation. Cellulose,
23(2), 1051-1059.
Chen, F. J., Chan, C. H., Huang, Y. J., et al. (2011). Structural and mechanical
properties of Klebsiella pneumoniae type 3 fimbriae. Journal of
Bacteriology, 193(7), 1718-1725.
Chen, J. H., Siu, L. K., Fung, C. P., et al. (2010). Contribution of outer
membrane protein K36 to antimicrobial resistance and virulence in
Klebsiella pneumoniae. Antimicrobial Agents and Chemotherapy,
65(5), 986-990.
Chen, K. M., Chiang, M. K., Wang, M., et al. (2014). The role of pgaC in
Klebsiella pneumoniae virulence and biofilm formation. Microbial
Pathogenesis, 77, 89-99.
Chen, L., Todd, R., Kiehlbauch, J., Walters, M., & Kallen, A. (2017). Notes from
the field: pan-resistant New Delhi metallo-beta-lactamase-producing
323 |
Klebsiella pneumoniae — Washoe County, Nevada, 2016. Morbidity
and Mortality Weekly Report 2017, 66(33).
Chothia, C., & Lesk, A. M. (1986). The relation between the divergence of
sequence and structure in proteins. EMBO Journal, 5(4), 823-826.
Clegg, S., & Murphy, C. N. (2016). Epidemiology and virulence of Klebsiella
pneumoniae. Microbiology Spectrum, 4(1).
Clements, A., Gaboriaud, F., Duval, J. F., et al. (2008). The major surface-
associated saccharides of Klebsiella pneumoniae contribute to host cell
association. PLOS ONE, 3(11), e3817.
CLSI. (2013). Clinical and Laboratory Standards Institute (CLSI)-Performance
standards for antimicrobial susceptibility testing. Clinical and Laboratory
Standards Institute, 33(1).
Collins, C. M., & D'Orazio, S. F. D. (1996). Virulence determinants of
uropathogenic Klebsiella pneumoniae In H. L. Mobley & J. W. Warren
(Eds.), Urinary Tract Infections; Molecular Pathogenesis and Clinical
Management (pp. 299-312). Washington D. C.: American Society for
Microbiology Press.
Combet, C., Blanchet, C., Geourjon, C., & Deléage, G. (2000). NPS@:
Network protein sequence analysis. Trends in Biochemical Science,
25(3), 147-150.
Connell, S. R., Tracz, D. M., Nierhaus, K. H., & Taylor, D. E. (2003). Ribosomal
protection proteins and their mechanism of tetracycline resistance.
Antimicrobial Agents and Chemotherapy, 47(12), 3675-3681.
324 |
Craig, W. A. (1998). Pharmacokinetic/pharmacodynamic parameters:
rationale for antibacterial dosing of mice and men. Clinical Infectious
Diseases, 26(1), 1-10.
Crawford, R. W., Reeve, K. E., & Gunn, J. S. (2010). Flagellated but not
hyperfimbriated Salmonella enterica serovar Typhimurium attaches to
and forms biofilms on cholesterol-coated surfaces. Journal of
Bacteriology, 192(12), 2981-2990.
Da Re, S., & Ghigo, J. M. (2006). A CsgD-independent pathway for cellulose
production and biofilm formation in Escherichia coli. Journal of
Bacteriology, 188(8), 3073-3087.
Danelon, C., & Winterhalter, M. (2004). Reconstitution of general diffusion
pores from bacterial outer membranes. In R. Benz (Ed.), Bacterial and
Eukaryotic Porins; Structure, Function, Mechanism (pp. 99-117).
Germany: Wiley-VCH Verlag GmbH & Co.
Danziger, L. H., & Neuhauser, M. (2011). Beta-Lactam Antibiotics. In S. C.
Piscitelli, K. A. Rodvold & M. P. Pai (Eds.), Drug Interactions in
Infectious Diseases (pp. 203-242). Totowa, NJ: Humana Press.
Das, T., Sehar, S., & Manefield, M. (2013). The roles of extracellular DNA in
the structural integrity of extracellular polymeric substance and bacterial
biofilm development. Environmental Microbiology Reports, 5(6), 778-
786.
Datsenko, K. A., & Wanner, B. L. (2000). One-step inactivation of
chromosomal genes in Escherichia coli K-12 using PCR products.
Proceedings of the National Academy of Sciences, 97(12), 6640-6645.
Datta, N., & Kontomichalou, P. (1965). Penicillinase synthesis controlled by
infectious R factors in Enterobacteriaceae. Nature, 208(5007), 239-241.
325 |
Davies, D. (2003). Understanding biofilm resistance to antibacterial agents.
Nature Reviews Drug Discovery, 2(2), 114-122.
de Sanctis, J., Teixeira, L., van Duin, D., et al. (2014). Complex prosthetic joint
infections due to carbapenemase-producing Klebsiella pneumoniae: a
unique challenge in the era of untreatable infections. International
Journal of Infectious Diseases, 25, 73-78.
Delcour, A. H. (2003). Solute uptake through general porins. Frontiers in
Bioscience: A journal and Virtual Library, 8, 1055-1071.
Delcour, A. H. (2009). Outer membrane permeability and antibiotic resistance.
Biochima et Biophysica Acta (BBA) - Proteins and Proteomics, 1794(5),
808-816.
Denyer, S. P., & Stewart, G. S. A. B. (1998). Mechanisms of action of
disinfectants. International Biodeterioration & Biodegradation, 41(3),
261-268.
Deris, Z. Z., Heidi, H. Y., Davis, K., et al. (2012). The combination of colistin
and doripenem is synergistic against Klebsiella pneumoniae at multiple
inocula and suppresses colistin resistance in an in vitro
pharmacokinetic/pharmacodynamic model. Antimicrobial Agents and
Chemotherapy, 56(10), 5103-5112.
Di Martino, P., Bertin, Y., Girardeau, J. P., et al. (1995). Molecular
characterization and adhesive properties of CF29K, an adhesin of
Klebsiella pneumoniae strains involved in nosocomial infections.
Infection and Immunity, 63(11), 4336-4344.
Di Martino, P., Livrelli, V., Sirot, D., Joly, B., & Darfeuille-Michaud, A. (1996).
A new fimbrial antigen harbored by CAZ-5/SHV-4-producing Klebsiella
326 |
pneumoniae strains involved in nosocomial infections. Infection and
Immunity, 64(6), 2266-2273.
Dillingham, M. S., & Kowalczykowski, S. C. (2008). RecBCD enzyme and the
repair of double-stranded DNA breaks. Microbiology & Molecular
Biology Reviews, 72(4), 642-671.
Doménech-Sánchez, A., Hernández-Allés, S., Martínez-Martínez, L., Benedí,
V. J., & Albertí, S. (1999). Identification and characterization of a new
porin gene of Klebsiella pneumoniae: its role in beta-lactam antibiotic
resistance. Journal of Bacteriology, 181(9), 2726-2732.
Doménech-Sánchez, A., Martínez-Martínez, L., Hernández-Allés, S., et al.
(2003). Role of Klebsiella pneumoniae OmpK35 porin in antimicrobial
resistance. Antimicrobial Agents and Chemotherapy, 47(10), 3332-
3335.
Domenico, P., Tomas, J. M., Merino, S., Rubires, X., & Cunha, B. A. (1999).
Surface antigen exposure by bismuth dimercaprol suppression of
Klebsiella pneumoniae capsular polysaccharide. Infection and
Immunity, 67(2), 664-669.
Doorduijn, D. J., Rooijakkers, S. H., van Schaik, W., & Bardoel, B. W. (2016).
Complement resistance mechanisms of Klebsiella pneumoniae.
Immunobiology, 221(10), 1102-1109.
Dorman, C. J., & Corcoran, C. P. (2009). Bacterial DNA topology and
infectious disease. Nucleic Acids Research, 37(3), 672-678.
Dou, W., Thompson-Jaeger, S., Laulederkind, S. J., et al. (2005). Defective
expression of Tamm-Horsfall protein/uromodulin in COX-2-deficient
mice increases their susceptibility to urinary tract infections. American
Journal of Physiology: Renal Physiology, 289(1), F49-60.
327 |
Ducel, G., Fabry, J., & Nicolle, L. (2002). Prevention of hospital acquired
infections: a practical guide. Geneva: World Health Organization.
Dueholm, M. S., Sondergaard, M. T., Nilsson, M., et al. (2013). Expression of
Fap amyloids in Pseudomonas aeruginosa, P. fluorescens, and P.
putida results in aggregation and increased biofilm formation.
Microbiology Open, 2(3), 365-382.
Duguid, J. P. (1959). Fimbriae and adhesive properties in Klebsiella strains
Journal of General Microbiology, 21(1), 271-286.
Dulek, D. E., Newcomb, D. C., Goleniewska, K., et al. (2014). Allergic airway
inflammation decreases lung bacterial burden following acute Klebsiella
pneumoniae infection in a neutrophil- and CCL8-dependent manner.
Infection and Immunity, 82(9), 3723-3739.
Dutzler, R., Rummel, G., Albertí, S., et al. (1999). Crystal structure and
functional characterization of OmpK36, the osmoporin of Klebsiella
pneumoniae. Structure, 7(4), 425-434.
ECDC. (2017). Annual Report of the European Antimicrobial Resistance
Surveillance Network (EARS-Net)- Surveillance of Antimicrobial
Resistance in Europe 2016. Retrieved from Stockholm:
https://ecdc.europa.eu/en/publications-data/antimicrobial-resistance-
surveillance-europe-2016
Enzler, M. J., Berbari, E., & Osmon, D. R. (2011). Antimicrobial prophylaxis in
adults. Mayo Clinic Proceedings, 86(7), 686-701.
EUCAST. (2014). Breakpoint tables for interpretation of MICs and zone
diameters. EUCAST: Clinical breakpoints. Version 4. Retrieved from
http://www.eucast.org
328 |
Fabrega, A., Madurga, S., Giralt, E., & Vila, J. (2009). Mechanism of action of
and resistance to quinolones. Microbial Biotechnology, 2(1), 40-61.
Fane, M. E. L., Dollo, I., Sodqi, M., et al. (2005). Septicaemia caused by
community acquired Klebsiella pneumonia complicated with
endocarditis and meningoencephalitis: A case report. Journal of
Cardiovascular Diseases & Diagnosis, 4(3).
Fang, C. T., Shih, Y. J., Cheong, C. M., & Yi, W. C. (2016). Rapid and accurate
determination of lipopolysaccharide O-antigen types in Klebsiella
pneumoniae with a novel PCR-based O-genotyping method. Journal of
Clinical Microbiology, 54(3), 666-675.
Fang, X., Ahmad, I., Blanka, A., et al. (2014). GIL, a new c-di-GMP-binding
protein domain involved in regulation of cellulose synthesis in
Enterobacteria. Molecular Microbiology, 93(3), 439-452.
Feldman, M. B., Terry, D. S., Altman, R. B., & Blanchard, S. C. (2010).
Aminoglycoside activity observed on single pre-translocation ribosome
complexes. Nature Chemical Biology, 6(1), 54-62.
Feneley, R. C., Hopley, I. B., & Wells, P. N. T. (2015). Urinary catheters:
history, current status, adverse events and research agenda. Journal of
Medical Engineering & Technology, 39(8), 459-470.
Feng, X., Oropeza, R., Walthers, D., & Kenney, L. J. (2003). OmpR
phosphorylation and its role in signaling and pathogenesis. ASM News
American Society for Microbiology, 69(8), 390-395.
Feng, Y., Johnston, R. N., Liu, G. R., & Liu, S. L. (2013). Genomic comparison
between Salmonella Gallinarum and Pullorum: Differential pseudogene
formation under common host restriction. PLOS ONE, 8(3), e59427.
329 |
Fernández, L., & Hancock, R. E. (2012). Adaptive and mutational resistance:
role of porins and efflux pumps in drug resistance. Clinical Microbiology
Reviews, 25(4), 661-681.
Ferrieres, L., Hancock, V., & Klemm, P. (2007). Biofilm exclusion of
uropathogenic bacteria by selected asymptomatic bacteriuria
Escherichia coli strains. Microbiology, 153(6), 1711-1719.
Fiser, A. (2010). Template-based protein structure modeling. Methods in
Molecular Biology, 673, 73-94.
Flemming, H. C. (2011). The perfect slime. Colloids and Surfaces B:
Biointerfaces, 86(2), 251-259.
Flemming, H. C., & Wingender, J. (2010). The biofilm matrix. Nature Reviews
Microbiology, 8(9), 623-633.
Flores-Mireles, A. L., Walker, J. N., Caparon, M., & Hultgren, S. J. (2015).
Urinary tract infections: epidemiology, mechanisms of infection and
treatment options. Nature Reviews Microbiology, 13(5), 269-284.
Fong, J. N., & Yildiz, F. H. (2015). Biofilm matrix proteins. Microbiology
Spectrum, 3(2).
Foster, P. L. (2007). Stress-induced mutagenesis in bacteria. Critical Reviews
in Biochemistry and Molecular Biology, 42(5), 373-397.
Fournet-Fayard, S., Joly, B., & Forestier, C. (1995). Transformation of wild type
Klebsiella pneumoniae with plasmid DNA by electroporation. Journal of
Microbiological Methods, 24(1), 49-54.
330 |
Foxman, B. (2010). The epidemiology of urinary tract infection. Nature
Reviews Urology, 7(12), 653-660.
French, G. L., Shannon, K. P., & Simmons, N. (1996). Hospital outbreak of
Klebsiella pneumoniae resistant to broad-spectrum cephalosporins and
beta-lactam-beta-lactamase inhibitor combinations by hyperproduction
of SHV-5 beta-lactamase. Journal of Clinical Microbiology, 34(2), 358-
363.
Fung, C.-P., Lin, Y.-T., Lin, J.-C., et al. (2012). Klebsiella pneumoniae in
gastrointestinal tract and pyogenic liver abscess. Emerging Infectious
Diseases, 18(8), 1322-1325.
Galdiero, E., Kampanaraki, A., Mignogna, E., & Galdiero, M. (2008). Porins in
the inflammatory and immunological response following Salmonella
infections. In Y. Kumar (Ed.), Salmonella- A Diversified Superbug.
Rijeka, Croatia: InTech Open Access Publisher.
Galimand, M., Courvalin, P., & Lambert, T. (2003). Plasmid-mediated high-
level resistance to aminoglycosides in Enterobacteriaceae due to 16S
rRNA methylation. Antimicrobial Agents and Chemotherapy, 47(8),
2565-2571.
García-Sureda, L., Doménech-Sánchez, A., Barbier, M., et al. (2011).
OmpK26, a novel porin associated with carbapenem resistance in
Klebsiella pneumoniae. Antimicrobial Agents and Chemotherapy,
55(10), 4742-4747.
Geisinger, E., & Isberg, R. R. (2015). Antibiotic modulation of capsular
exopolysaccharide and virulence in Acinetobacter baumannii. PLOS
Pathogens, 11(2), e1004691.
331 |
Gerba, C. P. (2015). Quaternary ammonium biocides: efficacy in application.
Applied and Environmental Microbiology, 81(2), 464-469.
Gerlach, G. F., Allen, B. L., & Clegg, S. (1988). Molecular characterization of
the type 3 (MR/K) fimbriae of Klebsiella pneumoniae. Journal of
Bacteriology, 170(8), 3547-3553.
Gilan, I., & Sivan, A. (2013). Effect of proteases on biofilm formation of the
plastic-degrading actinomycete Rhodococcus ruber C208. FEMS
Microbiology Letters, 342(1), 18-23.
Goh, E.-B., Yim, G., Tsui, W., et al. (2002). Transcriptional modulation of
bacterial gene expression by subinhibitory concentrations of antibiotics.
Proceedings of the National Academy of Sciences, 99(26), 17025-
17030.
Gonzalez-Escobedo, G., Marshall, J. M., & Gunn, J. S. (2011). Chronic and
acute infection of the gall bladder by Salmonella typhi: understanding
the carrier state. Nature Reviews Microbiology, 9(1), 9-14.
Goodman, S. D., Obergfell, K. P., Jurcisek, J. A., et al. (2011). Biofilms can be
dispersed by focusing the immune system on a common family of
bacterial nucleoid-associated proteins. Mucosal Immunology, 4(6), 625-
637.
Haeggman, S., Lofdahl, S., & Burman, L. G. (1997). An allelic variant of the
chromosomal gene for class A beta-lactamase K2, specific for
Klebsiella pneumoniae, is the ancestor of SHV-1. Antimicrobial Agents
and Chemotherapy, 41(12), 2705-2709.
Hall, B. G., Acar, H., Nandipati, A., & Barlow, M. (2014). Growth rates made
easy. Molecular Biology and Evolution, 31(1), 232-238.
332 |
Hall, T. A. (1999). BioEdit: a user-friendly biological sequence alignment editor
and analysis program for Windows 95/98/NT. Paper presented at the
Nucleic Acids Symposium Series.
Hardesty, C., Ferran, C., & DiRienzo, J. M. (1991). Plasmid-mediated sucrose
metabolism in Escherichia coli: characterization of scrY, the structural
gene for a phosphoenolpyruvate-dependent sucrose
phosphotransferase system outer membrane porin. Journal of
Bacteriology, 173(2), 449-456.
Harmsen, M., Lappann, M., Knøchel, S., & Molin, S. (2010). Role of
extracellular DNA during biofilm formation by Listeria monocytogenes.
Applied and Environmental Microbiology, 76(7), 2271-2279.
Hashemi, A., Fallah, F., Erfanimanesh, S., et al. (2014). Detection of β-
lactamases and outer membrane porins among Klebsiella pneumoniae
strains isolated in Iran. Scientifica, 2014, 6.
Hasman, H., Chakraborty, T., & Klemm, P. (1999). Antigen-43-mediated
autoaggregation of Escherichia coli is blocked by fimbriation. Journal of
Bacteriology, 181(16), 4834-4841.
Hennequin, C., & Forestier, C. (2009). oxyR, a LysR-type regulator involved in
Klebsiella pneumoniae mucosal and abiotic colonization. Infection and
Immunity, 77(12), 5449-5457.
Hernández-Allés, S., Albertí, S., Álvarez, D., et al. (1999). Porin expression in
clinical isolates of Klebsiella pneumoniae. Microbiology, 145(3), 673-
679.
Hernández-Allés, S., Conejo, M., Pascual, A., et al. (2000). Relationship
between outer membrane alterations and susceptibility to antimicrobial
333 |
agents in isogenic strains of Klebsiella pneumoniae. Journal of
Antimicrobial Chemotherapy, 46(2), 273-277.
Hickerson, A. D., & Carson, C. C. (2006). The treatment of urinary tract
infections and use of ciprofloxacin extended release. Expert Opinion on
Investigational Drugs, 15(5), 519-532.
Hickman, J. W., Tifrea, D. F., & Harwood, C. S. (2005). A chemosensory
system that regulates biofilm formation through modulation of cyclic
diguanylate levels. Proceedings of the National Academy of Sciences,
102(40), 14422-14427.
Hidron, A. I., Edwards, J. R., Patel, J., et al. (2008). NHSN annual update:
antimicrobial-resistant pathogens associated with healthcare-
associated infections: annual summary of data reported to the National
Healthcare Safety Network at the Centers for Disease Control and
Prevention, 2006-2007. Infection Control and Hospital Epidemiology,
29(11), 996-1011.
Hirsch, E. B., & Tam, V. H. (2010). Detection and treatment options for
Klebsiella pneumoniae carbapenemases (KPCs): an emerging cause
of multidrug-resistant infection. Journal of Antimicrobial Chemotherapy,
65(6), 1119-1125.
Hobley, L., Harkins, C., MacPhee, C. E., & Stanley-Wall, N. R. (2015). Giving
structure to the biofilm matrix: an overview of individual strategies and
emerging common themes. FEMS Microbiology Reviews, 39(5), 649-
669.
Hocquet, D., Vogne, C., El Garch, F., et al. (2003). MexXY-OprM efflux pump
is necessary for a adaptive resistance of Pseudomonas aeruginosa to
aminoglycosides. Antimicrobial Agents and Chemotherapy, 47(4),
1371-1375.
334 |
Hoffman, L. R., D'Argenio, D. A., MacCoss, M. J., et al. (2005). Aminoglycoside
antibiotics induce bacterial biofilm formation. Nature, 436(7054), 1171-
1175.
Holden, V. I., Breen, P., Houle, S., Dozois, C. M., & Bachman, M. A. (2016).
Klebsiella pneumoniae siderophores induce inflammation, bacterial
dissemination, and HIF-1α stabilization during pneumonia. mBIO, 7(5),
e01397-01316.
Hopkins, S., Shaw, K., & Simpson, L. (2012). English National Point
Prevalence Survey on Healthcare Associated Infections and
Antimicrobial Use, 2011: Preliminary data. Retrieved from
http://www.hpa.org.uk/webc/HPAwebFile/HPAwebC/1317134305239.
Hsueh, P.-R., Badal, R. E., Hawser, S. P., et al. Epidemiology and
antimicrobial susceptibility profiles of aerobic and facultative Gram-
negative bacilli isolated from patients with intra-abdominal infections in
the Asia-Pacific region: 2008 results from SMART (Study for Monitoring
Antimicrobial Resistance Trends). International Journal of Antimicrobial
Agents, 36(5), 408-414.
Huang, T.-W., Lam, I., Chang, H.-Y., et al. (2014). Capsule deletion via a λ-
Red knockout system perturbs biofilm formation and fimbriae
expression in Klebsiella pneumoniae MGH 78578. BMC Research
Notes, 7, 13-13.
Huertas, M. G., Zarate, L., Acosta, I. C., et al. (2014). Klebsiella pneumoniae
yfiRNB operon affects biofilm formation, polysaccharide production and
drug susceptibility. Microbiology, 160(12), 2595-2606.
Humeniuk, C., Arlet, G., Gautier, V., et al. (2002). Beta-lactamases of Kluyvera
ascorbata, probable progenitors of some plasmid-encoded CTX-M
types. Antimicrobial Agents and Chemotherapy, 46(9), 3045-3049.
335 |
Humphries, R. M., Kelesidis, T., Bard, J. D., et al. (2010). Successful treatment
of pan-resistant Klebsiella pneumoniae pneumonia and bacteraemia
with a combination of high-dose tigecycline and colistin. Journal of
Medical Microbiology, 59(11), 1383-1386.
Ipe, D. S., Horton, E., & Ulett, G. C. (2016). The basics of bacteriuria:
Strategies of microbes for persistence in urine. Frontiers in Cellular and
Infection Microbiology, 6, 14.
Izard, D., Ferragut, C., Gavini, F., et al. (1981). Klebsiella terrigena, a new
species from soil and water International Journal of Systematic
Bacteriology, 31(2), 116-127.
Jacoby, G. A., Chow, N., & Waites, K. B. (2003). Prevalence of plasmid-
mediated quinolone resistance. Antimicrobial Agents and
Chemotherapy, 47(2), 559-562.
Jacoby, G. A., Mills, D. M., & Chow, N. (2004). Role of β-lactamases and
porins in resistance to ertapenem and other β-lactams in Klebsiella
pneumoniae. Antimicrobial Agents and Chemotherapy, 48(8), 3203-
3206.
Jagnow, J., & Clegg, S. (2003). Klebsiella pneumoniae MrkD-mediated biofilm
formation on extracellular matrix- and collagen-coated surfaces.
Microbiology, 149(9), 2397-2405.
Jahn, C. E., Selimi, D. A., Barak, J. D., & Charkowski, A. O. (2011). The
Dickeya dadantii biofilm matrix consists of cellulose nanofibres, and is
an emergent property dependent upon the type III secretion system and
the cellulose synthesis operon. Microbiology, 157(10), 2733-2744.
336 |
Jiang, X., Espedido, B. A., Partridge, S. R., et al. (2009). Paradoxical effect of
Klebsiella pneumoniae OmpK36 porin deficiency. Pathology, 41(4),
388-392.
Johnson, J. G., Murphy, C. N., Sippy, J., Johnson, T. J., & Clegg, S. (2011).
Type 3 fimbriae and biofilm formation are regulated by the
transcriptional regulators MrkHI in Klebsiella pneumoniae. Journal of
Bacteriology, 193(14), 3453-3460.
Johnson, J. G., Spurbeck, R. R., Sandhu, S. K., & Matson, J. S. (2014).
Genome sequence of Klebsiella pneumoniae urinary tract isolate
Top52. Genome Announcements, 2(4), e00668-00614.
Jones, K. L., Kim, S. W., & Keasling, J. D. (2000). Low-copy plasmids can
perform as well as or better than high-copy plasmids for metabolic
engineering of bacteria. Metabolic Engineering, 2(4), 328-338.
Jones, M. E., Sahm, D. F., Martin, N., et al. (2000). Prevalence of gyrA, gyrB,
parC, and parE mutations in clinical isolates of Streptococcus
pneumoniae with decreased susceptibilities to different
fluoroquinolones and originating from Worldwide Surveillance Studies
during the 1997-1998 respiratory season. Antimicrobial Agents and
Chemotherapy, 44(2), 462-466.
Jorgensen, I., & Seed, P. C. (2012). How to make it in the urinary tract: A
tutorial by Escherichia coli. PLOS Pathogens, 8(10), e1002907.
Kabsch, W., & Sander, C. (1983). Dictionary of protein secondary structure:
pattern recognition of hydrogen-bonded and geometrical features.
Biopolymers, 22(12), 2577-2637.
Kaczmarek, F. M., Dib-Hajj, F., Shang, W., & Gootz, T. D. (2006). High-level
carbapenem resistance in a Klebsiella pneumoniae clinical isolate is
337 |
due to the combination of blaACT-1 β-lactamase production, porin
OmpK35/36 insertional inactivation, and down-regulation of the
phosphate transport porin PhoE. Antimicrobial Agents and
Chemotherapy, 50(10), 3396-3406.
Kaplan, J. B. (2011). Antibiotic-induced biofilm formation. The International
Journal of Artificial Organs, 34(9), 737-751.
Kaplan, J. B., Ragunath, C., Ramasubbu, N., & Fine, D. H. (2003). Detachment
of Actinobacillus actinomycetemcomitans biofilm cells by an
endogenous β-hexosaminidase activity. Journal of Bacteriology,
185(16), 4693-4698.
Karim, A., Poirel, L., Nagarajan, S., & Nordmann, P. (2001). Plasmid-mediated
extended-spectrum beta-lactamase (CTX-M-3 like) from India and gene
association with insertion sequence ISEcp1. FEMS Microbiology
Letters, 201(2), 237-241.
Kato, J., Nishimura, Y., Imamura, R., et al. (1990). New topoisomerase
essential for chromosome segregation in E. coli. Cell, 63(2), 393-404.
Khandige, S., & Møller-Jensen, J. (2016). Fimbrial phase variation: stochastic
or cooperative? Current Genetics, 62(2), 237-241.
Kishi, K., Yasuda, T., & Takeshita, H. (2001). DNase I: structure, function, and
use in medicine and forensic science. Legal Medicine, 3(2), 69-83.
Klebba, P. E. (2002). Mechanism of maltodextrin transport through LamB.
Research in Microbiology, 153(7), 417-424.
Knothe, H., Shah, P., Krcmery, V., Antal, M., & Mitsuhashi, S. (1983).
Transferable resistance to cefotaxime, cefoxitin, cefamandole and
338 |
cefuroxime in clinical isolates of Klebsiella pneumoniae and Serratia
marcescens. Infection, 11(6), 315-317.
Ko, W. C., Paterson, D. L., Sagnimeni, A. J., et al. (2002). Community-acquired
Klebsiella pneumoniae bacteremia: global differences in clinical
patterns. Emerging Infectious Diseases, 8(2), 160-166.
Kong, Q., Beanan, J. M., Olson, R., et al. (2012). Biofilm formed by a
hypervirulent (hypermucoviscous) variant of Klebsiella pneumoniae
does not enhance serum resistance or survival in an in vivo abscess
model. Virulence, 3(3), 309-318.
Korea, C. G., Ghigo, J. M., & Beloin, C. (2011). The sweet connection: Solving
the riddle of multiple sugar-binding fimbrial adhesins in Escherichia coli.
Bioessays, 33(4), 300-311.
Kotra, L. P., Haddad, J., & Mobashery, S. (2000). Aminoglycosides:
perspectives on mechanisms of action and resistance and strategies to
counter resistance. Antimicrobial Agents and Chemotherapy, 44(12),
3249-3256.
Krewulak, K. D., & Vogel, H. J. (2008). Structural biology of bacterial iron
uptake. Biochimica et Biophysica Acta (BBA) - Biomembranes, 1778(9),
1781-1804.
Kropec, A., Maira-Litran, T., Jefferson, K. K., et al. (2005). Poly-N-
acetylglucosamine production in Staphylococcus aureus is essential for
virulence in murine models of systemic infection. Infection and
Immunity, 73(10), 6868-6876.
Kumar, A., Mallik, D., Pal, S., et al. (2015). Escherichia coli O8-antigen
enhances biofilm formation under agitated conditions. FEMS
Microbiology Letters, 362(15).
339 |
LaBombardi, V. J., Rojtman, A., & Tran, K. (2006). Use of cefepime for the
treatment of infections caused by extended spectrum β-lactamase–
producing Klebsiella pneumoniae and Escherichia coli. Diagnostic
Microbiology and Infectious Disease, 56(3), 313-315.
Landman, D., Bratu, S., & Quale, J. (2009). Contribution of OmpK36 to
carbapenem susceptibility in KPC-producing Klebsiella pneumoniae.
Journal of Medical Microbiology, 58(10), 1303-1308.
Latasa, C., Solano, C., Penadés, J. R., & Lasa, I. (2006). Biofilm-associated
proteins. Comptes Rendus Biologies, 329(11), 849-857.
Lautrop, H. (1956). Gelatin liquefying Klebsiella strains (Bacterium oxytocum
(Flügge)). Acta Pathologica Microbiologica Scandinavica, 39(5), 375-
384.
Le Quéré, B., & Ghigo, J. M. (2009). BcsQ is an essential component of the
Escherichia coli cellulose biosynthesis apparatus that localizes at the
bacterial cell pole. Molecular Microbiology, 72(3), 724-740.
Lebeaux, D., Chauhan, A., Rendueles, O., & Beloin, C. (2013). From in vitro
to in vivo models of bacterial biofilm-related infections. Pathogens, 2(2),
288-356.
Lebeaux, D., Ghigo, J. M., & Beloin, C. (2014). Biofilm-related infections:
bridging the gap between clinical management and fundamental
aspects of recalcitrance toward antibiotics. Microbiology and Molecular
Biology Reviews, 78(3), 510-543.
LeBlanc, D. J., Lee, L. N., & Inamine, J. M. (1991). Cloning and nucleotide
base sequence analysis of a spectinomycin adenyltransferase AAD(9)
determinant from Enterococcus faecalis. Antimicrobial Agents and
Chemotherapy, 35(9), 1804-1810.
340 |
Leclercq, R. (2002). Mechanisms of resistance to macrolides and
lincosamides: nature of the resistance elements and their clinical
implications. Clinical Infectious Diseases, 34(4), 482-492.
Lee, D., Redfern, O., & Orengo, C. (2007). Predicting protein function from
sequence and structure. Nature Reviews Molecular Cell Biology, 8(12),
995-1005.
Levison, M. E., & Levison, J. H. (2009). Pharmacokinetics and
pharmacodynamics of antibacterial agents. Infectious Disease Clinics
of North America, 23(4), 791-815.
Lewis, K. (2001). Riddle of biofilm resistance. Antimicrobial Agents and
Chemotherapy, 45(4), 999-1007.
Liao, H., Zhang, X. Z., Rollin, J. A., & Zhang, Y. H. (2011). A minimal set of
bacterial cellulases for consolidated bioprocessing of lignocellulose.
Biotechnology Journal, 6(11), 1409-1418.
Limoli, D. H., Jones, C. J., & Wozniak, D. J. (2015). Bacterial extracellular
polysaccharides in biofilm formation and function. Microbiology
Spectrum, 3(3).
Lin, C.-W., Huang, Y.-W., Hu, R.-M., Chiang, K.-H., & Yang, T.-C. (2009). The
role of AmpR in regulation of L1 and L2 β-lactamases in
Stenotrophomonas maltophilia. Research in Microbiology, 160(2), 152-
158.
Lin, W.-P., Wang, J.-T., Chang, S.-C., et al. (2016). The antimicrobial
susceptibility of Klebsiella pneumoniae from community settings in
Taiwan, a Trend Analysis. Scientific Reports, 6, 36280.
341 |
Linares, J. F., Gustafsson, I., Baquero, F., & Martinez, J. L. (2006). Antibiotics
as intermicrobial signaling agents instead of weapons. Proceedings of
the National Academy of Sciences, 103(51), 19484-19489.
Liu, Y., & Tay, J.-H. (2002). The essential role of hydrodynamic shear force in
the formation of biofilm and granular sludge. Water Research, 36(7),
1653-1665.
Llobet, E., March, C., Giménez, P., & Bengoechea, J. A. (2009). Klebsiella
pneumoniae OmpA confers resistance to antimicrobial peptides.
Antimicrobial Agents and Chemotherapy, 53(1), 298-302.
Loveday, H. P., Wilson, J. A., Pratt, R. J., et al. (2014). epic3: National
evidence-based guidelines for preventing healthcare-acssociated
infections in NHS hospitals in England. Journal of Hospital Infection,
86(Supplement 1), S1-S70.
Lugtenberg, B., & Van Alphen, L. (1983). Molecular architecture and
functioning of the outer membrane of Escherichia coli and other Gram-
negative bacteria. Biochimica et Biophysica Acta (BBA)- Reviews on
Biomembranes, 737(1), 51-115.
Lynch, A. S., & Robertson, G. T. (2008). Bacterial and fungal biofilm infections.
Annual Review of Medicine, 59, 415-428.
Mack, D., Fischer, W., Krokotsch, A., et al. (1996). The intercellular adhesin
involved in biofilm accumulation of Staphylococcus epidermidis is a
linear beta-1,6-linked glucosaminoglycan: purification and structural
analysis. Journal of Bacteriology, 178(1), 175-183.
Magnet, S., & Blanchard, J. S. (2005). Molecular insights into aminoglycoside
action and resistance. Chemical Reviews, 105(2), 477-498.
342 |
Mah, T. F. C., & O'Toole, G. A. (2001). Mechanisms of biofilm resistance to
antimicrobial agents. Trends in Microbiology, 9(1), 34-39.
Maillard, J. Y. (2002). Bacterial target sites for biocide action. Journal of
Applied Microbiology, 92(Supplement 1), 16S-27S.
Majtan, J., Majtanova, L., Xu, M., & Majtan, V. (2008). In vitro effect of
subinhibitory concentrations of antibiotics on biofilm formation by
clinical strains of Salmonella enterica serovar Typhimurium isolated in
Slovakia. Journal of Applied Microbiology, 104(5), 1294-1301.
Mallea, M., Chevalier, J., Bornet, C., et al. (1998). Porin alteration and active
efflux: two in vivo drug resistance strategies used by Enterobacter
aerogenes. Microbiology, 144 (11), 3003-3009.
Martinez-Martinez, L., Pascual, A., & Jacoby, G. A. (1998). Quinolone
resistance from a transferable plasmid. Lancet, 351(9105), 797-799.
Martínez‐Martínez, L. (2008). Extended-spectrum β-lactamases and the
permeability barrier. Clinical Microbiology & Infection, 14(Supplement
1), 82-89.
McCoy, W. F., Bryers, J. D., Robbins, J., & Costerton, J. W. (1981).
Observations of fouling biofilm formation. Canadian Journal of
Microbiology, 27(9), 910-917.
McCusker, M. P., Turner, E. C., & Dorman, C. J. (2008). DNA sequence
heterogeneity in Fim tyrosine-integrase recombinase-binding elements
and functional motif asymmetries determine the directionality of the fim
genetic switch in Escherichia coli K-12. Molecular Microbiology, 67(1),
171-187.
343 |
McDonnell, G., & Russell, A. D. (1999). Antiseptics and disinfectants: Activity,
action, and resistance. Clinical Microbiology Reviews, 12(1), 147-179.
McDonnell, G. E. (2007). Antisepsis, disinfection, and sterilization: Types,
action and resistance. Washington D. C.: American Society of
Microbiology.
McKenna, M. (2013). The last resort. Nature, 499(7459), 394-396.
Medeiros, A. A. (1984). Beta-lactamases. British Medical Bulletin, 40(1), 18-
27.
Meile, K., Zhurinsh, A., & Spince, B. (2014). Aspects of periodate oxidation of
carbohydrates for the analysis of pyrolysis liquids. Journal of
Carbohydrate Chemistry, 33(3), 105-116.
Messenger, A. J., & Barclay, R. (1983). Bacteria, iron and pathogenicity.
Biochemical Education, 11(2), 54-63.
Miller, S. I. (2016). Antibiotic resistance and regulation of the Gram-negative
bacterial outer membrane barrier by host innate immune molecules.
mBIO, 7(5), e01541-01516.
Mingeot-Leclercq, M. P., Glupczynski, Y., & Tulkens, P. M. (1999).
Aminoglycosides: activity and resistance. Antimicrobial Agents and
Chemotherapy, 43(4), 727-737.
Montanaro, L., Poggi, A., Visai, L., et al. (2011). Extracellular DNA in biofilms.
International Journal of Artificial Organs, 34(9), 824-831.
Moreira, J. M., Gomes, L. C., Araújo, J. D., et al. (2013). The effect of glucose
concentration and shaking conditions on Escherichia coli biofilm
344 |
formation in microtiter plates. Chemical Engineering Science, 94, 192-
199.
Morgan, J. L. W., McNamara, J. T., & Zimmer, J. (2014). Mechanism of
activation of bacterial cellulose synthase by cyclic-di-GMP. Nature
Structural & Molecular Biology, 21(5), 489-496.
Muheim, C., Götzke, H., Eriksson, A. U., et al. (2017). Increasing the
permeability of Escherichia coli using MAC13243. Scientific Reports,
7(1), 17629.
Mullany, P., Wilks, M., Lamb, I., et al. (1990). Genetic analysis of a tetracycline
resistance element from Clostridium difficile and its conjugal transfer to
and from Bacillus subtilis. Journal of General Microbiology, 136(7),
1343-1349.
Mulvey, M. A., Schilling, J. D., Martinez, J. J., & Hultgren, S. J. (2000). Bad
bugs and beleaguered bladders: interplay between uropathogenic
Escherichia coli and innate host defenses. Proceedings of the National
Academy of Sciences, 97(16), 8829-8835.
Munita, J. M., & Arias, C. A. (2016). Mechanisms of antibiotic resistance.
Microbiology Spectrum, 4(2), 1-37.
Murphy, C. N., & Clegg, S. (2012). Klebsiella pneumoniae and type 3 fimbriae:
nosocomial infection, regulation and biofilm formation. Future
Microbiology, 7(8), 991-1002.
Murphy, C. N., Mortensen, M. S., Krogfelt, K. A., & Clegg, S. (2013). Role of
Klebsiella pneumoniae type 1 and type 3 fimbriae in colonizing silicone
tubes implanted into the bladders of mice as a model of catheter-
associated urinary tract infections. Infection and Immunity, 81(8), 3009-
3017.
345 |
Naparstek, L., Carmeli, Y., Navon-Venezia, S., & Banin, E. (2014). Biofilm
formation and susceptibility to gentamicin and colistin of extremely
drug-resistant KPC-producing Klebsiella pneumoniae. Journal of
Antimicrobial Chemotherapy, 69(4), 1027-1034.
Naville, M., Ghuillot-Gaudeffroy, A., Marchais, A., & Gautheret, D. (2011).
ARNold: A web tool for the prediction of Rho-independent transcription
terminators. RNA Biology, 8(1), 11-13.
Neal, D. E. (2008). Complicated urinary tract infections. Urologic Clinics of
North America, 35(1), 13-22.
Nicholas, K. B., & Nicholas, H. B. J. (1997). GeneDoc: a tool for editing and
annotating multiple sequence alignments.
http://www.psc.edu/biomed/genedoc.
Nicolle, L. E. (2014). Catheter associated urinary tract infections. Antimicrobial
Resistance and Infection Control, 3(1), 23.
Nikaido, H. (1988). Bacterial resistance to antibiotics as a function of outer
membrane permeability. Journal of Antimicrobial Chemotherapy,
22(Supplement A), 17-22.
Nikaido, H. (1994). Porins and specific diffusion channels in bacterial outer
membranes. The Journal of Biological Chemistry, 269(6), 3906-3908.
Nikaido, H. (1996a). Multidrug efflux pumps of Gram-negative bacteria.
Journal of Bacteriology, 178(20), 5853-5859.
Nikaido, H. (1996b). Outer membrane. In F. C. Neidhardt (Ed.), Escherichia
coli and Salmonella: Cellular and Molecular Biology (pp. 29-47).
Washington, DC: ASM Press.
346 |
Nikaido, H. (2003). Molecular basis of bacterial outer membrane permeability
revisited. Microbiology & Molecular Biology Reviews, 67(4), 593-656.
Nordmann, P., Cuzon, G., & Naas, T. (2009). The real threat of Klebsiella
pneumoniae carbapenemase-producing bacteria. The Lancet
Infectious Diseases, 9(4), 228-236.
Nordmann, P., Naas, T., & Poirel, L. (2011). Global spread of carbapenemase-
producing Enterobacteriaceae. Emerging Infectious Diseases, 17(10),
1791-1798.
Nuccio, S. P., & Bäumler, A. J. (2007). Evolution of the chaperone/usher
assembly pathway: fimbrial classification goes Greek. Microbiology &
Molecular Biology Reviews, 71(4), 551-575.
Nucleo, E., Steffanoni, L., Fugazza, G., et al. (2009). Growth in glucose-based
medium and exposure to subinhibitory concentrations of imipenem
induce biofilm formation in a multidrug-resistant clinical isolate of
Acinetobacter baumannii. BMC Microbiology, 9(1), 270.
O'Neill, J. (2016). Tackling drug-resistant infections globally: Final report and
recommendations.
O'Toole, G. A. (2011). Microtiter dish biofilm formation assay. Journal of
Visualized Experiments : JoVE(47), 2437.
Oelschlaeger, T. A., & Tall, B. D. (1997). Invasion of cultured human epithelial
cells by Klebsiella pneumoniae isolated from the urinary tract. Infection
and Immunity, 65(7), 2950-2958.
Ojo, K. K., Ulep, C., Van Kirk, N., et al. (2003). The mef(A) gene predominates
among seven macrolide resistance genes identified in Gram-negative
347 |
strains representing 13 genera, isolated from healthy Portuguese
children. Antimicrobial Agents and Chemotheraphy, 48(69), 3451-3456.
Okshevsky, M., & Meyer, R. L. (2014). Evaluation of fluorescent stains for
visualizing extracellular DNA in biofilms. Journal of Microbiological
Methods, 105, 102-104.
Old, D. C., Tavendale, A., & Senior, B. W. (1985). A comparative study of the
type-3 fimbriae of Klebsiella species. Journal of Medical Microbiology,
20(2), 203-214.
Olivares, E., Badel-Berchoux, S., Provot, C., et al. (2016). The BioFilm Ring
test: a rapid method for routine analysis of Pseudomonas aeruginosa
biofilm formation kinetics. Journal of Clinical Microbiology, 54(3), 657-
661.
Onori, R., Gaiarsa, S., Comandatore, F., et al. (2015). Tracking nosocomial
Klebsiella pneumoniae infections and outbreaks by whole-genome
analysis: Small-scale Italian scenario within a single hospital. Journal of
Clinical Microbiology, 53(9), 2861-2868.
Ørskov, I. (1984). Genus v. Klebsiella. In N. R. Krieg & J. R. Holt (Eds.),
Bergey's Manual of Systematic Bacteriology (Vol. 1, pp. 461-465):
Springer.
Paczosa, M. K., & Mecsas, J. (2016). Klebsiella pneumoniae: Going on the
offense with a strong defense. Microbiology & Molecular Biology
Reviews, 80(3), 629-661.
Pagès, J. M., James, C. E., & Winterhalter, M. (2008). The porin and the
permeating antibiotic: a selective diffusion barrier in Gram-negative
bacteria. Nature Reviews Microbiology, 6(12), 893-903.
348 |
Pak, J., Pu, Y., Zhang, Z. T., Hasty, D. L., & Wu, X. R. (2001). Tamm-Horsfall
protein binds to type 1 fimbriated Escherichia coli and prevents E. coli
from binding to uroplakin Ia and Ib receptors. Journal of Biological
Chemistry, 276(13), 9924-9930.
Pan, Y. J., Lin, T. L., Chen, Y. H., et al. (2013). Capsular types of Klebsiella
pneumoniae revisited by wzc sequencing. PLOS ONE, 8(12), e80670.
Pan, Y. J., Lin, T. L., Hsu, C. R., & Wang, J. T. (2011). Use of a Dictyostelium
model for isolation of genetic loci associated with phagocytosis and
virulence in Klebsiella pneumoniae. Infection and Immunity, 79(3), 997-
1006.
Pangon, B., Bizet, C., Bure, A., et al. (1989). In vivo selection of a cephamycin-
resistant, porin-deficient mutant of Klebsiella pneumoniae producing a
TEM-3 beta-lactamase. The Journal of Infectious Diseases, 159(5),
1005-1006.
Paris, T., Skali-Lami, S., & Block, J.-C. (2007). Effect of wall shear rate on
biofilm deposition and grazing in drinking water flow chambers.
Biotechnology and Bioengineering, 97(6), 1550-1561.
Parkinson, R., Holden, S., & Clarkson, A. (2016). Guideline for antibiotic
surgical prophylaxis in adult urology. Nottingham University Hospital.
Paterson, D. L. (2006). Resistance in Gram-negative bacteria:
Enterobacteriaceae. The American Journal of Medicine, 119(6), S20-
S28.
Paterson, D. L., Ko, W. C., Von Gottberg, A., et al. (2004). Antibiotic therapy
for Klebsiella pneumoniae bacteremia: Implications of production of
extended-spectrum β-lactamases. Clinical Infectious Diseases, 39(1),
31-37.
349 |
Paterson, D. L., Siu, L. K., & Chang, F. Y. (2014). Klebsiella species (K.
pneumoniae, K. oxytoca, K. ozaenae and K. rhinoscleromatis).
Retrieved from http://www.antimicrobe.org/b107.asp
Peters, A. C., & Wimpenny, J. W. T. (1987). A constant-depth laboratory model
film fermentor. Biotechnology and Bioengineering, 32(3), 263-270.
Pettersen, E. F., Goddard, T. D., Huang, C. C., et al. (2004). UCSF Chimera -
A visualization system for exploratory research and analysis. Journal of
Computational Chemistry, 25(13), 1605-1612.
Podschun, R., & Ullmann, U. (1998). Klebsiella spp. as nosocomial pathogens:
epidemiology, taxonomy, typing methods, and pathogenicity factors.
Clinical Microbiology Reviews, 11(4), 589-603.
Poole, K. (2012). Bacterial stress responses as determinants of antimicrobial
resistance. Journal of Antimicrobial Chemotherapy, 67(9), 2069-2089.
Prakash, M. (2008). Substitutional evoution. In Encyclopaedia of Gene
Evolution - Molecular Genetics (pp. 165-193). New Delhi: Discovery
Publishing House New Delhi.
Pratt, L. A., & Kolter, R. (1998). Genetic analysis of Escherichia coli biofilm
formation: roles of flagella, motility, chemotaxis and type I pili. Molecular
Microbiology, 30(2), 285-293.
Prigent-Combaret, C., Brombacher, E., Vidal, O., et al. (2001). Complex
regulatory network controls initial adhesion and biofilm formation in
Escherichia coli via regulation of the csgD gene. Journal of
Bacteriology, 183(24), 7213-7223.
350 |
Prigent-Combaret, C., Vidal, O., Dorel, C., & Lejeune, P. (1999). Abiotic
surface sensing and biofilm-dependent regulation of gene expression
in Escherichia coli. Journal of Bacteriology, 181(19), 5993-6002.
Prokesch, B. C., TeKippe, M., Kim, J., et al. (2016). Primary osteomyelitis
caused by hypervirulent Klebsiella pneumoniae. The Lancet Infectious
Diseases, 16(9), e190-e195.
Pruss, B. M., Besemann, C., Denton, A., & Wolfe, A. J. (2006). A complex
transcription network controls the early stages of biofilm development
by Escherichia coli. Journal of Bacteriology, 188(11), 3731-3739.
Pultz, N. J., Stiefel, U., & Donskey, C. J. (2005). Effects of daptomycin,
linezolid, and vancomycin on establishment of intestinal colonization
with vancomycin-resistant enterococci and extended-spectrum-beta-
lactamase-producing Klebsiella pneumoniae in mice. Antimicrobial
Agents and Chemotherapy, 49(8), 3513-3516.
Qi, Y., Pei, J., & Grishin, N. V. (2002). C-terminal domain of gyrase A is
predicted to have a β-propeller structure. Proteins: Structure, Function
and Bioinformatics, 47(3), 258-264.
Rachid, S., Ohlsen, K., Witte, W., Hacker, J., & Ziebuhr, W. (2000). Effect of
subinhibitory antibiotic concentrations on polysaccharide intercellular
adhesin expression in biofilm-forming Staphylococcus epidermidis.
Antimicrobial Agents and Chemotherapy, 44(12), 3357-3363.
Raffi, H. S., Bates, J. M., Flournoy, D. J., & Kumar, S. (2012). Tamm-Horsfall
protein facilitates catheter associated urinary tract infection. BMC
Research Notes, 5(1), 532.
Ramasubbu, N., Thomas, L. M., Ragunath, C., & Kaplan, J. B. (2005).
Structural analysis of dispersin B, a biofilm-releasing glycoside
351 |
hydrolase from the periodontopathogen Actinobacillus
actinomycetemcomitans. Journal of Molecular Biology, 349(3), 475-
486.
Ramirez, M. S., & Tolmasky, M. E. (2010). Aminoglycoside modifying
enzymes. Drug Resistance Updates, 13(6), 151-171.
Rawat, D., & Nair, D. (2010). Extended-spectrum β-lactamases in Gram
negative bacteria. Journal of Global Infectious Diseases, 2(3), 263-274.
Raymond, T., Wiesen, J., Rehm, S., & Auron, M. (2014). Carbapenem-
resistant Klebsiella pneumoniae prosthetic valve endocarditis: A feared
combination of technology and emerging pathogens. Infectious
Diseases in Clinical Practice, 22(2), 113-115.
Redgrave, L. S., Sutton, S. B., Webber, M. A., & Piddock, L. J. V. (2014).
Fluoroquinolone resistance: mechanisms, impact on bacteria, and role
in evolutionary success. Trends in Microbiology, 22(8), 438-445.
Reisner, A., Maierl, M., Jorger, M., et al. (2014). Type 1 fimbriae contribute to
catheter-associated urinary tract infections caused by Escherichia coli.
Journal of Bacteriology, 196(5), 931-939.
Rice, P., Longden, I., & Bleasby, A. (2000). EMBOSS: The European
Molecular Biology Open Software Suite. Trends in Genetics, 16(6), 276-
277.
Richter, L., Stepper, C., Mak, A., et al. (2007). Development of a microfluidic
biochip for online monitoring of fungal biofilm dynamics. Lab on a Chip,
7(12), 1723-1731.
352 |
Robicsek, A., Strahilevitz, J., Jacoby, G. A., et al. (2005). Fluoroquinolone-
modifying enzyme: a new adaptation of a common aminoglycoside
acetyltransferase. Nature Medicine, 12, 83.
Rodrigues, D. F., & Elimelech, M. (2009). Role of type 1 fimbriae and mannose
in the development of Escherichia coli K12 biofilm: from initial cell
adhesion to biofilm formation. Biofouling, 25(5), 401-411.
Rolhion, N., Carvalho, F. A., & Darfeuille-Michaud, A. (2007). OmpC and the
σE regulatory pathway are involved in adhesion and invasion of the
Crohn's disease-associated Escherichia coli strain LF82. Molecular
Microbiology, 63(6), 1684-1700.
Romero, D., Traxler, M. F., Lopez, D., & Kolter, R. (2011). Antibiotics as signal
molecules. Chemical Reviews, 111(9), 5492-5505.
Römling, U. (2012). Cyclic di-GMP, an established secondary messenger still
speeding up. Environmental Microbiology, 14(8), 1817-1829.
Römling, U., & Galperin, M. Y. (2015). Bacterial cellulose biosynthesis:
diversity of operons, subunits, products, and functions. Trends in
Microbiology, 23(9), 545-557.
Ronald, A. (2002). The etiology of urinary tract infection: traditional and
emerging pathogens. The American Journal of Medicine, 113(1), 14-
19.
Rose, A. S., Bradley, A. R., Valasatava, Y., et al. (2016). Web-based molecular
graphics for large complexes. Paper presented at the Proceedings of
the 21st International Conference on Web3D Technology, Anaheim,
California.
353 |
Rose, A. S., & Hildebrand, P. W. (2015). NGL Viewer: a web application for
molecular visualization. Nucleic Acids Research, 43(W1), 576-579.
Rosen, D. A., Pinkner, J. S., Jones, J. M., et al. (2008). Utilization of an
intracellular bacterial community pathway in Klebsiella pneumoniae
urinary tract infection and the effects of FimK on type 1 pilus expression.
Infection and Immunity, 76(7), 3337-3345.
Rosen, D. A., Pinkner, J. S., Walker, J. N., et al. (2008). Molecular variations
in Klebsiella pneumoniae and Escherichia coli FimH affect function and
pathogenesis in the urinary tract. Infection and Immunity, 76(7), 3346-
3356.
Rosenberg, E. Y., Ma, D., & Nikaido, H. (2000). AcrD of Escherichia coli is an
aminoglycoside efflux pump. Journal of Bacteriology, 182(6), 1754-
1756.
Rosenblueth, M., Martinez, L., Silva, J., & Martinez-Romero, E. (2004).
Klebsiella variicola, a novel species with clinical and plant-associated
isolates. Systematic and Applied Microbiology, 27(1), 27-35.
Roux, D., Cywes-Bentley, C., Zhang, Y. F., et al. (2015). Identification of poly-
N-acetylglucosamine as a major polysaccharide component of the
Bacillus subtilis biofilm matrix. Journal of Biological Chemistry, 290(31),
19261-19272.
Roy, S., Datta, S., Viswanathan, R., Singh, A. K., & Basu, S. (2013).
Tigecycline susceptibility in Klebsiella pneumoniae and Escherichia coli
causing neonatal septicaemia (2007-10) and role of an efflux pump in
tigecycline non-susceptibility. Journal of Antimicrobial Chemotherapy,
68(5), 1036-1042.
354 |
Ruiz, E., Sáenz, Y., Zarazaga, M., et al. (2012). qnr, aac(6′)-Ib-cr and qepA
genes in Escherichia coli and Klebsiella spp.: genetic environments and
plasmid and chromosomal location. Journal of Antimicrobial
Chemotherapy, 67(4), 886-897.
Russo, T. A., Olson, R., MacDonald, U., Beanan, J., & Davidson, B. A. (2015).
Aerobactin, but not yersiniabactin, salmochelin, or enterobactin,
enables the growth/survival of hypervirulent (hypermucoviscous)
Klebsiella pneumoniae ex vivo and in vivo. Infection and Immunity,
83(8), 3325-3333.
Saenger, W. (2013). Proteinase K In N. D. Rawlings & G. Salvesen (Eds.),
Handbook of Proteolytic Enzymes (Vol. 1, pp. 3240-3242). Europe:
Elsevier Ltd.
Sahly, H., Keisari, Y., & Ofek, I. (2009). Manno(rhamno)biose-containing
capsular polysaccharides of Klebsiella pneumoniae enhance opsono-
stimulation of human polymorphonuclear leukocytes. Journal of Innate
Immunity, 1(2), 136-144.
Sahly, H., Navon-Venezia, S., Roesler, L., et al. (2008). Extended-spectrum
β-lactamase production is associated with an increase in cell invasion
and expression of fimbrial adhesins in Klebsiella pneumoniae.
Antimicrobial Agents and Chemotherapy, 52(9), 3029-3034.
Sahly, H., Podschun, R., Oelschlaeger, T. A., et al. (2000). Capsule impedes
adhesion to and invasion of epithelial cells by Klebsiella pneumoniae.
Infection and Immunity, 68(12), 6744-6749.
Sakazaki, R., Tamura, K., Kosako, Y., & Yoshizaki, E. (1989). Klebsiella
ornithinolytica sp. nov., formerly known as ornithine-positive Klebsiella
oxytoca. Current Microbiology, 18(4), 201-206.
355 |
Saldaña, Z., A., M., Carrillo-Casas, E. M., et al. (2014). Production of the
Escherichia coli common pilus by uropathogenic E. coli is associated
with adherence to HeLa and HTB-4 cells and invasion of mouse bladder
urothelium. PLOS ONE, 9(7), e101200.
Sánchez, R., & Sali, A. (1998). Large-scale protein structure modeling of the
Saccharomyces cerevisiae genome. Proceedings of the National
Academy of Sciences, 95(23), 13597-13602.
Sandora, T. J., & Goldmann, D. A. (2012). Preventing lethal hospital outbreaks
of antibiotic-resistant bacteria. New England Journal of Medicine,
367(23), 2168-2170.
Saur, T., Morin, E., Habouzit, F., Bernet, N., & Escudié, R. (2017). Impact of
wall shear stress on initial bacterial adhesion in rotating annular reactor.
PLOS ONE, 12(2), e0172113.
Sbrana, F., Malacarne, P., Bassetti, M., et al. (2016). Risk factors for ventilator
associated pneumonia due to carbapenemase-producing Klebsiella
pneumoniae in mechanically ventilated patients with tracheal and rectal
colonization. Minerva Anestesiologica, 82(6), 635-640.
Schembri, M. A., Blom, J., Krogfelt, K. A., & Klemm, P. (2005). Capsule and
fimbria interaction in Klebsiella pneumoniae. Infection and Immunity,
73(8), 4626-4633.
Schembri, M. A., Dalsgaard, D., & Klemm, P. (2004). Capsule shields the
function of short bacterial adhesins. Journal of Bacteriology, 186(5),
1249-1257.
Schmidt, A. J., Ryjenkov, D. A., & Gomelsky, M. (2005). The ubiquitous protein
domain EAL is a cyclic diguanylate-specific phosphodiesterase:
356 |
enzymatically active and inactive EAL domains. Journal of Bacteriology,
187(14), 4774-4781.
Schmieder, R., & Edwards, R. (2012). Insights into antibiotic resistance
through metagenomic approaches. Future Microbiology, 7(1), 73-89.
Schroll, C., Barken, K. B., Krogfelt, K. A., & Struve, C. (2010). Role of type 1
and type 3 fimbriae in Klebsiella pneumoniae biofilm formation. BMC
Microbiology, 10(179), 2-10.
Schulz, G. E. (2004). The structures of general porins. In R. Benz (Ed.),
Bacterial and Eukaryotic Porins; Structure, Function, Mechanism (pp.
25-40). Germany: 2004 Wiley-Vch Verlag GmbH & Co.
Schwartz, K., Stephenson, R., Hernandez, M., Jambang, N., & Boles, B. R.
(2010). The use of drip flow and rotating disk reactors for
Staphylococcus aureus biofilm analysis. Journal of Visualized
Experiments : JoVE(46).
Seltmann, G., & Holst, O. (2002). Proteins of the outer membrane. In The
bacterial cell wall (pp. 89): Springer Science & Business Media.
Seneviratne, C. J., Yip, J. W. Y., Chang, J. W. W., Zhang, C. F., &
Samaranayake, L. P. (2013). Effect of culture media and nutrients on
biofilm growth kinetics of laboratory and clinical strains of Enterococcus
faecalis. Archives of Oral Biology, 58(10), 1327-1334.
Serafini-Cessi, F., Malagolini, N., & Cavallone, D. (2003). Tamm-Horsfall
glycoprotein: biology and clinical relevance. American Journal of Kidney
Diseases, 42(4), 658-676.
357 |
Shakib, P., Ghafourian, S., Zolfaghary, M. R., et al. (2012). Prevalence of
OmpK35 and OmpK36 porin expression in beta-lactamase and non-
betalactamase- producing Klebsiella pneumoniae. Biologics : Targets
& Therapy, 6, 1-4.
Sharples, G. J., & Lloyd, R. G. (1990). A novel repeated DNA sequence
located in the intergenic regions of bacterial chromosomes. Nucleic
Acids Research, 18(22), 6503-6508.
Shoji, S., Walker, S. E., & Fredrick, K. (2009). Ribosomal translocation: One
step closer to the molecular mechanism. ACS Chemical Biology, 4(2),
93-107.
Shon, A. S., Bajwa, R. P., & Russo, T. A. (2013). Hypervirulent
(hypermucoviscous) Klebsiella pneumoniae: A new and dangerous
breed. Virulence, 4(2), 107-118.
Shu, J. C., Chia, J. H., Kuo, A. J., Su, L. H., & Wu, T. L. (2009). A 7-year
surveillance for ESBL-producing Escherichia coli and Klebsiella
pneumoniae at a university hospital in Taiwan: the increase of CTX-M-
15 in the ICU. Epidemiology and Infection, 138(2), 253-263.
Sievers, F., Wilm, A., Dineen, D., et al. (2011). Fast, scalable generation of
high‐quality protein multiple sequence alignments using Clustal
Omega. Molecular Systems Biology, 7(1), 539.
Simpson, I. N., Harper, P. B., & O'Callaghan, C. H. (1980). Principal beta-
lactamases responsible for resistance to beta-lactam antibiotics in
urinary tract infections. Antimicrobial Agents and Chemotherapy, 17(6),
929-936.
358 |
Singla, S., Harjai, K., & Chhibber, S. (2013). Susceptibility of different phases
of biofilm of Klebsiella pneumoniae to three different antibiotics. Journal
of Antibiotics, 66(2), 61-66.
Siu, L. K., Yeh, K. M., Lin, J. C., Fung, C. P., & Chang, F. Y. (2012). Klebsiella
pneumoniae liver abscess: a new invasive syndrome. The Lancet
Infectious Diseases, 12(11), 881-887.
Smith, D. R., Price, J. E., Burby, P. E., et al. (2017). The production of curli
amyloid fibers is deeply integrated into the biology of Escherichia coli.
Biomolecules, 7(4).
Smyth, E. T. M., McIlvenny, G., Enstone, J. E., et al. (2008). Four country
healthcare associated infection prevalence survey 2006: overview of
the results. Journal of Hospital Infection, 69(3), 230-248.
Sokurenko, E. V., Vogel, V., & Thomas, W. E. (2008). Catch bond mechanism
of force-enhanced adhesion: counter-intuitive, elusive but …
widespread? Cell Host & Microbe, 4(4), 314-323.
Solano, C., Garcia, B., Valle, J., et al. (2002). Genetic analysis of Salmonella
enteritidis biofilm formation: critical role of cellulose. Molecular
Microbiology, 43(3), 793-808.
Solovyev, V., & Salamov, A. (2011). Automatic annotation of microbial
genomes and metagenomic sequences. In R. W. Li (Ed.),
Metagenomics and its Applications in Agriculture, Biomedicine and
Environmental Studies (pp. 61-78): Nova Science Publisher, Inc.
Song, T., Duperthuy, M., & Wai, S. N. (2016). Sub-optimal treatment of
bacterial biofilms. Antibiotics, 5(2), 23.
359 |
Sougakoff, W., Goussard, S., & Courvalin, P. (1988). The TEM-3 β-lactamase,
which hydrolyzes broad-spectrum cephalosporins, is derived from the
TEM-2 penicillinase by two amino acid substitutions. FEMS
Microbiology Letters, 56(3), 343-348.
Staerk, K., Khandige, S., Kolmos, H. J., Moller-Jensen, J., & Andersen, T. E.
(2016). Uropathogenic Escherichia coli express type 1 fimbriae only in
surface adherent populations under physiological growth conditions.
The Journal of Infectious Diseases, 213(3), 386-394.
Stahlhut, S. G., Struve, C., Krogfelt, K. A., & Reisner, A. (2012). Biofilm
formation of Klebsiella pneumoniae on urethral catheters requires either
type 1 or type 3 fimbriae. FEMS Immunology and Medical Microbiology,
65(2), 350-359.
Stahlhut, S. G., Tchesnokova, V., Struve, C., et al. (2009). Comparative
structure-function analysis of mannose-specific FimH adhesins from
Klebsiella pneumoniae and Escherichia coli. Journal of Bacteriology,
191(21), 6592-6601.
Steimle, A., Autenrieth, I. B., & Frick, J. S. (2016). Structure and function: Lipid
A modifications in commensals and pathogens. International Journal of
Medical Microbiology, 306(5), 290-301.
Stewart, P. S. (2002). Mechanisms of antibiotic resistance in bacterial biofilms.
International Journal of Medical Microbiology, 292(2), 107-113.
Stewart, P. S., & William Costerton, J. (2001). Antibiotic resistance of bacteria
in biofilms. The Lancet, 358(9276), 135-138.
Stickler, D., Young, R., Jones, G., Sabbuba, N., & Morris, N. (2003). Why are
Foley catheters so vulnerable to encrustation and blockage by
crystalline bacterial biofilm? Urological Research, 31(5), 306-311.
360 |
Stoodley, P., Dodds, I., Boyle, J. D., & Lappin-Scott, H. M. (1998). Influence of
hydrodynamics and nutrients on biofilm structure. Journal of Applied
Microbiology, 85(Supplement 1), 19S-28S.
Strahilevitz, J., Jacoby, G. A., Hooper, D. C., & Robicsek, A. (2009). Plasmid-
mediated quinolone resistance: a multifaceted threat. Clinical
Microbiology Reviews, 22(4), 664-689.
Struve, C., Bojer, M., & Krogfelt, K. A. (2008). Characterization of Klebsiella
pneumoniae type 1 fimbriae by detection of phase variation during
colonization and infection and impact on virulence. Infection and
Immunity, 76(9), 4055-4065.
Struve, C., & Krogfelt, K. A. (2004). Pathogenic potential of environmental
Klebsiella pneumoniae isolates. Environmental Microbiology, 6(6), 584-
590.
Sugawara, E., Kojima, S., & Nikaido, H. (2016). Klebsiella pneumoniae major
porins OmpK35 and OmpK36 allow more efficient diffusion of β-lactams
than their Escherichia coli homologs OmpF and OmpC. Journal of
Bacteriology, 198(23), 3200-3208.
Sun, L., Bertelshofer, F., Greiner, G., & Böckmann, R. A. (2016).
Characteristics of sucrose transport through the sucrose-specific porin
ScrY studied by molecular dynamics simulations. Frontiers in
Bioengineering and Biotechnology, 4(9).
Sutcliffe, J., Blumenthal, R., Walter, A., & Fouldsi, J. (1983). Escherichia coli
outer membrane protein K is a porin. Journal of Bacteriology, 156(2),
867-872.
Taglialegna, A., Lasa, I., & Valle, J. (2016). Amyloid structures as biofilm matrix
scaffolds. Journal of Bacteriology, 198(19), 2579-2588.
361 |
Tai, P. C., & Davis, B. D. (1979). Triphasic concentration effects of gentamicin
on activity and misreading in protein synthesis. Biochemistry, 18(1),
193-198.
Tambyah, P. A., & Maki, D. G. (2000). Catheter-associated urinary tract
infection is rarely symptomatic: a prospective study of 1,497
catheterized patients. Archives of Internal Medicine, 160(5), 678-682.
Tangy, F., Moukkadem, M., Vindimian, E., Capmau, M. L., & Goffic, F. (1985).
Mechanism of action of gentamicin components. The FEBS Journal,
147(2), 381-386.
Tenover, F. C. (2006). Mechanisms of antimicrobial resistance in bacteria. The
American Journal of Medicine, 119(6), S3-10.
Tetz, G. V., Artemenko, N. K., & Tetz, V. V. (2009). Effect of DNase and
antibiotics on biofilm characteristics. Antimicrobial Agents and
Chemotherapy, 53(3), 1204-1209.
Tezel, B. U., Akçelik, N., Yüksel, F. N., Karatuğ, N. T., & Akçelik, M. (2016).
Effects of sub-MIC antibiotic concentrations on biofilm production of
Salmonella Infantis. Biotechnology & Biotechnological Equipment,
30(6), 1184-1191.
Thanassi, D. G., Suh, G. S., & Nikaido, H. (1995). Role of outer membrane
barrier in efflux-mediated tetracycline resistance of Escherichia coli.
Journal of Bacteriology, 177(4), 998-1007.
Thomas, B., & Tolley, D. (2008). Concurrent urinary tract infection and stone
disease: pathogenesis, diagnosis and management. Nature Clinical
Practice Urology, 5(12), 668-675.
362 |
Thomas, W. (2008). Catch bonds in adhesion. Annual Review of Biomedical
Engineering, 10(1), 39-57.
Thornton, M. M., Chung-Esaki, H. M., Irvin, C. B., et al. (2012). Multicellularity
and antibiotic resistance in Klebsiella pneumoniae grown under
bloodstream-mimicking fluid dynamic conditions. Journal of Infectious
Diseases, 206(4), 588-595.
Tran, J. H., & Jacoby, G. A. (2002). Mechanism of plasmid-mediated quinolone
resistance. Proceedings of the National Academy of Sciences, 99(8),
5638-5642.
Tran, J. H., Jacoby, G. A., & Hooper, D. C. (2005). Interaction of the plasmid-
encoded quinolone resistance protein Qnr with Escherichia coli DNA
gyrase. Antimicrobial Agents and Chemotherapy, 49(1), 118-125.
Tsai, Y. K., Fung, C. P., Lin, J. C., et al. (2011). Klebsiella pneumoniae outer
membrane porins OmpK35 and OmpK36 play roles in both
antimicrobial resistance and virulence. Antimicrobial Agents and
Chemotherapy, 55(4), 1485-1493.
Tsao, N., Kuo, C. F., Chiu, C. C., et al. (2015). Protection against Klebsiella
pneumoniae using lithium chloride in an intragastric infection model.
Antimicrob Agents Chemother, 59(3), 1525-1533.
Tsuji, A., Kaneko, Y., Takahashi, K., Ogawa, M., & Goto, S. (1982). The effects
of temperature and pH on the growth of eight enteric and nine glucose
non-fermenting species of gram-negative rods. Microbiology and
Immunology, 26(1), 15-24.
Turner, P. J. (2005). Extended-spectrum β-lactamases. Clinical Infectious
Diseases, 41(Supplement 4), S273 - S275.
363 |
Tzouvelekis, L. S., Tzelepi, E., Tassios, P. T., & Legakis, N. J. (2000). CTX-
M-type beta-lactamases: an emerging group of extended-spectrum
enzymes. International Journal of Antimicrobial Agents, 14(2), 137-
142.
van Duin, D., & Bonomo, R. A. (2016). Ceftazidime/avibactam and
ceftolozane/tazobactam: Second-generation β-lactam/β-lactamase
inhibitor combinations. Clinical Infectious Diseases, 63(2), 234-241.
van Hoek, A. H., Mevius, D., Guerra, B., et al. (2011). Acquired antibiotic
resistance genes: an overview. Frontiers in Microbiology, 2, 1-27.
Vetsch, M., Puorger, C., Spirig, T., et al. (2004). Pilus chaperones represent a
new type of protein-folding catalyst. Nature, 431(7006), 329-333.
Vinogradov, E., Frirdich, E., MacLean, L. L., et al. (2002). Structures of
lipopolysaccharides from Klebsiella pneumoniae. Elucidation of the
structure of the linkage region between core and polysaccharide O
chain and identification of the residues at the non-reducing termini of
the O chains. The Journal of Biological Chemistry, 277(28), 25070-
25081.
Virgilio, E., Castaldo, P., Catta, F., Tarantino, G., & Cavallini, M. (2016).
Abdominal surgical site infection due to Klebsiella pneumoniae
carbapenemase‐producing K. pneumoniae. International Wound
Journal, 13(5), 1075-1076.
Vuong, C., Kocianova, S., Voyich, J. M., et al. (2004). A crucial role for
exopolysaccharide modification in bacterial biofilm formation, immune
evasion, and virulence. Journal of Biological Chemistry, 279(52),
54881-54886.
364 |
Vuotto, C., Longo, F., Balice, M. P., Donelli, G., & Varaldo, P. E. (2014).
Antibiotic resistance related to biofilm formation in Klebsiella
pneumoniae. Pathogens, 3(3), 743-758.
Vuotto, C., Longo, F., Pascolini, C., et al. (2017). Biofilm formation and
antibiotic resistance in Klebsiella pneumoniae urinary strains. Journal
of Applied Microbiology, 123(4), 1003-1018.
Walthers, D., Go, A., & Kenney, L. J. (2004). Regulation of porin gene
expression by the two-component regulatory system EnvZ/OmpR. In R.
Benz (Ed.), Bacterial and Eukaryotic Porins: Structure, Function,
Mechanism (pp. 1-24). Germany: 2004 Wiley-Vch Verlag GmbH & Co.
Wang, H., Yan, Y., Rong, D., et al. (2016). Increased biofilm formation ability
in Klebsiella pneumoniae after short-term exposure to a simulated
microgravity environment. MicrobiologyOpen, 5(5), 793-801.
Wang, L. C., Morgan, L. K., Godakumbura, P., Kenney, L. J., & Anand, G. S.
(2012). The inner membrane histidine kinase EnvZ senses osmolality
via helix‐coil transitions in the cytoplasm. The EMBO Journal, 31(11),
2648-2659.
Wang, X., Preston, J. F., & Romeo, T. (2004). The pgaABCD locus of
Escherichia coli promotes the synthesis of a polysaccharide adhesin
required for biofilm formation. Journal of Bacteriology, 186(9), 2724-
2734.
Wang, X. D., Cai, J. C., Zhou, H. W., Zhang, R., & Chen, G. X. (2009).
Reduced susceptibility to carbapenems in Klebsiella pneumoniae
clinical isolates associated with plasmid-mediated β-lactamase
production and OmpK36 porin deficiency. Journal of Medical
Microbiology, 58(9), 1196-2202.
365 |
Wang, Z. C., Huang, C. J., Huang, Y. J., Wu, C. C., & Peng, H. L. (2013). FimK
regulation on the expression of type 1 fimbriae in Klebsiella pneumoniae
CG43S3. Microbiology, 159(7), 1402-1415.
Webber, M. A., & Piddock, L. J. V. (2003). The importance of efflux pumps in
bacterial antibiotic resistance. Journal of Antimicrobial Chemotherapy,
51(1), 9-11.
Wei, D., Sun, J., Shi, J., Liu, P., & Hao, J. (2013). New strategy to improve
efficiency for gene replacement in Klebsiella pneumoniae. Journal of
Industrial Microbiology & Biotechnology, 40(5), 523-527.
Wei, D., Wang, M., Shi, J., & Hao, J. (2012). Red recombinase assisted gene
replacement in Klebsiella pneumoniae. Journal of Industrial
Microbiology & Biotechnology, 39(8), 1219-1226.
Weinstein, R. A., & Hooper, D. C. (2005). Efflux pumps and nosocomial
antibiotic resistance: A primer for hospital epidemiologists. Clinical
Infectious Diseases, 40(12), 1811-1817.
Whitchurch, C. B., Tolker-Nielsen, T., Ragas, P. C., & Mattick, J. S. (2002).
Extracellular DNA required for bacterial biofilm formation. Science,
295(5559), 1487.
Wiebe, H., Gurlebeck, D., Gross, J., et al. (2015). YjjQ represses transcription
of flhDC and additional loci in Escherichia coli. Journal of Bacteriology,
197(16), 2713-2720.
Wiegand, I., Hilpert, K., & Hancock, R. E. W. (2008). Agar and broth dilution
methods to determine the minimal inhibitory concentration (MIC) of
antimicrobial substances. Nature Protocols, 3(2), 163-175.
366 |
Wilkinson, M., Troman, L., Ismah, W. A. W. N., et al. (2016). Structural basis
for the inhibition of RecBCD by Gam and its synergistic antibacterial
effect with quinolones. eLife, 5, e22963.
Wilson, D. N. (2014). Ribosome-targeting antibiotics and mechanisms of
bacterial resistance. Nature Reviews Microbiology, 12(1), 35-48.
Wilson, M. L., & Gaido, L. (2004). Laboratory diagnosis of urinary tract
infections in adult patients. Clinical Infectious Diseases, 38(8), 1150-
1158.
Wimpenny, J., Manz, W., & Szewzyk, U. (2000). Heterogeneity in biofilms.
FEMS Microbiology Reviews, 24(5), 661-671.
Wolfaardt, G. M., Lawrence, J. R., Robarts, R. D., Caldwell, S. J., & Caldwell,
D. E. (1994). Multicellular organization in a degradative biofilm
community. Applied and Environmental Microbiology, 60(2), 434-446.
Wu, C. C., Huang, Y. J., Fung, C. P., & Peng, H. L. (2010). Regulation of the
Klebsiella pneumoniae Kpc fimbriae by the site-specific recombinase
KpcI. Microbiology, 156(7), 1983-1992.
Wu, M. C., Lin, T. L., Hsieh, P. F., Yang, H. C., & Wang, J. T. (2011). Isolation
of genes involved in biofilm formation of a Klebsiella pneumoniae strain
causing pyogenic liver abscess. PLOS ONE, 6(8), e23500.
Wu, X. R., Sun, T. T., & Medina, J. J. (1996). In vitro binding of type 1-
fimbriated Escherichia coli to uroplakins Ia and Ib: relation to urinary
tract infections. Proceedings of the National Academy of Sciences,
93(18), 9630-9635.
367 |
Yanisch-Perron, C., Vieira, J., & Messing, J. (1985). Improved M13 phage
cloning vectors and host strains: nucleotide sequences of the M13mp18
and pUC19 vectors. Gene, 33(1), 103-119.
Yigit, H., Queenan, A. M., Anderson, G. J., et al. (2001). Novel carbapenem-
hydrolyzing β-lactamase, KPC-1, from a carbapenem-resistant strain of
Klebsiella pneumoniae. Antimicrobial Agents and Chemotherapy,
45(4), 1151-1161.
Yinnon, A. M., Butnaru, A., Raveh, D., Jerassy, Z., & Rudensky, B. (1996).
Klebsiella bacteraemia: community versus nosocomial infection. QJM :
An International Journal of Medicine, 89(12), 933-941.
Yong, D., Toleman, M. A., Giske, C. G., et al. (2009). Characterization of a
new metallo-beta-lactamase gene, bla(NDM-1), and a novel
erythromycin esterase gene carried on a unique genetic structure in
Klebsiella pneumoniae sequence type 14 from India. Antimicrobial
Agents and Chemotherapy, 53(12), 5046-5054.
Zhang, Y., Li, P., Yin, Y., Li, F., & Zhang, Q. (2017). In vitro activity of
tigecycline in combination with rifampin, doripenem or ceftazidime
against carbapenem-resistant Klebsiella pneumoniae bloodstream
isolates. The Journal of Antibiotics, 70(2), 193-195.
Zhao, W.-H., & Hu, Z.-Q. (2013). Epidemiology and genetics of CTX-M
extended-spectrum β-lactamases in Gram-negative bacteria. Critical
Reviews in Microbiology, 39(1), 79-101.
Zheng, J.-x., Lin, Z.-w., Chen, C., et al. (2018). Biofilm formation in Klebsiella
pneumoniae bacteremia strains was found to be associated with CC23
and the presence of wcaG. Frontiers in Cellular and Infection
Microbiology, 8, 21.
368 |
Zhou, A., Kang, T. M., Yuan, J., et al. (2015). Synergistic interactions of
vancomycin with different antibiotics against Escherichia coli:
trimethoprim and nitrofurantoin display strong synergies with
vancomycin against wild-type E. coli. Antimicrobial Agents and
Chemotherapy, 59(1), 276-281.
Zogaj, X., Nimtz, M., Rohde, M., Bokranz, W., & Romling, U. (2001). The
multicellular morphotypes of Salmonella typhimurium and Escherichia
coli produce cellulose as the second component of the extracellular
matrix. Molecular Microbiology, 39(6), 1452-1463.
Zweig, M., Schork, S., Koerdt, A., et al. (2014). Secreted single-stranded DNA
is involved in the initial phase of biofilm formation by Neisseria
gonorrhoeae. Environmental Microbiology, 16(4), 1040-1052.

369 |
Appendices
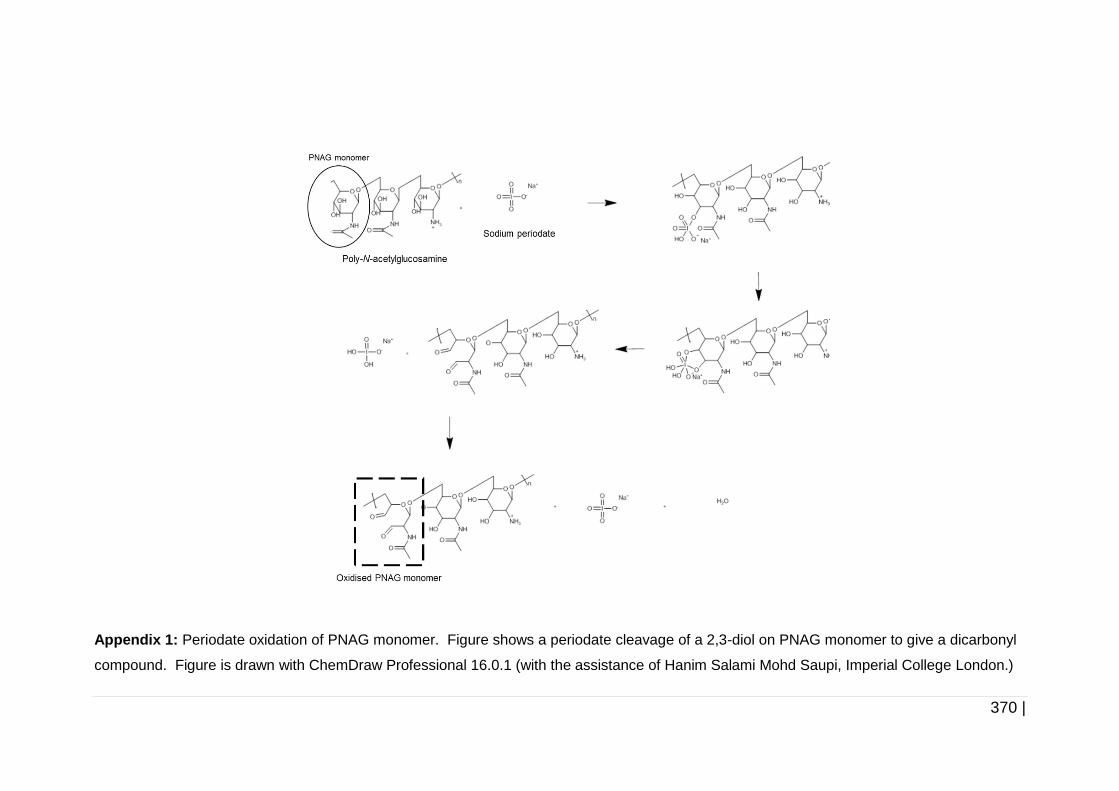
370 |
Appendix 1: Periodate oxidation of PNAG monomer. Figure shows a periodate cleavage of a 2,3-diol on PNAG monomer to give a dicarbonyl
compound. Figure is drawn with ChemDraw Professional 16.0.1 (with the assistance of Hanim Salami Mohd Saupi, Imperial College London.)
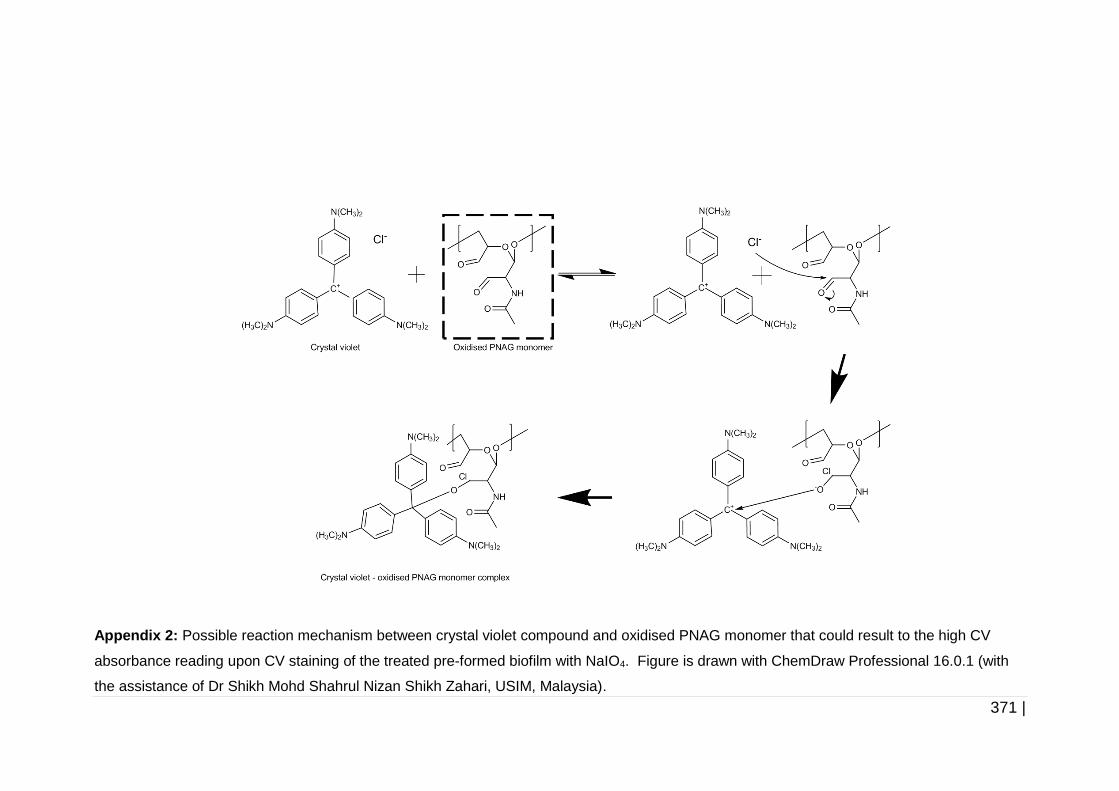
371 |
Appendix 2: Possible reaction mechanism between crystal violet compound and oxidised PNAG monomer that could result to the high CV
absorbance reading upon CV staining of the treated pre-formed biofilm with NaIO4. Figure is drawn with ChemDraw Professional 16.0.1 (with
the assistance of Dr Shikh Mohd Shahrul Nizan Shikh Zahari, USIM, Malaysia).
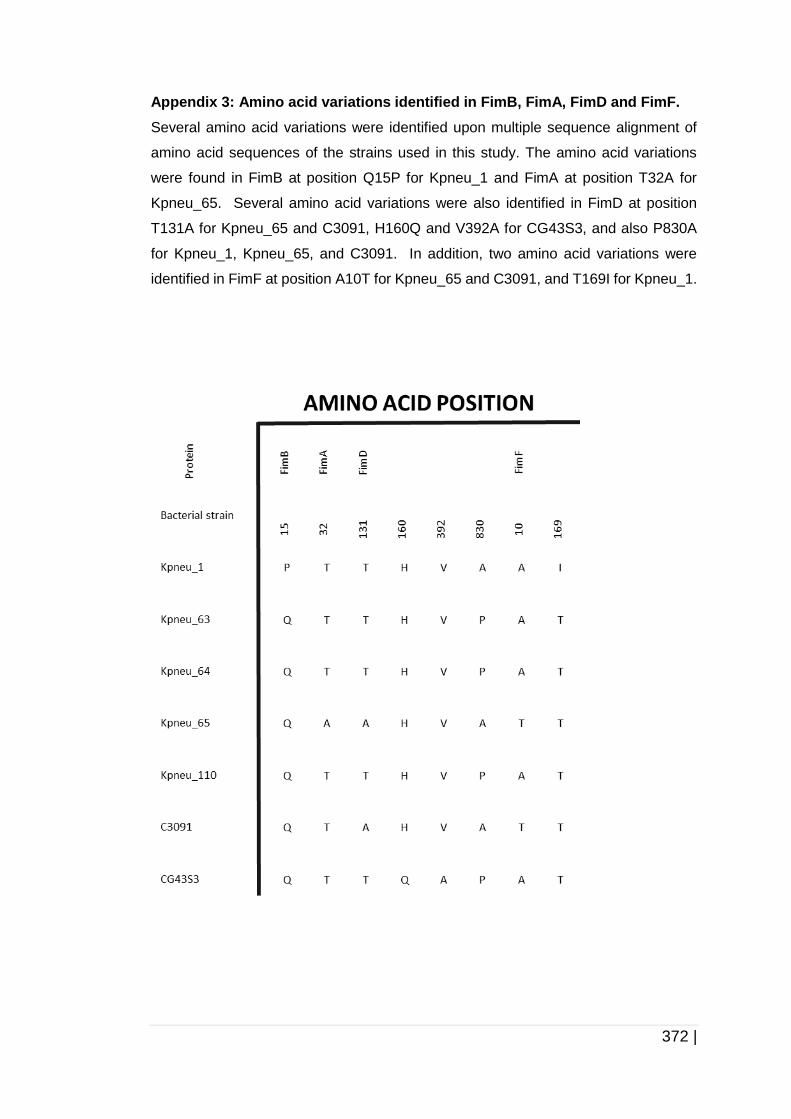
372 |
Appendix 3: Amino acid variations identified in FimB, FimA, FimD and FimF.
Several amino acid variations were identified upon multiple sequence alignment of
amino acid sequences of the strains used in this study. The amino acid variations
were found in FimB at position Q15P for Kpneu_1 and FimA at position T32A for
Kpneu_65. Several amino acid variations were also identified in FimD at position
T131A for Kpneu_65 and C3091, H160Q and V392A for CG43S3, and also P830A
for Kpneu_1, Kpneu_65, and C3091. In addition, two amino acid variations were
identified in FimF at position A10T for Kpneu_65 and C3091, and T169I for Kpneu_1.
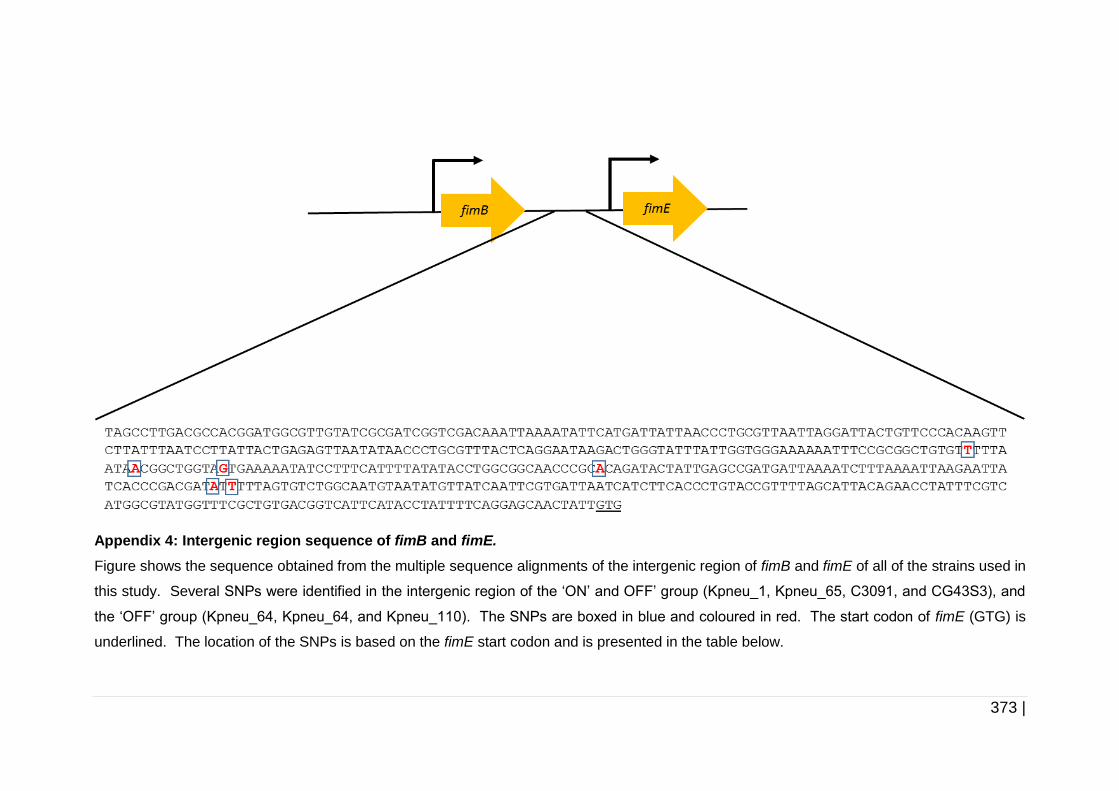
373 |
Appendix 4: Intergenic region sequence of fimB and fimE.
Figure shows the sequence obtained from the multiple sequence alignments of the intergenic region of fimB and fimE of all of the strains used in
this study. Several SNPs were identified in the intergenic region of the ‘ON’ and OFF’ group (Kpneu_1, Kpneu_65, C3091, and CG43S3), and
the ‘OFF’ group (Kpneu_64, Kpneu_64, and Kpneu_110). The SNPs are boxed in blue and coloured in red. The start codon of fimE (GTG) is
underlined. The location of the SNPs is based on the fimE start codon and is presented in the table below.
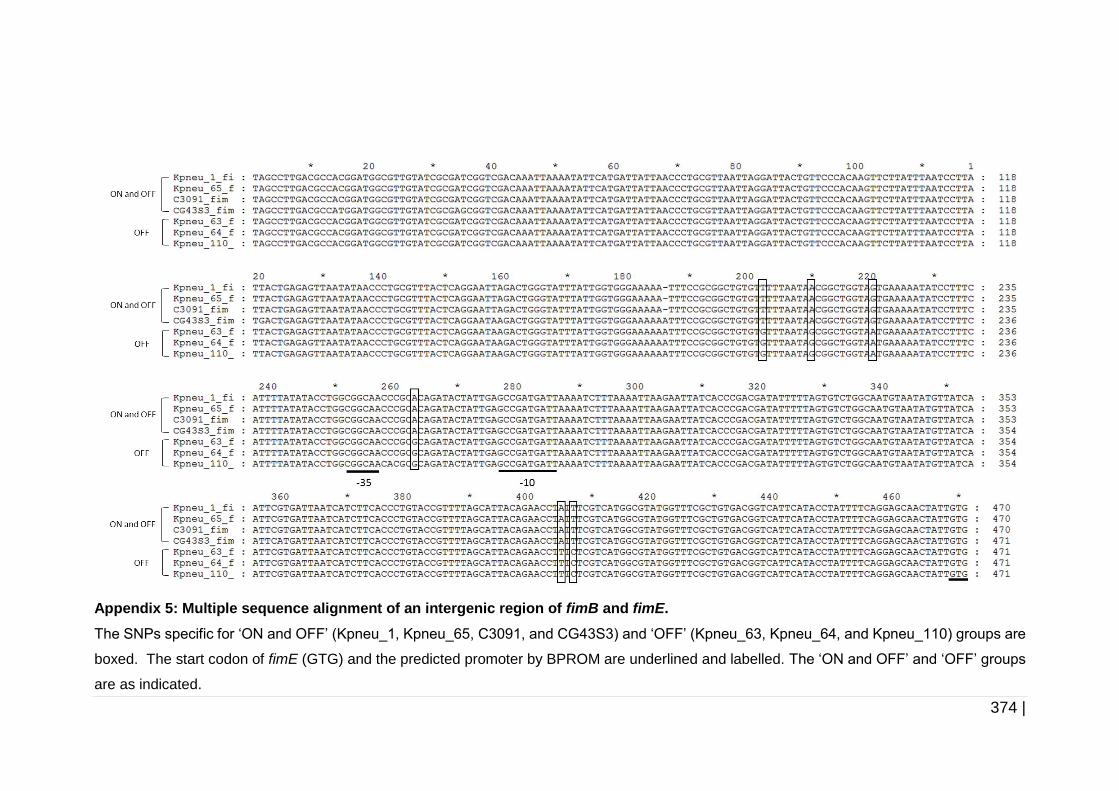
374 |
Appendix 5: Multiple sequence alignment of an intergenic region of fimB and fimE.
The SNPs specific for ‘ON and OFF’ (Kpneu_1, Kpneu_65, C3091, and CG43S3) and ‘OFF’ (Kpneu_63, Kpneu_64, and Kpneu_110) groups are
boxed. The start codon of fimE (GTG) and the predicted promoter by BPROM are underlined and labelled. The ‘ON and OFF’ and ‘OFF’ groups
are as indicated.
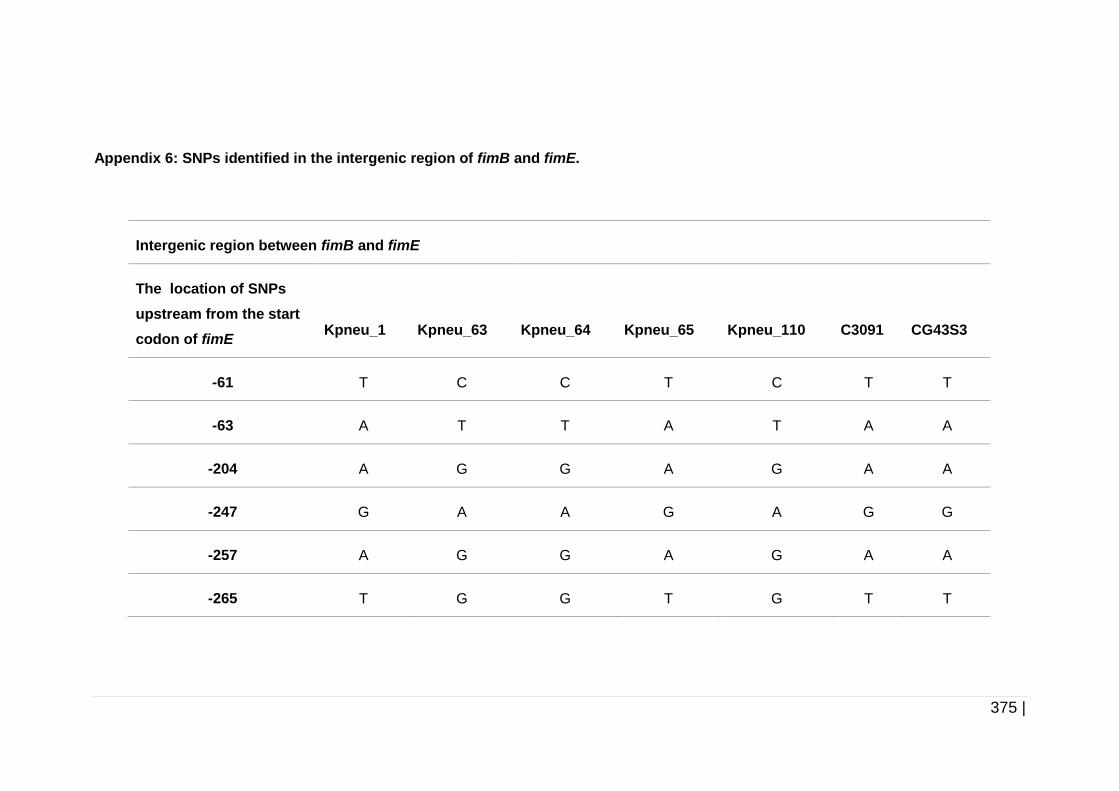
375 |
Appendix 6: SNPs identified in the intergenic region of fimB and fimE.
Intergenic region between fimB and fimE
The location of SNPs
upstream from the start
codon of fimE
Kpneu_1
Kpneu_63
Kpneu_64
Kpneu_65
Kpneu_110
C3091
CG43S3
-61 T C C T C T T
-63 A T T A T A A
-204 A G G A G A A
-247 G A A G A G G
-257 A G G A G A A
-265 T G G T G T T
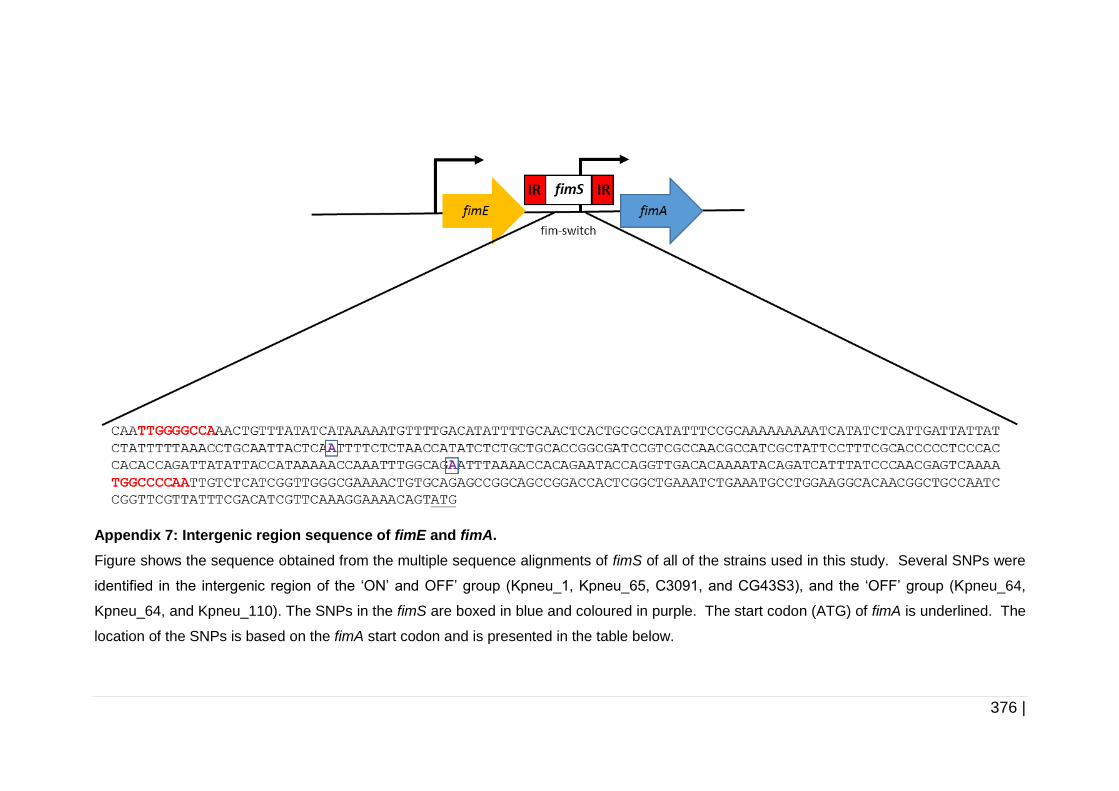
376 |
Appendix 7: Intergenic region sequence of fimE and fimA.
Figure shows the sequence obtained from the multiple sequence alignments of fimS of all of the strains used in this study. Several SNPs were
identified in the intergenic region of the ‘ON’ and OFF’ group (Kpneu_1, Kpneu_65, C3091, and CG43S3), and the ‘OFF’ group (Kpneu_64,
Kpneu_64, and Kpneu_110). The SNPs in the fimS are boxed in blue and coloured in purple. The start codon (ATG) of fimA is underlined. The
location of the SNPs is based on the fimA start codon and is presented in the table below.
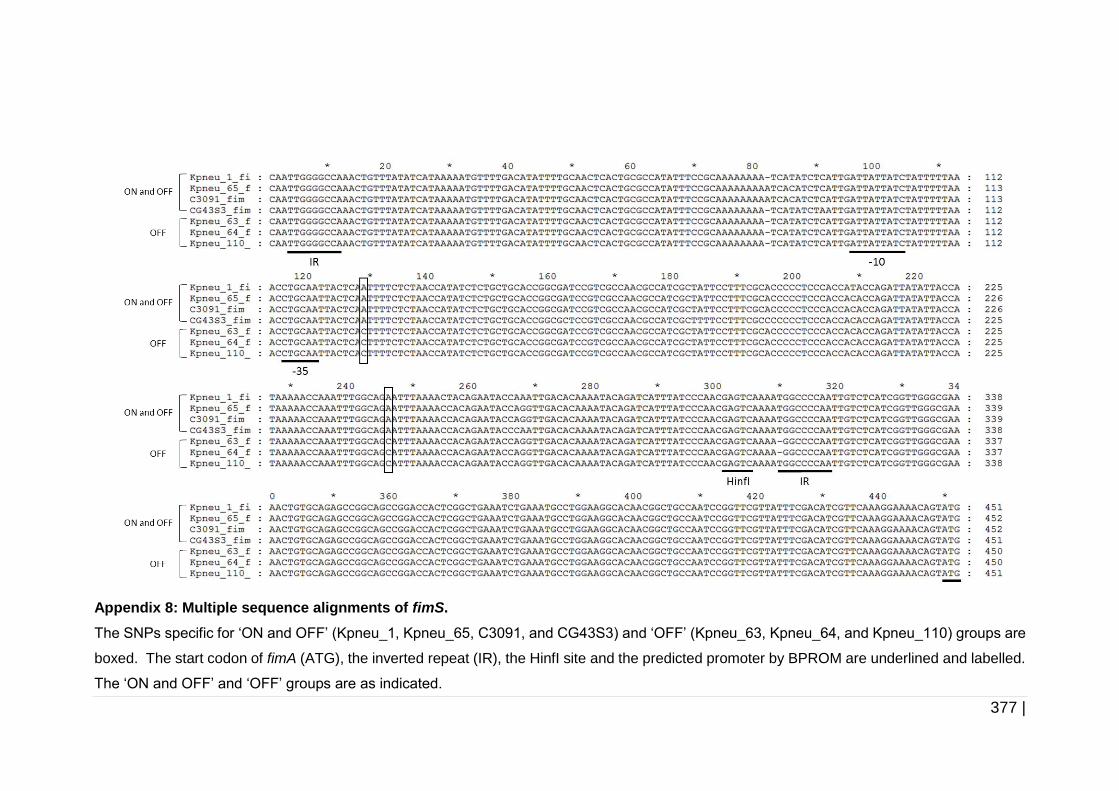
377 |
Appendix 8: Multiple sequence alignments of fimS.
The SNPs specific for ‘ON and OFF’ (Kpneu_1, Kpneu_65, C3091, and CG43S3) and ‘OFF’ (Kpneu_63, Kpneu_64, and Kpneu_110) groups are
boxed. The start codon of fimA (ATG), the inverted repeat (IR), the HinfI site and the predicted promoter by BPROM are underlined and labelled.
The ‘ON and OFF’ and ‘OFF’ groups are as indicated.
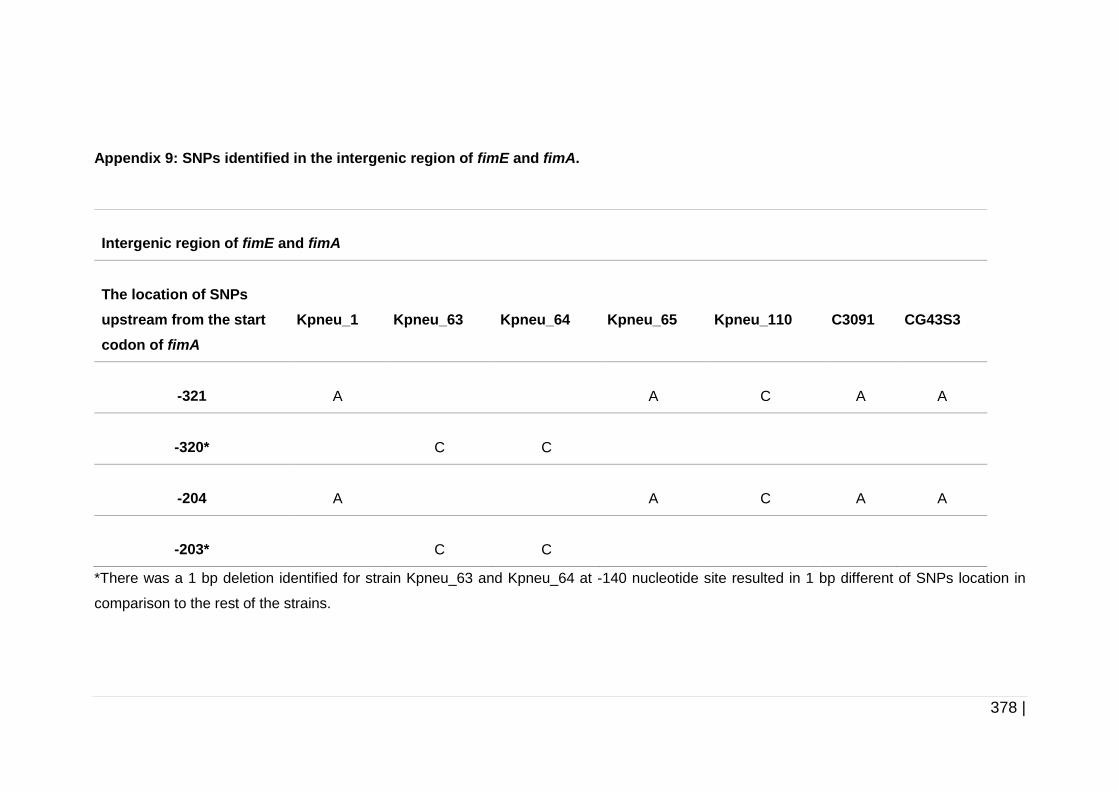
378 |
Appendix 9: SNPs identified in the intergenic region of fimE and fimA.
*There was a 1 bp deletion identified for strain Kpneu_63 and Kpneu_64 at -140 nucleotide site resulted in 1 bp different of SNPs location in
comparison to the rest of the strains.
Intergenic region of fimE and fimA
The location of SNPs
upstream from the start
codon of fimA
Kpneu_1
Kpneu_63
Kpneu_64
Kpneu_65
Kpneu_110
C3091
CG43S3
-321
A
A
C
A
A
-320*
C
C
-204
A
A
C
A
A
-203*
C
C
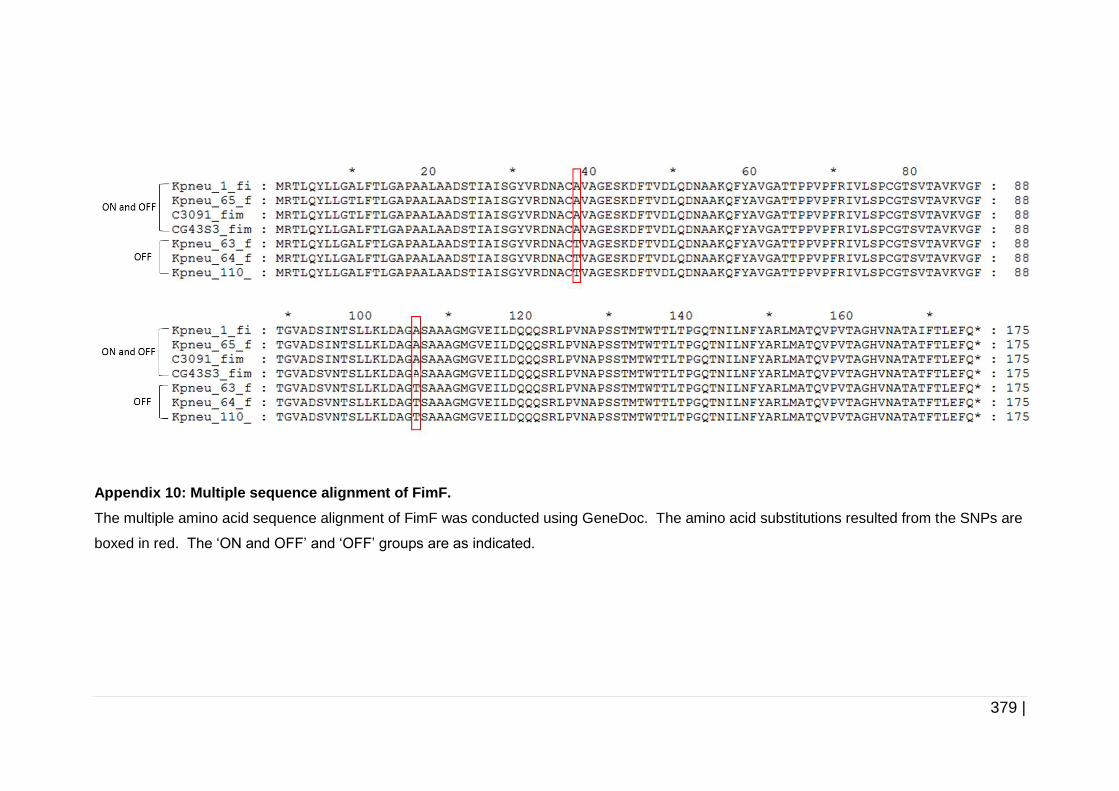
379 |
Appendix 10: Multiple sequence alignment of FimF.
The multiple amino acid sequence alignment of FimF was conducted using GeneDoc. The amino acid substitutions resulted from the SNPs are
boxed in red. The ‘ON and OFF’ and ‘OFF’ groups are as indicated.
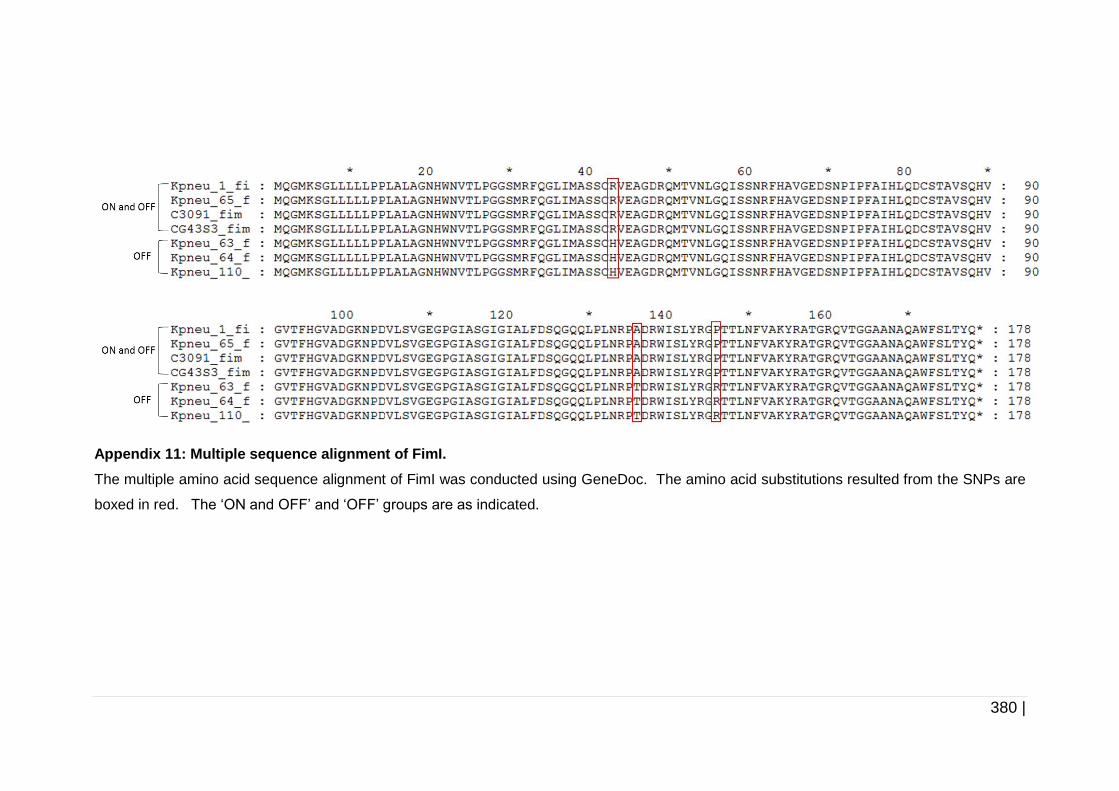
380 |
Appendix 11: Multiple sequence alignment of FimI.
The multiple amino acid sequence alignment of FimI was conducted using GeneDoc. The amino acid substitutions resulted from the SNPs are
boxed in red. The ‘ON and OFF’ and ‘OFF’ groups are as indicated.
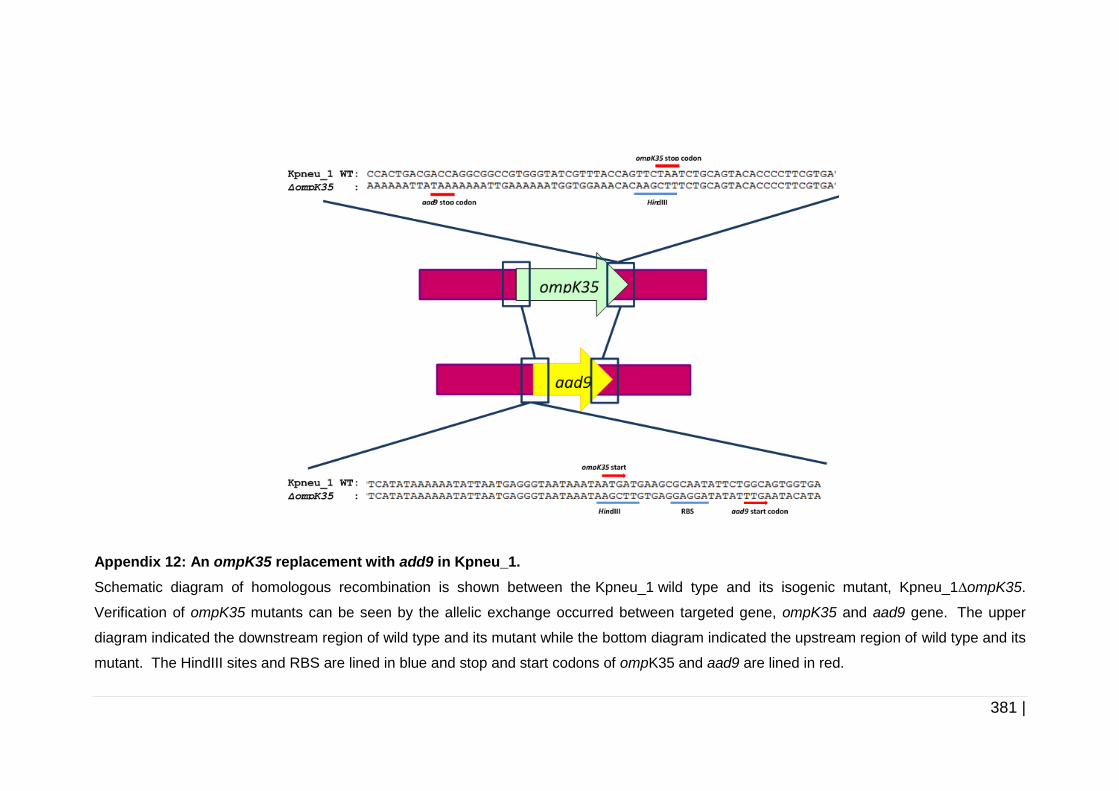
381 |
Appendix 12: An ompK35 replacement with add9 in Kpneu_1.
Schematic diagram of homologous recombination is shown between the Kpneu_1 wild type and its isogenic mutant, Kpneu_1∆ompK35.
Verification of ompK35 mutants can be seen by the allelic exchange occurred between targeted gene, ompK35 and aad9 gene. The upper
diagram indicated the downstream region of wild type and its mutant while the bottom diagram indicated the upstream region of wild type and its
mutant. The HindIII sites and RBS are lined in blue and stop and start codons of ompK35 and aad9 are lined in red.
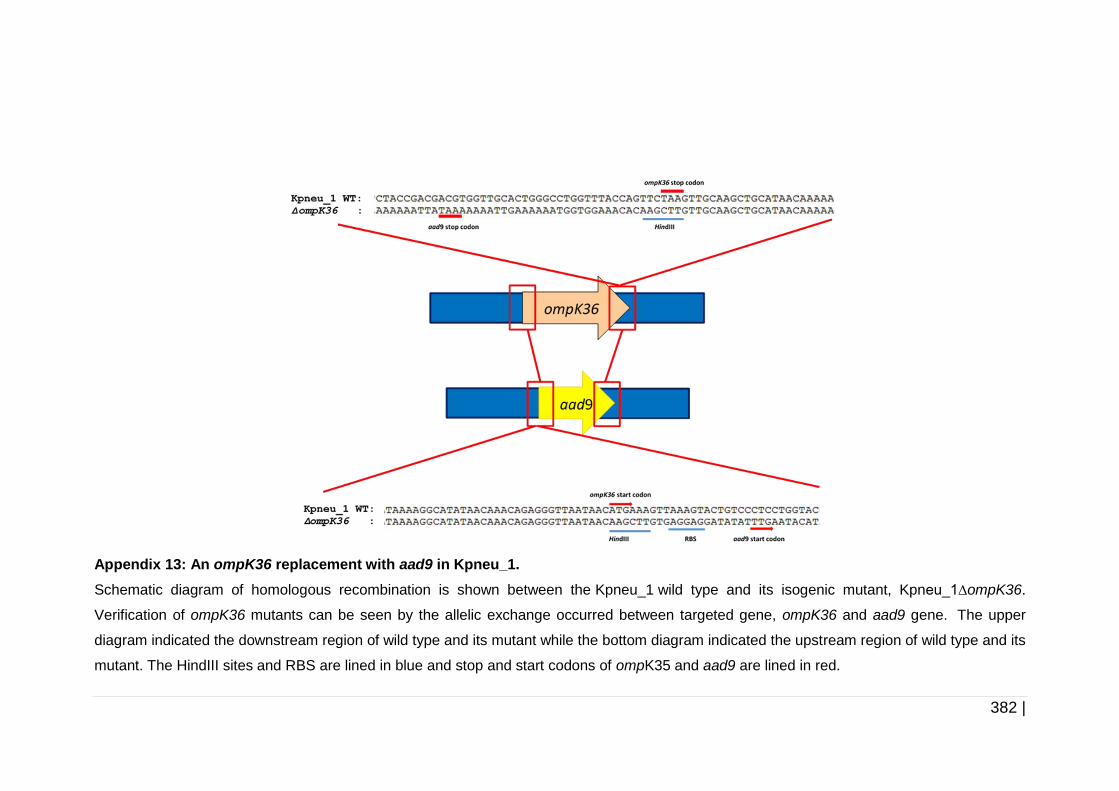
382 |
Appendix 13: An ompK36 replacement with aad9 in Kpneu_1.
Schematic diagram of homologous recombination is shown between the Kpneu_1 wild type and its isogenic mutant, Kpneu_1∆ompK36.
Verification of ompK36 mutants can be seen by the allelic exchange occurred between targeted gene, ompK36 and aad9 gene. The upper
diagram indicated the downstream region of wild type and its mutant while the bottom diagram indicated the upstream region of wild type and its
mutant. The HindIII sites and RBS are lined in blue and stop and start codons of ompK35 and aad9 are lined in red.
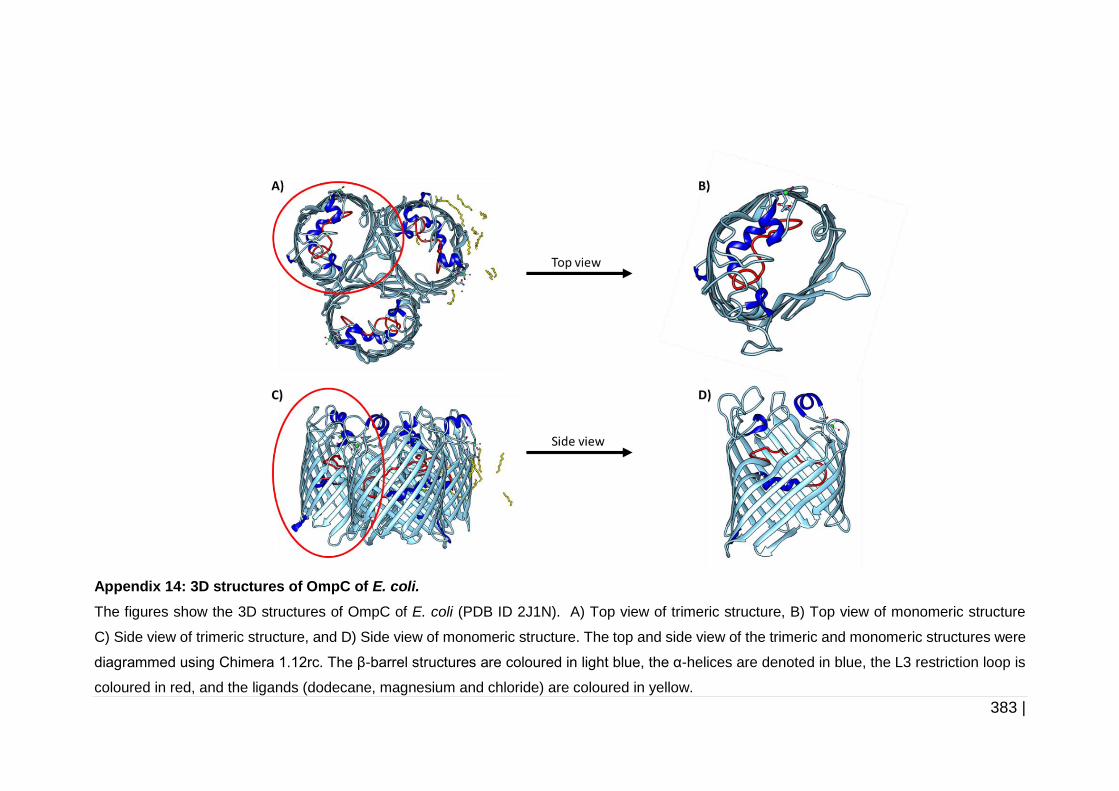
383 |
Appendix 14: 3D structures of OmpC of E. coli.
The figures show the 3D structures of OmpC of E. coli (PDB ID 2J1N). A) Top view of trimeric structure, B) Top view of monomeric structure
C) Side view of trimeric structure, and D) Side view of monomeric structure. The top and side view of the trimeric and monomeric structures were
diagrammed using Chimera 1.12rc. The β-barrel structures are coloured in light blue, the α-helices are denoted in blue, the L3 restriction loop is
coloured in red, and the ligands (dodecane, magnesium and chloride) are coloured in yellow.
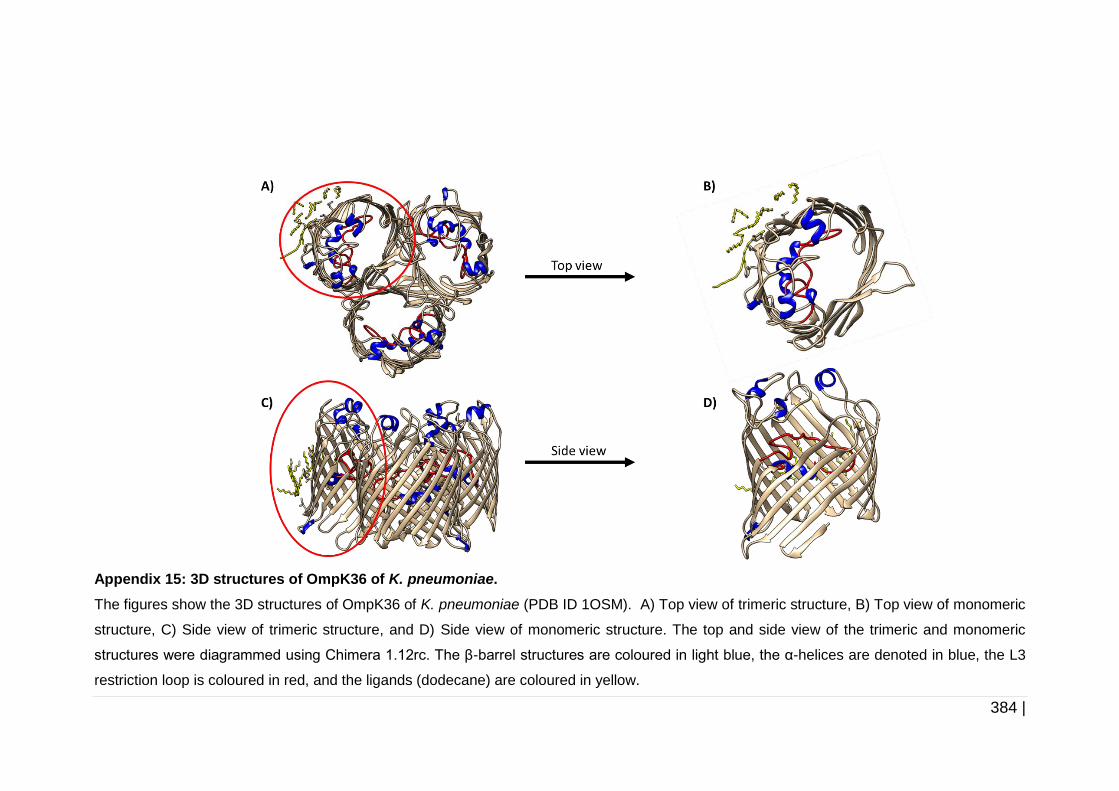
384 |
Appendix 15: 3D structures of OmpK36 of K. pneumoniae.
The figures show the 3D structures of OmpK36 of K. pneumoniae (PDB ID 1OSM). A) Top view of trimeric structure, B) Top view of monomeric
structure, C) Side view of trimeric structure, and D) Side view of monomeric structure. The top and side view of the trimeric and monomeric
structures were diagrammed using Chimera 1.12rc. The β-barrel structures are coloured in light blue, the α-helices are denoted in blue, the L3
restriction loop is coloured in red, and the ligands (dodecane) are coloured in yellow.
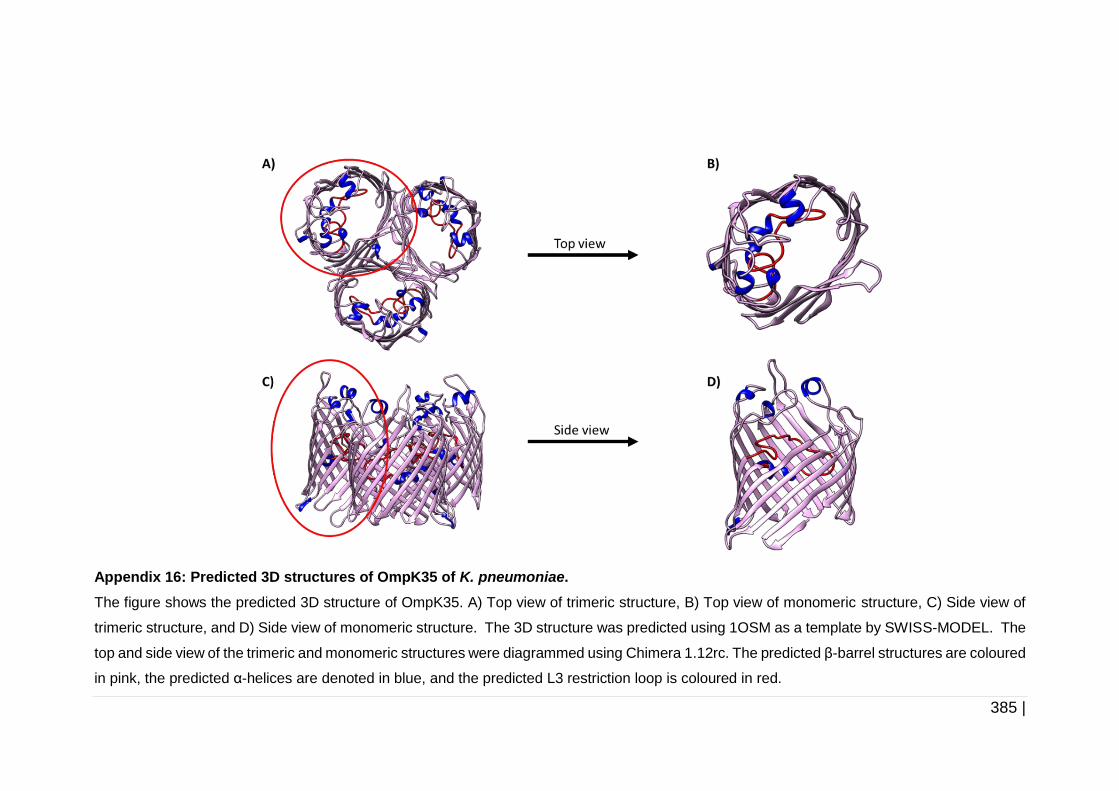
385 |
Appendix 16: Predicted 3D structures of OmpK35 of K. pneumoniae.
The figure shows the predicted 3D structure of OmpK35. A) Top view of trimeric structure, B) Top view of monomeric structure, C) Side view of
trimeric structure, and D) Side view of monomeric structure. The 3D structure was predicted using 1OSM as a template by SWISS-MODEL. The
top and side view of the trimeric and monomeric structures were diagrammed using Chimera 1.12rc. The predicted β-barrel structures are coloured
in pink, the predicted α-helices are denoted in blue, and the predicted L3 restriction loop is coloured in red.
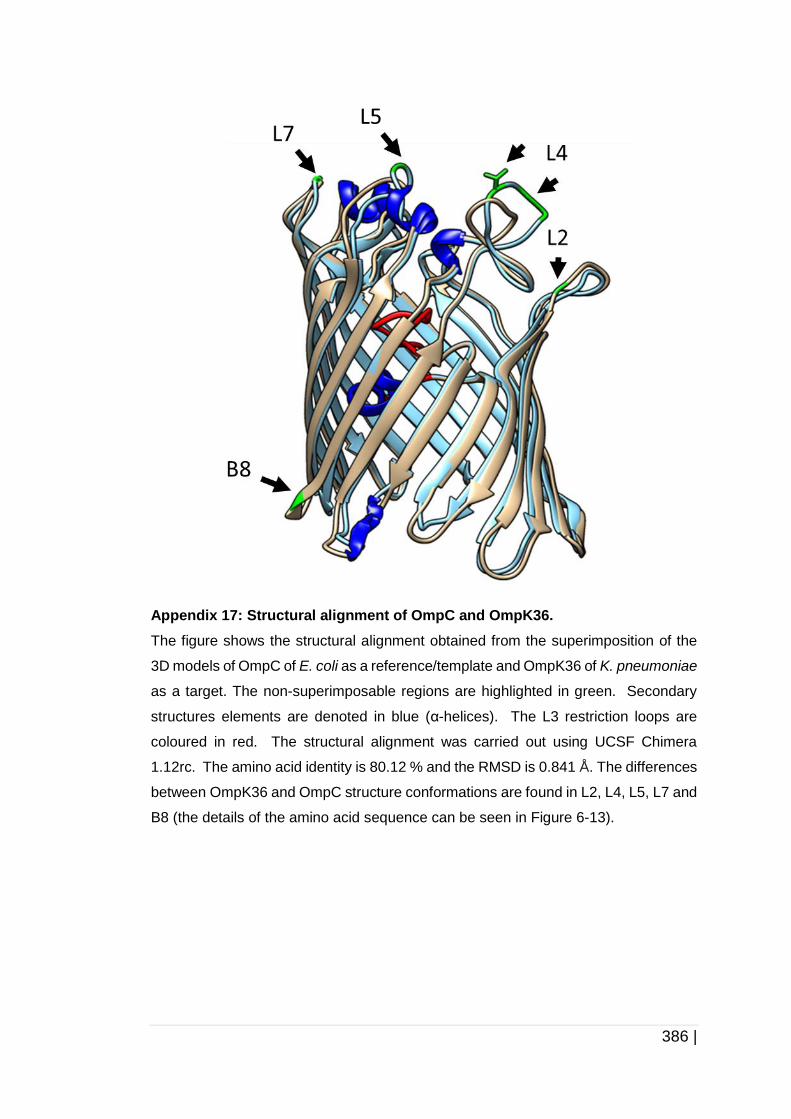
386 |
Appendix 17: Structural alignment of OmpC and OmpK36.
The figure shows the structural alignment obtained from the superimposition of the
3D models of OmpC of E. coli as a reference/template and OmpK36 of K. pneumoniae
as a target. The non-superimposable regions are highlighted in green. Secondary
structures elements are denoted in blue (α-helices). The L3 restriction loops are
coloured in red. The structural alignment was carried out using UCSF Chimera
1.12rc. The amino acid identity is 80.12 % and the RMSD is 0.841 Å. The differences
between OmpK36 and OmpC structure conformations are found in L2, L4, L5, L7 and
B8 (the details of the amino acid sequence can be seen in Figure 6-13).
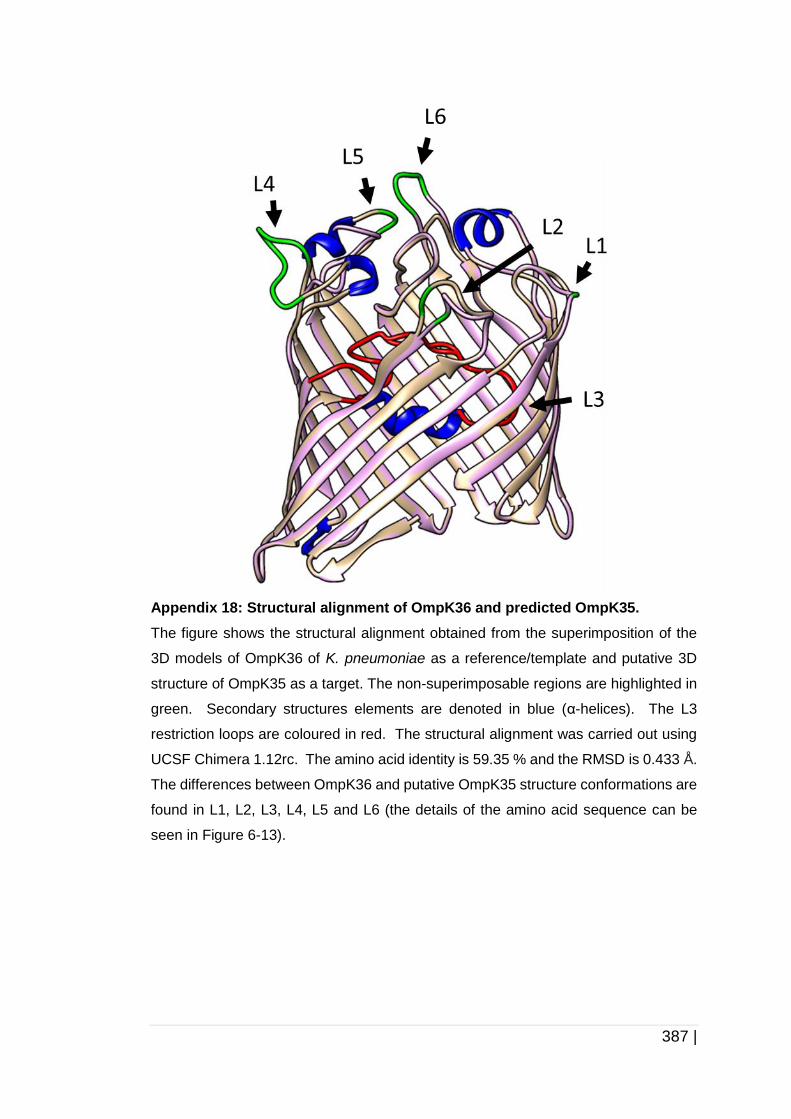
387 |
Appendix 18: Structural alignment of OmpK36 and predicted OmpK35.
The figure shows the structural alignment obtained from the superimposition of the
3D models of OmpK36 of K. pneumoniae as a reference/template and putative 3D
structure of OmpK35 as a target. The non-superimposable regions are highlighted in
green. Secondary structures elements are denoted in blue (α-helices). The L3
restriction loops are coloured in red. The structural alignment was carried out using
UCSF Chimera 1.12rc. The amino acid identity is 59.35 % and the RMSD is 0.433 Å.
The differences between OmpK36 and putative OmpK35 structure conformations are
found in L1, L2, L3, L4, L5 and L6 (the details of the amino acid sequence can be
seen in Figure 6-13).


