Embed Size (px)
Citation preview

Available online at www.sciencedirect.com
www.elsevier.com/locate/gca
Geochimica et Cosmochimica Acta 71 (2007) 5956–5967
Investigation of the protein osteocalcin of Camelops hesternus:Sequence, structure and phylogenetic implications
James F. Humpula a, Peggy H. Ostrom a,*, Hasand Gandhi a, John R. Strahler b,Angela K. Walker b, Thomas W. Stafford Jr. c, James J. Smith d,Michael R. Voorhies e, R. George Corner e, Phillip C. Andrews b
a Department of Zoology, Michigan State University, East Lansing, MI 48824, USAb Department of Biological Chemistry, University of Michigan, Ann Arbor, MI 48109, USA
c Stafford Research Labs, 200 Acadia Avenue, Lafayette, CO 80026, USAd Department of Entomology and Lymann Briggs College, Michigan State University, East Lansing, MI 48824, USA
e University of Nebraska State Museum, Lincoln, NE 68588, USA
Received 14 June 2007; accepted in revised form 10 September 2007; available online 22 September 2007
Abstract
Ancient DNA sequences offer an extraordinary opportunity to unravel the evolutionary history of ancient organisms. Pro-tein sequences offer another reservoir of genetic information that has recently become tractable through the application ofmass spectrometric techniques. The extent to which ancient protein sequences resolve phylogenetic relationships, however,has not been explored. We determined the osteocalcin amino acid sequence from the bone of an extinct Camelid (21 ka, Came-
lops hesternus) excavated from Isleta Cave, New Mexico and three bones of extant camelids: bactrian camel (Camelus bac-
trianus); dromedary camel (Camelus dromedarius) and guanaco (Llama guanacoe) for a diagenetic and phylogeneticassessment. There was no difference in sequence among the four taxa. Structural attributes observed in both modern andancient osteocalcin include a post-translation modification, Hyp9, deamidation of Gln35 and Gln39, and oxidation ofMet36. Carbamylation of the N-terminus in ancient osteocalcin may result in blockage and explain previous difficulties insequencing ancient proteins via Edman degradation.
A phylogenetic analysis using osteocalcin sequences of 25 vertebrate taxa was conducted to explore osteocalcin proteinevolution and the utility of osteocalcin sequences for delineating phylogenetic relationships. The maximum likelihood treeclosely reflected generally recognized taxonomic relationships. For example, maximum likelihood analysis recovered rodents,birds and, within hominins, the Homo-Pan-Gorilla trichotomy. Within Artiodactyla, character state analysis showed that asubstitution of Pro4 for His4 defines the Capra-Ovis clade within Artiodactyla. Homoplasy in our analysis indicated that oste-ocalcin evolution is not a perfect indicator of species evolution. Limited sequence availability prevented assigning functionalsignificance to sequence changes. Our preliminary analysis of osteocalcin evolution represents an initial step towards a com-plete character analysis aimed at determining the evolutionary history of this functionally significant protein. We emphasizethat ancient protein sequencing and phylogenetic analyses using amino acid sequences must pay close attention to post-trans-lational modifications, amino acid substitutions due to diagenetic alteration and the impacts of isobaric amino acids on massshifts and sequence alignments.� 2007 Elsevier Ltd. All rights reserved.
0016-7037/$ - see front matter � 2007 Elsevier Ltd. All rights reserved.
doi:10.1016/j.gca.2007.09.003
* Corresponding author. Fax: +1 517 432 2789.E-mail address: [email protected] (P.H. Ostrom).
1. INTRODUCTION
Due to their taxonomic specificity and ability to addressevolutionary questions, nucleic acids could be consideredthe ultimate biomarker. Yet, relative to other biomolecules,

Camelops Osteocalcin Sequence and phylogenetic implications 5957
DNA is not stable, suggesting temporal limits on our win-dow into the past (Collins et al., 2000). Pyrosequencingtechniques, aimed at identifying short nucleotide fragments,assist us in emerging from this time trap (Poinar et al.,2005). In addition, mineral associated proteins, arguablymore stable than DNA, may also extend the fossil geneticrecord (Collins et al., 2000). In the past 5 years, literatureon ancient protein sequences has increased with the firstcomplete sequence for the bone protein osteocalcin for a> 55 ka fossil reported in 2002 (Nielsen-Marsh et al.,2002) and sequences of collagen peptides from a 68 Madinosaur presented in 2007 (Asara et al., 2007). An impor-tant next step is to implement protein sequencing in a phy-logenetic analysis to enhance our understanding ofevolutionary relationships of extinct taxa. Consequently,we examined the ability of osteocalcin to provide phyloge-netic information for an extinct camelid and modern mem-bers of the family Camilidae.
The family Camelidae (order Artiodactyla) originatedduring the early Tertiary of North America. Camelids arecharacterized by a lack of horns, long slender necks, andlong limbs with a much-reduced ulna and fibula (Kurtenand Anderson, 1980). Most camelid evolution occurred inNorth America, with both camels and llamas being com-mon during the Pleistocene (Kurten and Anderson, 1980;Lange, 2002). North American camelids became extinct atthe end of the Pleistocene, ca. 11,000–12,000 years BP.The extant family Camelidae comprises two tribes, Laminiand Camelini, both of which split from a common ancestorapproximately 11 Ma ago (Webb, 1974). Lamini andCamelini comprise four New World species and two OldWorld species, respectively (Webb, 1974).
The genus Camelops, contains five separate species thatexisted in northern North America between 2 million and11,000–12,000 years ago (Savage, 1951; Stuart, 1991). Thesespecies are grouped into two subsets based on size and den-tal characters. The larger of the two groups includes the ex-tinct species Camelops hesternus and Camelops heurfanensis
(Savage, 1951). C. hesternus, or Yesterday’s Camel, first ap-peared 300,000 years ago, and was abundant throughoutthe western United States, the Yukon, and Alaska (Kurtenand Anderson, 1980). For unknown reasons, it went extinctbetween 12,600 and 10,800 years ago. Similar in relativeproportion to the modern dromedary camel, Camelus drom-
edarius, the legs of C. hesternus were approximately 20%longer than C. dromedarius. C. heurfanensis is very similarto C. hesternus, and is differentiated from the other largeCamelops species by the location of the post-palatine fora-men and the arrangement of the placement of the lowerborder of the mandible from the symphysis to a point belowthe last molar (Savage, 1951).
Osteocalcin, also known as Bone Gla Protein or BGP, isa 46–50 amino acid long acidic protein whose potential forsurvival is attributed to its high affinity for hydroxyapatite(Hauschka et al., 1989; Lian et al., 1989; Cancela et al.,1995). Osteocalcin’s conserved region contains a singledisulfide bridge connecting amino acids 23 and 29 and, inall but one species, has three c-carboxyglutamic acid(Gla) residues at positions 17, 21, and 24 (Hauschkaet al., 1989). The marine fish Argyrosomus regius also con-
tains Gla25 (Frazao et al., 2005). The Gla residues and thedisulfide bridge are key factors in the stabilization of oste-ocalcin and in maintaining its association with the hydroxy-apatite mineral phase (Hoang et al., 2003).
Evolutionary comparisons between osteocalcin se-quences have been explored, but very little work has beendone to determine osteocalcin’s taxonomic level of resolu-tion (Nielsen-Marsh et al., 2002; Laize et al., 2005). Fur-thermore, the strength of the hypothesized phylogeneticrelationships derived from osteocalcin sequences is un-known. To address these issues, a phylogenetic analysis ofderived osteocalcin sequences should be compared to a ro-bust, well-supported DNA-based phylogeny. Zardoya andMeyer (1996) determined the level of performance of allmitochondrial protein-coding regions in returning two ex-pected topologies. Cytochrome b was one of the highestperforming mtDNA-coding sequences found, and thereforeappropriate for evaluating the phylogenetic efficacy ofusing osteocalcin protein sequences.
The osteocalcin sequence for C. hesternus, modern cam-els (Camelus bactrianus and C. dromedarius) and guanaco(Llama guanacoe) were determined by MALDI-MS (ma-trix-assisted laser desorption ionization mass spectrome-try). The evolution of osteocalcin within the OrderArtiodactyla was investigated and a phylogenetic analysisof osteocalcin based on 24 species of vertebrates was per-formed. Comparisons between the phylogenies based onosteocalcin sequence data and phylogenies based on Nd4,Nd5, and Cytochrome b allow an assessment of the degreeof phylogenetic resolution and examination of specific phy-logenetic relationships exhibited in the osteocalcin tree.
2. MATERIALS AND METHODS
2.1. Sample description
A metapodial from a Camelus bactrianus (modern bac-trian camel) (MSU-9669) and the right femur of Llama
guanacoe (UM 157201) were obtained from Michigan StateUniversity Museum and University of Michigan, respec-tively. A vertebral fragment of dromedary camel (Camelus
dromedarius) (AMNH 10734) was obtained from the Amer-ican Museum of Natural History. The University of Ne-braska State Museum provided a phalanx of Camelops
hesternus from Isleta Cave, New Mexico, which was AMS14C dated as 21,190 ± 110 RC years (CAMS-22182) byStafford Research Laboratories. The Isleta Cave site con-sists of two caves located within a Quaternary lava flowapproximately 13 km west of Isleta, New Mexico, at an ele-vation of 1716 m. The fossil assemblage within the cavesconsists of 42 mammal genera and 6 reptile genera (Harrisand Findley, 1964).
2.2. Purification/digestion
The mechanically cleaned and powdered sample (20–50 mg; �190 �C, CertiPrep 6750 SPEX freezer/mill) wasdemineralized with sodium EDTA (0.5 M; pH 8.0; 4 h at25 �C), centrifuged (14,000 rpm, 10 min) and the resultingsupernatant applied to a fresh C18 gravity column (60 A,

5958 J.F. Humpula et al. / Geochimica et Cosmochimica Acta 71 (2007) 5956–5967
Fisher, 0.5 · 2 cm). The column was eluted with eight, 1 mLaliquots of a mixture of solvent A (94.9% water, 5% aceto-nitrile, 0.1% TFA) and solvent B (89.9% acetonitrile, 10%water, 0.1% TFA), with increasing concentration of solventB (20%, 25%, 30%, 32%, 34%, 36%, 38%, and 40%). Theeluent from each of the eight fractions was collected, con-centrated (Speedvac, Eppendorff), and reconstituted using10 lL of 1% n-octyl-b-D-glucopyranoside (OGP, Sigma) in50 mM Tris–HCl, pH 8.0. The reconstituted eluent was di-luted 1:10 with solvent A and 0.5 lL was spotted on aMALDI target, with 0.5 lL of a 1% solution of triflouro-acetic acid (TFA, Sigma) and 0.5 lL of a saturated solutionof CHCA (a-cyano-4-hydroxycinnamic acid) matrix in 1:1acetonitrile and 0.1% TFA. MALDI-MS spectra were ac-quired with an ABI-STR operated in linear mode. Spectrawere used to identify gravity column fractions that con-tained a peak consistent with the m/z of osteocalcin(�5.7 kDa) (Hauschka et al., 1989).
Osteocalcin was purified using reversed phase high per-formance liquid chromatography (rpHPLC) fitted with aC18 trap (1 · 10 mm, Michrom BioResources) and a1 · 150 mm C18 column (300 A, 5 lm, Reliasil, MichromBioResources) (Nielsen-Marsh et al., 2002). The C18 trapwas equilibrated with 20% solvent B, the sample injected,the trap washed with 300 lL of solvent A, and the flowfrom the trap diverted to the column. Osteocalcin waseluted with a gradient of 20% solvent B, increased to 30%solvent B over 15 min, held at 30% solvent B for 5 min, in-creased to 35% solvent B over 15 min, held at 35% solvent Bfor 10 min, increased to 95% solvent B over 5 min, and heldfor 5 min. All peaks were collected and MALDI-MS wasused to identify putative osteocalcin.
Peaks from the rpHPLC containing putative osteocalcinwere dried, reconstituted with 10 lL of 1% OGP in 50 mMTris–HCl, pH 8.0, and digested with Trypsin (Promega) orASP-N (Sigma). The digest products were purified usingrpHPLC (gradient: 5% solvent B, increased to 40% solventB over 40 min, held at 40% solvent B for 10 min, increasedto 95% solvent B over 1 min, held at 95% solvent B for5 min, and decreased to 5% solvent B over 1 min) and ana-lyzed using MALDI-MS.
Peptide disulfide bonds were reduced with tricarboxyethylphosphine (TCEP, 5 mM; 1 h at 60 �C) and cysteines blockedwith methyl methane thiosulfonate (MMTS,10 mM; 10 min,room temperature). Peptide hydroxyl groups were formylat-ed by incubation with 98% formic acid at room temperaturefor 24 h. Oxidized methionine was reduced with ethanedith-iol and bromotrimethylsilane.
2.3. MALDI-MS and Edman sequencing
MALDI-MS was performed on intact osteocalcin anddigest products using an ABI-STR (linear mode) and anABI-4800 TOFTOF (reflectron mode). Tandem mass spec-trometry (MS/MS) was performed on digest products usingthe ABI-4800 TOFTOF (ABI/MDS Sciex). Ions from theABI-STR are average m/z and reported as nominal masswhile those from the ABI-4800 TOFTOF are monoisotopicand reported to one decimal place. Spectra of intact osteo-calcin obtained on the ABI-STR were externally calibrated
using the 1+ and 2+ peaks of bovine insulin (average mass5734.6 and 2867.8, respectively; Sigma). Resolution was ca.530 and mass accuracy at m/z of 2800 was better than353 ppm (range 4–353 ppm).
MALDI-MS spectra obtained on the ABI-4800 TOF-TOF were acquired using 1500–3000 laser shots. Spectraof intact osteocalcin were externally calibrated using the[M+H]+1 and [M+2H]+2 of bovine insulin (monoisotopicmass 5730.6 and 2865.8, respectively, Sigma) and its b chain(monoisotopic mass 3495.9). Resolution was ca. 13,000 andmass accuracy was better than 34 ppm (range 9–34 ppm).MS/MS spectra were obtained using 2000–8000 laser shots,and were calibrated using fragmentation of angiotensin II(human). External calibration of MS/MS spectra was doneusing the Mass Standards Kit for the 4700 Proteomics Ana-lyzer (ABI/MDS Sciex). Atmosphere was used as the colli-sion gas (pressure: 6 · 10�7 torr, collision energy: 1 kV).The raw data for mass spectra that appear as figures inthe text or in electronic annexes are in Electronic Annex 1(EA-1) and are also housed at http://www.proteomecom-mons.org/data.jsp. These may be viewed using MS Expe-dite, also contained in EA-1. The observed and expectedmasses to charge ratio (m/z) of y and b ions in each ofthe MS/MS spectra presented as figures or discussed in thismanuscript are provided in EA-2.
Peptide sequences were determined by de novo sequenc-ing using MS Expedite (http://www.proteomecom-mons.org/current/530/MSViewerApp.jnlp). Fragment ionmasses for putative peptide sequences were generated usingMS-Product (prospector.ucsf.edu). MS/MS spectra weresearched using Mascot (v2.1 MatrixScience, London, UK)against a database consisting of NCBInr (Feb 22, 2007)and the putative camel osteocalcin sequence. Edmansequencing was performed on an Applied Biosystems 494CLc.
2.4. Phylogenetic analysis
The data set of osteocalcin sequences analyzed in thisstudy is composed of 25 complete protein sequences. Se-quences were aligned with ClustalX (Thompson et al.,1997) using the Gonnet series matrix. For the pair-wiseparameters, the gap opening penalty was set to 35.00 andthe gap extension penalty was set to 0.75. For the alignmentparameters, the gap opening penalty was set to 15.00 andthe gap extension penalty was set to 0.30. The alignmentwas unaffected by changing the parameters and needed nofurther modification.
The aligned osteocalcin sequences were analyzed bymaximum likelihood analysis, neighbor joining, and maxi-mum parsimony, with fish Takifugu rubripes and Tetradon
nigroviridis sequences as outgroups. Maximum likelihoodanalyses were performed using Tree-Puzzle 5.0 (Schmidtet al., 2002), which employs a quartet puzzling algorithmto search the tree space. Puzzling steps (10,000) were per-formed with parameter estimates set to ‘‘exact’’ using theJTT (Jones et al., 1992) model of amino acid substitution.
Neighbor joining and maximum parsimony proteinsequences were performed using PAUP* 4.0b10 (Swofford,2002). For neighbor joining analysis, uncorrected

Camelops Osteocalcin Sequence and phylogenetic implications 5959
p-distances were used, with ties between trees broken ran-domly. Neighbor joining bootstrap analysis (1000 repli-cates) was carried out using the default settings. Themaximum parsimony analysis was done using a heuristicsearch employing TBR branch swapping, with uninforma-tive characters excluded and the initial tree found using ran-dom taxon addition. Maximum parsimony bootstrappingfor osteocalcin employed 100 replicates (due to timeconstraints).
The mtDNA data set consists of 24 complete sequencesfrom the Cytochrome b protein-coding region of mtDNA.Taxa used to create the mtDNA and osteocalcin tree werethe same with the exception of Setonix, which does notyet have a complete Cytochrome b genome sequence (Table1). Sequences were aligned individually using ClustalX withdefault settings then manually corrected in MacClade 4.06(Maddison and Maddison, 2000). The aligned sequenceswere then analyzed by maximum likelihood, maximum par-simony, and neighbor joining, again using methods with T.
rubripes and T. nigroviridis as outgroups.For the Cytochrome b analyses, neighbor joining, max-
imum parsimony, and maximum likelihood were carriedout using PAUP* 4.0b10 (Swofford, 2002). Modeltest 3.7(Posada and Crandall, 1998) was used to determine theappropriate DNA substitution model (GTR+I+G) forthe maximum likelihood analysis. The maximum likelihoodtree was found with a heuristic search using TBR branchswapping. Maximum likelihood bootstrapping was per-formed using NNI branch swapping and starting withneighbor joining trees. For the neighbor joining analysismaximum likelihood distances were used, and bootstrap-ping was accomplished with 1000 replicates. The maximum
Table 1Sequence reference numbers for osteocalcin and Cytochrome b for all ta
Scientific name Common name Osteo
Bison bison Bison P8349Bos taurus Cow NP_77Camelus dromedarius Dromedary Camel SequeCanis familiaris Dog P8145Capra hircus Goat POC2Dromaius novaehollandiae Emu P1550Equus caballus Horse OstromFelis catus House cat P0282Gallus gallus Chicken NP_99Gorilla gorilla Gorilla P8434Homo sapiens Human NP_95Macaca sp. Macaque P0281Mus musculus House mouse AAA2Oryctolagus cuniculus European rabbit P3905Ovis aries Sheep ABD8Pan troglodytes Chimpanzee P8434Pongo pygmaeus Orangutan Q5RDRana sp. Bull frog BAD1Rattus norvegicus European rat NP_03Setonix sp. Quokka 10051Sus scrofa Pig AAN7Takifugu rubripes Fugu puffer AAO2Tetraodon nigroviridis Spotted green puffer AA02Xenopus laevis African clawed frog AAB3Xenopus tropicalis Western clawed frog NP_00
parsimony analysis consisted of a heuristic search withTBR branch swapping, uninformative characters excluded,and the initial tree found using random addition. Parsi-mony bootstrapping was accomplished using 1000replicates.
In both data sets, the maximum likelihood tree best rep-resents the accepted tree topology (ncbi.nlm.nih.gov). Themaximum parsimony bootstrap and neighbor joining boot-strap are included as support.
Character mapping was accomplished by mapping theamino acid character states of osteocalcin residues 4, 5,19, 48, and 49 onto the Cytochrome b maximum likelihoodtree, pruned to remove all taxa except the artiodactyls and achosen outgroup, Equus caballus, and modified to resolvethe sister relationship of Sus and Camelus according toMatthee et al. (2001). Resolution of ambiguous changesin the tree was achieved using the DELTRAN option inMacClade, which delays evolutionary transformations aslong as possible within the tree. For each of these five ami-no acid residues, character consistency indices (CI) andretention indices (RI) were calculated using MacClade.
3. RESULTS
3.1. Osteocalcin sequencing
Gravity column fractions of C. hesternus show [M+H]+
ions at m/z 5625 and 5668 that are within the range of oste-ocalcin from modern vertebrates (Mr = 5210–5889) (Haus-chka et al., 1989). The 43 Da difference between these twoanalytes is consistent with carbamylation (see below) aspreviously observed in fossil osteocalcin (Ostrom et al.,
xa in this study
calcin reference number Cytochrome b Reference number
8 AY6891866674 NC_006853
nce included X562815 NC_00200825 NC_0050444 NC_002784
et al. (2006) NC_0016401 NC_0017000718 NC_001323
9 NC_0016454642 AC_000021
9 AJ_3098659856 NC_0050896 NC_0019133814 NC_0019418 NC_001643P6 NC_0016466774 AF2050948200 NC_001665
80C3020 NC_0008454898 NC_004299
4897 NC_0071766024 NC_0015731006689 NC-006839

5960 J.F. Humpula et al. / Geochimica et Cosmochimica Acta 71 (2007) 5956–5967
2006). Because no sequences exist for osteocalcin from ex-tant camelids, interpretations of mass spectra were madeby comparison to bison osteocalcin (Nielsen-Marsh et al.,2005) (bison, YLDHGLGAuA PYPDPLEPKR EV-CELNPDCD ELADHIGFQE AYRRFYGPV: with decar-boxylation of Gla17, Gla21, Gla24; Hyp9; disulfide bondbetween Cys23, and Cys29).
We hypothesized that the tryptic digest of the m/z 5668analyte from C. hesternus contained peptides representingresidues 1–19 (m/z 2067.7), 20–43 (m/z 2846.2), and 44–49(m/z 744.4) (Fig. 1a) of osteocalcin and that the predomi-nant peak in the ASP-N digest was 34–49 (m/z 1987.7) ofosteocalcin. The peak at m/z 2110.9, 43 Da greater thanputative 1–19, likely represents 1–19 modified by carbamyl-ation (Fig. 1a, 1–19a). MS/MS results resolved the locationof carbamylation and sequence information for each of thedigest products.
The MS/MS of putative 1–19a produces a fragmenta-tion pattern that identifies residues 1–19 with a substitutionof Val13 for Pro13 relative to bison and carbamylation ofTyr1 (Fig. 2a). Carbamylation of Tyr1 (Tyr = 163.1) is sup-ported by a difference of 205.8 Da between y18 (m/z 1905.1)and the parent ion (m/z 2110.9). A series of peaks 43 Dagreater than the m/z expected for b ion fragments, denotedb*, are consistent with N-terminal carbamylation. Severalfragment ions (b8, b10, and b14) are consistent with loss ofan N-terminal carbamyl group and cleavage on the N-ter-minal side of proline and hydroxyproline. The differencein m/z between y3 and y5 (210.1) is consistent with Pro15
and Leu16, as in bison.The peptide mass fingerprint (PMF) of C. hesternus
showed two peaks differing by 17 Da (m/z 2829.2 and2846.2) that were candidates for 20–43 (Fig. 1a). MS/MSdata for these peaks (1) allows assignment of residues 20–22 and 30–43 of these peptides with substitution of Gln35
for His35 and Met36 for Ile36 relative to bison and (2) ex-plains the 17 Da difference between the two (Fig. 2b; Elec-tronic Annex EA-3). MS/MS of peptide m/z 2846.2 shows acharacteristic neutral loss of 64 from the parent ion innumerous y ions (denoted y0n, e.g. y08, y09, y012, y013) indicatingmethionine sulfoxide (Metox) in the peptide (Fig. 2b).Treatment of the peptide fraction containing m/z 2846.2and 2829.2 to reduce oxidized methionine resulted in a16 Da decrease of the peak at m/z 2846.2. MS/MS of m/z2829.2 shows pairs of fragment ions 1 Da apart, suggestingpartial deamidation at two positions: Gln35 and Gln39 (EA-3). Taken together the spectra indicate that the 17 Da differ-ence between the peptides results from oxidation ofMet36(+16) and deamidation (+1) of either Gln35 orGln39 in peptide 2846.2. A series of fragment ions in peptidem/z 2846.2 (putative b10, b11, b12, b14, b15, b16, b20, b21, b23,and y7 to y13) is consistent with this interpretation (Fig. 2b).
The tryptic peptide m/z 744.4 (putative 44–49) allowsassignments of residues 44–49 with substitutions of Thr48
and Thr49 for Pro48 and Val49 of bison (Fig. 2c). TheMS/MS data for ASP-N digest product m/z 1987.7 (puta-tive 34–49) confirms assignments for residues 34–44 andresidue 49 with Metox36 and deamidation of Gln35 andGln39 (Fig. 2d). Deamidation of Gln39 was identified by a1 Da increase in the m/z of y11, y12, and y13 relative to that
predicted. Deamidation of Gln39 and oxidation of Met36 isidentified by a 17 Da increase in the m/z of y14 relative tothat expected and a characteristic neutral loss of 64 Da iny14 and y15. Metox36 and deamidation of Gln35 and Gln39
is indicated by a 18 Da increase in the m/z of y15 relativeto that expected.
Based on comparison to bison, our data for C. hesternus
defines residues 1–22 and 30–49 (YLDHGLGAuAPYVDP-LEPKREV_ ______ DELADQMGFQEAYRRFYGTT)(with decarboxylation of Gla17, Gla21; Hyp9). Owing tolimited availability of the fossil, the remaining ambiguitywas resolved by sequencing three modern camelids, C. bac-
terianus, C. dromedarius, and L. guanacoe by PMF, tandemmass spectrometry and partial Edman sequencing. This alsoallowed a taxonomic comparison between the modern andancient taxa. MALDI-MS sequence determinations ofmodern taxa were based on a comparison to C. hesternus
and bison osteocalcin.A partial Edman sequence for ASP-N peptide 34–49 of
C. bacterianus identified Asp34, Gln35, Met36, Phe37, andGln38. The m/z of 44–49 (744.4) is the same for C. hesternus,C. bactrianus, and L. guanacoe (Fig. 1). The m/z of 1–19 ofosteocalcin from the modern taxa (C. dromedarius m/z2068.7; C. bactrianus m/z 2068.4; L. guanacoe m/z 2068.4)are 43 Da lower than 1–19a (m/z 2110.9) of C. hesternus,a difference consistent with carbamylation; a modificationthat appears to occur during fossilization (Fig. 1a–d). ThePMF showed two candidate peaks for 20–43 that differby 16 Da in C. bactrianus and L. guanacoe (Fig. 1c and d;m/z 2829.7 and 2845.7) or 17 Da in C. dromedarius
(Fig. 1b; m/z 2829.8 and 2846.7) and C. hesternus
(Fig. 1a; m/z 2829.2 and 2846.2). The m/z of ASP-N peptide34–49 of C. bacterianus and L. guanacoe are the same (m/z1970.2) but that of C. dromedarius (m/z 1986.4) and C. hest-
ernus (m/z 1987.7) are 16 and 18 Da higher, respectively.Mass differences observed in peptides 20–43 and 34–49are explained through investigation of MS/MS data(below).
Complete sequence coverage for tryptic peptide 1–19 ofC. dromedarius is provided by MS/MS (Fig. 3a). Aminoacids Leu, Ile, and hydroxyproline are isobaric. This ambi-guity at residue 9 was resolved by formylation of peptide 1–19 which resulted in a 28 Da increase in y and b ions thatcontain residue 9 consistent with formation of formate esteron hydroxyproline at residue 9. As with C. hesternus, Val13
is observed in C. dromedarius and the difference in m/z be-tween b14 and b16 identifies Pro15 and Leu16. The MS/MSof 1–19 of osteocalcin from C. bacterianus identifies resi-dues 1–19 and from L. guanacoe identifies residues 3–10,13–19 (Electronic Annexes EA-4 and EA-5) with Val13 inboth taxa. These data suggest that the osteocalcin sequencefor 1–19 from all taxa is identical.
The PMF of C. dromedarius showed two peaks differingby 17 Da that were candidates for 20–43 (Fig. 1b) at m/z2829.8 and m/z 2846.7, respectively. Complete sequencecoverage of peptide m/z 2846.7 was obtained followingreduction and cysteine blockage with MMTS (Fig. 3b).We define Pro27 and Asp28 because it is the only dipeptidepair that exists in other organisms at positions 27 and 28and its mass (212.1) is consistent with the 212.1 Da differ-

Fig. 1. Peptide mass fingerprint for osteocalcin tryptic digest from: (a) 21 ka Camelops hesternus; (b) Camelus dromedarius; (c) Camelus
bactrianus; and (d) Llama guanacoe produced from an ABI-4800 TOFTOF (confirmed on an ABI-STR). Peptide 1–19a, 43 Da greater than 1–19, is osteocalcin modified by carbamylation. Ions denoted (+16) have methionine sulfoxide in position 36 (Metox36). Ions denoted (+17) haveMetox36 and deamidation of Gln35.
Camelops Osteocalcin Sequence and phylogenetic implications 5961
ence between b7 and b9. Dipeptide Leu32Ala33 is inferred bycomparison to C. bactrianus and L. guanacoe whose y ionsidentify these residues (EA-4 and EA-5). The 147.0 Da
difference in the m/z of y7 and y8 and a characteristic neu-tral loss of 64 Da in numerous ions denoted y0n (e.g. y08,y09, y012, y013Þ is consistent with Metox in position 36.
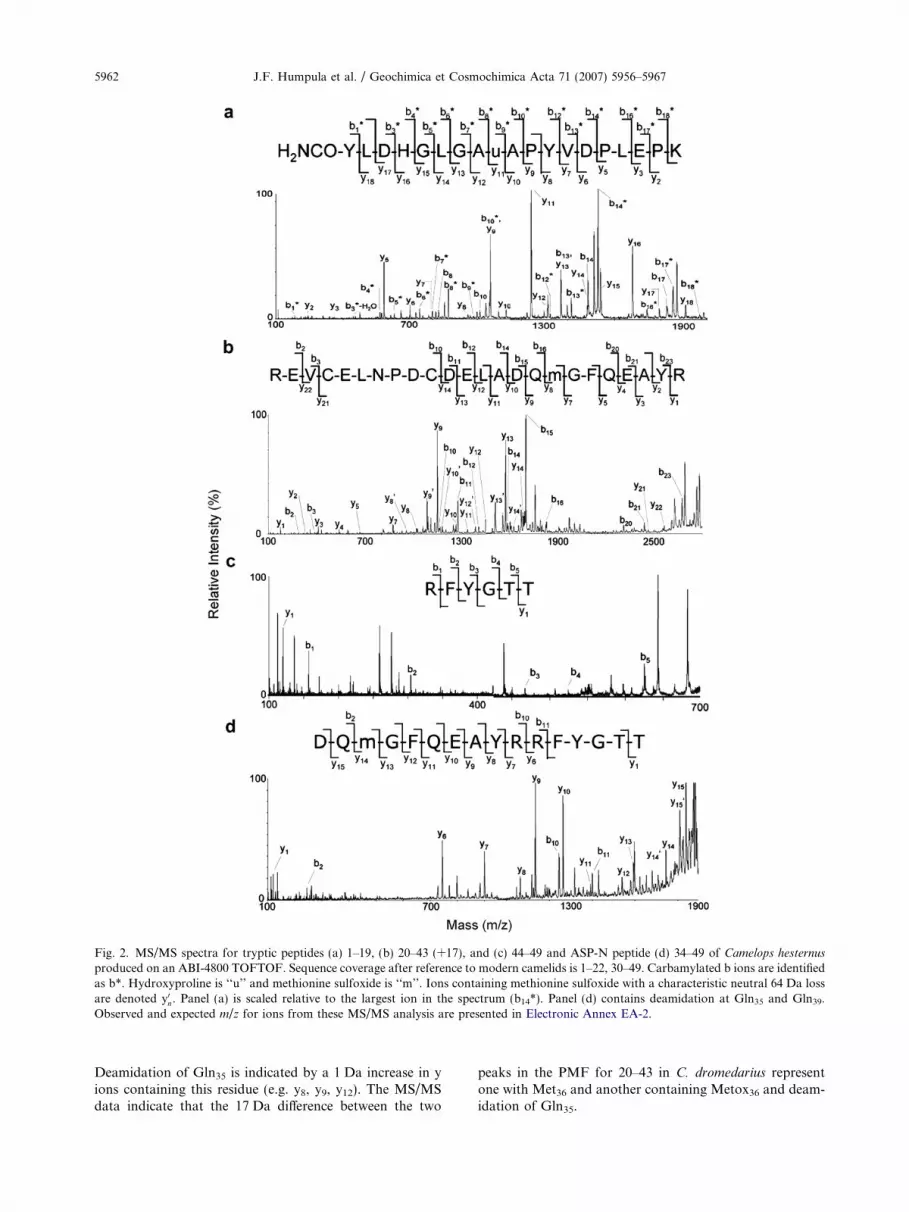
Fig. 2. MS/MS spectra for tryptic peptides (a) 1–19, (b) 20–43 (+17), and (c) 44–49 and ASP-N peptide (d) 34–49 of Camelops hesternus
produced on an ABI-4800 TOFTOF. Sequence coverage after reference to modern camelids is 1–22, 30–49. Carbamylated b ions are identifiedas b*. Hydroxyproline is ‘‘u’’ and methionine sulfoxide is ‘‘m’’. Ions containing methionine sulfoxide with a characteristic neutral 64 Da lossare denoted y0n. Panel (a) is scaled relative to the largest ion in the spectrum (b14*). Panel (d) contains deamidation at Gln35 and Gln39.Observed and expected m/z for ions from these MS/MS analysis are presented in Electronic Annex EA-2.
5962 J.F. Humpula et al. / Geochimica et Cosmochimica Acta 71 (2007) 5956–5967
Deamidation of Gln35 is indicated by a 1 Da increase in yions containing this residue (e.g. y8, y9, y12). The MS/MSdata indicate that the 17 Da difference between the two
peaks in the PMF for 20–43 in C. dromedarius representone with Met36 and another containing Metox36 and deam-idation of Gln35.

Fig. 3. MS/MS spectra for tryptic peptides (a) 1–19 and (b) MMTS-derivatized 20–43, and (c) ASP-N peptide 34–49 of Camelus dromedaries
produced on an ABI-4800 TOFTOF. By inference to Camelus bactrianus and Llama guanacoe, there is complete sequence coverage as detailedin the text. Hydroxyproline is denoted ‘‘u’’ and methionine sulfoxide is denoted ‘‘m’’. Ions containing methionine sulfoxide with acharacteristic neutral 64 Da loss are denoted y0n. Panel (d) contains deamidation at Gln35. Observed and expected m/z for ions from theseMS/MS analysis are presented in Electronic Annex EA-2.
Camelops Osteocalcin Sequence and phylogenetic implications 5963
In C. bactrianus, the MS/MS of tryptic peptide 20–43provides coverage for 20–24 and 29–43 and corroboratesMet36 identified by Edman sequencing (EA-4). The MS/MS of 20–43 of L. guanacoe provides coverage for 20–24, 29–34, and 37–42 (EA-5). The 20–43 (+16) peptideobserved in the PMF of both C. bactrianus and L. guana-
coe is 16 Da higher than the expected mass and likelycontains Metox36 (Fig. 1c and d). The MS/MS andPMF data suggest that the sequences for 20–43 fromall taxa are identical with modifications in position 35
(Gln35 or Glu35), position 39 (Gln39 or Glu39), and 36(Met36 or Metox36).
The MS/MS of ASP-N peptide 34–49 from osteocalcinof C. dromedarius confirms residues 37–43 and 47–49(Fig. 3c). A 16 Da increase in the observed m/z of a andb ions relative to that expected suggests Metox36. Completesequence coverage for peptide 34–49 was obtained for C.
bactrianus and L. guanacoe with Met36 in both taxa. MS/MS data for peptides 34–49 and 44–49 of C. bactrianus
and L. guanacoe (EA-4 and EA-5) suggests that with the

5964 J.F. Humpula et al. / Geochimica et Cosmochimica Acta 71 (2007) 5956–5967
exception of Met36 vs. Metox36, there is no difference in se-quence between residues 34–49 among taxa.
Data from the modern camelids allow us to addressremaining sequence ambiguity for C. hesternus. Becausethere is no difference in the sequence of the modern came-lids and the m/z of y21, y22, and b10 of tryptic peptide 20–43 from C. hesternus and the modern camelids are the same,we define residues 23–29 in C. hesternus as CELNPDC. Insummary, with the exception of oxidation of Met36 anddeamidation of Gln35 or Gln39, the MS/MS results andthe PMF indicate that the sequence of the modern and an-cient camelids is the same.
3.2. Phylogenetic analysis
The maximum likelihood (ML) tree for the 25 osteocal-cin amino acid sequences in our data set with maximumparsimony bootstrap and neighbor joining bootstrap in-cluded as support is shown in Fig. 4a. The ML tree waschosen for presentation rather than maximum parsimony(MP) or neighbor joining (NJ) trees because the maximumlikelihood ML tree more closely reflected generally recog-nized taxonomic relationships (Colbert et al., 1991;ncbi.nlm.nih.gov). For example, neither the MP analysisnor the NJ tree grouped Rattus with Mus or Ovis with Bi-
son, while the ML tree recovered both of these relation-ships. In addition, in both the MP and NJ trees, the birdsrendered the amphibians paraphyletic, while the ML recov-ered the amphibians as a monophyletic group. The ML also
Rattus norvegMus muscu
Sus scrofaCapra hircu
Ovis aries
Bos tauruCanis familia
Felis catu
Equus caba
Gorilla goriPan troglodyHomo sapie
Oryctolagus cun
Dromaius novaehGallus gallu
Xenopus lae
Tetraodon nigroTakifugu rubr
Camelus drome
Pongo pygma
Macaca sp
Bison biso
Setonix sp
Xenopus trop
Rana sp.
65/61
- / -
- / -
87/89
99/57- / -
100/100
Fig. 4. Maximum likelihood (ML) trees for (a) osteocalcin protein sequensequence for Setonix sp. was not available. Values on branches of trees repmaximum likelihood values. Cytochrome b ML tree created using PAUP*tree created using Tree-Puzzle 5.0. Maximum parsimony and neighbor jointree A = 148, CI = 0.655, RI = 0.523. Tree length for tree B = 3267, CI =support was assessed by bootstrap analysis using both maximum parsim
recovered the Pan-Homo-Gorilla clade. It is noteworthythat the Pan-Homo-Gorilla clade was also recovered byMP and NJ, the MP tree had Pongo as sister to this cladeand the NJ tree had Macaca sister to Pan, Homo, Gorilla,and Pongo, as generally recognized.
For comparative purposes, a mitochondrial Cytochromeb tree was constructed using DNA sequences from the sameset of taxa used for the OC analysis (n.b., a sequence fromthe marsupial, Setonix. was not available for this analysis).The ML tree (Fig. 4b) is in agreement with most of the gen-erally recognized relationships of the taxa in our data set,with the notable exception of placing Camelus as sister toSus. In contrast, the MP and NJ trees contain a polytomythat includes Equus, Camelus, Sus, Canis, Felis, Oryctola-
gus, and the Bos-Bison-Capra-Ovis clade observed in theML tree. Also different from the ML tree and recognizedrelationships is placement of the Pan-Homo-Gorilla cladeas a sister group to Rattus, Mus, and the polytomy.
4. DISCUSSION
We isolated and sequenced osteocalcin from a 21 Kyrbone from Camelops hesternus, as well as from three mo-dern camelid species (Camelus bactrianus, Camelus drome-
darius, and Llama guanacoe). Sequence coverage forC. hesternus was obtained via PMF and tandem mass spec-trometry. This marks the first molecular data for the genusCamelops. The data indicate that there is no sequence differ-ence among the ancient and modern camelid species.
icuslus
s
sris
s
llus
llatesns
iculus
ollandiaes
vis
viridisipes
darius
eus
.
n
.
icalis
100/100/99
100/100/100
100/98/100
87/97/97
99/100/100
64/53/75
61/71/ -
84/91/79
100/100/100
100/100/100
59/77/76
55/87/7896/67/91
100/100/100
73/ - / -
ce and (b) Cytochrome b-coding region of mtDNA. Cytochrome b
resent neighbor joining bootstrap/maximum parsimony bootstrap/4.0b10 with model generated using Modeltest 3.7. Osteocalcin MLing bootstrap values obtained using PAUP* 4.0b10. Tree length for0.350, RI = 0.406. Uninformative characters were excluded. Branchony and neighbor joining methods.

Camelops Osteocalcin Sequence and phylogenetic implications 5965
Modifications to the primary structure of osteocalcinwere observed in modern and ancient osteocalcin. A modi-fication of Met36 to Metox36 was observed in C. hesternus
and C. dromedarius. Met, like Cys and Trp, is one of themost easily oxidized amino acids in proteins (Vogt, 1995).This modification is reversed in vivo, and is hypothesizedto regulate protein function. Oxidation of methioninemay arise during diagenesis over geologic time or as an arti-fact of sample handling. The presence of EDTA and ironcan greatly enhance the oxidation of methionine, especiallyin an acidic environment. Thus, conclusions about thedepositional environment of the C. hesternus specimencan not be inferred based on this modification. Despite this,the presence of Met36 is notable. The side chain of Met ishydrophobic and its oxidation may influence the hydropho-bicity of osteocalcin. Because the function of osteocalcin isunknown (e.g. mediation of hydroxyapatite crystal mor-phology), we do not know if oxidation of Met36 restrictsthe function of the protein in vivo (Mundy and Poser,1983; Vogt, 1995; Dowd et al., 2003). However, if Met36
is involved in binding of a partner or is involved in the cre-ation of a reactive site its oxidation may result in loss ofbinding or functionality (Vogt, 1995).
Osteocalcin from C. hesternus exhibited deamidation ofGln35 and Gln39 in ASP-N digest product 34–49. Deamida-tion of Gln35 was also observed in C. dromedarius and inosteocalcin from a fossil horse (Ostrom et al., 2006) butnot in osteocalcin from other modern camelids. Becauseof its occurrence in the modern sample, we can not distin-guish the role of post-depostional processes from samplehandling in deamidation of ancient osteocalcin (Ostromet al., 2006).
Bos
taur
us
Bis
on p
riscu
s
Cap
ra h
ircus
49:19: Lys48: Pro Ile
19: Arg Lys
48: Thr Pro
49: Ala Val
5: Gly Trp
4: His Pro
Fig. 5. Osteocalcin amino acid residues 4, 5, 19, 48, and 49 mapped ontpruned to resolve sister relationship of Sus and Camelus.
Carbamylation was observed in osteocalcin of C. hester-
nus and previously in osteocalcin of a 42 ka horse but not inmodern osteocalcin. In solution, urea and ammonium cya-nate (tautomeric with isocyanic acid) are in equilibrium.Carbamylation of an amino group occurs when isocyanicacid reacts with the amino group of a protein(HNCO + H2N-R fi H2NCOH2N-R) (Stark, 1965). Ureain dry caves within the southwestern United States is abun-dant due to its accumulation into amberat by pack rats(Betancourt et al., 1990). Because of its ability to blockthe N-terminus, carbamylation may be linked to previousdifficulties in sequencing ancient proteins. N-terminalblockage is cited as the mechanism responsible for failed at-tempts to sequence ancient proteins by Edman degradation(Robbins et al., 1993).
Although the phylogenetic relationships of camelidscould not be determined using osteocalcin sequences, pri-marily due to a lack of sequence differences, evolutionaryrelationships between camelids and other artiodactyls wereexplored. To do this, we mapped the evolution of specificosteocalcin amino acid residues onto the Cytochrome b
tree, pruned to contain only artiodactyls (with Equus asoutgroup) and modified to resolve the sister relationshipof Sus and Camelus (cf. Matthee et al., 2001) (Fig. 5). FiveOC protein characters (amino acid residues 4, 5, 19, 48, and49) are variable within this subset of taxa. These charactersare all located in the N- or C-terminal regions of OC, whichare considered to be either variable or less structurally con-strained than the a-helical regions (Hauschka et al., 1989;Hoang et al., 2003).
Of these five osteocalcin amino acid characters, onlycharacter 4 evolves consistently in the Cytochrome b
Ovi
s ar
ies
Cam
elus
dro
med
ariu
s
Sus
scro
fa
Equu
s ca
ballu
s
5: Gly Trp48: Thr Ile49: Ala Thr
Ala Val Arg
o a pruned version of the Cytochrome b maximum likelihood tree

Table 2Evolution of OC within the Artiodactyla. CI is the consensus indexand RI is retention index
Character CI RI Character evaluation
4 1.00 1.00 His fi Pro defines the Ovis aries – Capra
hircus clade5 0.50 0.00 Gly fi Trp in both Equus and Bos
19 0.50 0.50 Arg fi Lys places Camelus with Bovids;with reversion (Lys fi Arg) in Ovis
48 0.67 0.50 Thr fi Ile in Sus, Thr fi Pro definesBovids, with Pro fi Ile in Capra
49 0.67 0.50 Ala fi Thr in Camelus; Ala fi Val in Bos
and Bison, Ovis
5966 J.F. Humpula et al. / Geochimica et Cosmochimica Acta 71 (2007) 5956–5967
maximum likelihood tree (without homoplasy; RI =CI = 1.00). Characters at all of the other four amino acidpositions evolve with varying degrees of homoplasy, andthese evolutionary changes are summarized in Table 2.These data indicate that within Artiodactyla osteocalcinhas not evolved in such a way to reflect species relation-ships. Our pruned data set shows clear examples of bothparallel evolution and convergence (character 5 in Bos
and Equus and character 48 in Sus and Capra, respectively).Further work will need to be done to determine if theseamino acid changes are due to positive selection or geneticdrift. If the amino acid substitutions resulted from selectiverather than neutral drift, it implies an event with functionalsignificance for osteocalcin.
We also examined the utility of osteocalcin sequences forexploring phylogenetic relationships at higher taxonomiclevels. The objective was to understand whether phyloge-netic inferences based on OC sequences (Fig. 4a) reflectedtaxonomic relationships delineated in the Cytochrome b
tree (Fig. 4b). In the ML tree of osteocalcin, amphibianswere grouped together without bootstrap support and sev-eral characters support the monophyly of the ingroup. Ro-dents were recovered, placing Rattus with Mus, albeitwithout bootstrap support. The Homo-Pan-Gorilla trichot-omy within hominins was also recovered (NJ/MP boot-strap = 65/61), as were the birds (Dromaius and Gallus
grouped with NJ/MP bootstrap = 87/89).Evolutionary changes in osteocalcin among primates,
particularly the absence of post-translational modificationof Pro9, are related to enzymatic requirements for prolyl-4-hydroxylase (Nielsen-Marsh et al., 2005). The prolyl-4-hydroxylase enzyme requires vitamin C and recognizesthe consensus sequence Leu6Gly7Ala8Pro9Ala10Pro11Tyr12
but hydroxylation appears to be resisted in five primateswhen Val10 substitutes for Ala10.
A preliminary evaluation of character states among fishand tetrapods showed that the osteocalcin sequence of fishis clearly unique from that of other taxa. Gln15 and Ile27 infish are replaced by Pro15 and Pro27 in amphibians, birdsand mammals. Ser18 in fish and amphibians is replaced byAla18 in birds and Pro18 in mammals. Furthermore, Frazaoet al. (2005) identified a fourth Gla at position 31 in the tel-eost fish Argyromsomus regius. They argued that the addi-tional carboxylated glutamic acid could be related toactions associated with interactions of the carboxylase
enzyme with the propeptide sequence. The activity of thecarboxylase is mediated by a conserved 18 amino acid pro-peptide sequence. Its affinity and, hence carboxylation, isimpaired when mutations occur at position �15, �9, and�6. Whereas only one of these residues is conserved in tet-rapods, two are conserved in the A. regius sequence.
In addition to substitutions at individual positions, tele-osts lack a conserved sequence present at the C-terminus ofmost tetrapods (RFYGPV) and retain an extended andconserved motif at the N-terminus (AYXXY/FYGP) thatis truncated in tetrapods (Nishimoto et al., 2003; Cancelaet al., 1995). Given the limited number of osteocalcin se-quences available and lack of understanding of osteocal-cin’s functional attributes, assigning significance tosequence substitutions is difficult. Such interpretationswould be significant as mineralized tissue is an innovationof vertebrates providing the framework for phenotypic var-iation (endoskeleton, predatory teeth).
While the conservative nature of osteocalcin appears tomake phylogenetic analysis of its amino acid sequence ame-nable for recovering a limited number of relationships,character analysis of the osteocalcin sequence is useful foridentifying specific taxa. For example, within the orderArtiodactyla, character 4 defines the Capra-Ovis clade witha substitution of Pro4 for His4. Thus, in the absence ofother distinguishing morphological or molecular character-istics for an artiodactyls skeletal element, osteocalcinsequencing could be used to constrain taxonomic affinity.
To develop an understanding of osteocalcin evolutionand its utility for phylogenetic reconstruction, sequencedata from additional taxa are required, especially amongreptiles, birds, and within the orders Carnivora and Periso-dactyla. The preliminary analysis of osteocalcin evolutionprovided here is an initial step toward a complete characteranalysis specifically aimed at determining the evolutionaryhistory of osteocalcin.
Our efforts mark the first phylogenetic analysis of an an-cient protein. As was done here, future studies applyingmass spectrometric based approaches to sequencing andphylogenetic analysis must be cognizant of the impacts ofpost-translational modifications, the possibility of isobaricamino acids (e.g. Leu and Ile) and the influence of diage-netic changes (e.g. deamidation of Gln to Glu and dehydr-oxylation of Ser to Ala) on sequence alignments and/ormass shifts. As noted here, the fact that protein sequencedatabases are limited and do not retain information for ex-tinct species, presents obstacles for interpreting sequencedata from ancient taxa. While diagenetic peptides of indig-enous proteins are presumably taxonomically informative,sequence information from such fragmentary material arenot amenable to standard phylogenetic analyses. Develop-ing approaches delineating phylogentic relationships forsuch material is one of the next challenges to unravelingthe secrets of the paleoproteome.
ACKNOWLEDGMENTS
We thank Barbara Lundrigan, Michigan State University andRoss MacPhee, American Museum of Natural History for bonesof modern camelids used in this research. We thank two unnamed

Camelops Osteocalcin Sequence and phylogenetic implications 5967
referees for contributing helpful comments on this manuscript andthose of the Associate Editor, Jay Brandes. This work was sup-ported by the National Science Foundation (NSF) Grant EAR-0309467 (to P.H.O.), the National Resource for Proteomics andPathways, NCRR Grant P41-18627 (to P.C.A.) and the MichiganProteome Consortium.
APPENDIX A. SUPPLEMENTARY DATA
Supplementary data associated with this article can befound, in the online version, at doi:10.1016/j.gca.2007.09.003.
REFERENCES
Asara J. M., Schweitzer M. H., Freimark L. M., Phillips M. andCantley L. C. (2007) Protein sequences from mastodon andTyrannosaurus Rex revealed by mass spectrometry. Science 316,
280–285.
Betancourt J. L., Van Devender T. R. and Martin P. S. (1990)Packrat Middens: The Last 40,000 years of Biotic Change.University of Arizona Press, Tucson, Arizona.
Cancela M. L., Williamson M. K. and Price P. A. (1995) Amino-acid sequence of bone Gla protein from the African clawed toadXenopus laevis and the fish Sparus aurata. Int. J. Pept. Protein
Res. 46, 419–423.
Colbert E. H., Morales M. and Minkoff E. C. (1991) Colbert’s
Evolution of the Vertebrates: A History of the Backboned
Animals Through Time, fifth ed. Wiley, Canada.Collins M. J., Gernaey A. M., Nielsen-Marsh C. M., Vermeer C. and
Westbroek P. (2000) Slow rates of degradation of osteocalcin:green light for fossil bone protein? Geology 28, 1139–1142.
Dowd T. L., Rosen J. F., Li L. and Gundberg C. M. (2003) The three-dimensional structure of bovine calcium ion-bound osteocalcinusing H NMR spectroscopy. Biochemistry 42, 7769–7779.
Frazao C., Simes D. C., Coelho R., Alves D., Williamson M. K.,Price P. A., Cancela M. L. and Carrondo M. A. (2005)Structural evidence of a fourth Gla residue in fish osteocalcin:biological implications. Biochemistry 44, 1234–1242.
Harris A. H. and Findley J. S. (1964) Pleistocene-recent fauna ofIsleta Caves Bernalillo County New Mexico. Am. J. Sci. 262,
114–120.
Hauschka P. V., Lian J. B., Cole D. E. C. and Gundberg C. M.(1989) Osteocalcin and matrix Gla protein—vitamin K-depen-dent proteins in bone. Physiol. Rev. 69, 990–1047.
Hoang Q. Q., Sicheri F., Howard A. J. and Yang D. S. C. (2003)Bone recognition mechanism of porcine osteocalcin fromcrystal structure. Nature 425, 977–980.
Jones D. T., Taylor W. R. and Thornton J. M. (1992) The rapidgeneration of mutation data matrices from protein sequences.Comput. Appl. Biosci. 8, 275–282.
Kurten B. and Anderson E. (1980) Pleistocene Mammals of North
America. Columbia University Press, New York.Laize V., Martel P., Viegas C. S. B., Price P. A. and Cancela
M. L. (2005) Evolution of matrix and bone c-carboxyglu-tamic acid proteins in vertebrates. J. Biol. Chem. 280,
26659–26668.
Lange I. M. (2002) Ice Age Mammals of North America: A Guide to
the Big, the Hairy, and the Bizarre. Mountain Press, Missoula,Montana.
Lian J., Stewart C., Puchacz E., Mackowiak S., Shalhoub V.,Collart D., Zambetti G. and Stein G. (1989) Structure of the ratosteocalcin gene and regulation of vitamin D-dependentexpression. Proc. Natl. Acad. Sci. USA 86, 1143–1147.
Maddison D. R. and Maddison W. P. (2000) MacClade version 4
Analysis of Phylogeny and Character Evolution. Sinauer Asso-ciates, Sunderland, Massachusetts.
Matthee C., Burzlaff A. J. D., Taylor J. F. and Davis S. K. (2001)Mining the Mammalian Genome for artiodactyl systematics.Syst. Biol. 50, 367–390.
Mundy G. R. and Poser J. W. (1983) Chemotactic activity of thec-carboxyglutamic acid containing protein in bone. Calcif.
Tissue Int. 35, 164–168.
Nielsen-Marsh C. M., Ostrom P. H., Gandhi H., Shapiro B.,Cooper A., Hauschka P. V. and Collins M. J. (2002) Sequencepreservation of osteocalcin protein and mitochondrial DNA inbison bones older than 55 ka. Geology 30, 1099–1102.
Nielsen-Marsh C. M., Richards M. P., Hauschka P. V., Thomas-Oates J. E., Trinkaus E., Pettitt P. B., Karavanic I., Poinar H.and Collins M. J. (2005) Osteocalcin protein sequences ofNeanderthals and modern primates. Proc. Natl. Acad. Sci. USA
102, 4409–4413.
Nishimoto S. K., Waite J. H., Nishimoto M. and Kriwacki R. W.(2003) Structure, activity, and distribution of fish osteocalcin. J.
Biol. Chem. 278, 11843–11848.
Ostrom P. H., Gandhi H., Strahler J. R., Walker A. K., Andrews P.C., Leykam J., Stafford T. W., Kelly R. L., Walker D. N.,Buckley M. and Humpula J. (2006) Unraveling the sequenceand structure of the protein osteocalcin from a 42 ka fossilhorse. Geochim. Cosmochim. Acta 70, 2034–2044.
Poinar H. N., Schwarz C., Qu J., Shapiro B., MacPhee R. D. E., BuigueB., Tikhonov A., Huson D., Tomsho L. P., Auch A., Rampp M.,Miller W. and Schuster S. C. (2005) Metagenomics to paleogenom-ics: large-scale sequencing of mammoth DNA. Science 311, 392–394.
Posada D. and Crandall K. A. (1998) MODELTEST: testing themodel of DNA substitution. Bioinformatics 14, 817–818.
Robbins L. L., Muyzer G. and Brew K. (1993) Macromoleculesform living and fossil biominerals: Implications for the estab-lishment of molecular phylogenies. In Organic Geochemistry:
Principles and Applications (eds. M. H. Engle and S. A. Macko).Plenum, New York, pp. 799–816.
Savage D. E. (1951) Late Cenozoic vertebrates of the SanFrancisco bay region. Univ. Calif. Publ. Geol. Sci. 18, 215–314.
Schmidt H. A., Strimmer K., Vingron M. and von Haeseler A. (2002)TREE-PUZZLE: maximum likelihood phylogenetic analysis usingquartets and parallel computing. Bioinformatics 18, 502–504.
Stark G. R. (1965) Reactions of cyanate with functional groups ofproteins. Inertness of aliphatic hydroxyl groups. Formation ofcarbamyl- and acylhydantoins. Biochemistry 4, 363–2367.
Stuart A. J. (1991) Mammalian extinctions in the late Pleistocene ofnorthern Eurasia and North America. Biol. Rev. Camb. Philos.
Soc. 66, 453–562.
Swofford D. L. (2002) PAUP*: Phylogenetic Analysis Using
Parsimony (* and other methods). Version 4.0b10. SinauerAssociates, Sunderland, Massachusetts.
Thompson J. D., Gibson T. J., Plewniak F., Jeanmougin F. andHiggins D. G. (1997) The CLUSTAL_X windows interface:flexible strategies for multiple sequence alignment aided byquality analysis tools. Nucleic Acids Res. 25, 4876–4882.
Vogt W. (1995) Oxidation of methionyl residues in proteins—tools,targets, and reversal. Free Radic. Biol. Med. 18, 93–105.
Webb S. D. (1974) Pleistocene llamas of Florida, with a brief review ofthe Lamini. In Pleistocene mammals of Florida (ed. S. D. Webb).University Press of Florida, Gainesville, Florida, pp. 170–214.
Zardoya R. and Meyer A. (1996) Phylogenetic performance ofmitochondrial protein-coding genes in resolving relationshipsamong vertebrates. Mol. Biol. Evol. 13, 933–942.
Associate editor: Jay A. Brandes


